dosimetry for biological experiments in space -...
TRANSCRIPT
DOBIES
Dosimetry for Biological Experiments
In Space
Partners:SCK-CEN: F. Vanhavere, J-L. GenicotNPI: F. Spurny, I. JadrnickovaDIAS: D. O’SullivanJSC: D. ZhouOSU: E. Yukihara
Objective
Develop a standard dosimetric method to measure accurately Absorbed Doses & Equivalent Doses in biological samples with a combination of different passive detectors
Detectors
• SCK•CEN: TL and OSL
• NPI: TL and TE
• DIAS/JSC: TE
• OSU: OSL
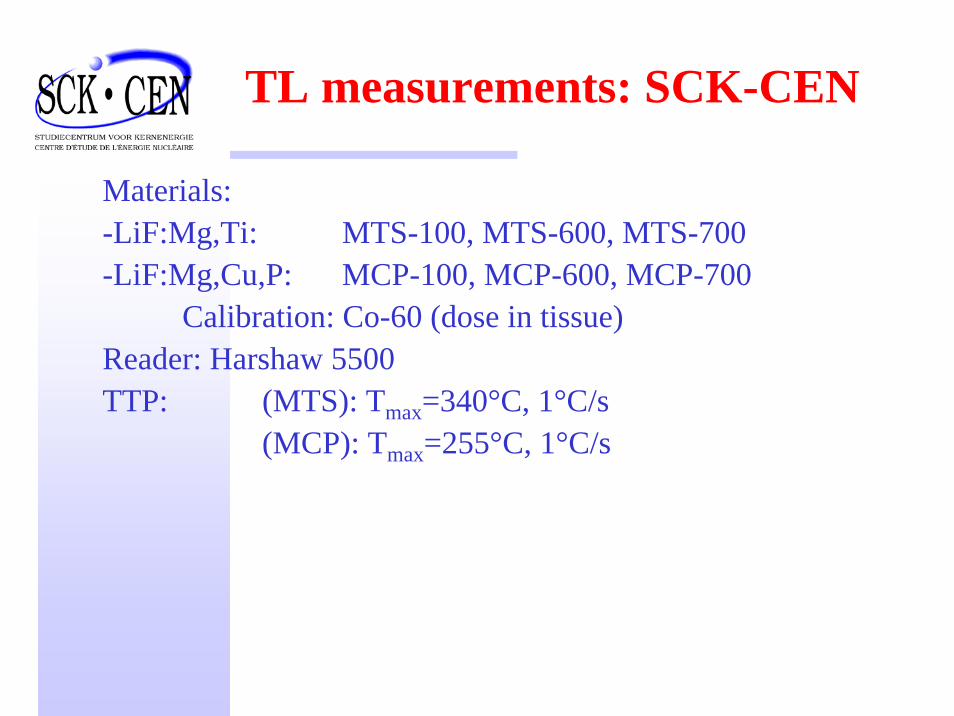
TL measurements: SCK-CEN
Materials: -LiF:Mg,Ti: MTS-100, MTS-600, MTS-700-LiF:Mg,Cu,P: MCP-100, MCP-600, MCP-700
Calibration: Co-60 (dose in tissue)Reader: Harshaw 5500TTP: (MTS): Tmax=340°C, 1°C/s
(MCP): Tmax=255°C, 1°C/s
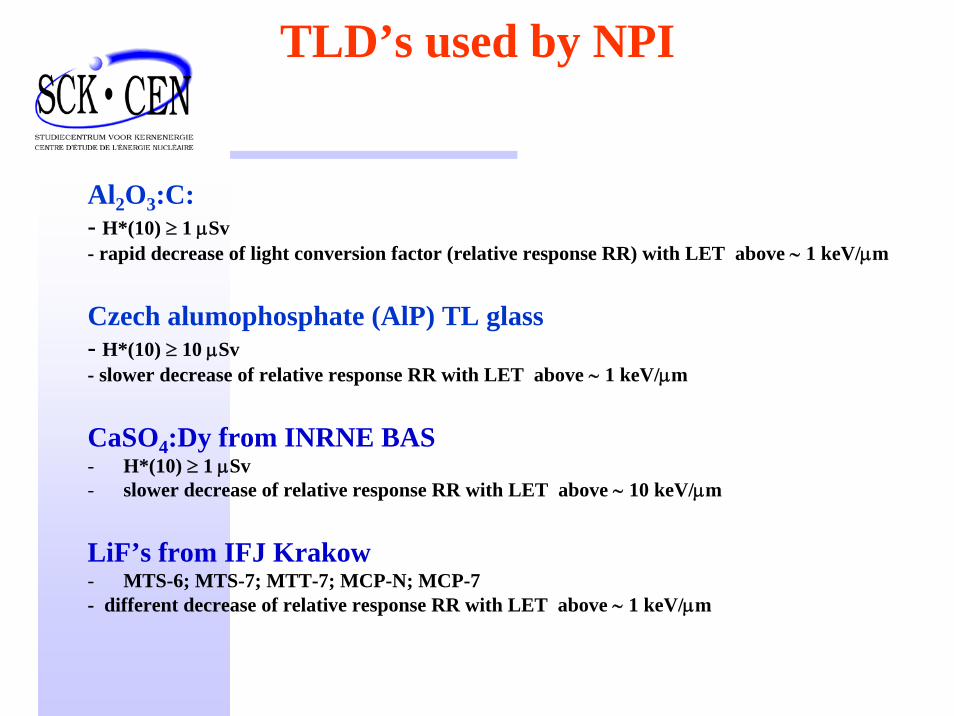
TLD’s used by NPI
Al2O3:C: - H*(10) ≥ 1 μSv- rapid decrease of light conversion factor (relative response RR) with LET above ∼ 1 keV/μm
Czech alumophosphate (AlP) TL glass- H*(10) ≥ 10 μSv- slower decrease of relative response RR with LET above ∼ 1 keV/μm
CaSO4:Dy from INRNE BAS- H*(10) ≥ 1 μSv- slower decrease of relative response RR with LET above ∼ 10 keV/μm
LiF’s from IFJ Krakow- MTS-6; MTS-7; MTT-7; MCP-N; MCP-7- different decrease of relative response RR with LET above ∼ 1 keV/μm
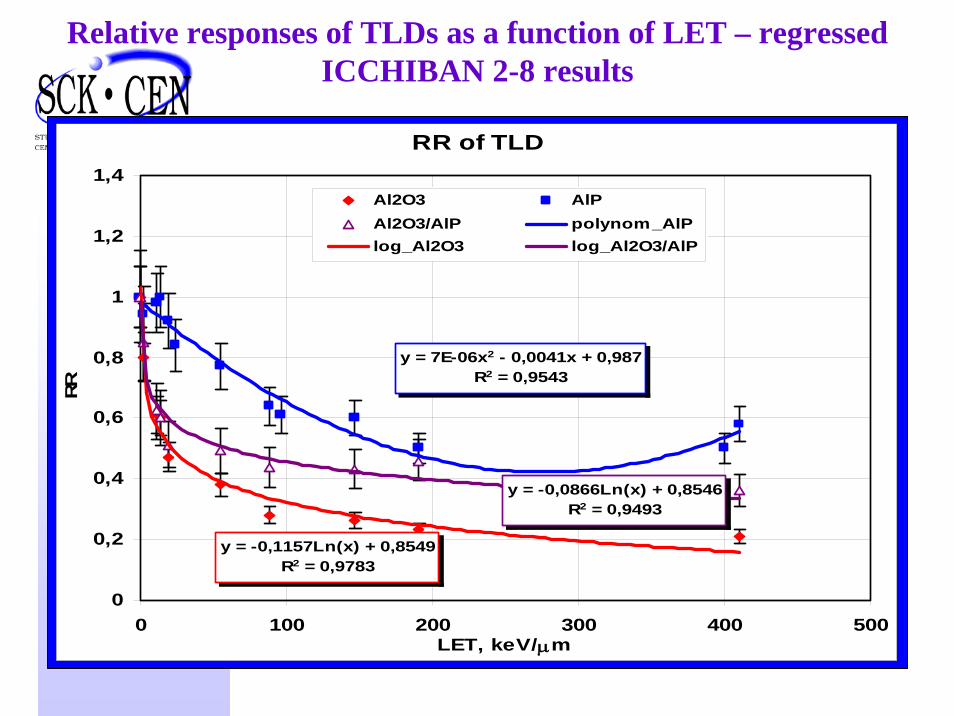
Relative responses of TLDs as a function of LET – regressed ICCHIBAN 2-8 results
RR of TLD
y = 7E-06x2 - 0,0041x + 0,987R2 = 0,9543
y = -0,1157Ln(x) + 0,8549R2 = 0,9783
y = -0,0866Ln(x) + 0,8546R2 = 0,9493
0
0,2
0,4
0,6
0,8
1
1,2
1,4
0 100 200 300 400 500LET, keV/μm
RR
Al2O3 AlPAl2O3/AlP polynom_AlPlog_Al2O3 log_Al2O3/AlP
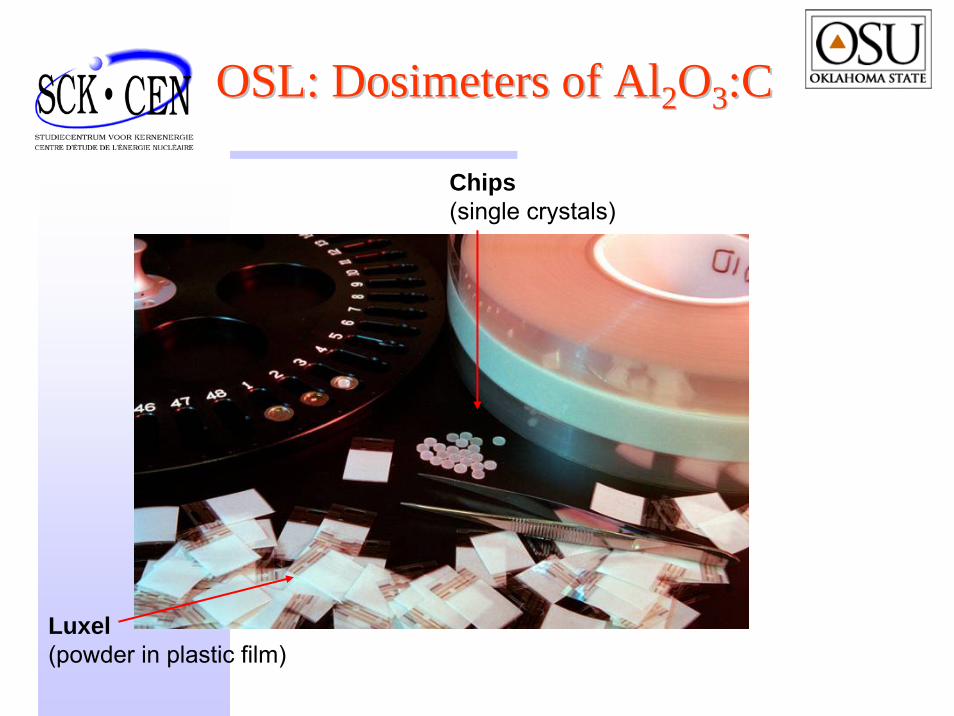
OSL: Dosimeters of AlOSL: Dosimeters of Al22OO33:C:C
Luxel(powder in plastic film)
Chips(single crystals)
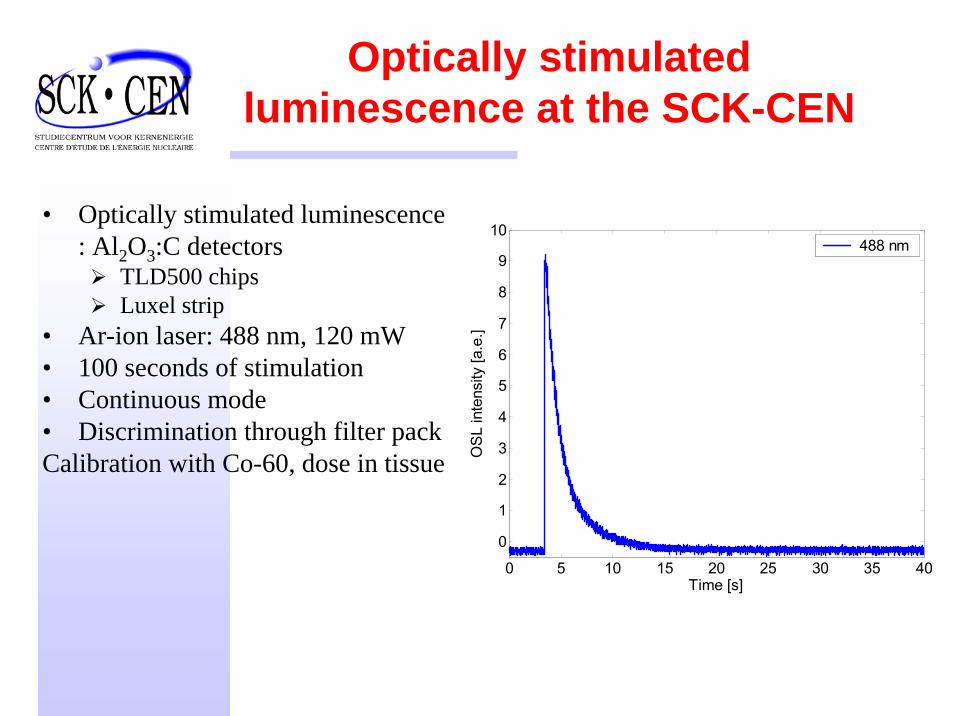
Optically stimulated luminescence at the SCK-CEN
• Optically stimulated luminescence : Al2O3:C detectors
TLD500 chipsLuxel strip
• Ar-ion laser: 488 nm, 120 mW• 100 seconds of stimulation• Continuous mode• Discrimination through filter packCalibration with Co-60, dose in tissue
0 5 10 15 20 25 30 35 40
0
1
2
3
4
5
6
7
8
9
10
Time [s]
OS
L in
tens
ity [a
.e.]
488 nm
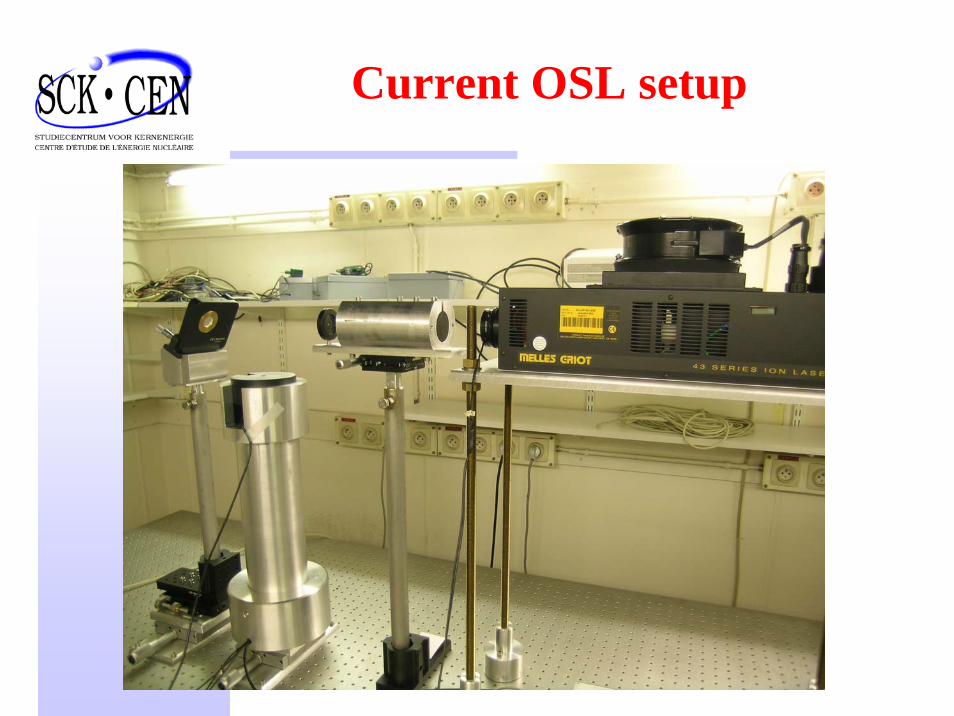
Current OSL setup
NPI: LET spectrometer based on a PADC track-etch detectors
• polyallyldiglycolcarbonate (PADC) – C12H18O7
Page 0.5 mm (Page Moulgings Ltd, England),Tastrak 0.5 and 1 mm (Track Analysis Systems Ltd, Bristol)
• etching in 5 N NaOH at 70oC for 18 hours
• automatic optical image analyzer LUCIA G
manufactured by American Technical Plastics (ATP) approximately 600 ± 50 µm thickchemically etched in 6.25N NaOH at 60oCevaluated manually
DIAS/JSC: LET spectrometer based on a PADC track-etch detectors
Laboratory exposures: SCK-CEN results
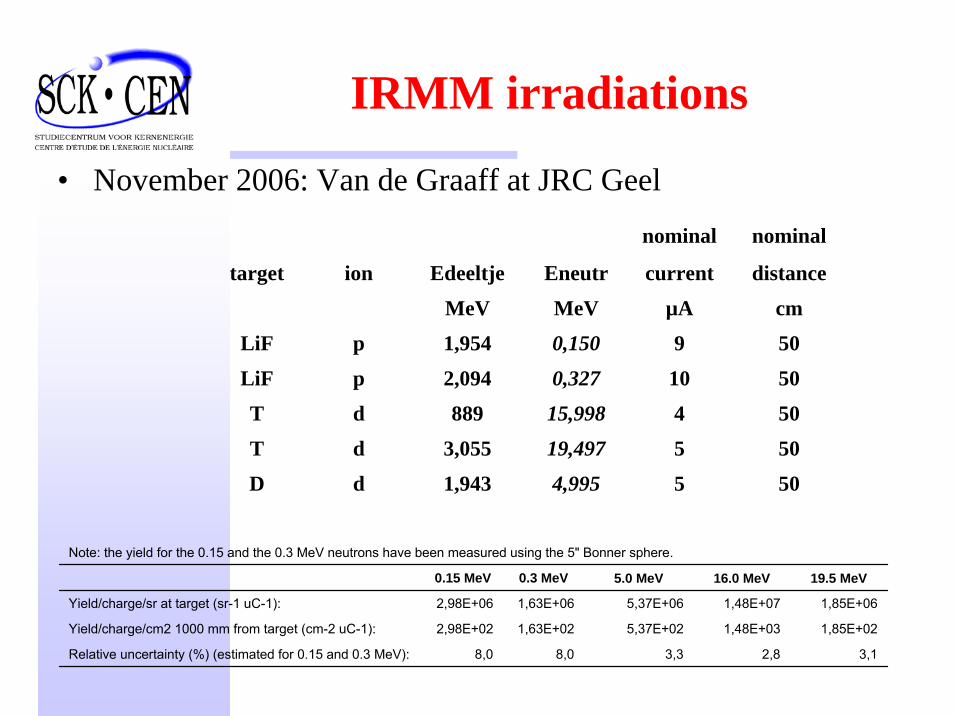
IRMM irradiations
nominal nominal
target ion Edeeltje Eneutr current distance
MeV MeV µA cm
LiF p 1,954 0,150 9 50
LiF p 2,094 0,327 10 50
T d 889 15,998 4 50
T d 3,055 19,497 5 50
D d 1,943 4,995 5 50
• November 2006: Van de Graaff at JRC Geel
Note: the yield for the 0.15 and the 0.3 MeV neutrons have been measured using the 5" Bonner sphere.
0.15 MeV 0.3 MeV 5.0 MeV 16.0 MeV 19.5 MeV
Yield/charge/sr at target (sr-1 uC-1): 2,98E+06 1,63E+06 5,37E+06 1,48E+07 1,85E+06
Yield/charge/cm2 1000 mm from target (cm-2 uC-1): 2,98E+02 1,63E+02 5,37E+02 1,48E+03 1,85E+02
Relative uncertainty (%) (estimated for 0.15 and 0.3 MeV): 8,0 8,0 3,3 2,8 3,1
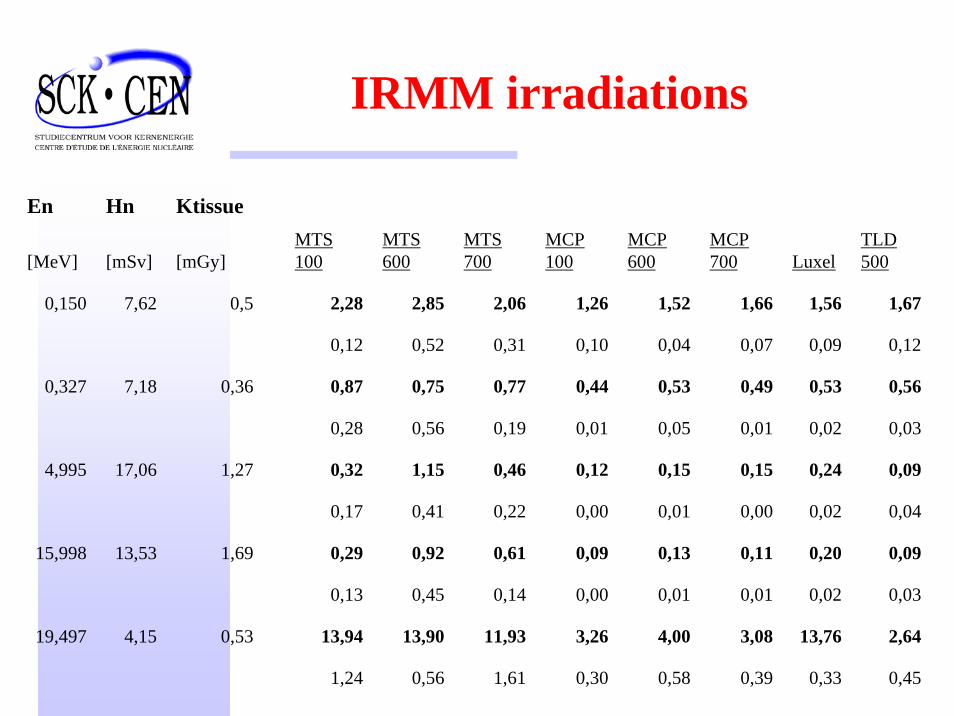
IRMM irradiations
En Hn Ktissue
[MeV] [mSv] [mGy]MTS 100
MTS 600
MTS 700
MCP 100
MCP 600
MCP 700 Luxel
TLD 500
0,150 7,62 0,5 2,28 2,85 2,06 1,26 1,52 1,66 1,56 1,67
0,12 0,52 0,31 0,10 0,04 0,07 0,09 0,12
0,327 7,18 0,36 0,87 0,75 0,77 0,44 0,53 0,49 0,53 0,56
0,28 0,56 0,19 0,01 0,05 0,01 0,02 0,03
4,995 17,06 1,27 0,32 1,15 0,46 0,12 0,15 0,15 0,24 0,09
0,17 0,41 0,22 0,00 0,01 0,00 0,02 0,04
15,998 13,53 1,69 0,29 0,92 0,61 0,09 0,13 0,11 0,20 0,09
0,13 0,45 0,14 0,00 0,01 0,01 0,02 0,03
19,497 4,15 0,53 13,94 13,90 11,93 3,26 4,00 3,08 13,76 2,64
1,24 0,56 1,61 0,30 0,58 0,39 0,33 0,45
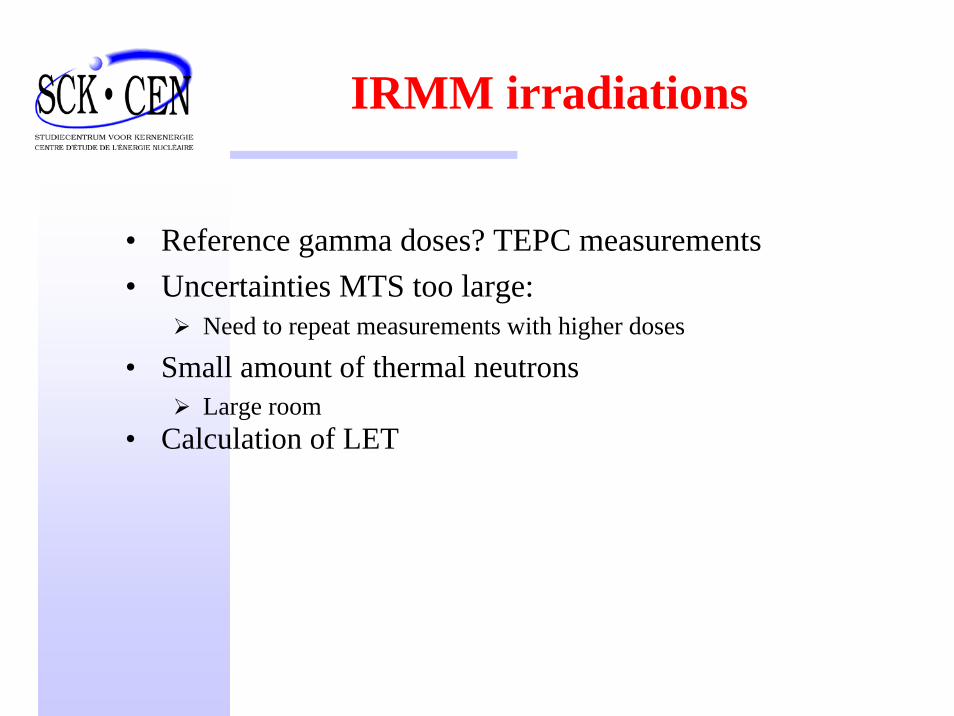
IRMM irradiations
• Reference gamma doses? TEPC measurements• Uncertainties MTS too large:
Need to repeat measurements with higher doses
• Small amount of thermal neutronsLarge room
• Calculation of LET
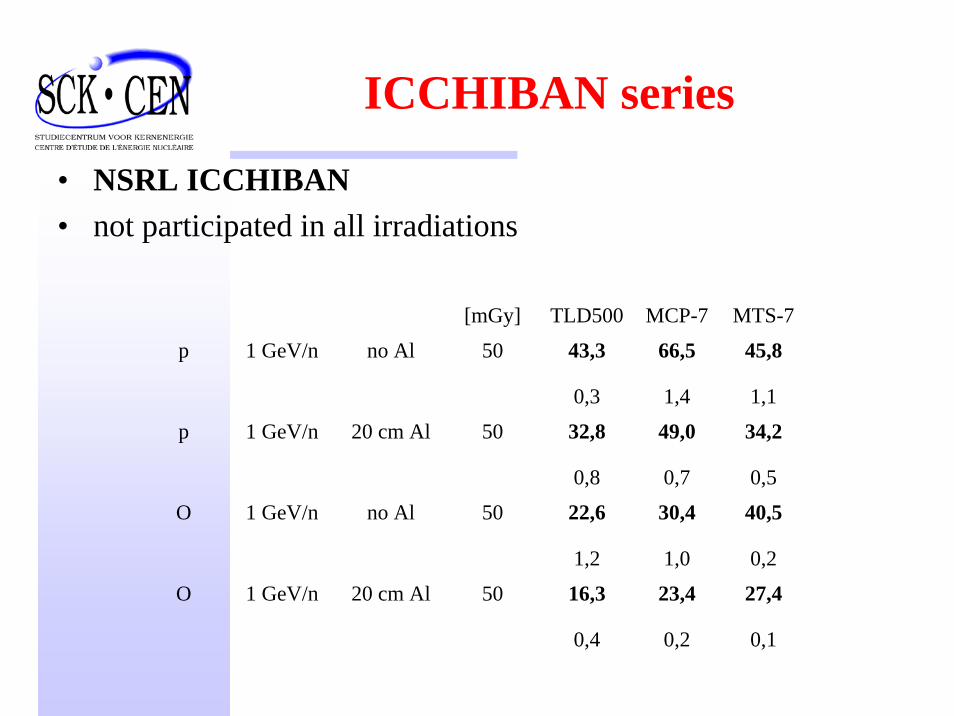
ICCHIBAN series
• NSRL ICCHIBAN• not participated in all irradiations
[mGy] TLD500 MCP-7 MTS-7
p 1 GeV/n no Al 50 43,3 66,5 45,8
0,3 1,4 1,1
p 1 GeV/n 20 cm Al 50 32,8 49,0 34,2
0,8 0,7 0,5
O 1 GeV/n no Al 50 22,6 30,4 40,5
1,2 1,0 0,2
O 1 GeV/n 20 cm Al 50 16,3 23,4 27,4
0,4 0,2 0,1
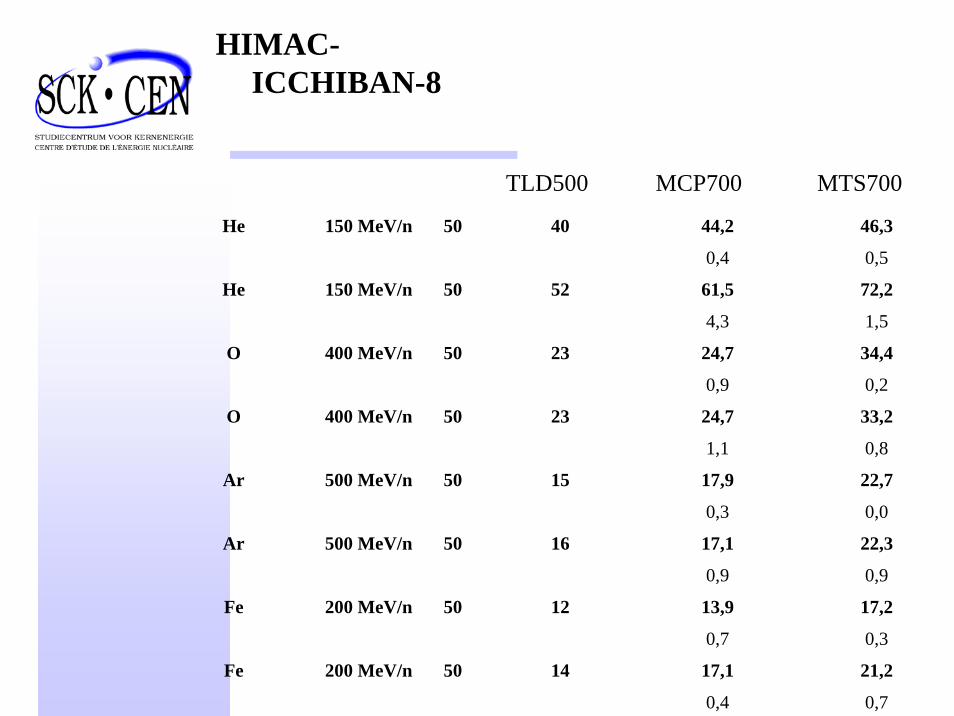
HIMAC-ICCHIBAN-8
He 150 MeV/n 50 40 44,2 46,3
0,4 0,5
He 150 MeV/n 50 52 61,5 72,2
4,3 1,5
O 400 MeV/n 50 23 24,7 34,4
0,9 0,2
O 400 MeV/n 50 23 24,7 33,2
1,1 0,8
Ar 500 MeV/n 50 15 17,9 22,7
0,3 0,0
Ar 500 MeV/n 50 16 17,1 22,3
0,9 0,9
Fe 200 MeV/n 50 12 13,9 17,2
0,7 0,3
Fe 200 MeV/n 50 14 17,1 21,2
0,4 0,7
TLD500 MCP700 MTS700
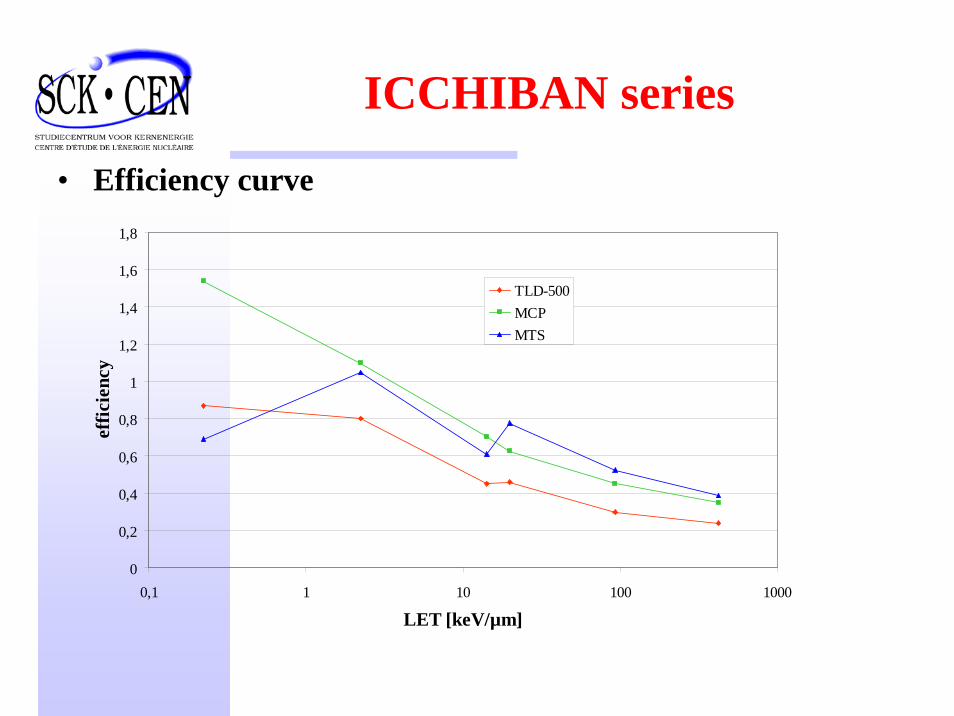
ICCHIBAN series
• Efficiency curve
0
0,2
0,4
0,6
0,8
1
1,2
1,4
1,6
1,8
0,1 1 10 100 1000
LET [keV/µm]
effic
ienc
y
TLD-500MCPMTS
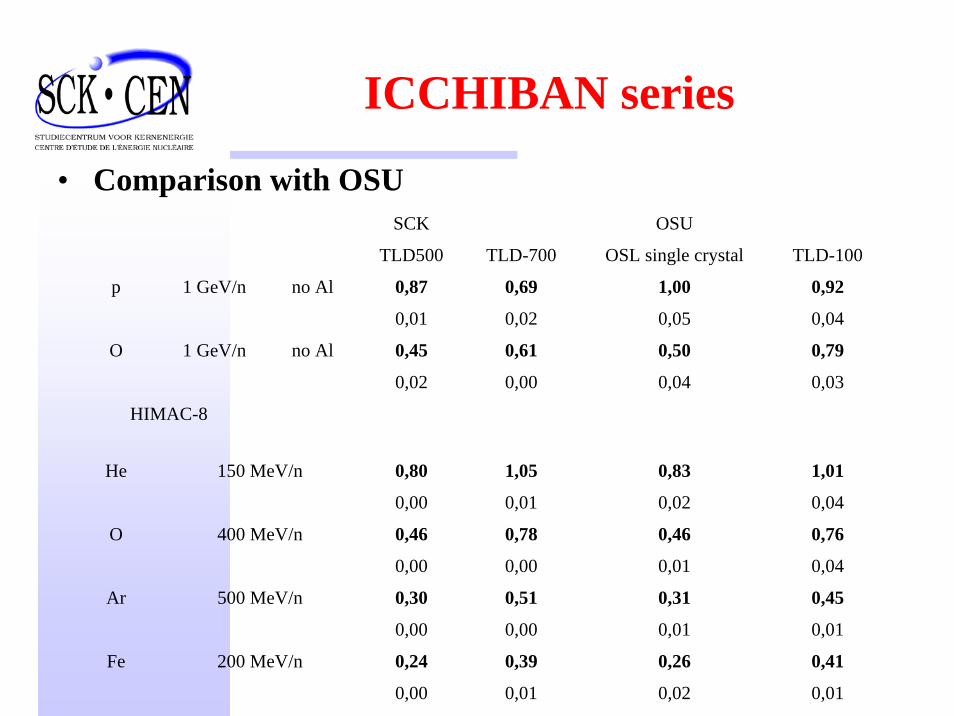
ICCHIBAN series
• Comparison with OSUSCK OSU
TLD500 TLD-700 OSL single crystal TLD-100
p 1 GeV/n no Al 0,87 0,69 1,00 0,92
0,01 0,02 0,05 0,04
O 1 GeV/n no Al 0,45 0,61 0,50 0,79
0,02 0,00 0,04 0,03
HIMAC-8
He 150 MeV/n 0,80 1,05 0,83 1,01
0,00 0,01 0,02 0,04
O 400 MeV/n 0,46 0,78 0,46 0,76
0,00 0,00 0,01 0,04
Ar 500 MeV/n 0,30 0,51 0,31 0,45
0,00 0,00 0,01 0,01
Fe 200 MeV/n 0,24 0,39 0,26 0,41
0,00 0,01 0,02 0,01
Future
• Other Ground experiments:Neutron sourcesMono-energetic neutrons: IRMM: october 2007high energy fields♣ iThemba♣Dubna♣Other ICCHIBAN runs?
• Set-up of efficiency curve: compare with literature• Glow curve deconvolution (TLD) – decay curve deconvolution
(OSL)
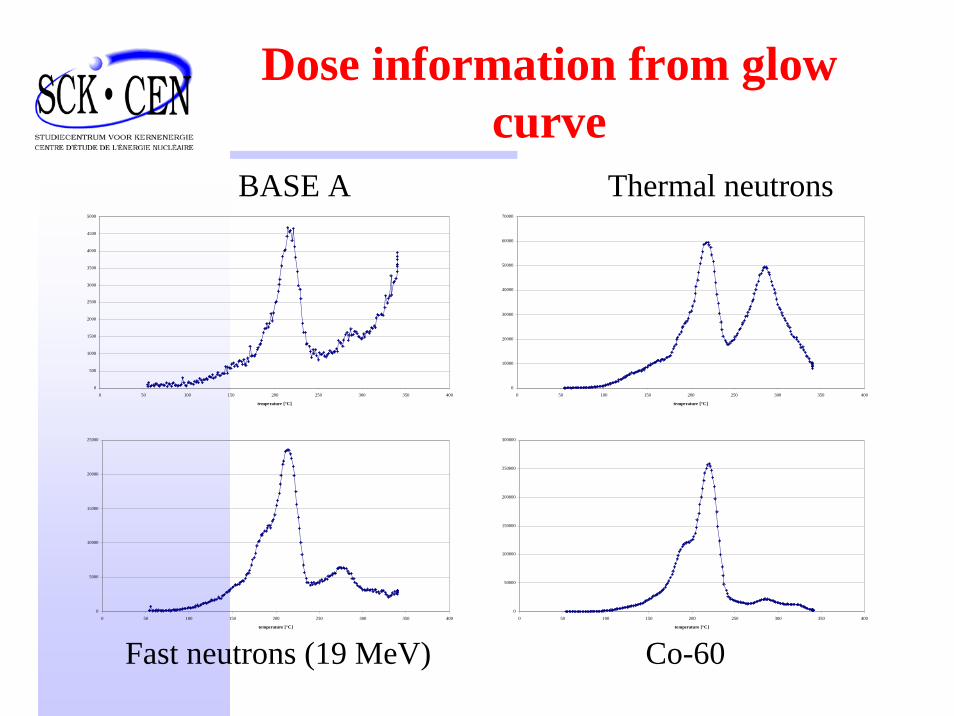
Dose information from glow curve
0
500
1000
1500
2000
2500
3000
3500
4000
4500
5000
0 50 100 150 200 250 300 350 400
temperature [°C]
0
10000
20000
30000
40000
50000
60000
70000
0 50 100 150 200 250 300 350 400
temperature [°C]
0
5000
10000
15000
20000
25000
0 50 100 150 200 250 300 350 400
temperature [°C]
0
50000
100000
150000
200000
250000
300000
0 50 100 150 200 250 300 350 400
temperature [°C]
Fast neutrons (19 MeV) Co-60
Thermal neutronsBASE A
Space exposures: SCK-CEN results
Past space measurements:
Two ESA projects:
MESSAGE 2: effects of the space flight conditions on bacterial gene expression♣October 2003: 10 days
MOBILIZATION: gene transfer between model bacteria : ♣april 2004: 11 days
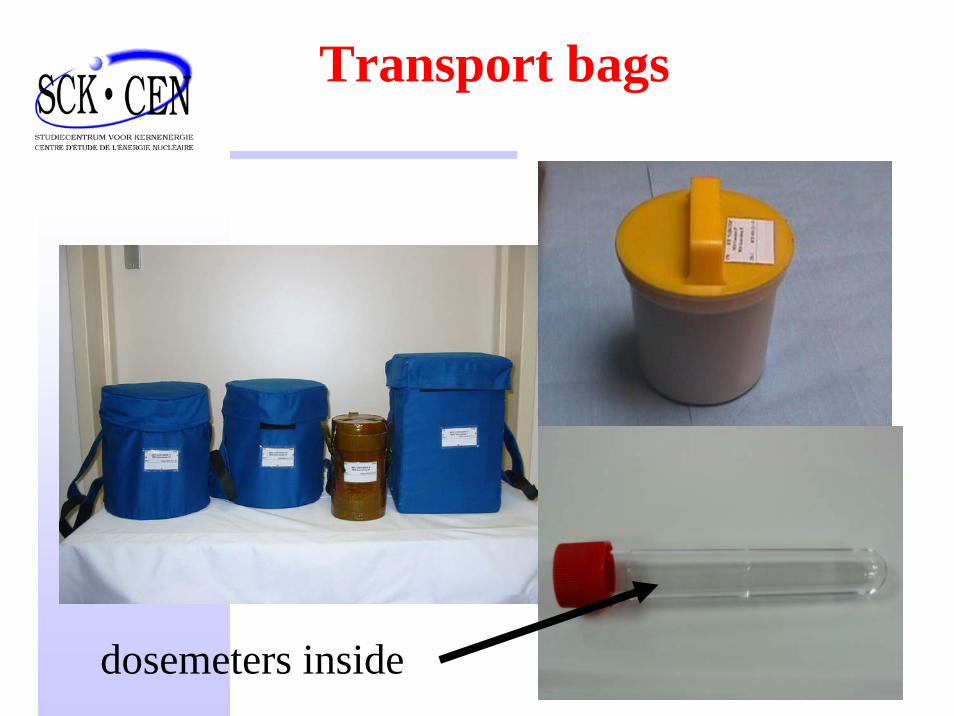
Transport bags
dosemeters inside
• Dose rate measured: 162 µGy/day (OSL, TL), high-LET(>10 keV/µm) particles: ~ 5 µGy d-1
Total dose rate: ~ 180 µGy/day
• Different results for different types of detectors: ≠ efficiencies to HCP with LET < detection threshold of TED’s
Conclusions first experiments
BASE-A flight
• Undocking of 13S: 18 September 2006 at 23:53 CET
Landing of 13S: 29 September 2006 at 03:13 CET
• Inclination: Practically constant at approximately 51.6 degrees.
Altitude of ISS between docking of 13S and undocking of 13S: Decreases almost linearly from 342 km to 340.5 km (approximate values)
• hardware and experiment stackings from the Soyuz module to the Zvezda module in ISS, conduct of experiment (storage & pictures) done by German European astronaut Thomas Reiter (ISS Expedition 13 crew - Astrolab-missie)
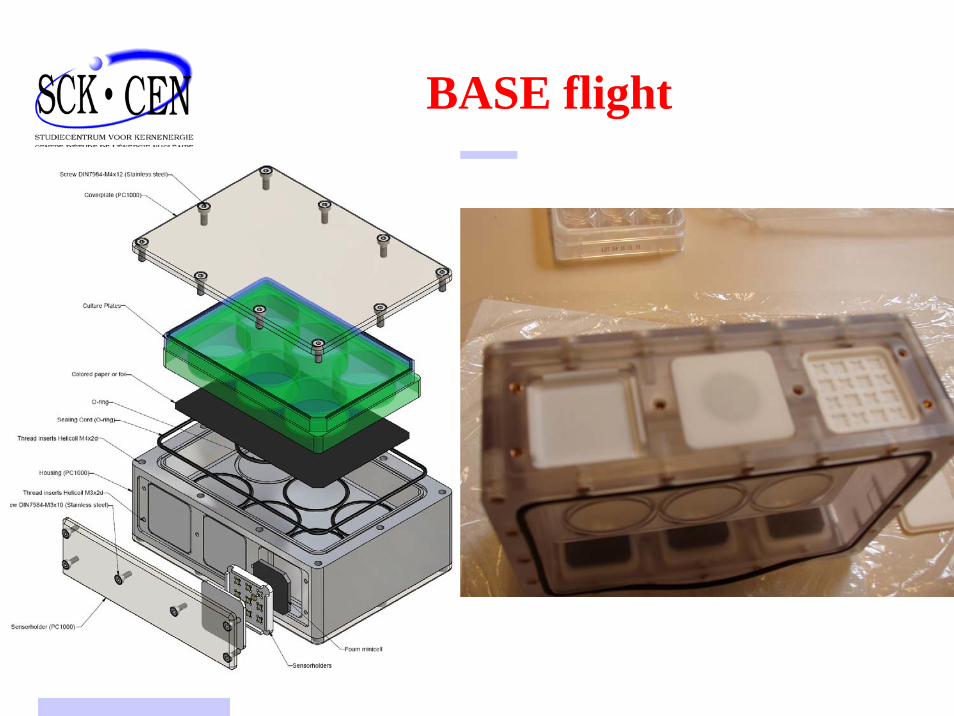
BASE flight
BASE-A flight
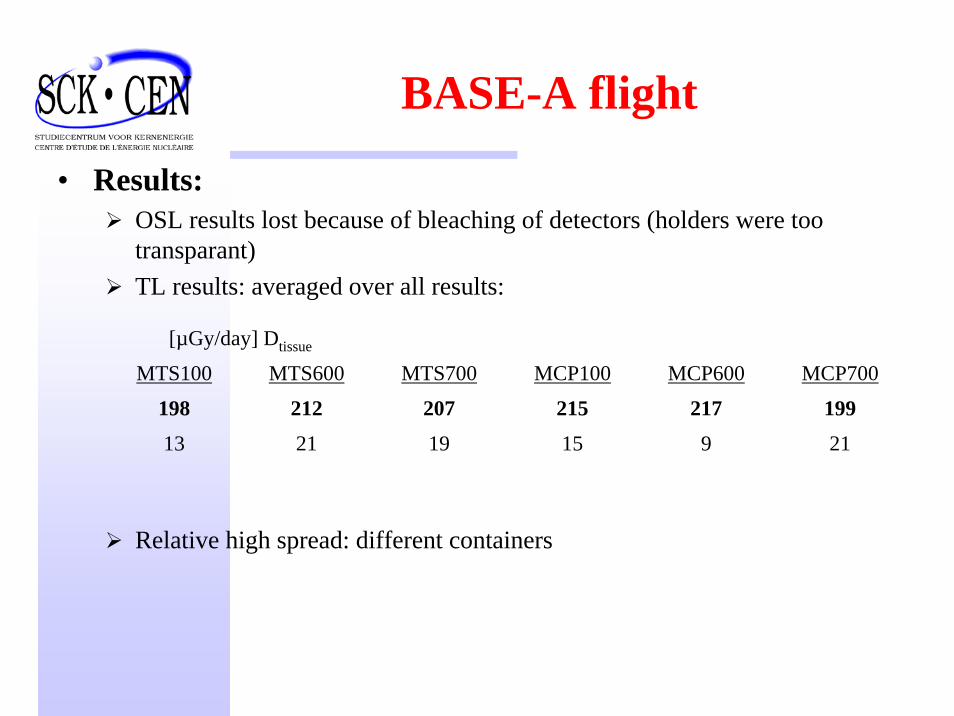
• Results: OSL results lost because of bleaching of detectors (holders were tootransparant)TL results: averaged over all results:
Relative high spread: different containers
[µGy/day] Dtissue
MTS100 MTS600 MTS700 MCP100 MCP600 MCP700
198 212 207 215 217 199
13 21 19 15 9 21
BASE-A flight
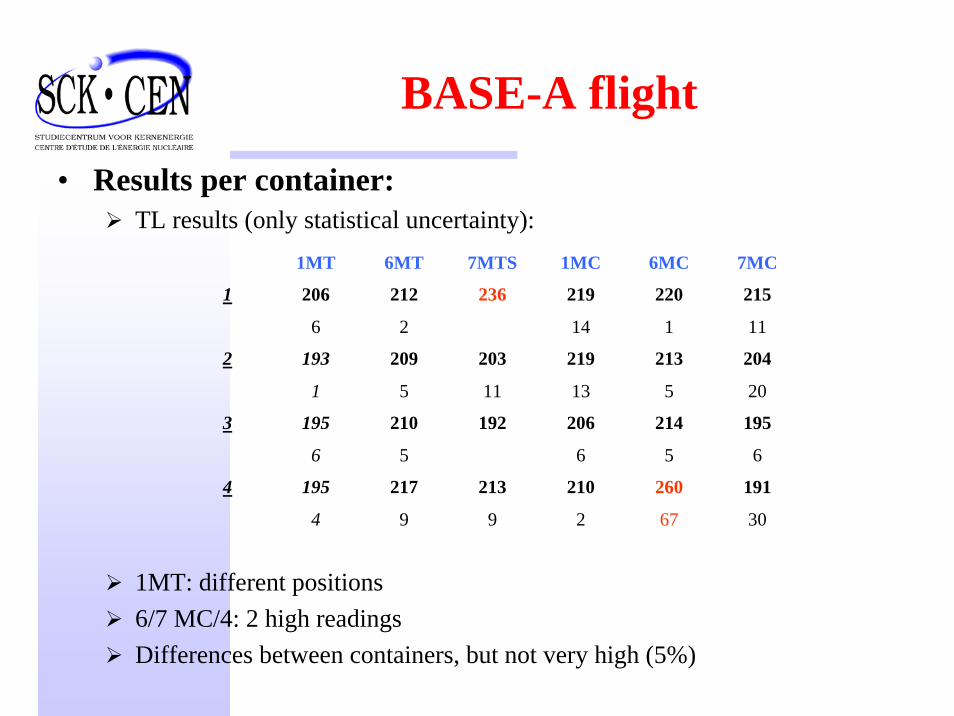
• Results per container: TL results (only statistical uncertainty):
1MT: different positions6/7 MC/4: 2 high readingsDifferences between containers, but not very high (5%)
1MT 6MT 7MTS 1MC 6MC 7MC
1 206 212 236 219 220 215
6 2 14 1 11
2 193 209 203 219 213 204
1 5 11 13 5 20
3 195 210 192 206 214 195
6 5 6 5 6
4 195 217 213 210 260 191
4 9 9 2 67 30
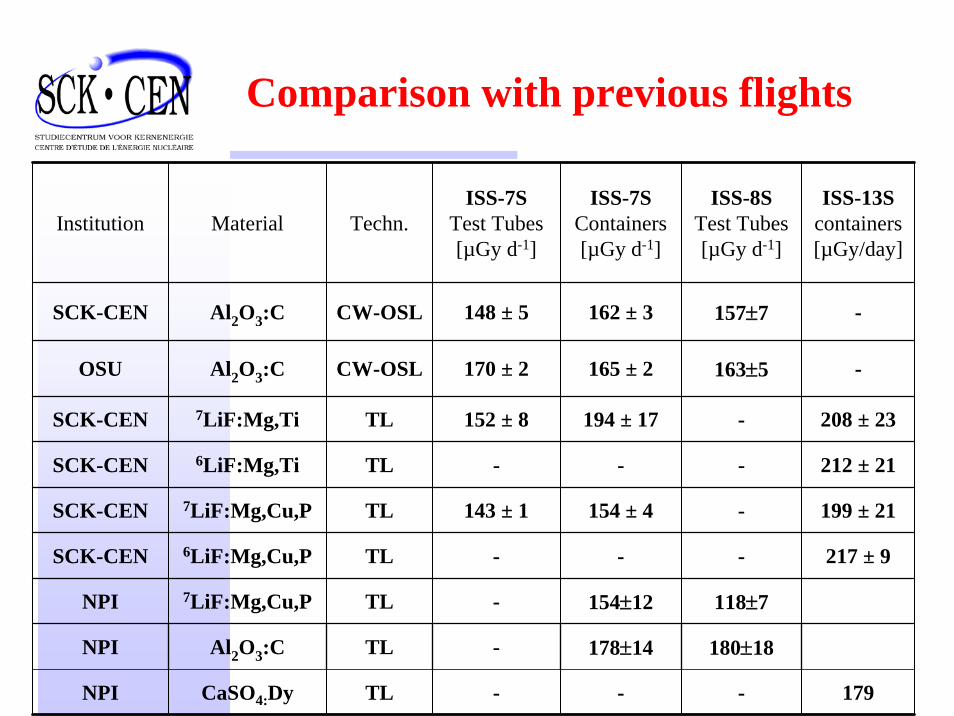
Comparison with previous flights
Institution Material Techn.ISS-7S
Test Tubes [µGy d-1]
ISS-7SContainers [µGy d-1]
ISS-8STest Tubes [µGy d-1]
ISS-13Scontainers[µGy/day]
SCK-CEN Al2O3:C CW-OSL 148 ± 5 162 ± 3 157±7
163±5
-
SCK-CEN 6LiF:Mg,Ti TL - - - 212 ± 21
SCK-CEN 7LiF:Mg,Cu,P TL 143 ± 1 154 ± 4 - 199 ± 21
NPI Al2O3:C TL - 178±14 180±18
-
118±7
-
-
OSU Al2O3:C CW-OSL 170 ± 2 165 ± 2 -
SCK-CEN 7LiF:Mg,Ti TL 152 ± 8 194 ± 17 208 ± 23
SCK-CEN 6LiF:Mg,Cu,P TL - - 217 ± 9
NPI 7LiF:Mg,Cu,P TL - 154±12
NPI CaSO4:Dy TL - - 179
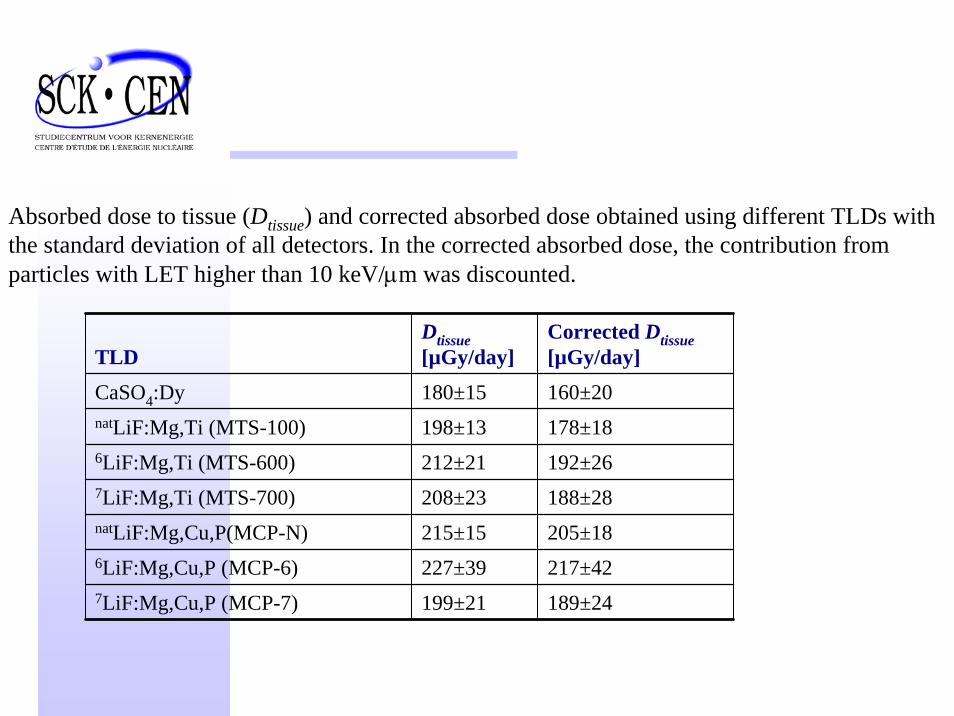
Absorbed dose to tissue (Dtissue) and corrected absorbed dose obtained using different TLDs with the standard deviation of all detectors. In the corrected absorbed dose, the contribution from particles with LET higher than 10 keV/μm was discounted.
TLDDtissue[µGy/day]
Corrected Dtissue[µGy/day]
CaSO4:Dy 180±15 160±20natLiF:Mg,Ti (MTS-100) 198±13 178±186LiF:Mg,Ti (MTS-600) 212±21 192±267LiF:Mg,Ti (MTS-700) 208±23 188±28natLiF:Mg,Cu,P(MCP-N) 215±15 205±186LiF:Mg,Cu,P (MCP-6) 227±39 217±427LiF:Mg,Cu,P (MCP-7) 199±21 189±24
The absorbed doses obtained with TLDs at different laboratories were consistent, but the uncertainties are of 10% in general.
Although different materials were shown to have different efficiencies to HZE particles during ground-based experiments, these differences could not be resolved in the space exposures due to the uncertainties
involved. The contribution from high LET particles to the TLD results, calculated
based on TED data, did not exceed 10%.
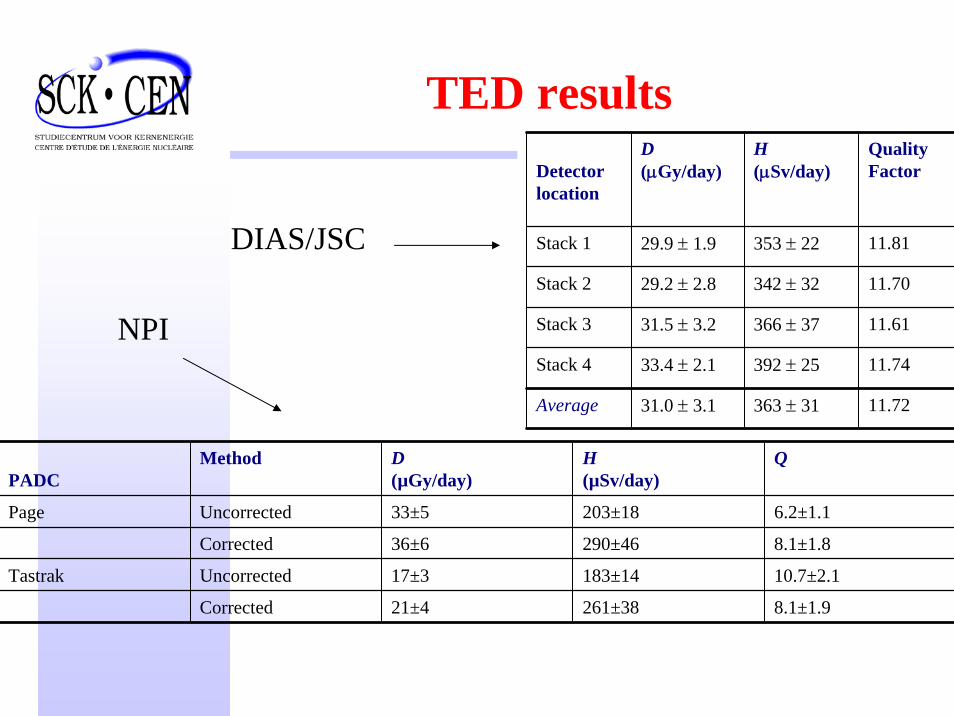
PADCMethod D
(µGy/day)H(µSv/day)
Q
Page Uncorrected 33±5 203±18 6.2±1.1
Corrected 36±6 290±46 8.1±1.8
Tastrak Uncorrected 17±3 183±14 10.7±2.1
Corrected 21±4 261±38 8.1±1.9
Detectorlocation
D(μGy/day)
H(μSv/day)
QualityFactor
Stack 1 29.9 ± 1.9 353 ± 22 11.81
Stack 2 29.2 ± 2.8 342 ± 32 11.70
Stack 3 31.5 ± 3.2 366 ± 37 11.61
Stack 4 33.4 ± 2.1 392 ± 25 11.74
Average 31.0 ± 3.1 363 ± 31 11.72
TED results
DIAS/JSC
NPI
The average values of the total dosimetric quantities are equal to ~220 µGy/day for D, and H varies from 480 to 580 µSv/day, depending on which TED result is used.
The D and H values are ~20% to 40% higher than previously measured (Goossens et al., 2006). This difference can be related to variations in solar activity or exposure location at the ISS, or both..
BASE A: Conclusion
Still in space
• BRADOS space intercomparison

Future flight opportunities
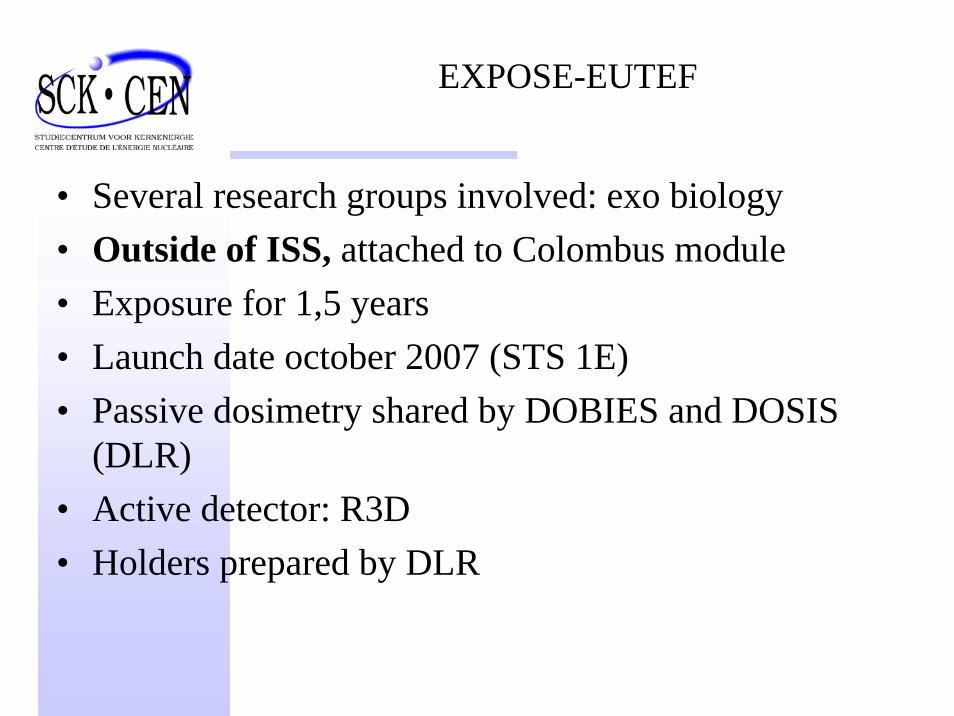
• Several research groups involved: exo biology• Outside of ISS, attached to Colombus module• Exposure for 1,5 years• Launch date october 2007 (STS 1E)• Passive dosimetry shared by DOBIES and DOSIS
(DLR)• Active detector: R3D • Holders prepared by DLR
EXPOSE-EUTEF
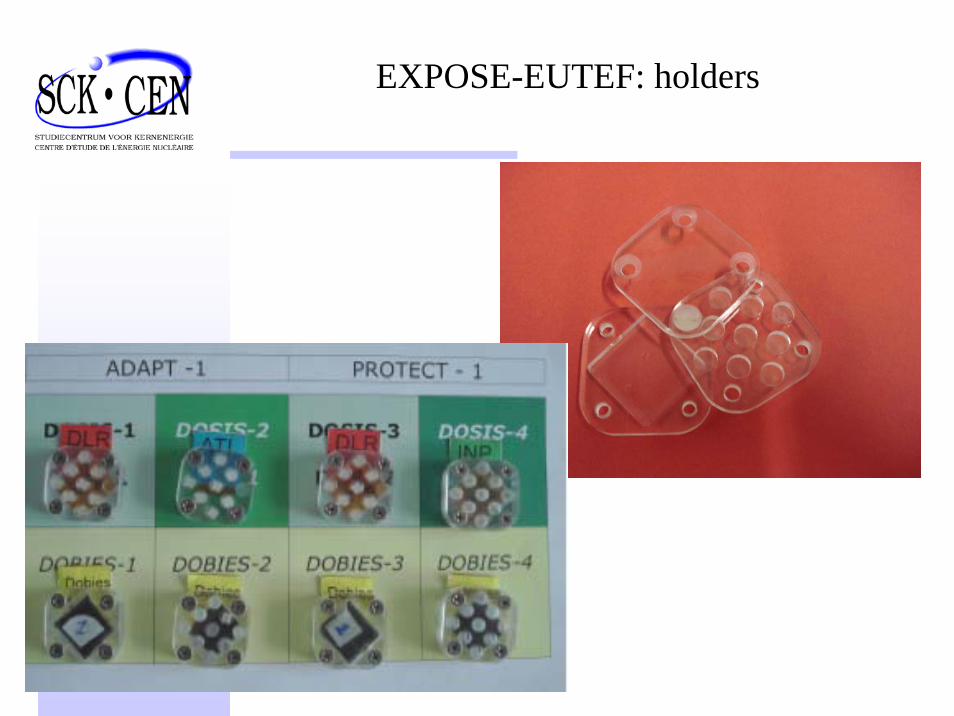
EXPOSE-EUTEF: holders
• Main researchers: Free University of Brussels• Determine the effect of microgravity on expression and functionality of Flo
proteins (yeast)• 1 separate experimental container (90x58x24mm) with all sensors
Including radiation sensors: same holders as BASE-A (now in black)♣OSL/TLD: ♣TED:
• BIO#4 mission: spring/autumn 2008
YING-B experiment
• Main researchers: SCK-CEN• Same configuration as Mobilisatsia 2• october 2007
Mobilisatsia-3 experiment
• Main researchers: SCK-CEN• Same configuration as BASE-A• BIO#4 mission: spring/autumn 2008
BASE-B experiment
• Main researchers: Rumania, EU-SURE program• Same hardware as BASE/YING• spring 2008• 3 containers for 10/11 days, 1 container for 6
months
CFS-A experiment
• KUBIK container: 6 months exposure inbetweenbiological experiments
Needs to be negociated
• EMCS container:Long waiting list
• Small detector packages on different locations in the ISS
Foreseen together with DOSIS experiment (Columbus)
Other possibilities to be discussed with ESA
End-goal of DOBIES
• Small and cheap passive dosemeter for biologicalexperiments
Which type of detectors ?How many detectors for sufficient accuracy? Simple algorithmCorrect for high LET contribution♣no need for TED every time?
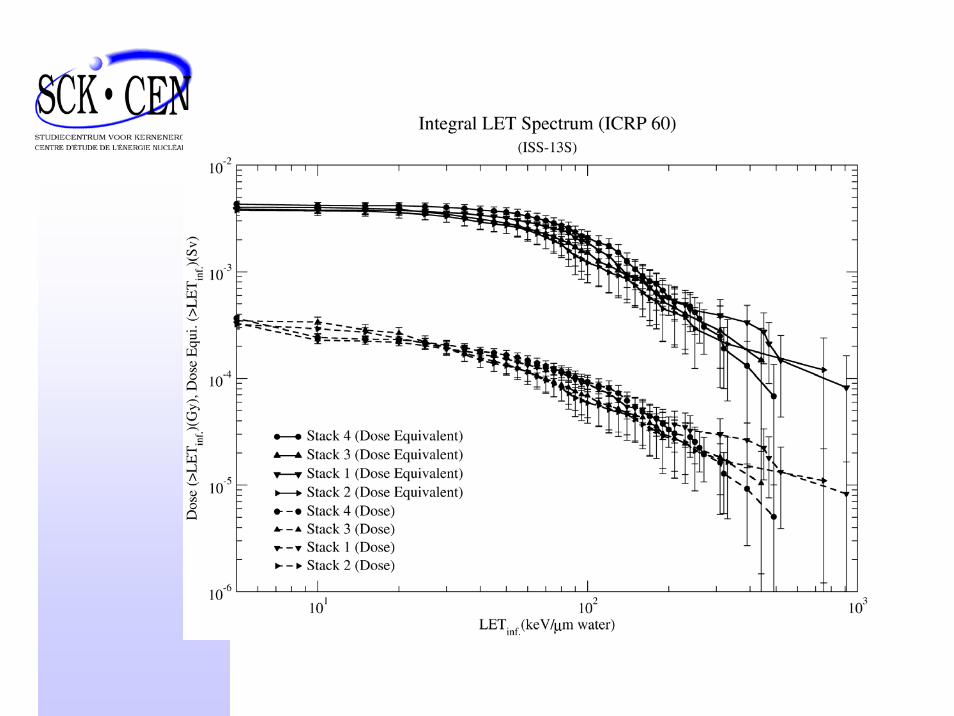
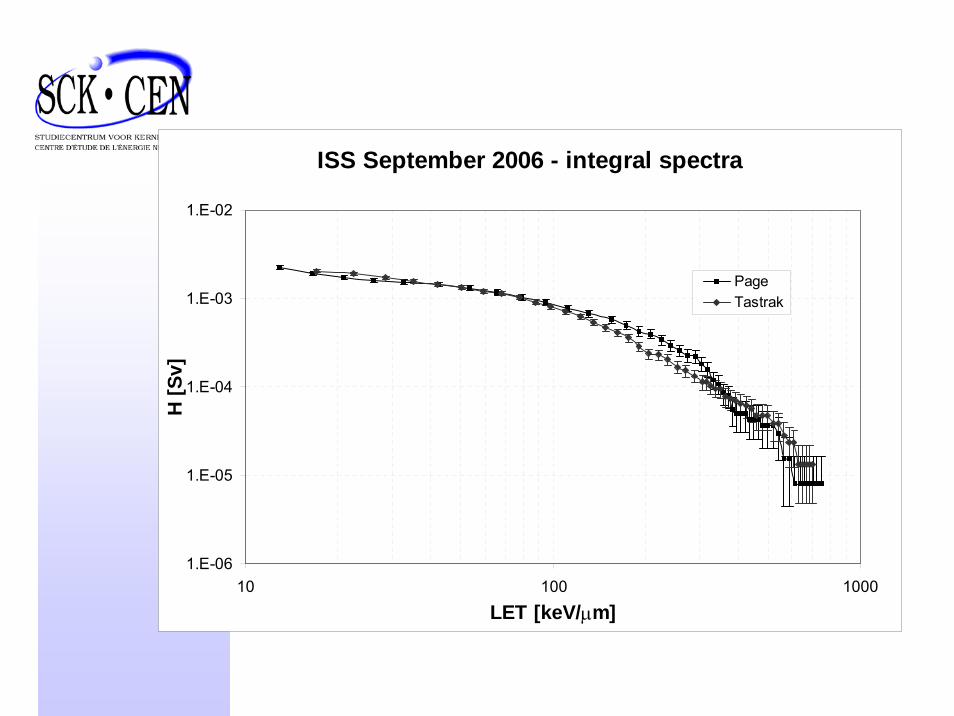
ISS September 2006 - integral spectra
1.E-06
1.E-05
1.E-04
1.E-03
1.E-02
10 100 1000
LET [keV/μm]
H [S
v]
PageTastrak