dorota_ilzuck
DESCRIPTION
http://iem.frosselli.org/docs/pres/2011_en/Dorota_Ilzuck.pptTRANSCRIPT
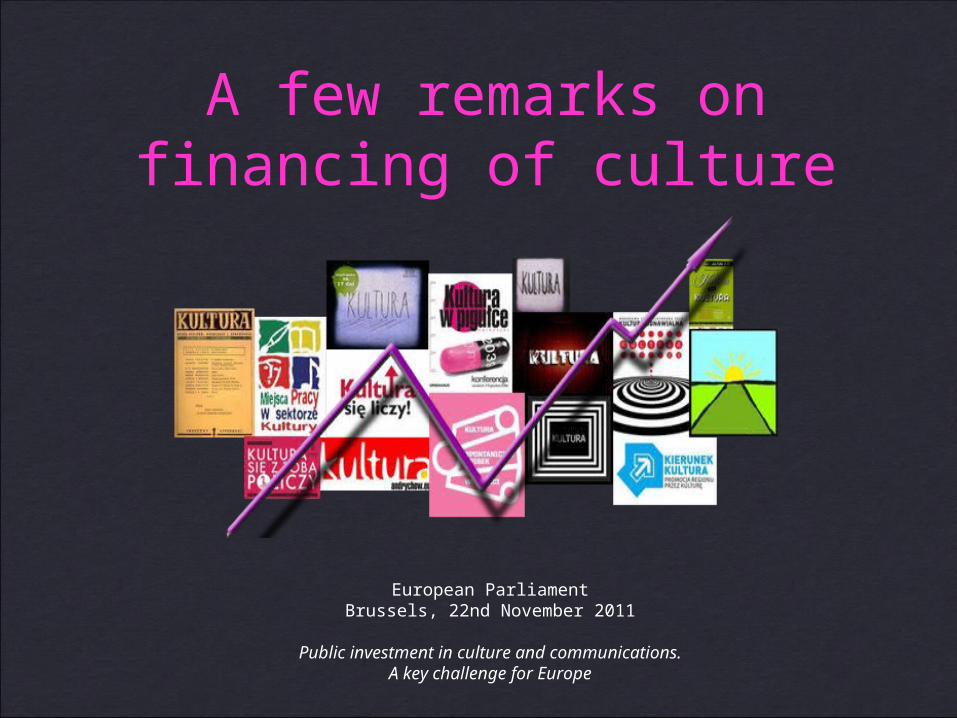
A few remarks on financing of culture
European ParliamentBrussels, 22nd November 2011
Public investment in culture and communications.A key challenge for Europe
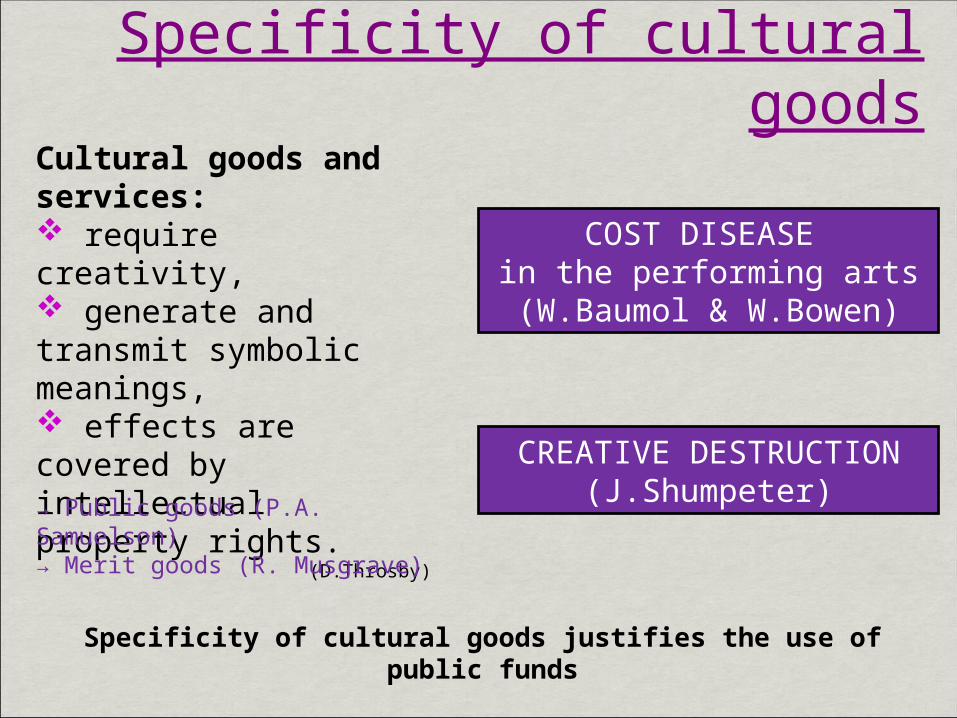
Specificity of cultural goodsCultural goods and services: require creativity, generate and transmit symbolic meanings, effects are covered by intellectual property rights.
(D.Throsby)
Specificity of cultural goods justifies the use of public funds
→ Public goods (P.A. Samuelson)→ Merit goods (R. Musgrave)
COST DISEASE in the performing arts
(W.Baumol & W.Bowen)
CREATIVE DESTRUCTION(J.Shumpeter)
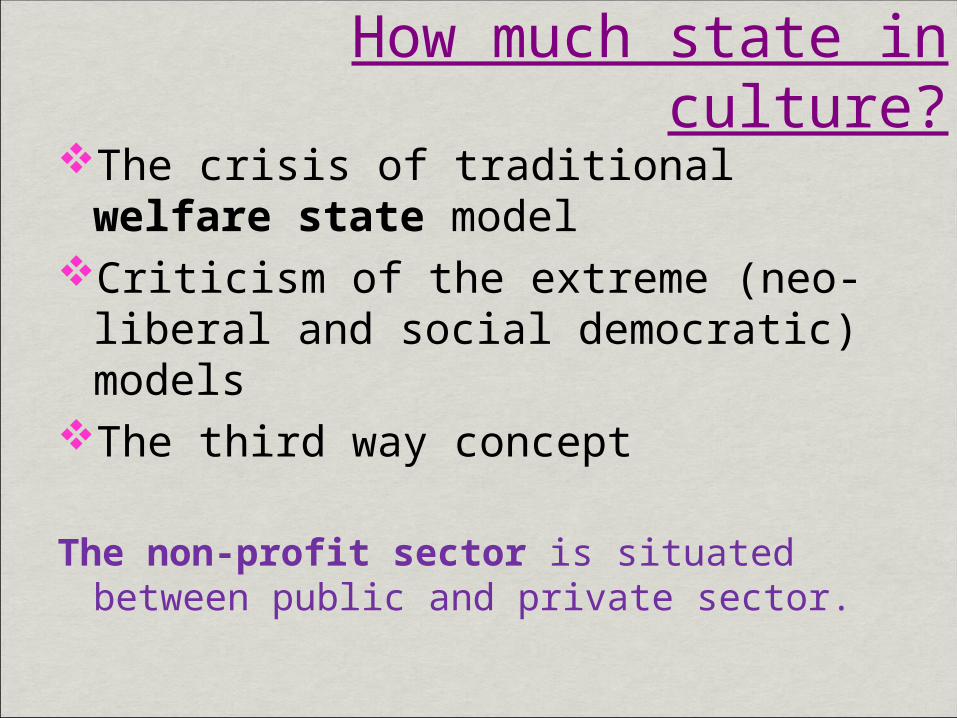
How much state in culture?The crisis of traditional welfare
state modelCriticism of the extreme (neo-liberal
and social democratic) modelsThe third way concept
The non-profit sector is situated between public and private sector.
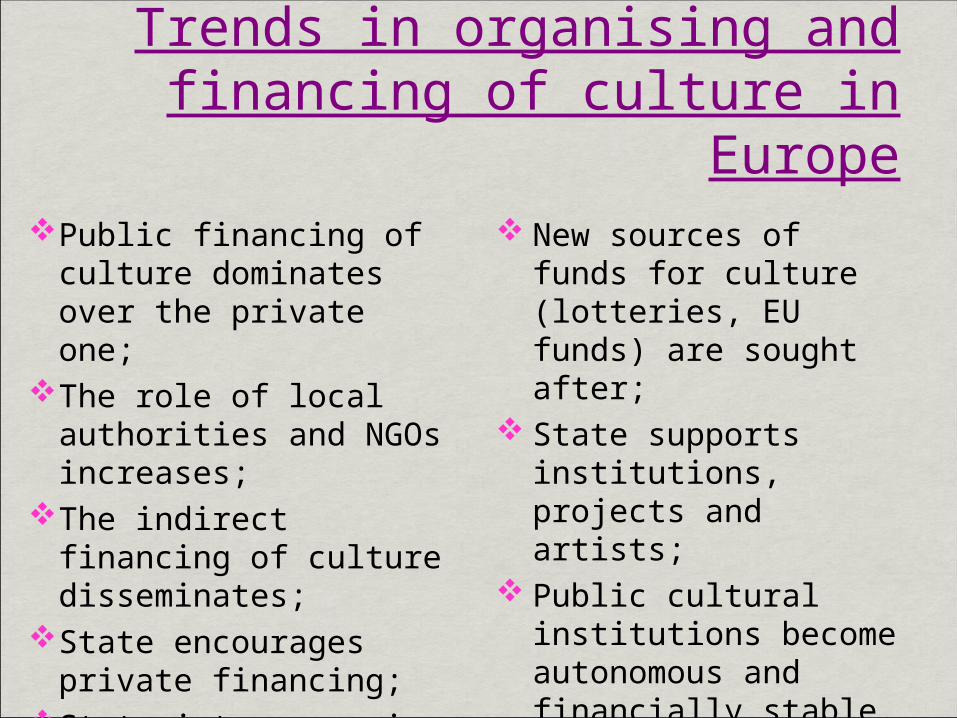
Public financing of culture dominates over the private one;
The role of local authorities and NGOs increases;
The indirect financing of culture disseminates;
State encourages private financing;
State intervenes in the field of cultural industries;
New sources of funds for culture (lotteries, EU funds) are sought after;
State supports institutions, projects and artists;
Public cultural institutions become autonomous and financially stable.
Trends in organising and financing of culture in Europe
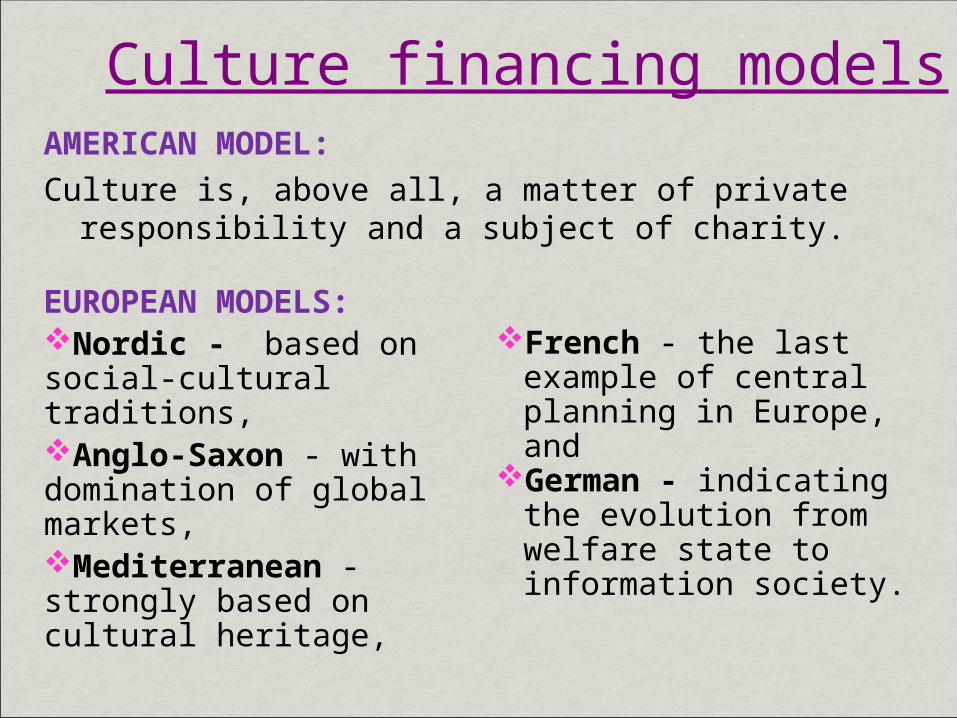
Culture financing modelsAMERICAN MODEL:Culture is, above all, a matter of private
responsibility and a subject of charity.
EUROPEAN MODELS:Nordic - based on social-cultural traditions,Anglo-Saxon - with domination of global markets,Mediterranean - strongly based on cultural heritage,
French - the last example of central planning in Europe, and
German - indicating the evolution from welfare state to information society.

Country Year Per capita (€) % GDPEstonia 2009 164.10 1.6%Finland 2009 174.00 0.54%France 2002 197.2 1.2%Germany 2007 101.00 0.34%Hungary 2009 56.00 0.57%Italy 2008 117.00 0.45%The Netherlands 2006 183.00 0.6%
Poland 2008 43.98 0.58%Slovenia 2007 134.6 0.81%Source: Council of Europe/ERICarts: "Compendium of Cultural Policies and Trends in Europe", 12th edition 2011. <http:// www.culturalpolicies.net>, ISSN: 2222-7334
Public expenditure on culture in chosen European countries
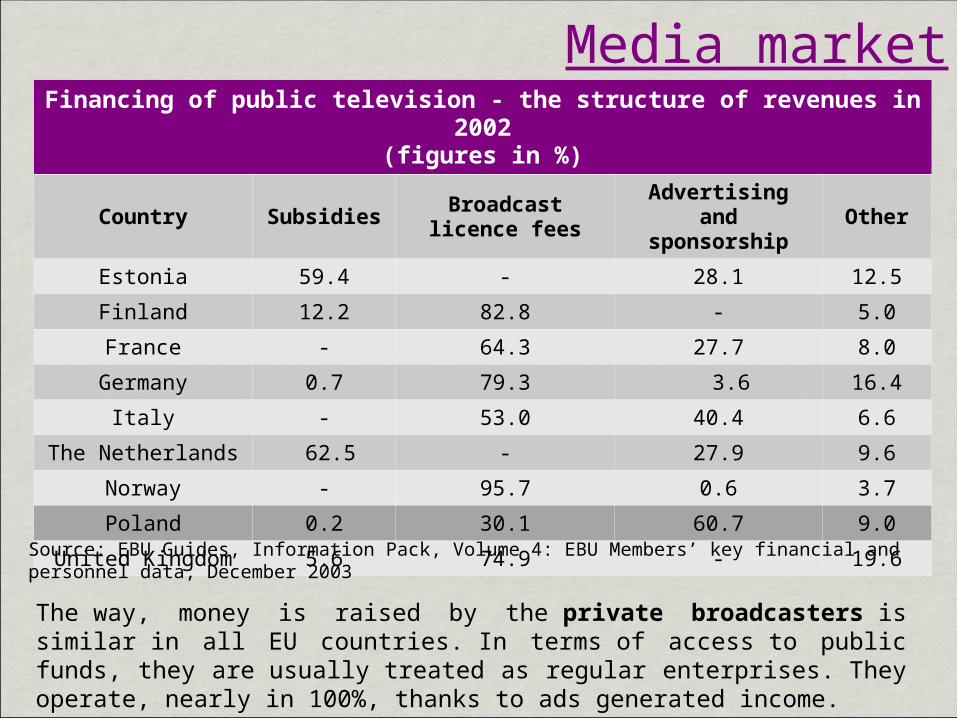
Financing of public television - the structure of revenues in 2002(figures in %)
Country Subsidies Broadcast licence fees
Advertising and
sponsorshipOther
Estonia 59.4 - 28.1 12.5Finland 12.2 82.8 - 5.0France - 64.3 27.7 8.0
Germany 0.7 79.3 3.6 16.4Italy - 53.0 40.4 6.6
The Netherlands 62.5 - 27.9 9.6Norway - 95.7 0.6 3.7Poland 0.2 30.1 60.7 9.0
United Kingdom 5.6 74.9 - 19.6
Media market
Source: EBU Guides, Information Pack, Volume 4: EBU Members’ key financial and personnel data, December 2003
The way, money is raised by the private broadcasters is similar in all EU countries. In terms of access to public funds, they are usually treated as regular enterprises. They operate, nearly in 100%, thanks to ads generated income.
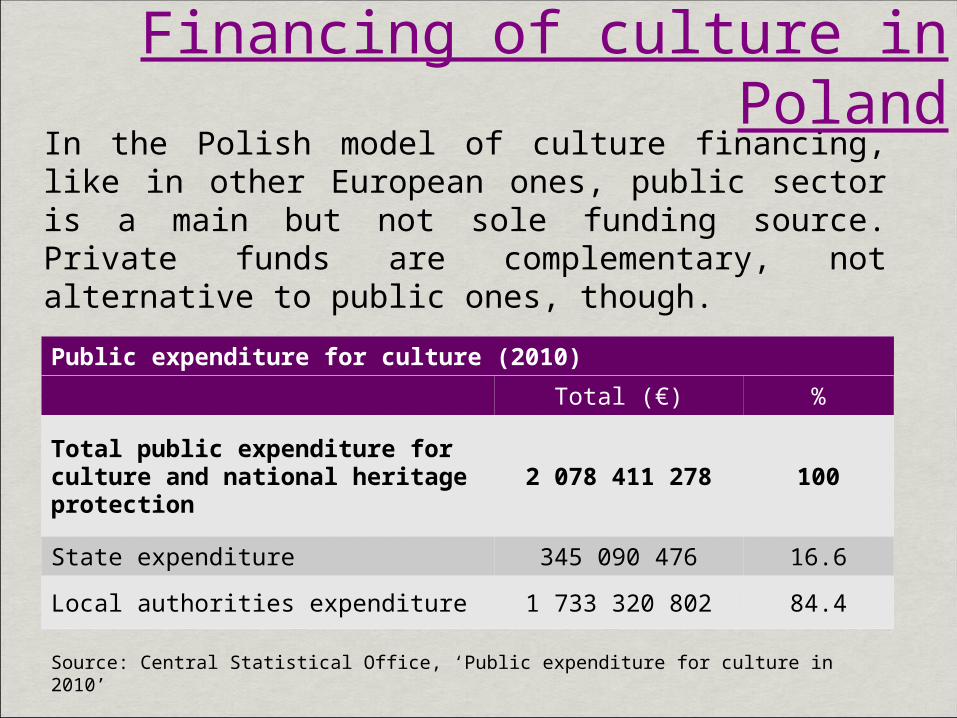
In the Polish model of culture financing, like in other European ones, public sector is a main but not sole funding source. Private funds are complementary, not alternative to public ones, though.
Public expenditure for culture (2010)Total (€) %
Total public expenditure for culture and national heritage protection
2 078 411 278 100
State expenditure 345 090 476 16.6Local authorities expenditure 1 733 320 802 84.4
Source: Central Statistical Office, ‘Public expenditure for culture in 2010’
Financing of culture in Poland
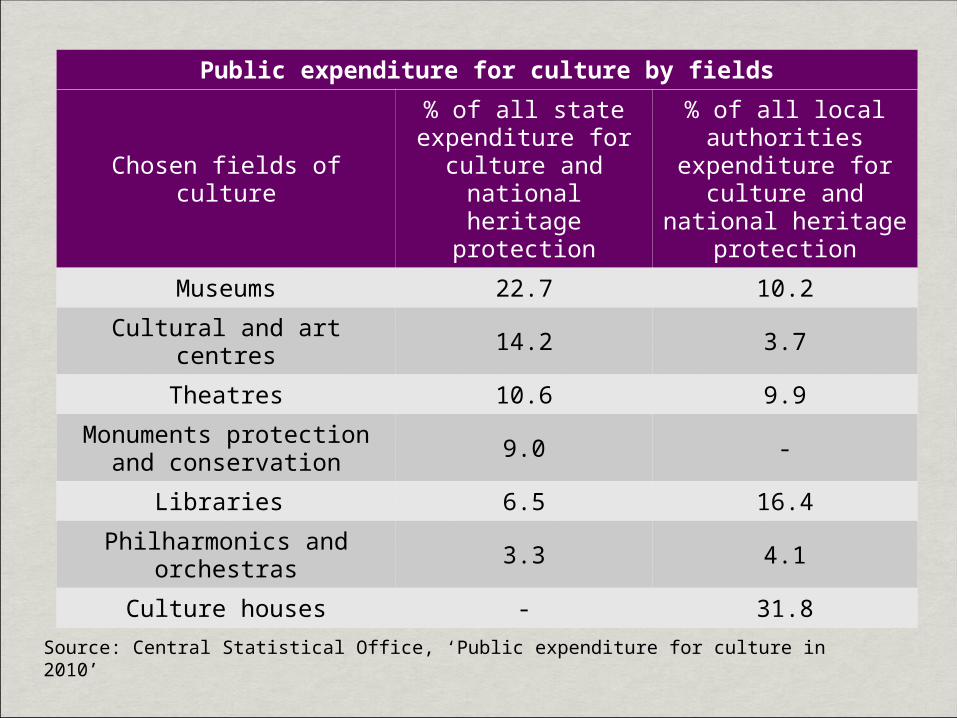
Public expenditure for culture by fields
Chosen fields of culture
% of all state expenditure for
culture and national heritage
protection
% of all local authorities
expenditure for culture and national heritage protection
Museums 22.7 10.2
Cultural and art centres 14.2 3.7
Theatres 10.6 9.9Monuments protection
and conservation 9.0 -
Libraries 6.5 16.4Philharmonics and
orchestras 3.3 4.1
Culture houses - 31.8
Source: Central Statistical Office, ‘Public expenditure for culture in 2010’
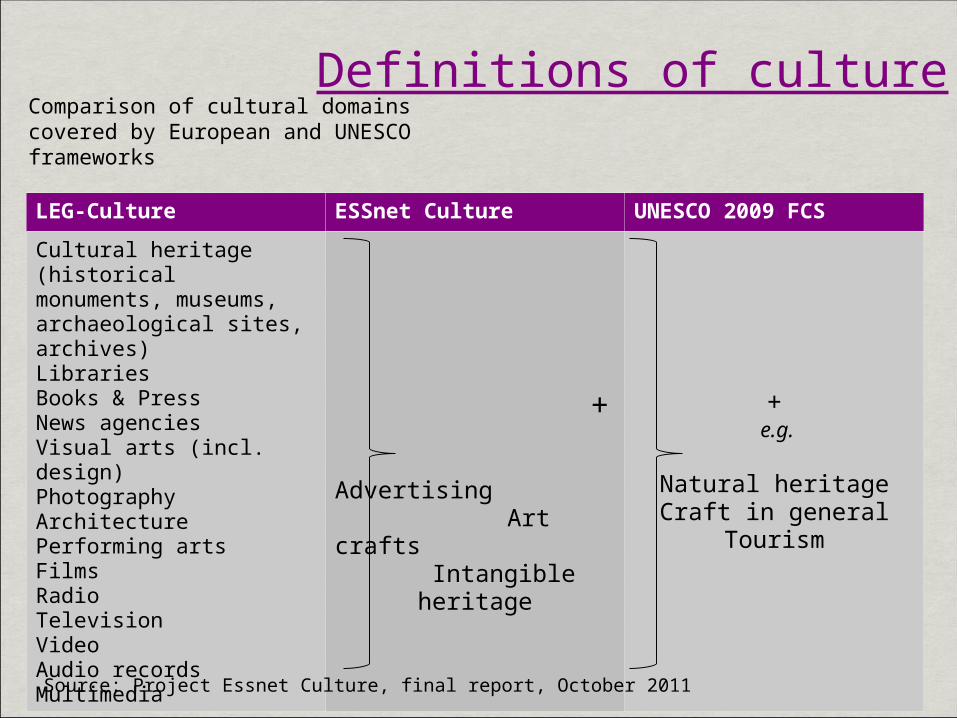
Definitions of cultureComparison of cultural domains covered by European and UNESCOframeworks
LEG-Culture ESSnet Culture UNESCO 2009 FCSCultural heritage (historical monuments, museums, archaeological sites, archives)LibrariesBooks & PressNews agenciesVisual arts (incl. design)PhotographyArchitecturePerforming artsFilmsRadioTelevisionVideoAudio recordsMultimedia
+ Advertising Art crafts Intangible heritage
+ e.g.
Natural heritageCraft in general
Tourism
Source: Project Essnet Culture, final report, October 2011
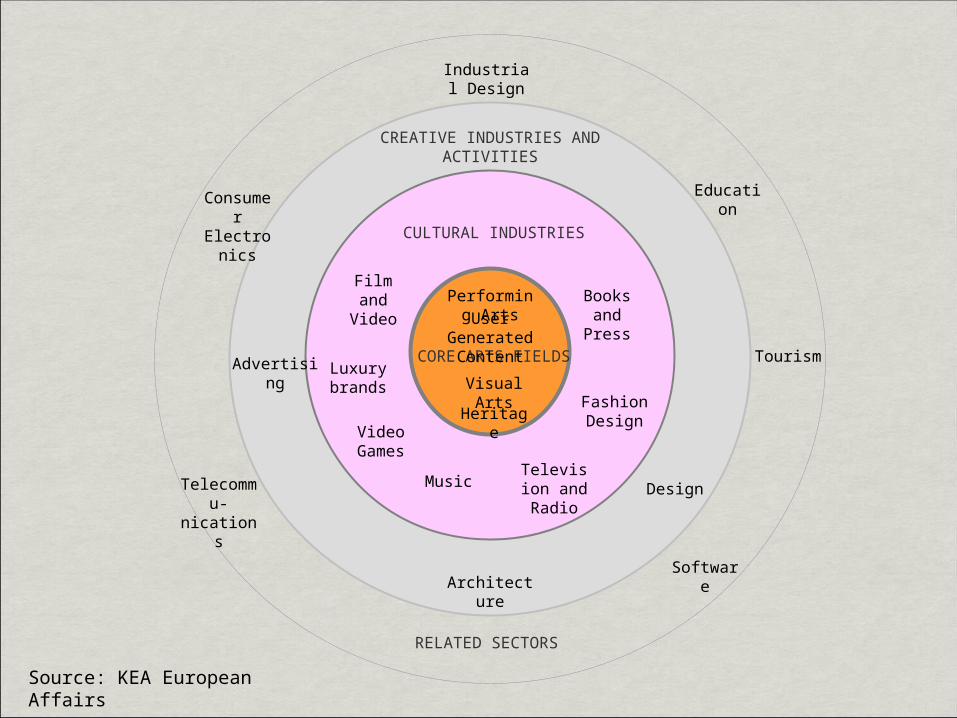
CORE ARTS FIELDS
CULTURAL INDUSTRIES
CREATIVE INDUSTRIES AND ACTIVITIES
RELATED SECTORS
Visual Arts
Heritage
Performing Arts Books and Press
Television and RadioMusic
Video Games
Film and Video
Advertising
Architecture
Design
Consumer Electronics
Telecommu-nications
Industrial Design
Software
Tourism
Education
Fashion Design
User Generated Content
Luxury brands
Source: KEA European Affairs

In Europe, culture is a field financed by public authorities only in part. Therefore, it is extremely important to supplement public funding with private one.
Donations and sponsorship Households expenditure Cultural and creative industries Non-profit sector
Private sector
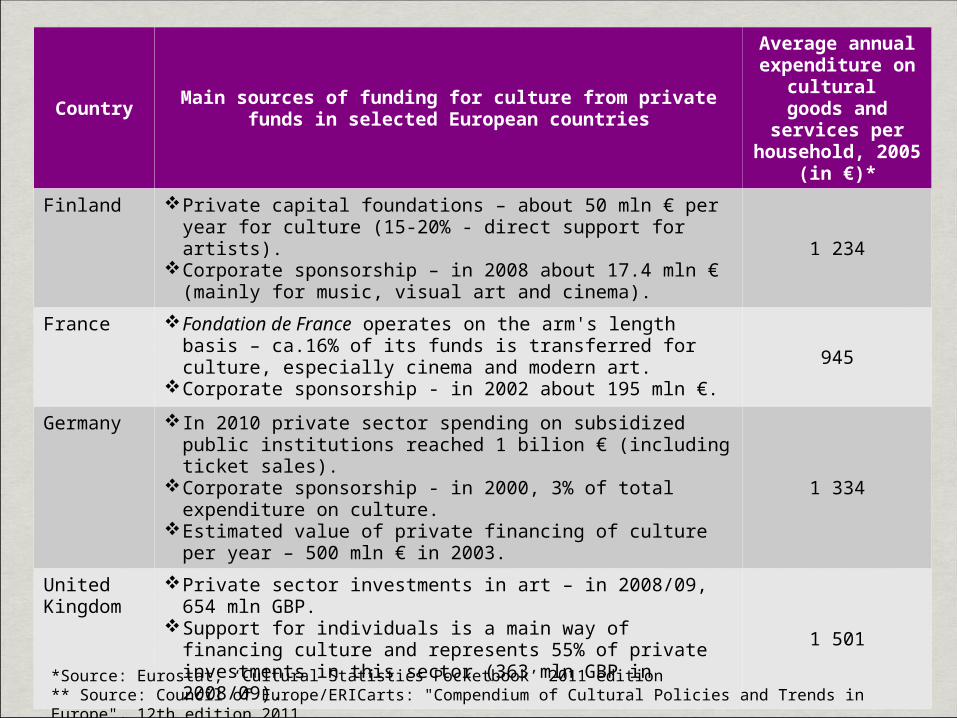
Country Main sources of funding for culture from private funds in selected European countries
Average annual expenditure on
cultural goods and
services per household, 2005 (in €)*
Finland Private capital foundations – about 50 mln € per year for culture (15-20% - direct support for artists).
Corporate sponsorship – in 2008 about 17.4 mln € (mainly for music, visual art and cinema).
1 234
France Fondation de France operates on the arm's length basis – ca.16% of its funds is transferred for culture, especially cinema and modern art.
Corporate sponsorship - in 2002 about 195 mln €.945
Germany In 2010 private sector spending on subsidized public institutions reached 1 bilion € (including ticket sales).
Corporate sponsorship - in 2000, 3% of total expenditure on culture.
Estimated value of private financing of culture per year – 500 mln € in 2003.
1 334
United Kingdom
Private sector investments in art – in 2008/09, 654 mln GBP.
Support for individuals is a main way of financing culture and represents 55% of private investments in this sector (363 mln GBP in 2008/09).
1 501
*Source: Eurostat, ‘Cultural Statistics Pocketbook’ 2011 edition** Source: Council of Europe/ERICarts: "Compendium of Cultural Policies and Trends in Europe", 12th edition 2011
2 240 bilion $ - the value of global creative economy in 2000 by John Howkins
6 100 bilion $ - the value of global creative economy in 2020 according to the prognosis of J.Howkins
654 bilion € - the sales of cultural and creative sector in EU countries in 2003 by KEA report ‘The Economy of Culture in Europe’ (2006)
2.6% - the added value to the EU GDP
19.7% - increase of added value of the creative sector in 1999-2003 (more than overall economy growth)
Different countries provide research on the economic value of creative sector, however due to differences in definitions used, the results are often incomparable.
Cultural and creative industries

Creative Partnerships / Public-Private Partnerships / CSR
Krystyna Janda Foundation for CulturePrivate theatre operating as a foundation1.3 mln € from public funds in 2005-2010 (municipal grants - about 4% of income)300 performances per year2 theatres (260 and 450 seats)20 full-time employees260 000 viewers per year
17 public theatres in Warsaw get ca. 22 mln € from public subsidies. 12 private theatres in Warsaw get 2.2 mln €.
Deutsche Bank Polska „Views” - competition for young Polish artists organised in cooperation with Zachęta National Gallery of Art
Media Cluster in Łódź Over 50 engaged entities and over
20 projects in various fields Investment value estimated at
150-200 Aim: creation of 25 000 new jobs
by 2010 and 40 000 by the end of 2015