doping options for high-efficiency c-si solar cells...1000 wafers back-to-back loading per tube...
TRANSCRIPT

Doping options for high-efficiency c-Si solar cells
July 18, 2015
Doping options for high-efficiency c-Si solar cells
July 18, 2015
Solar | Semiconductor | LED
James Hwang
VP, Technology
Amtech Systems, Inc.
Contact email: [email protected]
1

Contents
• Overview of Amtech Group
• Global electricity generation capacity & mix
• Global PV market
• Doping technology options
� N+ emitter for p-type cells
� P+ emitter for ntype cells
� Full ion implant option for n-type cells
2

Amtech Group Overview
3
BTU in Boston and SolayTec in Netherlands recently joined Amtech Group:
• BTU – inline furnaces (firing, diffusion..), reflow furnaces (PCB board, packaging..)
• SolayTec – Spatial ALD for Al₂O₃ passivation
� Founded in 1981 by JS Whang
� Headquartered in Tempe, Arizona, USA
� Employees (world-wide): ~430
� Public since 1983 (NASDAQ: ASYS)
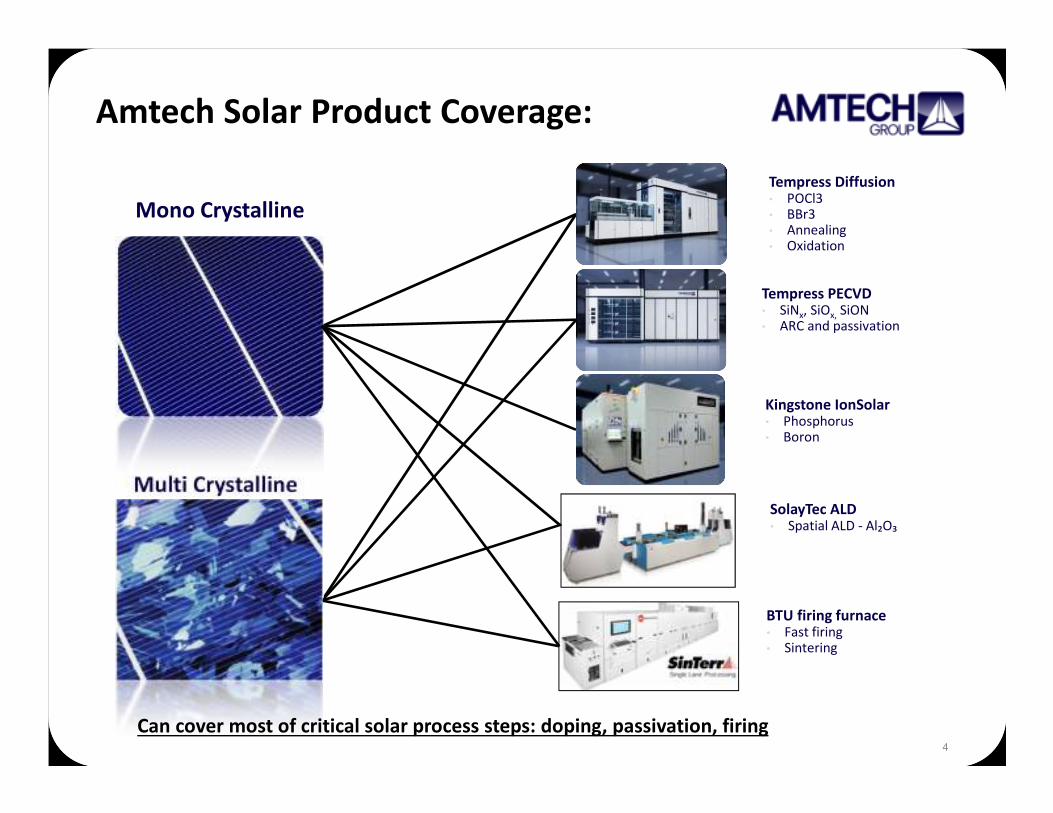
Amtech Solar Product Coverage:
4
Tempress PECVD• SiNx, SiOx, SiON• ARC and passivation
Kingstone IonSolar• Phosphorus• Boron
Tempress Diffusion• POCl3• BBr3• Annealing• Oxidation
Multi Crystalline
Mono Crystalline
SolayTec ALD• Spatial ALD - Al₂O₃
BTU firing furnace• Fast firing• Sintering
Can cover most of critical solar process steps: doping, passivation, firing

Global Electricity Generation Capacity
• 2014 total electricity capacity: 6 TW
(China 1.36 TW; EU 1.15 TW; USA 1.1 TW; India 0.31 TW; Japan 0.3 TW)
• Annual PV capacity add continues to increase from 20% in 2014
while other renewable add predicted relatively constant at about
30% (hydro 15%, wind 16%)
40%
24%
17%
6%
3%6%
3% 1%
Global Electricity Generation Mix 2014 (total 6 TW)
Coal
NG
Hydro
Nuclear
Petroleum
Wind
Solar
Others

2014 Electricity Generation Mix for Key Countries
• China: Coal (70%) and Hydro (20%) * annual capacity increase of 93GW
(solar, wind, nuclear..)
• EU: Coal (25%), NG (21%), Hydro (15%), Nuclear (11%), renewable (24%)
*~120 nuclear plants (mostly in France)
• USA: Coal (39%), NG (27%), Hydro (6%), Nuclear (19%); 17 GW new add
(36% from PV) *~100 nuclear plants mostly in East Coast
• Japan: Coal (36%), NG (28%), Nuclear (15%), Renewables (16%) * ~50
nuclear plants
• India: Coal (72%); aggressive annual growth (19.5GW), surpassed Japan
from 2014

Global Cumulative Solar PV Installation
• 2014E : World 185GW (EU 89GW, Germany 35GW, China 27GW, Japan 23GW, USA
18GW,...),
~3% of total global electricity capacity (~6TW)
• Forecast 1 TW (1,000 GW) installation around 2023 – 13% by solar PV !
Close to current total power generation capacity of USA
Source: IEA 2014
Source: NPD Solarbuzz 2013
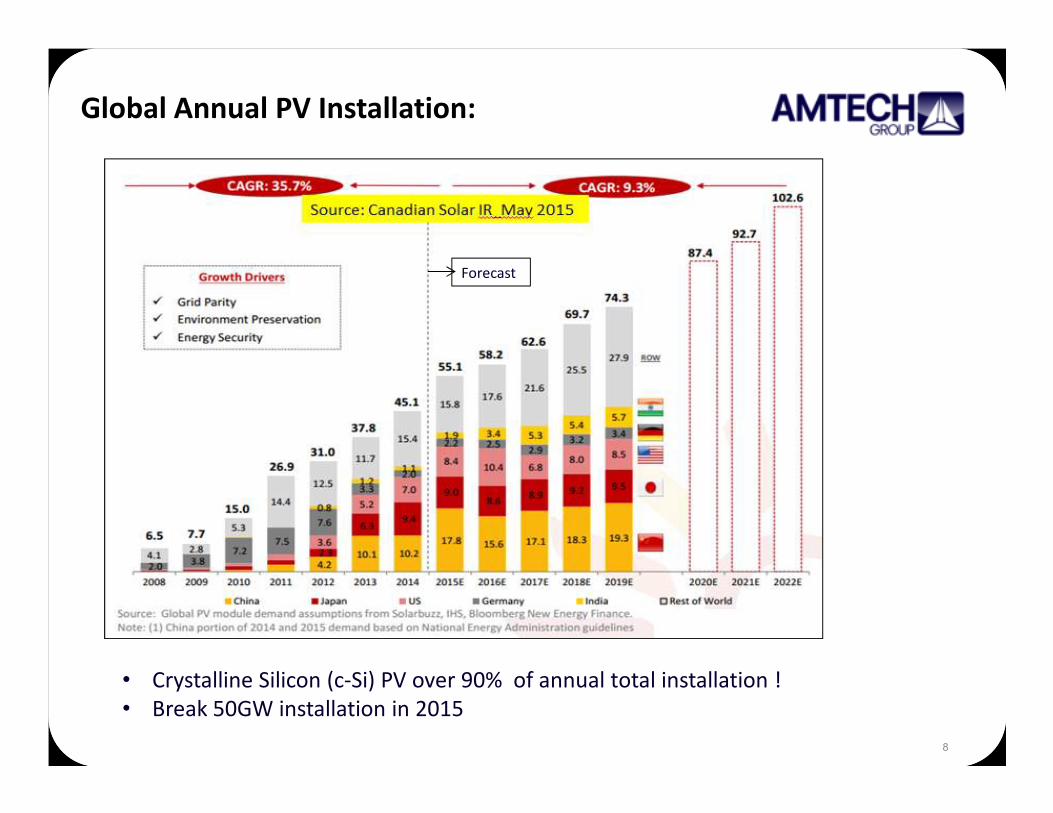
Global Annual PV Installation:
8
Forecast
• Crystalline Silicon (c-Si) PV over 90% of annual total installation !
• Break 50GW installation in 2015

PV Module Cost & Price Trend
• Actual @ Q4’14: Jinko $0.45/W; CSI
$0.49/W; Trina - $0.52/W
(First Solar CdTe TF $0.56/W @ 2013E)
• Thin-film: no longer cost advantage!
• Learning curve: Average module price
decreases at a learning rate (LR) for
every doubling of cum. PV module
shipments:
• $0.42/Wp @500GW cum (2018)
• $0.32/Wp @1TW cum (2023)
Tier-1 Chinese Manufacturers
Source: GTM, Feb. 2013
Cost forecast
Learning curve - Solar Moore’s Law

Levelized Cost of Energy (LCOE):
• Solar insolation or energy yield (kWh/kWp):� Arizona, California ~ 2000
� Europe ~ 900
• Solar PV already surpassed grid parity in some US States of high electricity
price such as California, New Jersey, New York, etc. and will in most of States
in USA by 2017
• LOCE = total cost /total
energy generation (for
lifetime)

Expected market share of c-Si wafer types
• Multi (std. multi & HP-multi ):
� Dominates today with >60%
� HP-multi replaces std. multi
� Share will reduce gradually
• Mono (p-mono & n-mono):
� Mono market share is increasing as a
result of rapid increase in n-mono
� P-mono share decreases

Expected market share of c-Si cell technologies
• Double-side contact still dominating over single-side contact:
• PERC will gain significant market share over BSF
• All cells except for SHJ require doping for emitter or surface field:
SHJ

Expected cell efficiency and module power trend
60-cell module power
Cell efficiency
SHJ

Doping Technologies in Production
• N+ emitter (phos) in p-type cells:
� POCl3 diffusion: pre-dominant for standard multi, HP-multi and p-
mono (over 70% market share of c-Si )
� Phosphorus ion implant to take advantages associated with single-side
doping : currently ~ 200MW for p-mono (Suniva and Shinsung)
• P+ emitter (boron) in n-type cells:
� APCVD solid source & drive-in for IBC cells (SunPower >1GW),
� BBr3 for bifacial n-PERT (Yingli, MSE ~ 400MW),
� Ion implant & damage anneal for bifacial n-PERT (LG ~ 300MW)

POCl3 Diffusion
• AP(atmospheric pressure) HD (high-density) POCl3:
� 5 stack tube furnace
� 1000 wafers back-to-back loading per tube (2.38mm pitch)
� Throughput: ~3200 wafers per hour
� CoO: ~ 1.8 ct/wafer
� Better control of surface doping density => better short-wavelength
response
• LP (low-pressure) POCl3 :
� 5 stack tube furnace
� 1000 wafers back-to-back loading per tube (2.38mm pitch)
� Throughput: ~3400 wafers per hour (shorter process time)
� CoO: ~ 1.9 ct/wafer (due to higher Capex and Opex)
� High surface doping density => degradation in short wavelength quantum
efficiency

Boron Doping for P+ Emitter in N-type Cells
• Diffusion:
• AP-BBr₃ - in production
• LP-BBr3 – not production-proven
yet
• Lowest CoO due to simultaneous
dopant deposition and diffusion
• Solid source deposition & drive-in :
• APCVD solid source & drive-in –
volume production for IBC cells by
SunPower
• Ion implant & anneal:
• Pure boron implant by beamline
with mass analysis (MA) & high-
temperature (1050°C) long-time
damage anneal (highest CoO)

Technical challenges for boron implant
• Ion-shower type boron molecular
ion implant (BF3, B₂F4. B2H6,
B10H14..) with no mass analysis is a
trend for a high throughput.
• Clean surface region by solid phase
epitaxy (SPE) regrowth during post-
implant anneal, but defective end-
of-range (EOR) region.
• Challenging part - annealing of EOR
extended defects which requires a
novel anneal method of high-
temperature but short time (within
an hour) – fast heating and cooling

Full implant (B & P) option for n-type cell
• Full Implant (B & P)+ Single Anneal can be cost-competitive to
two diffusion steps (BBr3 + POCl3 ), if the followings are met:
� High-throughput boron and phosphorus implants (>3000 wafers per hour)
� High-throughput boron implant anneal with fast heating and cooling
capability (≥ 25°C/sec or 1,500°C/min) (1000 °C or higher but 1 hour or
shorter)
• Status:
� Ion-shower type of high-
throughput implanters available
(Applied, Kingstone, Intevac)
� High-throughput, high-
temperature, fast anneal
method not available, yet –
novel advanced anneal concept
required!

Thank You for your attention!!
19