doosan corporation andsubsidiaries as of · pdf filedoosan shanghai chemical materials co.,...
TRANSCRIPT

DOOSAN CORPORATION AND SUBSIDIARIES NOTES TO CONSOLIDATED FINANCIAL STATEMENTS
AS OF AND FOR THE YEARS ENDED DECEMBER 31, 2015 AND 2014
1. ORGANIZATION AND DESCRIPTION OF THE BUSINESS:
(1) The Parent company
Doosan Corporation (the Parent ) was incorporated on December 18, 1933, under the name of Sohwa-Kirin Beer, Ltd. to manufacture and sell beer. The Parent has changed its name to Dongyang Beer, Ltd. in February 1948 to OB Beer, Ltd. in February 1996 and to Doosan Corporation on September 1, 1998.
Since June 1973, the Parent s stocks have been listed on the Korea. After several capital issues, the Parent s capital stock as of December 31, 2015, is 134,838 million, including 26,984 million of preferred share.
The Parent s common shares as of December 31, 2015, are owned as follows:
Number of common shares owned Ownership percentage (%)
Related parties 9,369,395 44.05Treasury stock 5,977,528 28.10Others 5,923,965 27.85
Total 21,270,888 100.00
Meanwhile, 48.3% of preferred shares are owned by the largest shareholders and others and 51.7% of preferred stocks are owned by others.

(2) Consolidated subsidiaries
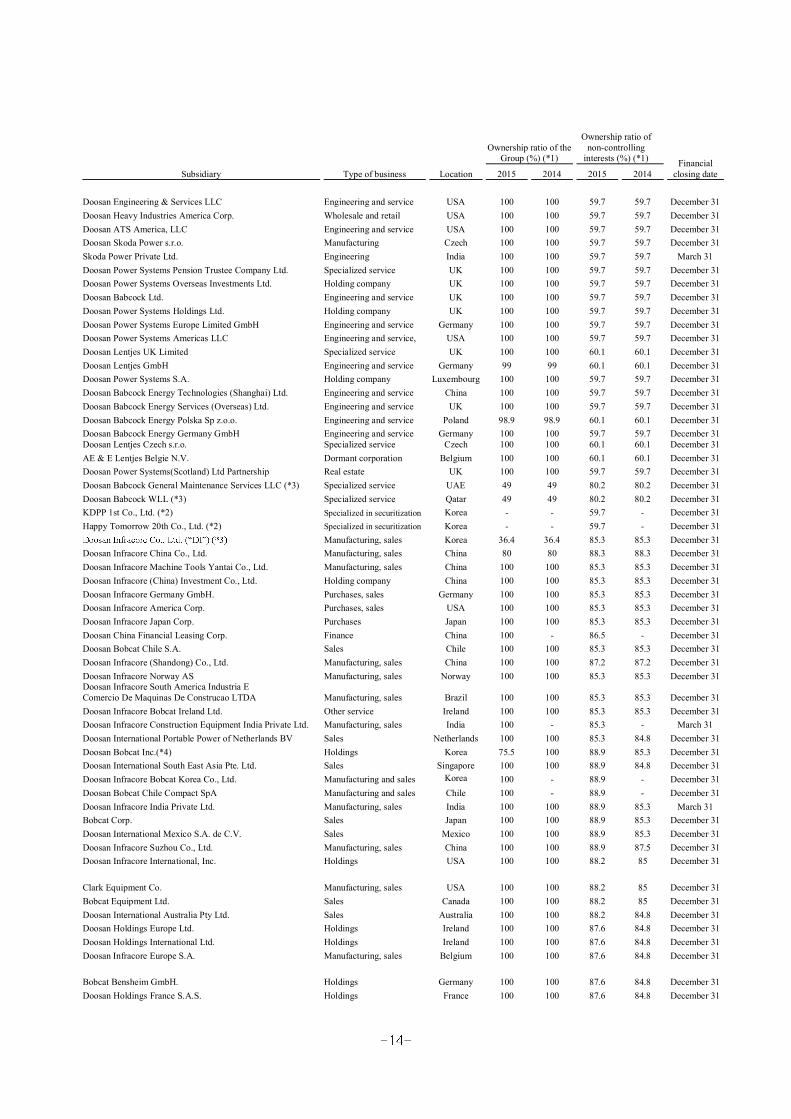
1) The details of consolidated subsidiaries as of December 31, 2015 and 2014, are as follows:
Ownership ratio of the Group (%) (*1)
Ownership ratio of non-controlling
interests (%) (*1) Financial closing dateSubsidiary Type of business Location 2015 2014 2015 2014
Oricom Inc. Advertising Korea 66.9 69.7 33.1 30.3 December 31Doosan Advertising (Beijing) Co., Ltd. Advertising China 100 100 33.1 30.3 December 31Han Comm. Inc. Advertising Korea 100 - 33.1 -Doosan Bears, Inc. Sports Korea 100 100 33.1 - December 31Doosan Feed & Livestock Co., Ltd. Manufacturing and sales Korea 100 100 - - December 31Doosan Tower Co., Ltd. Real estate Korea 100 100 - - December 31Doosan Electro-Materials Singapore Pte Ltd. Wholesale and retail Singapore 100 100 - - December 31Doosan Hongkong Ltd. Wholesale and retail China 100 100 - - December 31Doosan Electro-Materials (Shen Zhen) Limited. Wholesale and retail China 100 100 - - December 31Doosan Shanghai Chemical Materials Co., Ltd. Wholesale and retail China 100 100 - - December 31Doosan Electro-Materials (Changshu) Co., Ltd. Manufacturing China 100 100 - - December 31Doosan Electro-Materials America, LLC Marketing USA 100 100 - - December 31Doosan Real Estate Securitization Specialty Ltd. (*2) Specialized in securitization Korea - - - - December 31Doosan Second Real Estate Securitization Specialty Ltd. (*2) Specialized in securitization Korea 2 2 - - December 31Doosan Information and Communications America, LLC IT service USA 100 100 - - December 31Doosan Information and Communications China, Co., Ltd. IT service China 100 100 - - December 31Doosan Information and Communications Europe Ltd. IT service UK 100 100 - - December 31Doosan Mottrol (Jiangyin) Co., Ltd. Manufacturing China 100 100 - - December 31DIP Holdings Co., Ltd. Holding company Korea 100 100 - - December 31
Defense Korea 50.9 50.9 49.1 49.1 December 31DRA Inc. Software development Korea 100 - - - December 31Doosan Industrial Vehicle Europe N.A. Wholesale and retail Belgium 100 100 - - December 31Doosan Industrial Vehicle U.K. Ltd. Wholesale and retail UK 100 100 - - December 31Doosan Logistics Europe GmbH Manufacturing Germany 100 100 - - December 31Doosan Industrial Vehicle America Corp. Wholesale and retail USA 100 100 - - December 31Doosan Industrial Vehicle Yantai Co., Ltd. Manufacturing China 100 100 - - December 31Genesis Forklift Trucks Limited Wholesale and retail UK 100 100 - - December 31Rushlift Holdings Ltd. Holding company UK 100 - - - December 31Doosan Materials Handling UK Ltd. Holding company UK 100 - - - December 31Rushlift Ltd. Wholesale, retail and lease UK 100 - - - December 31Doosan Fuel Cell America, Inc. Manufacturing USA 100 100 - - December 31Doosan Electro-Materials Luxembourg Sarl Holding company Luxembourg 100 100 - - December 31Circuit Foil Luxembourg Sarl Manufacturing Luxembourg 100 100 - - December 31Circuit Foil Asia Pacific (Hong Kong) Wholesale and retail Hong Kong 100 100 - - December 31Circuit Foil Asia Pacific (Zhangjiagang) Manufacturing China 100 100 - - December 31Circuit Foil Trading Inc. Wholesale and retail USA 100 100 - - December 31
Doosan Heavy Industries & Construction Co., Ltd. Other engine and turbine manufacture Korea 40.3 40.3 59.7 59.7 December 31
Doosan Asset Management Company Co., Ltd. Real estate development Korea 100 100 59.7 59.7 December 31
Doosan Heavy Industries Vietnam Co., Ltd. Other engine and turbine manufacture Vietnam 100 100 61.7 61.3 December 31
HF Controls Corp. Manufacturing USA 100 100 59.7 59.7 December 31Doosan HF Controls Asia Co., Ltd. Manufacturing Korea 100 - 59.7 - December 31PT. Doosan Heavy Industries Indonesia Manufacturing Indonesia 55 55 77.8 77.8 December 31Doosan Heavy Industries Japan Corp. Wholesale and retail Japan 100 100 59.7 59.7 December 31S.C. Doosan IMGB S.A. Manufacturing Romania 99.9 99.9 59.8 59.8 December 31Doosan Enpure Ltd. Engineering and service UK 100 100 59.7 59.7 December 31Doosan Construction Site Solution Vietnam Company Limited Equipment rental Korea 100 100 59.7 59.7 December 31Doosan Power Systems India Private Ltd. Engineering and service India 100 100 59.7 59.7 March 31Doosan Heavy Industries Muscat LLC. Manufacturing Oman 70 - 71.8 - December 31Doosan Power Systems Arabia Manufacturing Saudi Arabia 51 - 79.4 - December 31Doosan Heavy Industries America Holdings Inc. Holding company USA 100 100 59.7 59.7 December 31Doosan Hydro Technology Inc. Manufacturing USA 100 100 59.7 59.7 December 31
Ownership ratio of the Group (%) (*1)
Ownership ratio of non-controlling
interests (%) (*1) Financial closing dateSubsidiary Type of business Location 2015 2014 2015 2014
Doosan Engineering & Services LLC Engineering and service USA 100 100 59.7 59.7 December 31Doosan Heavy Industries America Corp. Wholesale and retail USA 100 100 59.7 59.7 December 31Doosan ATS America, LLC Engineering and service USA 100 100 59.7 59.7 December 31Doosan Skoda Power s.r.o. Manufacturing Czech 100 100 59.7 59.7 December 31Skoda Power Private Ltd. Engineering India 100 100 59.7 59.7 March 31Doosan Power Systems Pension Trustee Company Ltd. Specialized service UK 100 100 59.7 59.7 December 31Doosan Power Systems Overseas Investments Ltd. Holding company UK 100 100 59.7 59.7 December 31Doosan Babcock Ltd. Engineering and service UK 100 100 59.7 59.7 December 31Doosan Power Systems Holdings Ltd. Holding company UK 100 100 59.7 59.7 December 31Doosan Power Systems Europe Limited GmbH Engineering and service Germany 100 100 59.7 59.7 December 31Doosan Power Systems Americas LLC Engineering and service, USA 100 100 59.7 59.7 December 31Doosan Lentjes UK Limited Specialized service UK 100 100 60.1 60.1 December 31Doosan Lentjes GmbH Engineering and service Germany 99 99 60.1 60.1 December 31Doosan Power Systems S.A. Holding company Luxembourg 100 100 59.7 59.7 December 31Doosan Babcock Energy Technologies (Shanghai) Ltd. Engineering and service China 100 100 59.7 59.7 December 31Doosan Babcock Energy Services (Overseas) Ltd. Engineering and service UK 100 100 59.7 59.7 December 31Doosan Babcock Energy Polska Sp z.o.o. Engineering and service Poland 98.9 98.9 60.1 60.1 December 31Doosan Babcock Energy Germany GmbH Engineering and service Germany 100 100 59.7 59.7 December 31Doosan Lentjes Czech s.r.o. Specialized service Czech 100 100 60.1 60.1 December 31AE & E Lentjes Belgie N.V. Dormant corporation Belgium 100 100 60.1 60.1 December 31Doosan Power Systems(Scotland) Ltd Partnership Real estate UK 100 100 59.7 59.7 December 31Doosan Babcock General Maintenance Services LLC (*3) Specialized service UAE 49 49 80.2 80.2 December 31Doosan Babcock WLL (*3) Specialized service Qatar 49 49 80.2 80.2 December 31KDPP 1st Co., Ltd. (*2) Specialized in securitization Korea - - 59.7 - December 31Happy Tomorrow 20th Co., Ltd. (*2) Specialized in securitization Korea - - 59.7 - December 31
Manufacturing, sales Korea 36.4 36.4 85.3 85.3 December 31Doosan Infracore China Co., Ltd. Manufacturing, sales China 80 80 88.3 88.3 December 31Doosan Infracore Machine Tools Yantai Co., Ltd. Manufacturing, sales China 100 100 85.3 85.3 December 31Doosan Infracore (China) Investment Co., Ltd. Holding company China 100 100 85.3 85.3 December 31Doosan Infracore Germany GmbH. Purchases, sales Germany 100 100 85.3 85.3 December 31Doosan Infracore America Corp. Purchases, sales USA 100 100 85.3 85.3 December 31Doosan Infracore Japan Corp. Purchases Japan 100 100 85.3 85.3 December 31Doosan China Financial Leasing Corp. Finance China 100 - 86.5 - December 31Doosan Bobcat Chile S.A. Sales Chile 100 100 85.3 85.3 December 31Doosan Infracore (Shandong) Co., Ltd. Manufacturing, sales China 100 100 87.2 87.2 December 31Doosan Infracore Norway AS Manufacturing, sales Norway 100 100 85.3 85.3 December 31Doosan Infracore South America Industria E Comercio De Maquinas De Construcao LTDA Manufacturing, sales Brazil 100 100 85.3 85.3 December 31Doosan Infracore Bobcat Ireland Ltd. Other service Ireland 100 100 85.3 85.3 December 31Doosan Infracore Construction Equipment India Private Ltd. Manufacturing, sales India 100 - 85.3 - March 31Doosan International Portable Power of Netherlands BV Sales Netherlands 100 100 85.3 84.8 December 31Doosan Bobcat Inc.(*4) Holdings Korea 75.5 100 88.9 85.3 December 31Doosan International South East Asia Pte. Ltd. Sales Singapore 100 100 88.9 84.8 December 31Doosan Infracore Bobcat Korea Co., Ltd. Manufacturing and sales Korea 100 - 88.9 - December 31Doosan Bobcat Chile Compact SpA Manufacturing and sales Chile 100 - 88.9 - December 31Doosan Infracore India Private Ltd. Manufacturing, sales India 100 100 88.9 85.3 March 31Bobcat Corp. Sales Japan 100 100 88.9 85.3 December 31Doosan International Mexico S.A. de C.V. Sales Mexico 100 100 88.9 85.3 December 31Doosan Infracore Suzhou Co., Ltd. Manufacturing, sales China 100 100 88.9 87.5 December 31Doosan Infracore International, Inc. Holdings USA 100 100 88.2 85 December 31
Clark Equipment Co. Manufacturing, sales USA 100 100 88.2 85 December 31Bobcat Equipment Ltd. Sales Canada 100 100 88.2 85 December 31Doosan International Australia Pty Ltd. Sales Australia 100 100 88.2 84.8 December 31Doosan Holdings Europe Ltd. Holdings Ireland 100 100 87.6 84.8 December 31Doosan Holdings International Ltd. Holdings Ireland 100 100 87.6 84.8 December 31Doosan Infracore Europe S.A. Manufacturing, sales Belgium 100 100 87.6 84.8 December 31
Bobcat Bensheim GmbH. Holdings Germany 100 100 87.6 84.8 December 31Doosan Holdings France S.A.S. Holdings France 100 100 87.6 84.8 December 31
Ownership ratio of the Group (%) (*1)
Ownership ratio of non-controlling
interests (%) (*1) Financial closing dateSubsidiary Type of business Location 2015 2014 2015 2014
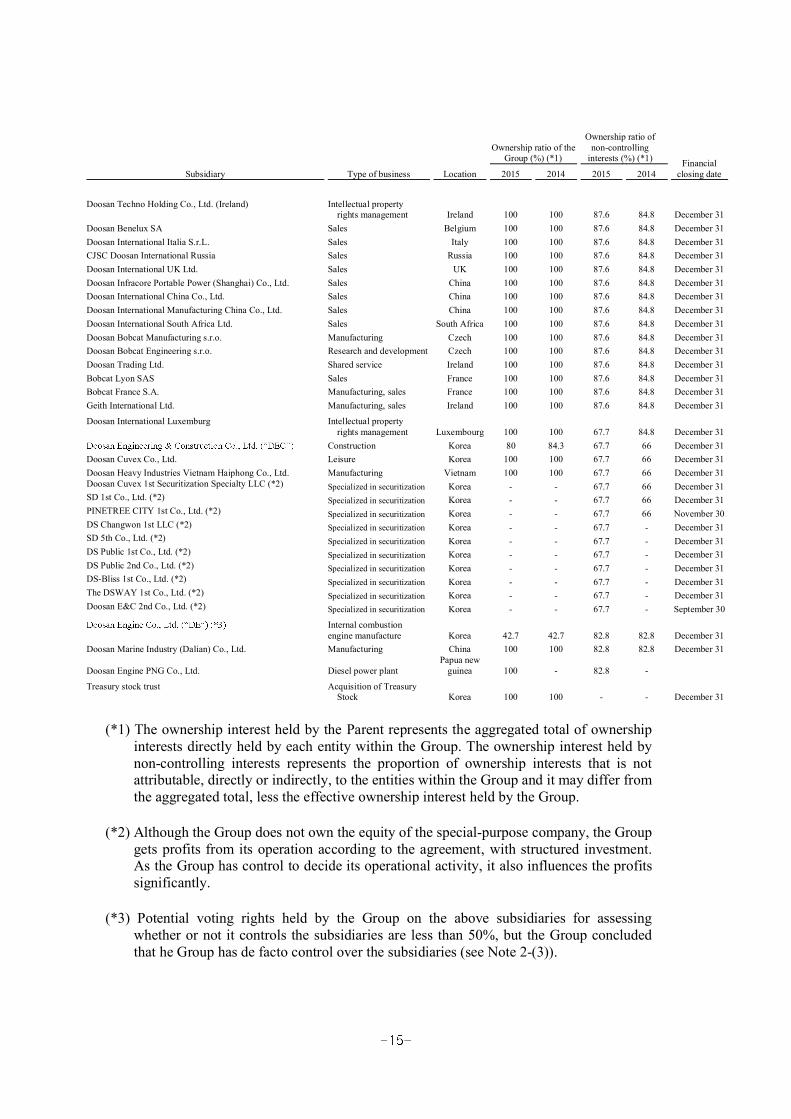
Doosan Techno Holding Co., Ltd. (Ireland) Intellectual property rights management Ireland 100 100 87.6 84.8 December 31
Doosan Benelux SA Sales Belgium 100 100 87.6 84.8 December 31Doosan International Italia S.r.L. Sales Italy 100 100 87.6 84.8 December 31CJSC Doosan International Russia Sales Russia 100 100 87.6 84.8 December 31Doosan International UK Ltd. Sales UK 100 100 87.6 84.8 December 31Doosan Infracore Portable Power (Shanghai) Co., Ltd. Sales China 100 100 87.6 84.8 December 31Doosan International China Co., Ltd. Sales China 100 100 87.6 84.8 December 31Doosan International Manufacturing China Co., Ltd. Sales China 100 100 87.6 84.8 December 31Doosan International South Africa Ltd. Sales South Africa 100 100 87.6 84.8 December 31Doosan Bobcat Manufacturing s.r.o. Manufacturing Czech 100 100 87.6 84.8 December 31Doosan Bobcat Engineering s.r.o. Research and development Czech 100 100 87.6 84.8 December 31Doosan Trading Ltd. Shared service Ireland 100 100 87.6 84.8 December 31Bobcat Lyon SAS Sales France 100 100 87.6 84.8 December 31Bobcat France S.A. Manufacturing, sales France 100 100 87.6 84.8 December 31Geith International Ltd. Manufacturing, sales Ireland 100 100 87.6 84.8 December 31
Doosan International Luxemburg Intellectual property rights management Luxembourg 100 100 67.7 84.8 December 31
Construction Korea 80 84.3 67.7 66 December 31Doosan Cuvex Co., Ltd. Leisure Korea 100 100 67.7 66 December 31Doosan Heavy Industries Vietnam Haiphong Co., Ltd. Manufacturing Vietnam 100 100 67.7 66 December 31Doosan Cuvex 1st Securitization Specialty LLC (*2) Specialized in securitization Korea - - 67.7 66 December 31SD 1st Co., Ltd. (*2) Specialized in securitization Korea - - 67.7 66 December 31PINETREE CITY 1st Co., Ltd. (*2) Specialized in securitization Korea - - 67.7 66 November 30DS Changwon 1st LLC (*2) Specialized in securitization Korea - - 67.7 - December 31SD 5th Co., Ltd. (*2) Specialized in securitization Korea - - 67.7 - December 31DS Public 1st Co., Ltd. (*2) Specialized in securitization Korea - - 67.7 - December 31DS Public 2nd Co., Ltd. (*2) Specialized in securitization Korea - - 67.7 - December 31DS-Bliss 1st Co., Ltd. (*2) Specialized in securitization Korea - - 67.7 - December 31The DSWAY 1st Co., Ltd. (*2) Specialized in securitization Korea - - 67.7 - December 31Doosan E&C 2nd Co., Ltd. (*2) Specialized in securitization Korea - - 67.7 - September 30
Internal combustion engine manufacture Korea 42.7 42.7 82.8 82.8 December 31
Doosan Marine Industry (Dalian) Co., Ltd. Manufacturing China 100 100 82.8 82.8 December 31
Doosan Engine PNG Co., Ltd. Diesel power plantPapua new
guinea 100 - 82.8 -
Treasury stock trust Acquisition of Treasury Stock Korea 100 100 - - December 31
(*1) The ownership interest held by the Parent represents the aggregated total of ownership interests directly held by each entity within the Group. The ownership interest held by non-controlling interests represents the proportion of ownership interests that is not attributable, directly or indirectly, to the entities within the Group and it may differ from the aggregated total, less the effective ownership interest held by the Group.
(*2) Although the Group does not own the equity of the special-purpose company, the Group gets profits from its operation according to the agreement, with structured investment. As the Group has control to decide its operational activity, it also influences the profits significantly.
(*3) Potential voting rights held by the Group on the above subsidiaries for assessing whether or not it controls the subsidiaries are less than 50%, but the Group concluded that he Group has de facto control over the subsidiaries (see Note 2-(3)).

(*4) For the year ended December 31, 2015, its name was changed from Doosan Infracore Bobcat Holdings Co., Ltd. to Doosan Bobcat Inc.
2) Changes in the scope of consolidation
Changes in the scope of consolidation for the year ended December 31, 2015, are as follows:
Subsidiary Change Description
Rushlift Holdings Ltd. Newly included Newly acquiredDoosan Materials Handling UK Ltd. Newly included Newly acquiredRushlift Ltd. Newly included Newly acquiredHancomm Inc. Newly included Newly acquiredDoosan China Financial Leasing Corp. Newly included Newly acquiredDRA Inc. Newly included Newly establishedDoosan HF Controls Asia Co., Ltd. Newly included Newly establishedDoosan Heavy Industries Muscat LLC Newly included Newly establishedDoosan Power Systems Arabia Newly included Newly establishedDoosan Infracore Bobcat Korea Co., Ltd. Newly included Newly establishedDoosan Infracore Construction Equipment India PrivateLtd.
Newly included Newly established
Doosan Bobcat Chile Compact SpA Newly included Newly establishedDoosan Engine PNG Co., Ltd. Newly included Newly establishedKDPP 1st Co., Ltd. Newly included Newly establishedHappy Tomorrow 20th Co., Ltd. Newly included Newly establishedDS Public 1st Co., Ltd. Newly included Newly establishedDS Public 2nd Co., Ltd. Newly included Newly establishedDS-Bliss 1st Co., Ltd. Newly included Newly establishedThe DSWAY 1st Co., Ltd. Newly included Newly establishedDoosan E&C 2nd Co., Ltd. Newly included Newly establishedDoosan Cuvex 1st Securitization Specialty LLC Newly included (*1)SD 1st Co., Ltd. Newly included (*1)PINETREE CITY 1st Co., Ltd. Newly included (*1)DS Changwon 1st LLC Newly included (*1)SD 5th Co., Ltd. Newly included (*1)Montabert Excluded Disposal of sharesDoosan Power Systems Czech Investment a.s. Excluded Liquidation
(*1) Special-2014 were included in consolidation in 2015. The Group assessed that the financial impact of their reclassification to consolidation was not material to the consolidated financial statements.

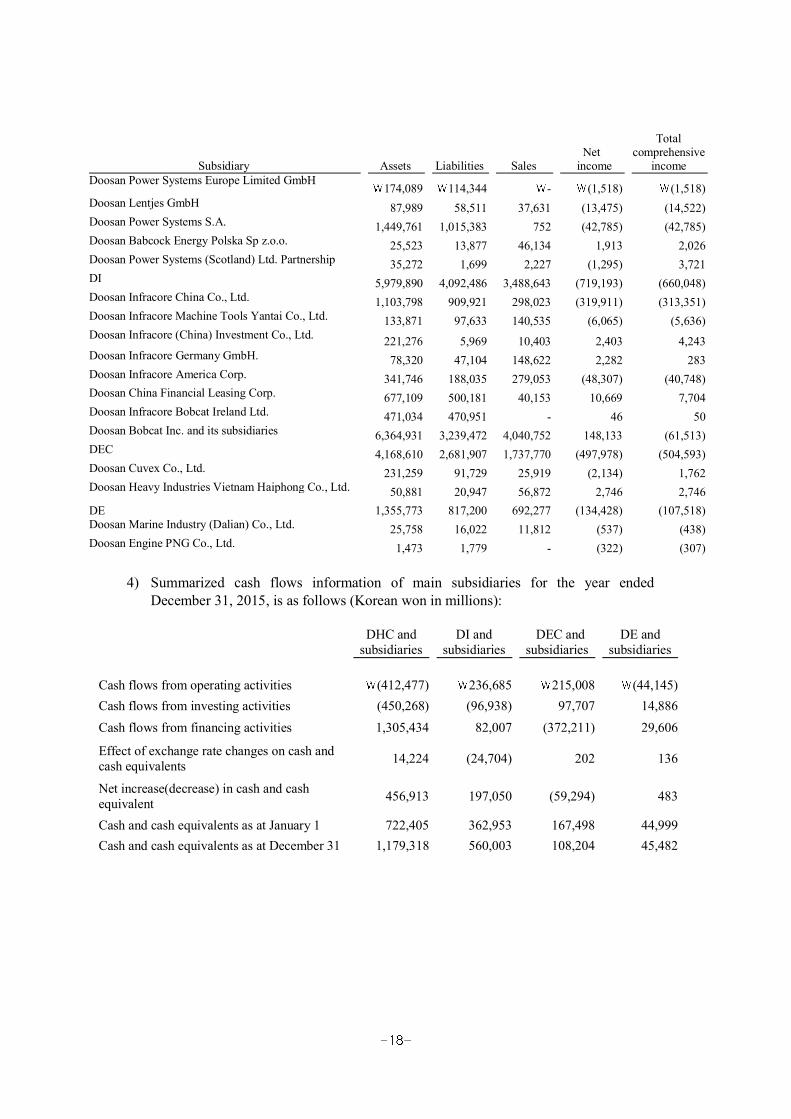
3) Condensed financial information of subsidiaries (or intermediate parent) as of and for the year ended December 31, 2015, is as follows (in millions of Korean won):
Subsidiary Assets Liabilities SalesNet
income
Total comprehensive
income
Oricom Inc. 151,763 88,744 96,004 2,682 3,580Hancomm Inc. 49,504 36,359 77,660 560 822Doosan Bears, Inc. 58,788 54,559 41,872 (7,352) (7,181)Doosan Feed & Livestock Co., Ltd. 83,481 53,346 91,378 (896) 3,082Doosan Tower Co., Ltd. 569,289 431,096 70,072 2,896 2,859DIP Holdings Co., Ltd. 548,094 150,323 17,818 15,229 156,721
829,508 421,566 693,211 33,780 45,721Doosan Electro-Materials (Changshu) Co., Ltd. 117,597 111,184 102,892 (678) (678)Doosan Mottrol (Jiangyin) Co., Ltd. 32,434 15,804 36,474 (7,855) (7,855)Doosan Industrial Vehicle Europe N.A. 34,899 19,940 52,931 796 796Doosan Industrial Vehicle U.K. Ltd. 74,509 72,921 33,515 (1,398) (1,398)Doosan Industrial Vehicle America Corp. 62,413 31,685 135,023 1,596 1,596Doosan Industrial Vehicle Yantai Co., Ltd. 35,167 25,778 38,297 (1,920) (1,920)Rushlift Ltd. 92,203 73,361 44,682 2,392 2,392Doosan Fuel Cell America, Inc. 226,029 181,659 146,993 2,451 2,451Doosan Electro-Materials Luxembourg Sarl 63,114 35,617 - (1,155) (1,155)Circuit Foil Luxembourg Sarl 99,144 42,218 106,630 6,376 5,812
DHC 11,685,624 7,211,633 5,146,294 (451,146) (181,138)
Doosan Heavy Industries Vietnam Co., Ltd. 423,325 355,464 229,133 (12,268) (12,268)HF Controls Corp. 22,597 8,550 15,505 561 561Doosan Heavy Industries Japan Corp. 30,932 28,221 2,985 220 220S.C. Doosan IMGB S.A. 154,640 119,357 86,543 (2,968) (2,968)Doosan Construction Site Solution Vietnam Company Limited 13,411 1,257 4,914 40 40
Doosan Power Systems India Private Ltd. 443,768 343,835 314,135 (32,650) (30,350)
Doosan Heavy Industries America Holdings Inc. 190,987 34,013 - 2,774 2,774
Doosan Hydro Technology Inc. 26,013 49,369 25,841 (1,143) (1,143)Doosan Heavy Industries America Corp. 22,383 14,293 3,711 (48,357) (48,357)Doosan Skoda Power s.r.o 613,181 204,361 346,015 59,345 67,018Doosan Power Systems Overseas Investments Ltd. 89,062 101,333 - (688) (688)Doosan Babcock Ltd. 1,771,316 932,823 791,372 (10,888) 4,007Doosan Power Systems Holdings Ltd. 154,308 - - 8,931 8,931
(Continued)
Subsidiary Assets Liabilities SalesNet
income
Total comprehensive
incomeDoosan Power Systems Europe Limited GmbH
174,089 114,344 - (1,518) (1,518)Doosan Lentjes GmbH 87,989 58,511 37,631 (13,475) (14,522)Doosan Power Systems S.A. 1,449,761 1,015,383 752 (42,785) (42,785)Doosan Babcock Energy Polska Sp z.o.o. 25,523 13,877 46,134 1,913 2,026Doosan Power Systems (Scotland) Ltd. Partnership 35,272 1,699 2,227 (1,295) 3,721DI 5,979,890 4,092,486 3,488,643 (719,193) (660,048)Doosan Infracore China Co., Ltd. 1,103,798 909,921 298,023 (319,911) (313,351)Doosan Infracore Machine Tools Yantai Co., Ltd. 133,871 97,633 140,535 (6,065) (5,636)Doosan Infracore (China) Investment Co., Ltd. 221,276 5,969 10,403 2,403 4,243Doosan Infracore Germany GmbH. 78,320 47,104 148,622 2,282 283Doosan Infracore America Corp. 341,746 188,035 279,053 (48,307) (40,748)Doosan China Financial Leasing Corp. 677,109 500,181 40,153 10,669 7,704Doosan Infracore Bobcat Ireland Ltd. 471,034 470,951 - 46 50Doosan Bobcat Inc. and its subsidiaries 6,364,931 3,239,472 4,040,752 148,133 (61,513)DEC 4,168,610 2,681,907 1,737,770 (497,978) (504,593)Doosan Cuvex Co., Ltd. 231,259 91,729 25,919 (2,134) 1,762Doosan Heavy Industries Vietnam Haiphong Co., Ltd. 50,881 20,947 56,872 2,746 2,746DE 1,355,773 817,200 692,277 (134,428) (107,518)Doosan Marine Industry (Dalian) Co., Ltd. 25,758 16,022 11,812 (537) (438)Doosan Engine PNG Co., Ltd. 1,473 1,779 - (322) (307)
4) Summarized cash flows information of main subsidiaries for the year ended December 31, 2015, is as follows (Korean won in millions):
DHC and subsidiaries
DI and subsidiaries
DEC and subsidiaries
DE and subsidiaries
Cash flows from operating activities (412,477) 236,685 215,008 (44,145)Cash flows from investing activities (450,268) (96,938) 97,707 14,886Cash flows from financing activities 1,305,434 82,007 (372,211) 29,606
Effect of exchange rate changes on cash and cash equivalents 14,224 (24,704) 202 136
Net increase(decrease) in cash and cash equivalent 456,913 197,050 (59,294) 483
Cash and cash equivalents as at January 1 722,405 362,953 167,498 44,999Cash and cash equivalents as at December 31 1,179,318 560,003 108,204 45,482
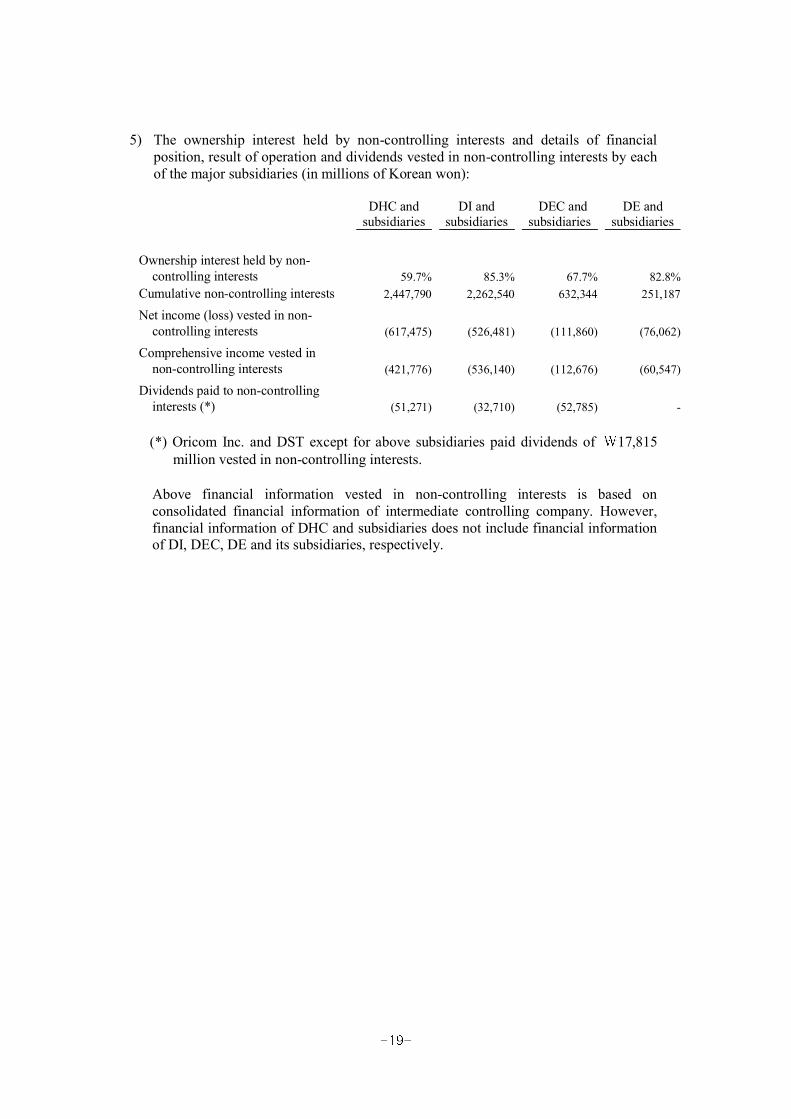
5) The ownership interest held by non-controlling interests and details of financial position, result of operation and dividends vested in non-controlling interests by each of the major subsidiaries (in millions of Korean won):
DHC and subsidiaries
DI and subsidiaries
DEC and subsidiaries
DE and subsidiaries
Ownership interest held by non-controlling interests 59.7% 85.3% 67.7% 82.8%
Cumulative non-controlling interests 2,447,790 2,262,540 632,344 251,187
Net income (loss) vested in non-controlling interests (617,475) (526,481) (111,860) (76,062)
Comprehensive income vested in non-controlling interests (421,776) (536,140) (112,676) (60,547)
Dividends paid to non-controlling interests (*) (51,271) (32,710) (52,785) -
(*) Oricom Inc. and DST except for above subsidiaries paid dividends of 17,815million vested in non-controlling interests.
Above financial information vested in non-controlling interests is based on consolidated financial information of intermediate controlling company. However, financial information of DHC and subsidiaries does not include financial information of DI, DEC, DE and its subsidiaries, respectively.

2. SUMMARY OF SIGNIFICANT ACCOUNTING POLICIES:
The Parent anKorean won and prepare consolidated financial statements in conformity with Korean
-in the Korean language (Hangul).
(1) Basis of preparation
The Group has prepared the consolidated financial statements in accordance with the K-IFRS.
The significant accounting policies under K-IFRS followed by the Group in the preparation of its consolidated financial statements are summarized below, and these accounting policies, except for the effects of the changes in accounting policies that are described below, have been applied consistently to the consolidated financial statements for the current period and the accompanying comparative period.
The accompanying consolidated financial statements have been prepared on the historical cost basis except for certain non-current assets and financial instruments that are measured at revalued amounts or fair values. Historical cost is generally based on the fair value of the consideration given.
The principal accounting policies are set out below.
1) Amendments to K-IFRS and new interpretations that are mandatorily effective for the current year
Amendments to K-IFRS 1019 Employee Benefits
The amendments permits the Group to recognize amount of contributions as a reduction in the service cost in which the related service is rendered if the amount of the contributions are independent of the number of years of service. The application
consolidated financial statements.
Annual Improvements to K-IFRS 2010-2012 Cycle
The amendments to K-
-IFRS 1103 Business Combinations clarify the classification and measurement of the contingent consideration in business combination. The amendments to K-IFRS 1108 clarify that a reconciliation of the
are regularly provided to the chief operating decision maker. The application of these

financial statements.
Annual Improvements to K-IFRS 2011-2013 Cycle
The amendments to K-IFRS 1103 clarify that it excludes the accounting for the formation of a joint arrangement in the financial statements of the joint arrangement itself from the scope of K-K- -IFRS 10exist. The application of these amendments has no significant impact on the
2) New and revised K-IFRS in issue but not yet effective
Amendments to K-IFRS 1001 Presentation of Financial Statements
The amendments to K-IFRS 1001 clarify the concept of applying materiality in practice and restrict an entity reducing the understandability of its financial statements by obscuring material information with immaterial information or by aggregating material items that have different natures or functions. The amendments to K-IFRS 1001 are effective for annual periods beginning on or after January 1, 2016.
Amendments to K-IFRS 1016 Property, Plant and Equipment
The amendments to K-IFRS 1016 prohibit the Group from using a revenue-based depreciation method for items of property, plant and equipment. The amendments are effective for the annual periods beginning on or after January 1, 2016.
Amendments to K-IFRS 1038 Intangible Assets
The amendments to K-IFRS 1038 do not allow presumption that revenue is an appropriate basis for the amortization of intangible assets, which the presumption can only be limited when the intangible asset expressed as a measure of revenue or when it can be demonstrated that revenue and consumption of the economic benefits of the intangible asset are highly correlated. The amendments apply prospectively for annual periods beginning on or after January 1, 2016.
Amendments to K-IFRS 1016 Property, plant and equipment & K-IFRS 1041 Agriculture: Bearer Plants
The amendments to K- -IFRS 1041
definition of a bearer plant to be accounted for as property, plant and equipment in accordance with K-IFRS 1016, instead of K-IFRS 1041. The amendments to K-IFRS 1016 and K-IFRS 1041 are effective for annual periods beginning on or
after January 1, 2016.
Amendments to K-IFRS 1110 Consolidated Financial Statements & K-IFRS 1112 Disclosure of interests in other entities & K-IFRS 1028 Investment in associates
The amendments clarify that in applying the equity method of accounting to an associate or a joint venture that is an investment entity, an investor may retain the fair value measurements that the associate or joint venture used for its subsidiaries. The amendments are effective for annual periods beginning on or after January 1, 2016.
Amendments to K-IFRS 1111 Accounting for Acquisitions of Interests in Joint Operations
The amendments to K-IFRS 1111 provide guidance on how to account for the acquisition of a joint operation that constitutes a business as defined in K-IFRS 1103 Business Combinations. A joint operator is also required to disclose the relevant information required by K-IFRS 1103 and other standards for business combinations. The amendments to K-IFRS 1111 are effective for the annual periods beginning on or after January 1, 2016.
Amendments to K-IFRS 1109 Financial Instruments
The amendments to K-IFRS 1109 contain the requirements for the classification and measurement of financial assets and financial liabilities based on a business model whose objective is achieved both by collecting contractual cash flows and selling financial assets and based on the contractual terms that give rise on specified dates to cash flows, impairment methodology based on the expected credit losses, broadened types of instruments that qualify as hedging instruments and the types of riskcomponents of non-financial items that are eligible for hedge accounting and the change of the hedge effectiveness test. The amendments are effective for annual periods beginning on or after January 1, 2018. The Group does not anticipate that the application of these new and revised K-IFRS that have been issued, but not effective,
Amendments to K-IFRS 1115 Revenue from Contracts with Customers
The core principle under K-IFRS 1115 is that an entity should recognize revenue to depict the transfer of promised goods or services to customers in an amount that reflects the consideration to which the entity expects to be entitled in exchange for those goods or services. The amendments introduce a five-step approach to revenue recognition and measurement: 1) Identify the contract with a customer, 2) Identify the performance obligations in the contract, 3) Determine the transaction price, 4) Allocate the transaction price to the performance obligations in the contract and 5) Recognize revenue when (or as) the entity satisfies a performance obligation. This

standard will supersede K-IFRS 1011 - Construction Contracts, K-IFRS 1018 - Revenue, K-IFRS 2113 - Customer Loyalty Programmes, K-IFRS 2115 - Agreements for the Construction of Real Estate, K-IFRS 2118 - Transfers of Assets from Customers and K-IFRS 2031 - Revenue-Barter Transactions Involving Advertising Services. The amendments are effective for annual periods beginning on or after January 1, 2018.
Annual Improvements to K-IFRS 2012-2014 Cycle
The Annual Improvements include amendments to a number of K-IFRS. The amendments introduce specific guidance in K-IFRS 1105 Non-current Assets Held for Sale and Discontinued Operations for when an entity reclassifies an asset (or disposal group) from held for sale to held for distribution to owners (or vice versa), such a change is considered as a continuation of the original plan of disposal not as a change to a plan of sale. Other amendments in the Annual Improvements include K-IFRS 1107 Financial Instruments: Disclosures, K-IFRS 1019 Employee Benefits, and K-IFRS 1034 Interim Financial Reporting.
The application of these amendments has no significant impact on the disclosure in the Gr
(2) Accounting Treatment related to the Emission Rights Cap and Trade Scheme
The Group classifies the emission rights as intangible assets. Emission right allowances the government allocated free of charge are measured at 0, and emission right allowances purchased are measured at cost, which the Group paid to purchase the allowances. If emission rights that the government allocated free of charge are sufficient to settle the emission right allowances allotted for vintage year, the emission liabilities are measured at 0. However, for the emission liabilities that exceed the allowances allocated free of charge, the shortfall is measured at the best estimate at the end of the reporting period.
(3) Basis of Consolidation
The consolidated financial statements incorporate the financial statements of the Company and entities (including structured entities) controlled by the Company (and its subsidiaries). Control is achieved where the Group 1) has the power over the investee, 2) is exposed, or has rights, to variable returns from its involvement with the investee and 3) has the ability to use its power to affect its returns. The Group reassesses whether or not it controls an investee if facts and circumstances indicate that there are changes to one or more of the three elements of controls listed above.
When the Group has less than a majority of the voting rights of an investee, it has power over the investee when the voting rights are sufficient to give it the practical ability to direct the relevant activities of the investee unilaterally. The Group considers all
an investee are sufficient to give it power, including:
the size of the Grouof holdings of the other vote holders
potential voting rights held by the Group, other vote holders or other parties rights arising from other contractual arrangements any additional facts and circumstances that indicate that the Group currently has,
or does not have, the ability to direct the relevant activities at the time that
meetings
Income and expenses of subsidiaries acquired or disposed of during the year are included in the consolidated statements of comprehensive income from the date the Group gains control until the date when the Company ceases to control the subsidiary. Profit or loss and each component of other comprehensive income are attributed to the owners of the Company and to the non-controlling interests. Total comprehensive income of subsidiaries is attributed to the owners of the Company and to the non-controlling interests even if this results in the non-controlling interests having a deficit balance.
When necessary, adjustments are made to the consolidated financial statements of
policies.
All intragroup transactions and related assets and liabilities, income and expenses are eliminated in full on consolidation.
Group losing control over the subsidiaries are accounted for as equity transactions. The -controlling interests are adjusted
to reflect the changes in their relative interests in the subsidiaries. Any difference between the amount by which the non-controlling interests are adjusted and the fair value of the consideration paid or received is recognized directly in equity and attributed to owners of the Company.
When the Group loses control of a subsidiary, a gain or loss on disposal is calculated as the difference between (i) the aggregate of the fair value of the consideration received and the fair value of any retained interest and (ii) the previous carrying amount of the assets (including goodwill) and liabilities of the subsidiary and any non-controlling interests. When assets of the subsidiary are carried at revalued amounts or fair values and the related cumulative gain or loss has been recognized in other comprehensive income and accumulated in equity, the amounts previously recognized in other comprehensive income and accumulated in equity are accounted for as if the Company had directly disposed of the relevant assets (i.e., reclassified to profit or loss or transferred directly to retained earnings). The fair value of any investment retained in the former subsidiary at the date when control is lost is recognized as the fair value on initial
recognition for subsequent accounting under K-IFRS 1039, Financial Instruments: Recognition and Measurement, or, when applicable, the cost on initial recognition of an investment in an associate or a joint venture.
(4) Business Combination
Acquisitions of businesses are accounted for using the acquisition method. The consideration transferred in a business combination is measured at fair value, which is calculated as the sum of the fair values of the assets transferred by the Group, liabilities incurred by the Group to the former owners of the acquiree and the equity interests issued by the Group in exchange for control of the acquiree. Acquisition-related costs are generally recognized in profit or loss as incurred.
At the acquisition date, the identifiable assets acquired and the liabilities assumed are recognized at their fair value at the acquisition date, except that:
Deferred tax assets or liabilities and liabilities or assets related to employee benefit arrangements are recognized and measured in accordance with K-IFRS 1012, Income Taxes, and K-IFRS 1019, respectively Liabilities or equity instruments related to share-based payment arrangements of the acquiree or share-based payment arrangements of the Group entered into to replace share-based payment arrangements of the acquiree are measured in accordance with K-IFRS 1102 at the acquisition date Assets (or disposal groups) that are classified as held for sale in accordance with K-IFRS 1105, Non-current Assets Held for Sale and Discontinued Operations, are measured in accordance with that standard
Goodwill is measured as the excess of the sum of a) the consideration transferred, b) the amount of any non-controlling interests in the acquiree and c) the fair value of the
acquisition-date amounts of the identifiable assets acquired and the liabilities assumed. If, after reassessment, the net of the acquisition-date amounts of the identifiable assets acquired and liabilities assumed exceeds the sum of a) the consideration transferred, b) the amount of any non-controlling interests in the acquiree and c) the fair value of the
usly held interest in the acquiree (if any), the excess is recognized immediately in profit or loss as a bargain purchase gain.
Non-controlling interests that are present ownership interests and entitle their holders to a proportionate share of the entitymeasured either at fair value or at the non-
measurement basis is made on a transaction-by-transaction basis. Other types of non-controlling interests are measured at fair value or, when applicable, on the basis specified in another K-IFRS.
When the consideration transferred by the Group in a business combination includes assets or liabilities resulting from a contingent consideration arrangement, the contingent consideration is measured at its acquisition-date fair value and included as part of the consideration transferred in a business combination. Changes in the fair value of the contingent consideration that qualify as measurement period adjustments are adjusted retrospectively, with corresponding adjustments against goodwill. Measurement period adjustments are adjustments that arise from additional information obtained during the
facts and circumstances that existed at the acquisition date
The subsequent accounting for changes in the fair value of the contingent consideration that do not qualify as measurement period adjustments depends on how the contingent consideration is classified. Contingent consideration that is classified as equity is not remeasured at subsequent reporting dates and its subsequent settlement is accounted for within equity. Contingent consideration that is classified as an asset or a liability is remeasured at subsequent reporting dates in accordance with K-IFRS 1039 or K-IFRS 1037, Provisions, Contingent Liabilities and Contingent Assets, as appropriate, with the corresponding gain or loss being recognized in profit or loss.
interest in the acquiree is remeasured to fair value at the acquisition date and the resulting gain or loss, if any, is recognized in profit or loss. Amounts arising from interests in the acquiree prior to the acquisition date that have previously been recognized in other comprehensive income are reclassified to profit or loss where such treatment would be appropriate if that interest were disposed of.
If the initial accounting for a business combination is incomplete by the end of the reporting period in which the combination occurs, the Group reports provisional amounts for the items for which the accounting is incomplete. Those provisional amounts are adjusted during the measurement period (see above), or additional assets or liabilities are recognized, to reflect new information obtained about facts and circumstances that existed at the acquisition date that, if known, would have affected the amounts recognized at that date.
(5) Investments in joint ventures and associates
An associate is an entity over which the Group has significant influence. Significant influence is the power to participate in the financial and operating policy decisions of the investee, but is not control or joint control over those policies.
A joint venture is a joint arrangement whereby the parties that have joint control of the arrangement have rights to the net assets of the joint arrangement. Joint control is the contractually agreed sharing of control of an arrangement, which exists only when decisions about the relevant activities require unanimous consent of the parties sharing control.

The results and assets and liabilities of associates or joint ventures are incorporated in these consolidated financial statements using the equity method of accounting, except when the investment is classified as held for sale, in which case it is accounted for in accordance with K-IFRS 1105. Under the equity method, an investment in an associate or a joint venture is initially recognized in the consolidated statements of financial
loss and other comprehensive income of the associate or joint venture. When the
that associate or joint venture (which includes any long-term interests that, in substance, form part of the Grodiscontinues recognizing its share of further losses. Additional losses are recognized only to the extent that the Group has incurred legal or constructive obligations or made payments on behalf of the associate or joint venture.
identifiable assets, liabilities and contingent liabilities of an associate or a joint venture recognized at the date of acquisition is recognized as goodwill, which is included within
value of the identifiable assets, liabilities and contingent liabilities over the cost of acquisition, after reassessment, is recognized immediately in profit or loss.
Upon disposal of an associate or a joint venture that results in the Group losing significant influence over that associate or joint venture, any retained investment is measured at fair value at that date and the fair value is regarded as its fair value on initial recognition as a financial asset in accordance with K-IFRS 1039. The difference between the previous carrying amount of the associate or joint venture attributable to the retained interest and its fair value is included in the determination of the gain or loss on disposal of the associate or joint venture. In addition, the Group accounts for all amounts previously recognized in other comprehensive income in relation to that associate or joint venture on the same basis we would be required if that associate or joint venture had directly disposed of the related assets or liabilities. Therefore, if a gain or loss previously recognized in other comprehensive income by that associate or joint venture would be reclassified to profit or loss on the disposal of the related assets or liabilities, the Group reclassifies the gain or loss from equity to profit or loss (as reclassification adjustment) when it loses significant influence over that associate or joint venture.
When the Group reduces its ownership interest in an associate or a joint venture but continues to use the equity method, the Group reclassifies the proportion of the gain or loss that had previously been recognized in other comprehensive income to profit or loss relating to that reduction in ownership interest if that gain or loss would be reclassified to profit or loss on the disposal of the related assets or liabilities. In addition, the Group applies K-IFRS 1105 to a portion of investment in an associate or a joint venture that meets the criteria to be classified as held for sale.

The requirements of K-IFRS 1039 are applied to determine whether it is necessary to in an associate or
a joint venture. When necessary, the entire carrying amount of the investment (including goodwill) is tested for impairment in accordance with K-IFRS 1036 by comparing its recoverable amount (higher of value in use and fair value, less costs to sell) with its carrying amount, and any impairment loss recognized forms part of the carrying amount of the investment. Any reversal of that impairment loss is recognized in accordance with K-IFRS 1036 to the extent that the recoverable amount of the investment subsequently increases.
The Group continues to use the equity method when an investment in an associate becomes an investment in a joint venture or an investment in a joint venture becomes an investment in an associate. There is no remeasurement to fair value upon such changes in ownership interests.
When a group entity transacts with an associate or a joint venture of the Group, profits and losses resulting from the transactions with the associate or joint venture are recognized in the Grointerests in the associate or joint venture that are not related to the Group.
(6) Interests in joint operations
A joint operation is a joint arrangement whereby the parties that have joint control of the arrangement have rights to the assets, and obligations for the liabilities, relating to the arrangement. Joint control is the contractually agreed sharing of control of an arrangement, which exists only when decisions about the relevant activities require unanimous consent of the parties sharing control.
When a group entity undertakes its activities under joint operations, the Group as a joint operator recognizes in relation to its interest in a joint operation:
its assets, including its share of any assets held jointly its liabilities, including its share of any liabilities incurred jointly its revenue from the sale of its share of the output arising from the joint operation its share of the revenue from the sale of the output by the joint operation its expenses, including its share of any expenses incurred jointly
The Group accounts for the assets, liabilities, revenues and expenses relating to its interest in a joint operation in accordance with the K-IFRS applicable to the particular assets, liabilities, revenues and expenses.
When a group entity transacts with a joint operation in which a group entity is a joint operator (such as a sale or contribution of assets), the Group is considered to be conducting the transaction with the other parties to the joint operation, and gains and losses resulting from the transactions are recognized in the Group's consolidated financial statements only to the extent of other parties' interests in the joint operation.

When a group entity transacts with a joint operation in which a group entity is a joint operator (such as a purchase of assets), the Group does not recognize its share of the gains and losses until it resells those assets to a third party.
(7) Goodwill
Goodwill arising on an acquisition of a business is carried at cost as established at the date of acquisition of the business less accumulated impairment losses, if any.
CGUs (or groups of CGUs) that is expected to benefit from the synergies of the combination.
A CGU to which goodwill has been allocated is tested for impairment annually, or more frequently when there is indication that the unit may be impaired. If the recoverable amount of the CGU is less than its carrying amount, the impairment loss is allocated first to reduce the carrying amount of any goodwill allocated to the unit and then to the other assets of the unit on a pro rata basis based on the carrying amount of each asset in the unit. Any impairment loss for goodwill is recognized directly in profit or loss. An impairment loss recognized for goodwill is not reversed in subsequent periods.
On disposal of the relevant CGU, the attributable amount of goodwill is included in the determination of the profon the acquisition of an associate is described in Note 2-(4).
(8) Non-current assets held for sale
Non-current assets and disposal groups are classified as held for sale if their carrying amount will be recovered principally through a sale transaction rather than through continuing use. This condition is regarded as met only when the sale is highly probable and the non-current asset (or disposal group) is available for immediate sale in its present condition. Management must be committed to the sale, which should be expected to qualify for recognition as a completed sale within one year from the date of classification.
When the Group is committed to a sale plan involving loss of control of a subsidiary, all of the assets and liabilities of that subsidiary are classified as held for sale when the criteria described above are met, regardless of whether the Group will retain a non-controlling interest in its former subsidiary after the sale.

When the Group is committed to a sale plan involving disposal of an investment, or a portion of an investment, in an associate or joint venture, the investment or the portion of the investment that will be disposed of is classified as held for sale when the criteria described above are met, and the Group discontinues the use of the equity method in relation to the portion that is classified as held for sale. Any retained portion of an investment in an associate or a joint venture that has not been classified as held for sale continues to be accounted for using the equity method. The Group discontinues the use of the equity method at the time of disposal when the disposal results in the Group losing significant influence over the associate or joint venture.
After the disposal takes place, the Group accounts for any retained interest in the associate or joint venture in accordance with K-IFRS 1039, unless the retained interest continues to be an associate or a joint venture, in which case the Group uses the equity method.
Non-current assets (and disposal groups) classified as held for sale are measured at the lower of their previous carrying amount and fair value, less costs to sell.
(9) Revenue recognition
Revenue is measured at the fair value of the consideration received or receivable for the sale of goods and rendering of services arising in the course of the ordinary activities of the Group. Revenue is reduced for value-added tax, estimated customer returns, rebates and trade discounts and is presented after eliminating intercompany transactions. The Group recognizes revenue when the amount of revenue can be measured reliably and it is probable that the economic benefits associated with the transaction will flow to the Group and when transaction meets the revenue recognition criteria specified by activity.
1) Sales of goods
Revenue from the sale of goods is recognized when the Group has transferred the significant risks and rewards of ownership of the goods to the buyer.
2) Rendering of services
Revenue from a contract to provide services is recognized by reference to the stage of completion of the contract. Depending on the nature of the transaction, the Group determines the stage of completion by reference to surveys of work performed, services performed to date as a percentage of total services to be performed or the proportion that costs incurred to date bear to the estimated total costs of the transaction, as applicable.

3) Dividend income and interest income
Dividend income from investments is recognized when the right to receive payment has been established.
Interest income is accrued on a timely basis, by reference to the principal outstanding and at the effective interest rate applicable, which is the rate that exactly discounts estimated future cash receipts through the expected life of the financial
4) Rental income
eases is described in Note 2-(11).
(10) Construction contracts
Where the outcome of a construction contract can be estimated reliably, revenue and costs are recognized by reference to the stage of completion of the contract activity at the end of the reporting period, measured based on the proportion of contract costs incurred for work performed to date relative to the estimated total contract costs, except where this would not be representative of the stage of completion. Variations in contract work, claims and incentive payments are included to the extent that the amount can be measured reliably and its receipt is considered probable.
Where the outcome of a construction contract cannot be estimated reliably, contract revenue is recognized to the extent of contract costs incurred that it is probable will be recoverable. Contract costs are recognized as expenses in the period in which they are incurred.
When it is probable that total contract costs will exceed total contract revenue, the expected loss is recognized as an expense immediately.
When contract costs incurred to date plus recognized profits less recognized losses exceed progress billing, the surplus is shown as amounts due from customers for contract work. For contracts where progress billings exceed contract costs incurred to date plus recognized profits less recognized losses, the surplus is shown as the amounts due to customers for contract work. Amounts received before the related work is performed are included in the consolidated statements of financial position, as a liability, as advances received. Amounts billed for work performed but not yet paid by the customer are included in the consolidated statements of financial position under trade and other receivables.
(11) Leases
Leases are classified as finance leases whenever the terms of the lease transfer substantially all the risks and rewards of ownership to the lessee. All other leases are classified as operating leases.
1) The Group as lessor
Amounts due from lessees under finance leases are recognized as receivables at the tment in the leases. Finance lease income is
allocated to accounting periods, so as to reflect a constant periodic rate of return on to the leases.
Rental income from operating leases is recognized on a straight-line basis over the term of the relevant lease. Initial direct costs incurred in negotiating and arranging an operating lease are added to the carrying amount of the leased asset and recognized on a straight-line basis over the lease term.
2) The Group as lessee
Assets held under finance leases are initially recognized as assets of the Group at their fair value at the inception of the lease or, if lower, at the present value of the minimum lease payments. The corresponding liability to the lessor is included in the consolidated statements of financial position as a finance lease obligation.
Lease payments are apportioned between finance expenses and reduction of the lease obligation so as to achieve a constant rate of interest on the remaining balance of the liability. Finance expenses are recognized immediately in profit or loss, unless they are directly attributable to qualifying assets, in which case they are capitalized in
borrowing costs (see Note 2-(13)). Contingent rentals are recognized as expenses in the periods in which they are incurred.
Operating lease payments are recognized as an expense on a straight-line basis over the lease term, except where another systematic basis is more representative of the time pattern in which economic benefits from the leased asset are consumed. Contingent rentals arising under operating leases are recognized as an expense in the period in which they are incurred.
In the event that lease incentives are received to enter into operating leases, such incentives are recognized as a liability. The aggregate benefit of incentives is recognized as a reduction of rental expense on a straight-line basis, except where another systematic basis is more representative of the time pattern in which economic benefits from the leased asset are consumed.

(12) Foreign currencies
The individual financial statements of each group entity are presented in the currency of the primary economic environment in which the entity operates (its functional currency). For the purpose of the consolidated financial statements, the results and financial position of each group entity are expressed in Korean won, which is the functional currency of the entity and the presentation currency for the consolidated financial statements.
In preparing the financial statements of the individual entities, transactions in currencies
rates of exchange prevailing at the dates of the transactions. At the end of each reporting period, monetary items denominated in foreign currencies are retranslated at the rates prevailing at that date. Non-monetary items carried at fair value that are denominated in foreign currencies are retranslated at the rates prevailing at the date when the fair value was determined. Non-monetary items that are measured in terms of historical cost in a foreign currency are not retranslated.
Exchange differences are recognized in profit or loss in the period in which they arise except for:
exchange differences on foreign currency borrowings relating to assets under construction for future productive use, which are included in the cost of those assets when they are regarded as an adjustment to interest costs on those foreign currency borrowings exchange differences on transactions entered into in order to hedge certain foreigncurrency risks (see Note 2-(26) below for hedging accounting policies) exchange differences on monetary items receivable from or payable to a foreign operation for which settlement is neither planned nor likely to occur (therefore, forming part of the net investment in the foreign operation), which are recognized initially in other comprehensive income and reclassified from equity to profit or loss on disposal or partial disposal of the net investment.
For the purpose of presenting consolidated financial statements, the assets and liabilities of the Group won using exchange rates prevailing at the end of the reporting period. Income and expense items are translated at the average exchange rates for the period, unless exchange rates fluctuated significantly during that period, in which case the exchange rates at the dates of the transactions are used. Exchange differences arising, if any, are recognized in other comprehensive income and accumulated in equity (attributed to non-controlling interests as appropriate). On the disposal of a foreign operation (i.e., n a foreign operation or a disposal involving loss of control over a subsidiary that includes a foreign operation or partial disposal of an interest in a joint arrangement or an associate that includes a foreign operation of which the retained interest becomes a financial asset), all of the accumulated exchange differences in respect to that operation attributable to the owners of the Company are reclassified to profit or loss. Any exchange differences that have previously been attributed to non-controlling interests are derecognized, but they are not reclassified to profit or loss.

In the case of a partial disposal (i.e., no loss of control) of a subsidiary that includes a foreign operation, the proportionate share of accumulated exchange differences are reattributed to non-controlling interests in equity and are not recognized in profit or loss. For all other partial disposals (i.e., partial disposals of associates or joint arrangements that do not result in the Group losing significant influence or joint control), the proportionate share of the accumulated exchange differences is reclassified to profit or loss.
Goodwill and fair value adjustments arising on the acquisition of a foreign operation are treated as assets and liabilities of the foreign operation and translated at the closing rate. Exchange differences arising are recognized in other comprehensive income.
(13) Borrowing costs
Borrowing costs directly attributable to the acquisition, construction or production of qualifying assets, which are assets that necessarily take a substantial period of time to get ready for their intended use or sale, are added to the cost of those assets, until such time as the assets are substantially ready for their intended use or sale.
Investment income earned on the temporary investment of specific borrowings pending their expenditure on qualifying assets is deducted from the borrowing costs eligible for capitalization.
All other borrowing costs are recognized in profit or loss in the period in which they are incurred.
(14) Retirement benefit costs and termination benefits
The Group operates a defined benefit pension plan. For defined benefit retirement benefit plans, the cost of providing benefits is determined using the projected unit credit method, with actuarial valuations being carried out at the end of each reporting period. Remeasurement, comprising actuarial gains and losses, the effect of the changes to the asset ceiling (if applicable) and the return on plan assets (excluding interest), is reflected immediately in the consolidated statements of financial position with a charge or credit recognized in other comprehensive income in the period in which they occur. Remeasurement recognized in other comprehensive income is reflected immediately in retained earnings and will not be reclassified to profit or loss. Past service cost is recognized in profit or loss in the period of a plan amendment. Net interest is calculated by applying the discount rate at the beginning of the period to the net defined benefit liability or asset. Defined benefit costs are composed of service cost (including current service cost, past service cost, as well as gains and losses on curtailments and settlements), net interest expense (income) and remeasurement.
The Group presents the service cost and net interest expense (income) components in profit or loss, and the remeasurement component in other comprehensive income. Curtailment gains and losses are accounted for as past service costs.

The retirement benefit obligation recognized in the consolidated statements of financial
surplus resulting from this calculation is limited to the present value of any economic benefits available in the form of refunds from the plans or reductions in future contributions to the plans.
A liability for a termination benefit is recognized at the earlier of when the entity can no longer withdraw the offer of the termination benefit and when the entity recognizes any related restructuring costs.
Contributions to defined contribution plans are recognized as an expense when employees have rendered service that entitles them to the contributions.
(15) Share-based payment arrangements
Equity-settled share-based payments to employees and others providing similar services are measured at the fair value of the equity instruments at the grant date.
The fair value determined at the grant date of the equity-settled share-based payments is expensed on a straight-line basis over the vof equity instruments that will eventually vest. At the end of each reporting period, the Group revises its estimate of the number of equity instruments expected to vest. The impact of the revision of the original estimates, if any, is recognized in profit or loss such that the cumulative expense reflects the revised estimate, with a corresponding adjustment in other component of equity.
(16) Taxation
Income tax expense represents the sum of the tax currently payable and deferred tax.
1) Current tax
The tax currently payable is based on taxable profit for the year. Taxable profit differs from profit as reported in the consolidated statement of profit or loss and comprehensive income because of items of income or expense that are taxable or
liability for current tax is calculated using tax rates that have been enacted or substantively enacted by the end of the reporting period.

2) Deferred tax
Deferred tax is recognized on temporary differences between the carrying amounts of assets and liabilities in the consolidated financial statements and the corresponding tax bases used in the computation of taxable profit. Deferred tax liabilities are generally recognized for all taxable temporary differences. Deferred tax assets are generally recognized for all deductible temporary differences to the extent that it is probable that taxable profits will be available against which those deductible temporary differences can be utilized. Such deferred tax assets and liabilities are not recognized if the temporary difference arises from goodwill or from the initial recognition (other than in a business combination) of other assets and liabilities in a transaction that affects neither the taxable profit, nor the accounting profit.
Deferred tax liabilities are recognized for taxable temporary differences associated with investments in subsidiaries and associates, and interests in joint ventures, except where the Group is able to control the reversal of the temporary difference, and it is probable that the temporary difference will not reverse in the foreseeable future. Deferred tax assets arising from deductible temporary differences associated with such investments and interests are only recognized to the extent that it is probable that there will be sufficient taxable profits against which to utilize the benefits of the temporary differences and they are expected to reverse in the foreseeable future.
The carrying amount of deferred tax assets is reviewed at the end of each reporting period and reduced to the extent that it is no longer probable that sufficient taxable profits will be available to allow all or part of the asset to be recovered.
Deferred tax assets and liabilities are measured at the tax rates that are expected to apply in the period in which the liability is settled or the asset realized, based on tax rates (and tax laws) that have been enacted or substantively enacted by the end of the reporting period. The measurement of deferred tax liabilities and assets reflects the tax consequences that would follow from the manner in which the Group expects, at the end of the reporting period, to recover or settle the carrying amount of its assets and liabilities.
Deferred tax assets and liabilities are offset if, and only if, the Group has a legally enforceable right to set off current tax assets against current tax liabilities, and the deferred tax assets and liabilities relate to income taxes levied by the same taxation authority on either the same taxable entity or different taxable entities, which intend either to settle current tax liabilities and assets on a net basis, or to realize the assets and settle the liabilities simultaneously, in each future period in which significant amounts of deferred tax liabilities or assets are expected to be settled or recovered.

For the purpose of measuring deferred tax liabilities and deferred tax assets for investment properties that are measured using the fair value model, the carrying amounts of such properties are presumed to be recovered entirely through sale, unless the presumption is rebutted. The presumption is rebutted when the investment property is depreciable and is held within a business model, whose objective is to consume substantially all of the economic benefits embodied in the investment properties over time, rather than through sale.
3) Current and deferred tax for the year
Current tax and deferred tax are recognized in profit or loss, except when they relate to items that are recognized in other comprehensive income or directly in equity, in which case, the current tax and deferred tax are also recognized in other comprehensive income or directly in equity, respectively. Where current tax or deferred tax arises from the initial accounting for a business combination, the tax effect is included in the accounting for the business combination.
(17) Government grants
Government grants are not recognized until there is reasonable assurance that the Group will comply with the conditions attaching to them and that the grants will be received.
The benefit of a government loan at a below-market rate of interest is treated as a government grant, measured as the difference between proceeds received and the fair value of the loan based on prevailing market interest rates.
Government grants related to assets are presented in the consolidated statements of financial position by deducting the grant from the carrying amount of the asset. The related grant is recognized in profit or loss over the life of a depreciable asset as a reduced depreciation expense.
Government grants related to income are recognized in profit or loss on a systematic basis over the periods in which the Group recognizes as expenses the related costs for which the grants are intended to compensate. Government grants that are receivable as compensation for expenses or losses already incurred or for the purpose of giving immediate financial support to the Group with no future-related costs are recognized in profit or loss in the period in which they become receivable.
(18) Property, Plant and Equipment
Property, plant and equipment are initially stated at cost and subsequently recorded at cost, less accumulated depreciation, and accumulated impairment losses, except for land, which is recorded using revaluation model. The cost of an item of property, plant and equipment is directly attributable to their purchase or construction, which includes any costs directly attributable to bringing the asset to the location and condition necessary for it to be capable of operating in the manner intended by management. It also includes the initial estimate of the costs of dismantling and removing the item and restoring the site on which it is located.

Subsequent costs are recognized in carrying amount of an asset or as a separate asset, ifit is probable that future economic benefits associated with the assets will flow into the Group and the cost of an asset can be measured reliably. Routine maintenance and repairs are expensed as incurred.
The Group does not depreciate land. Depreciation expense is computed using the straight-line method, based on the estimated useful lives of the assets as follows:
Estimated useful lives (in years)
Buildings 4 50Structures 2 40Machinery 2 20Others 2 20
If each part of an item of property, plant and equipment has a cost that is significant in relation to the total cost of the item, then it is depreciated separately.
The Group reviews the depreciation method, the estimated useful lives and residual values of property, plant and equipment at the end of each annual reporting period. If expectations differ from previous estimates, the changes are accounted for as a change in an accounting estimate.
An item of property, plant and equipment is derecognized upon disposal or when no future economic benefits are expected to arise from the continued use of the asset. Any gain or loss arising on derecognition of the property (calculated as the difference between the net disposal proceeds and the carrying amount of the asset) is included in profit or loss in the period in which the property is derecognized.
(19) Investment properties
Investment properties are properties held to earn rentals and/or for capital appreciation (including property under construction for such purposes). Investment properties are measured initially at cost, including transaction costs. Subsequent to initial recognition, investment properties are stated at fair value, with any gains or losses arising on fair value fluctuation recognized in profit or loss.
Subsequent costs are recognized in carrying amount of an asset or as a separate asset, ifit is probable that future economic benefits associated with the assets will flow into the Group and the cost of an asset can be measured reliably. Routine maintenance and repairs are expensed as incurred.
An investment property is derecognized upon disposal or when the investment property is permanently withdrawn from use and no future economic benefits are expected from the disposal. Any gain or loss arising on derecognition of the property (calculated as the difference between the net disposal proceeds and the carrying amount of the asset) is included in profit or loss in the period in which the property is derecognized.

(20) Intangible Assets
1) Intangible assets acquired separately
Intangible assets with finite useful lives that are acquired separately are carried at cost, less accumulated amortization and accumulated impairment losses. Amortization is recognized on a straight-line basis over their estimated useful lives. The estimated useful life and amortization method are reviewed at the end of each reporting period, with the effect of any changes in estimate being accounted for on a prospective basis. Intangible assets with indefinite useful lives that are acquired separately are carried at cost, less accumulated impairment losses.
2) Internally generated intangible assets - research and development expenditure
Expenditure on research activities is recognized as an expense in the period in which it is incurred.
Expenditure arising from development (or from the development phase of an internal project) is recognized as an intangible asset, if, and only if, the development project is designed to produce new or substantially improved products, and the Group can demonstrate the technical and economical feasibility and measure reliably the resources attributable to the intangible asset during its development.
Subsequent to initial recognition, internally generated intangible assets are reported at cost, less accumulated amortization and accumulated impairment losses, on the same basis as intangible assets that are acquired separately.
3) Intangible assets acquired in a business combination
Intangible assets that are acquired in a business combination are recognized separately from goodwill and are initially recognized at their fair value at the acquisition date (which is regarded as their cost). Subsequent to initial recognition, intangible assets acquired in a business combination are reported at cost, less accumulated amortization and accumulated impairment losses, on the same basis as intangible assets that are acquired separately.
4) Derecognition of intangible assets
An intangible asset is derecognized on disposal, or when no future economic benefits are expected from its use. Gains or losses arising from derecognition of an intangible asset, measured as the difference between the net disposal proceeds and the carrying amount of the asset, are recognized in profit or loss when the asset is derecognized.

5) Depreciation of intangible assets
Intangible assets (membership) with indefinite useful lives are not amortized. Intangible assets other than not amortized intangible assets are using the straight-line method, based on the estimated useful lives of the assets as follows:
Estimated useful lives (in years)
Development costs 4-12Industrial rights 5-10Other intangible assets 2-20
(21) Impairment of tangible and intangible assets other than goodwill
At the end of each reporting period, the Group reviews the carrying amounts of its tangible and intangible assets to determine whether there is any indication that those assets have suffered an impairment loss. If any such indication exists, the recoverable amount of the asset is estimated in order to determine the extent of the impairment loss (if any). When it is not possible to estimate the recoverable amount of an individual asset, the Group estimates the recoverable amount of the CGU to which the asset belongs. Where a reasonable and consistent basis of allocation can be identified, corporate assets are also allocated to individual CGUs, or otherwise they are allocated to the smallest group of CGUs for which a reasonable and consistent allocation basis can be identified.
Intangible assets with indefinite useful lives and intangible assets not yet available for use are tested for impairment at least annually, and whenever there is an indication that the asset may be impaired.
Recoverable amount is the higher of fair value, less costs to sell and value in use. If the recoverable amount of an asset (or a CGU) is estimated to be less than its carrying amount, the carrying amount of the asset (or the CGU) is reduced to its recoverable amount and the reduced amount is recognized in profit or loss.
Where an impairment loss subsequently reverses, the carrying amount of the asset (or a CGU) is increased to the revised estimate of its recoverable amount, but so that the increased carrying amount does not exceed the carrying amount that would have been determined had no impairment loss been recognized for the asset (or the CGU) in prior years. A reversal of an impairment loss is recognized immediately in profit or loss.

(22) Inventories
Inventories are stated at the lower of cost and net realizable value. Cost of inventories is measured under the specific identification method and consists of the purchase price, cost of conversion and other costs incurred in bringing the inventories to their present location and condition. Net realizable value represents the estimated selling price for inventories, less all estimated costs of completion and costs necessary to make the sale.
When inventories are sold, the carrying amount of those inventories is recognized as an expense (cost of sales) in the period in which the related revenue is recognized. The amount of any write-down of inventories to net realizable value and all losses of inventories is recognized as an expense in the period the write-down or loss occurs. The amount of any reversal of any write-down of inventories, arising from an increase in net realizable value, is recognized as a reduction in the amount of inventories recognized as an expense in the period in which the reversal occurs.
(23) Provisions
Provisions are recognized when the Group has a present obligation (legal or constructive) as a result of a past event, it is probable that the Group will be required to settle the obligation and a reliable estimate can be made of the amount of the obligation.
The amount recognized as a provision is the best estimate of the consideration required to settle the present obligation at the end of the reporting period, taking into account the risks and uncertainties surrounding the obligation. When a provision is measured using the cash flows estimated to settle the present obligation, its carrying amount is the present value of those cash flows (where the effect of the time value of money is material). The discount rate used is a pretax rate that reflects current market assessments of the time value of money and the risks specific to the liability. Where discounting is used, the increase in the provision due to the passage is recognized in profit or loss as borrowing cost.
When some or all of the economic benefits required to settle a provision are expected to be recovered from a third party, a receivable is recognized as an asset if it is virtually certain that reimbursement will be received and the amount of the receivable can be measured reliably.
At the end of each reporting period, the remaining provision balance is reviewed and assessed to determine if the current best estimate is being recognized. If the existence of an obligation to transfer economic benefit is no longer probable, the related provision is reversed during the period.

(24) Financial instruments
Financial assets and financial liabilities are recognized when an entity becomes a party to the contractual provisions of the instruments. Financial assets and financial liabilities are initially measured at fair value. Transaction costs that are directly attributable to the acquisition or issue of financial assets and financial liabilities are added to, or deducted from, the fair value of the financial assets or financial liabilities, as appropriate, on initial recognition. Transaction costs directly attributable to the acquisition of financial assets or financial liabilities at fair value through profit or loss ( FVTPL ) are recognized immediately in profit or loss.
Financial assets are classified into the following specifi-to- -for-sale ( AFS
financial assets, and is determined at the time of initial recognition.
1) Effective interest method
The effective interest method is a method of calculating the amortized cost of a debt instrument and of allocating interest income over the relevant period. The effective interest rate is the rate that exactly discounts estimated future cash receipts (including all fees and points paid or received that form an integral part of the effective interest rate, transaction costs and other premiums or discounts) through the expected life of the debt instrument, or, where appropriate, a shorter period, to the net carrying amount on initial recognition.
Income is recognized on an effective interest basis for debt instruments other than those financial assets classified as at FVTPL.
2) Financial assets at FVTPL
Financial assets are classified as at FVTPL when the financial asset is either held for trading or it is designated as at FVTPL. A financial asset is classified as held for trading, if it has been acquired principally for the purpose of selling it in the nearterm; or on initial recognition it is part of a portfolio of identified financial instruments that the Group manages together and has a recent actual pattern of short-term profit-taking; or it is a derivative that is not designated and effective as a hedging instrument. Financial assets at FVTPL are stated at fair value, with any gains or losses arising on remeasurement recognized in profit or loss.
3) Held-to-maturity investments
Non-derivative financial assets with fixed or determinable payments and fixed-maturity dates that the Group has the positive intent and ability to hold to maturity are classified as held-to-maturity investments. Held-to-maturity investments are measured at amortized cost using the effective interest method, less any impairment, with revenue recognized on an effective yield basis.

4) AFS financial assets
AFS financial assets are non-derivatives that are either designated as AFS or are not classified as (a) loans and receivables, (b) held-to-maturity investments or (c) financial assets at FVTPL.
They are subsequently measured at fair value at the end of each reporting period. Changes in the carrying amount of AFS monetary financial assets relating to changes in foreign currency rates, interest income calculated using the effective interest method and dividends on AFS equity investments are recognized in profit or loss. Other changes in the carrying amount of AFS financial assets are recognized in other comprehensive income (as (investments revaluation reserve)). When the investment is disposed of, or is determined to be impaired, the cumulative gain or loss previously accumulated in other comprehensive income is reclassified to profit or loss.
Dividends on AFS equity instruments are recognized in profit or loss when the Group o receive the dividends is established.
AFS equity investments that do not have a quoted market price in an active market and whose fair value cannot be reliably measured and derivatives that are linked to and must be settled by delivery of such unquoted equity investments are measured at cost, less any identified impairment losses at the end of each reporting period.
5) Loans and receivables
Trade receivables, loans and other receivables that have fixed or determinable payments that are not quoted in an acreceivables.effective interest method, less any impairment. Interest income is recognized by applying the effective interest rate, except for short-term receivables when the effect of discounting is immaterial.
6) Impairment of financial assets
Financial assets, other than those at FVTPL, are assessed for indicators of impairment at the end of each reporting period. Financial assets are considered to be impaired when there is objective evidence that more events that occurred after the initial recognition of the financial asset, the estimated future cash flows of the investment have been affected.
For AFS equity investments, a significant or prolonged decline in the fair value of the security below its cost is considered to be objective evidence of impairment.
For certain categories of financial asset, such as trade receivables, assets that are assessed not to be impaired individually are, in addition, assessed for impairment on a collective basis. Objective evidence of impairment for a portfolio of receivables could include the Groupnumber of delayed payments in the portfolio past the average credit period of 30 days, as well as observable changes in national or local economic conditions that correlate with default on receivables.
For financial assets carried at amortized cost, the amount of the impairment loss recognized is the difference be
effective interest rate.
For financial assets that are carried at cost, the amount of the impairment loss recognized is thvalue of estimated future cash flows, discounted at the current market rate of return for a similar financial asset. Such impairment loss will not be reversed in subsequent periods.
When an AFS financial asset is considered to be impaired, cumulative gains or losses previously recognized in other comprehensive income are reclassified to profit or loss in the period.
For financial assets measured at amortized cost, if, in a subsequent period, the amount of the impairment loss decreases and the decrease can be related objectively to an event occurring after the impairment was recognized, the previously recognized impairment loss is reversed through profit or loss to the extent that the carryingamount of the investment at the date the impairment is reversed does not exceed what the amortized cost would have been had the impairment not been recognized.
In respect to AFS equity securities, impairment losses previously recognized in profit or loss are not reversed through profit or loss. Any increase in fair value subsequent to an impairment loss is recognized in other comprehensive income. In respect to AFS debt securities, impairment losses are subsequently reversed through profit or loss if an increase in the fair value of the investment can be objectively related to an event occurring after the recognition of the impairment loss.

7) Derecognition of financial assets
The Group derecognizes a financial asset only when the contractual rights to the cash flows from the asset expire, or when it transfers the financial asset and substantially all the risks and rewards of ownership of the asset to another entity. If the Group neither transfers nor retains substantially all the risks and rewards of ownership and continues to control the transferred asset, the Group recognizes its retained interest in the asset and an associated liability for amounts it may have to pay. If the Group retains substantially all the risks and rewards of ownership of a transferred financial asset, the Group continues to recognize the financial asset and also recognizes a collateralized borrowing for the proceeds received.
carrying amount and the sum of the consideration received and receivable, and the cumulated gain or loss that had been recognized in other comprehensive income and accumulated in equity is recognized in profit or loss.
On derecognition of a financial assets other than in its entirety (e.g., when the Groupretains an option to repurchase part of a transferred asset, or it retains a residual interest, and such a retained interest indicates that the transferor has neither transferred nor retained substantially all the risks and rewards of ownership and has retained control of the transferred asset), the Group allocates the previous carrying amount of the financial asset between the part it continues to recognize under continuing involvement and the part it no longer recognizes on the basis of the relative fair value of those parts on the date of the transfer. The difference between the carrying amount allocated to the part that is no longer recognized and the sum of the consideration received for the part that is no longer recognized and any cumulative gain or loss allocated to it that had been recognized in other comprehensive income is recognized in profit or loss. A cumulative gain or loss that had been recognized in other comprehensive income is allocated between the partthat continues to be recognized and the part that is no longer recognized on the basis of the relative fair value of those parts.

(25) Financial liabilities and equity instruments
1) Classification as debt or equity
Debt and equity instruments are classified as either financial liabilities or as equity in accordance with the substance of the contractual arrangement and the definitions of financial liability and an equity instrument.
2) Equity instruments
An equity instrument is any contract that evidences a residual interest in the assets of an entity after deducting all of its liabilities. Equity instruments issued by the Group are recognized at the proceeds received, net of direct issue costs.
d deducted directly in equity. No gain or loss is recognized in profit or loss on the purchase, sale,
3) Compound instruments
The component parts of compound instruments (convertible bonds) issued by the Group are classified separately as financial liabilities and equity in accordance with the substance of the contractual arrangements and the definitions of a financial liability and equity instrument. Conversion option that will be settled by the exchange of a fixed amount of cash or another financial asset for a fixed number of
At the date of issue, the fair value of the liability component is estimated using the prevailing market interest rate for a similar non-convertible instrument. This amount is recorded as a liability on an amortized cost basis using the effective interest
The conversion option classified as equity is determined by deducting the amount of the liability component from the fair value of the compound instrument as a whole. This is recognized and included in equity, net of income tax effects, and is not subsequently remeasured. In addition, the conversion option classified as equity will remain in equity until the conversion option is exercised, in which case, the balance recognized in equity will be transferred to share premium. No gain or loss is recognized in profit or loss upon conversion or expiration of the conversion option.

4) Financial liabilities
Financial liabilities are recognized when the Group becomes a party to the contractual provisions of the instruments. Financial liabilities are initially measured at fair value. Transaction costs that are directly attributable to the issue of financial liabilities are deducted from the fair value of the financial liabilities on initial recognition. Transaction costs directly attributable to acquisition of financial liabilities at FVTPL are recognized immediately in profit or loss.
Financial liabilities are classified as either financial liabilities at FVTPL or other financial liabilities.
5) Financial liabilities at FVTPL
Financial liabilities are classified as at FVTPL when the financial liability is either held for trading or it is designated as at FVTPL.
Financial liabilities at FVTPL are stated at fair value, with any gains or losses arising on remeasurement recognized in profit or loss. The net gain or loss recognized in profit or loss incorporates any interest paid on the financial liability and is included
- consolidated statements of income.
6) Other financial liabilities
Other financial liabilities are subsequently measured at amortized cost using the effective interest method, with interest expense recognized on an effective yield basis.
7) Financial guarantee contracts
A financial guarantee contract is a contract that requires the issuer to make specified payments to reimburse the holder for a loss it incurs because a specified debtor fails to make payments when due in accordance with the terms of a debt instrument.
Financial guarantee contract liabilities are initially measured at their fair values and, if not designated as at FVTPL, are subsequently measured at the higher of:
the amount of the obligation under the contract, as determined in accordance with K-IFRS 1037 and the amount initially recognized less, cumulative amortization recognized in accordance with the K-IFRS 1018, Revenue

8) Derecognition of financial liabilities
The Group derecognizes s are discharged, canceled or they expire. The difference between the carrying amount of the financial liability derecognized and the consideration paid and payable is recognized in profit or loss.
(26) Derivative financial instruments
The Group enters into a variety of derivative financial instruments to manage its exposure to interest rate and foreign exchange rate risk, including foreign exchange forward contracts, interest rate swaps and cross currency swaps.
Derivatives are initially recognized at fair value at the date the derivative contract is entered into and are subsequently remeasured to their fair value at the end of each reporting period. The resulting gain or loss is recognized in profit or loss immediately, unless the derivative is designated and effective as a hedging instrument, in such case the timing of the recognition in profit or loss depends on the nature of the hedge relationship.
A derivative with a positive fair value is recognized as a financial asset; a derivative with a negative fair value is recognized as a financial liability. A derivative is presented as a non-current asset or a non-current liability, if the remaining maturity of the instrument is more than 12 months and it is not expected to be realized or settled within 12 months. Other derivatives are presented as current assets or current liabilities.
1) Embedded derivatives
Derivatives embedded in non-derivative host contracts are treated as separate derivatives when they meet the definition of a derivative, their risks and characteristics are closely related to those of the host contracts and the contracts are not measured at FVTPL.
2) Hedge accounting
The Group designates certain hedging instruments, which include derivatives, embedded derivatives and non-derivatives in respect to foreign currency risk, as either fair value hedges, cash flow hedges or hedges of net investments in foreign operations. Hedges of foreign exchange risk on firm commitments are accounted for as cash flow hedges.
At the inception of the hedge relationship, the entity documents the relationship between the hedging instrument and the hedged item, along with its risk management objectives and its strategy for undertaking various hedge transactions. Furthermore, at the inception of the hedge and on an ongoing basis, the Group documents whether the hedging instrument is highly effective in offsetting changes in fair values or cash flows of the hedged item.

3) Fair value hedges
Changes in the fair value of derivatives that are designated and qualify as fair value hedges are recognized in profit or loss immediately, together with any changes in the fair value of the hedged asset or liability that are attributable to the hedged risk. The change in the fair value of the hedging instrument and the change in the hedged item attributable to the hedged risk are recognized in the line of the consolidated statements of income relating to the hedged item.
Hedge accounting is discontinued when the Group revokes the hedging relationship, when the hedging instrument expires or is sold, terminated or exercised, or when it no longer qualifies for hedge accounting. The fair value adjustment to the carrying amount of the hedged item arising from the hedged risk is amortized to profit or loss from that date.
4) Cash flow hedges
The effective portion of changes in the fair value of derivatives that are designated and qualify as cash flow hedges is recognized in other comprehensive income. The gain or loss relating to the ineffective portion is recognized immediately in profit or
F
Amounts previously recognized in other comprehensive income and accumulated in equity are reclassified to profit or loss in the periods when the hedged item is recognized in profit or loss, in the same line of the consolidated statements of comprehensive income as the recognized hedged item. However, when the forecast transaction that is hedged results in the recognition of a non-financial asset or a non-financial liability, the gains and losses previously accumulated in equity are transferred from equity and included in the initial measurement of the cost of the non-financial asset or non-financial liability.
Hedge accounting is discontinued when the Group revokes the hedging relationship, when the hedging instrument expires or is sold, terminated or exercised, or it no longer qualifies for hedge accounting. Any gain or loss accumulated in equity at that time remains in equity, and is recognized when the forecast transaction is ultimately recognized in profit or loss. When a forecast transaction is no longer expected to occur, the gain or loss accumulated in equity is recognized immediately in profit or loss.

(27) Fair value
Fair value is the price that would be received to sell an asset or paid to transfer a liability in an orderly transaction between market participants at the measurement date, regardless of whether that price is directly observable or estimated using another valuation technique. In estimating the fair value of an asset or a liability, the Group takes into account the characteristics of the asset or liability if market participants would take those characteristics into account when pricing the asset or liability at the measurement date. Fair value for measurement and/or disclosure purposes in these consolidated financial statements is determined on such a basis, except for share-based payment transactions that are within the scope of K-IFRS 1102, leasing transactions that are within the scope of K-IFRS 1017, Leases, and measurements that have some similarities to fair value, but are not fair value, such as net realizable value in K-IFRS 1002, Inventories, or value in use in K-IFRS 1036.
In addition, for financial reporting purposes, fair value measurements are categorized into Levels 1, 2 or 3, based on the degree to which the inputs to the fair value measurements are observable and the significance of the inputs to the fair value measurement in its entirety, which are described in Note 10.
(28) Approval of consolidated financial statements
The consolidated financial statements for the year ended December 31, 2015, were approved by the Board of Directors on March 2, 2016.

3. SIGNIFICANT ACCOUNTING JUDGMENTS AND KEY SOURCES OFESTIMATION UNCERTAINTIES:
In the application of the Group accounting policies, which are described in Note 2, management is required to make judgments, estimates and assumptions about the carrying amounts of assets and liabilities that are not readily apparent from other sources. The estimates and underlying assumptions are reviewed on an ongoing basis. Actual results may differ from these estimates.
Revisions to accounting estimates are recognized in the period in which the estimate is revised, if the revision affects only that period. The revisions are recognized in the period of revision and future periods, if the revision affects both current and future periods.
(1) Revenue recognition
Revenue from a contract to provide services is recognized by reference to the stage of completion of the contract. The stage of completion of the contract is determined as reasonable estimation and is subject to change as related factors change.
(2) Impairment of goodwill
Determining whether goodwill is impaired requires an estimation of the value in use of the CGUs to which goodwill has been allocated. The value in use calculation requires the directors to estimate the future cash flows expected to arise from the CGU and a suitable discount rate in order to calculate present value.
(3) Defined benefit obligation
carried out at the end of each annual reporting period. Actuarial assumptions are the , such as discount rates, rates of expected future
salary increases and mortality rates.
(4) Warranty provision
Provisions for the expected cost of warranty obligations are recognized at the best
Provisions are determined by the estimate based on past experience.

(5) Revaluation model on land and fair value model on investment in real properties
As stated in Notes 12 and 14, the Group uses evaluation methods, including inputs that are not based on observable market data to approximate revalued amount of land classified as property, plant and equipment and fair value of investment property. The
for revaluation model on land and fair value model on investment in real properties are fair.
(6) Deferred tax
Recognition and measurement of deferred tax assets and liabilities require the
(7) Useful lives of property, plant and equipment and intangible assets
It is required to estimate useful lives for depreciation and amortization.
(8) Scope of consolidation
s ownership interest on DHC, as of December 31, 2015, is 40.3%, and DHC owns 36.4% and 42.7% of ownership interest on DI and DEC, respectively. Ownershipinterests other than aforementioned shares are owned by larger number of investors who own less than 1% of ownership. The management of the Group has assessed whether the group has de facto control over the aforementioned subsidiaries on every reporting period since the effective date of K-IFRS 1110 (January 1, 2013) and concluded the
voting rights relative to the size and dispersion of holdings of the other vote holders.
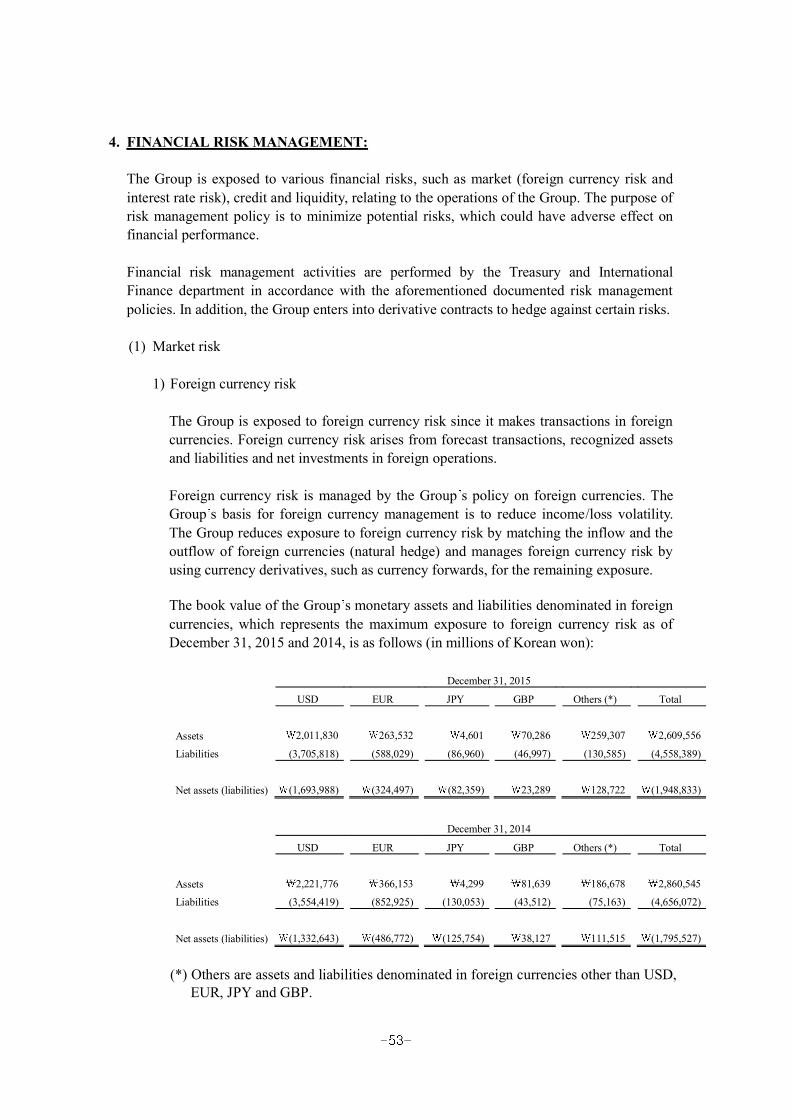
4. FINANCIAL RISK MANAGEMENT:
The Group is exposed to various financial risks, such as market (foreign currency risk and interest rate risk), credit and liquidity, relating to the operations of the Group. The purpose of risk management policy is to minimize potential risks, which could have adverse effect on financial performance.
Financial risk management activities are performed by the Treasury and International Finance department in accordance with the aforementioned documented risk management policies. In addition, the Group enters into derivative contracts to hedge against certain risks.
(1) Market risk
1) Foreign currency risk
The Group is exposed to foreign currency risk since it makes transactions in foreign currencies. Foreign currency risk arises from forecast transactions, recognized assets and liabilities and net investments in foreign operations.
Foreign currency risk is managed by the Group s policy on foreign currencies. The Group s basis for foreign currency management is to reduce income/loss volatility. The Group reduces exposure to foreign currency risk by matching the inflow and the outflow of foreign currencies (natural hedge) and manages foreign currency risk by using currency derivatives, such as currency forwards, for the remaining exposure.
The book value of the Group s monetary assets and liabilities denominated in foreign currencies, which represents the maximum exposure to foreign currency risk as of December 31, 2015 and 2014, is as follows (in millions of Korean won):
December 31, 2015
USD EUR JPY GBP Others (*) Total
Assets 2,011,830 263,532 4,601 70,286 259,307 2,609,556
Liabilities (3,705,818) (588,029) (86,960) (46,997) (130,585) (4,558,389)
Net assets (liabilities) (1,693,988) (324,497) (82,359) 23,289 128,722 (1,948,833)
December 31, 2014
USD EUR JPY GBP Others (*) Total
Assets 2,221,776 366,153 4,299 81,639 186,678 2,860,545
Liabilities (3,554,419) (852,925) (130,053) (43,512) (75,163) (4,656,072)
Net assets (liabilities) (1,332,643) (486,772) (125,754) 38,127 111,515 (1,795,527)
(*) Others are assets and liabilities denominated in foreign currencies other than USD, EUR, JPY and GBP.
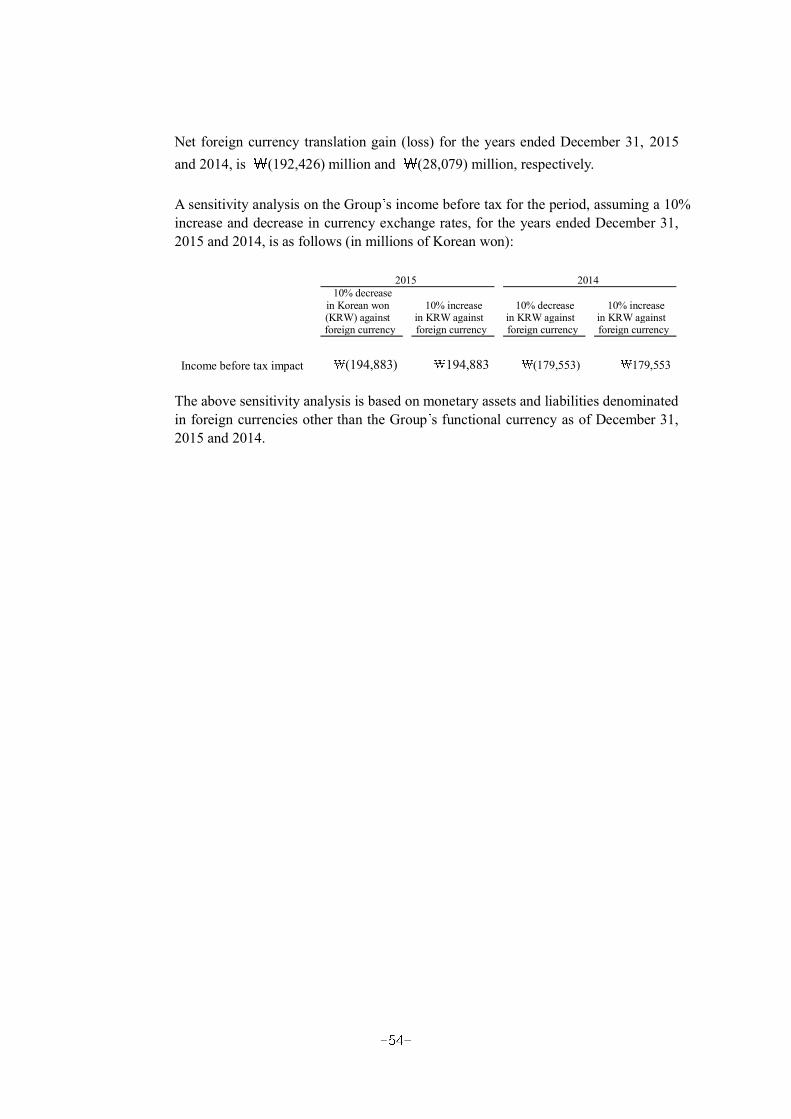
Net foreign currency translation gain (loss) for the years ended December 31, 2015and 2014, is (192,426) million and (28,079) million, respectively.
A sensitivity analysis on the Group s income before tax for the period, assuming a 10% increase and decrease in currency exchange rates, for the years ended December 31,2015 and 2014, is as follows (in millions of Korean won):
2015 201410% decrease
in Korean won (KRW) againstforeign currency
10% increase in KRW againstforeign currency
10% decrease in KRW againstforeign currency
10% increase in KRW againstforeign currency
Income before tax impact (194,883) 194,883 (179,553) 179,553
The above sensitivity analysis is based on monetary assets and liabilities denominated in foreign currencies other than the Group s functional currency as of December 31, 2015 and 2014.
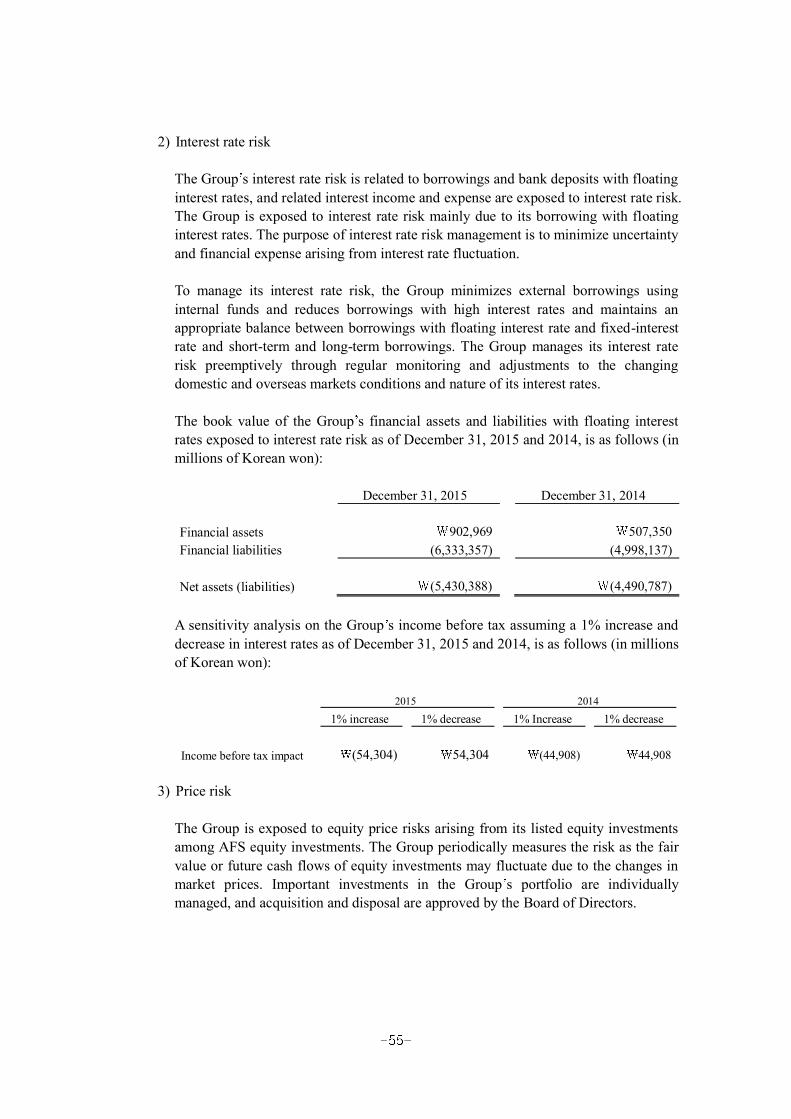
2) Interest rate risk
The Group s interest rate risk is related to borrowings and bank deposits with floating interest rates, and related interest income and expense are exposed to interest rate risk. The Group is exposed to interest rate risk mainly due to its borrowing with floating interest rates. The purpose of interest rate risk management is to minimize uncertainty and financial expense arising from interest rate fluctuation.
To manage its interest rate risk, the Group minimizes external borrowings using internal funds and reduces borrowings with high interest rates and maintains an appropriate balance between borrowings with floating interest rate and fixed-interest rate and short-term and long-term borrowings. The Group manages its interest rate risk preemptively through regular monitoring and adjustments to the changing domestic and overseas markets conditions and nature of its interest rates.
The book value of the Group s financial assets and liabilities with floating interest rates exposed to interest rate risk as of December 31, 2015 and 2014, is as follows (in millions of Korean won):
December 31, 2015 December 31, 2014
Financial assets 902,969 507,350Financial liabilities (6,333,357) (4,998,137)
Net assets (liabilities) (5,430,388) (4,490,787)
A sensitivity analysis on the Group s income before tax assuming a 1% increase and decrease in interest rates as of December 31, 2015 and 2014, is as follows (in millions of Korean won):
2015 2014
1% increase 1% decrease 1% Increase 1% decrease
Income before tax impact (54,304) 54,304 (44,908) 44,908
3) Price risk
The Group is exposed to equity price risks arising from its listed equity investments among AFS equity investments. The Group periodically measures the risk as the fair value or future cash flows of equity investments may fluctuate due to the changes in market prices. Important investments in the Group s portfolio are individually managed, and acquisition and disposal are approved by the Board of Directors.

(2) Credit risk
The credit risk refers to risk of financial losses to the Group when the counterparty defaults on the obligations of the contract. The credit risk arises from AFS financial assets, which are not equity securities, deposits in financial institution, financial derivatives and guarantee limit, as well as from the Group s normal transaction and investing activity. To manage credit risk, the Group evaluates the creditworthiness of each customer or counterparty considering the financial status, past experience and other factors. The Group establishes credit limit for each customer and counterparty.
The Group evaluates the credit worthiness using opened financial information and information provided by credit-rating institution when the Group contracts with new customers. The Group decides credit transaction limit, and is provided with collateral and guarantee based on evaluation.
Also, the Group revaluates customers credit worthiness periodically, reassesses credit transaction limit and readjust level of collateral. The Group reports the present condition of delayed collection and collection measures periodically to financial assets, which has delayed collection and takes measures by causes of delay.
A. The maximum credit risk exposure
The maximum exposure amount of credit risk of financial assets maintained by the Group and the book value for the financial assets as of December 31, 2015 and 2014,are as follows (in millions of Korean won):
December 31,2015
December 31,2014
Loans and receivables:Cash and cash equivalents 2,332,606 1,691,010Financial instruments 556,659 692,958Accounts and other receivable 4,635,536 4,584,142Deposits 258,508 309,860
Held-to-maturity financial assets 9,960 9,989
AFS financial assets 2,860 38,655
Derivative assets 90,091 66,396
Total 7,886,220 7,393,010
Apart from the above financial assets, the maximum exposure of the Group related to financial guarantee contract is the maximum amount to be paid if the guarantee will be charged (see Note 32).

B. The Group 5 and 2014, is as follows (in millions of Korean won):
December 31, 2015
Individuallyassessed
receivables
Receivables assessed for impairment on a collective basis
Within due 0 3 months 3 6 months 6 12 monthsMore than 12 months Total
Trade receivables 2,853,500 1,245,653 155,022 67,179 68,725 293,506 4,683,585
Other receivables and loans 2,118,576 100,537 28,147 491 5,482 52,634 2,305,867
Accrued income 134,842 14,649 - - - - 149,491
Total 5,106,918 1,360,839 183,169 67,670 74,207 346,140 7,138,943
December 31, 2014
Individuallyassessed
receivables
Receivables assessed for impairment on a collective basis
Within due 0 3 months 3 6 months 6 12 monthsMore than 12 months Total
Trade receivables 2,881,883 1,125,441 167,423 58,991 48,366 58,741 4,340,845
Other receivables and loans 1,817,497 79,962 28,966 2,337 1,575 117,842 2,048,179
Accrued income 111,260 6,530 - - - - 117,790
Total 4,810,640 1,211,933 196,389 61,328 49,941 176,583 6,506,814
An allowance for above individually impaired receivables as of December 31, 2015 and 2014, is 2,405,786 million and 1,844,895 million, respectively.

Among individually assessed receivables, receivables not impaired are as follows (in millions of Korean won):
December 31, 2015
0 3 months 3 6 months 6 12 monthsMore than 12
months Total
Trade receivables 300,745 67,529 4,742 109,480 482,496
Other receivable and loans 346,523 15,808 14,180 181,098 557,609
Accrued income 124,546 - - 390 124,936
Total 771,814 83,337 18,922 290,968 1,165,041
December 31, 2014
0 3 months 3 6 months 6 12 monthsMore than 12
months Total
Trade receivables 259,783 57,908 45,359 226,027 589,077
Other receivable and loans 152,322 18,002 13,098 218,842 402,264
Accrued income 1,841 576 906 19,766 23,089
Total 413,946 76,486 59,363 464,635 1,014,430
An allowance account is recognized by applying appropriate allowance rate for receivables that can be assessed to be impaired individually due to insolvency, bankruptcy and others. Group of financial assets that are not individually significant and have similar credit risk characteristics is assessed for impairment on a collective basis. An allowance account is recognized based on aging analysis and the Group s past experience of receivables collection.
AFS financial assets, held-to-maturity financial assets, deposits in financial institutions and derivative instruments are individually assessed to be impaired.

(3) Liquidity risk
Liquidity risk is the risk that the Group will encounter difficulty in meeting its financial liability obligations related to financing its operation. The Group forecasts cash flows from operating, investing and financing activities through a cash flow budget.
A summary of the Group s non-derivative liabilities maturity as of December 31, 2015 and 2014, is as follows (in millions of Korean won):
December 31, 2015
Bookvalue
Nominal cash flows according to contract
TotalLess than
1 year1 year 2
years 2 5 yearsMore than
5 years
Financial liabilities 18,397,848 18,447,939 11,347,582 2,625,728 2,623,055 1,851,574
Interest on financial liabilities - 955,989 377,693 207,287 337,429 33,580
Total 18,397,848 19,403,928 11,725,275 2,833,015 2,960,484 1,885,154
December 31, 2014
Bookvalue
Nominal cash flows according to contract
TotalLess than
1 year1 year 2
years 2 5 yearsMore than
5 years
Financial liabilities 17,581,429 17,697,492 9,793,400 3,097,743 3,025,557 1,780,792
Interest on financial liabilities - 1,216,125 491,408 257,430 355,944 111,343
Total 17,581,429 18,913,617 10,284,808 3,355,173 3,381,501 1,892,135
The above-mentioned maturity analysis is based on undiscounted cash flow according to the contract, which is different from non-derivative liabilities in the consolidated statements of financial position.
Apart from the above non-derivative liabilities, as of December 31, 2015, financial guarantee contract liabilities of the Group are explained in Note 32.

(4) Capital risk
The Group performs capital risk management to maintain its ability to continuously provide profits to shareholders and parties in interest, and to maintain optimum capital structure to reduce capital expenses.
The Group manages its capital structure through dividend payments to shareholders, returns capital to shareholders and issues new shares and sells its assets for debt reduction. Debt-to-equity ratio calculated as total liabilities divided by equity is used as an index to manage the Group s capital similar to overall industry practice.
Debt-to-equity ratios as of December 31, 2015 and 2014, are as follows (in millions of Korean won):
December 31, 2015 December 31, 2014
Total liabilities 23,162,785 22,466,959Total equity 8,393,526 8,902,341
Debt-to-equity ratio 275.96% 252.37%

5. RESTRICTED FINANCIAL ASSETS:
Details of restricted financial assets as of December 31, 2015 and 2014, are as follows (in millions of Korean won):
December 31, 2015
December 31, 2014 Description
Cash and cash equivalents16,813 30,686 and others
Short-term financial instruments357,627 438,981
National project (*1), establish the right of pledge and others
Long-term financial instruments 2,207 56,884 Bank transaction depositsDeposits 584 - Establish the right of pledge
Total 377,231 526,551
(*1) It can be used only for the purpose for implementing the national policy research and development specific issues.

6. INVESTMENT SECURITIES:
(1) Investment securities as of December 31, 2015 and 2014, are summarized as follows (in millions of Korean won):
TypeDecember 31,
2015December 31,
2014
Current:AFS financial assets Beneficiary certificate and others 441 38,385
Non-Current:AFS financial assets Investments and others 573,809 383,376Held-to-maturity financial assets Debt securities and others 9,960 9,989Sub total 583,769 393,365
Total 584,210 431,750
Investment securities are measured at cost or fair value depending on the presence or absence of market prices being advertised in an active market.
(2) Investment securities as of December 31, 2015 and 2014, are summarized as follows (in millions of Korean won):
December 31, 2015
December 31,2014
AFS financial assets:Investments in listed companies
(Korea Aerospace Industries, Ltd. and others) 381,475 194,800
Investments in non-listed companies (Korea Defense Industry Association and others) 189,915 188,306
Beneficiary certificate (Nicolas Correa S.A. and others) 2,790 35,705Trust instrument (ABCP) - 2,943Debt securities (government and public bonds) 70 7
Subtotal 574,250 421,761
Held-to-maturity financial assets:Government and public bonds - 9Debt securities 9,960 9,980
Subtotal 9,960 9,989
Total 584,210 431,750

(3) Changes in unrealized gain on AFS financial assets for the years ended December 31, 2015 and 2014, are as follows (in millions of Korean won):
Year ended December 31, 2015January 1,
2015 ValuationReclassification from equity to profit or loss
December 31, 2015
Investments in listed companies 115,914 185,597 - 301,511Investments in non-listed companies 9,858 60 (2,191) 7,727Debt securities (30,947) (45,059) 108 (75,898)Tax effect (13,218) 860 (9,985) (22,343)Consolidation adjustment
Total 81,607 141,458 (12,068) 210,997
Year ended December 31, 2014January 1,
2014 ValuationReclassification from equity to profit or loss
December 31, 2014
Investments in listed companies 64,104 52,577 (767) 115,914Investments in non-listed companies 7,788 2,070 - 9,858Debt securities 70 - (70) -Tax effect (17,938) (13,174) 165 (30,947)Consolidation adjustment (12,214) (1,046) 42 (13,218)
Total 41,810 40,427 (630) 81,607

7. TRADE AND OTHER RECEIVABLES:
(1) Trade and other receivables as of December 31, 2015 and 2014, consist of the following (in millions of Korean won):
December 31, 2015 December 31, 2014
Gross
Present value
discount
Allowance for doubtful accounts
Bookvalue Gross
Present value
discount
Allowance for doubtful accounts
Bookvalue
Current:Trade receivables 4,677,458 (11,036) (1,830,994) 2,835,428 4,333,957 (8,901) (1,510,276) 2,814,780Other receivables 613,172 - (151,778) 461,394 493,880 - (124,060) 369,820Accrued income 149,491 - (30,239) 119,252 117,790 - (1,910) 115,880Loans 308,362 - (125,088) 183,274 560,445 - (16,210) 544,235
Total 5,748,483 (11,036) (2,138,099) 3,599,348 5,506,072 (8,901) (1,652,456) 3,844,715
Non-Current:
Trade receivables 6,127 - (258) 5,869 6,888 - (261) 6,627Other receivables 6,723 (2,480) (3,910) 333 9,204 (3,203) (35) 5,966Loans 1,377,610 (171) (347,453) 1,029,986 984,650 (283) (257,533) 726,834
Total 1,390,460 (2,651) (351,621) 1,036,188 1,000,742 (3,486) (257,829) 739,427
(2) The changes in allowance for doubtful accounts for the year ended December 31, 2015, are as follows (in millions of Korean won):
Year ended December 31, 2015January 1,
2015 Increase Written off Others (*)December 31,
2015Current:
Trade receivables 1,510,276 280,997 (153,871) 193,592 1,830,994Other receivables 124,060 47,238 (19,289) (231) 151,778Accrued income 1,910 28,329 - - 30,239Loans 16,210 95,976 - 12,902 125,088
Non-Current:
Trade receivables 261 (3) - - 258Other receivables 35 3,875 - - 3,910Loans 257,533 102,623 (503) (12,200) 347,453
Total 1,910,285 559,035 (173,663) 194,063 2,489,720
(*) The variation due to reclassification between non-current and current asset orexchange rate differences, business combination and others
Bad debt expense to impaired trade receivables is included in selling, general and administrative expenses, and bad debt expense to impaired other receivables is included in other non-operating expenses in the consolidated statements of income.

8. INVENTORIES:
Inventories as of December 31, 2015 and 2014, are summarized as follows (in millions of Korean won):
December 31, 2015 December 31, 2014
Acquisition cost
Valuation allowance Book value
Acquisition cost
Valuation allowance Book value
Merchandise 543,914 (36,340) 507,574 482,776 (30,601) 452,175
Finished goods 608,314 (54,357) 553,957 658,762 (52,603) 606,159
Work in progress 653,364 (26,457) 626,907 612,697 (17,822) 594,875
Raw materials 841,413 (66,935) 774,478 843,831 (77,058) 766,773
Materials in transit 217,445 - 217,445 399,117 - 399,117
Stores 30,858 (288) 30,570 27,159 (346) 26,813
Land 41,099 - 41,099 - - -
Others 288 - 288 3,268 - 3,268
Total 2,936,695 (184,377) 2,752,318 3,027,610 (178,430) 2,849,180
Losses (reversals) on inventory valuation charged to the cost of sales amounted to 5,947million and 19,734 million for the years ended December 31, 2015 and 2014,respectively.

9. DERIVATIVES:
Details of gain and loss on valuation of derivatives as of December 31, 2015 and 2014, are as follows (in thousands of foreign currencies and millions of Korean won):
December 31, 2015
Buy Sell
Assets(liabilities)
Gains(losses)
Other comprehensive income (loss)
(*1)
Firm commitment
assets (liabilities)Currency Amount Currency Amount
Foreign currency forwards:KRW 6,695,349 USD 5,980,087 (308,889) (256,150) (32,327) 135,560KRW 243,056 EUR 188,144 (222) 1,130 1,502 (499)KRW 264,367 JPY 24,465,534 6,288 (7,848) 60 (3,885)USD 2,307,415 KRW 2,603,838 82,276 78,393 43,787 (19,061)EUR 415,594 KRW 557,771 (16,071) (5,301) (4,998) 5,112JPY 29,201,574 KRW 337,724 (35,143) 2,295 (8,735) (19)GBP and others EUR and others 3,885 (20,542) (5,951) (687)
Subtotal (267,876) (208,023) (6,662) 116,521
Interest rate swap:
KRW 5,000, 3.15%KRW 5,000,
MOR 3M+1.60% (19) (21) - -
Foreign currency long-term debt: (*2) KRW 210,710 USD 200,000 - - - 23,690
Embedded derivatives (*3) (447) 39,412 - -Put back options (*4) (6,800) (6,955) - -Others (72) - 1,173 -
Total (275,214) (175,587) (5,489) 140,211
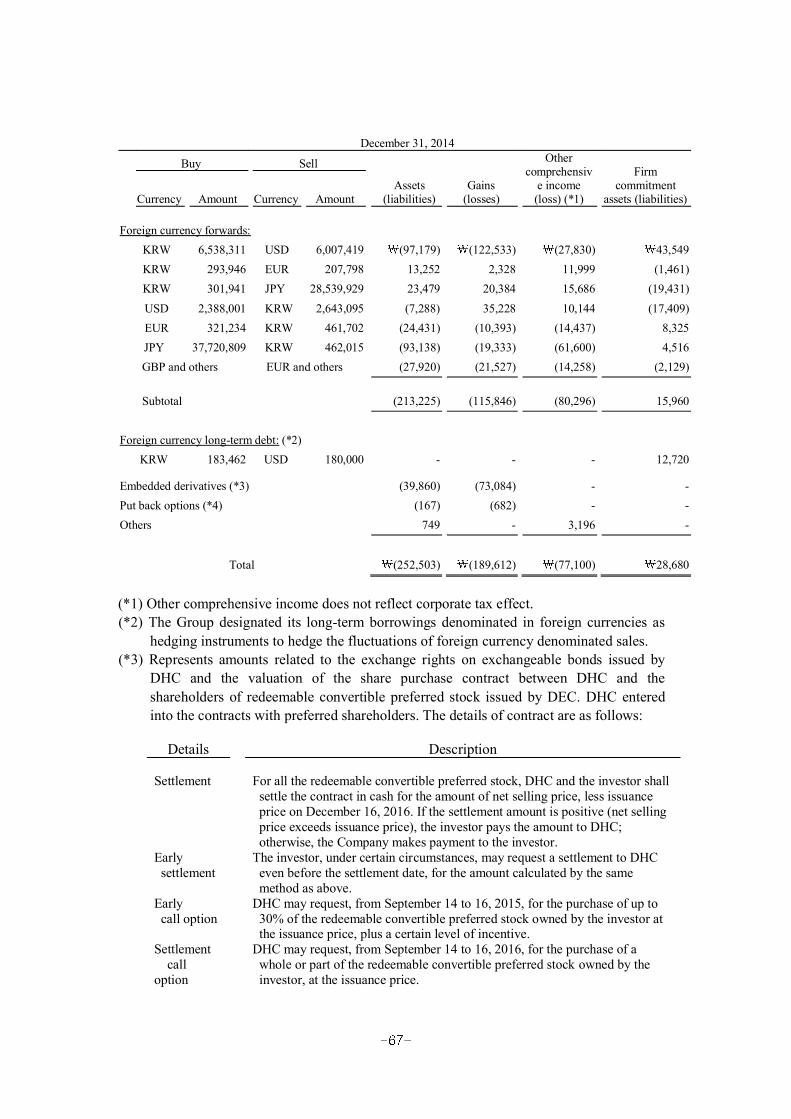
December 31, 2014
Buy Sell
Assets(liabilities)
Gains(losses)
Other comprehensiv
e income (loss) (*1)
Firm commitment
assets (liabilities)Currency Amount Currency Amount
Foreign currency forwards:KRW 6,538,311 USD 6,007,419 (97,179) (122,533) (27,830) 43,549 KRW 293,946 EUR 207,798 13,252 2,328 11,999 (1,461)KRW 301,941 JPY 28,539,929 23,479 20,384 15,686 (19,431)USD 2,388,001 KRW 2,643,095 (7,288) 35,228 10,144 (17,409)EUR 321,234 KRW 461,702 (24,431) (10,393) (14,437) 8,325 JPY 37,720,809 KRW 462,015 (93,138) (19,333) (61,600) 4,516 GBP and others EUR and others (27,920) (21,527) (14,258) (2,129)
Subtotal (213,225) (115,846) (80,296) 15,960
Foreign currency long-term debt: (*2)KRW 183,462 USD 180,000 - - - 12,720
Embedded derivatives (*3) (39,860) (73,084) - -Put back options (*4) (167) (682) - -Others 749 - 3,196 -
Total (252,503) (189,612) (77,100) 28,680
(*1) Other comprehensive income does not reflect corporate tax effect. (*2) The Group designated its long-term borrowings denominated in foreign currencies as
hedging instruments to hedge the fluctuations of foreign currency denominated sales. (*3) Represents amounts related to the exchange rights on exchangeable bonds issued by
DHC and the valuation of the share purchase contract between DHC and the shareholders of redeemable convertible preferred stock issued by DEC. DHC entered into the contracts with preferred shareholders. The details of contract are as follows:
Details Description
Settlement For all the redeemable convertible preferred stock, DHC and the investor shall settle the contract in cash for the amount of net selling price, less issuance price on December 16, 2016. If the settlement amount is positive (net selling price exceeds issuance price), the investor pays the amount to DHC; otherwise, the Company makes payment to the investor.
Early settlement
The investor, under certain circumstances, may request a settlement to DHC even before the settlement date, for the amount calculated by the same method as above.
Earlycall option
DHC may request, from September 14 to 16, 2015, for the purchase of up to 30% of the redeemable convertible preferred stock owned by the investor at the issuance price, plus a certain level of incentive.
Settlement call
option
DHC may request, from September 14 to 16, 2016, for the purchase of a whole or part of the redeemable convertible preferred stock owned by the investor, at the issuance price.

(*4) DEC, a subsidiary, participated in SOC projects and other infrastructure projects, including Shinbundang Line, Shinbundang extension Line, Daegu 4th beltway, Masan Sewer Pipeline BTL, Suwon-Gwangmyeong Road, Gwanggyo Power Center, etc. as a construction investor. To invite financial investors, DEC entered into a put option contract ( 32,000 million). DEC classified the contract as financial derivatives andrecognized the fluctuation of option value as loss on valuation of derivatives and derivatives liabilities.
10. FINANCIAL INSTRUMENTS:
(1) Categories of financial instruments as of December 31, 2015 and 2014, are as follows (in millions of Korean won):
December 31, 2015
Financial assets at FVTPL
Loans and receivables
AFSfinancial
assets
Held-to-maturity financial
assets
Derivatives designated as
hedging instruments Book value Fair value
Cash and cash equivalents - 2,332,606 - - - 2,332,606 2,332,606
Financial instruments - 556,659 - - - 556,659 556,659
Investment securities - - 574,250 9,960 - 584,210 584,210
Trade and other
receivables -
4,635,536 - - - 4,635,536 4,635,536
Derivative assets 36,793 - - - 53,298 90,091 90,091
Deposits - 258,508 - - - 258,508 258,508
Total 36,793 7,783,309 574,250 9,960 53,298 8,457,610 8,457,610
December 31, 2015
Financial liabilities at
FVTPL
Financial liabilities
at amortized cost
Derivatives designated as
hedging instruments
Financial guarantee contract Book value Fair value
Trade and other payables - 4,191,308 - 22,701 4,214,009 4,214,009
Borrowings and bonds - 14,206,540 - - 14,206,540 14,206,540
Derivative liabilities 36,570 - 328,736 - 365,306 365,306
Total 36,570 18,397,848 328,736 22,701 18,785,855 18,785,855

December 31, 2014
Financial assets at FVTPL
Loans and receivables
AFSfinancial
assets
Held-to-maturity financial
assets
Derivatives designated as
hedging instruments Book value Fair value
Cash and cash equivalents - 1,691,010 - - - 1,691,010 1,691,010
Financial instruments - 692,958 - - - 692,958 692,958
Investment securities - - 421,761 9,989 - 431,750 431,750
Trade and other
receivables - 4,584,142 - - - 4,584,142 4,584,142
Derivative assets 12,102 - - - 54,294 66,396 66,396
Deposits - 309,860 - - - 309,860 309,860
Total 12,102 7,277,970 421,761 9,989 54,294 7,776,116 7,776,116
December 31, 2014
Financial liabilities at
FVTPL
Financial liabilities
at amortized cost
Derivatives designated as
hedging instruments
Financial guarantee contract Book value Fair value
Trade and other payables - 4,498,291 - 220,322 4,718,613 4,718,613
Borrowings and bonds - 13,083,138 - - 13,083,138 13,083,138
Derivative liabilities 69,544 - 249,355 - 318,899 318,899
Total 69,544 17,581,429 249,355 220,322 18,120,650 18,120,650

(2) Fair value measurements of financial instruments by fair value hierarchy levels as of December 31, 2015 and 2014, are as follows (in millions of Korean won):
December 31, 2015Level 1 Level 2 Level 3 Total
Financial assets:Financial assets at FVTPL - 36,793 - 36,793
AFS financial assets 383,707 - 126,448 510,155
Derivatives designated as hedging instruments
- 53,298 - 53,298
Total 383,707 90,091 126,448 600,246
Financial liabilities:Financial liabilities at FVTPL - (36,570) - (36,570)
Derivatives designated as hedging instruments
- (328,736) - (328,736)
Total - (365,306) - (365,306)
December 31, 2014Level 1 Level 2 Level 3 Total
Financial assets:Financial assets at FVTPL - 12,102 - 12,102AFS financial assets 195,085 - 130,721 325,806
Derivatives designated as hedging instruments - 54,294 - 54,294
Total 195,085 66,396 130,721 392,202
Financial liabilities:Financial liabilities at FVTPL - (69,544) - (69,544)
Derivatives designated as hedging instruments - (249,355) - (249,355)
Total - (318,899) - (318,899)

The above table does not include information for financial instruments, which are not measured at fair value because the book value approximates the fair value.
The Group uses the following hierarchy for determining and disclosing the fair value of financial instruments by valuation technique. The level of hierarchy of fair value is as follows:
Level 1: Unadjusted quoted prices in active markets for identical assets or liabilitiesLevel 2: Inputs other than quoted prices that are observable for the asset or liability,
either directly or indirectlyLevel 3: Inputs that are not based on observable market data (unobservable inputs)
The fair value of financial instruments traded in active markets is based on quoted market prices at the dates of the consolidated statements of financial position. These instruments are included in Level 1. Instruments included in Level 1 comprise primarily listed equity investments classified as trading securities or AFS securities.
The fair value of financial instruments that are not traded in an active market (for example, over-the-counter derivatives) is determined by using valuation techniques. These valuation techniques maximize the use of observable market data where it is available and rely as little as possible on entity-specific estimates. If all significant inputs required for fair value of an instrument are observable, the instrument is included in Level 2.
If one or more of the significant inputs is not based on observable market data, the instrument is included in Level 3.
(3) Valuation techniques and inputs used for derivatives designated as hedging instruments (Level 2) are as follows:
Valuation technique Observable inputs Explanation of input parameters
Discounted cash flow method
a. Forward exchange rate It is based on forward exchange rate, disclosed on the market that remaining period is the same until maturity of forward contracts. If the forward exchange rate is not disclosed on the market, it is calculated by using interpolation method.
b. Discount rate It is determined by using yield curve that is disclosed at the end of the reporting period.

(4) Assumptions used in the fair value of AFS financial assets that have been rated as Level 3 out of AFS financial assets measured at fair value as of December 31, 2015, are as follows:
AFS assets Evaluation Discount rateChanges of inputs
and others
Incheon-Kimpo expressway Co, Ltd.and others
Past transaction modeland others
- Amount of recent capital increase
Daegu South Circulation Road Corporation and others
Dividend discount modeland others
7.00% 14.00% Expected dividend cash flows
Construction Guarantee Free cash flow to equity model
10.00% Free cash flow to Equity
Others Net asset value assessment and others
- Fair value ofnet assets and
others
Changes in the carrying amount of AFS financial assets that have been rated as Level 3 of fair value hierarchy for the years ended December 31, 2015and 2014, are as follows (in millions of Korea won):
Year January 1 Acquisition DisposalProfitor loss
Other comprehensive
income Others(*) December 31
2015 130,721 7,141 (11,553) - 60 79 126,4482014 122,961 7,091 (1,401) - 2,070 - 130,721
(*) Changes due to business combination, changes in exchange rate and others.

(5) Profit and loss by categories of financial instruments for the years ended December 31, 2015 and 2014, are as follows (in millions of Korean won):
2015Profit or loss
Other comprehensive
income (*)Financial guarantee
Impairment and reversal
Interest Dividend Provision Others Disposal
Financial assets:Loans and receivables 47,732 - - (559,035) - (14,859) -
AFS financial assets 943 3,089 - - (709) 18,667 183,466Held-to-maturity investments 687 - - - (68) - -
Total 49,362 3,089 - (559,035) (777) 3,808 183,466
Financial liabilities:
Financial liabilities at amortized cost (695,217) - (20,104) - - (1,587) -
2014Profit or loss
Other comprehensive
income (*)Financial guarantee
Impairment and reversal
Interest Dividend Provision Others Disposal
Financial assets:Loans and receivables 60,817 - - (170,817) - (24,949) -AFS financial assets 3,815 1,754 - - (7,285) 9,907 53,810 Held-to-maturity investments 435 - - - (21) - -
Total 65,067 1,754 - (170,817) (7,306) (15,042) 53,810
Financial liabilities:
Financial liabilities at amortized cost (709,849) - (91,848) - - (38,360) -

Apart from the above financial instruments, other comprehensive income (loss) by derivatives for the years ended December 31, 2015 and 2014, is as follows (in millions of Korean won):
2015 2014
Profit or loss Other comprehensive
income(*)
Profit or loss Other comprehensive
income(*)Valuation Disposal Valuation Disposal
Derivative instrument not designated as a hedge 64,757 8,858 - (70,784) 18,645 -
Derivative instrument designated as a fair value hedge (232,199) (18,466) - (76,100) 3,688 -
Derivatives designated as a cash flow hedge (8,145) 28,982 71,611 (42,728) (20,948) (7,802)
Total (175,587) 19,374 71,611 (189,612) 1,385 (7,802)
(*) Other comprehensive income does not reflect corporate tax effect.
Differences arising from foreign currency transactions (in terms of foreign currency transactions gains and income) are mostly occurred in financial assets classified as loans and receivables and financial liabilities measured in amortized cost.

(6) Financial assets and liabilities subject to an enforceable master netting arrangement or similar agreement as of December 31, 2015 and 2014, are as follows (in millions of Korea won):
December 31, 2015Before enforceable
master nettingEnforceable master
nettingAfter enforceable
master netting
Financial assets:Trade receivables 14,642 (6,728) 7,914
Other receivables 1,306 (230) 1,076
Derivative assets 110,893 (46,598) 64,295
Total 126,841 (53,556) 73,285
Financial liabilities:Trade payables 32,319 (4,883) 27,436
Other payables 14,195 (2,075) 12,120Derivative liabilities 312,164 (46,598) 265,566
Long-term borrowings - - -
Total 358,678 (53,556) 305,122
December 31, 2014Before enforceable
master nettingEnforceable master
nettingAfter enforceable
master netting
Financial assets:Trade receivables 18,894 (6,084) 12,810Other receivables 893 (793) 100 Derivative assets 92,746 (51,699) 41,047
Total 112,533 (58,576) 53,957
Financial liabilities:Trade payables 55,815 (5,460) 50,355Other payables 11,030 (1,417) 9,613Derivative liabilities 235,709 (51,699) 184,010Long-term borrowings 50,000 (50,000) -
Total 352,554 (108,576) 243,978
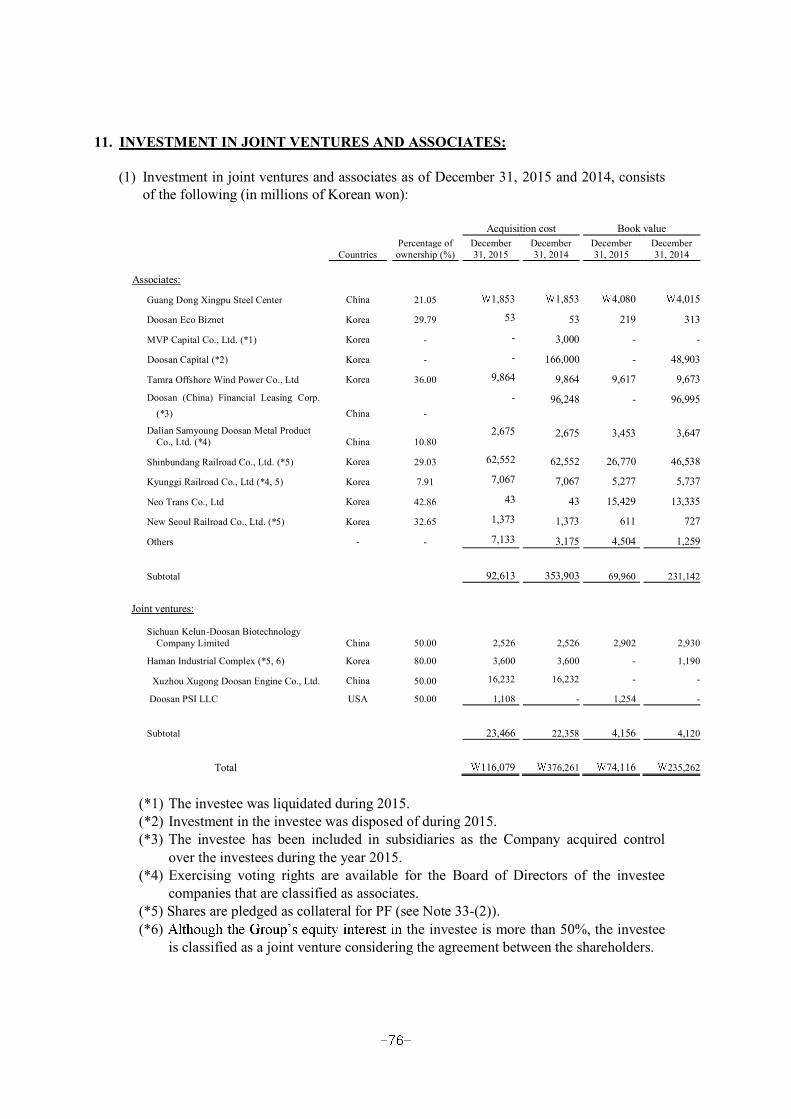
11. INVESTMENT IN JOINT VENTURES AND ASSOCIATES:
(1) Investment in joint ventures and associates as of December 31, 2015 and 2014, consists of the following (in millions of Korean won):
Percentage of ownership (%)
Acquisition cost Book value
CountriesDecember 31, 2015
December31, 2014
December31, 2015
December31, 2014
Associates:
Guang Dong Xingpu Steel Center China 21.05 1,853 1,853 4,080 4,015
Doosan Eco Biznet Korea 29.79 53 53 219 313
MVP Capital Co., Ltd. (*1) Korea - - 3,000 - -
Doosan Capital (*2) Korea - - 166,000 - 48,903
Tamra Offshore Wind Power Co., Ltd Korea 36.00 9,864 9,864 9,617 9,673
Doosan (China) Financial Leasing Corp. (*3) China -
- 96,248 - 96,995
Dalian Samyoung Doosan Metal Product Co., Ltd. (*4) China 10.80
2,675 2,675 3,453 3,647
Shinbundang Railroad Co., Ltd. (*5) Korea 29.03 62,552 62,552 26,770 46,538
Kyunggi Railroad Co., Ltd (*4, 5) Korea 7.91 7,067 7,067 5,277 5,737
Neo Trans Co., Ltd Korea 42.86 43 43 15,429 13,335
New Seoul Railroad Co., Ltd. (*5) Korea 32.65 1,373 1,373 611 727
Others - - 7,133 3,175 4,504 1,259
Subtotal 92,613 353,903 69,960 231,142
Joint ventures:
Sichuan Kelun-Doosan Biotechnology Company Limited China 50.00 2,526 2,526 2,902 2,930
Haman Industrial Complex (*5, 6) Korea 80.00 3,600 3,600 - 1,190
Xuzhou Xugong Doosan Engine Co., Ltd. China 50.00 16,232 16,232 - -
Doosan PSI LLC USA 50.00 1,108 - 1,254 -
Subtotal 23,466 22,358 4,156 4,120
Total 116,079 376,261 74,116 235,262
(*1) The investee was liquidated during 2015. (*2) Investment in the investee was disposed of during 2015. (*3) The investee has been included in subsidiaries as the Company acquired control
over the investees during the year 2015. (*4) Exercising voting rights are available for the Board of Directors of the investee
companies that are classified as associates. (*5) Shares are pledged as collateral for PF (see Note 33-(2)). (*6) the investee is more than 50%, the investee
is classified as a joint venture considering the agreement between the shareholders.

(2) Changes in investment in joint ventures and associates for the years ended December 31, 2015 and 2014, consist of the following (in millions of Korean won):
Year ended December 31, 2015
January 1, 2015
Acquisition(disposal) Dividends
Share of profit (loss)
Increase (decrease)
in equity of associates Other (*)
December 31, 2015
Associates:
Guang Dong Xingpu Steel Center 4,015 - - 27 38 - 4,080
Doosan Eco Biznet 313 - - (94) - - 219
Doosan Capital 48,903 (6,613) - (42,390) 100 - -
Tamra Offshore Wind Power Co., Ltd 9,673 - - (56) - - 9,617
Doosan(China) Financial Leasing Corp. 96,995 - - (19,137) - (77,858) -
Dalian Samyoung Doosan Metal Product Co., Ltd.
3,647 - - (230) 36 - 3,453
Shinbundang Railroad Co., Ltd. 46,538 - - (19,768) - - 26,770
Kyunggi Railroad Co., Ltd. 5,737 - - (460) - - 5,277
Neo Trans Co., Ltd 13,335 - - 2,094 - - 15,429
New Seoul Railroad Co., Ltd. 727 - - (116) - - 611
Others 1,259 - (45) 2,627 177 486 4,504
Subtotal 231,142 (6,613) (45) (77,503) 351 (77,372) 69,960
Joint ventures:
Sichuan Kelun-Doosan Biotechnology Company Limited 2,930 - (988) 924 36 - 2,902
Haman Industrial Complex 1,190 - - (1,190) - - -
Doosan PSI LLC - 1,108 - 80 - 66 1,254
Subtotal 4,120 1,108 (988) (186) 36 66 4,156
Total 235,262 (5,505) (1,033) (77,689) 387 (77,306) 74,116
(*1) Others include impacts on changes in foreign currency exchange rate, business combination and others.

Year ended December 31, 2014
January 1, 2014
Acquisition(disposal) Dividends
Share of profit (loss)
Increase (decrease)in equity of associates Other (*)
December 31, 2014
Associates:
Guang Dong Xingpu Steel Center 4,229 - - (270) 56 - 4,015
Doosan Eco Biznet 197 - - 116 - - 313
MVP Capital Co., Ltd. - - - - - - -
Dong-A E&C Contents 17 - - (10) - (7) -
Wilus Inc. - - - 4 - (4) -
Doosan Capital 105,511 - - (57,908) 1,300 - 48,903
Tamra Offshore Wind Power Co., Ltd 9,622 - - 51 - - 9,673
Doosan(China) Financial Leasing Corp. 101,370 - - (5,790) - 1,415 96,995
Dalian Samyoung Doosan Metal Product Co., Ltd. 3,391 - - 196 60 - 3,647
Shinbundang Railroad Co., Ltd. 67,785 - - (21,247) - - 46,538
Kyunggi Railroad Co., Ltd. 4,946 18 - 773 - - 5,737
Neo Trans Co., Ltd 10,745 - - 2,590 - - 13,335
New Seoul Railroad Co., Ltd. 776 250 - (299) - - 727
Others 493 (25) (14) 1,015 - (210) 1,259
Subtotal 309,082 243 (14) (80,779) 1,416 1,194 231,142
Joint ventures:Sichuan Kelun-Doosan Biotechnology
Company Limited 2,555 - (931) 1,222 84 - 2,930
Haman Industrial Complex 2,394 - - (1,204) - - 1,190
Hanjung Power Ltd. 6,066 (6,066) (1,494) 2,767 (1,103) (170) -
Doosan Babcock WLL 290 - - - - (290) -
Subtotal 11,305 (6,066) (2,425) 2,785 (1,019) (460) 4,120
Total 320,387 (5,823) (2,439) (77,994) 397 734 235,262
(*) Changes in other equity items of investees and others.
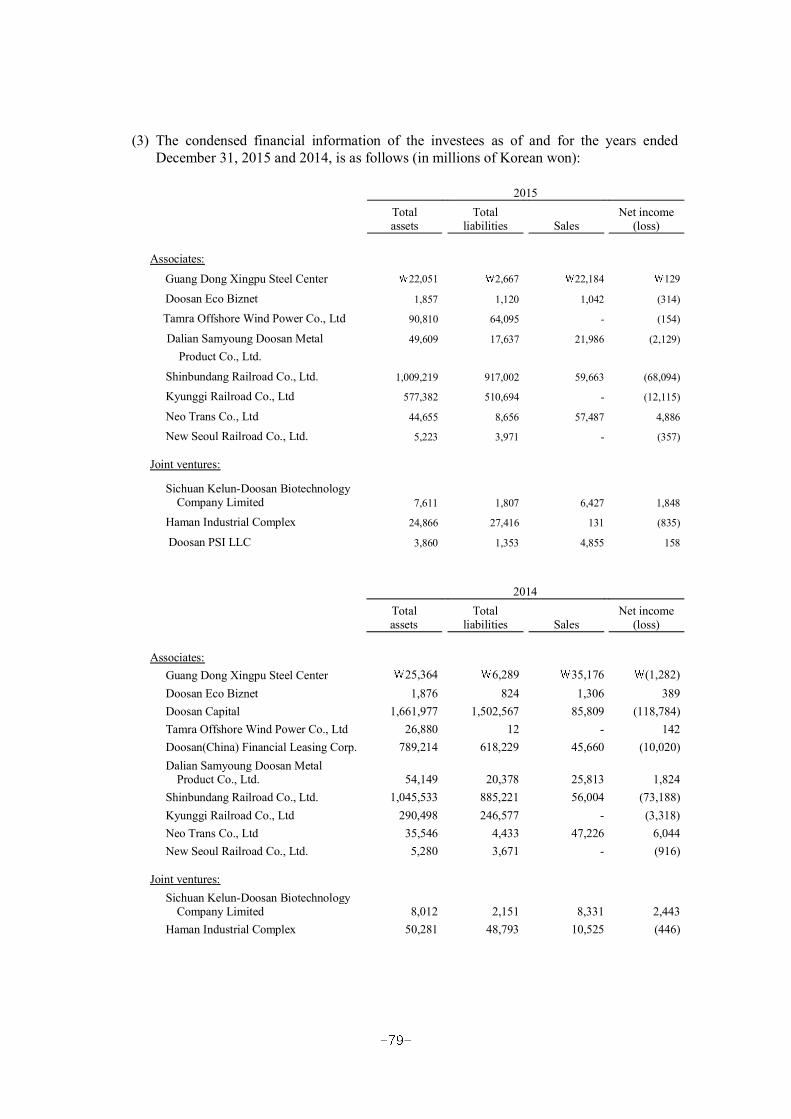
(3) The condensed financial information of the investees as of and for the years ended December 31, 2015 and 2014, is as follows (in millions of Korean won):
2015Total assets
Total liabilities Sales
Net income (loss)
Associates:
Guang Dong Xingpu Steel Center 22,051 2,667 22,184 129
Doosan Eco Biznet 1,857 1,120 1,042 (314)
Tamra Offshore Wind Power Co., Ltd 90,810 64,095 - (154)
Dalian Samyoung Doosan Metal Product Co., Ltd.
49,609 17,637 21,986 (2,129)
Shinbundang Railroad Co., Ltd. 1,009,219 917,002 59,663 (68,094)
Kyunggi Railroad Co., Ltd 577,382 510,694 - (12,115)
Neo Trans Co., Ltd 44,655 8,656 57,487 4,886
New Seoul Railroad Co., Ltd. 5,223 3,971 - (357)
Joint ventures:
Sichuan Kelun-Doosan Biotechnology Company Limited 7,611 1,807 6,427 1,848
Haman Industrial Complex 24,866 27,416 131 (835)
Doosan PSI LLC 3,860 1,353 4,855 158
2014Total assets
Total liabilities Sales
Net income (loss)
Associates:Guang Dong Xingpu Steel Center 25,364 6,289 35,176 (1,282)Doosan Eco Biznet 1,876 824 1,306 389Doosan Capital 1,661,977 1,502,567 85,809 (118,784)Tamra Offshore Wind Power Co., Ltd 26,880 12 - 142Doosan(China) Financial Leasing Corp. 789,214 618,229 45,660 (10,020)Dalian Samyoung Doosan Metal
Product Co., Ltd. 54,149 20,378 25,813 1,824Shinbundang Railroad Co., Ltd. 1,045,533 885,221 56,004 (73,188)Kyunggi Railroad Co., Ltd 290,498 246,577 - (3,318)Neo Trans Co., Ltd 35,546 4,433 47,226 6,044New Seoul Railroad Co., Ltd. 5,280 3,671 - (916)
Joint ventures:Sichuan Kelun-Doosan Biotechnology
Company Limited 8,012 2,151 8,331 2,443Haman Industrial Complex 50,281 48,793 10,525 (446)

(4) Adjustments from net assets of joint ventures and associates to carrying amount of investment in joint ventures and associates as of December 31, 2015 and 2014, are as follows (in millions of Korean won):
December 31, 2015
Adjustment amountsNet asset valueas of December
31, 2015
Percentage ofownership
(%)
Ownership of net
asset value
Removed investment
balance
Internal transactionsand others
Book value
Associates:
Guang Dong Xingpu Steel Center 19,384 21.05 4,080 - - 4,080
Doosan Eco Biznet 737 29.79 219 - - 219
Tamra Offshore Wind Power Co., Ltd 26,715 36.00 9,617 - - 9,617
Dalian Samyoung Doosan Metal Product Co., Ltd.
31,972 10.80 3,453 - - 3,453
Shinbundang Railroad Co., Ltd. 92,217 29.03 26,770 - - 26,770
Kyunggi Railroad Co., Ltd 66,688 7.91 5,277 - - 5,277
Neo Trans Co., Ltd 35,999 42.86 15,429 - - 15,429
New Seoul Railroad Co., Ltd. 1,252 32.65 409 202 - 611
Joint ventures:
Sichuan Kelun-Doosan Biotechnology
Company Limited 5,804 50.00 2,902 - - 2,902
Doosan PSI LLC 2,507 50.00 1,254 - - 1,254

December 31, 2014
Adjustment amountsNet asset valueas of December
31, 2014
Percentage ofownership
(%)
Ownership of net
asset value
Removed investment
balance
Internal transactions and others
Book value
Associates:
Guang Dong Xingpu Steel Center 19,076 21.05 4,015 - - 4,015
Doosan Eco Biznet 1,051 29.79 313 - - 313
Doosan Capital (*) 76,124 33.30 38,906 9,997 - 48,903
Tamra Offshore Wind Power Co., Ltd 26,868 36.00 9,673 - - 9,673
Doosan(China) Financial Leasing Corp. 170,985 49.00 83,783 13,212 - 96,995
Dalian Samyoung Doosan Metal Product Co., Ltd. 33,771 10.80 3,647 - - 3,647
Shinbundang Railroad Co., Ltd. 160,312 29.03 46,538 - - 46,538
Kyunggi Railroad Co., Ltd 43,921 13.06 5,736 - - 5,736
Neo Trans Co., Ltd 31,113 42.86 13,335 - - 13,335
New Seoul Railroad Co., Ltd. 1,609 32.65 525 202 - 727
Joint ventures:
Sichuan Kelun-Doosan Biotechnology Company Limited 5,861 50.00 2,930 - - 2,930
Haman Industrial Complex 1,488 80.00 1,190 - - 1,190
(*) The net asset value of Doosan Capital represents only the equity holders of the Parent, and the equity interest in the investee was calculated by adding the equity ownership percentage of preferred shares.

12. PROPERTY, PLANT AND EQUIPMENT:
(1) Changes in property, plant and equipment for the years ended December 31, 2015 and 2014, consist of the following (in millions of Korean won):
Year ended December 31, 2015
LandBuildings and
structures Machinery
Tools, furniture,fixtures and
othersConstruction in progress Total
Balance at January 1, 2015 4,907,520 1,910,384 1,210,545 331,143 223,935 8,583,527
Acquisition 26,959 13,860 51,084 82,965 272,417 447,285
Reclassification 19,379 (8,259) 133,312 21,465 (192,500) (26,603)
Disposal (1,957) (10,163) (12,646) (4,435) - (29,201)
Increase (decrease)
in revaluation 559,019 - - - - 559,019
Depreciation (43) (102,886) (243,142) (112,074) - (458,145)
Impairments (870) (77,798) (41,021) (18,267) - (137,956)
Business combination (*1) (123,449) (8,902) (5,053) 59,010 - (78,394)
Others (*2) (10,588) (4,195) (6,231) 2,112 (44,575) (63,477)
Balance at December 31, 2015 5,375,970 1,712,041 1,086,848 361,919 259,277 8,796,055
- Acquisition cost 3,595,803 2,781,534 3,430,012 1,150,046 259,277 11,216,672
- Accumulated depreciationand impairment - (1,069,493) (2,343,164) (788,127) - (4,200,784)
- Revaluation surplus 1,780,167 - - - - 1,780,167
Year ended December 31, 2014
LandBuildings and
structures Machinery
Tools, furniture,fixtures and
othersConstruction in progress Total
Balance at January 1, 2014 4,956,327 1,851,542 1,272,073 349,239 230,788 8,659,969
Acquisition 2,682 43,486 90,515 73,431 262,397 472,511
Reclassification 520 133,385 88,753 37,335 (270,664) (10,671)
Disposal (3,333) (4,074) (11,023) (1,179) (1,791) (21,400)
Depreciation (43) (101,990) (253,805) (107,401) - (463,239)
Impairments (2,224) (8,250) (1,118) (660) - (12,252)
Business combination (*1) (40,600) (829) 10,315 (15,869) 2,817 (44,166)
Others (*2) (5,809) (2,886) 14,835 (3,753) 388 2,776
Balance at December 31, 2014 4,907,520 1,910,384 1,210,545 331,143 223,935 8,583,527
- Acquisition cost 3,617,977 2,848,619 3,453,138 996,753 223,935 11,140,422
- Accumulated depreciationand impairment - (938,235) (2,242,593) (665,610) - (3,846,438)
- Revaluation surplus 1,289,543 - - - - 1,289,543

(*1) Includes merger, acquisition and disposal of subsidiaries in 2014 (see Notes 37, 38 and 39).
(*2) Effect of exchange rate differences and others.
The Group recognized the land subsequently measured at revaluation amount; and if the land were stated at cost, the land would amount to 3,595,803 million and 3,617,977million as of December 31, 2015 and 2014, respectively.
As of December 31, 2015, certain of the land and buildings are partially pledged as collateral for loans from KDB and others (see Note 33).
(2) The details of revaluation model, which the Group applies to measurement of the land are as follows:
For the year ended December 31, 2015, the Group initially measured all land assets using fair value at the date of the revaluation. As of December 31, 2015, the fair value of land assets was determined from the appraisal that was undertaken by independently qualified valuators, the First Appraisal & Consulting Co., Ltd ( FACC ) and Mirae & Saehan Appraisal Co., Ltd., on October 31, 2015.
FACC and Mirae & Saehan Appraisal Co., Ltd. are members of Korea Association of Property Appraisers and comprise of certified professionals that have a significant amount of industry experience.
(3) Fair value measurements of land assets by fair value hierarchy level as of December 31, 2015 and 2014, are as follows (in millions of Korean won):
December 31, 2015 December 31, 2014Level 1 Level 2 Level 3 Level 1 Level 2 Level 3
Property:Land - - 5,375,970 - - 4,907,520
(4) Valuation techniques and inputs used for fair value measurement of land assets (Level 3) are as follows:
Valuation technique
Significant inputs that are not based on observable market data (unobservable inputs)
Correlation between unobservable inputs and fair value arguments
Official Assessed Reference Land Price OARLP :OARLP of similar parcels nearby the subject land and reflating corrections necessary for differences between the subject and thecomparable
a. Fluctuation rate ofland price and others
Fair value increases (decreases) if rate of land price increases (decreases).
b. Parcel conditions and others
Fair value increases (decreases) if correction of parcel conditions and others increases (decreases).
c. Land conditionsaffecting the sales priceand others
Fair value increases (decreases) if correction of land conditions affecting the sales price increases (decreases).

Change in land whose degree of fair value is classified as Level 3 for the year ended December 31, 2015, is as follows (in millions of Korean won):
Revaluation
January 1, 2015 AcquisitionReclassifica
tion(*1) Disposal
Other comprehensive income Net income(*2) Others
December 31, 2013
4,907,520 26,959 (104,070) (1,957) 551,992 7,027 (11,501) 5,375,970
(*1) Includes impact on transfer to investment property and business transfer. (*2) Revaluation gain or losses recognized as profit or losses.
(5) Capitalized borrowing costs for the years ended December 31, 2015 and 2014, are asfollows (in millions of Korea won):
2015 2014
Capitalized borrowing cost 2,286 4,535Capitalization interest rate (%) 3.66~4.49% 4.32 5.63%
(6) Classification of depreciation expenses for the years ended December 31, 2015 and 2014,is as follows (in millions of Korean won):
2015 2014
Cost of sales 389,488 386,544Selling, general and administrative expenses 41,861 51,186Research and development cost 25,638 16,301Income from discontinued operations 1,158 9,208
Total 458,145 463,239
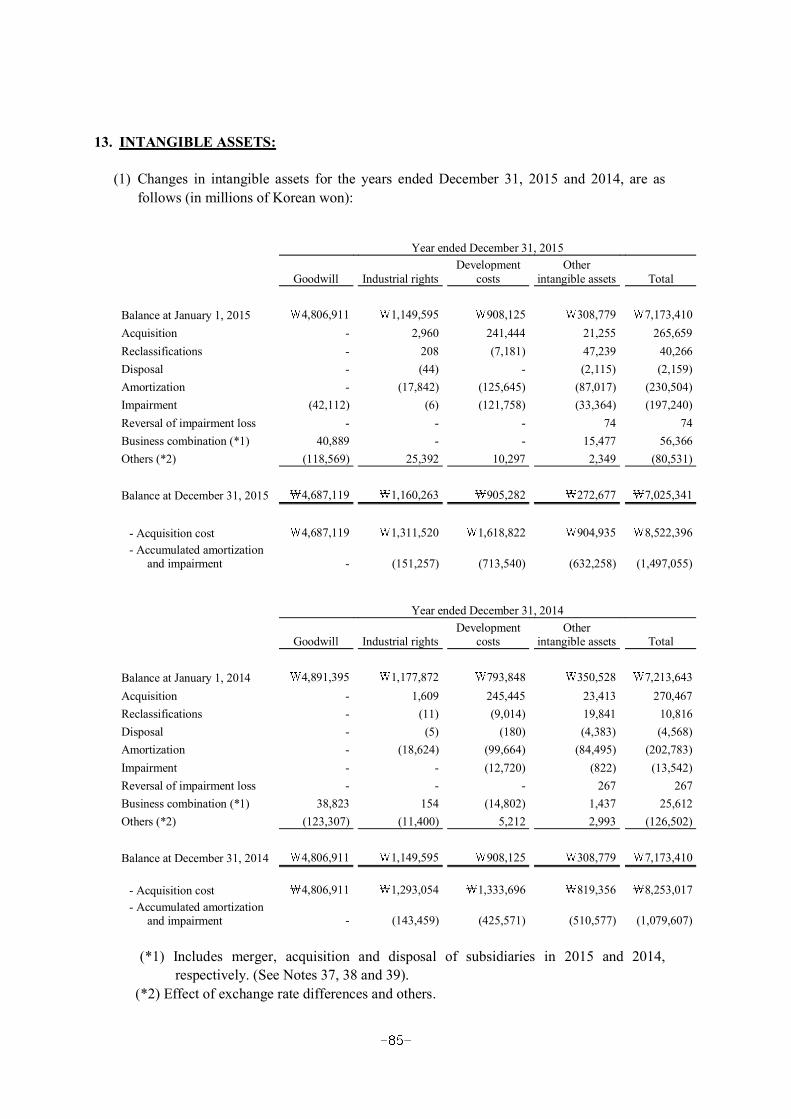
13. INTANGIBLE ASSETS:
(1) Changes in intangible assets for the years ended December 31, 2015 and 2014, are as follows (in millions of Korean won):
Year ended December 31, 2015
Goodwill Industrial rightsDevelopment
costsOther
intangible assets Total
Balance at January 1, 2015 4,806,911 1,149,595 908,125 308,779 7,173,410Acquisition - 2,960 241,444 21,255 265,659Reclassifications - 208 (7,181) 47,239 40,266Disposal - (44) - (2,115) (2,159)Amortization - (17,842) (125,645) (87,017) (230,504)Impairment (42,112) (6) (121,758) (33,364) (197,240)Reversal of impairment loss - - - 74 74Business combination (*1) 40,889 - - 15,477 56,366Others (*2) (118,569) 25,392 10,297 2,349 (80,531)
Balance at December 31, 2015 4,687,119 1,160,263 905,282 272,677 7,025,341
- Acquisition cost 4,687,119 1,311,520 1,618,822 904,935 8,522,396- Accumulated amortization
and impairment - (151,257) (713,540) (632,258) (1,497,055)
Year ended December 31, 2014
Goodwill Industrial rightsDevelopment
costsOther
intangible assets Total
Balance at January 1, 2014 4,891,395 1,177,872 793,848 350,528 7,213,643Acquisition - 1,609 245,445 23,413 270,467Reclassifications - (11) (9,014) 19,841 10,816Disposal - (5) (180) (4,383) (4,568)Amortization - (18,624) (99,664) (84,495) (202,783)Impairment - - (12,720) (822) (13,542)Reversal of impairment loss - - - 267 267Business combination (*1) 38,823 154 (14,802) 1,437 25,612Others (*2) (123,307) (11,400) 5,212 2,993 (126,502)
Balance at December 31, 2014 4,806,911 1,149,595 908,125 308,779 7,173,410
- Acquisition cost 4,806,911 1,293,054 1,333,696 819,356 8,253,017- Accumulated amortization
and impairment - (143,459) (425,571) (510,577) (1,079,607)
(*1) Includes merger, acquisition and disposal of subsidiaries in 2015 and 2014, respectively. (See Notes 37, 38 and 39).
(*2) Effect of exchange rate differences and others.

The carrying amount of membership with indefinite useful lives in other intangible assets item is 42,646 million and 44,943 million as of December 31, 2015 and 2014,respectively.
Meanwhile, expenditure on research and development, which was recognized as an expense, amounted to 359,194 million and 322,716 million for the years ended December 31, 2015 and 2014, respectively.
(2) Impairment test of goodwill
1) Goodwill has been allocated for impairment testing purposes to the following CGUs and is tested for impairment annually:
Company CGUs Description
The Parent Mottrol BG Manufacturing and sale of hydraulic components
Industrial Vehicle BG Manufacturing and sale of industrial vehicles
Fuel Cell BU Manufacturing and sale of fuel cellDHC Power Generation Manufacturing and sale of power
generation
Water Manufacturing and sale of desalination and water treatment plants
DI Construction Machinery Manufacturing and sale of construction machinery and others
DEC Construction industry Housing and infrastructure construction
Chemical engineering equipment Production of chemical industry facilities and gas industry equipment
DST Defense industry Defense industry
Oricom Inc. Advertising Advertising services
Magazine
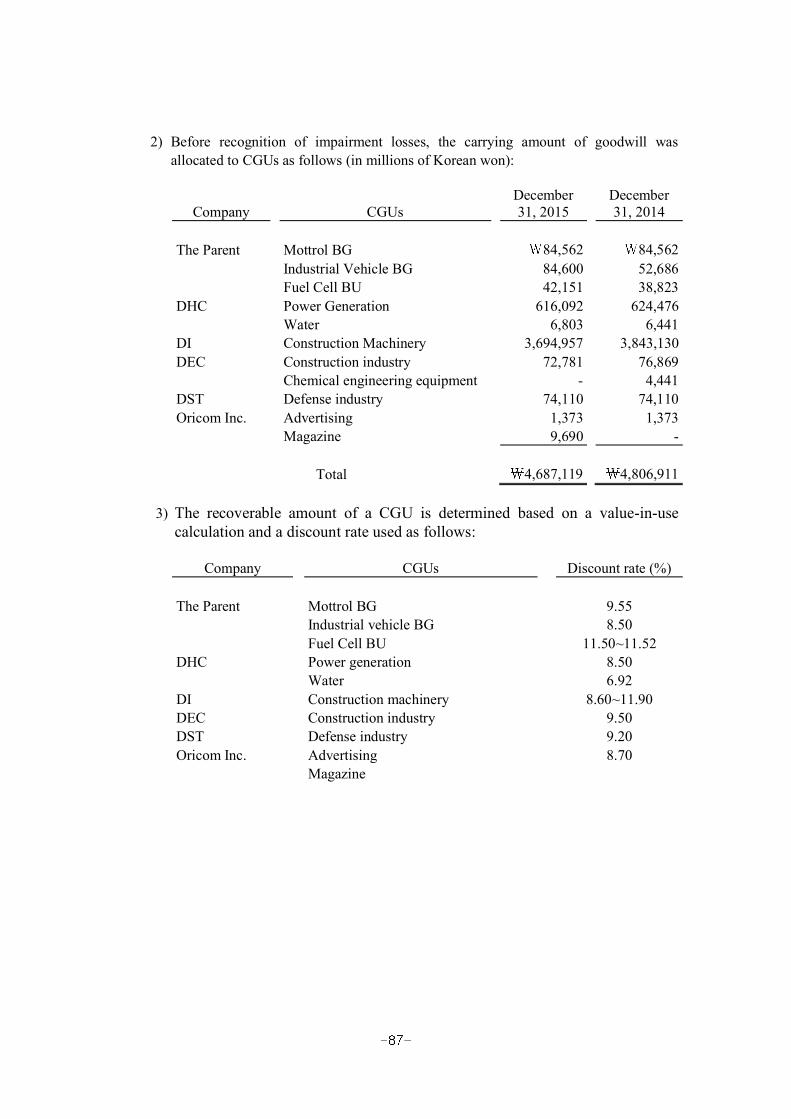
2) Before recognition of impairment losses, the carrying amount of goodwill was allocated to CGUs as follows (in millions of Korean won):
Company CGUsDecember 31, 2015
December 31, 2014
The Parent Mottrol BG 84,562 84,562Industrial Vehicle BG 84,600 52,686Fuel Cell BU 42,151 38,823
DHC Power Generation 616,092 624,476Water 6,803 6,441
DI Construction Machinery 3,694,957 3,843,130DEC Construction industry 72,781 76,869
Chemical engineering equipment - 4,441DST Defense industry 74,110 74,110Oricom Inc. Advertising 1,373 1,373
Magazine 9,690 -
Total 4,687,119 4,806,911
3) The recoverable amount of a CGU is determined based on a value-in-use calculation and a discount rate used as follows:
Company CGUs Discount rate (%)
The Parent Mottrol BG 9.55Industrial vehicle BG 8.50Fuel Cell BU 11.50~11.52
DHC Power generation 8.50Water 6.92
DI Construction machinery 8.60~11.90DEC Construction industry 9.50DST Defense industry 9.20Oricom Inc. Advertising 8.70
Magazine

The Group uses cash flow projections based on financial budgets approved by the directors covering five-year periods for a value-in-use calculation. The financial budgets are determined based on historical result and expectation of market growth. Cash flows beyond that five-year periods have been extrapolated using a 0% 3%growth rate, continuing the fifth year cash flow. The growth rate does not exceed long-term average growth rate of market, and the discount rates used reflect relevant risks specific to the CGUs.
The result of recoverable amount of the Group calculated based on value-in-use calculation was not to cause the aggregate carrying amount to exceed the aggregate recoverable amount of the CGU. The result of recoverable amount the Company calculated based on value-in-use calculation was to cause the aggregate carrying amount to exceed the aggregate recoverable amount of DI and DEC. Therefore, impairment loss is recognized in the amount of 42,112 million based on the impairment test for the year ended December 31, 2015.The recoverable amount may change according to changes in key assumptions.
industrial trends.
(3) Capitalized borrowing costs for the years ended December 31, 2015 and 2014, are as follows (in millions of Korea won):
2015 2014
Capitalized borrowing cost 9,051 9,574Capitalization interest rate (%) 3.88 ~ 4.49% 4.32 4.59%
(4) Classification of amortization expense for the years ended December 31, 2015 and 2014,is as follows (in millions of Korean won):
2015 2014
Cost of sales 138,288 107,826Selling, general and administrative expenses 91,181 87,236Research and development cost 905 468Income from discontinued operations 130 7,253
Total 230,504 202,783
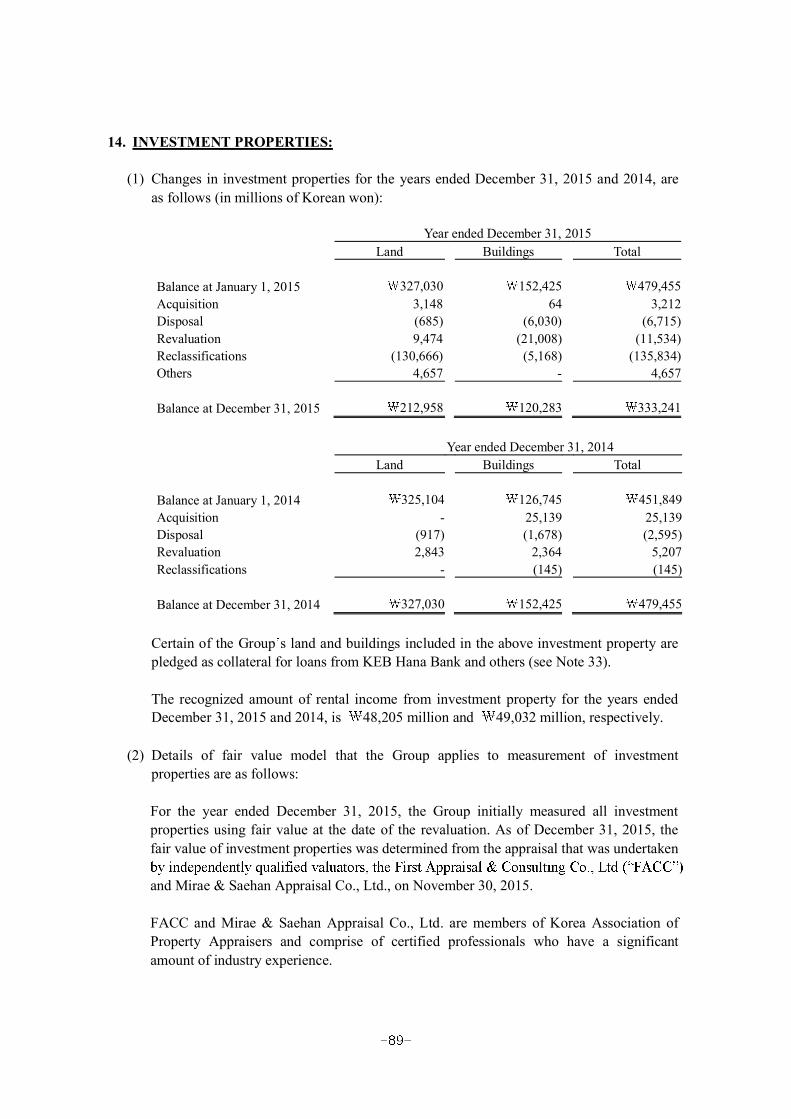
14. INVESTMENT PROPERTIES:
(1) Changes in investment properties for the years ended December 31, 2015 and 2014, are as follows (in millions of Korean won):
Year ended December 31, 2015Land Buildings Total
Balance at January 1, 2015 327,030 152,425 479,455Acquisition 3,148 64 3,212Disposal (685) (6,030) (6,715)Revaluation 9,474 (21,008) (11,534)Reclassifications (130,666) (5,168) (135,834)Others 4,657 - 4,657
Balance at December 31, 2015 212,958 120,283 333,241
Year ended December 31, 2014Land Buildings Total
Balance at January 1, 2014 325,104 126,745 451,849Acquisition - 25,139 25,139Disposal (917) (1,678) (2,595)Revaluation 2,843 2,364 5,207Reclassifications - (145) (145)
Balance at December 31, 2014 327,030 152,425 479,455
Certain of the Group s land and buildings included in the above investment property are pledged as collateral for loans from KEB Hana Bank and others (see Note 33).
The recognized amount of rental income from investment property for the years ended December 31, 2015 and 2014, is 48,205 million and 49,032 million, respectively.
(2) Details of fair value model that the Group applies to measurement of investment properties are as follows:
For the year ended December 31, 2015, the Group initially measured all investment properties using fair value at the date of the revaluation. As of December 31, 2015, the fair value of investment properties was determined from the appraisal that was undertaken
and Mirae & Saehan Appraisal Co., Ltd., on November 30, 2015.
FACC and Mirae & Saehan Appraisal Co., Ltd. are members of Korea Association of Property Appraisers and comprise of certified professionals who have a significant amount of industry experience.

(3) Fair value measurements of land assets by fair value hierarchy level as of December 31, 2015 and 2014, are as follows (in millions of Korean won):
December 31, 2015 December 31, 2014Level 1 Level 2 Level 3 Level 1 Level 2 Level 3
Property:Land - - 212,958 - - 327,030Buildings - - 120,283 - - 152,425
(4) Valuation techniques and inputs used for fair value measurement of land assets (Level 3) are as follows:
Valuation technique
Significant inputs that are not based on observable market data (unobservable inputs)
Correlation between unobservable inputs and fair value arguments
A. OARLP :OARLP of similar parcels nearby the subject land and reflating corrections are necessary for differences between the subject and the comparable.
a. Fluctuation rate ofland price and others
Fair value increases (decreases) if rate of land price increases (decreases).
b. Parcel conditions and others
Fair value increases (decreases) if correction of parcel conditions and others increases (decreases).
c. Land conditionsaffecting the sales priceand others
Fair value increases (decreases) if correction of land conditions affecting the sales price increases (decreases).
B. Sales comparison approach:Fair value is based on sales comparison of a similar object based on marketability with target object, while measuring fair value as compared with circumstance correction, time correction and individual factors.
a. Circumstance correction Fair value increases (decrease) if circumstance correction increases(decreases).
b. Regional factors Fair value increases (decrease) if regional factors increase (decrease).
c. Comparative value of individual factors
The comparative value of individual factors increases (decreases) if the fair value increases (decreases).
C. Estimated cost price approach:
Fair value is based on depreciation and replacement costs considered with structure, building materials, construction condition, building equipment, end use, present condition and management condition.
a. Replacement cost Fair value decreases (increase) if replacement cost increases(decreases).

15. BONDS AND BORROWINGS:
(1) Bonds as of December 31, 2015 and 2014, are as follows (in millions of Korean won):
Annualinterest rate (%)
December 31, 2015
December 31, 2014
Public issued bond 3.77~8.15 2,892,788 3,465,110Private placement bond 3.90~8.50 390,000 430,000Exchangeable bond 1.50 115,656 155,522Convertible bond 3.20~4.00 311,112 200,000Bonds payables in foreign currency 2.13~7.49 585,999 29,678
Total 4,295,555 4,280,310
Less: Conversion rights adjustment (2,471) (10,369)Less: Exchange rights adjustment (28,370) (22,531)More: Premium on bonds 54,439 49,305Less: Discount on bonds (22,409) (33,960)Less: Current portion of long-term bonds (1,499,290) (844,014)
Long-term bonds 2,797,454 3,418,741
The conditions of exchangeable bond and convertible bond are as follows:
Details Exchangeable bond Convertible bond(84th) Convertible bond(85th)
The date of issue(the day of maturity)
2011.6.14(2016.6.14)
2014.9.4(2017.9.4)
2015.6.11(2018.6.11)
Interest rate 1.50% 4.00% 3.20%Guaranteed return 4.5% (116.72% of principal) 7.5% (111.65% of principal) 6.5% (110.83% of principal)
Exercise period 2011.6.15 2016.5.14 From one month after date of issue to one month before maturity
From one month after date of issue to one month before
maturityExercise price 53,480 per share 8,190 per share 6,000 per share
Issuing price 220,000 million 190,798 million 143,560 million
The option of redemption
Right exercisable after three years from the day of issue
Right exercisable after one and a half years and two and a half years from the day of issue
Right exercisable after two years and two and a half
years from the day of issueThe modification of
exercise price
Exercising price adjustable due to increase of capital stock without consideration, stock dividend
Exercising price adjustable due to increase of capital stock with consideration, stock dividend
Exercising price adjustable due to increase of capital stock with consideration,
stock dividendStock for conversion Common share of DEC Common share of DEC Common share of DEC

(2) Short-term borrowings as of December 31, 2015 and 2014, are as follows (in millions of Korean won):
Company Lender
Annualinterest rate
(%)December 31, 2015
December 31, 2014
Borrowings in Korean won:Doosan KDB and others 2.74~5.11 490,656 302,407DHC and subsidiaries KDB and others 2.64~3.92 1,191,089 459,675DI and subsidiaries Korea Exim Bank and others 2.32~5.99 545,901 388,500DEC and subsidiaries Woori Bank and others 1.40~11.74 583,298 568,560DE and subsidiaries Woori Bank and others 3.52~4.05 50,000 -
Subtotal 2,860,944 1,719,142
Borrowings in foreign currency:Doosan Korea Exim Bank and others 0.74~4.51 146,054 100,131
DHC and subsidiaries KDB and others 0.40~11.7 827,038 709,050
DI and subsidiaries KDB and others 0.72~9.25 722,765 765,309
DEC and subsidiaries KDB and others Libor+0.80~4.50 39,868 61,222
DE and subsidiaries KEB HanaBank and others 1.36~5.8020,107 18,449
Subtotal 1,755,832 1,654,161
Total 4,616,776 3,373,303
Financial liabilities related to transferred trade receivables that did not meet the derecognition criteria amounted to 105,442 million and 40,472 million as of December 31, 2015 and 2014, respectively. The trade receivables were pledged as collateral for these liabilities (see Note 32-(3)).

(3) Long-term borrowings as of December 31, 2015 and 2014, are as follows (in millions of Korean won):
Company LenderAnnual
interest rate(%)December 31, 2015
December 31, 2014
Borrowings in Korean won:
Doosan KDB and others 2.50~5.63 296,635 317,787
DHC and subsidiaries Korea Exim Bank and others 3.20~5.57 787,801 901,058DI and subsidiaries KDB and others 3.90~4.98 300,667 672,000DEC and subsidiaries Kookmin Bank and others 2.50~6.46 102,412 171,656DE and subsidiaries KDB and others MOR+2.00~4.42 75,000 95,000
Subtotal 1,562,515 2,157,501
Borrowings in foreign currency:Doosan Korea Exim Bank and others 1.01~Libor+2.10 256,500 154,742DHC and subsidiaries KDB and others 2.33~Libor+6.00
414,211 493,540
DI and subsidiaries KDB and others 0.00~8.00 2,548,131 2,233,480DE and subsidiaries China Construction Bank - - 1,591
Subtotal 3,218,842 2,883,353
Total 4,781,357 5,040,854
Discount on current portion of long-term borrowings (32,790) (33,799)Less: Current portion of long-term borrowings (1,033,279) (1,067,495)
Long-term borrowings 3,715,288 3,939,560
(4) Securitized debt
The principal feature of the securitization of the Group s transactions is that future receivables from various construction projects are initially transferred to a special-
SPE which in turn will issue an asset-backed security (future receivables).
Company LenderAnnual
interest rate(%)December 31, 2015
December 31, 2014
Securitized debt in Korean won:
DHC and subsidiaries KDB and others 3.89 165,000 -
DEC and subsidiaries Woori Bank and others 6.49~8.59 383,600 444,050Total 548,600 444,050
Discount on current portion of long-term borrowings (4,148) (4,024)Less: Current portion of long-term borrowings (394,044) (397,348)
Securitized debt 150,408 42,678

16. RETIREMENT BENEFIT OBLIGATION:
The Group operates a defined benefit plan for employees, and the actuarial valuation of plan assets and the defined benefit liability is performed by a reputable actuary using the projected unit credit method. Meanwhile, contributions to defined contribution retirement benefit plan are recognized as an expense when employees have rendered service entitling them to the contributions.
(1) Details of retirement benefit obligation as of December 31, 2015 and 2014, are as follows (in millions of Korean won):
December 31, 2015 December 31, 2014
Present value of defined benefit obligation 2,538,128 2,606,142Fair value of plan assets (1,571,665) (1,521,102)
Total 966,463 1,085,040
(2) Expenses recognized in profit and loss for the years ended December 31, 2015 and 2014,are as follows (in millions of Korean won):
2015 2014
Current service cost 133,028 139,540Net interest cost 40,783 46,895Effect of downscale and liquidation 2,977 (10,153)
Total 176,788 176,282
(3) Classification of the expenses related to the retirement benefit obligation recognized in the consolidated statements of income for the years ended December 31, 2015 and 2014,is as follows (in millions of Korean won):
2015 2014
Cost of sales 96,403 97,305Selling, general and administrative expenses 62,894 59,874Research and development cost 16,588 16,066Income from discontinued operations 903 3,037
Total 176,788 176,282

(4) Changes in defined benefit obligations for the years ended December 31, 2015 and 2014,are as follows (in millions of Korean won):
2015 2014
Beginning balance 2,606,142 2,324,554Current service cost 133,028 139,540Interest cost 90,769 101,014
Remeasurements of defined benefit liabilities:- Changes in demographic assumptions (44,306) 10,083- Changes in financial assumptions (66,546) 206,335- Others 27,716 (2,468)
Subtotal (83,136) 213,950
Transfer in/out (193) (955)Business combinations (13,458) (17,918)Effect of downscale and liquidation 1,472 (11,856)Contributions by employee 2,611 2,380Contributions by employer directly to plan assets - -Benefit payment (266,152) (155,988)Others 67,045 11,421
Ending balance 2,538,128 2,606,142
Changes in plan assets for the years ended December 31, 2015 and 2014, are as follows (in millions of Korean won):
2015 2014
Beginning balance 1,521,102 1,303,416 Expected return on plan assets 49,986 54,119Return on plan assets excluding amounts included
in interest income (52,252) 63,433Transfer in/out (37) 570Business combinations (6,286) (8,347)Effect of downscale and liquidation - (1,505) (1,703)Contributions by employee 2,486 2,306Contributions by employer directly to plan assets 197,390 224,030Benefit payment (171,210) (120,013)Others 31,991 3,291
Ending balance 1,571,665 1,521,102

(5) Assumptions used on actuarial valuation as of December 31, 2015 and 2014, are as follows:
CompanyDecember 31,
2015December 31,
2014
Discount rate 1.30% ~ 7.73% 3.00% 8.40%Expected rate of salary increase Doosan 2.60% ~ 6.00% 3.00% 4.80%
DHC and subsidiaries 2.80% ~ 8.00% 0.00% 8.00%DI and subsidiaries 3.00% ~ 4.00% 3.75% 4.23%DEC and subsidiaries 2.80% ~ 3.00% 3.00% 5.30%DE and subsidiaries 2.00% ~ 2.80% 2.40% 3.40%
(6) Details of plan assets as of December 31, 2015 and 2014, are as follows (in millions of Korean won):
December 31, 2015 December 31, 2014
Equity instruments 561,786 437,356Debt instruments 420,103 563,097Deposit and others 589,776 520,649
Total 1,571,665 1,521,102
Plan assets are mostly invested in assets that have a quoted market price in an active market.

(7) The sensitivity analysis for the significant actuarial assumptions as of December 31, 2015 and 2014, is as follows (in millions of Korean won):
December 31, 2015 December 31, 2014Amount Rate Amount Rate
Discount rate:1% increase (198,937) (-)7.8% (204,842) (-)7.9%1% decrease 237,249 9.3% 242,036 9.3%
Salary increase rate:1% increase 57,825 2.3% 54,177 2.1%1% decrease (52,725) (-)2.1% (56,044) (-)2.2%
(8) Information about the maturity profile of the defined benefit obligation as of December 31, 2015, is as follows (in millions of Korean won):
0 1 year 1 2 years 2 5 years 5 10 years Total
Expected payment 163,295 248,857 559,253 968,067 1,939,472
Above maturity of the defined benefit does not include planned payment over 10 years, and maturity profile does not include estimated payments after 10 years. The Group expects to contribute 186,292 million for the defined benefit plans in 2016.
The Group recognized expenses amounting to 22,649 million and 22,142 millionfor the defined benefit plans in 2015 and 2014, respectively.

17. PROVISION:
Changes in provision for the year ended December 31, 2015, are as follows (in millions of Korean won):
Year ended December 31, 2015January 1,
2015 Accrual UseBusiness
combinations OthersDecember 31,
2015 CurrentNon
-Current
Provision for product warranties 384,167 29,968 (39,407) - 6,169 380,897 136,605 244,292
Provision for returned goods of product 1,413 2,158 (1,276) - - 2,295 2,295 -
Provision for restoration 5,043 108 - - 451 5,602 - 5,602
Provision for loss compensation 2,602 (1,279) (35) - 8 1,296 - 1,296
Total 393,225 30,955 (40,718) - 6,628 390,090 138,900 251,190
The Group estimates expenditure required to settle the Group s obligations from product warranty, refund, related after service and others based on warranty period, historical claim rate and recognized provision.

18. SHARE CAPITAL AND SHARE PREMIUM:
Changes in share capital and share premium of the Parent for the years ended December 31, 2015 and 2014, are as follows (in millions of Korean won and number of shares):
Number of shares Share capitalCommon
sharesPreferred
sharesCommon
sharesPreferred
shares TotalShare
premium
Balance at January 1, 2014 20,882,071 5,396,759 105,910 26,984 132,894 337,274
Issuance of new shares for merger 384,867 - 1,924 - 1,924 18,046
Exercising share options 3,950 - 20 - 20 416
Balance at December 31, 2014 21,270,888 5,396,759 107,854 26,984 134,838 355,736
Balance at January 1, 2015 21,270,888 5,396,759 107,854 26,984 134,838 355,736
Balance at December 31, 2015 21,270,888 5,396,759 107,854 26,984 134,838 355,736
The Parent s number of shares authorized amounted to 400,000,000 shares with a par value of 5,000 per share. There is a difference arising from retirement of shares through retained earnings, and capital stock is not the same as total par value of shares issued.
The number of shares that are having limitation on voting right under commercial law amounted to 5,977,528 and 5,401,098 as of December 31, 2015 and 2014, respectively.
19. OTHER CAPITAL SURPLUS:
Other capital surplus as of December 31, 2015 and 2014, is summarized as follows (in millions of Korean won):
December 31, 2015 December 31, 2014
Share premium 355,736 355,736Gain from merger 1,390 1,390Asset revaluation reserve 277,542 277,542Other capital surplus 204,236 310,865
Total 838,904 945,533

20. OTHER CAPITAL ITEMS:
(1) Other capital items as of December 31, 2015 and 2014, are summarized as follows (in millions of Korean won):
December 31, 2015 December 31, 2014
Treasury stock (359,235) (300,033)Loss on disposal of treasury stock (16,738) (16,738)Share option 18,426 16,874Loss on capital reduction (127,319) (127,319)Other capital items (37,556) (36,202)
Total (522,422) (463,418)
(2) Treasury stock
Changes in treasury stock for the year ended December 31, 2015, are as follows (in millions of Korean won):
Number of treasury stock Carrying amountCommon
stockPreferred
stock TotalCommon
stockPreferred
stock Total
January 1, 2015 5,401,098 673,054 6,074,152 284,981 15,052 300,033Acquisition 576,430 - 576,430 59,202 - 59,202
December 31, 2015 5,977,528 673,054 6,650,582 344,183 15,052 359,235
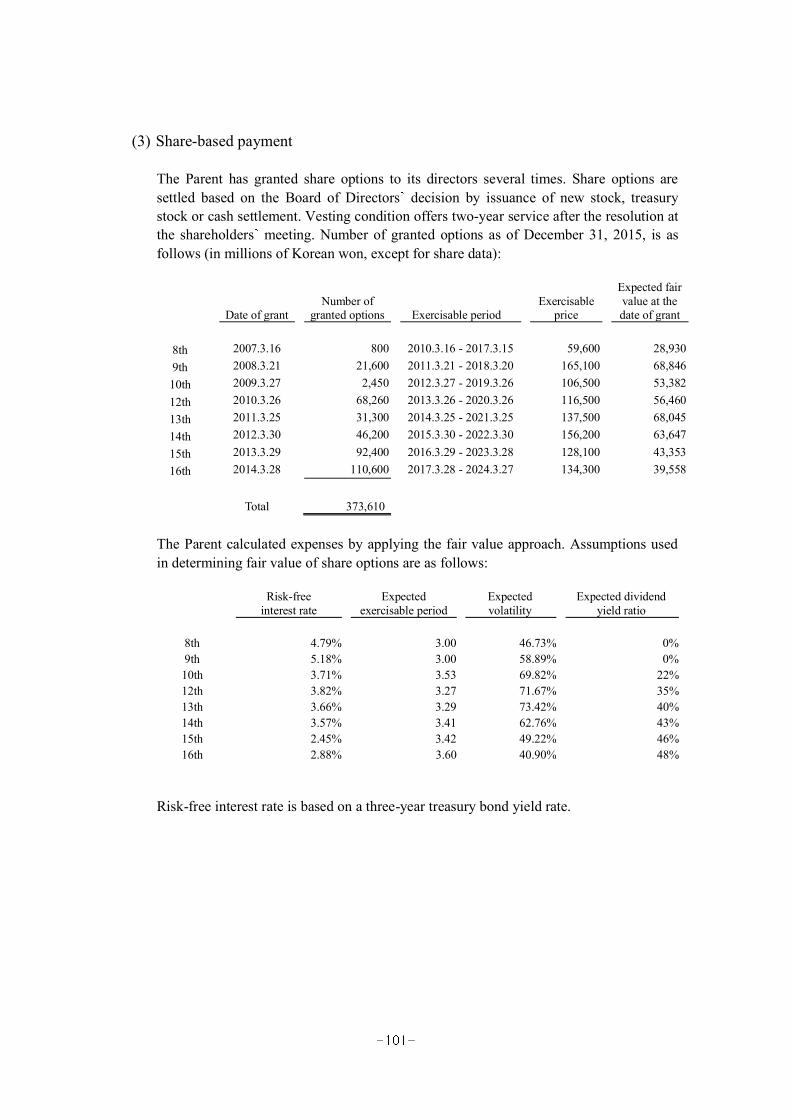
(3) Share-based payment
The Parent has granted share options to its directors several times. Share options are settled based on the Board of Directors decision by issuance of new stock, treasury stock or cash settlement. Vesting condition offers two-year service after the resolution at the shareholders meeting. Number of granted options as of December 31, 2015, is as follows (in millions of Korean won, except for share data):
Date of grantNumber of
granted options Exercisable periodExercisable
price
Expected fair value at the date of grant
8th 2007.3.16 800 2010.3.16 - 2017.3.15 59,600 28,9309th 2008.3.21 21,600 2011.3.21 - 2018.3.20 165,100 68,84610th 2009.3.27 2,450 2012.3.27 - 2019.3.26 106,500 53,38212th 2010.3.26 68,260 2013.3.26 - 2020.3.26 116,500 56,46013th 2011.3.25 31,300 2014.3.25 - 2021.3.25 137,500 68,04514th 2012.3.30 46,200 2015.3.30 - 2022.3.30 156,200 63,64715th 2013.3.29 92,400 2016.3.29 - 2023.3.28 128,100 43,35316th 2014.3.28 110,600 2017.3.28 - 2024.3.27 134,300 39,558
Total 373,610
The Parent calculated expenses by applying the fair value approach. Assumptions used in determining fair value of share options are as follows:
Risk-free interest rate
Expected exercisable period
Expected volatility
Expected dividend yield ratio
8th 4.79% 3.00 46.73% 0%9th 5.18% 3.00 58.89% 0%10th 3.71% 3.53 69.82% 22%12th 3.82% 3.27 71.67% 35%13th 3.66% 3.29 73.42% 40%14th 3.57% 3.41 62.76% 43%15th 2.45% 3.42 49.22% 46%16th 2.88% 3.60 40.90% 48%
Risk-free interest rate is based on a three-year treasury bond yield rate.

Changes in share options for the year ended December 31, 2015, are as follows:
1) Number of common shares to be issued:
January 1, 2015 Granted Exercised Forfeited December 31, 2015
8th 800 - - - 8009th 23,100 - - (1,500) 21,60010th 2,900 - - (450) 2,45012th 69,360 - - (1,100) 68,26013th 34,000 - - (2,700) 31,30014th 56,000 - - (9,800) 46,20015th 94,600 - - (2,200) 92,40016th 112,500 - - (1,900) 110,600
Total 393,260 - - (19,650) 373,610
2) Valuation amount (in millions of Korean won):
January 1, 2015 Granted Exercised Forfeited December 31, 2015
8th 23 - - - 239th 1,591 - - (103) 1,48810th 155 - - (24) 13112th 3,921 - - (62) 3,85913th 2,308 - - (184) 2,12414th 3,564 - - (624) 2,94015th 3,613 485 - (92) 4,00616th 1,699 2,191 - (35) 3,855
Total 16,874 2,676 - (1,124) 18,426
The weighted-average price of shares on their respective exercise dates for the year ended December 31, 2015, amounted to 2,549 million. The weighted-average remaining contractual period of share options is 6.89 years. Expense of a controlling company, recognized related to the share option grant, amounted to 2,549 million and 3,853 million for the years ended December 31, 2015 and 2014, respectively. Expense of subsidiary companies, recognized related to the share option grant,amounted to 1,493 million and 5,047 million for the years ended December 31, 2015 and 2014, respectively.
Expense to be recognized in the future period amounted to 527 million. Expense of subsidiary companies amounted to 477 million.

21. ACCUMULATED OTHER COMPREHENSIVE INCOME:
Accumulated other comprehensive income as of December 31, 2015 and 2014, is summarized as follows (in millions of Korean won):
December 31, 2015 December 31, 2014
Gain on AFS securities 210,997 81,607Decrease in equity of associates (2,404) (3,532)Loss on translation of foreign operations (115,182) (108,366)Gain on valuation of derivatives 43,143 18,331Revaluation surplus 632,111 468,181
Total 768,665 456,221
22. RETAINED EARNINGS:
(1) Retained earnings as of December 31, 2015 and 2014, are as follows (in millions of Korean won):
December 31, 2015 December 31, 2014
Legal reserve 43,737 35,464Voluntary reserve 74,999 97,666Unappropriated retained earnings 1,238,281 1,683,104
Total 1,357,017 1,816,234
The Commercial Code of the Republic of Korea requires the Parent to appropriate an amount equal to a minimum of 10% of annual cash dividends declared as a legal reserve until the reserve equals 50% of its issued share capital.

(2) Changes in retained earnings for the years ended December 31, 2015 and 2014, are as follows (in millions of Korean won):
2015 2014
Beginning balance 1,816,234 1,852,941Profit for the year (391,245) 65,349Remeasurements of defined benefit liabilities (2,097) (31,053)Payment of dividends (72,267) (73,455)Revaluation surplus 6,392 2,452
Ending balance 1,357,017 1,816,234
(3) Details of dividends for the years ended December 31, 2015 and 2014, are as follows (in Korean won, except for share data and dividend amount):
2015 2014
Preferred shares (old)
Preferred shares (new)
Common shares
Preferred shares (old)
Preferred shares (new)
Common shares
Face value per share 5,000 5,000 5,000 5,000 5,000 5,000
Interim dividends:
Number of shares issued - - - 4,411,074 985,685 20,885,121
Number of treasury stocks - - - (620,812) (52,242) (4,690,518)
Shares eligible for dividends - - - 3,790,262 933,443 16,194,603
Dividend rate - - - 10% 10% 10%
Dividend per share - - - 500 500 500
Dividend amount (in millions of Korean won) - - - 1,895 467 8,097
Closing price on dividend date - - - 69,100 64,900 125,000
Dividend yield ratio - - - 0.73% 0.76% 0.40%
Year-end dividends:
Number of shares issued 4,411,074 985,685 21,270,888 4,411,074 985,685 21,270,888
Number of treasury stocks (620,812) (52,242) (5,977,528) (620,812) (52,242) (5,401,098)
Shares eligible for dividends 3,790,262 933,443 15,293,360 3,790,262 933,443 15,869,790
Dividend rate 92% 91% 91% 71% 70% 70%
Dividend per share 4,600 4,550 4,550 3,550 3,500 3,500
Dividend amount(in millions of Korean won) 17,435 4,247 69,585 13,456 3,267 55,544
Average closing price 61,300 61,175 95,050 64,075 63,200 112,000
Dividend yield ratio 7.50% 7.44% 4.79% 5.46% 5.62% 3.13%

23. SEGMENT INFORMATION:
(1) The Group is engaged in various businesses, such as heavy industry, machinery manufacturing, apartment construction industry and service industry; key products and services of each division are as follows:
Business segment Main products and services
Electro-Materials BG Copper-clad laminates and othersMottrol BG Oil hydraulic equipment and othersIndustrial Vehicle BG Forklift and othersInformation and
Communication BUDevelopment and maintenance service of information
technology system and othersOthers Advertisement and substituting office work and othersDHC Generating unit, casting, forging and others DI Internal combustion engine, construction machinery of
all kinds, transportation equipment and others DEC Construction of apartment buildings and othersDE Marine engine, internal combustion engine, nuclear
power plant emergency generator and others
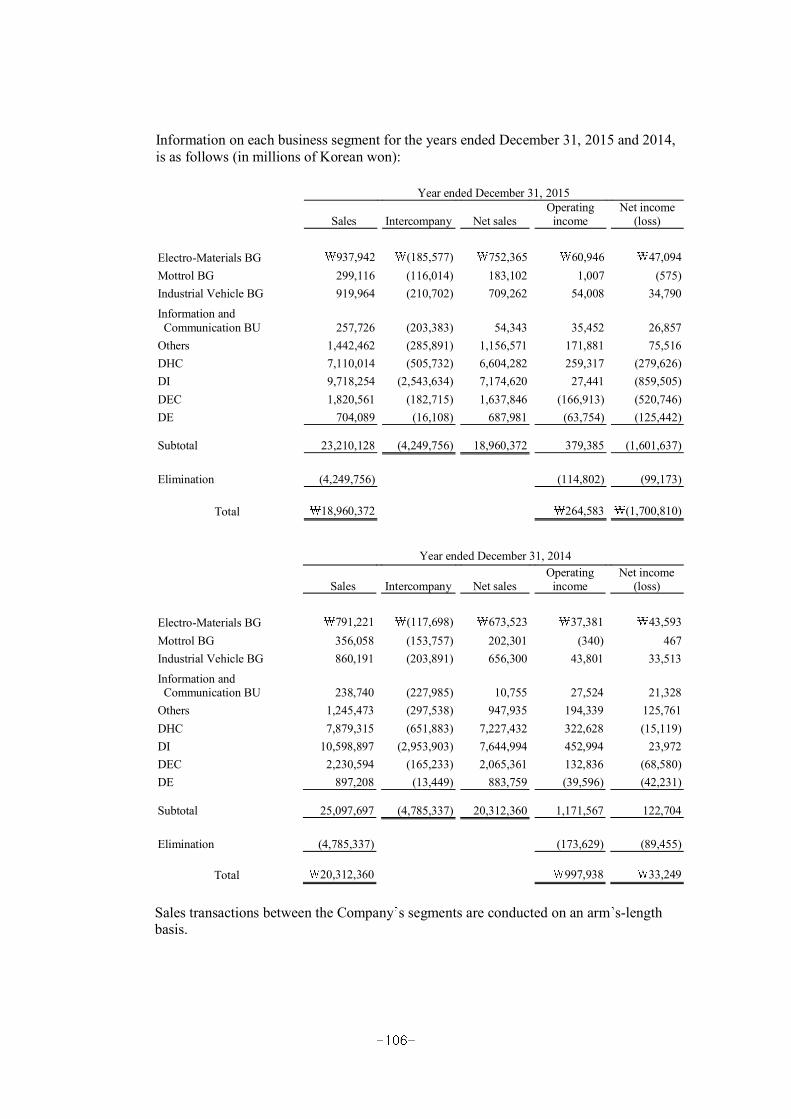
Information on each business segment for the years ended December 31, 2015 and 2014, is as follows (in millions of Korean won):
Year ended December 31, 2015
Sales Intercompany Net salesOperating
incomeNet income
(loss)
Electro-Materials BG 937,942 (185,577) 752,365 60,946 47,094Mottrol BG 299,116 (116,014) 183,102 1,007 (575)Industrial Vehicle BG 919,964 (210,702) 709,262 54,008 34,790
Information andCommunication BU 257,726 (203,383) 54,343 35,452 26,857
Others 1,442,462 (285,891) 1,156,571 171,881 75,516DHC 7,110,014 (505,732) 6,604,282 259,317 (279,626)DI 9,718,254 (2,543,634) 7,174,620 27,441 (859,505)DEC 1,820,561 (182,715) 1,637,846 (166,913) (520,746)DE 704,089 (16,108) 687,981 (63,754) (125,442)
Subtotal 23,210,128 (4,249,756) 18,960,372 379,385 (1,601,637)
Elimination (4,249,756) (114,802) (99,173)
Total 18,960,372 264,583 (1,700,810)
Year ended December 31, 2014
Sales Intercompany Net salesOperating
incomeNet income
(loss)
Electro-Materials BG 791,221 (117,698) 673,523 37,381 43,593Mottrol BG 356,058 (153,757) 202,301 (340) 467Industrial Vehicle BG 860,191 (203,891) 656,300 43,801 33,513
Information andCommunication BU 238,740 (227,985) 10,755 27,524 21,328
Others 1,245,473 (297,538) 947,935 194,339 125,761DHC 7,879,315 (651,883) 7,227,432 322,628 (15,119)DI 10,598,897 (2,953,903) 7,644,994 452,994 23,972DEC 2,230,594 (165,233) 2,065,361 132,836 (68,580)DE 897,208 (13,449) 883,759 (39,596) (42,231)
Subtotal 25,097,697 (4,785,337) 20,312,360 1,171,567 122,704
Elimination (4,785,337) (173,629) (89,455)
Total 20,312,360 997,938 33,249
Sales transactions between the Company s segments are conducted on an arm s-length basis.
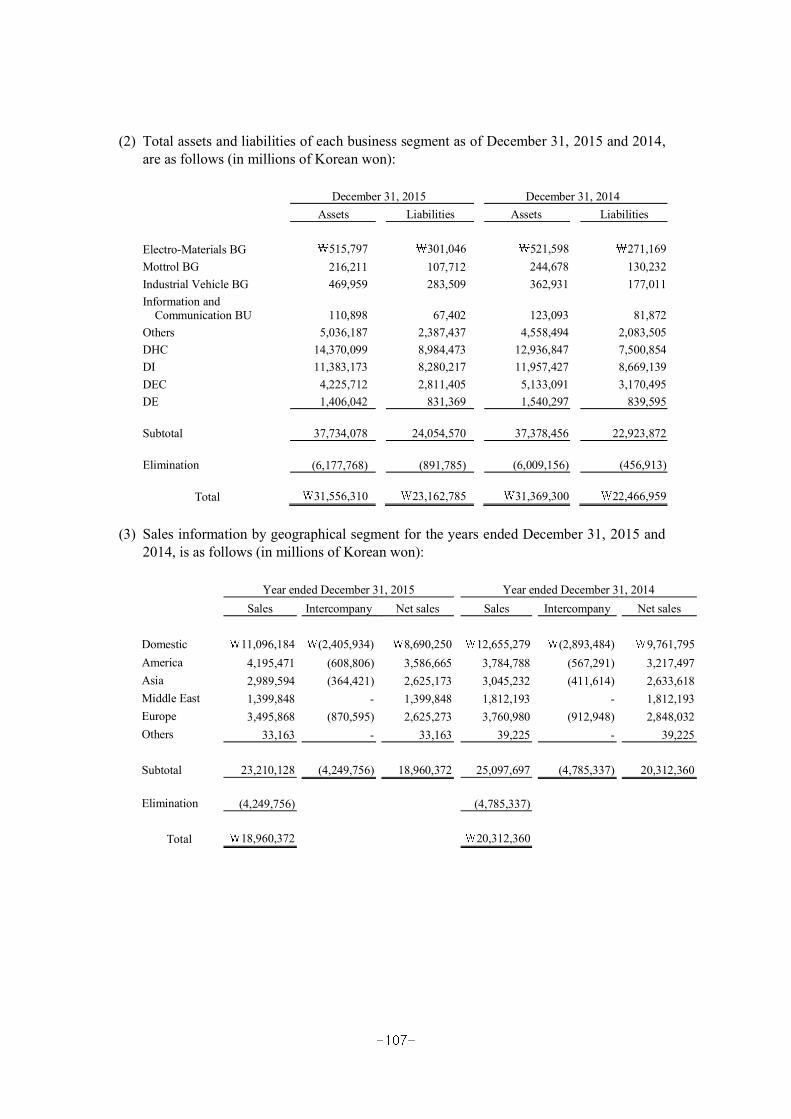
(2) Total assets and liabilities of each business segment as of December 31, 2015 and 2014,are as follows (in millions of Korean won):
December 31, 2015 December 31, 2014Assets Liabilities Assets Liabilities
Electro-Materials BG 515,797 301,046 521,598 271,169Mottrol BG 216,211 107,712 244,678 130,232Industrial Vehicle BG 469,959 283,509 362,931 177,011Information and
Communication BU 110,898 67,402 123,093 81,872Others 5,036,187 2,387,437 4,558,494 2,083,505DHC 14,370,099 8,984,473 12,936,847 7,500,854DI 11,383,173 8,280,217 11,957,427 8,669,139DEC 4,225,712 2,811,405 5,133,091 3,170,495DE 1,406,042 831,369 1,540,297 839,595
Subtotal 37,734,078 24,054,570 37,378,456 22,923,872
Elimination (6,177,768) (891,785) (6,009,156) (456,913)
Total 31,556,310 23,162,785 31,369,300 22,466,959
(3) Sales information by geographical segment for the years ended December 31, 2015 and 2014, is as follows (in millions of Korean won):
Year ended December 31, 2015 Year ended December 31, 2014Sales Intercompany Net sales Sales Intercompany Net sales
Domestic 11,096,184 (2,405,934) 8,690,250 12,655,279 (2,893,484) 9,761,795America 4,195,471 (608,806) 3,586,665 3,784,788 (567,291) 3,217,497Asia 2,989,594 (364,421) 2,625,173 3,045,232 (411,614) 2,633,618Middle East 1,399,848 - 1,399,848 1,812,193 - 1,812,193Europe 3,495,868 (870,595) 2,625,273 3,760,980 (912,948) 2,848,032Others 33,163 - 33,163 39,225 - 39,225
Subtotal 23,210,128 (4,249,756) 18,960,372 25,097,697 (4,785,337) 20,312,360
Elimination (4,249,756) (4,785,337)
Total 18,960,372 20,312,360

24. REVENUES:
Details of revenues for the years ended December 31, 2015 and 2014, are as follows (in millions of Korean won):
2015 2014Sales of goods 12,540,759 13,024,658Construction contracts 6,025,471 7,020,265Others 394,142 267,437
Total 18,960,372 20,312,360
25. CONSTRUCTION CONTRACTS:
(1) Details of the Group s accumulated construction income and assets and liabilities related to construction contracts as of and for the years ended December 31, 2015 and 2014, are as follows (in millions of Korean won):
As of and for the year ended December 31, 2015Accumulated construction
revenue
Accumulated construction
cost
Advances from construction
contract
Receivable from construction contract Due to customers
for contract workClaimed Unclaimed
DHC 36,268,853 30,937,499 5,331,354 1,175,024 1,427,003 (736,796)DST 141,196 135,856 5,340 3,781 67,843 (5,117)DEC 9,709,511 8,594,671 1,114,840 1,277,908 362,170 (247,456)DE 226,100 177,913 48,187 - 2,331 (9,702)
DPS S.A. and others 9,717,433 8,839,573 877,860 171,555 191,902 (183,312)
Subtotal 56,063,093 48,685,512 7,377,581 2,628,268 2,051,249 (1,182,383)Less:
Discontinued operation 93,877 92,029 1,848 41 (244) -
Total 55,969,216 48,593,483 7,375,733 2,628,227 2,051,493 (1,182,383)
As of and for the year ended December 31, 2014Accumulated construction
revenueAccumulated
construction cost
Advances from construction
contract
Receivable from construction contract Due to customers
for contract workClaimed Unclaimed
DHC 34,602,998 29,448,147 5,154,851 1,105,167 1,102,682 (747,018)DST 79,510 77,375 2,135 3,392 64,633 (412)DEC 9,780,001 8,564,581 1,215,420 1,463,796 777,882 (142,482)DE 188,147 147,311 40,836 - 13,000 (14,568)
DPS S.A. and others 7,748,960 6,739,164 1,009,796 77,568 185,466 (216,134)
Subtotal 52,399,616 44,976,578 7,423,038 2,649,923 2,143,663 (1,120,614)Less:
Discontinued operation 215,308 216,415 (1,107) 313 4,323 (103)
Total 52,184,308 44,760,163 7,424,145 2,649,610 2,139,340 (1,120,511)

(2) Details of changes in construction contract for the years ended December 31, 2015 and 2014, are as follows (in millions of Korean won):
Year ended December 31, 2015
Ordering organization Project PeriodJanuary 1,
2015Increase
(decrease)Revenue
recognizedDecember 31,
2015
DHC EVN and othersVinh Tan 4 Thermal
Power Plant and others2012.11-2018.06 13,884,026 5,408,830 (5,146,294) 14,146,562
DSTDefense Acquisition
Program Administration and others
Prototype research and development and
others
2011.06-2019.05
161,410 45,945 (60,487) 146,868
DEC Korea Rail Network Authority and others
Suseo-Pyungtaekhigh-speed rail
secondconstruction
district and others
2007.05-2017.12
6,728,537 2,049,865 (1,728,966) 7,049,436
DE KHNP and othersSingori No. 3 4
emergency generators and others
2005.02-2017.03
97,502 24,460 (36,754) 85,208
DPS S.A.and others GMR and others
Raipur and others2008.122030.12 1,916,543 2,954,622 (1,551,422) 3,319,743
Total 22,788,018 10,483,720 (8,523,923) 24,747,815
Less : Discontinued operation 37,603 (36,659) (944) -
Net 22,750,415 10,520,379 (8,522,979) 24,747,815
Year ended December 31, 2014
Ordering organization Project PeriodJanuary 1,
2014Increase
(decrease)Revenue
recognizedDecember 31,
2014
DHC SEC and others Rabigh Power Plant and others
2010.92017.12 13,270,519 6,110,300 (5,496,793) 13,884,026
DSTDefense Acquisition
Program Administration and others
Prototype research and development and
others
2006.72018.11
117,173 110,556 (66,319) 161,410
DECHaeundae Jugong Apts Construction Union and
others
Haeundae Jugong Apts and others 2007.5
2017.17,195,003 1,666,971 (2,133,437) 6,728,537
DE KHNP and othersSingori No. 3 4
emergency generators and others
2005.22017.3
84,587 33,641 (20,726) 97,502DPS S.A.and others GMR and others Raipur and others 2008.12
2030.12 2,457,071 1,307,841 (1,848,369) 1,916,543
Total 23,124,353 9,229,309 (9,565,644) 22,788,018
Less : Discontinued operation 61,452 7,389 (31,238) 37,603Net 23,062,901 9,221,920 (9,534,406) 22,750,415
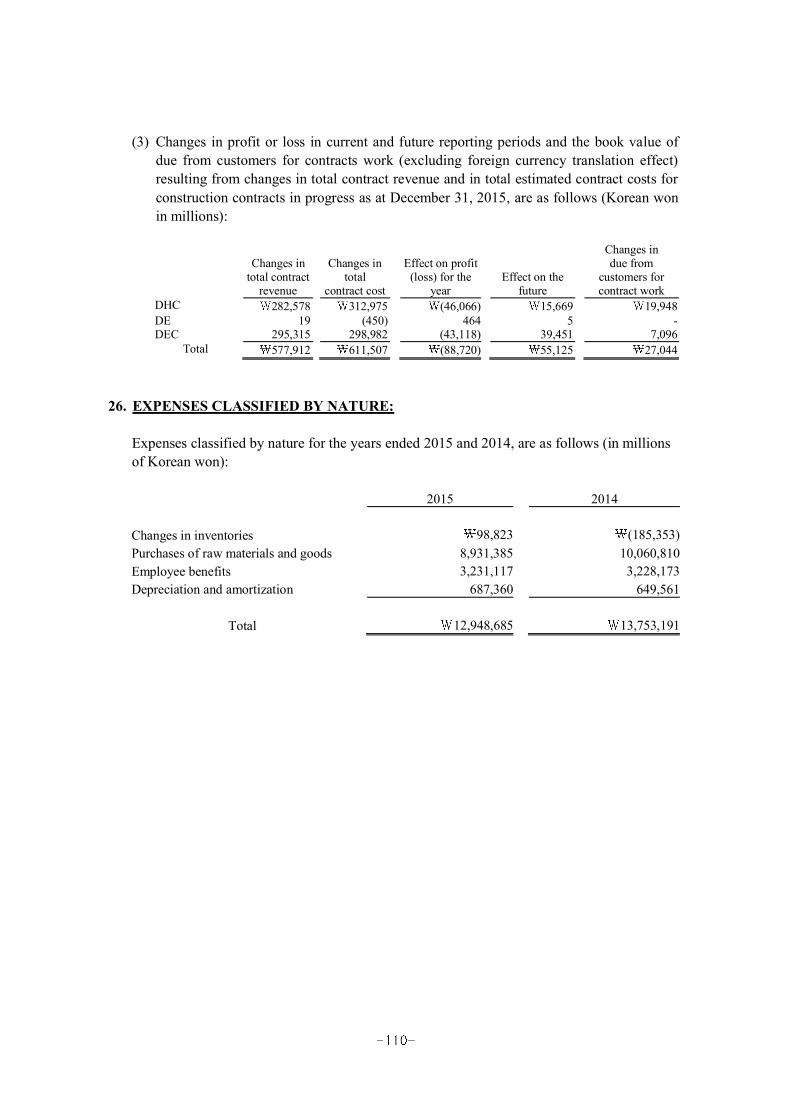
(3) Changes in profit or loss in current and future reporting periods and the book value of due from customers for contracts work (excluding foreign currency translation effect) resulting from changes in total contract revenue and in total estimated contract costs for construction contracts in progress as at December 31, 2015, are as follows (Korean won in millions):
Changes intotal contract
revenue
Changes in total
contract cost
Effect on profit(loss) for the
yearEffect on the
future
Changes indue from
customers forcontract work
DHC 282,578 312,975 (46,066) 15,669 19,948DE 19 (450) 464 5 -DEC 295,315 298,982 (43,118) 39,451 7,096
Total 577,912 611,507 (88,720) 55,125 27,044
26. EXPENSES CLASSIFIED BY NATURE:
Expenses classified by nature for the years ended 2015 and 2014, are as follows (in millions of Korean won):
2015 2014
Changes in inventories 98,823 (185,353)Purchases of raw materials and goods 8,931,385 10,060,810Employee benefits 3,231,117 3,228,173Depreciation and amortization 687,360 649,561
Total 12,948,685 13,753,191

27. SELLING AND ADMINISTRATIVE EXPENSES:
Selling and administrative expenses for the years ended December 31, 2015 and 2014, are as follows (in millions of Korean won):
2015 2014
Salaries 778,818 821,571Provision for retirement and severance benefits 286,954 115,501Employee welfare 160,308 162,266Travel 74,863 79,739Utilities 6,471 6,520Sales commission 80,372 77,560Taxes and dues 35,785 33,710Rent 55,006 58,056Depreciation 41,861 51,186Insurance 35,781 30,595Entertainment 12,695 14,622Advertising 81,809 63,929Packaging 13,130 16,936Research and development 307,275 304,264Education and training 19,439 25,092Freight and custody 31,912 31,891Sales promotion cost 22,861 20,770Royalty 806 1,213Service fees 148,070 139,710Maintenance of office 1,339 1,394Outsourcing fee 12,739 14,185Bad debt expense 322,192 114,234Amortization 91,181 87,236Defect repair cost 29,086 22,426Cost of developing overseas market 30,145 30,285Others 46,786 50,670
Total 2,727,684 2,375,561
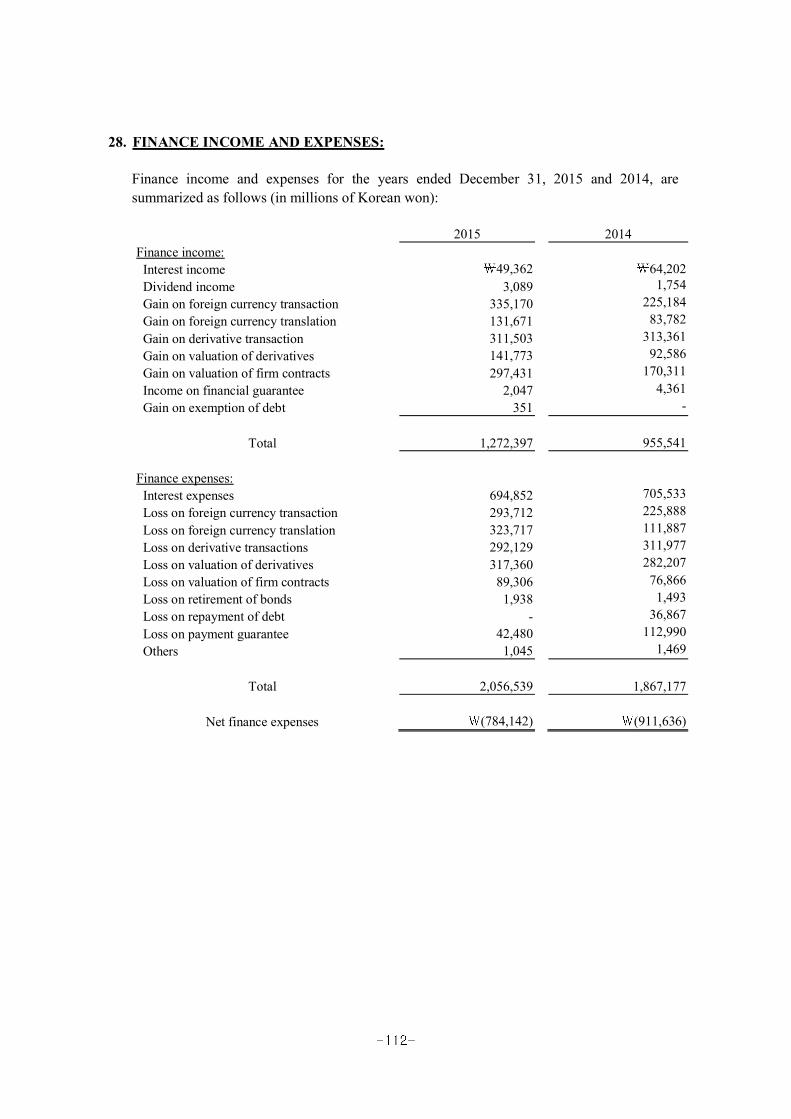
28. FINANCE INCOME AND EXPENSES:
Finance income and expenses for the years ended December 31, 2015 and 2014, are summarized as follows (in millions of Korean won):
2015 2014Finance income:
Interest income 49,362 64,202Dividend income 3,089 1,754Gain on foreign currency transaction 335,170 225,184Gain on foreign currency translation 131,671 83,782Gain on derivative transaction 311,503 313,361Gain on valuation of derivatives 141,773 92,586Gain on valuation of firm contracts 297,431 170,311Income on financial guarantee 2,047 4,361Gain on exemption of debt 351 -
Total 1,272,397 955,541
Finance expenses:Interest expenses 694,852 705,533Loss on foreign currency transaction 293,712 225,888Loss on foreign currency translation 323,717 111,887Loss on derivative transactions 292,129 311,977Loss on valuation of derivatives 317,360 282,207Loss on valuation of firm contracts 89,306 76,866Loss on retirement of bonds 1,938 1,493Loss on repayment of debt - 36,867Loss on payment guarantee 42,480 112,990Others 1,045 1,469
Total 2,056,539 1,867,177
Net finance expenses (784,142) (911,636)

29. OTHER NON-OPERATING INCOME AND EXPENSES:
Other non-operating income and expenses for the years ended December 31, 2015 and 2014, consist of the following (in millions of Korean won):
2015 2014
Other non-operating income:Gain on disposal of short-term investment securities 5,998 9,773Gain on disposal of long-term investment securities 13,678 1,463Gain on disposal of subsidiary 29,718 -Gain on disposal of property, plant and equipment 7,951 4,708Gain on disposal of intangible assets 625 295Gain on disposal of investment properties 618 785Gain on valuation of investment properties 9,513 9,602Reversal of impairment losses on intangible assets 74 255Gain on disposal of assets scheduled to sell - 45,090Others 56,146 87,618
Total 124,321 159,589
Other non-operating expenses:Loss on disposal of trade receivables 14,859 24,911Loss on disposal of long-term investment securities 1,009 1,433Impairment loss on long-term investment securities 777 7,306Loss on disposal of property, plant and equipment 17,649 9,438Loss on disposal of intangible assets 235 347Loss on disposal of investment properties 5,636 1,288Impairment loss on property, plant and equipment 137,956 8,691Impairment loss of intangible assets 197,240 13,103Loss on valuation of investment properties 21,046 4,395Impairment loss on non-current assetsclassified as held for sale 54,983 -Other bad debt expense 283,580 61,877Donations 43,222 31,150Others 195,035 141,374
Total 973,227 305,313
Net other non-operating expenses (848,906) (145,724)

30. INCOME TAX EXPENSE:
(1) Components of income tax expense for the years ended December 31, 2015 and 2014,are as follows (in millions of Korean won):
2015 2014
Current income tax expense 162,055 158,972Deferred income tax 250,226 (298,882)Transferred deferred income tax due to business
combinations 2,146 5,083Deferred income tax directly charged to equity (184,914) 39,801
- Income tax expenses (benefit) directly charged to discontinued operations - 84
- Income tax expenses (benefit) related to continuing operations 229,513 (95,110)

(2) Changes in deferred tax assets and liabilities for the years ended December 31, 2015 and 2014, are as follows (in millions of Korean won):
January 1, 2015
ChangeBusiness
combinationsDecember 31,
2015Income
(expense) Equity
Inventories 2,485 82 - - 2,567
AFS securities (30,947) 108 (45,059) - (75,898)Property, plant and equipment (721,413) 61,148 (118,028) - (778,293)Accrued expenses 14,256 747 - - 15,003Retirement benefit obligation 273,313 (20,836) 17,030 448 269,955Reserve for research and human resource (158,499) 48,342 - - (110,157)Investment properties (17,913) 2,751 - - (15,162)Others 1,420,729 (148,245) (26,275) 1,698 1,247,907Consolidation adjustment (18,601) (11,555) (12,582) - (42,738)
Total 763,410 (67,458) (184,914) 2,146 513,184
January 1, 2014
ChangeBusiness
combinationsDecember 31,
2014Income
(expense) Equity
Inventories 4,355 308 - (2,178) 2,485AFS securities (17,938) 165 (13,174) - (30,947)Property, plant and equipment (702,680) (16,748) (436) (1,549) (721,413)Accrued expenses 15,782 (434) - (1,092) 14,256Retirement benefit obligation 214,463 14,224 47,515 (2,889) 273,313Reserve for research and human resource (169,459) 10,960 - - (158,499)Investment properties (20,060) 2,147 - - (17,913)Others 1,166,130 235,912 5,896 12,791 1,420,729Consolidation adjustment (26,065) 7,464 - - (18,601)
Total 464,528 253,998 39,801 5,083 763,410
The Group offsets deferred tax assets and deferred tax liabilities, if the Group has a legally enforceable right to set off current tax assets against current tax liabilities and the deferred tax assets against deferred tax liabilities relating to income taxes levied by the same taxation authority.
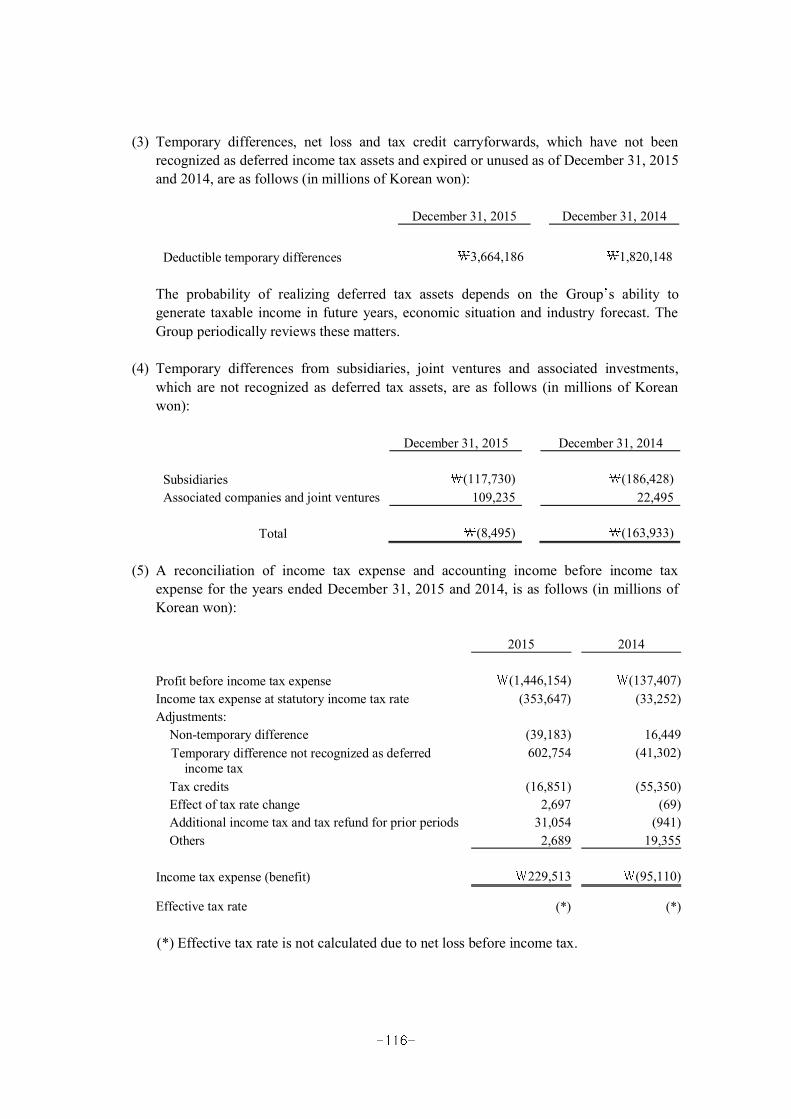
(3) Temporary differences, net loss and tax credit carryforwards, which have not been recognized as deferred income tax assets and expired or unused as of December 31, 2015 and 2014, are as follows (in millions of Korean won):
December 31, 2015 December 31, 2014
Deductible temporary differences 3,664,186 1,820,148
The probability of realizing deferred tax assets depends on the Group s ability to generate taxable income in future years, economic situation and industry forecast. The Group periodically reviews these matters.
(4) Temporary differences from subsidiaries, joint ventures and associated investments, which are not recognized as deferred tax assets, are as follows (in millions of Korean won):
December 31, 2015 December 31, 2014
Subsidiaries (117,730) (186,428)Associated companies and joint ventures 109,235 22,495
Total (8,495) (163,933)
(5) A reconciliation of income tax expense and accounting income before income tax expense for the years ended December 31, 2015 and 2014, is as follows (in millions of Korean won):
2015 2014
Profit before income tax expense (1,446,154) (137,407)Income tax expense at statutory income tax rate (353,647) (33,252)Adjustments:
Non-temporary difference (39,183) 16,449Temporary difference not recognized as deferred
income tax602,754 (41,302)
Tax credits (16,851) (55,350)Effect of tax rate change 2,697 (69)Additional income tax and tax refund for prior periods 31,054 (941)Others 2,689 19,355
Income tax expense (benefit) 229,513 (95,110)
Effective tax rate (*) (*)
(*) Effective tax rate is not calculated due to net loss before income tax.

31. EARNINGS PER SHARE:
Earnings per share for the years ended December 31, 2015 and 2014, are computed as follows (in Korean won, except for share data):
(1) Basic earnings per share
1) Basic earnings per share for the years ended December 31, 2015 and 2014, are as follows :
Year ended December 31, 2015Continuing Discontinued Total
Common stock basic earnings per share (19,870) (422) (20,292)Old-type preferred stock basic earnings per
share (*1) (19,870) (422) (20,292)
(*1) The Company calculated earning per share for old-type preferred share due to the nature of the share,which does not have preferred right on dividends and liquidation; therefore, the stock is considered as common stock based on K-
Year ended December 31, 2014Continuing Discontinued Total
Common stock basic earnings per share (44) 3,157 3,113Old-type preferred stock basic earnings per
share (*1) (44) 3,202 3,158
2) Net income available to common shares is as follows Year ended December 31, 2015
Continuing Discontinued Total
Net income (383,116,605,973) (8,128,014,802) (391,244,620,775)(-)Expected dividends on new-type preferred
shares 91,405,094 1,939,206 93,344,300(-)Expected residual income attributable to new-type preferred shares - - -(-)Expected residual income attributable to old-type preferred shares (75,313,099,440) (1,597,805,935) (76,910,905,375)Net income available to common share (307,894,911,627) (6,532,148,073) (314,427,059,700)

Year ended December 31, 2014Continuing Discontinued Total
Net income (783,187,815) 66,132,001,721 65,348,813,906(-)Expected dividends on new-type preferred
shares 93,344,300 3,173,706,200 3,267,050,500(-)Expected residual income attributable to new-type preferred shares - - -
(-)Expected residual income attributable to old-type preferred shares (167,033,487) 12,135,797,107 11,968,763,620
Net income available to common share (709,498,628) 50,822,498,414 50,112,999,786
3) The weighted-average number of common shares and old-type preferred shares outstanding used in the earnings per share calculation is as follows
Year ended December 31, 2015Common shares Old-type preferred shares
Beginning outstanding shares 15,853,290 3,790,262Effect of share option exercised - -Issuance of share capital - -Acquisition of treasury stock (357,946) -
Weighted-average number of commonshares outstanding 15,495,344 3,790,262
Year ended December 31, 2014Common shares Old-type preferred shares
Beginning outstanding shares 16,211,860 3,790,262Effect of share option exercised 1,835 -Issuance of share capital 98,062 -Acquisition of treasury stock (212,077) -
Weighted-average number of commonshares outstanding 16,099,680 3,790,262

(2) Diluted earnings per share
1) Diluted earnings per share for the years ended December 31, 2015 and 2014, are as follows
Year ended December 31, 2015Continuing Discontinued Total
Common stock diluted earnings per share (19,870) (422) (20,292)
Old-type preferred stock diluted earnings per share (19,870) (422) (20,292)
Year ended December 31, 2014Continuing Discontinued Total
Common stock diluted earnings per share (44) 3,156 3,112Old-type preferred stock diluted earnings
per share (44) 3,202 3,158
2) Diluted net income available to common shares is as follows :
Year ended December 31, 2015Continuing Discontinued Total
Controlling interest in net income (307,894,911,627) (6,532,148,073) (314,427,059,700)
Share-based compensation cost - - -
Diluted earnings per share (307,894,911,627) (6,532,148,073) (314,427,059,700)
Year ended December 31, 2014Continuing Discontinued Total
Controlling interest in net income (709,498,628) 50,822,498,414 50,112,999,786Share-based compensation cost - - -
Diluted earnings per share (709,498,628) 50,822,498,414 50,112,999,786
3) The weighted-average number of common shares outstanding used in the diluted earnings per share calculation is as follows:
2015 2014
Weighted-average number of common shares outstanding 15,495,344 16,099,680 Effect of share option exercise - 5,779
Adjusted weighted-average number of common shares outstanding 15,495,344 16,105,459

4) Diluted earning per share for old-type preferred share equals the basic earning pershare since there is no potential ordinary share for old-type preferred share.
(3) Conditions for preferred shares dividends
Face value Number of shares issued
Old-type preferred stock (*1) 5,000 4,411,074New-type preferred stock (*2) 5,000 985,685
(*1) Cash dividends available to common shares (*2) The Company should distribute 2% of face value of preferred share annually. In case the
Company distributes more than 2% of face value for common share, preferred share is participated in dividend for the exceeded dividend.
32. COMMITMENTS AND CONTINGENCIES:
(1) Notes, bills and checks offered in security
The Group pledged several notes and checks to financial institutions as collateral for long-term borrowings and performance guarantee agreements.
(2) Financial covenant
1) DI
For the year ended December 31, 2011, DI issued 19th foreign currency-denominated bonds for USD 350,000 thousand. In addition, the issued 19th foreign currency-denominated bond has an early redemption clause for when and if DIKDB, becomes privatized, and the funds required for such redemption will be provided by KDB to DI.
As of December 31, 2015, DI, a shareholder of DICC, entered into an agreement with unrelated financial investors, under which DI and the unrelated financial investors, as they mutually agree, may collectively dispose of all shares of DICC, belonging to each of them, to a third party. Upon exercise of the agreement by the unrelated financial investors, DI has a right to sell its shares of DICC pursuant to the agreement or otherwise repurchase the shares held by the unrelated financial investors.
As of December 31, 2015, DI entered into an agreement with unrelated financial investors, preferred shareholder of DBI under which DI and the unrelated financial investors, as they mutually agree, unless executing IPO of DBI in four years and six months, may collectively dispose of all shares of DBI, belonging to each of them, to a third party or right to request dispose of DBI's subsidiaries. Upon exercise of the agreement by the unrelated financial investors, DI has a right to sell its shares of Doosan Bobcat Inc. pursuant to the agreement or, otherwise, repurchase the shares held by the unrelated financial investors.
2) DEC
DEC entered into construction contracts with INTDC Co., Ltd. and Daewon Plus Constructions Co., Ltd. to develop Ilsan Zenith project and Haeundae Zenith project, respectively. DEC has provided guarantees to customers, who purchase the Ilsan Zenith and Haeundae Zenith apartments for the consideration paid to purchase the apartments during the repurchase guarantee periods (two to three years after the date of sale), should customers apply for such guarantees (see Note 30-8).
As of December 31, 2015reflect the effect from such guarantees, as the Group cannot reasonably predict the number of purchasers applying for the guarantee and the related guaranteed amount.
(3) Transferred trade receivables
Outstanding trade receivables sold with recourse by the Group are in the amount of 105,442 million and 40,472 million as of December 31, 2015 and 2014,
respectively. Because the Group retains some level of risks and rewards relating to trade receivables, the Group has recognized its carrying amount and cash receipt from transfer as short-term borrowings, in consolidated statements of financial position (see Note 15-(2)).

(4) Litigation in progress
Details of major lawsuits are as follows (in millions of Korean won):
Subsidiaries Claim Claimed amount
Doosan Claims for damages and others 17,213DHC and subsidiaries Claims for cancelation of apartment contracts
and others 352,624DI and subsidiaries Claims for damages and others 105,569DEC and subsidiaries Claims for damages and others 125,506DE and subsidiaries Claims for damages 21,281
Total 622,193
The outcome of such pending lawsuits cannot presently be determined.
In 2015, Hyundai Engineering & Construction Co., Ltd. requested International Chamber of Commerce to arbitrate disputes on manufacture of HRSG and warranties for general repairs with DEC. As at December 31, 2015, arbitration is in process, and the outcome of the arbitration cannot be reasonably estimated.
(5) Technical contract
DE and others have technical license agreements for the purpose of manufacturing specific products with MAN, MHI, YRI and others for the years ended December 31, 2015, and the Group paid 60,211 million as license fee.
(6) Operating leases
Details of non-cancelable operating leases contract for the year ended December 31, 2015, are as follows (in millions of Korean won):
Under 1 year1 year5 years
More than 5 years Total
Minimum lease payment 29,998 99,427 129,762 259,187
(7) Credit lines for borrowings
As of December 31, 2015, the Group has entered into bank overdraft agreements amounting to 12,384,848 million with various financial institutions, including KEB Hana Bank.

(8) Certification of payment
1) As of December 31, 2015, guarantees provided by the Group for third parties or received from third parties are as follows (in millions of Korean won):
Provider Provided to Amount
Guarantees provided by the Group:
DHC and subsidiaries 237,262DI and subsidiaries Daewoo Engineering & Construction and others 281,314DEC and subsidiaries 1,789,422
Total 2,307,998
2) As of December 31, 2015, guarantees provided by third parties for the Group are as follows (in millions of Korean won):
Provided to Provider Amount
Guarantees received from financial institutions:
The Parent Korea Defense Industry Association and others 82,383Seoul Guarantee Insurance 22,456KDB and others 22,545
Oricom Inc. Seoul Guarantee Insurance 1,082Woori Bank 360
Hancomm Inc. Seoul Guarantee Insurance 2,296
Doosan Feed & Livestock Co., Ltd.
Seoul Guarantee Insurance 358Shinhan Bank and others 1,343
DST Korea Defense Industry Association 657,209Seoul Guarantee Insurance 7,956Korea Exim Bank 529
Doosan Tower Co., Ltd. Seoul Guarantee Insurance 16
Doosan Bears, Inc. Seoul Guarantee Insurance 43Circuit Foil Luxembourg Sarl BGL BNP PARIBAS LUX 32
Doosan Fuel Cell America Korea Exim Bank and others 19,394DHC and subsidiaries Construction Guarantee Cooperative 465,654
Korea Trade Insurance Corporation 212,838Seoul Guarantee Insurance 744,300 Korea Exim Bank 1,557,564KEB Hana Bank 195,852Machinery Financial Cooperative 1,495,045Korea Federation of Small and Medium Business 153,563Others 2,435,898
DI and subsidiaries KDB 410,200
KEB Hana Bank and others 3,193Seoul Guarantee Insurance 2,205Machinery Financial Cooperative 27,161
DE and subsidiaries KEB Hana Bank 35,200

Provided to Provider Amount
Woori Bank 39,882Nonghyup Bank 30,214Kookmin Bank 21,761
DEC and subsidiaries Construction Guarantee Cooperative 2,037,813Korea Housing Guarantee 710,158Seoul Guarantee Insurance 85,005Dongbu Corporation and others 392,668KEB Hana Bank 101,895Woori Bank 89,411KDB 55,517Korea Exim Bank 166,726Machinery Financial Cooperative 168,473ACB Bank 10,937
12,467,135
3) Certification of payment related to PF
As of December 31, 2015, certifications of payment to DEC, and DHC for PF of developer are as follows (in millions of Korean won):
Business name Bond institution The term of guaranteeLimit of
guarantee The balance Description
Asset-backed commercial paper:Sangdo-dong Doosan Weve 2 Kiwoom Securities and others 2015.11.26 2016.02.26 70,000 70,000 Debt acceptanceHongcheon Mokok CC HI Securities and others 2015.04.22 2016.04.19 70,000 70,000 Debt acceptance
Subtotal 140,000 140,000
Loan:Seoul Forest Trimage KFCC and others 2014.04.28 2017.08.28 195,000 195,000 Debt acceptanceYongin Administration Town KDB Capital and others 2014.04.18 2016.04.17 55,000 55,000 Debt acceptanceHongcheon Mokok CC SC Bank and others 2015.04.22 2016.04.19 68,000 68,000 Debt acceptanceUlsan Daehyeon-dong Woori Bank and others 2013.07.11 2017.11.30 89,500 89,500 Joint and several guaranteePohang New Port Shinhan Bank and others 2010.03.26 2025.12.31 7,447 7,447 Joint and several guaranteeDaejeon Cheonbyeon KEB Hana Bank 2004.05.06 2024.05.06 7,167 3,987 Joint and several guaranteeBanwol-dong, Hwaseong Nonghyup Bank and others 2008.03.31 2016.06.30 78,000 60,000 Joint and several guarantee
Subtotal 500,114 478,934
A short-term debenture:Seoul Forest Trimage LIG Securities and others 2014.04.28 2017.08.28 35,000 35,000 Debt acceptanceYongin Administration Town SK Securities 2014.04.18 2016.04.17 30,000 30,000 Debt acceptanceSangdo-dong Doosan Weve 2 Kiwoom Securities and others 2015.11.26 2016.02.26 120,000 120,000 Debt acceptanceHongcheon Mokok CC Kyobo Securities and others 2015.04.22 2016.04.19 30,000 30,000 Debt acceptanceUlsan Daehyeon-dong KTB Securities 2015.10.06 2016.01.06 41,600 32,000 Joint and several guaranteeCheonan Cheongdang-dong Shin Young Securities 2015.12.18 2016.03.18 65,000 50,000 Joint and several guarantee
Subtotal 321,600 297,000
Total 961,714 915,934

4) Other commitments and contingencies
As at December 31, 2015, DHC has entered into a contract to assume a liability (limit: 155,000 million) if it fails to complete construction of The Land Park Office in Magok district.
As at December 31, 2015, the Group provides joint and several guarantees amounting to 588,272 million for the performance of construction contracts to other construction companies. In addition, the Group provides joint and several guarantees for construction performance to Korea Housing & Finance Corporation related to the guarantee for housing sales, which was provided by Korea Housing Finance Corporation to the developers.
With regard to the Incheon-Gimpo Highway Construction Project, the Group entered into a capital supplement agreement with a limited guarantee of 22,346 million with Incheon-Gimpo Expressway Co., Ltd. Construction investors associated with SOC business have an agreement of providing for an insufficient fund when the agreement is terminated or insufficient to repay the loan principal and interest by buy price or payment arising from purchase requirement from authorities.

(9) Ordinary wages
The Group may have to pay additional wages, if regular bonuses and other salaries fall under the category of ordinary wages. But the Group sees the possibility of the likeliness of having to pay related amounts to be low, based on the Supreme Court decision.
(10) Covenant related to unconsolidated structured entities
Details of unconsolidated structured entities as of December 31, 2015, are as follows (in millions of Korean won):
Asset amount of interests in
unconsolidated structured entities
Liability amount of interests in
unconsolidated structured entities
Maximum exposure to the loss of
unconsolidated structured entities
KDPP 1st Co., Ltd. - 115,000 115,000Happy Tomorrow 20th Co., Ltd. - 50,000 50,000Doosan Cuvex 1st Securitization
Specialty Co., Ltd. - 41,500 41,500SD 1st Co., Ltd. - 100,000 69,500PINETREECITY 1st Co., Ltd. (*1) - 50,000 39,700DS Changwon 1st LLC (*1) - 30,000 30,000SD 5th Co., Ltd. - 33,000 33,000DS Public 1st Co., Ltd. - 50,000 49,900DS Public 2nd Co., Ltd. - 35,000 35,000DS-Bliss 1st Co., Ltd. (*1) - 45,000 45,000The DSWAY 1st Co., Ltd. - 40,000 40,000Doosan E&C 1st Co., Ltd. (*1) - 102,000 102,000
(* 1) The Group has provided certain tangible assets of DEC as collateral related to obligation for financial support to structured entities.
Details of securitization assets and method are as follows:
Assets Method
KDPP 1st Co., Ltd. Future construction receivablesIssuing ABCP and others
Happy Tomorrow 20th Co., Ltd. Future construction receivablesIssuing ABCP and others
Doosan Cuvex 1st Securitization Specialty Co., Ltd.
Shares of Doosan Cuvex Co., Ltd. Issuing ABS bonds
SD 1st Co., Ltd.Future construction receivables from nine
government-ordered construction projects, including Incheon-Gimpo Expressway
Issuing ABS bonds
PINETREECITY 1st Co., Ltd. Changwon 2nd plant Issuing ABS bondsDS Changwon 1st LLC Changwon 1st plant Issuing ABS bonds
SD 5th Co., Ltd.
Future construction receivables fromtwo government-ordered construction projects including Suseo Pyungtaek high-speed rail second construction district
Issuing ABS bonds
DS Public 1st Co., Ltd.
Future construction receivablesfrom eight government-ordered construction projects including Wonju-Gangneung Railway Fifth construction district
Issuing ABS bonds
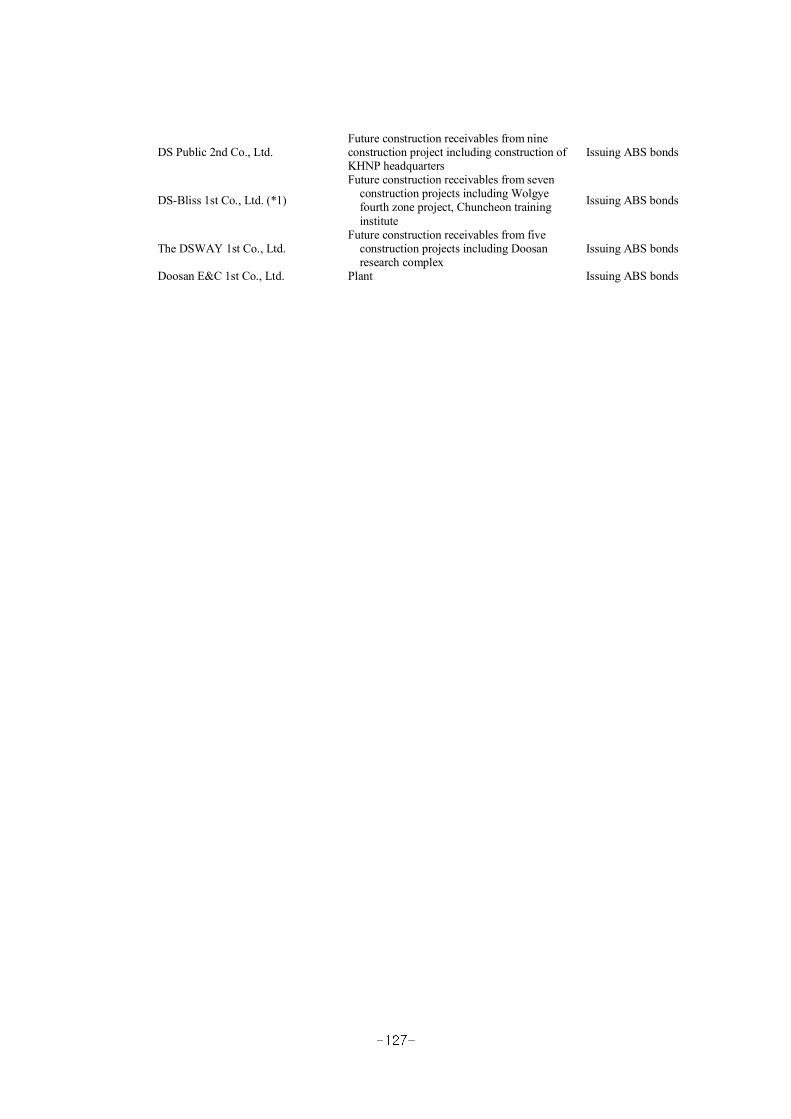
DS Public 2nd Co., Ltd. Future construction receivables from nine construction project including construction of KHNP headquarters
Issuing ABS bonds
DS-Bliss 1st Co., Ltd. (*1)
Future construction receivables from seven construction projects including Wolgye fourth zone project, Chuncheon training institute
Issuing ABS bonds
The DSWAY 1st Co., Ltd. Future construction receivables from five
construction projects including Doosan research complex
Issuing ABS bonds
Doosan E&C 1st Co., Ltd. Plant Issuing ABS bonds
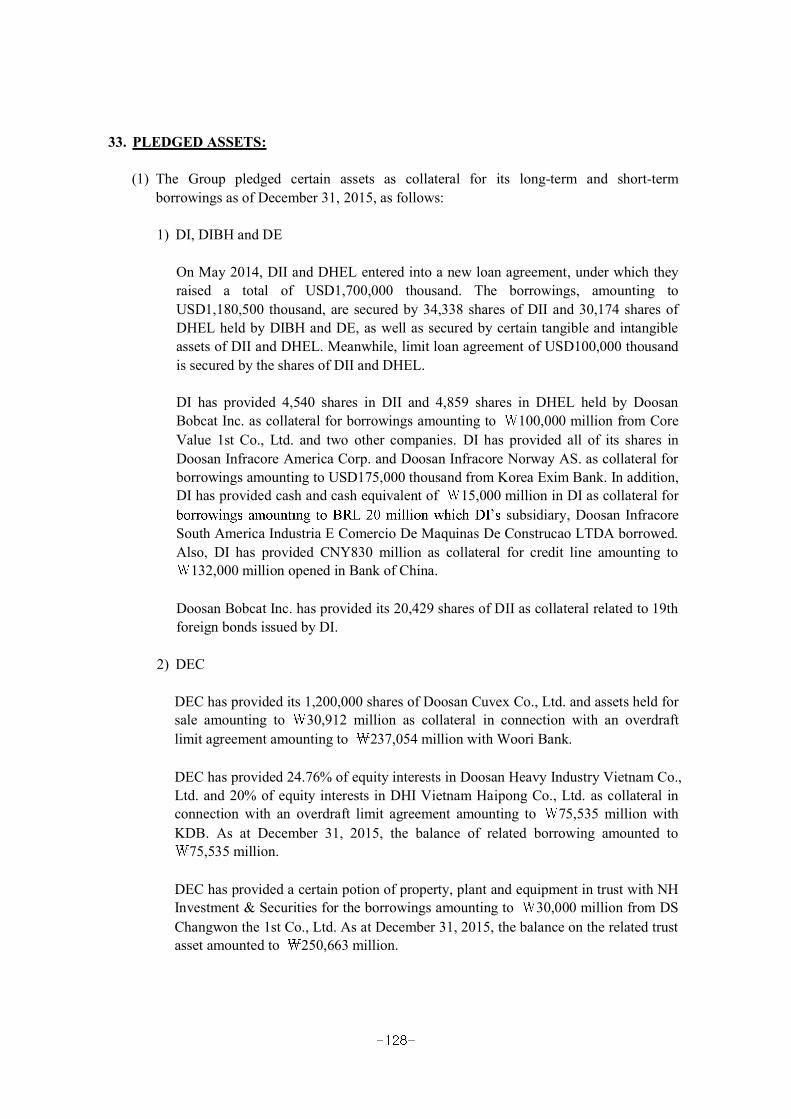
33. PLEDGED ASSETS:
(1) The Group pledged certain assets as collateral for its long-term and short-term borrowings as of December 31, 2015, as follows:
1) DI, DIBH and DE
On May 2014, DII and DHEL entered into a new loan agreement, under which they raised a total of USD1,700,000 thousand. The borrowings, amounting to USD1,180,500 thousand, are secured by 34,338 shares of DII and 30,174 shares of DHEL held by DIBH and DE, as well as secured by certain tangible and intangible assets of DII and DHEL. Meanwhile, limit loan agreement of USD100,000 thousand is secured by the shares of DII and DHEL.
DI has provided 4,540 shares in DII and 4,859 shares in DHEL held by Doosan Bobcat Inc. as collateral for borrowings amounting to 100,000 million from Core Value 1st Co., Ltd. and two other companies. DI has provided all of its shares in Doosan Infracore America Corp. and Doosan Infracore Norway AS. as collateral for borrowings amounting to USD175,000 thousand from Korea Exim Bank. In addition,DI has provided cash and cash equivalent of 15,000 million in DI as collateral for
subsidiary, Doosan Infracore South America Industria E Comercio De Maquinas De Construcao LTDA borrowed. Also, DI has provided CNY830 million as collateral for credit line amounting to
132,000 million opened in Bank of China.
Doosan Bobcat Inc. has provided its 20,429 shares of DII as collateral related to 19th foreign bonds issued by DI.
2) DEC
DEC has provided its 1,200,000 shares of Doosan Cuvex Co., Ltd. and assets held for sale amounting to 30,912 million as collateral in connection with an overdraft limit agreement amounting to 237,054 million with Woori Bank.
DEC has provided 24.76% of equity interests in Doosan Heavy Industry Vietnam Co., Ltd. and 20% of equity interests in DHI Vietnam Haipong Co., Ltd. as collateral in connection with an overdraft limit agreement amounting to 75,535 million with KDB. As at December 31, 2015, the balance of related borrowing amounted to
75,535 million.
DEC has provided a certain potion of property, plant and equipment in trust with NH Investment & Securities for the borrowings amounting to 30,000 million from DS Changwon the 1st Co., Ltd. As at December 31, 2015, the balance on the related trust asset amounted to 250,663 million.
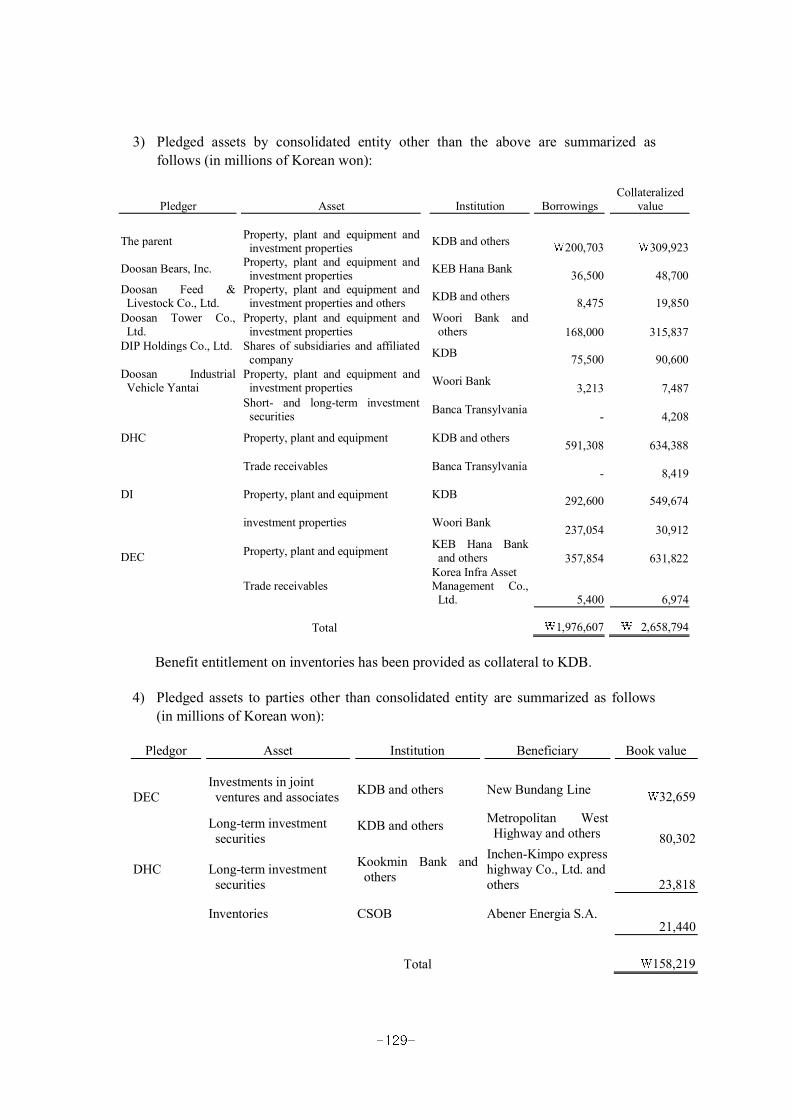
3) Pledged assets by consolidated entity other than the above are summarized as follows (in millions of Korean won):
Pledger Asset Institution BorrowingsCollateralized
value
The parent Property, plant and equipment and investment properties KDB and others 200,703 309,923
Doosan Bears, Inc. Property, plant and equipment and investment properties KEB Hana Bank 36,500 48,700
Doosan Feed & Livestock Co., Ltd.
Property, plant and equipment and investment properties and others KDB and others 8,475 19,850
Doosan Tower Co., Ltd.
Property, plant and equipment and investment properties
Woori Bank and others 168,000 315,837
DIP Holdings Co., Ltd. Shares of subsidiaries and affiliated company KDB 75,500 90,600
Doosan Industrial Vehicle Yantai
Property, plant and equipment and investment properties Woori Bank 3,213 7,487
DHC
Short- and long-term investment securities Banca Transylvania - 4,208
Property, plant and equipment KDB and others 591,308 634,388
Trade receivables Banca Transylvania - 8,419
DI Property, plant and equipment KDB 292,600 549,674
DEC
investment properties Woori Bank 237,054 30,912
Property, plant and equipment KEB Hana Bank and others 357,854 631,822
Trade receivables Korea Infra AssetManagement Co.,
Ltd. 5,400 6,974
Total 1,976,607 2,658,794
Benefit entitlement on inventories has been provided as collateral to KDB.
4) Pledged assets to parties other than consolidated entity are summarized as follows (in millions of Korean won):
Pledgor Asset Institution Beneficiary Book value
DECInvestments in joint
ventures and associates KDB and others New Bundang Line 32,659
Long-term investment securities
KDB and others Metropolitan West Highway and others 80,302
DHC Long-term investment securities
Kookmin Bank and others
Inchen-Kimpo expresshighway Co., Ltd. andothers 23,818
Inventories CSOB Abener Energia S.A. 21,440
Total 158,219
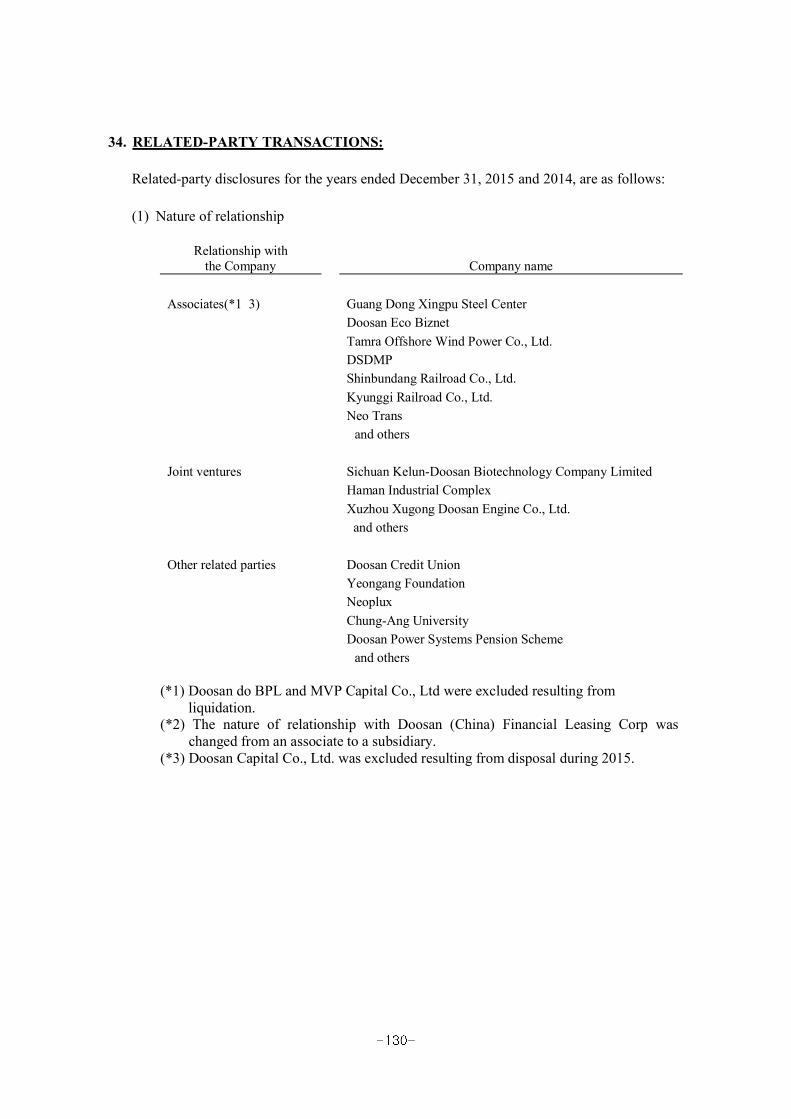
34. RELATED-PARTY TRANSACTIONS:
Related-party disclosures for the years ended December 31, 2015 and 2014, are as follows:
(1) Nature of relationship
Relationship with the Company Company name
Associates(*1 3) Guang Dong Xingpu Steel CenterDoosan Eco BiznetTamra Offshore Wind Power Co., Ltd.DSDMPShinbundang Railroad Co., Ltd.Kyunggi Railroad Co., Ltd.Neo Trans
and others
Joint ventures Sichuan Kelun-Doosan Biotechnology Company LimitedHaman Industrial ComplexXuzhou Xugong Doosan Engine Co., Ltd.
and others
Other related parties Doosan Credit UnionYeongang FoundationNeopluxChung-Ang UniversityDoosan Power Systems Pension Scheme
and others
(*1) Doosan do BPL and MVP Capital Co., Ltd were excluded resulting from liquidation.
(*2) The nature of relationship with Doosan (China) Financial Leasing Corp was changed from an associate to a subsidiary.
(*3) Doosan Capital Co., Ltd. was excluded resulting from disposal during 2015.

(2) Significant transactions
1) For the year ended December 31, 2015, significant transactions between the Group and related parties are as follows (in millions of Korean won):
2015
Sales Sales- other PurchasePurchases-
others
Associates:Doosan Capital 1,284 - - 42Tamra Offshore Wind Power Co.,
Ltd 63,443 - 2 -DCFL - 2,900 - -Shinbundang Railroad Co., Ltd. - - 47 12Kyunggi Railroad Co., Ltd. 81,243 - 1 -Neo Trans 5,919 - 554 61Others 1,486 1 3,775 126
Subtotal 153,375 2,901 4,379 241
Joint ventures:Haman Industrial Complex - 215 - -
Other related parties:Doosan Credit Union 691 - 372 445Yeongang Foundation 4,047 - 23 4,984Chung-Ang University 45,984 - 1,365 17,124Others 1,186 2 - 10,008
Subtotal 51,908 2 1,760 32,561
Total 205,283 3,118 6,139 32,802
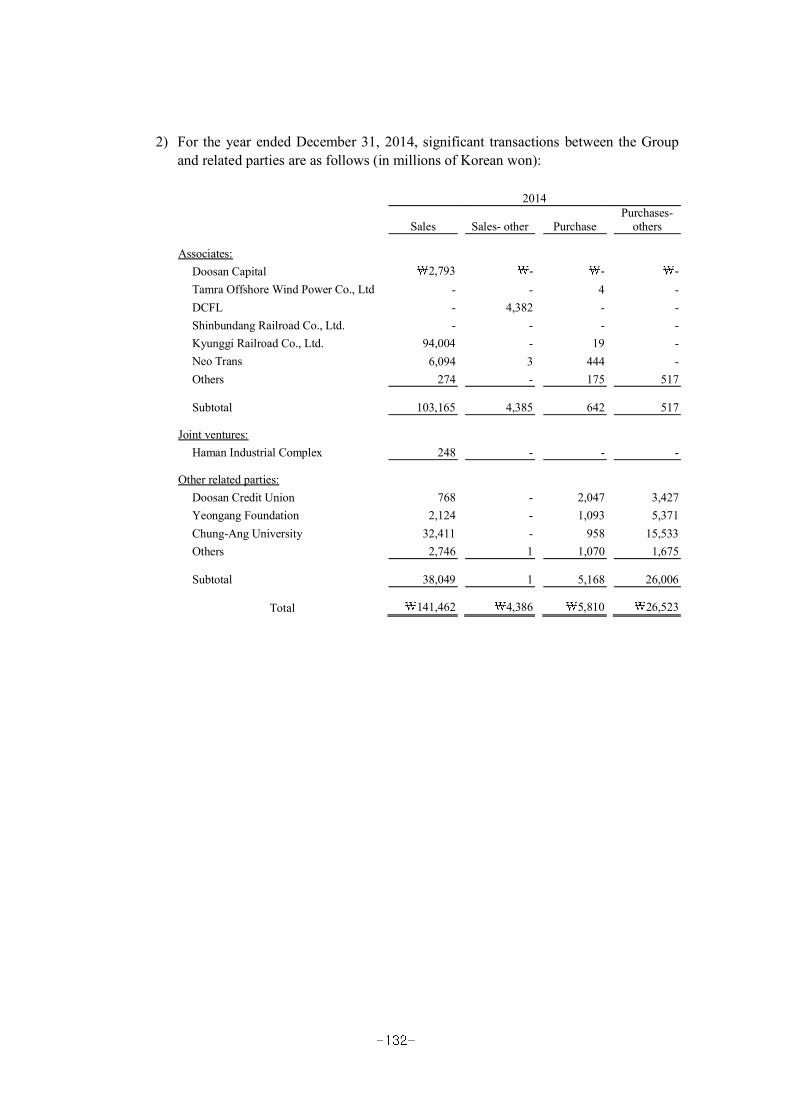
2) For the year ended December 31, 2014, significant transactions between the Group and related parties are as follows (in millions of Korean won):
2014
Sales Sales- other PurchasePurchases-
others
Associates:Doosan Capital 2,793 - - -Tamra Offshore Wind Power Co., Ltd - - 4 -DCFL - 4,382 - -Shinbundang Railroad Co., Ltd. - - - -Kyunggi Railroad Co., Ltd. 94,004 - 19 -Neo Trans 6,094 3 444 -Others 274 - 175 517
Subtotal 103,165 4,385 642 517
Joint ventures:Haman Industrial Complex 248 - - -
Other related parties:Doosan Credit Union 768 - 2,047 3,427 Yeongang Foundation 2,124 - 1,093 5,371 Chung-Ang University 32,411 - 958 15,533 Others 2,746 1 1,070 1,675
Subtotal 38,049 1 5,168 26,006
Total 141,462 4,386 5,810 26,523

(3) Significant balances related to the transactions between the Group and related parties (in millions of Korean won):
1) For the year ended December 31, 2015
Receivables PayablesTrade
receivablesOther
receivables LoansTrade
PayablesOther
payables
Associates:Tamra Offshore Wind Power
Co., Ltd 63,126 - - - 12,795DCFL - - - - -Shinbundang Railroad Co., Ltd. 11,023 - 15,858 10 -Kyunggi Railroad Co., Ltd. 101 269 26,000 1 -Neo Trans 831 - - 133 79Others 75 - 560 193 -
Subtotal 75,156 269 42,418 337 12,874
Joint ventures:Haman Industrial Complex 5,523 5,929 - - -Others - 586 - - -Subtotal 5,523 6,515 - - -
Other related parties:Doosan Credit Union 23 - - - 86Yeongang Foundation 205 1,908 - 2 506 Chung-Ang University 37 198 - 58 1,128 Others 13 4 - 4 230
Subtotal 278 2,110 - 64 1,950 Total 80,957 8,894 42,418 401 14,824

2) For the year ended December 31, 2014
Receivables PayablesTrade
receivablesOther
receivables LoansTrade
PayablesOther
payables
Associates:Tamra Offshore Wind Power
Co., Ltd - - - - -DCFL - 395 1,396 - -Shinbundang Railroad Co., Ltd. 11,023 - 9,858 - -Kyunggi Railroad Co., Ltd. 1,550 9 12,300 6 -Neo Trans 161 - - 104 79Others 41 - 354 20 164
Subtotal 12,775 404 23,908 130 243
Joint ventures:Haman Industrial Complex 11,823 5,921 - - -Others - - - - -Subtotal 11,823 5,921 - - -
Other related parties:Doosan Credit Union 57 2 - - 605Yeongang Foundation 11 1,712 - 3 348 Chung-Ang University 3 198 - 159 152 Others 19 9 - 218 1,287
Subtotal 90 1,921 - 380 2,392 Total 24,688 8,246 23,908 510 2,635

(4) Fund and equity transaction for the years ended December 31, 2015 and 2014, between the Group and related parties are as follows (in millions of Korean won):
1) For the year ended December 31, 2015
Loans Borrowings Investments DividendLoans Collection Borrowings Refunding Received Provided Income Payout
Associates:DCFL 105,926 - - - - - - -Shinbundang Railroad Co., Ltd. 6,000 - - - - - - -Kyunggi Railroad Co., Ltd. 13,700 - - - - - - -New Seoul Railroad Co., Ltd. 206 - - - - - - -Others - - - - - - 45 -
Subtotal 125,832 - - - - - 45 -
Joint ventures:Sichuan Kelun-Doosan Biotechnology Company Limited - - - - - - 988 -
Doosan PSI LLC - - - - - 1,108 - -
Subtotal - - - - - 1,108 988 -
Other related parties::
DPS Pension Scheme - - - - 25,000 - - -
Total 125,832 - - - 25,000 1,108 1,033 -

2) For the year ended December 31, 2014
Loans Borrowings Investments DividendLoans Collection Borrowings Refunding Received Provided Income Payout
Associates:DCFL 1,396 - - - - - - -Shinbundang Railroad Co., Ltd. 9,858 - - - - - - -Doosan do BPL - 261 - - - - - -Kyunggi Railroad Co., Ltd. 12,300 - - - - 18 - -New Seoul Railroad Co., Ltd. 354 - - - - 250 - -Others - - - - - - 14 -
Subtotal 23,908 261 - - - 268 14 -
Joint ventures:Hanjung Power Ltd. - - - - - - 1,494 -
Sichuan Kelun-Doosan Biotechnology Company Limited - - - - - - 931 -
Subtotal - - - - - - 2,425 -
Total 23,908 261 - - - 268 2,439 -
(5) As of December 31, 2015, the Group provides guarantees and warranties for related party. (see Notes 32 and 33)
(6) Compensation to key management personnel of the Group for the years ended December 31, 2015 and 2014, is as follows (in millions of Korean won):
2015 2014
Employee benefits 124,516 145,887 Severance benefits 12,084 12,897 Share-based payments 4,042 8,900
Total 140,642 167,684

35. CONSOLIDATED STATEMENTS OF CASH FLOWS:
The cash and cash equivalents in the statements of cash flows are the same as the cash and cash equivalents in the statements of financial position.
(1) The adjustments and changes in operating assets and liabilities in the consolidated statements of cash flows for the years ended December 31, 2015 and 2014, are as follows (in millions of Korean won):
2015 2014Adjustments:
Expenses not involving cash payments and others:Bad debt expense 322,839 113,471Cost of goods sold (allowance for inventory) 5,947 19,734Depreciation 458,145 463,239Amortization 230,504 202,783Severance indemnities 176,788 176,282Compensation expenses of share-based payments 4,042 8,900Interest income (49,362) (65,067)Dividend income (3,089) (1,754)Gain on foreign currency translation (131,859) (83,855)Gain on valuation of derivatives (142,608) (92,725)Gain on valuation of fixed-price contract (297,431) (170,311)Gain on financial warranty (2,047) (4,361)Gain on exemption of debt (351) -Interest expenses 695,217 709,849Loss on foreign currency translation 324,285 111,934Loss on valuation of derivatives 318,195 282,337Loss on valuation of fixed-price contract 89,306 76,866Loss on retirement of bonds 1,938 1,493Loss on retirement of redemption fund - 36,867Loss on payment guarantee 22,151 96,209Gain on disposal of short-term investment securities (5,998) (9,877)Gain on disposal of long-term investment securities (13,678) (1,463)Gain on disposal of subsidiary (29,718) -Gain on disposal of properties (8,012) (4,761)Gain on disposal of intangible assets (625) (330)Gain on disposal of investment in real properties (618) (785)Gain on disposal of properties scheduled to disposal - (45,090)Gains on valuation of investment in real properties (9,513) (9,602)Reversal of impairment losses on intangible assets (74) (267)Gain on disposal of subsidiaries (discontinued operation) 12,296 (67,876)Loss on disposal of trade receivables 14,859 24,949Loss on disposal of long-term investment securities 1,009 1,433Loss on impairment of long-term investment securities 777 7,306Loss on disposal of properties 17,940 9,741Loss on disposal of intangible asset 235 347Loss on disposal of investment in real properties 5,636 1,288Loss on valuation of investment in real properties 21,046 4,395Loss on impairment of properties 137,956 12,252Loss on impairment of intangible asset 197,240 13,542
(continued)

2015 2014
Loss on impairment of non-current assets classified as held-for-sale
54,983 -
Other bad debt expense 284,560 61,948Provision for warranties 30,847 37,461Share of loss of equity-accounted investees 77,689 77,994Income tax expense (gain) 229,513 (95,026)Other expense (gain) 10,828 (44,250)
Total 3,051,788 1,855,220
2015 2014Changes in operating assets and liabilities:
Increase or decrease in trade receivables 180,733 (57,349)Increase or decrease in other receivables (41,680) (21,854)Increase or decrease in due from customers for contract work 7,295 250,431Increase or decrease in derivative assets (liability) (118,903) 90,778Increase or decrease in inventories 99,082 (262,198)Increase or decrease in other current assets 67,626 (159,691)Increase or decrease in other long-term receivables 9,677 (2,854)Increase or decrease in other non-current assets 20,832 (61,328)Increase or decrease in trade payables (677,681) 583,186Increase or decrease in other payables 126,765 (133,164)Increase or decrease in due to customers for contract work 90,553 (557,219)Increase or decrease in provisions (32,768) (77,436)Increase or decrease in other current liabilities (32,207) 83,184Increase or decrease in other long-term payables 3,698 268,620Increase or decrease in other non-current liabilities 89 (1,471)Payment of severance benefits (266,152) (155,988)Increase or decrease in plan assets (48,053) (111,540)Increase or decrease in assets and liabilities related with
other operations (5,643) (32,732)
Total (616,737) (358,625)
(2) Significant non-cash transactions for the years ended December 31, 2015 and 2014, are as follows (in millions of Korean won):
2015 2014
Reclassification of construction in progress to property, plant and equipment and others 211,126 269,152
Transfer from land to inventories 41,099 -Transfer from property, plant and equipment and
investment properties to assets held for sales 99,698 -

36. NON-CURRENT ASSETS CLASSIFIED AS HELD-FOR-SALE:
(1) The non-current assets classified as held-for-sale as of December 31, 2015, are as follows (in millions of Korean won):
2015
Land 77,348Buildings and structures 12,101machinery and equipment 10,249
Total 99,698
The Group steadily makes an effort to disposal of the asset and is expected to be sold in 2016.
(2) Fair value measurements of assets held for sale
The fair value of the assets that is classified a held for sale is measured based on market approach considering the recent trading price of an object similar to the target object of December 31, 2015, and it is categorized into Level 3. The Group recognized as an impairment loss on assets held for sale amounting to 54,983 million for the year ended December 31, 2015.
The valuation technique to the fair values measurements of the assets that is classified a held for sale and significant inputs that are not based on observable market data are as follows:
Valuation technique
Significant inputs that are not based on
observable market data (unobservable inputs)
Correlation between unobservable
inputs and fair value arguments
Sales comparison approach:Fair value of land, buildings and structures is measured by selecting sales comparison similar to the subject assets and modified considering corrections for differences between the subject and the comparable.
Fair value of machinery was measured in consideration of the characteristics of the machine and the market trend. If there are no sales comparables, resale value is measured in consideration of consumer layer and years of use.
a. Fluctuation rate ofland price and others
Fair value increases (decreases) if rate of land price increases
(decreases).b. Parcel conditions
and othersFair value increases
(decreases) if correction of parcel
conditions and others increases (decreases).
c. Land conditionsaffecting the sales price and others
Fair value increases (decreases) if correction
of land conditions affecting the sales price increases (decreases).

37. BUSINESS COMBINATION:
(1) Details of business combination are summarized as follows (in millions of Korean won):
Details 2014
Acquired company Fuelcellpower Co., LtdObject Finding new opportunities for growthPrincipal activity Manufacturing and sales of fuel cellDate of acquisition September 30, 2014Acquired shares Mergers as new issue of stockPurchase price (*) 19,975Merger accounting method Acquisition
(*) Fair value of the 384,867 new shares issued for merger and closing price of 113,000 as of the date of merger.
(2) Fair values of assets and liabilities at acquisition date from business combinations are as follows (in millions of Korean won):
Fuelcellpower Co., Ltd.
Fair value of assets acquired:Current assets 14,087Non-current assets 7,423
Subtotal 21,510
Fair value of liabilities acquired:Current liabilities 30,311Non-current liabilities 1,512
Subtotal 31,823
Fair value of net assets acquired (10,313)
(3) Goodwill in business combinations for the year ended December 31, 2014, is as follows (in millions of Korean won):
Fuelcellpower Co., Ltd.
Purchase price 19,975Fair value of the identifiable net assets acquired (10,313)
Goodwill 30,288

(4) Net cash flows in business combinations for the year ended December 31, 2014, are as follows (in millions of Korean won):
Fuelcellpower Co., Ltd.
Consideration paid-in cash -Acquisition of cash and cash equivalents 779
Total 779
(5) Details of income in business combinations after acquisition date are as follows (in millions of Korean won):
Fuelcellpower Co., Ltd.
Sales 8,208Net income (162)
Meanwhile, the revenues and net income contributed by Fuelcellpower Co., Ltd. prior to the merger transaction date, which are excluded in the income statement amount to
2,511 million and 899 million, respectively.

38. ADDITIONAL ACQUISITION OF CONSOLIDATED SUBSIDIARY:
(1) Details of acquisition of subsidiaries are summarized as follows:
Dec.31 2015
DetailsRushlift Holdings Ltd.
(*1) Hancomm Inc.Doosan China Financial
Leasing Corp.Location UK Korea ChinaPrincipal activity Wholesale, retail and
leaseAdvertisement Finance
Date of acquisition
2015.2.27 2015.8.18 2015.7.17
Purchase price GBP 28,727 thousand(KRW 48,666 million)
KRW 23,330 million
CNY 460,000 thousand in cash(KRW 83,301 million)(*3)
Dec. 31 2014
DetailsDoosan Fuel Cell
America, Inc.Doosan Electro-Materials
Luxembourg Sarl(*3)
Business transferer ClearEdge Power, Inc. Circuit Foil Luxembourg SarlLocation USA LuxembourgPrincipal activity Manufacturing and sales of fuel
cellCopper-clad laminates
and othersDate of acquisition 2014.7.18 2014.7.10Purchase price USD 32,397 thousand
( 33,185 million)USD 49,357 thousand
( 50,507 million)
(*1) Includes its subsidiaries, Rushlift Ltd., Doosan Materials Handling UK Ltd. (*2) Includes its subsidiaries, Circuit Foil Luxembourg Sarl, Circuit Foil Asia Pacific
(Hong Kong), Circuit Foil Asia Pacific (Zhangjiagang) and Circuit Foil Trading Inc. (*3) (49%) was CNY 441,961
thousand, which was held by the Group prior to the date of acquisition.
(2) Fair values of assets and liabilities at acquisition date from acquisition of subsidiaries are as follows (in millions of Korean won):
Dec 31 2015
Rushlift Holdings Hancomm DCFL Total
Fair value of assets acquired:Current assets 13,699 43,979 574,766 632,444
Non-current assets 68,220 9,710 122,065 199,995
Subtotal 81,919 53,689 696,831 832,439
Fair value of liabilities acquired:Current liabilities 25,491 37,373 47,488 110,352
Non-current liabilities 38,943 2,676 483,450 525,069
Subtotal 64,434 40,049 530,938 635,421
Fair value of net assets acquired 17,485 13,640 165,893 197,018

Dec 31 2014
Doosan Fuel Cell America, Inc.(*1)
Doosan Electro-Materials Luxembourg Sarl Total
Fair value of assets acquired:Current assets 50,595 58,045 108,640
Non-current assets 15,005 22,907 37,912
Subtotal 65,600 80,952 146,552
Fair value of liabilities acquired:Current liabilities 36,559 20,557 57,116
Non-current liabilities 6,223 5,495 11,718
Subtotal 42,782 26,052 68,834
Fair value of net assets acquired 22,818 54,900 77,718
(*1) Recognized additional goodwill amounting KRW 3,327 million in the current year because the purchase price allocation had not finalized in the prior year.
(3) Goodwill in acquisition of subsidiaries for the year ended December 31, 2015, is as follows (in millions of Korean won):
Dec 31 2015
Rushlift Holdings Hancomm DCFL Total
Purchase price 48,666 23,330 163,336 235,332
Fair value of the identifiable netassets acquired 17,485 13,640 165,893 197,018
Cumulative effect of foreign currency translation 769 - (207) 562
Goodwill 31,950 9,690 (2,764) 38,876
Dec 31 2014
Doosan Fuel Cell America, Inc.
Doosan Electro-Materials Luxembourg Sarl Total
Purchase price 33,185 50,507 83,692
Fair value of the identifiable netassets acquired 22,818 54,900 77,718
Cumulative effect of foreign currency translation 1,495 324 1,819
Goodwill 11,862 (4,069) 7,793

(4) Net cash flows in acquisition of subsidiaries for the year ended December 31, 2013, are as follows (in millions of Korean won):
Dec 31 2015
Rushlift Holdings Hancomm DCFL Total
Consideration paid-in cash 48,666 23,330 83,301 155,297Acquisition of cash and
cash equivalents 7,743 16,688 28,361 52,792
Total (40,923) (6,642) (54,940) (102,505)
Dec 31 2014
Doosan Fuel Cell America, Inc.
Doosan Electro-Materials Luxembourg Sarl Total
Consideration paid-in cash 33,185 50,507 83,692Acquisition of cash and
cash equivalents - 2,665 2,665
Total (33,185) (47,842) (81,027)
(5) Details of income in acquisition of subsidiaries after acquisition date are as follows (in millions of Korean won):
Dec 31 2015
Rushlift Holdings Hancomm DCFL Total
Sales 44,682 29,838 40,153 114,673Net income 1,874 1,115 10,669 13,658
Dec 31 2014
Doosan Fuel Cell America, Inc
Doosan Electro-Materials Luxembourg Sarl Total
Sales 40,446 39,376 79,822Net income (17,176) (1,655) (18,831)

(6) Had these business combinations been effected on January 1, 2015, additional sales and net income included in the consolidated financial statements should be as follows(in millions of Korean won):
Dec 31 2015
Rushlift Holdings Hancomm DCFL Total
Sales 8,495 47,822 17,217 73,534Net income 618 (555) (6,371) (6,308)
Dec 31 2014
Doosan Fuel Cell America, Inc
Doosan Electro-Materials Luxembourg Sarl Total
Sales - 67,433 67,433Net income - (3,968) (3,968)
39. DISPOSAL OF SUBSIDIARIES (DISCONTINUED OPERATIONS):
(1) The details of discontinued operations as of December 31, 2015 and 2014, are as follows:
2015
DetailsOSS business unit
(Offshore Structure & Subsea) Rexcon business unit
Main products and services
Manufacturing of offshore and subsea structures and
equipmentProduction and distribution of ready-mixed
concrete
Disposal date March 27, 2015 May 22, 2015
MethodDecided to discontinue the
businessDisposal of business unit and disposal of
subsidiary after spin-off
Acquiring company - Jungsun remicon and 5 other parities
Disposal price -
KRW 128,317 million(Includes other receivable to be settled
amounting KRW 8,270 million)

(2) The book value of net assets disposed as of disposal date is as follows (in millions of Korean won):
2015 2014
RexconSRS Korea Co., Ltd.
Doosan Dong-ACo., Ltd. Total
Assets:Current assets 15,413 22,798 48,020 70,818 Non-current
assets 138,706 60,999 78,839 139,838
Subtotal 154,119 83,797 126,859 210,656
Liabilities:Current liabilities 7,320 26,876 109,866 136,742 Non-current
liabilities 1,993 11,739 5,551 17,290
Subtotal 9,313 38,615 115,417 154,032
Net assets 144,806 45,182 11,442 56,624
(3) Details of gain on subsidiaries disposal are as follows (in millions of Korean won):
Price ofnet asset disposed
Value ofnet asset disposed
Incidental expense of disposal
Gain onsubsidiaries disposal
2015Rexcon 136,587 (144,806) (4,077) (12,296)
2014SRS Korea Co.,
Ltd. 100,000 (45,182) (500) 54,318 Doosan Dong-A
Co., Ltd. 25,000 (11,442) - 13,558
Total 125,000 (56,624) (500) 67,876
(4) Net cash flows incurred by subsidiaries disposal for the year ended December 31, 2015, are as follows (in millions of Korean won):
Price of net asset disposed
Cash of transferred business
Incidental expense of disposal Net cash flows
2015Rexcon 128,317 - - 128,317
2014SRS Korea Co., Ltd. 100,000 14,334 500 85,166Doosan Dong-A Co., Ltd. 25,000 3,219 - 21,781
Subtotal 125,000 17,553 500 106,947

(5) Details of income from discontinued operations for the disposal years ended December 31, 2015 and 2014, are as follows (in millions of Korean won):
(6) Details of net cash flows from operating activities, investing activities and financing activities attributable to discontinued operations for the disposal years ended December 31, 2015 and 2014, are as follows (in millions of Korean won):
2015 2014Sales 57,204 371,317Cost of sales 56,423 253,038Selling and administrative cost 4,969 113,817Finance income (costs) (798) (3,394)Other non-operating income (expense) (7,861) 6,686Income tax expenses (income)related to discontinued operating - 84Loss on disposal of discontinued operations (12,296) 67,876Gain (loss) for the year from discontinued operations (25,143) 75,546Attributable to equity holders of the parent (8,128) 66,132Attributable to non-controlling interests (17,015) 9,414
2015 2014
Cash flows from operating activities (32,263) 7,884Cash flows from investing activities 128,001 75,681Cash flows from financing activities (97,898) 28,480Net foreign exchange difference 139 20
Total (2,021) 112,065
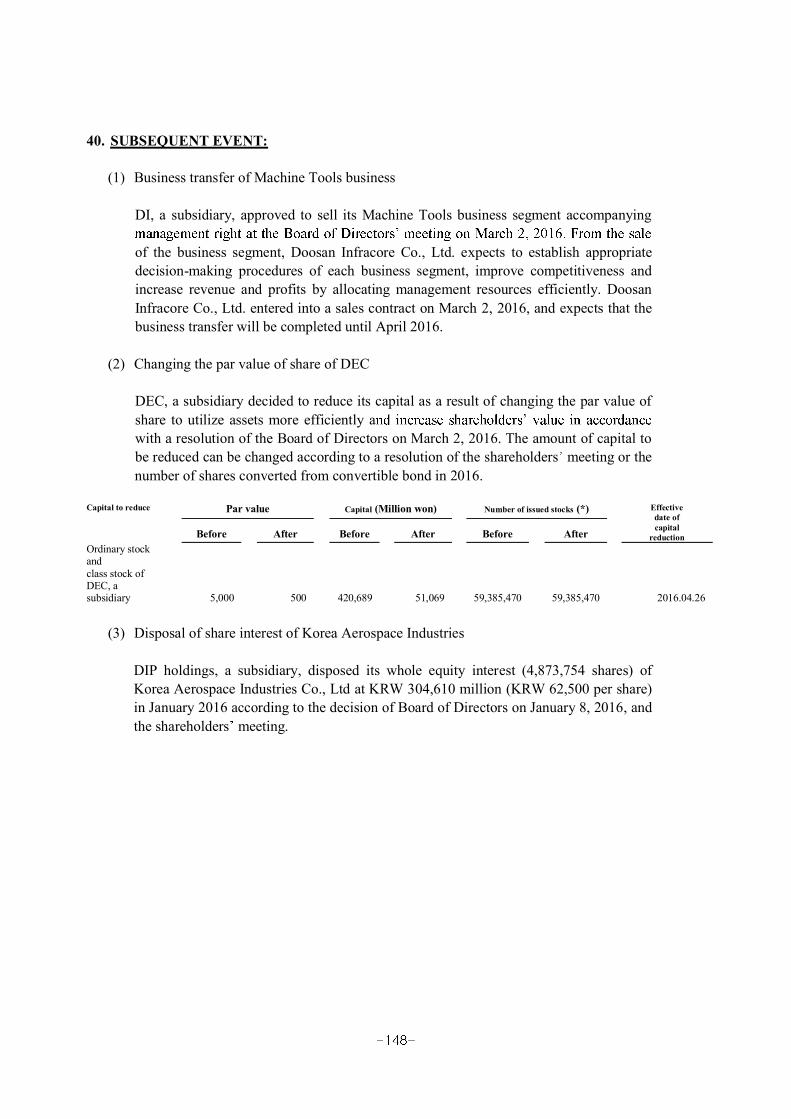
40. SUBSEQUENT EVENT:
(1) Business transfer of Machine Tools business
DI, a subsidiary, approved to sell its Machine Tools business segment accompanying
of the business segment, Doosan Infracore Co., Ltd. expects to establish appropriate decision-making procedures of each business segment, improve competitiveness and increase revenue and profits by allocating management resources efficiently. Doosan Infracore Co., Ltd. entered into a sales contract on March 2, 2016, and expects that the business transfer will be completed until April 2016.
(2) Changing the par value of share of DEC
DEC, a subsidiary decided to reduce its capital as a result of changing the par value of share to utilize assets more efficiently awith a resolution of the Board of Directors on March 2, 2016. The amount of capital to be reduced can be changed according to a resolution of the shareholders meeting or the number of shares converted from convertible bond in 2016.
Capital to reduce Par value Capital (Million won) Number of issued stocks (*) Effectivedate ofcapital
reductionBefore After Before After Before AfterOrdinary stock andclass stock ofDEC, a subsidiary 5,000 500 420,689 51,069 59,385,470 59,385,470 2016.04.26
(3) Disposal of share interest of Korea Aerospace Industries
DIP holdings, a subsidiary, disposed its whole equity interest (4,873,754 shares) of Korea Aerospace Industries Co., Ltd at KRW 304,610 million (KRW 62,500 per share) in January 2016 according to the decision of Board of Directors on January 8, 2016, and the shareholders meeting.