don't leave your facilities needs to chance - appa 2015
TRANSCRIPT

Don’t Leave Your Facilities Needs to ChanceWhat campus leaders can do when rolling the dice doesn’t work
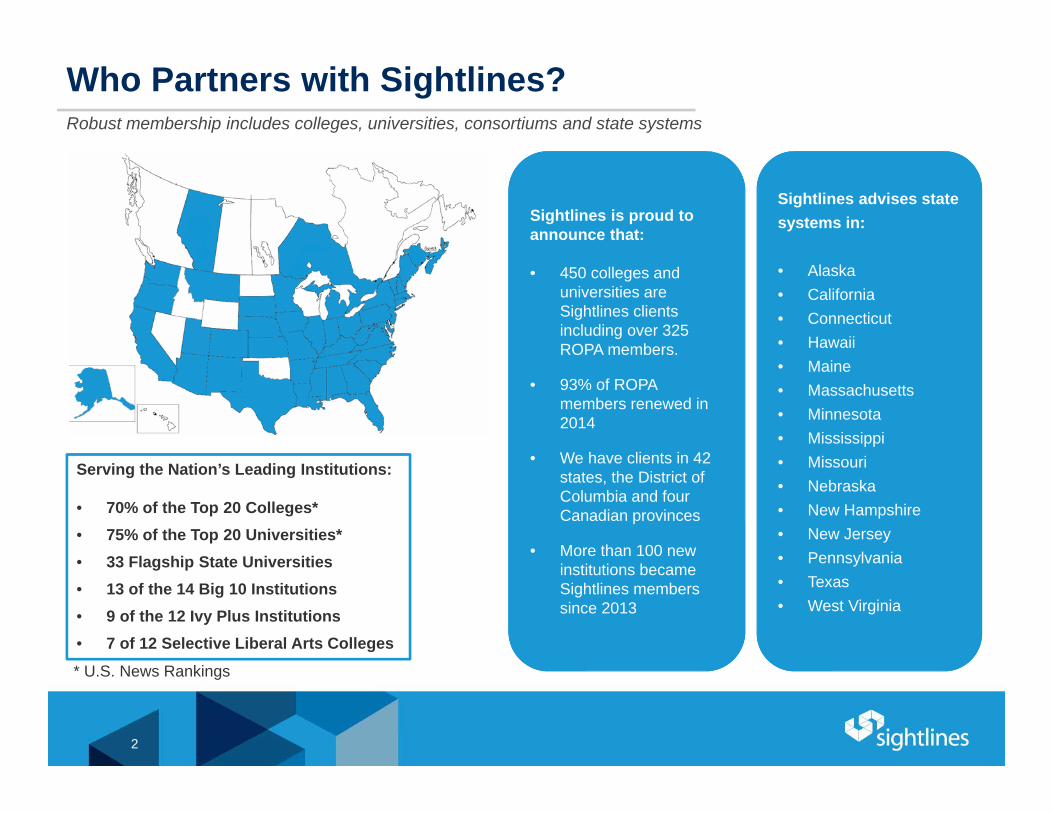
Who Partners with Sightlines?Robust membership includes colleges, universities, consortiums and state systems
2
* U.S. News Rankings
Sightlines is proud to announce that:
• 450 colleges and universities are Sightlines clients including over 325 ROPA members.
• 93% of ROPA members renewed in 2014
• We have clients in 42 states, the District of Columbia and four Canadian provinces
• More than 100 new institutions became Sightlines members since 2013
Sightlines advises state systems in:
• Alaska• California• Connecticut• Hawaii• Maine• Massachusetts• Minnesota• Mississippi• Missouri• Nebraska• New Hampshire• New Jersey• Pennsylvania• Texas• West Virginia
Serving the Nation’s Leading Institutions:
• 70% of the Top 20 Colleges*• 75% of the Top 20 Universities*• 33 Flagship State Universities• 13 of the 14 Big 10 Institutions• 9 of the 12 Ivy Plus Institutions• 7 of 12 Selective Liberal Arts Colleges

Agenda
Condition Assessment
3

Introductions
Robert Wells Chief Facilities OfficerClemson University
Founded: 1889GSF: 7.2MBuilding Count: 270
Students: 19,735Faculty/Staff: 4,524
Founded: 1824GSF: 5.2MBuilding Count: 85
Students: 2,700Faculty/Staff: 2,903
Greg WeigleChief Facilities OfficerMedical University of South Carolina
4

Is Facilities Management like Monopoly?
• There are numerous key players involved
• Every player/constituents may have a different priority than yours
• Strategic investments are required
• Different properties hold different values
5

Is Facilities Management like Monopoly?
• There are lots of key players involved
• Every player/constituent may have a different priority than yours
• Both require strategic investments
• Different properties hold different values
WITHOUT A PLAN YOU WILL LOSE
6

What are the Questions Decision Makers are Asking?Answering these questions is the first step in developing your plan
Where are we NOW?
Where are we GOING?
HOW do we get there?
7


Tracking a Changing Campus…Student population growing at faster rate than campus facilities
9
0%
10%
20%
30%
40%
50%
Campus Population and Facilities Change Over Time
Student Population Campus Facilities
0
50
100
150
200
250
GSF
/Stu
dent
Program Space Per Student*
*This benchmark shows the relative availability of academic, research and faculty program space to students in terms of sq. ft. per student.

… With a High Risk Profile15% more of Clemson’s space is in the High Risk category compared to peers
Buildings Under 10Little work. “Honeymoon” period.
Low Risk
Buildings 10 to 25Short life-cycle needs; primarily space
renewal.Medium Risk
Buildings 25 to 50Major envelope and mechanical life cycles come
due.Higher Risk
Buildings over 50Life cycles of major building components are past due.
Failures are possible.Highest risk
6%
22%
29%
27%
28%
27%
38%23%
0%
10%
20%
30%
40%
50%
60%
70%
80%
90%
100%
Clemson E&G Peer Average
% o
f Tot
al C
ampu
s G
SF
Campus Reno Age by Category
Under 10 10 to 25 25 to 50 Over 50
10
High RiskHigh Risk

The Data Pointed Towards…
New Building
$$$
11


Data Talks
“You can’t manage (effectively) what you
don’t measure.”
‐Peter Drucker
13

The Bottom-Up, Top-Down Approach
Project Identification•Inventory•Interviews•Other studies
Project Codification•Timeframe•Package•Investment Criteria
Project Selection•Project scores•Meet investment objectives
Building Portfolio Creation•Group Buildings•Outline investment strategies Funding
Identification•What financial resources are available?
Funding Allocation•By Portfolio•By Investment Criteria Multi-year
capital investment
plan
Technical
Strategic

Building Portfolio Identified Needs
15
$-
$50.00
$100.00
$150.00
$200.00
$250.00
$300.00
$350.00
$400.00
$ / G
ross
Squ
are
Foot
Identified Needs by Building
'C' (8-10 years)'B' (4-7 years)'A' (1-3 years)


Classroom Space UtilizationDaniel Hall will feel much more crowded than the other classroom buildings
17
34.6
22.6 20.9 20.8 20.6 20.6 17.2
0
5
10
15
20
25
30
35
40
Lee Martin Tillman Brackett Sirrine Poole Daniel
SF/Student by BuildingClassrooms Only
Included Classrooms
18 15 13 20 23 17 39
CHE Standard 22 ASF/Student Station
Daniel Hall is an out of date building in terms of
CR structure

0%
10%
20%
30%
40%
50%
60%
70%
80%
90%
100%Fall 2013 Utilization: Classrooms only, MTWRF
Room Utilization Position Utilization
Utilization Analysis – by Room-Type
Classrooms Laboratories (Wet & Dry) Lecture Halls Computer Laboratories
Included Classrooms: 243Included Classrooms: 243
18
gAverage: 64%p60% Optimal Room Utilization
gAverage: 47%
*Averages are for 8am-4:59pm
p75% Optimal Position Utilization

19
Realized Teaching Space Value

Total Project Inventory
$563.5 M
Grounds$54.2 M
Building Needs
$308.3 M
Academic$184.1 M
Administrative$13.5 M
Science/Research$93.5 M
Student Life
$5.5 MSupport$0.9 M
Other$2.5 M
Campus Wide
$8.3 M
Utility Infrastructure
$201.0 M
Functional Building PortfoliosNeeds distributed according to primary building function
20

Clemson: 2020 Forward
http://blogs.clemson.edu/2020forward/21

> Used 10 year BPS project plan to identify project needs for Facilities stewardship component of the 2020 Forward Plan.
> Used 10 year BPS plan and space utilization study to drive home the need to completely renew Daniel Hall and to propose Sirrine Hall as swing space and eventual repurposing.
> Space utilization study highlighted the need to leverage the value in underutilized scheduled classrooms and labs.
> Secured seat at the table for the implementation of the Facilities stewardship component of the 2020 Forward Plan.
Monopoly in Progress
22

Medical University of South Carolina
23

Database Distribution of Density
Less Foot Traffic at MUSCDensity is the lowest amongst peers and below database average
24
0
100
200
300
400
500
600
Use
rs/1
00,0
00 G
SF
Density Factor
Peer Average
MUSCPeers
Density Impacts:• Custodial Operations• Wear and Tear on Campus Facilities• Life Cycles of Building Components
Users/100,000 GSF

A More Intense CampusCampus users spread out over more buildings
25
Peer Average
-
2
4
6
8
10
12
14
16
18
MUSC Peer Average
Bld
gs/ 1
,000
,000
GSF
Building Intensity
0
100
200
300
400
500
600
Use
rs/1
00,0
00 G
SF
Density Factor
Peer Average

$31.7
$12.8$9.6
$17.9
$6.3
0.0
5.0
10.0
15.0
20.0
25.0
30.0
35.0
3% Replacement Value Life Cycle Need Annual Investment Target
$ in
Mill
ions
Annual Investment Target
Envelope/Mechanical Space/Program
$16M in Annual Need
26
Functional obsolescence drives investment prior to life cycles &
discounts the annual investment target
Can MUSC keep up with campus needs?
Replacement Value: $1.06B
Total $ $31.7M $30.7 $15.9

$0.0
$5.0
$10.0
$15.0
$20.0
$25.0
$30.0
$35.0
2009 2010 2011 2012 2013
$ in
Mill
ions
Total Capital Investment vs. Funding Target
Annual Stewardship Asset Reinvestment Annual Investment Target Life Cycle Need
Funding Needs to Grow!Recurring funds alone are not enough to reach targets
27
Increasing Net Asset Value
Lowering Risk Profile

If we utilize our space better, figure out how we can condense ourselves…we can divest ourselves of this overwhelming need.
28
Making the Problem Smaller…

When Rolling the Dice Doesn’t Work…
DATA can.
29

Aligning Investment Need with Our RCM Model
30
RCM Ownership
Total 10-Year Needs(Backlog plus 10-year Life
Cycle)
Potential Annual Charge
A&S‐Edu/Student Life $11,309,107 $1,130,911
A&S‐Library $4,743,028 $474,303 Aux Bookstore/
Vending $34,379 $3,438
Aux Wellness $9,210,388 $921,039
CDM $15,784,485 $1,578,449
CGS $265,779 $26,578
CHP $7,188,432 $718,843
COM $109,714,770 $10,971,477
CON $1,943,475 $194,348
COP $10,958,664 $1,095,866
MUHA $27,075,777 $2,707,578
VA $3,984,620 $398,462
External Tenant $860,517 $86,052
Total $203.1 M $20.3 M/year
$0
$100
$200
$300
$400
$500
$600
$ / O
ccup
ied
SF
Total Needs (10-year) /Occupied SF
Weighted Average

$0.0
$5.0
$10.0
$15.0
$20.0
$25.0
$30.0
$35.0
2009 2010 2011 2012 2013
Mill
ions
Total Capital Investment vs. Funding Target
Annual Stewardship Asset Reinvestment Annual Investment Target Life Cycle Need
Or! How Can we Lower the Line?Recurring funds alone are not enough to reach targets
31
Increasing Net Asset Value
Lowering Risk Profile

Marrying Master Planning with Condition Assessment How do we do it all?

The Benefit of Building Portfolios
Existing Inventory
33

Factors to Consider when Creating Portfolios
RCM Model
Financial Model
Building Characteristics
Purpose
Age Condition Location Function
Mission
Institutional Focus
Academic Requirements
Student Needs
Requirements
Historical Significance
Safety/Code Recruitment/
Retention
Transitional Space
Adaptive Reuse
Grounds & Infrastructure
Athletic Fields Utility Needs
34

35
Capital Upkeep Stage
Repair and M
aintain
Portfolios by Net Asset Value
(Replacement Value - Building Needs)
Replacement Value
Systemic Renovation Stage Tran
sitio
n / G
ut R
enov
atio
n St
age
>80%
<80%<60%
>60%

NAV by BuildingB
IOE
NG
INE
ER
ING
BU
ILD
ING
DR
UG
DIS
CO
VE
RY
BU
ILD
ING
DE
NTA
L C
LIN
ICS
BU
ILD
ING
HO
LLIN
GS
CA
NC
ER
CE
NTE
RD
AR
BY
CH
ILD
RE
N'S
RE
SE
AR
CH
INS
TC
OLL
OF
HLT
H P
RO
F C
OM
PLE
X "B
"H
AR
PE
R S
TUD
EN
T/W
ELL
NE
SS
CN
TRC
OLL
EG
E O
F N
UR
SIN
GC
OLB
ER
T E
DU
CE
NTE
R A
ND
LIB
RA
RY
135
CA
NN
ON
ST.
(CA
NN
ON
PLA
CE
)C
OLL
OF
HLT
H P
RO
F R
ES
RC
H B
LDG
CLI
NIC
AL
SC
IEN
CE
S B
UIL
DIN
GW
ALT
ON
RE
SE
AR
CH
BU
ILD
ING
STO
RM
EY
E IN
STI
TUTE
MO
DE
LLE
D B
UIL
DIN
GS
BA
SIC
SC
IEN
CE
BU
ILD
ING
E B
UIL
DIN
GTH
UR
MO
ND
/GA
ZES
RE
SE
AR
CH
BLD
GC
OLL
OF
HLT
H P
RO
F C
OM
PLE
X "A
"C
OLC
OC
K H
ALL
PS
YC
HIA
TRIC
INS
TITU
TEA
LUM
NI M
EM
OR
IAL
HO
US
E
BA
RU
CH
AU
DIT
OR
IUM
F B
UIL
DIN
G0%
10%
20%
30%
40%
50%
60%
70%
80%
90%
100%NAV Index by Building
Capital Upkeep Stage (>80%): Primarily new or recently renovated buildings w/ sporadic building repair & life cycle needs; “You pick the projects”
Repair and Maintain Stage (>70%): Buildings are beginning to show their age and may require more significant investment on a case-by-case basis
Systemic Renovation Stage (>60%): Buildings may require more significant repairs ; large-scale capital infusions/ renovations are inevitable; “The projects pick you”
Demolition/Transitional/ Gut Renovation Stage (<60%): Major buildings components are in jeopardy of complete failure.
36

BIO
EN
GIN
EE
RIN
G B
UIL
DIN
GD
RU
G D
ISC
OV
ER
Y B
UIL
DIN
GD
EN
TAL
CLI
NIC
S B
UIL
DIN
GH
OLL
ING
S C
AN
CE
R C
EN
TER
DA
RB
Y C
HIL
DR
EN
'S R
ES
EA
RC
H IN
ST
CO
LL O
F H
LTH
PR
OF
CO
MP
LEX
"B"
HA
RP
ER
STU
DE
NT/
WE
LLN
ES
S C
NTR
CO
LLE
GE
OF
NU
RS
ING
CO
LBE
RT
ED
U C
EN
TER
AN
D L
IBR
AR
Y13
5 C
AN
NO
N S
T. (C
AN
NO
N P
LAC
E)
CO
LL O
F H
LTH
PR
OF
RE
SR
CH
BLD
GC
LIN
ICA
L S
CIE
NC
ES
BU
ILD
ING
WA
LTO
N R
ES
EA
RC
H B
UIL
DIN
GS
TOR
M E
YE
INS
TITU
TEM
OD
ELL
ED
BU
ILD
ING
SB
AS
IC S
CIE
NC
E B
UIL
DIN
GE
BU
ILD
ING
THU
RM
ON
D/G
AZE
S R
ES
EA
RC
H B
LDG
CO
LL O
F H
LTH
PR
OF
CO
MP
LEX
"A"
CO
LCO
CK
HA
LLP
SY
CH
IATR
IC IN
STI
TUTE
ALU
MN
I ME
MO
RIA
L H
OU
SE
BA
RU
CH
AU
DIT
OR
IUM
F B
UIL
DIN
G0%
10%
20%
30%
40%
50%
60%
70%
80%
90%
100%NAV Index by Building
NAV by Building
37
Stewardship (>85%):
Ensure these don’t slip.
Reinvestment (<85%):
Need to qualify investment and prioritize.
Transitional (<50%)
Divest and don’t invest.

> Affirm the required space (using standards) we need for academic, research, clinical and support functions.
> ID functions that can be off campus (potential leaseholds)
> ID the appropriate buildings to optimize our utilization for these functions and assign on a matrix (next slide).
> Recommend buildings for re-purposing or divestment.
38
Enter our Master Facility PlanningUse space analysis and Strategic Plan Goals to:

Match Program Value to Campus Need
39
Prog
ram
Val
ue
Stewardship
Maintain/RepurposeTransitional Buildings
Major Capital Renovations
Poor Building Condition, High Program Value
Excellent Building Condition, High Program Value
Excellent Building Condition, Low Program Value
Poor Building Condition, Low Program Value

> Links building need to long term building investment requirements
> Allows us to develop a Real Estate Strategy
40
Integrating Building Portfolio & Master PlanningWhat’s in it for MUSC?
> Getting a seat at the table is not a given
> Your bank is not limitless
> You cannot start over
> Rolling the dice is a risk you cannot take
The Challenges of Playing Monopoly
41

Q&A

Presenter Profile
Robert (Bob) WellsChief Facilities OfficerClemson UniversityEmail: [email protected]
Caroline JohnsonRegional Service Manager –Member ServicesSightlines LLCEmail: [email protected]
Greg WeigleChief Facilities OfficerMedical University of SouthCarolinaEmail: [email protected]
43