doncasters group limited annual report 2016€¦ · doncasters group limited annual report ......
TRANSCRIPT
D o n c a s t e r s G r o u p L i m i t e d A n n u a l R e p o r t 2 0 1 6
1
Doncasters Group LimitedAnnual Report 2016
This report presents the financial results of Doncasters Group Limitedfor the year ended 31 December 2016.
Contents
Strategic report 2
Report of the directors 5
Independent auditors’ report 9
Consolidated income statement 11
Consolidated statement of comprehensive income 12
Consolidated statement of financial position 13
Consolidated statement of cash flows 14
Consolidated statement of changes in equity 15
Notes to the consolidated financial statements 16
Independent auditors’ report to the Company 56
Company financial statements 58
Subsidiary undertakings 63
D o n c a s t e r s G r o u p L i m i t e d A n n u a l R e p o r t 2 0 1 6
2
Strategic reportPrincipal activities
Doncasters is a leading worldwide supplier of high quality engineered components for aero engines, industrial gas turbines (“IGT”),fastener systems and other specialist high performance applications. The Group excels in working with alloys and complex designs inorder to meet customers’ demanding product specifications. Key materials include nickel-based superalloys, stainless steels andtitanium.
Specialist manufacturing capabilities include investment casting, centrifugal casting, precision forging, ring-rolling, machining, fabricationand specialist finishing activities. Further advanced technologies include superplastic forming, diffusion bonding and single crystalcasting.
The Group has a broad, blue-chip focused customer base, with no single customer directly accountable for more than 14% of aggregatesales in 2016. Building and maintaining secure customer relationships based upon best in class delivery and quality attainment forms amajor part of the Group’s strategy. Of the top 20 customers, which account for over 57% of sales, most have been customers for inexcess of 25 years, with many business relationships secured under long term supply agreements.
The Group operates from 32 principal manufacturing facilities based in the UK, US, Germany, Belgium, Mexico and China withheadquarters in Burton-upon-Trent, England. The Group has been majority owned by Dubai International Capital LLC and itssubsidiaries (“DIC”) since 2006.
Financial highlights
Results for the year & Key performance indicators
2016£ million
2015£ million
(Restated)
Sales 654.2 627.8
Underlying EBITDA
Underlying EBITDA Margin %
Less:Metals - Inventory and hedging lossesStep up adjustment in relation to acquisition of subsidiaryNon-cash (charges)/credits for long-term incentive plansNew England Airfoil Products disposalChange in basis of provisionForward foreign exchange contractsCosts associated with new product introduction and one off operational costs
100.9
15.4%
(2.1)(0.2)(0.1)
--
(2.5)(13.4)
114.4
18.2%
(4.7)-
1.8(0.5)(1.3)
--
Reported EBITDA before exceptional items 82.6 109.7
Underlying Operating Profit 74.0 90.5
Underlying Operating Margin % 11.3% 14.4%
Operating Profit 22.1 10.8
Cash Generated from Operations 68.4 96.4
Cash & Cash Equivalents 19.2 35.5
Underlying EBITDA is defined as operating profit prior to: step up adjustments in relation to acquisitions; inventory and hedging lossesrelating to metals; exceptional items; depreciation and impairment of property, plant and equipment; amortisation and impairment ofgoodwill and other intangibles; amortisation of government grants; profit or loss on sale of property, plant and equipment; non-cashcharges associated with certain long-term incentive plans; effects of gains and losses on unrealised forward foreign exchange contracts;one off costs associated with new product introduction; and one off operational costs. The operating loss of £0.5 million of New EnglandAirfoil Products was adjusted in 2015 following the disposal of the business in that year. Additionally the basis of a provision for USworkers’ compensation was amended in 2015 resulting in a one-off charge for historic claims.
Underlying Operating Profit is defined as operating profit prior to step up adjustments in relation to acquisitions; inventory and hedginglosses relating to metals; exceptional items; amortisation and impairment of goodwill and other intangibles; non-cash chargesassociated with certain long-term incentive plans; effects of gains and losses on unrealised forward foreign exchange contracts; one offcosts associated with new product introduction; and one off operational costs. The 2015 figure is stated prior to the New England AirfoilProducts disposal and the change in basis of provision described above.

D o n c a s t e r s G r o u p L i m i t e d A n n u a l R e p o r t 2 0 1 6
3
Strategic report (continued)Financial highlights (continued)
The Group made substantial progress in winning new work during the year which was reflected in a 41% increase in its order book during2016. There was also a shift in the aerospace and IGT businesses from legacy engines to next generation platforms which was evident inthe revenue generated for the year. Reported revenue increased by £26.4 million during the year to £654.2 million. Market conditions weremixed, with continued strong demand in Aerospace, IGT and commercial construction markets offset by weaker conditions in heavy dutytruck and mining markets. Revenue also benefitted from currency improvements of approximately £43.5 million relating to the translation ofoverseas sales. Reported sales were reduced by £13.5 million due to lower input metals prices which are broadly passed on to the Group’send customers in full.
Underlying EBITDA reduced to £100.9 million which is mainly attributable to costs and inefficiencies which are part of the transition fromlegacy engine platforms to the next generation of components. Over time the Group anticipates margins generated on these new platformswill be similar to the legacy platforms but it will take time to lean out the new programmes. Action was taken where possible to maintainmargins through cost management. Underlying EBITDA margin was 15.4%. Reported EBITDA before exceptional items was £82.6 million(2015: £109.7 million).
Operating profit was £22.1 million compared to £10.8 million in 2015. Cash generated from operations of £68.4 million (2015: £96.4million). The Group made significant capital investments during the year in order to support growth and customer commitments.
Group liquidity remains healthy with cash and cash equivalents of £19.2 million (2015: £35.5 million) including restricted cash of £2.3 million(2015: £1.9 million) and £41.5 million of the maximum £84 million revolving credit facility available for draw down at the year end.
The Group acquired TOG Manufacturing, a manufacturer of components for the steam power generation market, which added £2.2 millionto 2016 revenue. TOG Manufacturing generates annual sales of approximately £5.4 million and operating profit of £0.9 million. Groupresults for 2016 include £0.1 million of operating profit in relation to TOG Manufacturing, which includes a cost of £0.2 million incurred aspart of the step up in the valuation of inventory upon acquisition.
Following a detailed review of the results reported by the Group’s Chinese subsidiary a number of accounting irregularities have beenidentified related to previously published results. As a result of this review changes have been made to strengthen controls within thebusiness and also restate historic numbers to align with the Group’s accounting policies. Further details are shown in note 1 to the FinancialStatements.
Debt structure
The weakening of sterling against the dollar during the year from $1.4739: £1 at 31 December 2015 to $1.2357: £1 at 31 December2016 has affected levels of bank debt held on a reported basis. The change in exchange rates has increased bank debt by £107.2million in sterling equivalent.
As a result bank loans at 31 December 2016 totalled £829.3 million (2015: £687.2 million) comprising 1st Lien loans of £708.7 million(2015: £620.4 million), 2nd Lien Loans of £78.1 million (2015: £65.0 million) and multi-currency revolving loan facilities of £42.5 million(2015: £1.8 million).
Dubai International Capital (“DIC”) and management loan notes, being unsecured subordinated loan notes, totalled £379.4 million(2015: £336.2 million). These have a nominal value at 31 December 2016 of £561.6 million (2015 £535.9 million). Further details areshown in notes 15 and 16 to the Financial Statements.
Other long term commitments
The Group operates a number of defined benefit and defined contribution pension arrangements in the UK, US and Continental Europe.All UK defined benefit schemes are closed to new entrants. The Group’s net pension asset, calculated in accordance with IAS 19(revised), at 31 December 2016 (excluding other post-employment benefits) was £30.2 million (2015: £34.2 million). The two UKschemes were closed to future accrual from 1 October 2016 after consultation with members.
Other post-employment benefits are provided for certain US current and past employees and calculated in accordance with IAS 19(revised). At 31 December 2016 the liabilities for these plans amounted to £3.2 million (2015: £11.3 million). The Doncasters Inc. postretirement medical plan was settled in cash in the year, resulting in a settlement gain of £8.5 million.
Further details are shown in note 20 to the Financial Statements.
D o n c a s t e r s G r o u p L i m i t e d A n n u a l R e p o r t 2 0 1 6
4
Strategic report (continued)Risk management
The Group uses a framework aimed at identifying, evaluating and managing significant risks. The framework is not designed toeliminate risk. Risks are recorded in regularly updated risk registers operating at all levels of the organisation and are reviewed andmonitored. There are specific programmes in place for health and safety, environmental and export compliance. There is also acomprehensive insurance programme.
The principal risks and uncertainties facing the Group are set out below:
Risk arising Mitigation
Customer demand is affected by changes in
end market demand such as electricity
consumption, oil prices and aircraft & power
station build programmes
The Group has a diversified portfolio of businesses, products and end markets which limits the risk to a
change in the demand in a single end market. Additionally new business is targeted in the markets
which offer the greatest potential for growth.
Customer demand is affected by competition
or customer sourcing decisions
We seek to mitigate such risk by spreading our sales revenues across a number of customers, and
entering into long term agreements where this is the market norm. Competitive pressures can increase
during periods of economic downturn, and as long term agreements become due for re-negotiation
there is a risk that pricing and other contractual terms may be less attractive.
Products supplied may not comply with
customer specifications and designs. This
provides for the risk of returned products or
customer claims
The Group generally supplies customers with products manufactured to customers’ designs and
specifications according to agreed manufacturing processes. Additionally the Group has rigorous
internal quality checks which are designed to ensure products are appropriately tested and validated
prior to supply to customers.
Costs of new product introduction exceed
those planned or forecast in customer pricing
proposals.
The Group has a robust bidding and costing process. New product introduction is tracked through eachdevelopment stage and progress is monitored by the Group at all levels.
Supply of products may be affected by the
ability of the Group to source appropriate
components at the required time
Active monitoring of the financial viability of our suppliers is undertaken. Contingency plans exist whichinclude for key suppliers and materials the potential for secondary sourcing. Additionally productionscheduling is routinely undertaken which provides key suppliers with a clear understanding offorthcoming demand.
Failure to retain key personnel The Group maintains development and succession programmes, competitive remuneration packagesand good communications at all levels.
Failure to comply with laws and regulations
governing our production plants, such as
health and safety, and environmental
requirements
Each business operates according to strict policies and procedures regarding compliance with health
and safety and environmental legislation. These procedures are monitored by an environmental health
and safety officer for each territory in which the Group operates. There is regular reporting to the board
regarding the Group’s compliance with such legislation.
Failure to comply with the requirements of the
Group’s borrowing agreements
The Group monitors compliance with its borrowing agreements on an ongoing basis.
Failure to comply with Group accounting
policies and controls and procedures
The Group monitors compliance with internal controls and procedures on a regular basis. This includes
documented policies and procedures, a regular programme of self-certifications and visits by internal
and external audit to verify compliance.
Outlook
2016 has been a year of positioning for growth through investment and product introduction. The Group has seen a substantial increasein its order book and new product pipeline which is expected to lead to growth in sales and earnings in 2017 supported by encouragingmarket conditions.
On behalf of the BoardD SmootChief Executive Officer
30 March 2017
D o n c a s t e r s G r o u p L i m i t e d A n n u a l R e p o r t 2 0 1 6
5
Report of the directorsThe directors present their annual report, the audited consolidated financial statements of Doncasters Group Limited and its subsidiaries(the “Group”), and the audited financial statements of the parent company, Doncasters Group Limited (the “Company”), companyregistration number 05651556, for the year ended 31 December 2016.
The Board of Directors
The Group has an experienced Board which monitors results and sets key priorities for the Group’s executive management. The Boardmeets at least four times a year. The directors of the Company who were in office during the year and up to the date of signing the financialstatements were:
Executive Directors
CEO – David SmootCFO – Duncan HinksMichael Schurch (Resigned 23 March 2016)
Non-Executive Directors
Chairman - Christopher RowlandsChristopher MaussAidan Birkett
Secretary to the Board
Ian Molyneux
The senior executive management structure includes an Executive Leadership Team comprising the CEO, CFO, Managing Directors andPresidents of the operating divisions, and the General Counsel and Group Company Secretary. The Team meets regularly and hasresponsibility for development and execution of operational strategies.
The Executive Leadership Team receives regular and comprehensive financial reports, summarised versions of which are prepared for theBoard. All operating subsidiaries are monitored against a wide range of performance metrics and trends, benchmarked to operatingbudgets and prior periods. These are aggregated at divisional level and are reviewed with executive management across a weekly,monthly and quarterly control cycle.
Customers
The Group is committed to its customers and customer satisfaction through quality of product and delivery performance is a keystrategic priority. Our mission is to become the supplier of choice by aligning ourselves with the long-term vision of our customers andoffering superior quality, technology and service. The Group continually invests in its processes and capability to support the growth ofits customers and meet their needs.
Employees
The Group firmly believes in recognising the contribution to its success of well-motivated and dedicated employees and to involvingthem fully in the Group’s fortunes. Employees are informed of the performance of their individual operating location and of the Group onan ongoing basis. This information includes matters relating to their location’s performance, its prospects and future outlook of thebusiness. Employees are encouraged to contribute ideas for improvement of the Group in all communication forums.
The Group is committed to ensuring that the right talent is in place, or will become available at the right time, to satisfy business needsand to ensure employees are given full encouragement to fulfil their potential. Employees are encouraged to gain appropriate skills, andopportunities are provided to achieve this.
We invest considerable resources in talent management and succession planning. All jobs within the Group have been assessed undera global grading structure, benchmarked to external organisations and roles. We have implemented a rigorous programme ofperformance development reviews across the Group, where performance, competencies and personal development programmes arediscussed between the employee and their manager. We have implemented a programme of succession planning, and are seeking toidentify all individuals capable of future promotion, and to identify potential successor candidates for all managerial roles within theGroup. Our leadership development programme has continued during the year in the UK, Europe and the US.

D o n c a s t e r s G r o u p L i m i t e d A n n u a l R e p o r t 2 0 1 6
6
Report of the directors (continued)Employees (continued)
Fair and full consideration is given to applications for employment from disabled persons having regard to their particular aptitudes andabilities. Training, career development and promotion are, as far as practicable, identical for all employees.
The Group consistently seeks to recruit, develop and employ suitably qualified, capable and experienced people in an environment ofequal opportunity ensuring no employee or applicant is treated less favourably on the grounds of race, religion, ethnic origin, age,disability or sexual orientation.
The Group is committed to ensure that employees have the right to raise concerns on any matter they feel appropriate with seniormanagement, without fear of prejudice or victimisation. To that end we operate a global helpline, which employees can callanonymously should they so wish. All calls are followed up by management and actions are taken where appropriate.
The Group operates a long-term incentive plan for its senior employees. A charge of £0.1 million (2015: £1.8 million credit) has beenrecorded in the accounts. In 2016 this relates solely to a Management Equity Plan, further details of which are shown in note 21 to theFinancial Statements. In 2015 a credit of £0.1 million was recognised in relation to this plan in accordance with IFRS 2.
Health and safety and the environment
The Group is committed to safeguarding a core value of the Group, being health and safety of its employees, contractors and othersaffected by its activities. Implementation of health and safety policies and procedures is a key management task and compliance withthe highest standards is monitored both at operating company level and at Board level where it is regularly reviewed. Most facilities areOHSAS 18001 registered with robust health and safety management systems in place.
Environmental awareness and best practice continues to be a high priority item. Concern for the environment and the community issupported by a rigorous statement of environmental policy and all operating locations are charged with its implementation. Groupspecialist staff are available for support and advice, as well as measuring and monitoring performance. Most facilities are OHSAS 14001registered with robust environmental management systems in place to prevent accidental release of hazardous materials, reduce facilityemissions and to conserve natural resources through waste minimisation and recycling efforts.
Directors’ remuneration
The remuneration of the directors was as follows:-Year ended Year ended
31 December 2016 31 December 2015£ million £ million
(Audited) (Audited)
Aggregate emoluments* 1.0 1.3Highest paid director
- Aggregate emoluments* 0.6 0.8
*Excluding compensation for loss of office
There was no compensation for loss of office in 2016 (2015: £2.2 million).
The remuneration shown above was paid by Doncasters Limited, a subsidiary of Doncasters Group Limited and by Dubai InternationalCapital LLC, the owners of Doncasters Group Limited.
Company contributions paid in respect of money purchase plans were £23,782 (2015: £nil).
During the year ended 31 December 2016 no directors accrued defined benefit pension scheme benefits (2015: £nil).
Service contracts
Executive directors have service agreements terminable by either party with a maximum twelve month notice period.
Directors’ indemnity
As permitted by the Articles of Association, the directors have the benefit of an indemnity which is a qualifying third party indemnityprovision as defined by Section 234 of the Companies Act 2006. The indemnity was in force throughout the last financial year and iscurrently in force. The Company also purchased and maintained throughout the financial year Directors’ and Officers’ liability insurancein respect of itself and its directors.

D o n c a s t e r s G r o u p L i m i t e d A n n u a l R e p o r t 2 0 1 6
7
Report of the directors (continued)
Financial risk management
We have a number of long-term agreements to supply customers on fixed price contracts, or where price changes are limited.Accordingly, we are exposed to increases or decreases in the costs of manufacturing products. This risk is managed by ensuringestimated costs for new products are based on reliable historic data, and by negotiating price flexibility in relation to changes in inputprices of metals where this is appropriate.
We operate in and sell products to a range of countries with different currencies resulting in an exposure to exchange rates. Transactionrisk arises where revenues are made in currencies different from those of the costs of manufacture. Short-term (generally up to twoyears) transaction risk is managed using hedging techniques, but the Group remains exposed to the long-term risk of exchange ratefluctuations. In addition, from time to time, credit lines to enter into appropriate short-term hedging may not be available from suitablecounterparties and this may result in short-term exposure to movement in exchange rates. Mitigation is achieved by sourcing goods andservices in the same currencies as the exposure. Translation risk arises on the translation of income statements of overseassubsidiaries.
Credit risks exist in relation to customers, banks and insurers. We mitigate these risks by applying rigorous credit control practices,maintaining a wide banking group and monitoring relationships with our lending banks and counterparties to our treasury instruments.We also select insurers with good credit ratings.
The funding of the Group’s post-retirement benefits may be adversely affected by poor investment performance, changes in interest andinflation rates, improved mortality rates and changes in the regulatory environment. The income statement and level of cashcontributions required may be affected accordingly. We monitor this risk by consulting closely with the trustees and advisors to ourschemes, and mitigate the risks by modifying future service benefits and agreeing prudent deficit recovery plans where appropriate.
Our debt structure includes borrowings in different territories and different currencies. Translation risk arises on the translation of netassets, and transaction risk arises on the costs of interest service. Risks are mitigated through the use of hedging instruments such asforward foreign exchange contracts. Interest rates can vary; interest rate risks and other treasury and related risks are managed asdescribed in notes 1 and 16 to the financial statements.
Research and development
Research and development capability is split between operating company initiatives and Group-wide technology projects aimed atadding value to core business activities.
We continue to operate a Group Technical Centre which hosts researchers, technologists and technicians. The focus of the team is toachieve world leading yields and to develop new intellectual property.
Research and development expenditure amounting to £2.0 million was capitalised as an intangible asset during the year (2015: £3.0million). Research and development expenditure charged to the income statement totalled £2.2 million (2015: £2.5 million).
Outlook
Details concerning the future outlook for the Group are included within the Strategic report on page 4.
Going concern
The Directors have performed a going concern assessment by reviewing the latest forecasts and trading prospects of the Group. Theforecasts for 2017 have been formally reviewed and adopted by the Board. Additionally the Directors have considered longer rangeforecasts into 2018 in line with the multi-year plan prepared and approved by the Board. These forecasts indicate an improvement inoperating performance in 2017 which is linked to the increasing order book, generally favourable markets and improving operationalperformance as new products are industrialised. The Directors have also considered available headroom under the Group’s facilitiesand are satisfied that sufficient headroom exists and levers are available to the Group to manage a number of reasonable down sidesensitivities in terms of trading and cash performance. In this regard it should also be noted that the Group’s £110 million revolvingcredit facilities are due for renewal in April 2018 and the Directors are satisfied that the most likely outcome is that these are extendedon terms acceptable to the Group. Whilst no final agreement has been reached regarding the extension of these revolving creditfacilities the Directors have received indications of support to renew the facility as it falls due. While there can be no certainty that theseforecasts can be achieved, the Directors can see no reasonable outcome where the Group would not have sufficient financial resourcesto meet financial obligations as they fall due.
Dubai International Capital LLC (“DIC”), the majority owner of the Group, had certain debt facilities which matured on 31 December2016 for which the shares in the Group are held as collateral. A sale process was initiated in 2016 for DIC to dispose of the Group andgenerate proceeds to repay a substantial share of DIC’s debt facilities. The sale process has generated significant interest and apotential buyer is currently in exclusive discussions to agree a transaction in the first half of 2017. At this stage the Directors believethere is nothing to suggest that the DIC lenders would take actions detrimental to a successful sale of the Group or its ability to continuetrading as a going concern; in the event that the sale of the Group does not take place, they expect the DIC debt facilities to beextended or restructured without any disruption to the Group. However, there is no certainty as to the DIC lenders’ actions. Additionallythe expected sale proceeds for the Group are likely to lead to the need to restructure the unsecured subordinated loan notes but untilfinal timings and proceeds are known this action is not certain.
The conditions outlined above and as described within the financial statements indicate the existence of material uncertainties, whichmay cast significant doubt on the Group’s ability to continue as a going concern. However, in consideration of all of the relevant factorsthe Directors have concluded that it is appropriate to prepare the accounts on a going concern basis. Therefore, the financial statementsdo not include the adjustments that would result if the Group and Company were unable to continue as a going concern.
D o n c a s t e r s G r o u p L i m i t e d A n n u a l R e p o r t 2 0 1 6
8
Report of the directors (continued)
Statement of directors’ responsibilities in respect of the financial statements
The directors are responsible for preparing the Annual Report and the Group and the Company financial statements in accordance withapplicable law and regulations.
Company law requires the directors to prepare financial statements for each financial year. Under that law the directors have preparedthe group financial statements in accordance with International Financial Reporting Standards (IFRSs) as adopted by the EuropeanUnion and parent company financial statements in accordance with United Kingdom Generally Accepted Accounting Practice (UnitedKingdom Accounting Standards, comprising FRS 102 “The Financial Reporting Standard applicable in the UK and Republic of Ireland”,and applicable law). Under company law the directors must not approve the financial statements unless they are satisfied that they givea true and fair view of the state of affairs of the group and parent company and of the profit or loss of the group and parent company forthat period. In preparing the financial statements, the directors are required to:
select suitable accounting policies and then apply them consistently; make judgements and accounting estimates that are reasonable and prudent; state whether applicable IFRSs as adopted by the European Union have been followed for the group financial statements and
United Kingdom Accounting Standards, comprising FRS 102, have been followed for the company financial statements,subject to any material departures disclosed and explained in the financial statements;
notify its shareholders in writing about the use of disclosure exemptions, if any, of FRS 102 used in the preparation of thefinancial statements; and
prepare the financial statements on the going concern basis unless it is inappropriate to presume that the Group and theCompany will continue in business.
The directors are responsible for keeping adequate accounting records that are sufficient to show and explain the group and parentcompany's transactions and disclose with reasonable accuracy at any time the financial position of the group and parent company andenable them to ensure that the financial statements comply with the Companies Act 2006 and, as regards the group financialstatements, Article 4 of the IAS Regulation.
The directors are also responsible for safeguarding the assets of the group and parent company and hence for taking reasonable stepsfor the prevention and detection of fraud and other irregularities.
In the case of each director in office at the date the Directors’ Report is approved:
so far as the director is aware, there is no relevant audit information of which the group and parent company’s auditors areunaware; and
they have taken all the steps that they ought to have taken as a director in order to make themselves aware of any relevantaudit information and to establish that the group and parent company’s auditors are aware of that information.
By Order of the BoardI MolyneuxGroup Company Secretary
30 March 2017
9
Independent auditors’ report to the members of DoncastersGroup Limited
Report on the group financial statements
Our opinionIn our opinion, Doncasters Group Limited’s group financial statements (the “financial statements”):
give a true and fair view of the state of the group’s affairs as at 31 December 2016 and of its loss and cash flows for the yearthen ended;
have been properly prepared in accordance with International Financial Reporting Standards (“IFRSs”) as adopted by theEuropean Union; and
have been prepared in accordance with the requirements of the Companies Act 2006.
Emphasis of matter - Going concernIn forming our opinion on the financial statements, which is not modified, we have considered the adequacy of the disclosure made innote 1 to the financial statements concerning the group’s ability to continue as a going concern. There exists uncertainty regarding theGroup’s ability to extend its revolving credit facility beyond April 2018. In addition there is also uncertainty over the actions that may betaken by the lenders to the parent company of the Group in the event that a sale of the Group, which would allow settlement of asubstantial share of the debt that is currently due and secured on the Group, does not take place. These conditions, along with the othermatters explained in note 1 to the financial statements, indicate the existence of material uncertainties which may cast significant doubtabout the group’s ability to continue as a going concern. The financial statements do not include the adjustments that would result if thegroup was unable to continue as a going concern.
What we have auditedThe financial statements, included within the Annual report (the “Annual Report”), comprise:
the consolidated statement of financial position as at 31 December 2016;
the consolidated income statement and consolidated statement of comprehensive income for the year then ended;
the consolidated statement of cash flows for the year then ended;
the consolidated statement of changes in equity for the year then ended; and
the notes to the financial statements, which include a summary of significant accounting policies and other explanatoryinformation.
Certain required disclosures have been presented elsewhere in the Annual Report, rather than in the notes to the financial statements.These are cross-referenced from the financial statements and are identified as audited.
The financial reporting framework that has been applied in the preparation of the financial statements is IFRSs as adopted by theEuropean Union, and applicable law.
In applying the financial reporting framework, the directors have made a number of subjective judgements, for example in respect ofsignificant accounting estimates. In making such estimates, they have made assumptions and considered future events.
Opinion on other matter prescribed by the Companies Act 2006
In our opinion, based on the work undertaken in the course of the audit:
the information given in the Strategic Report and the Report of the directors for the financial year for which the financialstatements are prepared is consistent with the financial statements; and
the Strategic Report and the Report of the directors have been prepared in accordance with applicable legal requirements.
In addition, in light of the knowledge and understanding of the group and its environment obtained in the course of the audit, we arerequired to report if we have identified any material misstatements in the Strategic Report and the Report of the directors. We havenothing to report in this respect.
Other matters on which we are required to report by exception
Adequacy of information and explanations receivedUnder the Companies Act 2006 we are required to report to you if, in our opinion, we have not received all the information andexplanations we require for our audit. We have no exceptions to report arising from this responsibility.
Directors’ remunerationUnder the Companies Act 2006 we are required to report to you if, in our opinion, certain disclosures of directors’ remuneration specifiedby law are not made. We have no exceptions to report arising from this responsibility.
10
Independent auditors’ report to the members of DoncastersGroup Limited (continued)
Responsibilities for the financial statements and the audit
Our responsibilities and those of the directorsAs explained more fully in the Statement of directors' responsibilities set out on page 8, the directors are responsible for the preparationof the financial statements and for being satisfied that they give a true and fair view.
Our responsibility is to audit and express an opinion on the financial statements in accordance with applicable law and InternationalStandards on Auditing (UK and Ireland) (“ISAs (UK & Ireland)”). Those standards require us to comply with the Auditing PracticesBoard’s Ethical Standards for Auditors.
This report, including the opinions, has been prepared for and only for the company’s members as a body in accordance with Chapter 3of Part 16 of the Companies Act 2006 and for no other purpose. We do not, in giving these opinions, accept or assume responsibility forany other purpose or to any other person to whom this report is shown or into whose hands it may come save where expressly agreedby our prior consent in writing.
What an audit of financial statements involvesWe conducted our audit in accordance with ISAs (UK & Ireland). An audit involves obtaining evidence about the amounts anddisclosures in the financial statements sufficient to give reasonable assurance that the financial statements are free from materialmisstatement, whether caused by fraud or error. This includes an assessment of:
whether the accounting policies are appropriate to the group’s circumstances and have been consistently applied andadequately disclosed;
the reasonableness of significant accounting estimates made by the directors; and
the overall presentation of the financial statements.
We primarily focus our work in these areas by assessing the directors’ judgements against available evidence, forming our ownjudgements, and evaluating the disclosures in the financial statements.
We test and examine information, using sampling and other auditing techniques, to the extent we consider necessary to provide areasonable basis for us to draw conclusions. We obtain audit evidence through testing the effectiveness of controls, substantiveprocedures or a combination of both.
In addition, we read all the financial and non-financial information in the Annual Report to identify material inconsistencies with theaudited financial statements and to identify any information that is apparently materially incorrect based on, or materially inconsistentwith, the knowledge acquired by us in the course of performing the audit. If we become aware of any apparent material misstatementsor inconsistencies we consider the implications for our report. With respect to the Strategic Report and Report of the directors, weconsider whether those reports include the disclosures required by applicable legal requirements.
Other matter
We have reported separately on the parent company financial statements of Doncasters Group Limited for the year ended 31 December2016. That report includes an emphasis of matter.
David Teager (Senior Statutory Auditor)for and on behalf of PricewaterhouseCoopers LLPChartered Accountants and Statutory AuditorsEast Midlands30 March 2017
D o n c a s t e r s G r o u p L i m i t e d A n n u a l R e p o r t 2 0 1 6
11
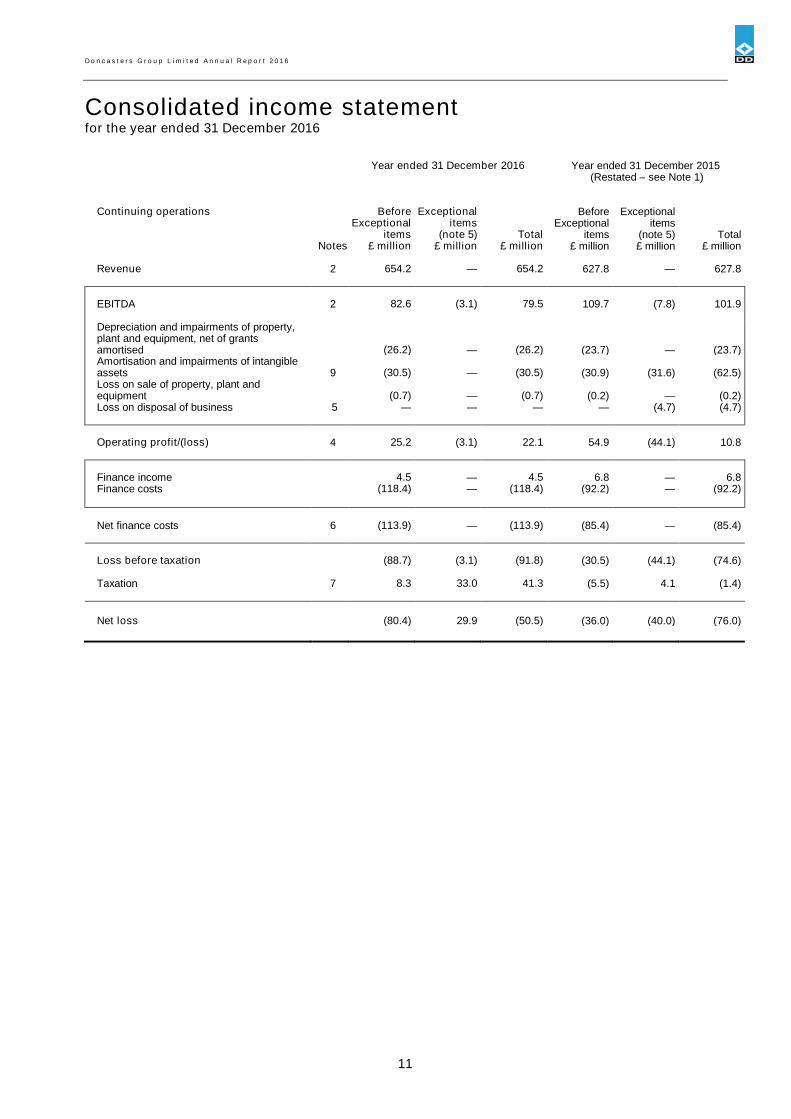
Consolidated income statementfor the year ended 31 December 2016
Year ended 31 December 2016 Year ended 31 December 2015(Restated – see Note 1)
Continuing operations Before Exceptional Before ExceptionalExceptional items Exceptional items
items (note 5) Total items (note 5) TotalNotes £ million £ million £ million £ million £ million £ million
Revenue 2 654.2 — 654.2 627.8 — 627.8
EBITDA 2 82.6 (3.1) 79.5 109.7 (7.8) 101.9
Depreciation and impairments of property,plant and equipment, net of grantsamortised (26.2) — (26.2) (23.7) — (23.7)Amortisation and impairments of intangibleassets 9 (30.5) — (30.5) (30.9) (31.6) (62.5)Loss on sale of property, plant andequipment (0.7) — (0.7) (0.2) — (0.2)Loss on disposal of business 5 — — — — (4.7) (4.7)
Operating profit/(loss) 4 25.2 (3.1) 22.1 54.9 (44.1) 10.8
Finance income 4.5 — 4.5 6.8 — 6.8Finance costs (118.4) — (118.4) (92.2) — (92.2)
Net finance costs 6 (113.9) — (113.9) (85.4) — (85.4)
Loss before taxation (88.7) (3.1) (91.8) (30.5) (44.1) (74.6)
Taxation 7 8.3 33.0 41.3 (5.5) 4.1 (1.4)
Net loss (80.4) 29.9 (50.5) (36.0) (40.0) (76.0)
D o n c a s t e r s G r o u p L i m i t e d A n n u a l R e p o r t 2 0 1 6
12
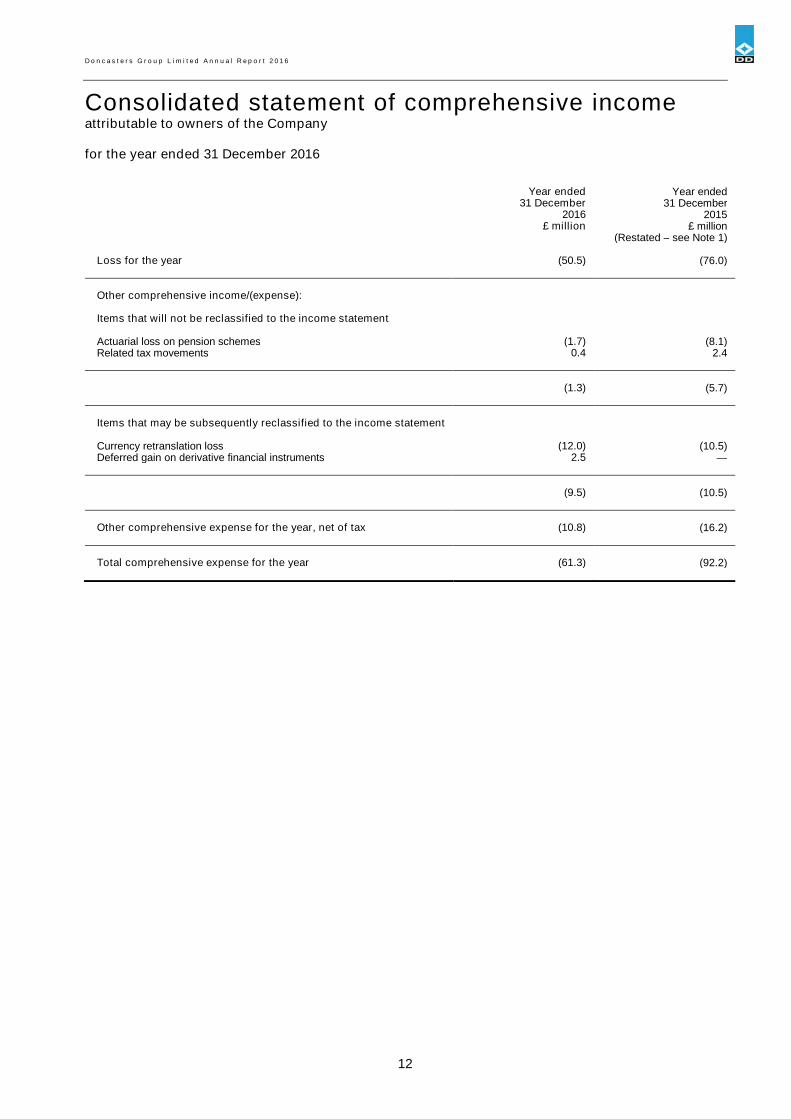
Consolidated statement of comprehensive incomeattributable to owners of the Company
for the year ended 31 December 2016
Year ended Year ended31 December 31 December
2016 2015£ million £ million
(Restated – see Note 1)
Loss for the year (50.5) (76.0)
Other comprehensive income/(expense):
Items that will not be reclassified to the income statement
Actuarial loss on pension schemes (1.7) (8.1)Related tax movements 0.4 2.4
(1.3) (5.7)
Items that may be subsequently reclassified to the income statement
Currency retranslation loss (12.0) (10.5)Deferred gain on derivative financial instruments 2.5 —
(9.5) (10.5)
Other comprehensive expense for the year, net of tax (10.8) (16.2)
Total comprehensive expense for the year (61.3) (92.2)

D o n c a s t e r s G r o u p L i m i t e d A n n u a l R e p o r t 2 0 1 6
13
Consolidated statement of financial positionat 31 December 2016
Registered number: 05651556 2016 2015Notes £ million £ million
(Restated – See Note 1)
Non-current assetsIntangible assets 9 396.6 379.8Property, plant and equipment 10 241.1 180.8Available-for-sale financial assets 11 0.5 0.5Trade and other receivables 13 0.2 —Derivative financial instruments 16 2.9 —Pension asset for scheme surpluses 20 64.4 62.8Deferred tax assets 19 14.0 6.8
Total non-current assets 719.7 630.7
Current assetsInventories 12 137.1 114.1Trade and other receivables 13 133.4 125.3Taxation recoverable 1.7 0.8Derivative financial instruments 16 3.5 0.2Cash and cash equivalents 14 19.2 35.5
Total current assets 294.9 275.9
Current liabilitiesBorrowings due within one year 15 (28.9) (8.8)Derivative financial instruments 16 (3.8) (1.6)Provisions 18 (8.3) (5.4)Trade and other payables 17 (101.7) (87.7)Current tax liabilities (2.0) (1.9)
Total current liabilities (144.7) (105.4)
Net current assets 150.2 170.5
Total assets less current liabilities 869.9 801.2
Non-current liabilitiesBorrowings due after more than one year 15 1,179.8 1,014.6Derivative financial instruments 16 0.8 —Trade and other payables 17 2.6 1.3Deferred tax liabilities 19 71.9 106.8Pension liability for scheme obligations 20 37.4 39.9
Total non-current liabilities 1,292.5 1,162.6
Shareholders’ equityCalled up share capital 21 0.6 0.6Share premium account 21 57.9 57.9Contributed capital 217.7 217.7Other reserves (17.4) (8.0)Retained earnings (681.4) (629.6)
Total shareholders’ deficit (422.6) (361.4)
Total capital employed 869.9 801.2
The financial statements on pages 11 to 55 were approved by the Board of directors on 30 March 2017 and signed on its behalf by:
D Smoot, Chief Executive Officer D Hinks, Chief Financial Officer

D o n c a s t e r s G r o u p L i m i t e d A n n u a l R e p o r t 2 0 1 6
14
Consolidated statement of cash flowsfor the year ended 31 December 2016
Notes Year ended Year ended31 December 31 December
2016 2015£ million £ million
Cash flow from operating activitiesCash generated from operations 22 68.4 96.4Net income tax paid (7.0) (6.0)
Net cash generated from operating activities 61.4 90.4
Cash flows from investing activitiesInterest received — 0.5Purchase of property, plant and equipment (62.9) (20.3)Purchase of intangibles (4.2) (3.7)Disposal of property, plant and equipment 0.1 0.8Disposal of business — 2.3
Grants received 1.5 —
Other disposals 0.7 0.5Acquisition of group companies (4.5) —
Net cash used in investing activities (69.3) (19.9)
Cash flows from financing activitiesInterest paid (38.8) (39.2)Proceeds from settlement of foreign exchange hedge — 7.9Proceeds from borrowings 39.8 1.4Repayment of borrowings (9.4) (63.4)
Net cash used in financing activities (8.4) (93.3)
Net decrease in cash and cash equivalents (16.3) (22.8)
Cash and cash equivalents at the beginning of the year 35.5 58.3
Effect of foreign currency exchange rate changes — —
Cash and cash equivalents at the end of the year 14 19.2 35.5
D o n c a s t e r s G r o u p L i m i t e d A n n u a l R e p o r t 2 0 1 6
15
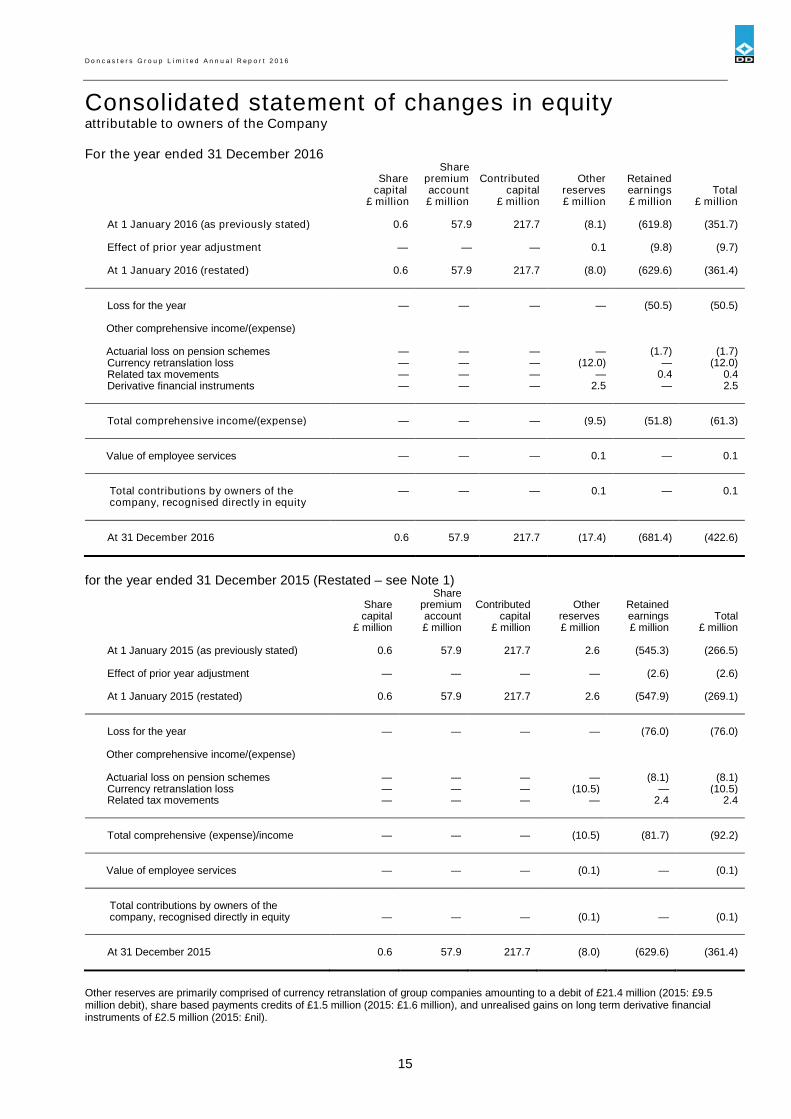
Consolidated statement of changes in equityattributable to owners of the Company
For the year ended 31 December 2016Share
Share premium Contributed Other Retainedcapital account capital reserves earnings Total
£ million £ million £ million £ million £ million £ million
At 1 January 2016 (as previously stated) 0.6 57.9 217.7 (8.1) (619.8) (351.7)
Effect of prior year adjustment — — — 0.1 (9.8) (9.7)
At 1 January 2016 (restated) 0.6 57.9 217.7 (8.0) (629.6) (361.4)
Loss for the year — — — — (50.5) (50.5)
Other comprehensive income/(expense)
Actuarial loss on pension schemes — — — — (1.7) (1.7)Currency retranslation loss — — — (12.0) — (12.0)Related tax movements — — — — 0.4 0.4Derivative financial instruments — — — 2.5 — 2.5
Total comprehensive income/(expense) — — — (9.5) (51.8) (61.3)
Value of employee services — — — 0.1 — 0.1
Total contributions by owners of thecompany, recognised directly in equity
— — — 0.1 — 0.1
At 31 December 2016 0.6 57.9 217.7 (17.4) (681.4) (422.6)
for the year ended 31 December 2015 (Restated – see Note 1)Share
Share premium Contributed Other Retainedcapital account capital reserves earnings Total
£ million £ million £ million £ million £ million £ million
At 1 January 2015 (as previously stated) 0.6 57.9 217.7 2.6 (545.3) (266.5)
Effect of prior year adjustment — — — — (2.6) (2.6)
At 1 January 2015 (restated) 0.6 57.9 217.7 2.6 (547.9) (269.1)
Loss for the year — — — — (76.0) (76.0)
Other comprehensive income/(expense)
Actuarial loss on pension schemes — — — — (8.1) (8.1)Currency retranslation loss — — — (10.5) — (10.5)Related tax movements — — — — 2.4 2.4
Total comprehensive (expense)/income — — — (10.5) (81.7) (92.2)
Value of employee services — — — (0.1) — (0.1)
Total contributions by owners of thecompany, recognised directly in equity — — — (0.1) — (0.1)
At 31 December 2015 0.6 57.9 217.7 (8.0) (629.6) (361.4)
Other reserves are primarily comprised of currency retranslation of group companies amounting to a debit of £21.4 million (2015: £9.5million debit), share based payments credits of £1.5 million (2015: £1.6 million), and unrealised gains on long term derivative financialinstruments of £2.5 million (2015: £nil).

D o n c a s t e r s G r o u p L i m i t e d A n n u a l R e p o r t 2 0 1 6
16
Notes to the consolidated financial statements
1 Principal accounting policies
The Company
Doncasters Group Limited (the “Company”) is a company domiciled and incorporated in the United Kingdom. The consolidated financialstatements for the year ended 31 December 2016 comprise the Company and its subsidiaries (together referred to as the “Group”).
Basis of preparation
The consolidated financial statements have been prepared in accordance with International Financial Reporting Standards (IFRSs) asendorsed by the EU, including the International Financial Reporting Interpretations Committee (IFRIC) and with the Companies Act2006 as applicable to companies using IFRS.
IAS 1 (revised), ‘Presentation of financial statements’ prohibits the presentation of items of income and expenses (that is ‘non-ownerchanges in equity’) in the statement of changes in equity, requiring ‘non-owner changes in equity’ to be presented separately fromowner changes in equity. All ‘non-owner changes in equity’ are required to be shown in a performance statement. Entities can choosewhether to present one performance statement (the statement of comprehensive income) or two statements (the income statement andstatement of comprehensive income). The Group has elected to present two statements: an income statement and a statement ofcomprehensive income.
The financial statements are prepared under the historical cost convention as modified by the revaluation of financial assets classifiedas available-for-sale and financial assets and financial liabilities (including derivative instruments) at fair value through the profit or lossand on a going concern basis.
The principal accounting policies are set out below and have been applied consistently year on year.
Going concern
The Directors have performed a going concern assessment by reviewing the latest forecasts and trading prospects of the Group. Theforecasts for 2017 have been formally reviewed and adopted by the Board. Additionally the Directors have considered longer rangeforecasts into 2018 in line with the multi-year plan prepared and approved by the Board. These forecasts indicate an improvement inoperating performance in 2017 which is linked to the increasing order book, generally favourable markets and improving operationalperformance as new products are industrialised. The Directors have also considered available headroom under the Group’s facilitiesand are satisfied that sufficient headroom exists and levers are available to the Group to manage a number of reasonable down sidesensitivities in terms of trading and cash performance. In this regard it should also be noted that the Group’s £110 million revolvingcredit facilities are due for renewal in April 2018 and the Directors are satisfied that the most likely outcome is that these are extendedon terms acceptable to the Group. Whilst no final agreement has been reached regarding the extension of these revolving creditfacilities the Directors have received indications of support to renew the facility as it falls due. While there can be no certainty that theseforecasts can be achieved, the Directors can see no reasonable outcome where the Group would not have sufficient financial resourcesto meet financial obligations as they fall due.
Dubai International Capital LLC (“DIC”), the majority owner of the Group, had certain debt facilities which matured on 31 December2016 for which the shares in the Group are held as collateral. A sale process was initiated in 2016 for DIC to dispose of the Group andgenerate proceeds to repay a substantial share of DIC’s debt facilities. The sale process has generated significant interest and apotential buyer is currently in exclusive discussions to agree a transaction in the first half of 2017. At this stage the Directors believethere is nothing to suggest that the DIC lenders would take actions detrimental to a successful sale of the Group or its ability to continuetrading as a going concern; in the event that the sale of the Group does not take place, they expect the DIC debt facilities to beextended or restructured without any disruption to the Group. However, there is no certainty as to the DIC lenders’ actions. Additionallythe expected sale proceeds for the Group are likely to lead to the need to restructure the unsecured subordinated loan notes but untilfinal timings and proceeds are known this action is not certain.
The conditions outlined above and as described within the financial statements indicate the existence of material uncertainties, whichmay cast significant doubt on the Group’s ability to continue as a going concern. However, in consideration of all of the relevant factorsthe Directors have concluded that it is appropriate to prepare the accounts on a going concern basis. Therefore, the financial statementsdo not include the adjustments that would result if the Group and Company were unable to continue as a going concern.
D o n c a s t e r s G r o u p L i m i t e d A n n u a l R e p o r t 2 0 1 6
17
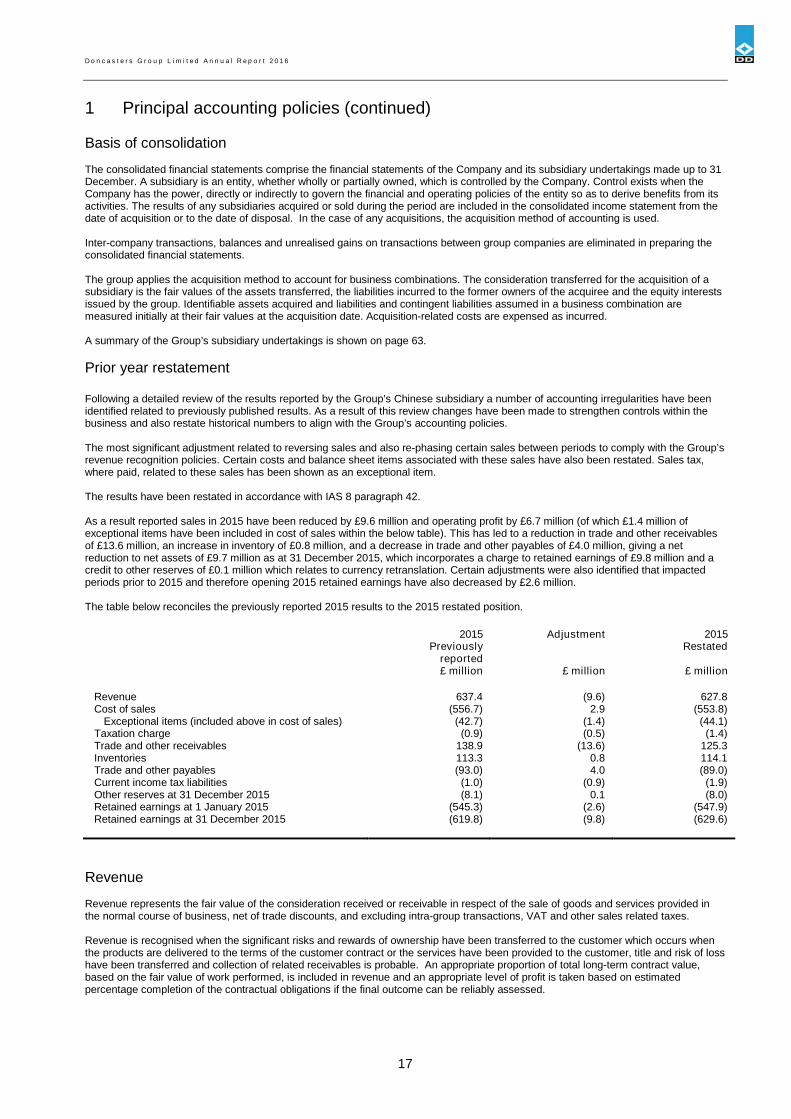
1 Principal accounting policies (continued)
Basis of consolidation
The consolidated financial statements comprise the financial statements of the Company and its subsidiary undertakings made up to 31December. A subsidiary is an entity, whether wholly or partially owned, which is controlled by the Company. Control exists when theCompany has the power, directly or indirectly to govern the financial and operating policies of the entity so as to derive benefits from itsactivities. The results of any subsidiaries acquired or sold during the period are included in the consolidated income statement from thedate of acquisition or to the date of disposal. In the case of any acquisitions, the acquisition method of accounting is used.
Inter-company transactions, balances and unrealised gains on transactions between group companies are eliminated in preparing theconsolidated financial statements.
The group applies the acquisition method to account for business combinations. The consideration transferred for the acquisition of asubsidiary is the fair values of the assets transferred, the liabilities incurred to the former owners of the acquiree and the equity interestsissued by the group. Identifiable assets acquired and liabilities and contingent liabilities assumed in a business combination aremeasured initially at their fair values at the acquisition date. Acquisition-related costs are expensed as incurred.
A summary of the Group’s subsidiary undertakings is shown on page 63.
Prior year restatement
Following a detailed review of the results reported by the Group’s Chinese subsidiary a number of accounting irregularities have beenidentified related to previously published results. As a result of this review changes have been made to strengthen controls within thebusiness and also restate historical numbers to align with the Group’s accounting policies.
The most significant adjustment related to reversing sales and also re-phasing certain sales between periods to comply with the Group’srevenue recognition policies. Certain costs and balance sheet items associated with these sales have also been restated. Sales tax,where paid, related to these sales has been shown as an exceptional item.
The results have been restated in accordance with IAS 8 paragraph 42.
As a result reported sales in 2015 have been reduced by £9.6 million and operating profit by £6.7 million (of which £1.4 million ofexceptional items have been included in cost of sales within the below table). This has led to a reduction in trade and other receivablesof £13.6 million, an increase in inventory of £0.8 million, and a decrease in trade and other payables of £4.0 million, giving a netreduction to net assets of £9.7 million as at 31 December 2015, which incorporates a charge to retained earnings of £9.8 million and acredit to other reserves of £0.1 million which relates to currency retranslation. Certain adjustments were also identified that impactedperiods prior to 2015 and therefore opening 2015 retained earnings have also decreased by £2.6 million.
The table below reconciles the previously reported 2015 results to the 2015 restated position.
2015Previously
reported
Adjustment 2015Restated
£ million £ million £ million
Revenue 637.4 (9.6) 627.8Cost of sales (556.7) 2.9 (553.8)
Exceptional items (included above in cost of sales) (42.7) (1.4) (44.1)Taxation charge (0.9) (0.5) (1.4)Trade and other receivables 138.9 (13.6) 125.3Inventories 113.3 0.8 114.1Trade and other payables (93.0) 4.0 (89.0)Current income tax liabilities (1.0) (0.9) (1.9)Other reserves at 31 December 2015 (8.1) 0.1 (8.0)Retained earnings at 1 January 2015 (545.3) (2.6) (547.9)Retained earnings at 31 December 2015 (619.8) (9.8) (629.6)
Revenue
Revenue represents the fair value of the consideration received or receivable in respect of the sale of goods and services provided inthe normal course of business, net of trade discounts, and excluding intra-group transactions, VAT and other sales related taxes.
Revenue is recognised when the significant risks and rewards of ownership have been transferred to the customer which occurs whenthe products are delivered to the terms of the customer contract or the services have been provided to the customer, title and risk of losshave been transferred and collection of related receivables is probable. An appropriate proportion of total long-term contract value,based on the fair value of work performed, is included in revenue and an appropriate level of profit is taken based on estimatedpercentage completion of the contractual obligations if the final outcome can be reliably assessed.
D o n c a s t e r s G r o u p L i m i t e d A n n u a l R e p o r t 2 0 1 6
18
1 Principal accounting policies (continued)
Divisional information
Information is provided on the basis of divisions, and is based on the management structure of the Group.
A division is a group of businesses engaged in providing products and services that are subject to similar risks and returns and whoserisks and returns differ from other business divisions.
Exceptional items
Items which are significant by virtue of their size or nature and which are considered non-recurring are classified as exceptional items.Such items, which include for instance restructuring of businesses, significant customer claims and settlements, the costs of integratingsignificant acquisitions, profits or losses made on the disposal of businesses and restructuring of forward foreign currency exchangecontracts, are included within the appropriate consolidated income statement category but are highlighted separately in the notes to thefinancial statements. Exceptional items are excluded from the underlying profit measures used by the Board to monitor and measurethe underlying performance of the Group (see notes 2 and 5).
Foreign currencies
(a) Presentational currency
The Group’s consolidated financial statements are presented in pounds sterling.
(b) Transactions and balances
Transactions in foreign currencies are recorded at the rates of exchange prevailing at the dates of the transactions. Monetary assetsand liabilities denominated in foreign currencies are reported at the rates of exchange prevailing at the statement of financial positiondate. Exchange differences on retranslating monetary assets and liabilities are recognised in the income statement.
(c) Foreign subsidiaries
The results of foreign subsidiaries are translated at the average rates of exchange for the year. Assets and liabilities of foreignsubsidiaries are translated at the exchange rates prevailing at the statement of financial position date. Exchange differences arisingfrom the translation of the results of foreign subsidiaries and their opening net assets are recognised as a separate component of equitywithin other reserves. Exchange differences on borrowings and other currency instruments used to manage the statement of financialposition translation exposure of foreign subsidiaries are recognised in the income statement.
When a foreign subsidiary is sold the cumulative exchange differences relating to the retranslation of the net investment in that foreignsubsidiary are recognised in the income statement as part of the gain or loss on disposal.
Intangible assets
GoodwillGoodwill (being the difference between the fair value of consideration paid for new interests in group companies and the fair value of theGroup’s share of their net identifiable assets and contingent liabilities at the date of acquisition) is capitalised. Goodwill is not amortised,but is subject to an annual review for impairment (or more frequently if necessary). Any impairment is charged to the income statementas it arises. Negative goodwill arising on acquisitions is recognised immediately in the income statement.
Other intangible assetsOn acquisition of group companies, the Group recognises any specifically identifiable intangible assets separately from goodwill, initiallymeasuring the intangible assets at fair value. Separately purchased intangible assets are initially measured at cost. Finite-livedintangible assets including software are amortised in the income statement over the period of their expected useful lives.
IFRSs also require that internally generated intangible assets be capitalised where certain specific criteria are met. The Groupcapitalises internally generated software where it is clear that the software development is technically feasible and will be completed andthat the software will generate economic benefits in the future.
D o n c a s t e r s G r o u p L i m i t e d A n n u a l R e p o r t 2 0 1 6
19
1 Principal accounting policies (continued)
Intangible assets (continued)
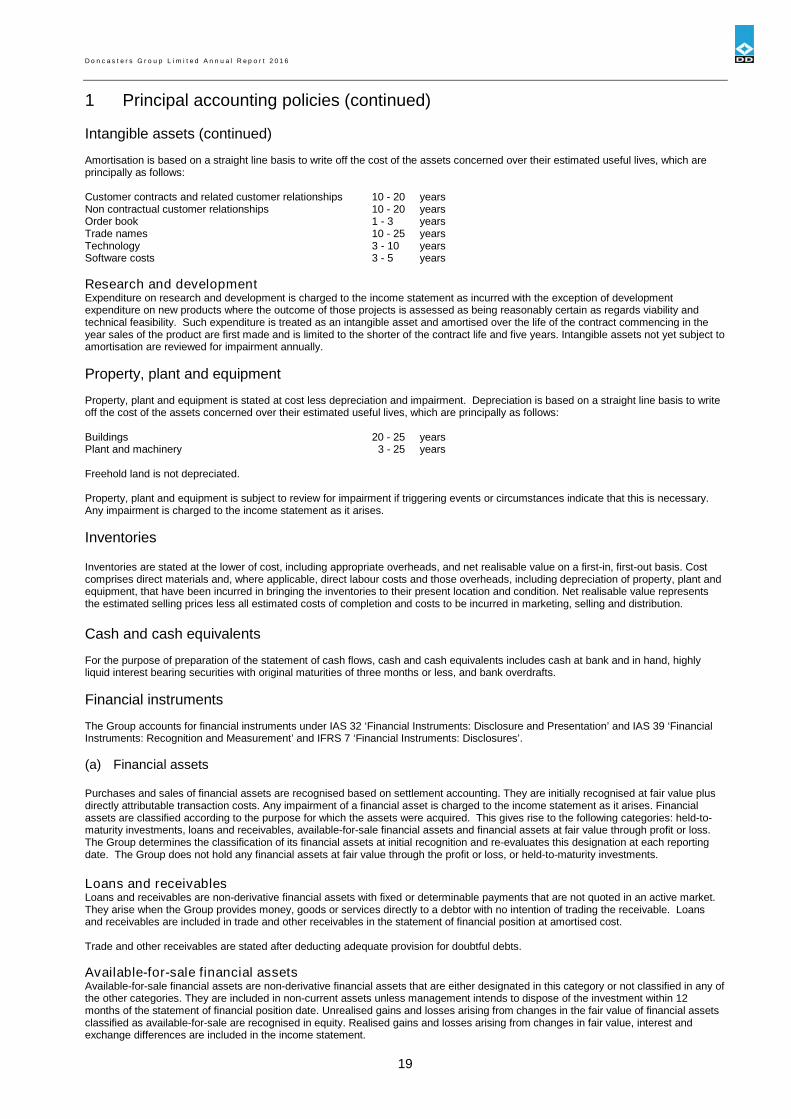
Amortisation is based on a straight line basis to write off the cost of the assets concerned over their estimated useful lives, which areprincipally as follows:
Customer contracts and related customer relationships 10 - 20 yearsNon contractual customer relationships 10 - 20 yearsOrder book 1 - 3 yearsTrade names 10 - 25 yearsTechnology 3 - 10 yearsSoftware costs 3 - 5 years
Research and developmentExpenditure on research and development is charged to the income statement as incurred with the exception of developmentexpenditure on new products where the outcome of those projects is assessed as being reasonably certain as regards viability andtechnical feasibility. Such expenditure is treated as an intangible asset and amortised over the life of the contract commencing in theyear sales of the product are first made and is limited to the shorter of the contract life and five years. Intangible assets not yet subject toamortisation are reviewed for impairment annually.
Property, plant and equipment
Property, plant and equipment is stated at cost less depreciation and impairment. Depreciation is based on a straight line basis to writeoff the cost of the assets concerned over their estimated useful lives, which are principally as follows:
Buildings 20 - 25 yearsPlant and machinery 3 - 25 years
Freehold land is not depreciated.
Property, plant and equipment is subject to review for impairment if triggering events or circumstances indicate that this is necessary.Any impairment is charged to the income statement as it arises.
Inventories
Inventories are stated at the lower of cost, including appropriate overheads, and net realisable value on a first-in, first-out basis. Costcomprises direct materials and, where applicable, direct labour costs and those overheads, including depreciation of property, plant andequipment, that have been incurred in bringing the inventories to their present location and condition. Net realisable value representsthe estimated selling prices less all estimated costs of completion and costs to be incurred in marketing, selling and distribution.
Cash and cash equivalents
For the purpose of preparation of the statement of cash flows, cash and cash equivalents includes cash at bank and in hand, highlyliquid interest bearing securities with original maturities of three months or less, and bank overdrafts.
Financial instruments
The Group accounts for financial instruments under IAS 32 ‘Financial Instruments: Disclosure and Presentation’ and IAS 39 ‘FinancialInstruments: Recognition and Measurement’ and IFRS 7 ‘Financial Instruments: Disclosures’.
(a) Financial assets
Purchases and sales of financial assets are recognised based on settlement accounting. They are initially recognised at fair value plusdirectly attributable transaction costs. Any impairment of a financial asset is charged to the income statement as it arises. Financialassets are classified according to the purpose for which the assets were acquired. This gives rise to the following categories: held-to-maturity investments, loans and receivables, available-for-sale financial assets and financial assets at fair value through profit or loss.The Group determines the classification of its financial assets at initial recognition and re-evaluates this designation at each reportingdate. The Group does not hold any financial assets at fair value through the profit or loss, or held-to-maturity investments.
Loans and receivablesLoans and receivables are non-derivative financial assets with fixed or determinable payments that are not quoted in an active market.They arise when the Group provides money, goods or services directly to a debtor with no intention of trading the receivable. Loansand receivables are included in trade and other receivables in the statement of financial position at amortised cost.
Trade and other receivables are stated after deducting adequate provision for doubtful debts.
Available-for-sale financial assetsAvailable-for-sale financial assets are non-derivative financial assets that are either designated in this category or not classified in any ofthe other categories. They are included in non-current assets unless management intends to dispose of the investment within 12months of the statement of financial position date. Unrealised gains and losses arising from changes in the fair value of financial assetsclassified as available-for-sale are recognised in equity. Realised gains and losses arising from changes in fair value, interest andexchange differences are included in the income statement.

D o n c a s t e r s G r o u p L i m i t e d A n n u a l R e p o r t 2 0 1 6
20
1 Principal accounting policies (continued)
(b) Financial liabilities
BorrowingsBorrowings are recognised initially at fair value, net of transaction costs incurred. Borrowings are subsequently stated at amortised costunless they are part of a fair value hedge accounting relationship; any difference between the proceeds and the redemption value isrecognised in the income statement over the period of the borrowings using the effective interest method. Those borrowings that arepart of a fair value hedge accounting relationship are also recorded on an amortised cost basis, plus or minus the fair value attributableto the risk being hedged with a corresponding entry in the income statement.
(c) Derivative financial instruments
The Group uses derivative financial instruments to hedge its exposure to interest rate and foreign currency transactional andtranslational risk. Derivative financial instruments are recognised at fair value on the date the derivative contract is entered into and aresubsequently re-measured at fair value at each statement of financial position date. To the extent that the maturity of the financialinstrument is more than 12 months from the statement of financial position date the fair value is reported as a non-current asset orliability. Derivative financial instruments with maturities of less than 12 months from the statement of financial position are shown ascurrent assets or liabilities.
Certain financial instruments held by the group will not reach maturity until more than three years after the balance sheet date.Management assesses the reliability of the valuations of these instruments on an individual basis. Where significant uncertainty over theaccuracy of the valuations exists, the fair value of the instruments in question is not recognised through profit and loss, instead beingrecognised through reserves. Management reassesses this treatment at each balance sheet date and recognises the fair value throughprofit and loss at the point where the estimates are deemed reliable.
The Group does not apply hedge accounting to any of its foreign currency and interest rate hedging relationships.
Leases
Leases are classified as finance leases whenever the terms of the lease transfer substantially all the risks and rewards of ownership tothe lessee. All other leases are classified as operating leases. Assets held under finance leases are recognised as non-current assetsof the Group at their fair value at the date of commencement of the lease or, if lower, at the present value of the minimum leasepayments. The corresponding liability to the lessor is included in the statement of financial position as a finance lease obligation. Leasepayments are apportioned between finance charges and reduction of the lease obligation so as to achieve a constant rate of interest onthe remaining balance of the liability. Finance charges are charged directly against income.
Government grants
Government grants received for property, plant and equipment are released to the income statement over the estimated useful life of theassets concerned. The balance of grants available for release is included in the statement of financial position as deferred income.Other grants are credited to the income statement in the period in which they are received.
Provisions
Provisions are recognised when the Group has a present obligation as a result of a past event, and it is probable that the Group will berequired to settle that obligation. Provisions are measured at the directors’ best estimate of the expenditure required to settle theobligation at the statement of financial position date, and, where applicable, are discounted to present value, using a risk-free returnrate.
Taxation
The tax charge on the profit or loss for the year comprises current and deferred tax. Current tax is the expected tax payable for the year,using tax rates enacted or substantively enacted at the statement of financial position date, and any adjustment to tax payable inrespect of previous years.
Deferred taxation is recognised using the liability method on all taxable temporary differences between the tax base and the accountingbase of items included in the statement of financial position of the Group. Deferred tax is recognised at the rates of tax prevailing at theyear end unless future rates have been enacted or substantively enacted. Deferred tax is not discounted.
D o n c a s t e r s G r o u p L i m i t e d A n n u a l R e p o r t 2 0 1 6
21
1 Principal accounting policies (continued)
Pensions and similar obligations
The Group provides post-employment benefits to employees in the form of pension benefits. In addition, other post-retirement benefits,mainly healthcare, are provided to certain employees in North America.
For defined benefit plans, the cost of providing the benefits is determined based on actuarial valuations of each of the plans that arecarried out annually at the Group’s statement of financial position date by independent qualified actuaries. Plan assets (if any) aremeasured at their fair values at the statement of financial position date. Benefit obligations are measured using the projected unit creditmethod.
The operating and financing costs of defined benefit plans are recognised separately in the income statement. The costs recognised inthe income statement comprise the net total of the current service cost, plan administration expenses, the past service cost, the netinterest on the net defined benefit liability/asset and the effect of curtailments and settlements. The current service cost represents theincrease in the present value of the plan liabilities expected to arise from employee service in the current period. Past service costsresulting from enhanced benefits are recognised immediately in the income statement. The net interest on the net defined benefitliability/asset is calculated by multiplying the net defined benefit liability/asset by the discount rate, both as determined at the start of theannual reporting period, taking account of any changes in the net defined benefit liability/asset during the period as a result ofcontribution and benefit payments. The discount rate used is determined by reference to market yields on high quality corporate bonds,where available, or government bonds at the statement of financial position date. Gains and losses on curtailments or settlements arerecognised in the income statement in the period in which the curtailment or settlement occurs.
Actuarial gains and losses, which represent differences between the expected and actual returns on the plan assets and the effect ofchanges in actuarial assumptions, are recognised in the statement of comprehensive income in the period in which they occur.
The defined benefit liability or asset recognised in the statement of financial position comprises the net total for each plan of the presentvalue of the benefit obligation at the statement of financial position date, minus the fair value of the plan assets, if any, at the statementof financial position date. Where a plan is in surplus, the asset recognised is limited to the present value of any amounts that the Groupexpects to recover by way of refunds or a reduction in future contributions.
The cost of providing benefits through defined contribution pension schemes is charged to the income statement in the period in respectof which contributions become payable.
Share capital
Ordinary shares are classified as equity. Incremental costs directly attributable to the issue of new shares are shown in equity as adeduction, net of tax, from the proceeds.
Critical accounting estimates and judgements
The preparation of financial statements in conformity with IFRSs requires the use of certain critical accounting estimates. It also requiresmanagement to exercise its judgement in the process of applying the Group’s accounting policies. The areas involving a higher degreeof judgement or complexity, or areas where assumptions and estimates are significant to the consolidated financial statements aredisclosed below. These estimates and judgements are regularly reviewed and updated as necessary.
Impairment of non-current assetsImpairment reviews in respect of goodwill and indefinite-lived intangible assets are performed at least annually. More regular reviewsare performed on all non-current assets if events indicate that this is necessary. Examples of such triggering events would include asignificant planned restructuring, a major change in market conditions or technology, expectations of future operating losses, or negativecash flows.
The recoverable amounts of cash-generating units are determined based on the higher of realisable value and value-in-use calculations.These calculations require the use of estimates. Further information concerning the assumptions used in the impairment reviews can befound in Note 9.
Retirement benefitsPension accounting requires certain assumptions to be made in order to value the obligations and to determine the charges to be madeto the income statement. These figures are particularly sensitive to assumptions for discount rates, mortality and inflation rates. Detailsof assumptions made and their relevant sensitivity analysis are given in note 20.
Income taxesIn determining the Group provisions for income tax and deferred tax it is necessary to consider transactions in a small number of key taxjurisdictions for which the ultimate tax determination is uncertain and may depend upon agreement with the relevant tax authorities. Tothe extent that the final outcome differs from the tax that has been provided, adjustments will be made to income tax and deferred taxprovisions held in the period the determination is made. The recognition of deferred tax assets requires certain assumptions to be maderegarding the utilisation of tax losses and interest deductions for future periods.
D o n c a s t e r s G r o u p L i m i t e d A n n u a l R e p o r t 2 0 1 6
22
1 Principal accounting policies (continued)
Critical accounting estimates and judgements (continued)
BorrowingsThe majority of the unsecured subordinated DIC and management loan notes are fair valued under IAS 39 using the estimated futurecash flows and they are discounted at 14%. The directors consider that this discount rate appropriately represents the terms and risks ofthe financial instrument and is comparable with other financial instruments of a similar nature and substance.
Provisions
InventoryInventories are stated at the lower of cost and net realisable value, with due allowance for excess, obsolete or slow moving items (usingan established provisioning policy) which are dependent on estimates of future revenues and margins of the inventories.
Trade receivablesTrade receivables are stated after deducting an adequate provision for doubtful debts which is dependent on estimates of therecoverability of the receivables.
Other liabilitiesProvisions are made for committed onerous contracts and the costs of compliance with statutory regulations which are dependent onestimates of future revenues, costs and margins the outcome of which are, by their nature, uncertain. Provisions are also made to coverpotential customer returns and warranty claims based on historic evidence of return rates.
Customer claims and returnsAppropriate provisions are made in relation to liabilities to customers where the directors believe there is a likelihood of either customerclaims or products returns for components which do not meet agreed specifications. The value of the provisions takes into account thebest estimates currently available.
Recent accounting developments
(a) New and amended standards adopted by the Group.
No standards, amendments and interpretations which are effective for the financial year beginning on 1 January 2016 are material to thegroup.
(b) New standards and interpretations not yet adopted.
A number of new standards and amendments to standards and interpretations are effective for annual periods beginning after 1 January2016, and have not been applied in preparing these consolidated financial statements. None of these is expected to have a significanteffect on the consolidated financial statements of the Group, except the following set out below:
IFRS 9, ‘Financial instruments’, addresses the classification, measurement and recognition of financial assets and financial liabilities.The complete version of IFRS 9 was issued in July 2014. It replaces the guidance in IAS 39 that relates to the classification andmeasurement of financial instruments. IFRS 9 retains but simplifies the mixed measurement model and establishes three primarymeasurement categories for financial assets: amortised cost, fair value through OCI and fair value through P&L. The basis ofclassification depends on the entity’s business model and the contractual cash flow characteristics of the financial asset. Investments inequity instruments are required to be measured at fair value through profit or loss with the irrevocable option at inception to presentchanges in fair value in OCI not recycling. There is now a new expected credit losses model that replaces the incurred loss impairmentmodel used in IAS 39. For financial liabilities there were no changes to classification and measurement except for the recognition ofchanges in own credit risk in other comprehensive income, for liabilities designated at fair value through profit or loss. IFRS 9 relaxesthe requirements for hedge effectiveness by replacing the bright line hedge effectiveness tests. It requires an economic relationshipbetween the hedged item and hedging instrument and for the ‘hedged ratio’ to be the same as the one management actually use for riskmanagement purposes. Contemporaneous documentation is still required but is different to that currently prepared under IAS 39. Thestandard is effective for accounting periods beginning on or after 1 January 2018. Early adoption is permitted subject to EUendorsement. The group is yet to assess IFRS 9’s full impact.
IFRS 15, ‘Revenue from contracts with customers’ deals with revenue recognition and establishes principles for reporting usefulinformation to users of financial statements about the nature, amount, timing and uncertainty of revenue and cash flows arising from anentity’s contracts with customers. Revenue is recognised when a customer obtains control of a good or service and thus has the abilityto direct the use and obtain the benefits from the good or service. The standard replaces IAS 18 ‘Revenue’ and IAS 11 ‘Constructioncontracts’ and related interpretations. The standard is effective for annual periods beginning on or after 1 January 2018 and earlierapplication is permitted subject to EU endorsement. The group is assessing the impact of IFRS 15.
IFRS 16, ‘Leases’ sets out the principles for the recognition, measurement, presentation and disclosure of leases. The objective is toensure that lessees and lessors provide relevant information in a manner that faithfully represents those transactions. This informationgives a basis for users of financial statements to assess the effect that leases have on the financial position, financial performance andcash flows of the entity. The standard replaces IAS 17 ‘Leases’ and related interpretations. The standard is effective for annual periodsbeginning on or after 1 January 2019 and earlier application is permitted for entities that apply IFRS 15 at or before the date of initialapplication of IFRS 16. The group is yet to assess IFRS 16’s full impact.
There are no other IFRSs or IFRIC interpretations that are not yet effective that would be expected to have a material impact on theGroup.
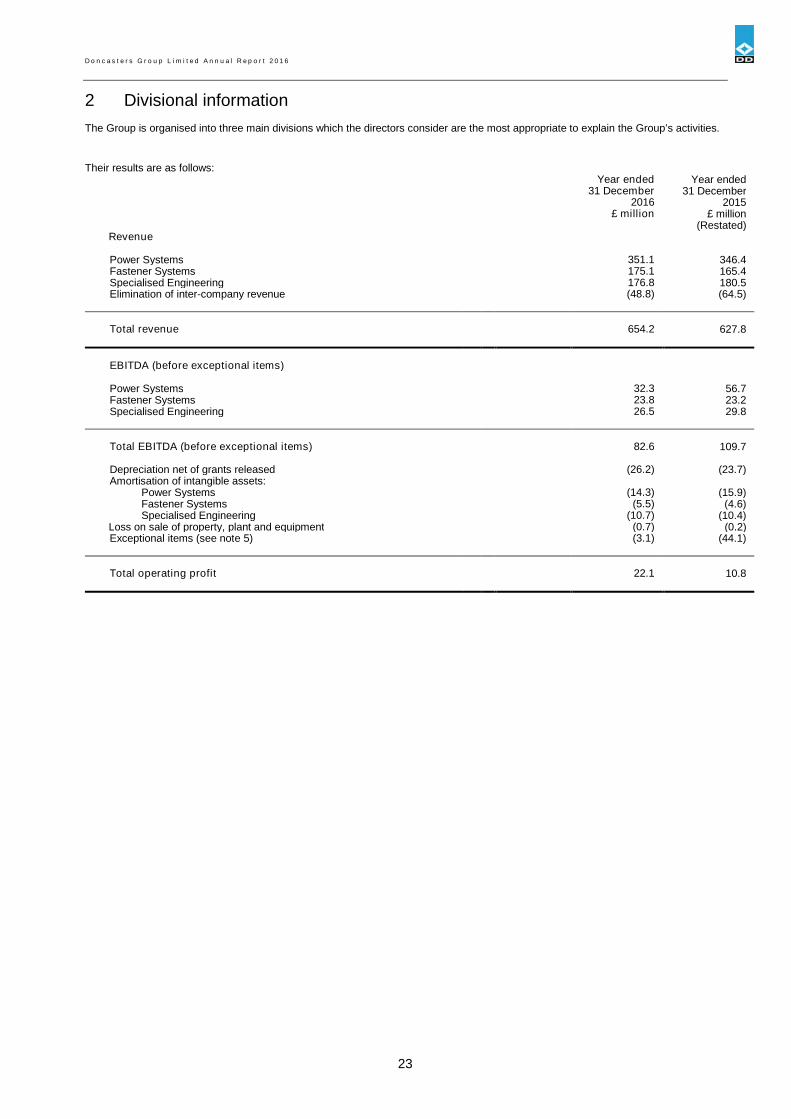
D o n c a s t e r s G r o u p L i m i t e d A n n u a l R e p o r t 2 0 1 6
23
2 Divisional information
The Group is organised into three main divisions which the directors consider are the most appropriate to explain the Group’s activities.
Their results are as follows:Year ended Year ended
31 December 31 December2016 2015
£ million £ million(Restated)
Revenue
Power Systems 351.1 346.4Fastener Systems 175.1 165.4Specialised Engineering 176.8 180.5Elimination of inter-company revenue (48.8) (64.5)
Total revenue 654.2 627.8
EBITDA (before exceptional items)
Power Systems 32.3 56.7Fastener Systems 23.8 23.2Specialised Engineering 26.5 29.8
Total EBITDA (before exceptional items) 82.6 109.7
Depreciation net of grants released (26.2) (23.7)Amortisation of intangible assets:
Power Systems (14.3) (15.9)Fastener Systems (5.5) (4.6)Specialised Engineering (10.7) (10.4)
Loss on sale of property, plant and equipment (0.7) (0.2)Exceptional items (see note 5) (3.1) (44.1)
Total operating profit 22.1 10.8

D o n c a s t e r s G r o u p L i m i t e d A n n u a l R e p o r t 2 0 1 6
24
2 Divisional information (continued)
2016 2015£ million £ million
(Restated)Assets
Power Systems 565.4 504.4Fastener Systems 200.8 167.7Specialised Engineering 206.6 190.7
Total divisional assets 972.8 862.8Available-for-sale financial assets 0.5 0.5Derivative financial instruments 6.4 0.2Cash and cash equivalents * 19.2 35.5Taxation recoverable 1.7 0.8Deferred tax assets 14.0 6.8
Total assets 1,014.6 906.6
*The allocation of cash and cash equivalents between divisions is not considered meaningful due to the cash pooling arrangements theGroup has in place with its various financial institutions.
2016 2015£ million £ million
(Restated)Liabilities
Power Systems 94.4 86.4Fastener Systems 37.9 29.0Specialised Engineering 17.7 18.9
Total divisional liabilities 150.0 134.3Borrowings 1,208.7 1,023.4Derivative financial instruments 4.6 1.6Current tax liabilities 2.0 1.9Deferred tax liabilities 71.9 106.8
Total liabilities 1,437.2 1,268.0
Year ended Year ended31 December 31 December
2016 2015£ million £ million
Capital expenditure on property, plant and equipment
Power Systems 46.3 11.2Fastener Systems 8.1 5.8Specialised Engineering 8.5 3.3
Total capital expenditure 62.9 20.3
Depreciation of property, plant and equipment
Power Systems 16.9 15.8Fastener Systems 6.4 5.3Specialised Engineering 3.2 2.9
Total depreciation 26.5 24.0
Depreciation excludes £0.3 million (2015: £0.3 million) of Government grant amortisation.
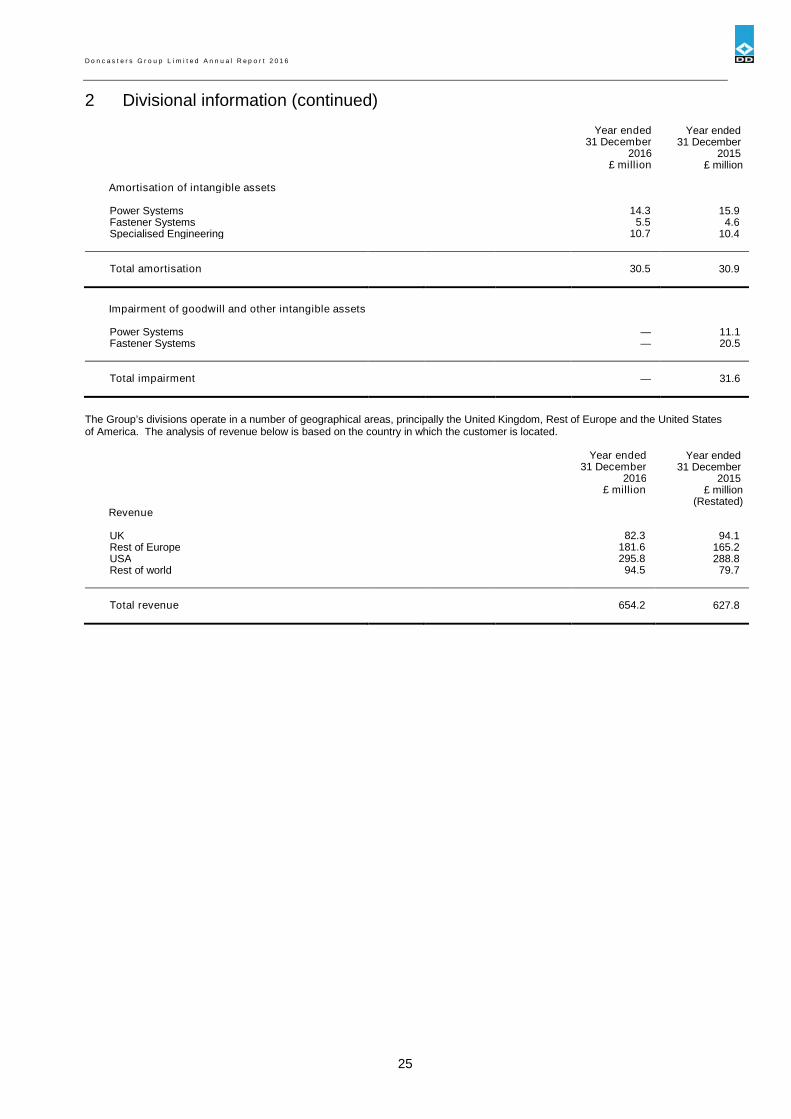
D o n c a s t e r s G r o u p L i m i t e d A n n u a l R e p o r t 2 0 1 6
25
2 Divisional information (continued)
Year ended Year ended31 December 31 December
2016 2015£ million £ million
Amortisation of intangible assets
Power Systems 14.3 15.9Fastener Systems 5.5 4.6Specialised Engineering 10.7 10.4
Total amortisation 30.5 30.9
Impairment of goodwill and other intangible assets
Power Systems — 11.1Fastener Systems — 20.5
Total impairment — 31.6
The Group’s divisions operate in a number of geographical areas, principally the United Kingdom, Rest of Europe and the United Statesof America. The analysis of revenue below is based on the country in which the customer is located.
Year ended Year ended31 December 31 December
2016 2015£ million £ million
(Restated)Revenue
UK 82.3 94.1Rest of Europe 181.6 165.2USA 295.8 288.8Rest of world 94.5 79.7
Total revenue 654.2 627.8
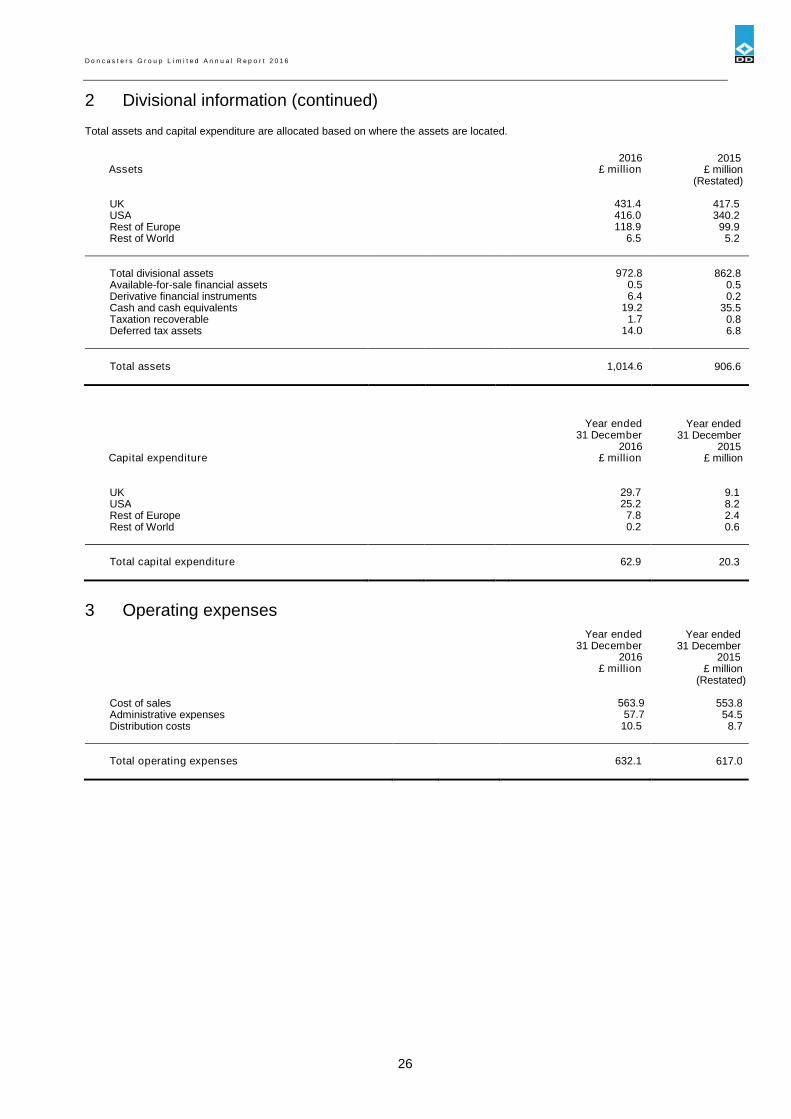
D o n c a s t e r s G r o u p L i m i t e d A n n u a l R e p o r t 2 0 1 6
26
2 Divisional information (continued)
Total assets and capital expenditure are allocated based on where the assets are located.
2016 2015Assets £ million £ million
(Restated)
UK 431.4 417.5USA 416.0 340.2Rest of Europe 118.9 99.9Rest of World 6.5 5.2
Total divisional assets 972.8 862.8Available-for-sale financial assets 0.5 0.5Derivative financial instruments 6.4 0.2Cash and cash equivalents 19.2 35.5Taxation recoverable 1.7 0.8Deferred tax assets 14.0 6.8
Total assets 1,014.6 906.6
Year ended Year ended31 December 31 December
2016 2015Capital expenditure £ million £ million
UK 29.7 9.1USA 25.2 8.2Rest of Europe 7.8 2.4Rest of World 0.2 0.6
Total capital expenditure 62.9 20.3
3 Operating expenses
Year ended Year ended31 December 31 December
2016 2015£ million £ million
(Restated)
Cost of sales 563.9 553.8Administrative expenses 57.7 54.5Distribution costs 10.5 8.7
Total operating expenses 632.1 617.0

D o n c a s t e r s G r o u p L i m i t e d A n n u a l R e p o r t 2 0 1 6
27
4 Operating profitYear ended Year ended
31 December 31 December2016 2015
Operating profit is arrived at after charging/(crediting): £ million £ million
Depreciation 26.5 24.0Amortisation of Government grants (0.3) (0.3)Amortisation of intangible assets 30.5 30.9Impairment of goodwill — 29.0Impairment of other intangible assets — 2.6Fees payable to the Company’s auditor for the audit of
Company’s annual financial statements 0.4 0.4Fees payable to the Company’s auditor for other services:
Audit of the Company’s subsidiaries pursuant to legislation 0.5 0.5Tax advisory 0.4 0.4Tax compliance 0.1 0.1Other non-audit services 0.8 0.2
Research and development 2.2 2.5Operating leases:
Land and buildings 5.7 5.2Plant and machinery 1.0 0.8
Loss on sale of property, plant and equipment 0.7 0.2Doubtful debt expense 0.6 0.2Long-term incentive plans 0.1 (1.8)Raw materials and consumables used 245.3 233.3Net foreign exchange losses/(gains) 2.8 (1.0)
Fees payable to the Company’s auditor relating to the audit of pension schemes amounted to £20,000 (2015: £20,000).
5 Exceptional itemsYear ended Year ended
31 December 31 December2016 2015
(Restated)Exceptional items included within operating profit/(loss) arecategorised as follows:
£ million £ million
Cost of salesRedundancy and other reorganisation costs 4.3 4.4Claims, settlements and litigation costs 5.1 2.4Irrecoverable VAT 0.5 1.4Impairment of intangible assets — 31.6Loss on disposal of business — 4.7Curtailment gain on retirement benefits — (1.5)Professional fees incurred on disposal and reorganisation studies — 1.1
Administrative expensesProfessional fees 1.7 —Settlement on retirement benefits (8.5) —
3.1 44.1
Redundancy and other reorganisation costs were largely incurred as a result of changes in executive management and significantrestructuring of certain sites as part of a cost reduction programme.
Claims, settlements and associated costs incurred in 2015 related to litigation costs and investigative fees associated with the breach ofnon-compete obligations by some former employees, and certain customer claims. In 2016 these relate to customer claims associatedwith contractual terms of specific long-term agreements.
On 31 December 2015 the trade and assets of the New England Airfoil Products business were sold for a gross consideration of £2.3million. The loss on disposal of £4.7 million includes the write off of goodwill and other intangible assets of £3.2 million. Associated withthis disposal a number of former employees retired from the US post-retirement benefit plan, resulting in curtailment gains of £1.5million. This has been presented as past service income in note 20. During 2016, a gain of £8.5 million has been recognised on thesettlement of a US retirement benefit plan.
Professional fees in 2016 of £1.7 million (2015: £1.1 million) were incurred in relation to potential divestment, reorganisation activity andreview of the Chinese subsidiary entity (see Note 1).
£0.5 million of irrecoverable VAT has been written off as an exceptional item in 2016. Further disclosure can be found in the ‘Prior yearrestatement’ section of Note 1.
Tax has been provided on exceptional items, where required, at the relevant tax rate resulting in a tax charge of £0.9 million (2015: £4.1million credit). In addition, a tax credit of £33.9 million (2015:£nil) has been recognised as an exceptional item. See Note 7 for furtherdetails.
Cash outflows in relation to the above exceptional items were £9.1 million (2015: £2.0 million).
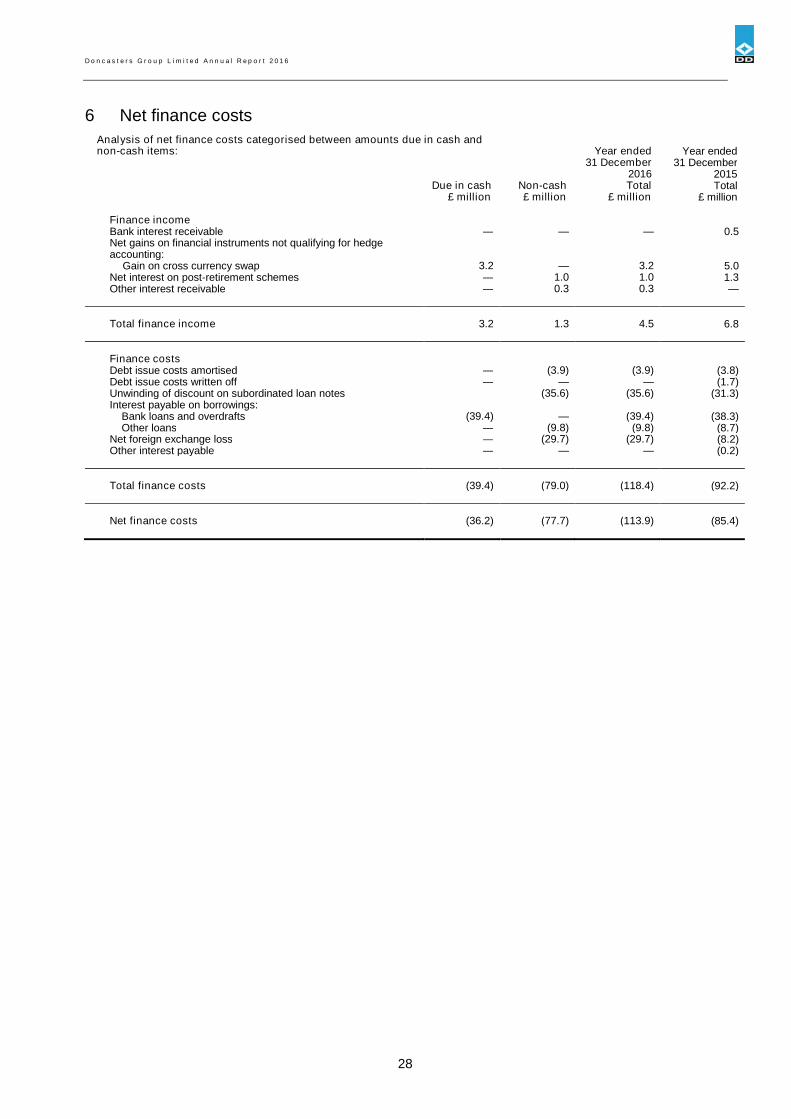
D o n c a s t e r s G r o u p L i m i t e d A n n u a l R e p o r t 2 0 1 6
28
6 Net finance costs
Analysis of net finance costs categorised between amounts due in cash andnon-cash items: Year ended Year ended
31 December 31 December2016 2015
Due in cash Non-cash Total Total£ million £ million £ million £ million
Finance incomeBank interest receivable — — — 0.5Net gains on financial instruments not qualifying for hedgeaccounting:
Gain on cross currency swap 3.2 — 3.2 5.0Net interest on post-retirement schemes — 1.0 1.0 1.3Other interest receivable — 0.3 0.3 —
Total finance income 3.2 1.3 4.5 6.8
Finance costsDebt issue costs amortised — (3.9) (3.9) (3.8)Debt issue costs written off — — — (1.7)Unwinding of discount on subordinated loan notes (35.6) (35.6) (31.3)Interest payable on borrowings:
Bank loans and overdrafts (39.4) — (39.4) (38.3)Other loans — (9.8) (9.8) (8.7)
Net foreign exchange loss — (29.7) (29.7) (8.2)Other interest payable — — — (0.2)
Total finance costs (39.4) (79.0) (118.4) (92.2)
Net finance costs (36.2) (77.7) (113.9) (85.4)
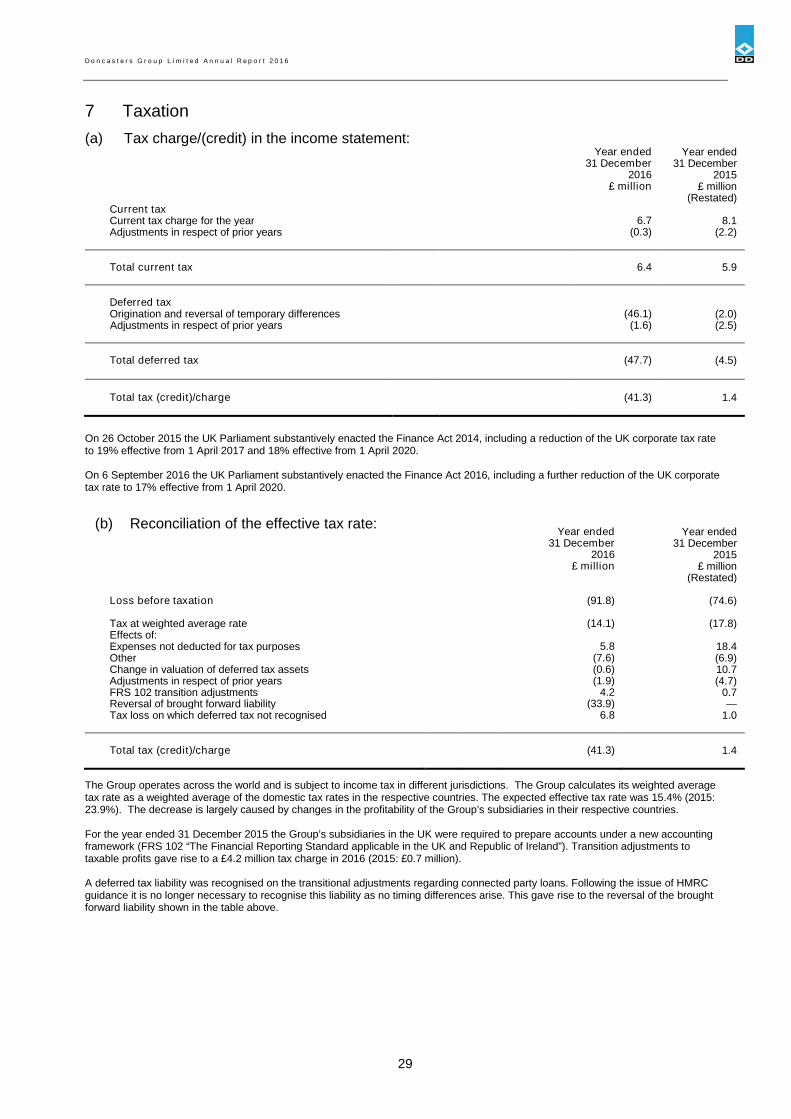
D o n c a s t e r s G r o u p L i m i t e d A n n u a l R e p o r t 2 0 1 6
29
7 Taxation
(a) Tax charge/(credit) in the income statement:Year ended Year ended
31 December 31 December2016 2015
£ million £ million(Restated)
Current taxCurrent tax charge for the year 6.7 8.1Adjustments in respect of prior years (0.3) (2.2)
Total current tax 6.4 5.9
Deferred taxOrigination and reversal of temporary differences (46.1) (2.0)Adjustments in respect of prior years (1.6) (2.5)
Total deferred tax (47.7) (4.5)
Total tax (credit)/charge (41.3) 1.4
On 26 October 2015 the UK Parliament substantively enacted the Finance Act 2014, including a reduction of the UK corporate tax rateto 19% effective from 1 April 2017 and 18% effective from 1 April 2020.
On 6 September 2016 the UK Parliament substantively enacted the Finance Act 2016, including a further reduction of the UK corporatetax rate to 17% effective from 1 April 2020.
(b) Reconciliation of the effective tax rate:Year ended Year ended
31 December 31 December2016 2015
£ million £ million(Restated)
Loss before taxation (91.8) (74.6)
Tax at weighted average rate (14.1) (17.8)Effects of:Expenses not deducted for tax purposes 5.8 18.4Other (7.6) (6.9)Change in valuation of deferred tax assets (0.6) 10.7Adjustments in respect of prior years (1.9) (4.7)FRS 102 transition adjustments 4.2 0.7Reversal of brought forward liability (33.9) —Tax loss on which deferred tax not recognised 6.8 1.0
Total tax (credit)/charge (41.3) 1.4
The Group operates across the world and is subject to income tax in different jurisdictions. The Group calculates its weighted averagetax rate as a weighted average of the domestic tax rates in the respective countries. The expected effective tax rate was 15.4% (2015:23.9%). The decrease is largely caused by changes in the profitability of the Group’s subsidiaries in their respective countries.
For the year ended 31 December 2015 the Group’s subsidiaries in the UK were required to prepare accounts under a new accountingframework (FRS 102 “The Financial Reporting Standard applicable in the UK and Republic of Ireland”). Transition adjustments totaxable profits gave rise to a £4.2 million tax charge in 2016 (2015: £0.7 million).
A deferred tax liability was recognised on the transitional adjustments regarding connected party loans. Following the issue of HMRCguidance it is no longer necessary to recognise this liability as no timing differences arise. This gave rise to the reversal of the broughtforward liability shown in the table above.
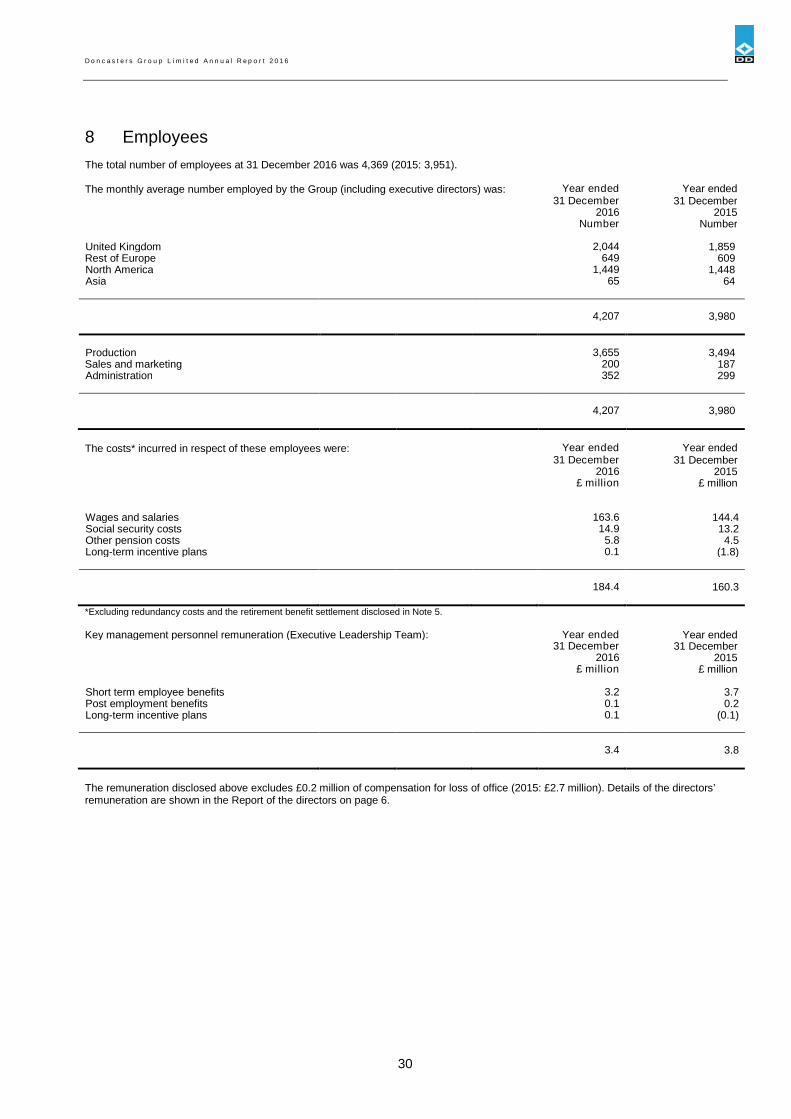
D o n c a s t e r s G r o u p L i m i t e d A n n u a l R e p o r t 2 0 1 6
30
8 Employees
The total number of employees at 31 December 2016 was 4,369 (2015: 3,951).
The monthly average number employed by the Group (including executive directors) was: Year ended Year ended31 December 31 December
2016 2015Number Number
United Kingdom 2,044 1,859Rest of Europe 649 609North America 1,449 1,448Asia 65 64
4,207 3,980
Production 3,655 3,494Sales and marketing 200 187Administration 352 299
4,207 3,980
The costs* incurred in respect of these employees were: Year ended Year ended31 December 31 December
2016 2015£ million £ million
Wages and salaries 163.6 144.4Social security costs 14.9 13.2Other pension costs 5.8 4.5Long-term incentive plans 0.1 (1.8)
184.4 160.3
*Excluding redundancy costs and the retirement benefit settlement disclosed in Note 5.
Key management personnel remuneration (Executive Leadership Team): Year ended Year ended31 December 31 December
2016 2015£ million £ million
Short term employee benefits 3.2 3.7Post employment benefits 0.1 0.2Long-term incentive plans 0.1 (0.1)
3.4 3.8
The remuneration disclosed above excludes £0.2 million of compensation for loss of office (2015: £2.7 million). Details of the directors’remuneration are shown in the Report of the directors on page 6.

D o n c a s t e r s G r o u p L i m i t e d A n n u a l R e p o r t 2 0 1 6
31
9 Intangible assets
Finite-lived Other
intangible development
Goodwill assets Software costs Total
£ million £ million £ million £ million £ million
Cost
At 1 January 2015 254.5 580.1 4.6 7.8 847.0
Additions — — 0.6 3.1 3.7Disposals (7.2) (19.7) — — (26.9)Currency exchange movements 6.5 11.0 (0.1) — 17.4
At 1 January 2016 253.8 571.4 5.1 10.9 841.2
Acquisition of subsidiary 2.3 0.4 — — 2.7Additions — — 1.9 2.2 4.1Disposals — — (0.1) (0.5) (0.6)Currency exchange movements 25.6 51.3 0.6 0.2 77.7
At 31 December 2016 281.7 623.1 7.5 12.8 925.1
Amortisation and impairment
At 1 January 2015 52.5 356.7 2.8 2.3 414.3
Charge for the year — 30.5 0.3 0.1 30.9Disposals (7.2) (16.5) — — (23.7)Impairments 29.0 2.6 — — 31.6Currency exchange movements 1.7 6.5 0.1 — 8.3
At 1 January 2016 76.0 379.8 3.2 2.4 461.4
Charge for the year — 29.3 0.8 0.4 30.5Disposals — — (0.1) — (0.1)Currency exchange movements 5.2 31.0 0.4 0.1 36.7
At 31 December 2016 81.2 440.1 4.3 2.9 528.5
Net book amount at 31 December 2016 200.5 183.0 3.2 9.9 396.6
Net book amount at 31 December 2015 177.8 191.6 1.9 8.5 379.8
The amortisation and impairment charges are classified to cost of sales within the consolidated income statement.
Finite-lived intangible assets are all externally generated and arise on the Group’s previous acquisitions. They mainly comprisevaluations for customer contracts and relationships, order book, patents, trade names and supply agreements. The followingassumptions were used in the calculations of the fair value of these intangibles at inception:
Useful lives between 1 and 25 yearsLong-term growth rates between 2.5% and 3.0%Discount rates between 11.8% and 17.8%Royalty rates between 0.3% and 3.5%
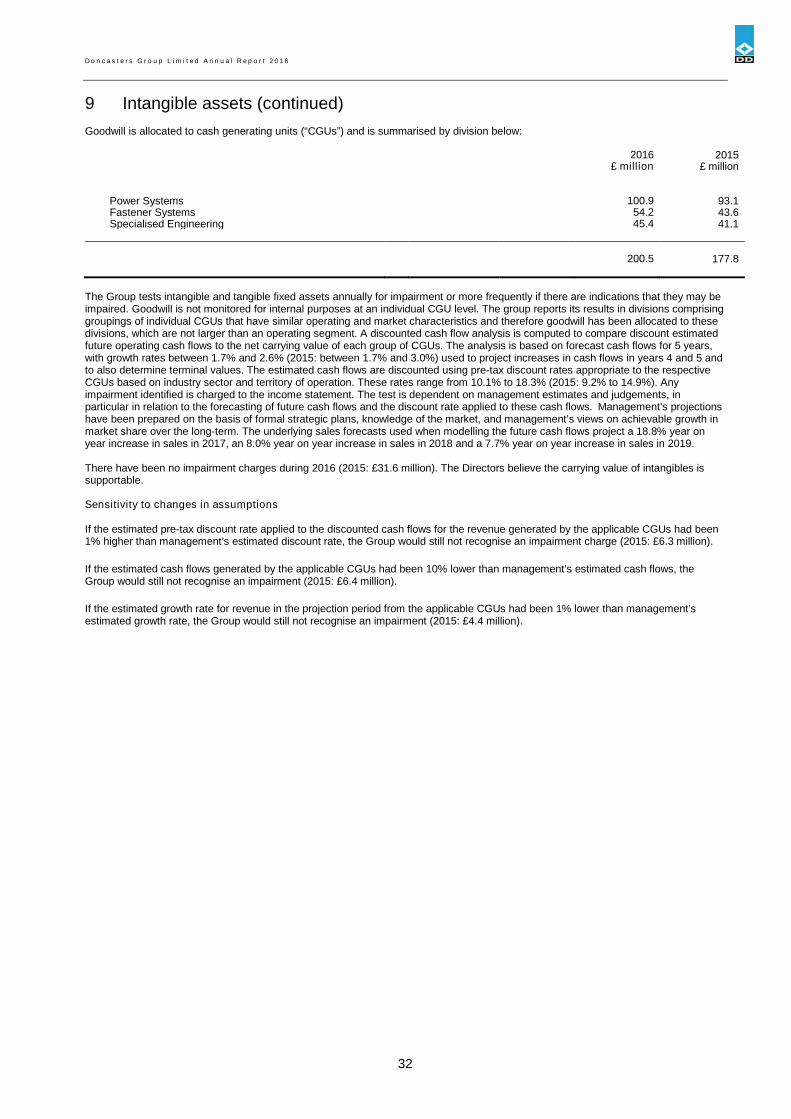
D o n c a s t e r s G r o u p L i m i t e d A n n u a l R e p o r t 2 0 1 6
32
9 Intangible assets (continued)
Goodwill is allocated to cash generating units (“CGUs”) and is summarised by division below:
2016 2015£ million £ million
Power Systems 100.9 93.1Fastener Systems 54.2 43.6Specialised Engineering 45.4 41.1
200.5 177.8
The Group tests intangible and tangible fixed assets annually for impairment or more frequently if there are indications that they may beimpaired. Goodwill is not monitored for internal purposes at an individual CGU level. The group reports its results in divisions comprisinggroupings of individual CGUs that have similar operating and market characteristics and therefore goodwill has been allocated to thesedivisions, which are not larger than an operating segment. A discounted cash flow analysis is computed to compare discount estimatedfuture operating cash flows to the net carrying value of each group of CGUs. The analysis is based on forecast cash flows for 5 years,with growth rates between 1.7% and 2.6% (2015: between 1.7% and 3.0%) used to project increases in cash flows in years 4 and 5 andto also determine terminal values. The estimated cash flows are discounted using pre-tax discount rates appropriate to the respectiveCGUs based on industry sector and territory of operation. These rates range from 10.1% to 18.3% (2015: 9.2% to 14.9%). Anyimpairment identified is charged to the income statement. The test is dependent on management estimates and judgements, inparticular in relation to the forecasting of future cash flows and the discount rate applied to these cash flows. Management’s projectionshave been prepared on the basis of formal strategic plans, knowledge of the market, and management’s views on achievable growth inmarket share over the long-term. The underlying sales forecasts used when modelling the future cash flows project a 18.8% year onyear increase in sales in 2017, an 8.0% year on year increase in sales in 2018 and a 7.7% year on year increase in sales in 2019.
There have been no impairment charges during 2016 (2015: £31.6 million). The Directors believe the carrying value of intangibles issupportable.
Sensitivity to changes in assumptions
If the estimated pre-tax discount rate applied to the discounted cash flows for the revenue generated by the applicable CGUs had been1% higher than management’s estimated discount rate, the Group would still not recognise an impairment charge (2015: £6.3 million).
If the estimated cash flows generated by the applicable CGUs had been 10% lower than management’s estimated cash flows, theGroup would still not recognise an impairment (2015: £6.4 million).
If the estimated growth rate for revenue in the projection period from the applicable CGUs had been 1% lower than management’sestimated growth rate, the Group would still not recognise an impairment (2015: £4.4 million).
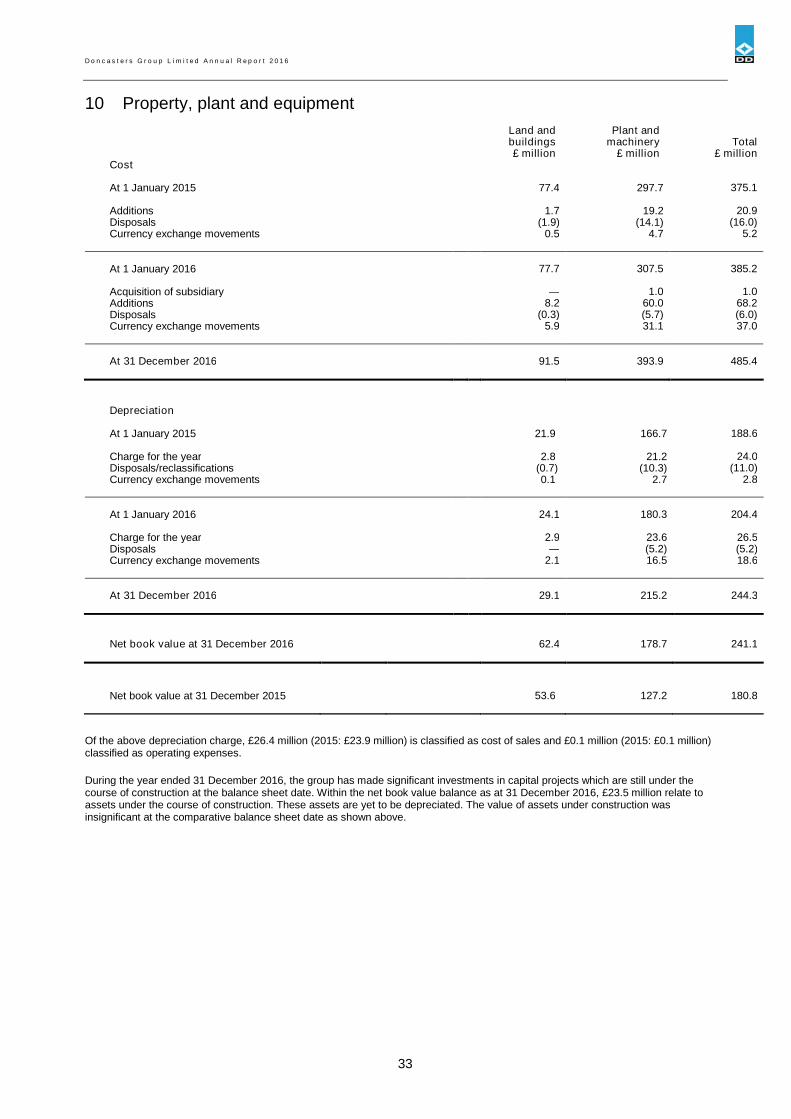
D o n c a s t e r s G r o u p L i m i t e d A n n u a l R e p o r t 2 0 1 6
33
10 Property, plant and equipment
Land and Plant andbuildings machinery Total£ million £ million £ million
Cost
At 1 January 2015 77.4 297.7 375.1
Additions 1.7 19.2 20.9Disposals (1.9) (14.1) (16.0)Currency exchange movements 0.5 4.7 5.2
At 1 January 2016 77.7 307.5 385.2
Acquisition of subsidiary — 1.0 1.0Additions 8.2 60.0 68.2Disposals (0.3) (5.7) (6.0)Currency exchange movements 5.9 31.1 37.0
At 31 December 2016 91.5 393.9 485.4
Depreciation
At 1 January 2015 21.9 166.7 188.6
Charge for the year 2.8 21.2 24.0Disposals/reclassifications (0.7) (10.3) (11.0)Currency exchange movements 0.1 2.7 2.8
At 1 January 2016 24.1 180.3 204.4
Charge for the year 2.9 23.6 26.5Disposals — (5.2) (5.2)Currency exchange movements 2.1 16.5 18.6
At 31 December 2016 29.1 215.2 244.3
Net book value at 31 December 2016 62.4 178.7 241.1
Net book value at 31 December 2015 53.6 127.2 180.8
Of the above depreciation charge, £26.4 million (2015: £23.9 million) is classified as cost of sales and £0.1 million (2015: £0.1 million)classified as operating expenses.
During the year ended 31 December 2016, the group has made significant investments in capital projects which are still under thecourse of construction at the balance sheet date. Within the net book value balance as at 31 December 2016, £23.5 million relate toassets under the course of construction. These assets are yet to be depreciated. The value of assets under construction wasinsignificant at the comparative balance sheet date as shown above.
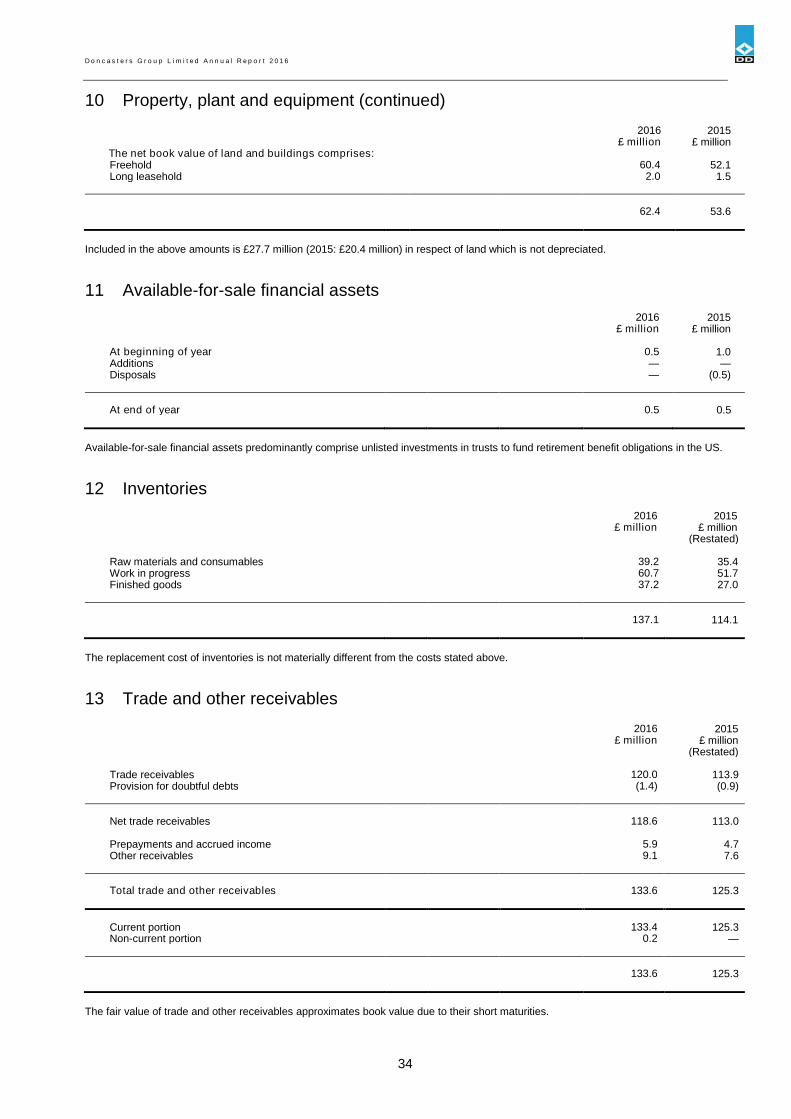
D o n c a s t e r s G r o u p L i m i t e d A n n u a l R e p o r t 2 0 1 6
34
10 Property, plant and equipment (continued)
2016 2015£ million £ million
The net book value of land and buildings comprises:Freehold 60.4 52.1Long leasehold 2.0 1.5
62.4 53.6
Included in the above amounts is £27.7 million (2015: £20.4 million) in respect of land which is not depreciated.
11 Available-for-sale financial assets
2016 2015£ million £ million
At beginning of year 0.5 1.0Additions — —Disposals — (0.5)
At end of year 0.5 0.5
Available-for-sale financial assets predominantly comprise unlisted investments in trusts to fund retirement benefit obligations in the US.
12 Inventories
2016 2015£ million £ million
(Restated)
Raw materials and consumables 39.2 35.4Work in progress 60.7 51.7Finished goods 37.2 27.0
137.1 114.1
The replacement cost of inventories is not materially different from the costs stated above.
13 Trade and other receivables
2016 2015£ million £ million
(Restated)
Trade receivables 120.0 113.9Provision for doubtful debts (1.4) (0.9)
Net trade receivables 118.6 113.0
Prepayments and accrued income 5.9 4.7Other receivables 9.1 7.6
Total trade and other receivables 133.6 125.3
Current portion 133.4 125.3Non-current portion 0.2 —
133.6 125.3
The fair value of trade and other receivables approximates book value due to their short maturities.
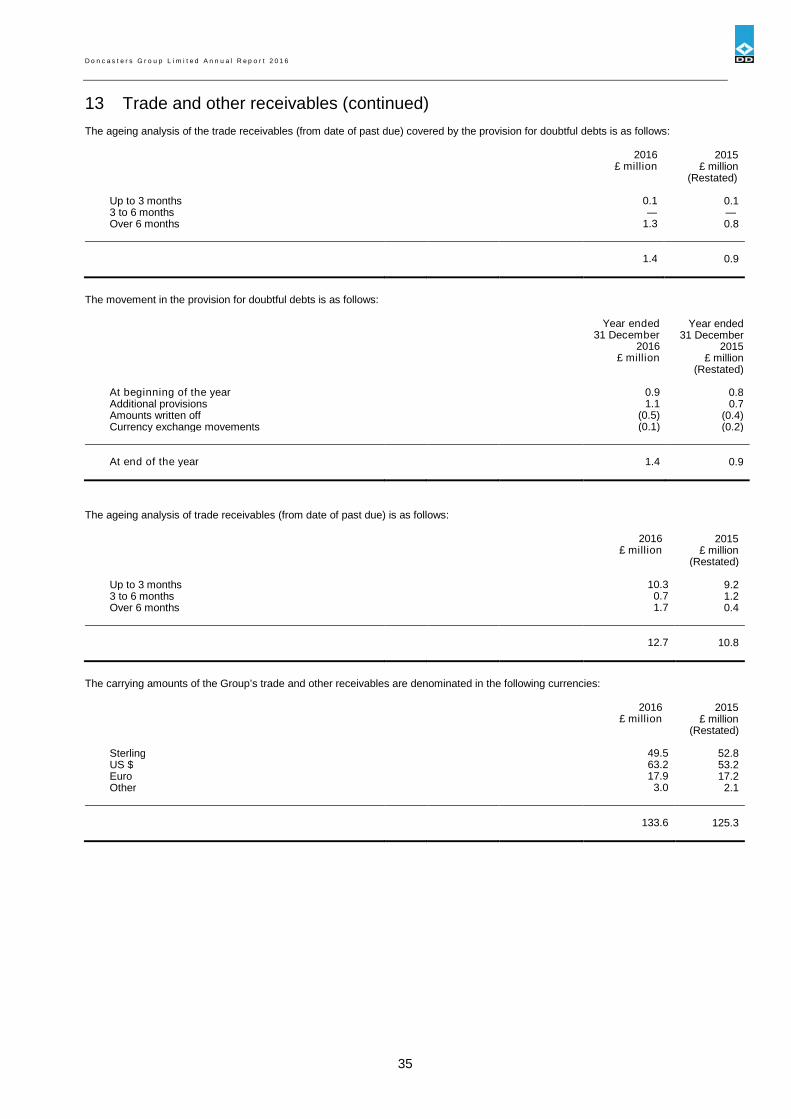
D o n c a s t e r s G r o u p L i m i t e d A n n u a l R e p o r t 2 0 1 6
35
13 Trade and other receivables (continued)
The ageing analysis of the trade receivables (from date of past due) covered by the provision for doubtful debts is as follows:
2016 2015£ million £ million
(Restated)
Up to 3 months 0.1 0.13 to 6 months — —Over 6 months 1.3 0.8
1.4 0.9
The movement in the provision for doubtful debts is as follows:
Year ended Year ended31 December 31 December
2016 2015£ million £ million
(Restated)
At beginning of the year 0.9 0.8Additional provisions 1.1 0.7Amounts written off (0.5) (0.4)Currency exchange movements (0.1) (0.2)
At end of the year 1.4 0.9
The ageing analysis of trade receivables (from date of past due) is as follows:
2016 2015£ million £ million
(Restated)
Up to 3 months 10.3 9.23 to 6 months 0.7 1.2Over 6 months 1.7 0.4
12.7 10.8
The carrying amounts of the Group’s trade and other receivables are denominated in the following currencies:
2016 2015£ million £ million
(Restated)
Sterling 49.5 52.8US $ 63.2 53.2Euro 17.9 17.2Other 3.0 2.1
133.6 125.3
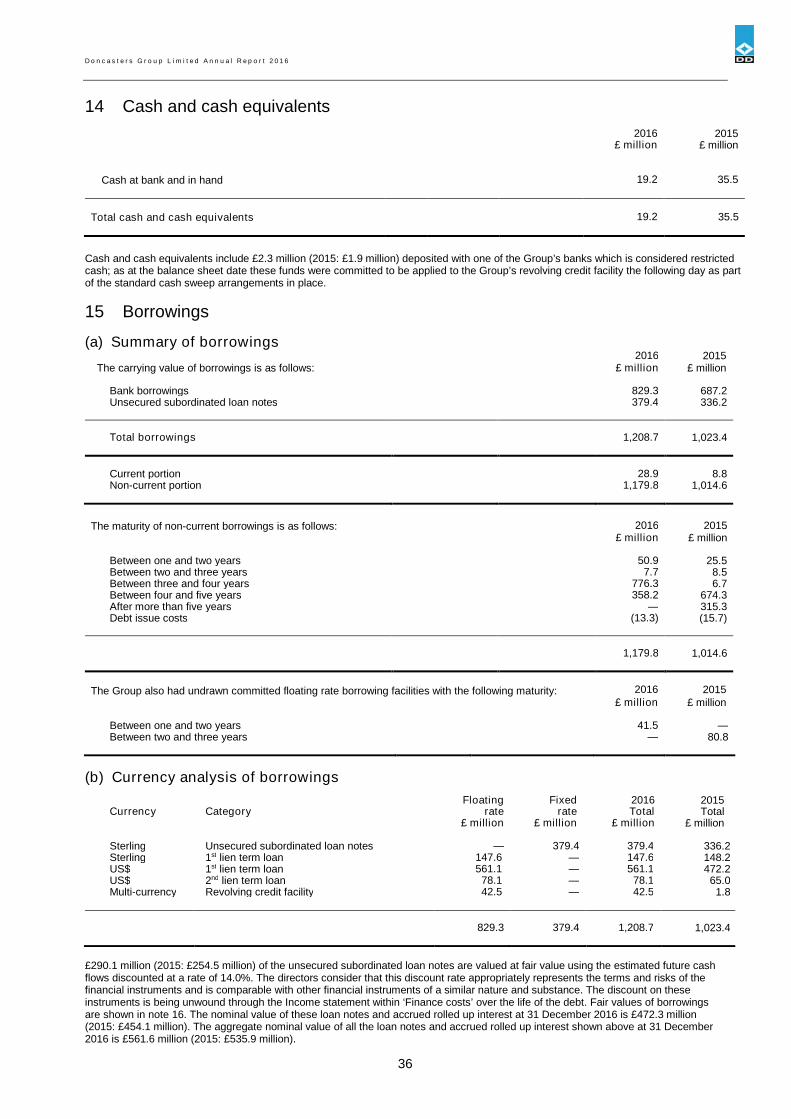
D o n c a s t e r s G r o u p L i m i t e d A n n u a l R e p o r t 2 0 1 6
36
14 Cash and cash equivalents
2016 2015£ million £ million
Cash at bank and in hand 19.2 35.5
Total cash and cash equivalents 19.2 35.5
Cash and cash equivalents include £2.3 million (2015: £1.9 million) deposited with one of the Group’s banks which is considered restrictedcash; as at the balance sheet date these funds were committed to be applied to the Group’s revolving credit facility the following day as partof the standard cash sweep arrangements in place.
15 Borrowings
(a) Summary of borrowings2016 2015
The carrying value of borrowings is as follows: £ million £ million
Bank borrowings 829.3 687.2Unsecured subordinated loan notes 379.4 336.2
Total borrowings 1,208.7 1,023.4
Current portion 28.9 8.8Non-current portion 1,179.8 1,014.6
The maturity of non-current borrowings is as follows: 2016 2015£ million £ million
Between one and two years 50.9 25.5Between two and three years 7.7 8.5Between three and four years 776.3 6.7Between four and five years 358.2 674.3After more than five years — 315.3Debt issue costs (13.3) (15.7)
1,179.8 1,014.6
The Group also had undrawn committed floating rate borrowing facilities with the following maturity: 2016 2015£ million £ million
Between one and two years 41.5 —Between two and three years — 80.8
(b) Currency analysis of borrowings
Floating Fixed 2016 2015Currency Category rate rate Total Total
£ million £ million £ million £ million
Sterling Unsecured subordinated loan notes — 379.4 379.4 336.2Sterling 1st lien term loan 147.6 — 147.6 148.2US$ 1st lien term loan 561.1 — 561.1 472.2US$ 2nd lien term loan 78.1 — 78.1 65.0Multi-currency Revolving credit facility 42.5 — 42.5 1.8
829.3 379.4 1,208.7 1,023.4
£290.1 million (2015: £254.5 million) of the unsecured subordinated loan notes are valued at fair value using the estimated future cashflows discounted at a rate of 14.0%. The directors consider that this discount rate appropriately represents the terms and risks of thefinancial instruments and is comparable with other financial instruments of a similar nature and substance. The discount on theseinstruments is being unwound through the Income statement within ‘Finance costs’ over the life of the debt. Fair values of borrowingsare shown in note 16. The nominal value of these loan notes and accrued rolled up interest at 31 December 2016 is £472.3 million(2015: £454.1 million). The aggregate nominal value of all the loan notes and accrued rolled up interest shown above at 31 December2016 is £561.6 million (2015: £535.9 million).
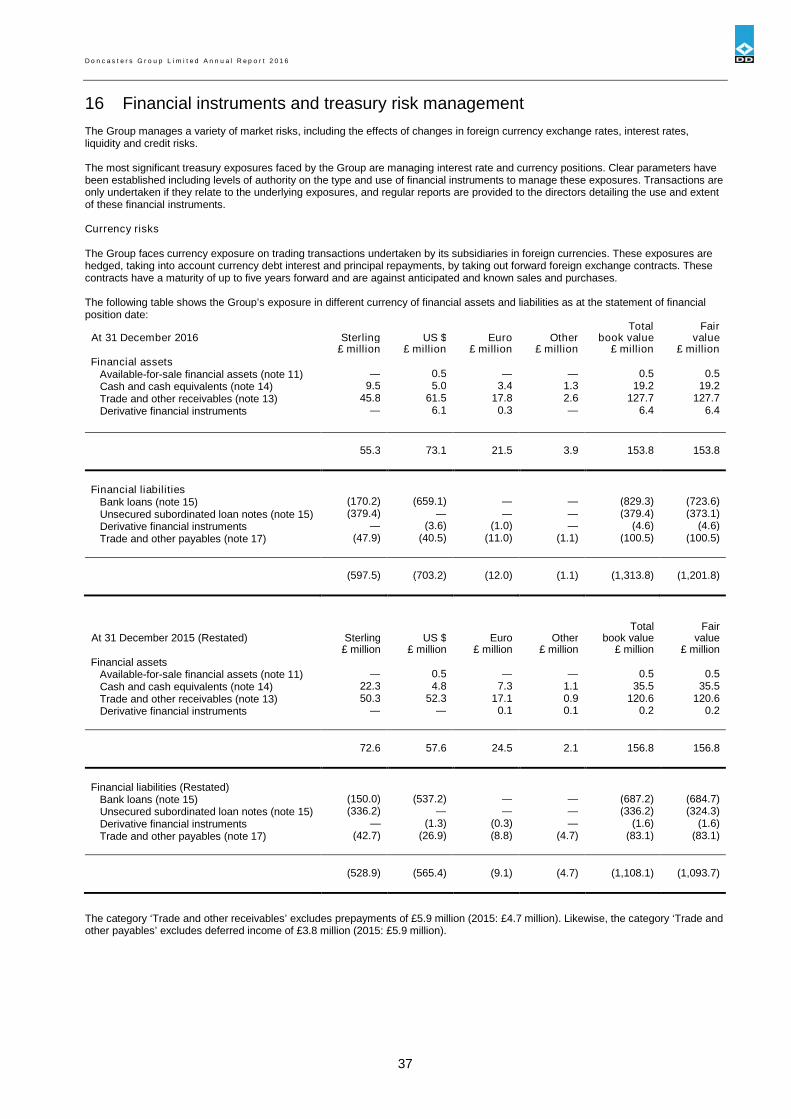
D o n c a s t e r s G r o u p L i m i t e d A n n u a l R e p o r t 2 0 1 6
37
16 Financial instruments and treasury risk management
The Group manages a variety of market risks, including the effects of changes in foreign currency exchange rates, interest rates,liquidity and credit risks.
The most significant treasury exposures faced by the Group are managing interest rate and currency positions. Clear parameters havebeen established including levels of authority on the type and use of financial instruments to manage these exposures. Transactions areonly undertaken if they relate to the underlying exposures, and regular reports are provided to the directors detailing the use and extentof these financial instruments.
Currency risks
The Group faces currency exposure on trading transactions undertaken by its subsidiaries in foreign currencies. These exposures arehedged, taking into account currency debt interest and principal repayments, by taking out forward foreign exchange contracts. Thesecontracts have a maturity of up to five years forward and are against anticipated and known sales and purchases.
The following table shows the Group’s exposure in different currency of financial assets and liabilities as at the statement of financialposition date:
Total FairAt 31 December 2016 Sterling US $ Euro Other book value value
£ million £ million £ million £ million £ million £ millionFinancial assets
Available-for-sale financial assets (note 11) — 0.5 — — 0.5 0.5Cash and cash equivalents (note 14) 9.5 5.0 3.4 1.3 19.2 19.2Trade and other receivables (note 13) 45.8 61.5 17.8 2.6 127.7 127.7Derivative financial instruments — 6.1 0.3 — 6.4 6.4
55.3 73.1 21.5 3.9 153.8 153.8
Financial liabilitiesBank loans (note 15) (170.2) (659.1) — — (829.3) (723.6)Unsecured subordinated loan notes (note 15) (379.4) — — — (379.4) (373.1)Derivative financial instruments — (3.6) (1.0) — (4.6) (4.6)Trade and other payables (note 17) (47.9) (40.5) (11.0) (1.1) (100.5) (100.5)
(597.5) (703.2) (12.0) (1.1) (1,313.8) (1,201.8)
Total FairAt 31 December 2015 (Restated) Sterling US $ Euro Other book value value
£ million £ million £ million £ million £ million £ millionFinancial assets
Available-for-sale financial assets (note 11) — 0.5 — — 0.5 0.5Cash and cash equivalents (note 14) 22.3 4.8 7.3 1.1 35.5 35.5Trade and other receivables (note 13) 50.3 52.3 17.1 0.9 120.6 120.6Derivative financial instruments — — 0.1 0.1 0.2 0.2
72.6 57.6 24.5 2.1 156.8 156.8
Financial liabilities (Restated)Bank loans (note 15) (150.0) (537.2) — — (687.2) (684.7)Unsecured subordinated loan notes (note 15) (336.2) — — — (336.2) (324.3)Derivative financial instruments — (1.3) (0.3) — (1.6) (1.6)Trade and other payables (note 17) (42.7) (26.9) (8.8) (4.7) (83.1) (83.1)
(528.9) (565.4) (9.1) (4.7) (1,108.1) (1,093.7)
The category ‘Trade and other receivables’ excludes prepayments of £5.9 million (2015: £4.7 million). Likewise, the category ‘Trade andother payables’ excludes deferred income of £3.8 million (2015: £5.9 million).
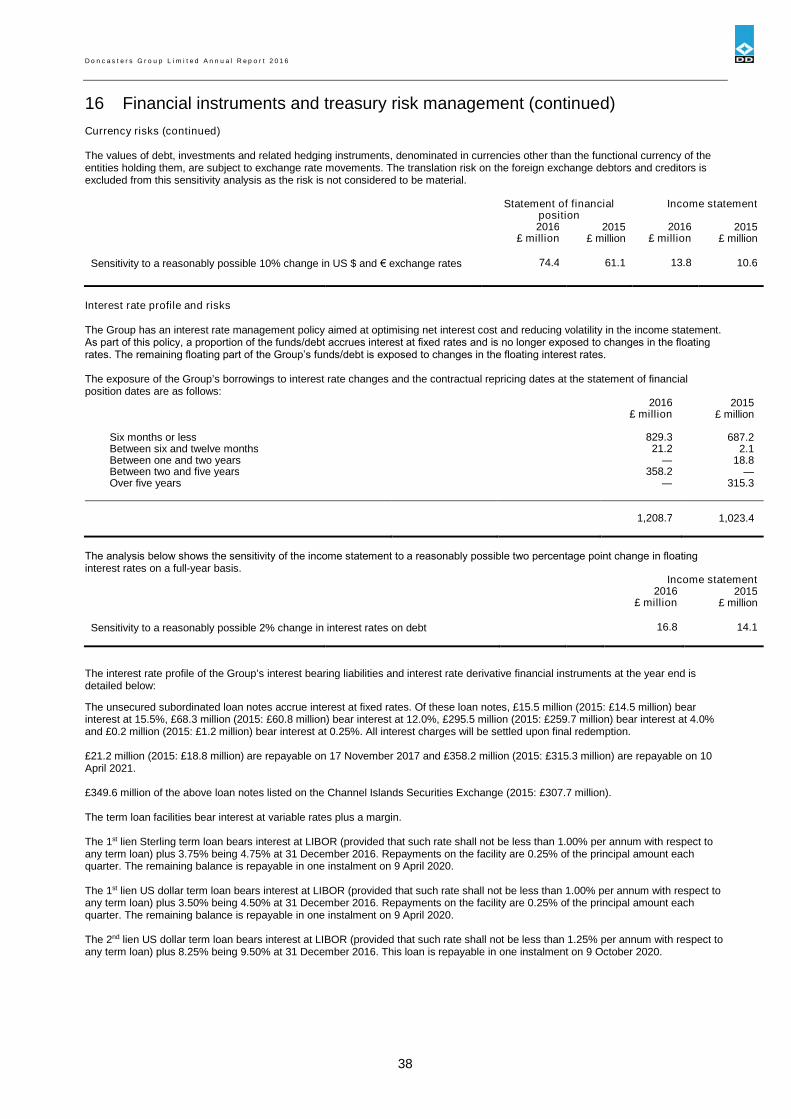
D o n c a s t e r s G r o u p L i m i t e d A n n u a l R e p o r t 2 0 1 6
38
16 Financial instruments and treasury risk management (continued)
Currency risks (continued)
The values of debt, investments and related hedging instruments, denominated in currencies other than the functional currency of theentities holding them, are subject to exchange rate movements. The translation risk on the foreign exchange debtors and creditors isexcluded from this sensitivity analysis as the risk is not considered to be material.
Statement of financialposition
Income statement
2016 2015 2016 2015£ million £ million £ million £ million
Sensitivity to a reasonably possible 10% change in US $ and € exchange rates 74.4 61.1 13.8 10.6
Interest rate profile and risks
The Group has an interest rate management policy aimed at optimising net interest cost and reducing volatility in the income statement.As part of this policy, a proportion of the funds/debt accrues interest at fixed rates and is no longer exposed to changes in the floating rates. The remaining floating part of the Group’s funds/debt is exposed to changes in the floating interest rates.
The exposure of the Group’s borrowings to interest rate changes and the contractual repricing dates at the statement of financialposition dates are as follows:
2016 2015£ million £ million
Six months or less 829.3 687.2Between six and twelve months 21.2 2.1Between one and two years — 18.8Between two and five years 358.2 —Over five years — 315.3
1,208.7 1,023.4
The analysis below shows the sensitivity of the income statement to a reasonably possible two percentage point change in floating interest rates on a full-year basis.
Income statement2016 2015
£ million £ million
Sensitivity to a reasonably possible 2% change in interest rates on debt 16.8 14.1
The interest rate profile of the Group’s interest bearing liabilities and interest rate derivative financial instruments at the year end isdetailed below:
The unsecured subordinated loan notes accrue interest at fixed rates. Of these loan notes, £15.5 million (2015: £14.5 million) bearinterest at 15.5%, £68.3 million (2015: £60.8 million) bear interest at 12.0%, £295.5 million (2015: £259.7 million) bear interest at 4.0%and £0.2 million (2015: £1.2 million) bear interest at 0.25%. All interest charges will be settled upon final redemption.
£21.2 million (2015: £18.8 million) are repayable on 17 November 2017 and £358.2 million (2015: £315.3 million) are repayable on 10April 2021.
£349.6 million of the above loan notes listed on the Channel Islands Securities Exchange (2015: £307.7 million).
The term loan facilities bear interest at variable rates plus a margin.
The 1st lien Sterling term loan bears interest at LIBOR (provided that such rate shall not be less than 1.00% per annum with respect toany term loan) plus 3.75% being 4.75% at 31 December 2016. Repayments on the facility are 0.25% of the principal amount eachquarter. The remaining balance is repayable in one instalment on 9 April 2020.
The 1st lien US dollar term loan bears interest at LIBOR (provided that such rate shall not be less than 1.00% per annum with respect toany term loan) plus 3.50% being 4.50% at 31 December 2016. Repayments on the facility are 0.25% of the principal amount eachquarter. The remaining balance is repayable in one instalment on 9 April 2020.
The 2nd lien US dollar term loan bears interest at LIBOR (provided that such rate shall not be less than 1.25% per annum with respect toany term loan) plus 8.25% being 9.50% at 31 December 2016. This loan is repayable in one instalment on 9 October 2020.
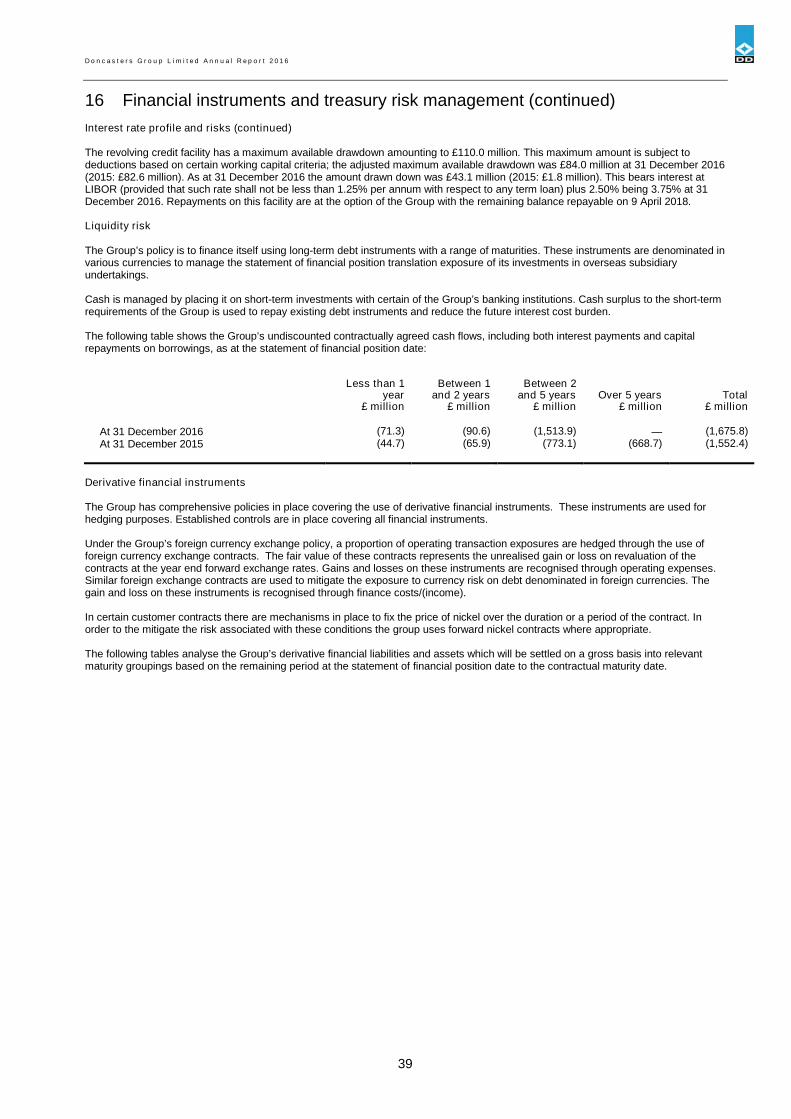
D o n c a s t e r s G r o u p L i m i t e d A n n u a l R e p o r t 2 0 1 6
39
16 Financial instruments and treasury risk management (continued)
Interest rate profile and risks (continued)
The revolving credit facility has a maximum available drawdown amounting to £110.0 million. This maximum amount is subject todeductions based on certain working capital criteria; the adjusted maximum available drawdown was £84.0 million at 31 December 2016(2015: £82.6 million). As at 31 December 2016 the amount drawn down was £43.1 million (2015: £1.8 million). This bears interest atLIBOR (provided that such rate shall not be less than 1.25% per annum with respect to any term loan) plus 2.50% being 3.75% at 31December 2016. Repayments on this facility are at the option of the Group with the remaining balance repayable on 9 April 2018.
Liquidity risk
The Group’s policy is to finance itself using long-term debt instruments with a range of maturities. These instruments are denominated invarious currencies to manage the statement of financial position translation exposure of its investments in overseas subsidiaryundertakings.
Cash is managed by placing it on short-term investments with certain of the Group’s banking institutions. Cash surplus to the short-termrequirements of the Group is used to repay existing debt instruments and reduce the future interest cost burden.
The following table shows the Group’s undiscounted contractually agreed cash flows, including both interest payments and capitalrepayments on borrowings, as at the statement of financial position date:
Less than 1year
Between 1and 2 years
Between 2and 5 years Over 5 years Total
£ million £ million £ million £ million £ million
At 31 December 2016 (71.3) (90.6) (1,513.9) — (1,675.8)At 31 December 2015 (44.7) (65.9) (773.1) (668.7) (1,552.4)
Derivative financial instruments
The Group has comprehensive policies in place covering the use of derivative financial instruments. These instruments are used forhedging purposes. Established controls are in place covering all financial instruments.
Under the Group’s foreign currency exchange policy, a proportion of operating transaction exposures are hedged through the use offoreign currency exchange contracts. The fair value of these contracts represents the unrealised gain or loss on revaluation of thecontracts at the year end forward exchange rates. Gains and losses on these instruments are recognised through operating expenses.Similar foreign exchange contracts are used to mitigate the exposure to currency risk on debt denominated in foreign currencies. Thegain and loss on these instruments is recognised through finance costs/(income).
In certain customer contracts there are mechanisms in place to fix the price of nickel over the duration or a period of the contract. Inorder to the mitigate the risk associated with these conditions the group uses forward nickel contracts where appropriate.
The following tables analyse the Group’s derivative financial liabilities and assets which will be settled on a gross basis into relevantmaturity groupings based on the remaining period at the statement of financial position date to the contractual maturity date.
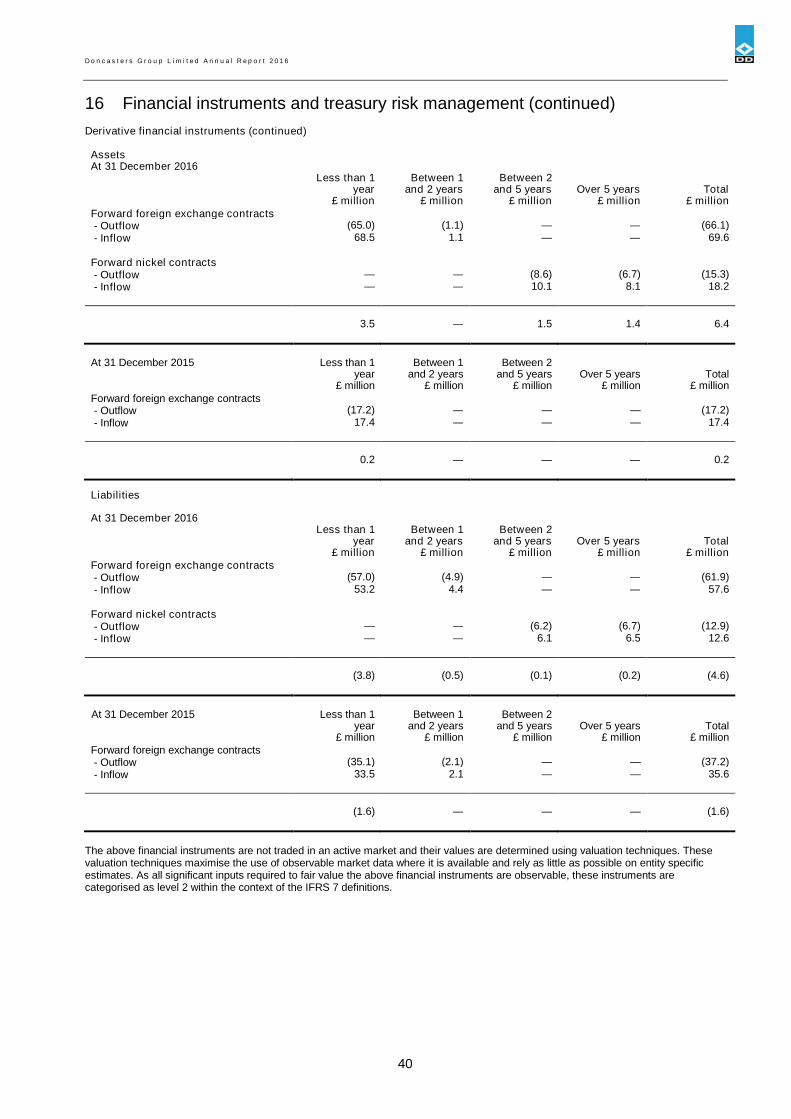
D o n c a s t e r s G r o u p L i m i t e d A n n u a l R e p o r t 2 0 1 6
40
16 Financial instruments and treasury risk management (continued)
Derivative financial instruments (continued)
AssetsAt 31 December 2016
Less than 1year
Between 1and 2 years
Between 2and 5 years Over 5 years Total
£ million £ million £ million £ million £ millionForward foreign exchange contracts- Outflow (65.0) (1.1) — — (66.1)- Inflow 68.5 1.1 — — 69.6
Forward nickel contracts- Outflow — — (8.6) (6.7) (15.3)- Inflow — — 10.1 8.1 18.2
3.5 — 1.5 1.4 6.4
At 31 December 2015 Less than 1year
Between 1and 2 years
Between 2and 5 years Over 5 years Total
£ million £ million £ million £ million £ millionForward foreign exchange contracts- Outflow (17.2) — — — (17.2)- Inflow 17.4 — — — 17.4
0.2 — — — 0.2
Liabilities
At 31 December 2016Less than 1
yearBetween 1
and 2 yearsBetween 2
and 5 years Over 5 years Total£ million £ million £ million £ million £ million
Forward foreign exchange contracts- Outflow (57.0) (4.9) — — (61.9)- Inflow 53.2 4.4 — — 57.6
Forward nickel contracts- Outflow — — (6.2) (6.7) (12.9)- Inflow — — 6.1 6.5 12.6
(3.8) (0.5) (0.1) (0.2) (4.6)
At 31 December 2015 Less than 1year
Between 1and 2 years
Between 2and 5 years Over 5 years Total
£ million £ million £ million £ million £ millionForward foreign exchange contracts- Outflow (35.1) (2.1) — — (37.2)- Inflow 33.5 2.1 — — 35.6
(1.6) — — — (1.6)
The above financial instruments are not traded in an active market and their values are determined using valuation techniques. Thesevaluation techniques maximise the use of observable market data where it is available and rely as little as possible on entity specificestimates. As all significant inputs required to fair value the above financial instruments are observable, these instruments arecategorised as level 2 within the context of the IFRS 7 definitions.
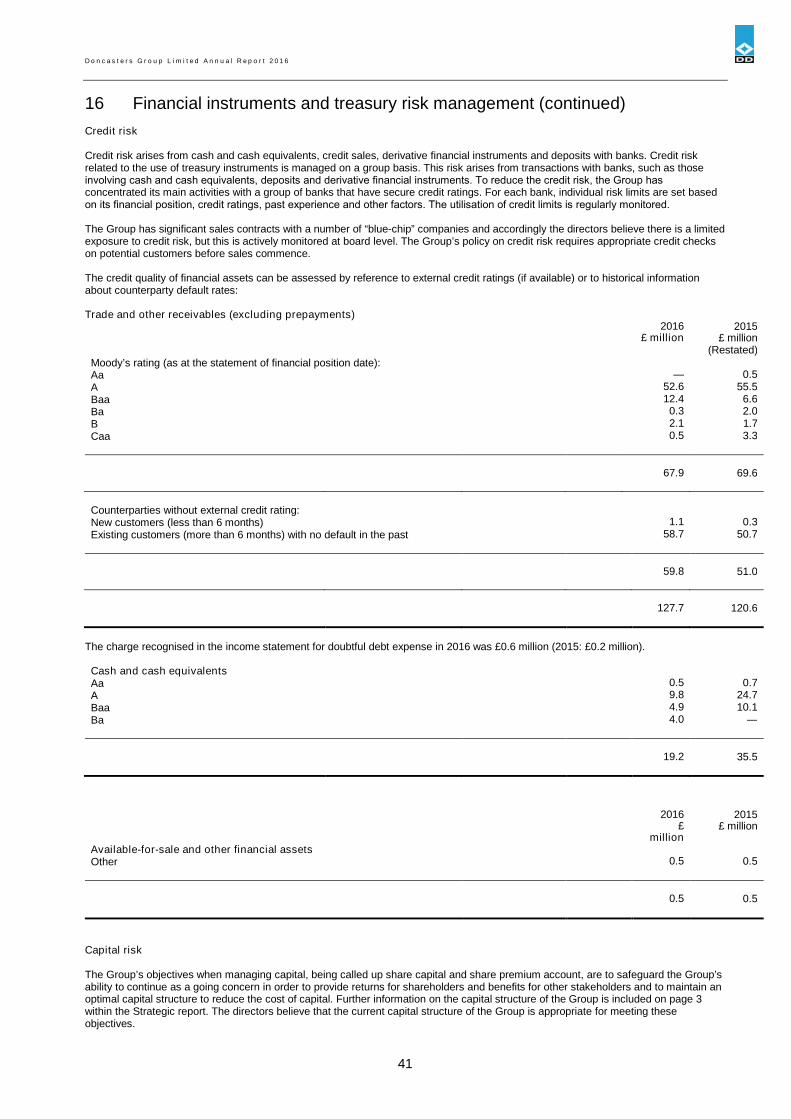
D o n c a s t e r s G r o u p L i m i t e d A n n u a l R e p o r t 2 0 1 6
41
16 Financial instruments and treasury risk management (continued)
Credit risk
Credit risk arises from cash and cash equivalents, credit sales, derivative financial instruments and deposits with banks. Credit riskrelated to the use of treasury instruments is managed on a group basis. This risk arises from transactions with banks, such as thoseinvolving cash and cash equivalents, deposits and derivative financial instruments. To reduce the credit risk, the Group has concentrated its main activities with a group of banks that have secure credit ratings. For each bank, individual risk limits are set basedon its financial position, credit ratings, past experience and other factors. The utilisation of credit limits is regularly monitored.
The Group has significant sales contracts with a number of “blue-chip” companies and accordingly the directors believe there is a limitedexposure to credit risk, but this is actively monitored at board level. The Group’s policy on credit risk requires appropriate credit checkson potential customers before sales commence.
The credit quality of financial assets can be assessed by reference to external credit ratings (if available) or to historical informationabout counterparty default rates:
Trade and other receivables (excluding prepayments)2016 2015
£ million £ million(Restated)
Moody’s rating (as at the statement of financial position date):Aa — 0.5A 52.6 55.5Baa 12.4 6.6Ba 0.3 2.0B 2.1 1.7Caa 0.5 3.3
67.9 69.6
Counterparties without external credit rating:New customers (less than 6 months) 1.1 0.3Existing customers (more than 6 months) with no default in the past 58.7 50.7
59.8 51.0
127.7 120.6
The charge recognised in the income statement for doubtful debt expense in 2016 was £0.6 million (2015: £0.2 million).
Cash and cash equivalentsAa 0.5 0.7A 9.8 24.7Baa 4.9 10.1Ba 4.0 —
19.2 35.5
2016 2015£
million£ million
Available-for-sale and other financial assetsOther 0.5 0.5
0.5 0.5
Capital risk
The Group’s objectives when managing capital, being called up share capital and share premium account, are to safeguard the Group’sability to continue as a going concern in order to provide returns for shareholders and benefits for other stakeholders and to maintain anoptimal capital structure to reduce the cost of capital. Further information on the capital structure of the Group is included on page 3within the Strategic report. The directors believe that the current capital structure of the Group is appropriate for meeting theseobjectives.
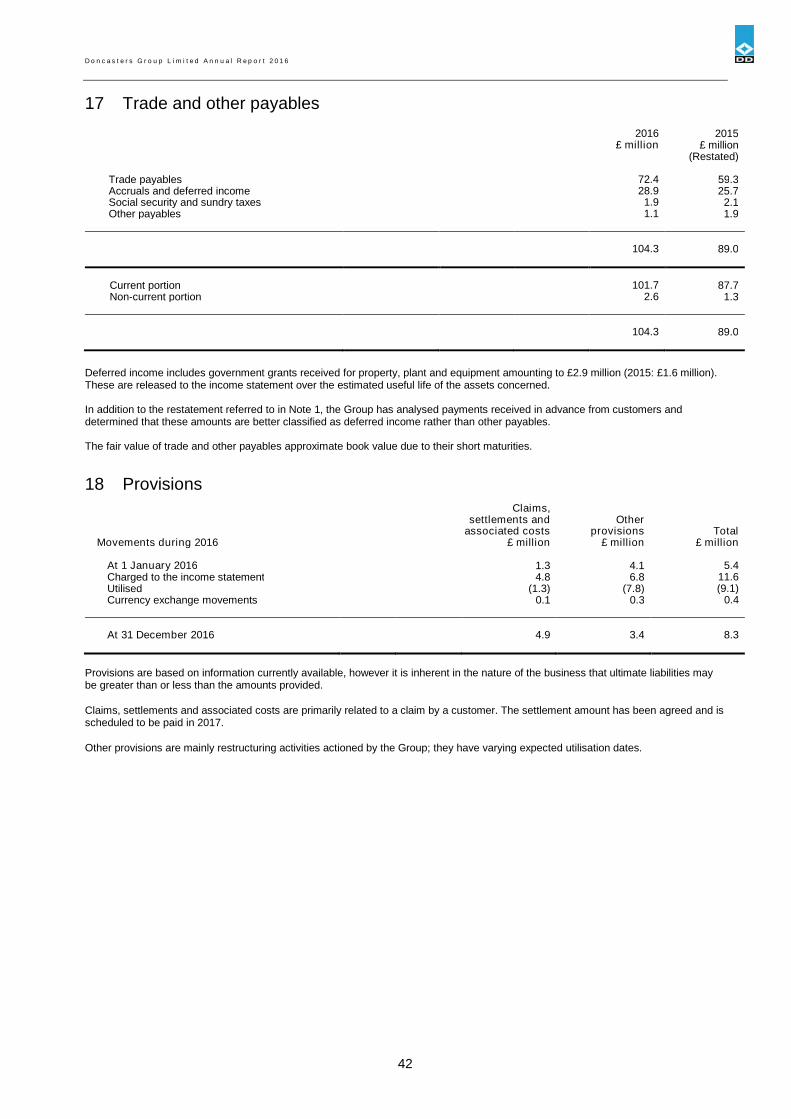
D o n c a s t e r s G r o u p L i m i t e d A n n u a l R e p o r t 2 0 1 6
42
17 Trade and other payables
2016 2015£ million £ million
(Restated)
Trade payables 72.4 59.3Accruals and deferred income 28.9 25.7Social security and sundry taxes 1.9 2.1Other payables 1.1 1.9
104.3 89.0
Current portion 101.7 87.7Non-current portion 2.6 1.3
104.3 89.0
Deferred income includes government grants received for property, plant and equipment amounting to £2.9 million (2015: £1.6 million).These are released to the income statement over the estimated useful life of the assets concerned.
In addition to the restatement referred to in Note 1, the Group has analysed payments received in advance from customers anddetermined that these amounts are better classified as deferred income rather than other payables.
The fair value of trade and other payables approximate book value due to their short maturities.
18 Provisions
Claims,settlements and Other
associated costs provisions TotalMovements during 2016 £ million £ million £ million
At 1 January 2016 1.3 4.1 5.4Charged to the income statement 4.8 6.8 11.6Utilised (1.3) (7.8) (9.1)Currency exchange movements 0.1 0.3 0.4
At 31 December 2016 4.9 3.4 8.3
Provisions are based on information currently available, however it is inherent in the nature of the business that ultimate liabilities maybe greater than or less than the amounts provided.
Claims, settlements and associated costs are primarily related to a claim by a customer. The settlement amount has been agreed and isscheduled to be paid in 2017.
Other provisions are mainly restructuring activities actioned by the Group; they have varying expected utilisation dates.
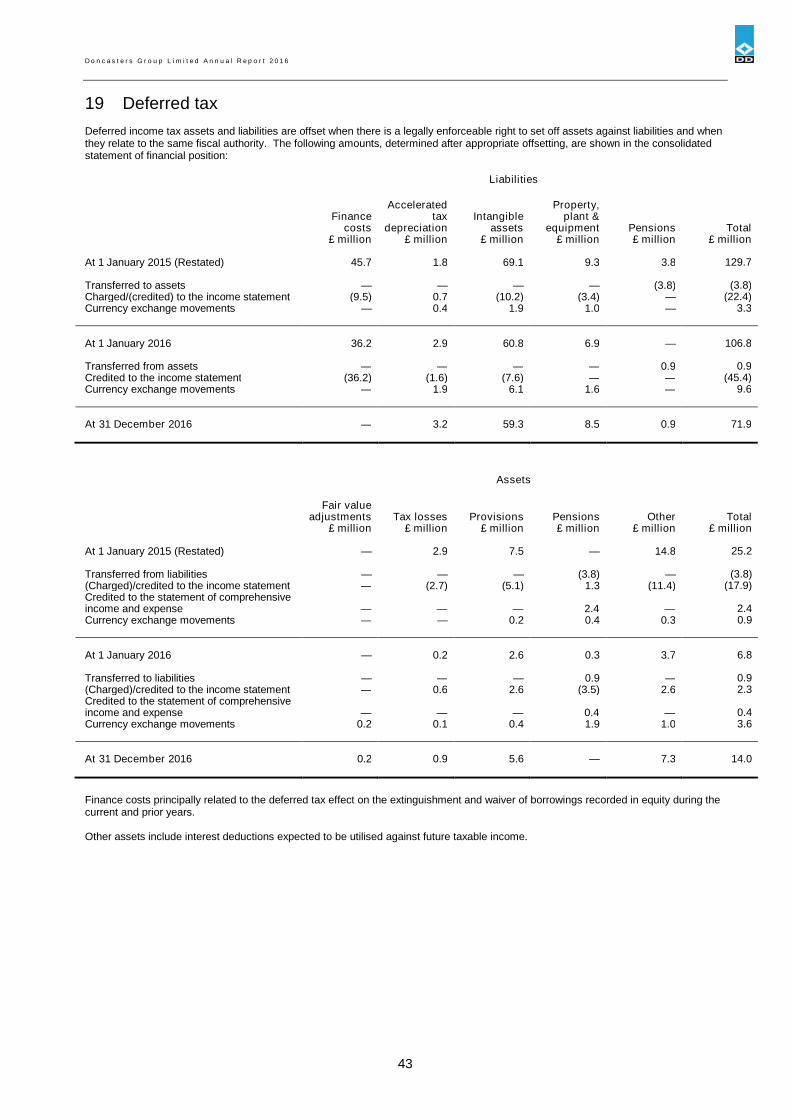
D o n c a s t e r s G r o u p L i m i t e d A n n u a l R e p o r t 2 0 1 6
43
19 Deferred tax
Deferred income tax assets and liabilities are offset when there is a legally enforceable right to set off assets against liabilities and whenthey relate to the same fiscal authority. The following amounts, determined after appropriate offsetting, are shown in the consolidatedstatement of financial position:
Liabilities
Financecosts
Acceleratedtax
depreciationIntangible
assets
Property,plant &
equipment Pensions Total£ million £ million £ million £ million £ million £ million
At 1 January 2015 (Restated) 45.7 1.8 69.1 9.3 3.8 129.7
Transferred to assets — — — — (3.8) (3.8)Charged/(credited) to the income statement (9.5) 0.7 (10.2) (3.4) — (22.4)Currency exchange movements — 0.4 1.9 1.0 — 3.3
At 1 January 2016 36.2 2.9 60.8 6.9 — 106.8
Transferred from assets — — — — 0.9 0.9Credited to the income statement (36.2) (1.6) (7.6) — — (45.4)Currency exchange movements — 1.9 6.1 1.6 — 9.6
At 31 December 2016 — 3.2 59.3 8.5 0.9 71.9
Assets
Fair valueadjustments Tax losses Provisions Pensions Other Total
£ million £ million £ million £ million £ million £ million
At 1 January 2015 (Restated) — 2.9 7.5 — 14.8 25.2
Transferred from liabilities — — — (3.8) — (3.8)(Charged)/credited to the income statement — (2.7) (5.1) 1.3 (11.4) (17.9)Credited to the statement of comprehensiveincome and expense — — — 2.4 — 2.4Currency exchange movements — — 0.2 0.4 0.3 0.9
At 1 January 2016 — 0.2 2.6 0.3 3.7 6.8
Transferred to liabilities — — — 0.9 — 0.9(Charged)/credited to the income statement — 0.6 2.6 (3.5) 2.6 2.3Credited to the statement of comprehensiveincome and expense — — — 0.4 — 0.4Currency exchange movements 0.2 0.1 0.4 1.9 1.0 3.6
At 31 December 2016 0.2 0.9 5.6 — 7.3 14.0
Finance costs principally related to the deferred tax effect on the extinguishment and waiver of borrowings recorded in equity during thecurrent and prior years.
Other assets include interest deductions expected to be utilised against future taxable income.
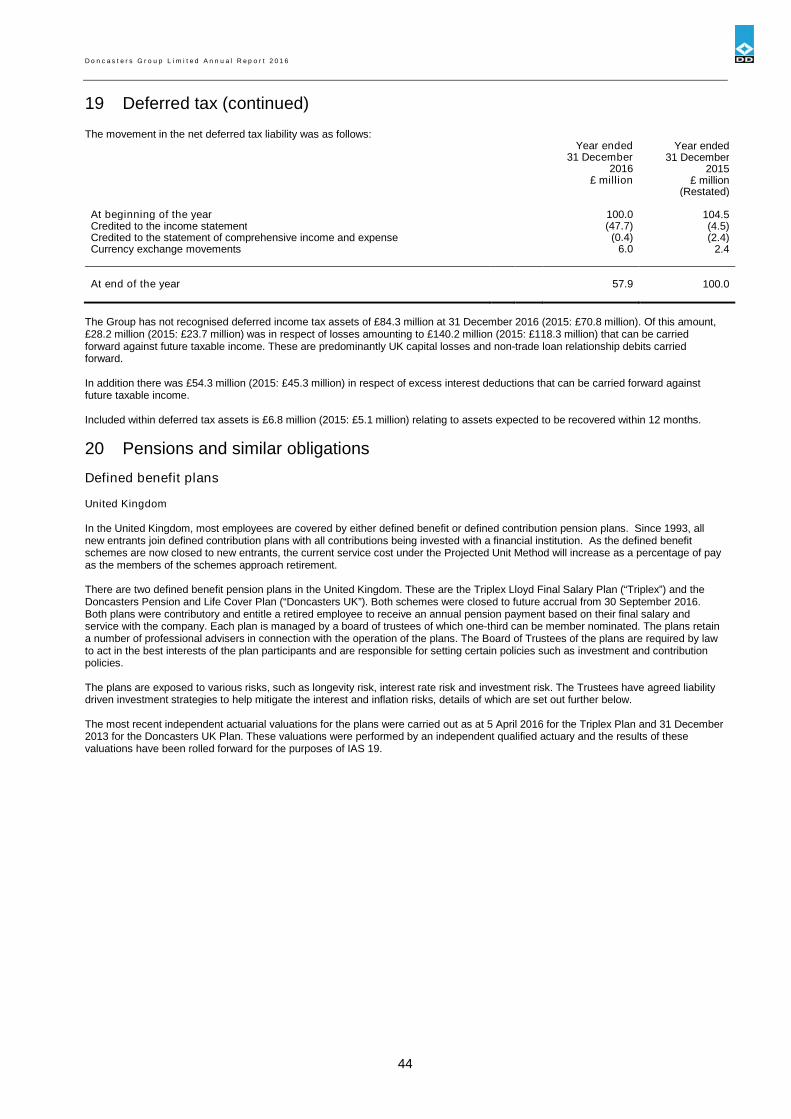
D o n c a s t e r s G r o u p L i m i t e d A n n u a l R e p o r t 2 0 1 6
44
19 Deferred tax (continued)
The movement in the net deferred tax liability was as follows:Year ended Year ended
31 December 31 December2016 2015
£ million £ million(Restated)
At beginning of the year 100.0 104.5Credited to the income statement (47.7) (4.5)Credited to the statement of comprehensive income and expense (0.4) (2.4)Currency exchange movements 6.0 2.4
At end of the year 57.9 100.0
The Group has not recognised deferred income tax assets of £84.3 million at 31 December 2016 (2015: £70.8 million). Of this amount,£28.2 million (2015: £23.7 million) was in respect of losses amounting to £140.2 million (2015: £118.3 million) that can be carriedforward against future taxable income. These are predominantly UK capital losses and non-trade loan relationship debits carriedforward.
In addition there was £54.3 million (2015: £45.3 million) in respect of excess interest deductions that can be carried forward againstfuture taxable income.
Included within deferred tax assets is £6.8 million (2015: £5.1 million) relating to assets expected to be recovered within 12 months.
20 Pensions and similar obligations
Defined benefit plans
United Kingdom
In the United Kingdom, most employees are covered by either defined benefit or defined contribution pension plans. Since 1993, allnew entrants join defined contribution plans with all contributions being invested with a financial institution. As the defined benefitschemes are now closed to new entrants, the current service cost under the Projected Unit Method will increase as a percentage of payas the members of the schemes approach retirement.
There are two defined benefit pension plans in the United Kingdom. These are the Triplex Lloyd Final Salary Plan (“Triplex”) and theDoncasters Pension and Life Cover Plan (“Doncasters UK”). Both schemes were closed to future accrual from 30 September 2016.Both plans were contributory and entitle a retired employee to receive an annual pension payment based on their final salary andservice with the company. Each plan is managed by a board of trustees of which one-third can be member nominated. The plans retaina number of professional advisers in connection with the operation of the plans. The Board of Trustees of the plans are required by lawto act in the best interests of the plan participants and are responsible for setting certain policies such as investment and contributionpolicies.
The plans are exposed to various risks, such as longevity risk, interest rate risk and investment risk. The Trustees have agreed liabilitydriven investment strategies to help mitigate the interest and inflation risks, details of which are set out further below.
The most recent independent actuarial valuations for the plans were carried out as at 5 April 2016 for the Triplex Plan and 31 December2013 for the Doncasters UK Plan. These valuations were performed by an independent qualified actuary and the results of thesevaluations have been rolled forward for the purposes of IAS 19.
D o n c a s t e r s G r o u p L i m i t e d A n n u a l R e p o r t 2 0 1 6
45
20 Pensions and similar obligations (continued)
Defined benefit plans (continued)
Triplex Plan
The plan invests in two broad types of fund, a matching fund (with the least risk portfolio) and an investment fund (the return seekingportfolio). The Trustees agreed to allocate approximately 40% of the assets in the matching fund with the remaining 60% in theinvestment fund.
The matching fund is made up mainly of cash deposits and a UK Gilts portfolio. The investment fund consists of a variety of globalequity investments, a number of bond instruments, and an asset allocation fund which rotates capital through a variety of asset classesand markets depending on market conditions.
The plan is also subject to inflation and interest rate risks. Swap contracts have been put in place which seek to remove 80% of theserisks to the plan.
During the year, all contributions received by the plan were paid in accordance with the plan rules and at the rates recommended by theactuary, as detailed in the schedule of contributions.
As at the valuation date of April 2016, the plan had a funding surplus and as such there were no deficit contributions required from theGroup. Furthermore, on 30 September 2016 the scheme was closed to active members such that the scheme ceased to incur furtherservice costs as of that date. As a consequence the Group is not required to make contributions into the scheme at this juncture.
Doncasters UK Plan
The plan invests in two broad types of fund, a matching fund (with the least risk portfolio) and an investment fund (the return seekingportfolio). The Trustees agreed to allocate approximately 40% of the assets in the matching fund with the remaining 60% in theinvestment fund.
The matching fund is made up mainly of cash deposits and a UK Gilts portfolio. The investment fund consists of a variety of globalequity investments, a number of bond instruments, and an asset allocation fund which rotates capital through a variety of asset classesand markets depending on market conditions.
The plan is also subject to inflation and interest rate risks. Swap contracts have been put in place which seek to remove approximately100% of the inflation rate risk and 60% of the interest rate risk to the plan.
The most recent schedule of contributions was introduced on 31 March 2015. During the year, all contributions received by the planwere paid in accordance with the plan rules and at the rates recommended by the actuary, as detailed in the schedule of contributions.On 30 September 2016 the scheme was closed to active members such that the scheme ceased to incur further service costs as of thatdate. The future service contributions will be reviewed and amended as appropriate following the next formal valuation to reflect themembership profile, benefit structure and financial conditions at that time.
The employer contribution rate is exclusive of Pension Protection Fund (“PPF”) and other levies, which are met from the assets of theplan. The Group pays additional amounts to cover the costs of benefit augmentations within one month of the later of the date ofgranting the augmentation and the date on which the trustee receives the details of the costs from the scheme actuary
Payments are monitored against the amounts and dates on the schedule of contributions. Future contributions by the Group, subject tothe review that will take place following the conclusion of the pending scheme valuation, have been agreed at £0.3 million per annum.

D o n c a s t e r s G r o u p L i m i t e d A n n u a l R e p o r t 2 0 1 6
46
20 Pensions and similar obligations (continued)
Defined benefit plans (continued)
United States
In the United States, pension benefits are provided to employees by either defined benefit or defined contribution pension plans. TheGroup operates 8 defined benefit schemes across a number of its sites. Benefits in respect of these plans are based primarily on eitheryears of service and employees’ average pay or a stated amount for each year of service. Pension costs are calculated and fundedbased on annual actuarial estimates, except that funding is subject to limitations under applicable tax regulations.
Plan assets of the US pension plans consist principally of cash, equity securities and fixed income securities, and are managed acrosstwo Master Trusts.
The Group provides certain health care and life insurance benefits for retired employees in the United States. A substantial proportion ofall US employees may become eligible for these benefits upon retirement from the Group. The Group uses accrual accounting for healthcare and other post-retirement benefits other than pensions. The accumulated post-retirement benefits obligation is determined byapplication of the terms of health care and life insurance plans, together with relevant actuarial assumptions and health care cost trendrates. The Group has not funded these obligations. The effects of any plan amendments or actuarial gains and losses in excess ofdefined limits are recognised immediately in the statement of comprehensive income. During 2016 the Group settled one of the healthcare schemes via payment of £2.8 million in cash. An exceptional gain was recognised within operating profit of £8.5 million in relationto this settlement.
The most recent actuarial valuation of the plans has been rolled forward to the balance sheet date, in line with the requirements of IAS19, by an independent qualified actuary.
Future contributions by the Group during 2017 are expected to be £0.6 million.
Germany
The Group operates 3 defined benefit pension schemes. These schemes are principally unfunded and pension liabilities are calculatedby independent qualified actuaries. The most recent actuarial valuation of the plans has been rolled forward to the balance sheet date,in line with the requirements of IAS 19, by an independent qualified actuary.
Unfunded liabilities provide less security for members and pose additional risks as liabilities cannot be matched to assets.
Asset volatility
The plan liabilities are calculated using a discount rate set with reference to corporate bond yields; if plan assets underperform this yield,this will create a deficit. The plans hold a significant proportion of equities, which are expected to outperform corporate bonds in thelong-term while providing volatility and risk in the short-term. The Business reduces the level of investment risk by investing in assetsthat match the liabilities. The Business believes that due to the long-term nature of the plan liabilities and the strength of the supportingBusiness, a level of continuing equity investment remains an appropriate facet of the long term strategy to manage the plans efficiently.
Changes in bond yields
A decrease in corporate bond yields will increase plan liabilities, although this will be partially offset by an increase in the value of theplans’ bond holdings.
Inflation risk
Some of the Business pension obligations are linked to inflation, and higher inflation will lead to higher liabilities. The majority of theplans’ assets are either unaffected by (fixed interest bonds) or loosely correlated with (equities) inflation, meaning that an increase ininflation will also increase the deficit.
Life expectancy
The majority of the plans’ obligations are to provide benefits for the life of the member, so increases in life expectancy will result in anincrease in the plans’ liabilities.
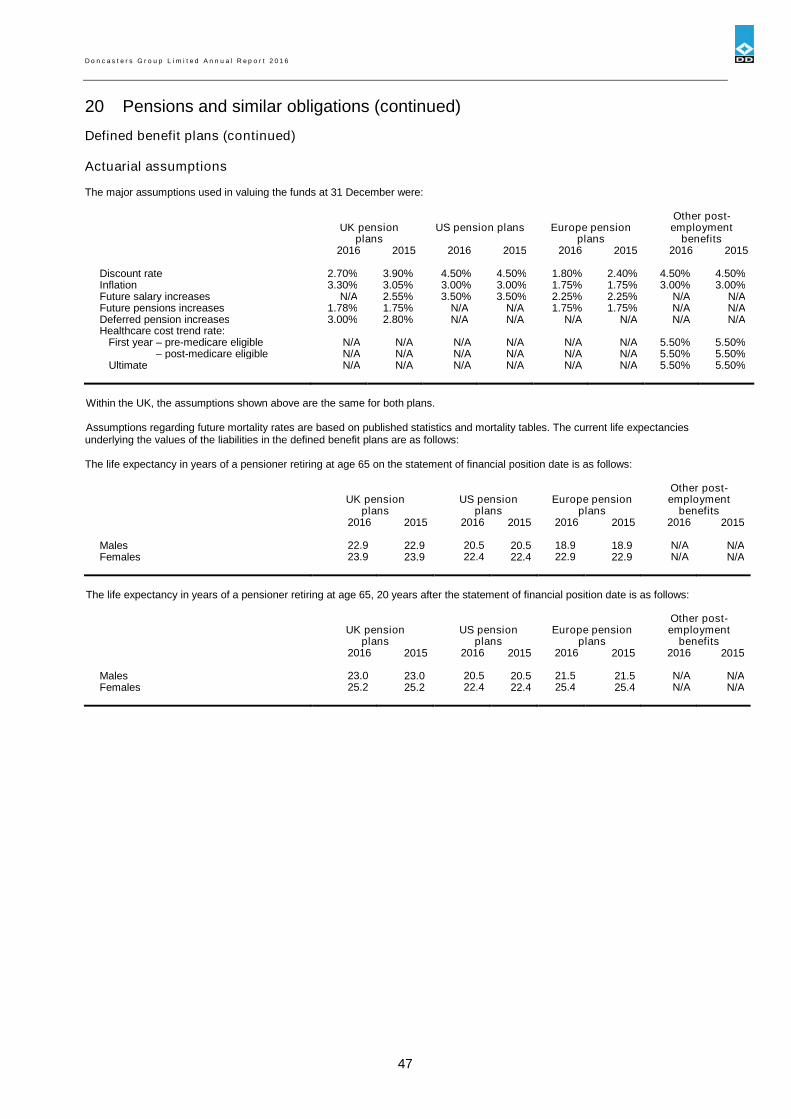
D o n c a s t e r s G r o u p L i m i t e d A n n u a l R e p o r t 2 0 1 6
47
20 Pensions and similar obligations (continued)
Defined benefit plans (continued)
Actuarial assumptions
The major assumptions used in valuing the funds at 31 December were:
UK pensionplans
US pension plans Europe pensionplans
Other post-employment
benefits2016 2015 2016 2015 2016 2015 2016 2015
Discount rate 2.70% 3.90% 4.50% 4.50% 1.80% 2.40% 4.50% 4.50%Inflation 3.30% 3.05% 3.00% 3.00% 1.75% 1.75% 3.00% 3.00%Future salary increases N/A 2.55% 3.50% 3.50% 2.25% 2.25% N/A N/AFuture pensions increases 1.78% 1.75% N/A N/A 1.75% 1.75% N/A N/ADeferred pension increases 3.00% 2.80% N/A N/A N/A N/A N/A N/AHealthcare cost trend rate:
First year – pre-medicare eligible N/A N/A N/A N/A N/A N/A 5.50% 5.50%– post-medicare eligible N/A N/A N/A N/A N/A N/A 5.50% 5.50%
Ultimate N/A N/A N/A N/A N/A N/A 5.50% 5.50%
Within the UK, the assumptions shown above are the same for both plans.
Assumptions regarding future mortality rates are based on published statistics and mortality tables. The current life expectanciesunderlying the values of the liabilities in the defined benefit plans are as follows:
The life expectancy in years of a pensioner retiring at age 65 on the statement of financial position date is as follows:
UK pensionplans
US pensionplans
Europe pensionplans
Other post-employment
benefits2016 2015 2016 2015 2016 2015 2016 2015
Males 22.9 22.9 20.5 20.5 18.9 18.9 N/A N/AFemales 23.9 23.9 22.4 22.4 22.9 22.9 N/A N/A
The life expectancy in years of a pensioner retiring at age 65, 20 years after the statement of financial position date is as follows:
UK pensionplans
US pensionplans
Europe pensionplans
Other post-employment
benefits2016 2015 2016 2015 2016 2015 2016 2015
Males 23.0 23.0 20.5 20.5 21.5 21.5 N/A N/AFemales 25.2 25.2 22.4 22.4 25.4 25.4 N/A N/A
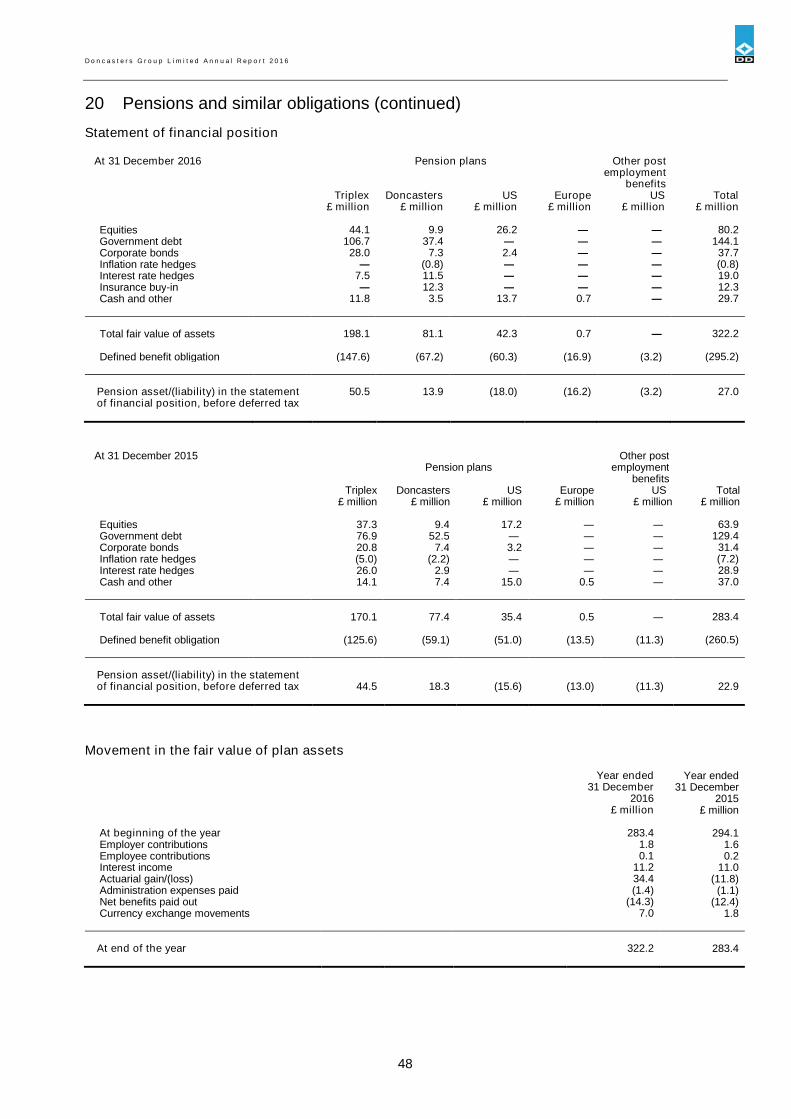
D o n c a s t e r s G r o u p L i m i t e d A n n u a l R e p o r t 2 0 1 6
48
20 Pensions and similar obligations (continued)
Statement of financial position
At 31 December 2016 Pension plans Other postemployment
benefitsTriplex Doncasters US Europe US Total
£ million £ million £ million £ million £ million £ million
Equities 44.1 9.9 26.2 ― ― 80.2Government debt2% 106.7 37.4 ― ― ― 144.1Corporate bonds 28.0 7.3 2.4 ― ― 37.7Inflation rate hedges ― (0.8) ― ― ― (0.8)Interest rate hedges 7.5 11.5 ― ― ― 19.0Insurance buy-in ― 12.3 ― ― ― 12.3Cash and other 11.8 3.5 13.7 0.7 ― 29.7
Total fair value of assets 198.1 81.1 42.3 0.7 ― 322.2
Defined benefit obligation (147.6) (67.2) (60.3) (16.9) (3.2) (295.2)
Pension asset/(liability) in the statementof financial position, before deferred tax
50.5 13.9 (18.0) (16.2) (3.2) 27.0
At 31 December 2015Pension plans
Other postemployment
benefitsTriplex Doncasters US Europe US Total
£ million £ million £ million £ million £ million £ million
Equities 37.3 9.4 17.2 ― ― 63.9Government debt2% 76.9 52.5 ― ― ― 129.4Corporate bonds 20.8 7.4 3.2 ― ― 31.4Inflation rate hedges (5.0) (2.2) ― ― ― (7.2)Interest rate hedges 26.0 2.9 ― ― ― 28.9Cash and other 14.1 7.4 15.0 0.5 ― 37.0
Total fair value of assets 170.1 77.4 35.4 0.5 ― 283.4
Defined benefit obligation (125.6) (59.1) (51.0) (13.5) (11.3) (260.5)
Pension asset/(liability) in the statementof financial position, before deferred tax 44.5 18.3 (15.6) (13.0) (11.3) 22.9
Movement in the fair value of plan assets
Year ended Year ended31 December 31 December
2016 2015£ million £ million
At beginning of the year 283.4 294.1Employer contributions 1.8 1.6Employee contributions 0.1 0.2Interest income 11.2 11.0Actuarial gain/(loss) 34.4 (11.8)Administration expenses paid (1.4) (1.1)Net benefits paid out (14.3) (12.4)Currency exchange movements 7.0 1.8
At end of the year 322.2 283.4
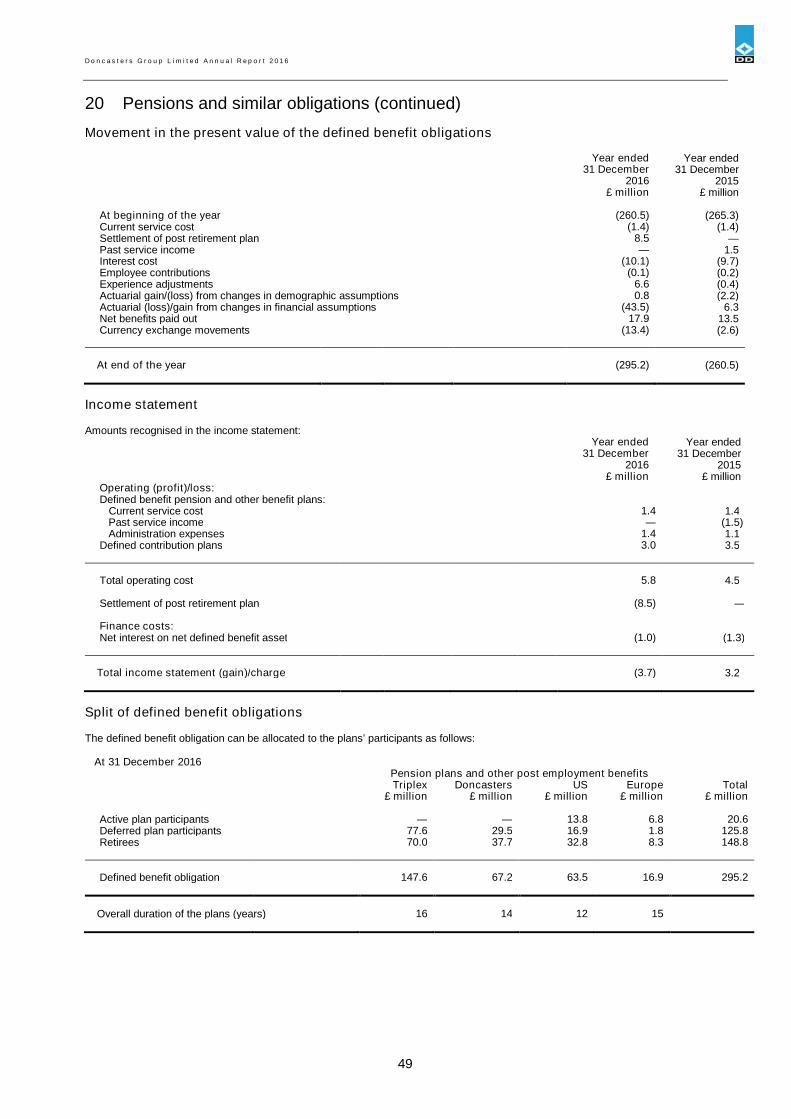
D o n c a s t e r s G r o u p L i m i t e d A n n u a l R e p o r t 2 0 1 6
49
20 Pensions and similar obligations (continued)
Movement in the present value of the defined benefit obligations
Year ended Year ended31 December 31 December
2016 2015£ million £ million
At beginning of the year (260.5) (265.3)Current service cost (1.4) (1.4)Settlement of post retirement plan 8.5 —Past service income — 1.5Interest cost (10.1) (9.7)Employee contributions (0.1) (0.2)Experience adjustments 6.6 (0.4)Actuarial gain/(loss) from changes in demographic assumptions 0.8 (2.2)Actuarial (loss)/gain from changes in financial assumptions (43.5) 6.3Net benefits paid out 17.9 13.5Currency exchange movements (13.4) (2.6)
At end of the year (295.2) (260.5)
Income statement
Amounts recognised in the income statement:Year ended Year ended
31 December 31 December2016 2015
£ million £ millionOperating (profit)/loss:Defined benefit pension and other benefit plans:
Current service cost 1.4 1.4Past service income ― (1.5)Administration expenses 1.4 1.1
Defined contribution plans 3.0 3.5
Total operating cost 5.8 4.5
Settlement of post retirement plan (8.5) ―
Finance costs:Net interest on net defined benefit asset (1.0) (1.3)
Total income statement (gain)/charge (3.7) 3.2
Split of defined benefit obligations
The defined benefit obligation can be allocated to the plans’ participants as follows:
At 31 December 2016Pension plans and other post employment benefitsTriplex Doncasters US Europe Total
£ million £ million £ million £ million £ million
Active plan participants — — 13.8 6.8 20.6Deferred plan participants2% 77.6 29.5 16.9 1.8 125.8Retirees 70.0 37.7 32.8 8.3 148.8
Defined benefit obligation 147.6 67.2 63.5 16.9 295.2
Overall duration of the plans (years) 16 14 12 15

D o n c a s t e r s G r o u p L i m i t e d A n n u a l R e p o r t 2 0 1 6
50
20 Pensions and similar obligations (continued)
Sensitivity analysis
The calculation of the defined benefit obligation is sensitive to the assumptions set out above. The following table summarises how theimpact on the defined benefit obligation at the end of the reporting period would have increased or decreased as a result of a change inthe respective assumptions.
Increase/(decrease) indefined benefit obligation
0.5% 0.5%increase decrease£ million £ million
Discount rate (20.8) 21.4Inflation 9.6 (8.1)Salaries (0.1) 0.1
1 year 1 yearincrease decrease£ million £ million
Life expectancy 9.6 (9.7)
The above sensitivities are based on the average duration of the benefit obligation determined at the date of the last full actuarialvaluation and are applied to adjust the defined benefit obligation at the end of the reporting period for the assumptions concerned.Whilst the analysis does not take into account the full distribution of cash flows expected under the plans, it does provide anapproximation to the sensitivity of the assumptions shown.
21 Called up share capital
Number Ordinary Shareof shares shares premium Total
£’000 £’000 £’000
At 31 December 2015 and 31 December 2016 57,347,943 573 57,878 58,451
Number of shares Nominal value2016 2015 2016 2015
Number Number £ £
Issued and fully paid:
Class of sharesB 839,658 839,658 8,397 8,397C 1 1 — —D 48,500 48,500 485 485Super A 28,941,284 28,941,284 289,413 289,413PPO 2,995,103 2,995,103 29,951 29,951E1 6,185,332 6,185,332 61,854 61,854E 749,647 749,647 7,495 7,495Deferred 17,588,418 17,588,418 175,884 175,884
57,347,943 57,347,943 573,479 573,479
All of the above are Ordinary Shares of 1 pence each.
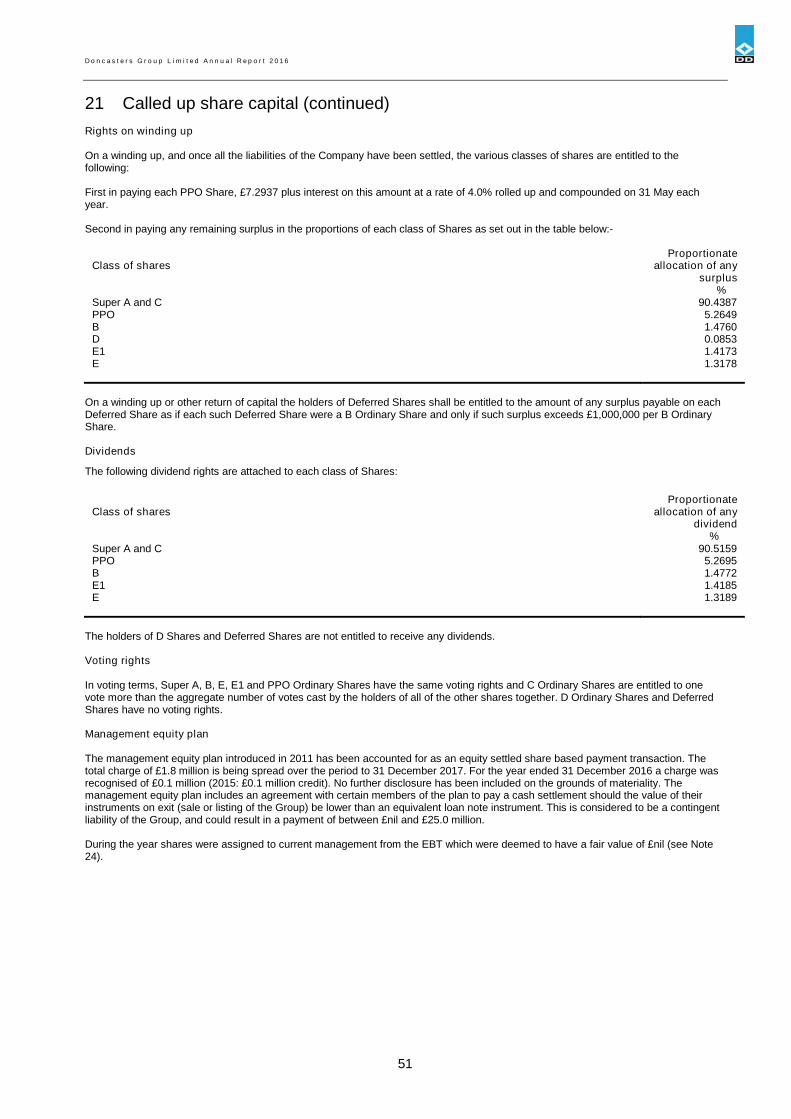
D o n c a s t e r s G r o u p L i m i t e d A n n u a l R e p o r t 2 0 1 6
51
21 Called up share capital (continued)
Rights on winding up
On a winding up, and once all the liabilities of the Company have been settled, the various classes of shares are entitled to thefollowing:
First in paying each PPO Share, £7.2937 plus interest on this amount at a rate of 4.0% rolled up and compounded on 31 May eachyear.
Second in paying any remaining surplus in the proportions of each class of Shares as set out in the table below:-
Class of sharesProportionate
allocation of anysurplus
%Super A and C 90.4387PPO 5.2649B 1.4760D 0.0853E1 1.4173E 1.3178
On a winding up or other return of capital the holders of Deferred Shares shall be entitled to the amount of any surplus payable on eachDeferred Share as if each such Deferred Share were a B Ordinary Share and only if such surplus exceeds £1,000,000 per B OrdinaryShare.
Dividends
The following dividend rights are attached to each class of Shares:
Class of sharesProportionate
allocation of anydividend
%Super A and C 90.5159PPO 5.2695B 1.4772E1 1.4185E 1.3189
The holders of D Shares and Deferred Shares are not entitled to receive any dividends.
Voting rights
In voting terms, Super A, B, E, E1 and PPO Ordinary Shares have the same voting rights and C Ordinary Shares are entitled to onevote more than the aggregate number of votes cast by the holders of all of the other shares together. D Ordinary Shares and DeferredShares have no voting rights.
Management equity plan
The management equity plan introduced in 2011 has been accounted for as an equity settled share based payment transaction. Thetotal charge of £1.8 million is being spread over the period to 31 December 2017. For the year ended 31 December 2016 a charge wasrecognised of £0.1 million (2015: £0.1 million credit). No further disclosure has been included on the grounds of materiality. Themanagement equity plan includes an agreement with certain members of the plan to pay a cash settlement should the value of theirinstruments on exit (sale or listing of the Group) be lower than an equivalent loan note instrument. This is considered to be a contingentliability of the Group, and could result in a payment of between £nil and £25.0 million.
During the year shares were assigned to current management from the EBT which were deemed to have a fair value of £nil (see Note24).

D o n c a s t e r s G r o u p L i m i t e d A n n u a l R e p o r t 2 0 1 6
52
22 Notes to the statement of cash flows
Reconciliation of net loss to cash generated from operations:
Year ended Year ended31 December 31 December
2016 2015£ million £ million
Cash generated from operations (Restated)
Net loss (50.5) (76.0)Taxation (41.3) 1.4Net finance costs 113.9 85.4Depreciation of property, plant and equipment 26.5 24.0Loss on sale of property, plant and equipment 0.7 0.2Amortisation of intangible assets 30.5 30.9Impairment of goodwill and other intangible assets — 31.6Amortisation of Government grants (0.3) (0.3)
Inventories (9.5) (8.7)Trade and other receivables 4.5 4.6Trade, other payables and provisions 2.1 1.7
Net changes in working capital (2.9) (2.4)Long-term incentive plans 0.1 (1.8)Pension and similar obligations less payments 0.4 (1.3)Loss on disposal of business — 4.7Unrealised foreign exchange loss on derivative financial instruments 2.5 —Settlement of retirement benefits (11.2) —
Cash generated from operations 68.4 96.4
The cash flows of pension funds (other than contributions and other direct payments made by the Group in respect of pensions andsimilar obligations) are not included in the Group consolidated statement of cash flows.
Reconciliation of net cash flow to movement in net debt:
Year ended Year ended31 December 31 December
2016 2015£ million £ million
Net decrease in cash and cash equivalents (16.3) (22.8)Net cash movement in borrowings (30.4) 62.0
Change in net debt resulting from cash flows (46.7) 39.2
Non-cash movements in debt* (49.3) (45.0)Currency exchange movements (105.6) (30.7)
Movement in net debt (201.6) (36.5)
Net debt at 1 January (987.9) (951.4)
Net debt at 31 December (1,189.5) (987.9)
*Non-cash movements in debt comprise the amortisation of debt issue costs and interest charged during the year which is settled only onrepayment of the debt.

D o n c a s t e r s G r o u p L i m i t e d A n n u a l R e p o r t 2 0 1 6
53
22 Notes to the statement of cash flows (continued)
Analysis of net debt:
2016 2015£ million £ million
Cash and cash equivalents 19.2 35.5
Bank debt redeemable- in 2016 — (6.7)- in 2017 (7.7) (6.7)- in 2018 (50.9) (8.5)- in 2019 (7.7) (6.7)- in 2020 (776.3) (674.3)- unamortised debt issue costs 13.3 15.7
Net bank debt (810.1) (651.7)
Unsecured subordinated loan notes redeemable - in 2016 — (2.1)- in 2017 (21.2) (18.8)- in 2021 (358.2) (315.3)
Net debt (1,189.5) (987.9)
The nominal value of the loan notes and accrued rolled up interest shown above at 31 December 2016 is £561.6 million (2015: £535.9million).
23 Commitments
Operating leases
The Group has various non-cancellable operating lease agreements for plant and machinery and land and buildings. The futureaggregate minimum lease payments under these agreements are:
2016 2015£ million £ million
Within one year 5.1 4.9Between two and five years 9.6 11.7After five years 0.2 0.3
14.9 16.9
Future committed capital expenditure not provided in the accounts 24.1 1.4
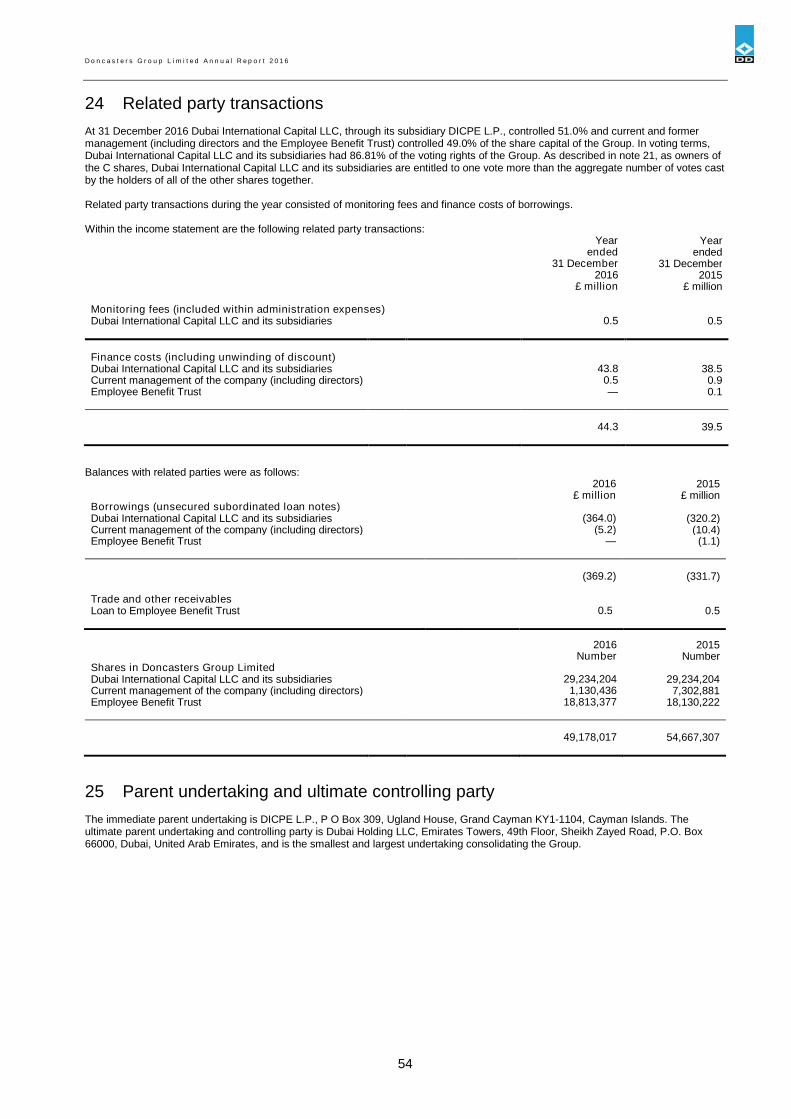
D o n c a s t e r s G r o u p L i m i t e d A n n u a l R e p o r t 2 0 1 6
54
24 Related party transactions
At 31 December 2016 Dubai International Capital LLC, through its subsidiary DICPE L.P., controlled 51.0% and current and formermanagement (including directors and the Employee Benefit Trust) controlled 49.0% of the share capital of the Group. In voting terms,Dubai International Capital LLC and its subsidiaries had 86.81% of the voting rights of the Group. As described in note 21, as owners ofthe C shares, Dubai International Capital LLC and its subsidiaries are entitled to one vote more than the aggregate number of votes castby the holders of all of the other shares together.
Related party transactions during the year consisted of monitoring fees and finance costs of borrowings.
Within the income statement are the following related party transactions:Year
endedYear
ended31 December 31 December
2016 2015£ million £ million
Monitoring fees (included within administration expenses)Dubai International Capital LLC and its subsidiaries 0.5 0.5
Finance costs (including unwinding of discount)Dubai International Capital LLC and its subsidiaries 43.8 38.5Current management of the company (including directors) 0.5 0.9Employee Benefit Trust — 0.1
44.3 39.5
Balances with related parties were as follows:2016 2015
£ million £ millionBorrowings (unsecured subordinated loan notes)Dubai International Capital LLC and its subsidiaries (364.0) (320.2)Current management of the company (including directors) (5.2) (10.4)Employee Benefit Trust — (1.1)
(369.2) (331.7)
Trade and other receivablesLoan to Employee Benefit Trust 0.5 0.5
2016 2015Number Number
Shares in Doncasters Group LimitedDubai International Capital LLC and its subsidiaries 29,234,204 29,234,204Current management of the company (including directors) 1,130,436 7,302,881Employee Benefit Trust 18,813,377 18,130,222
49,178,017 54,667,307
25 Parent undertaking and ultimate controlling party
The immediate parent undertaking is DICPE L.P., P O Box 309, Ugland House, Grand Cayman KY1-1104, Cayman Islands. Theultimate parent undertaking and controlling party is Dubai Holding LLC, Emirates Towers, 49th Floor, Sheikh Zayed Road, P.O. Box66000, Dubai, United Arab Emirates, and is the smallest and largest undertaking consolidating the Group.
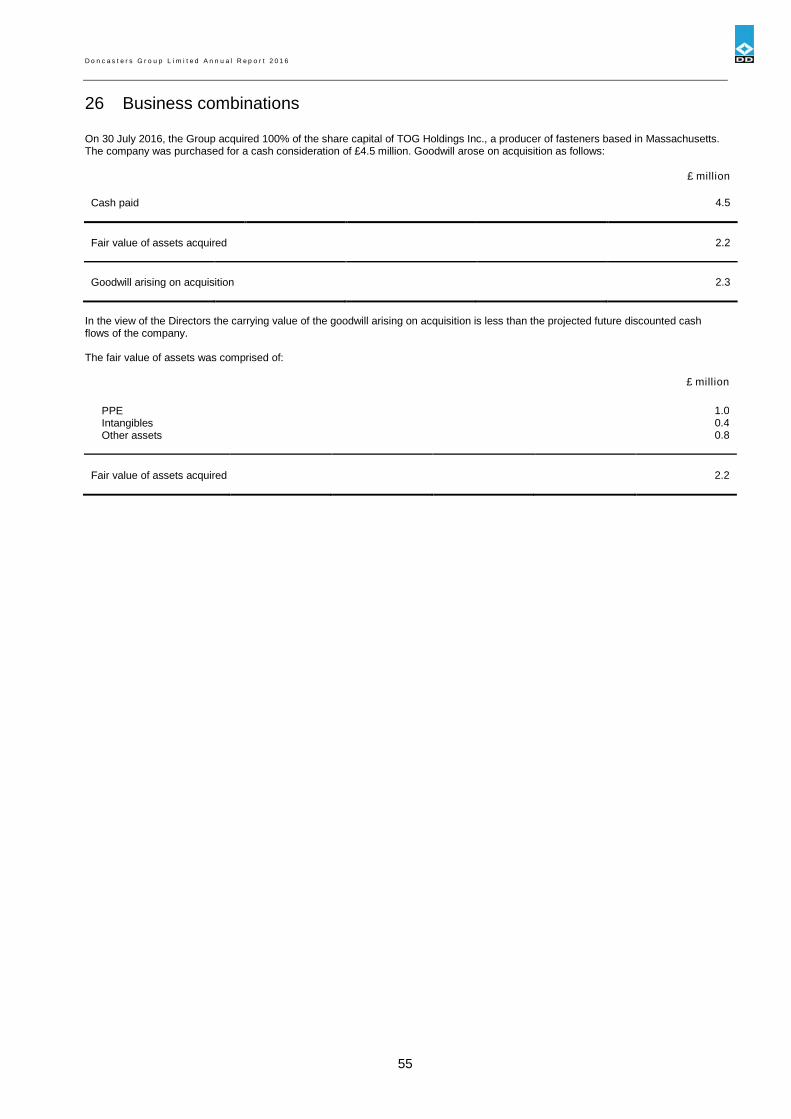
D o n c a s t e r s G r o u p L i m i t e d A n n u a l R e p o r t 2 0 1 6
55
26 Business combinations
On 30 July 2016, the Group acquired 100% of the share capital of TOG Holdings Inc., a producer of fasteners based in Massachusetts.The company was purchased for a cash consideration of £4.5 million. Goodwill arose on acquisition as follows:
£ million
Cash paid 4.5
Fair value of assets acquired 2.2
Goodwill arising on acquisition 2.3
In the view of the Directors the carrying value of the goodwill arising on acquisition is less than the projected future discounted cashflows of the company.
The fair value of assets was comprised of:
£ million
PPE 1.0Intangibles 0.4Other assets 0.8
Fair value of assets acquired 2.2
56
Independent auditors’ report to the members of DoncastersGroup Limited
Report on the parent company financial statements
Our opinionIn our opinion, Doncasters Group Limited’s company financial statements (the “financial statements”):
give a true and fair view of the state of the company’s affairs as at 31 December 2016;
have been properly prepared in accordance with United Kingdom Generally Accepted Accounting Practice; and
have been prepared in accordance with the requirements of the Companies Act 2006.
Emphasis of matter - Going concernIn forming our opinion on the financial statements, which is not modified, we have considered the adequacy of the disclosure made innote 1 to the financial statements concerning the company’s ability to continue as a going concern. The going concern of the Companydepends on the going concern assessment of the Group as a whole. There exists uncertainty regarding the Group’s ability to extend itsrevolving credit facility beyond April 2018. In addition there is also uncertainty over the actions that may be taken by the lenders to theparent company of the Group in the event that a sale of the Group, which would allow settlement of a substantial share of the debt thatis currently due and secured on the Group, does not take place. These conditions, along with the other matters explained in note 1 tothe financial statements, indicate the existence of material uncertainties which may cast significant doubt about the company’s ability tocontinue as a going concern. The financial statements do not include the adjustments that would result if the company was unable tocontinue as a going concern.
What we have auditedThe financial statements, included within the Annual report (the “Annual Report”), comprise:
the balance sheet as at 31 December 2016;
the statement of changes in equity for the year then ended; and
the notes to the financial statements, which include a summary of significant accounting policies and other explanatoryinformation.
Certain required disclosures have been presented elsewhere in the Annual Report, rather than in the notes to the financial statements.These are cross-referenced from the financial statements and are identified as audited.
The financial reporting framework that has been applied in the preparation of the financial statements is United Kingdom AccountingStandards, comprising FRS 102 “The Financial Reporting Standard applicable in the UK and Republic of Ireland”, and applicable law(United Kingdom Generally Accepted Accounting Practice).
In applying the financial reporting framework, the directors have made a number of subjective judgements, for example in respect ofsignificant accounting estimates. In making such estimates, they have made assumptions and considered future events.
Opinion on other matter prescribed by the Companies Act 2006
In our opinion, based on the work undertaken in the course of the audit:
the information given in the Strategic Report and the Report of the directors for the financial year for which the financialstatements are prepared is consistent with the financial statements; and
the Strategic Report and the Report of the directors have been prepared in accordance with applicable legal requirements.
In addition, in light of the knowledge and understanding of the company and its environment obtained in the course of the audit, we arerequired to report if we have identified any material misstatements in the Strategic Report and the Report of the directors. We havenothing to report in this respect.
Other matters on which we are required to report by exception
Adequacy of accounting records and information and explanations receivedUnder the Companies Act 2006 we are required to report to you if, in our opinion:
we have not received all the information and explanations we require for our audit; or
adequate accounting records have not been kept by the company, or returns adequate for our audit have not been receivedfrom branches not visited by us; or
the financial statements are not in agreement with the accounting records and returns.
We have no exceptions to report arising from this responsibility.
Directors’ remunerationUnder the Companies Act 2006 we are required to report to you if, in our opinion, certain disclosures of directors’ remuneration specifiedby law are not made. We have no exceptions to report arising from this responsibility.
57
Independent auditors’ report to the members of DoncastersGroup Limited (continued)
Responsibilities for the financial statements and the audit
Our responsibilities and those of the directorsAs explained more fully in the Statement of directors' responsibilities set out on page 8, the directors are responsible for the preparationof the financial statements and for being satisfied that they give a true and fair view.
Our responsibility is to audit and express an opinion on the financial statements in accordance with applicable law and InternationalStandards on Auditing (UK and Ireland) (“ISAs (UK & Ireland)”). Those standards require us to comply with the Auditing PracticesBoard’s Ethical Standards for Auditors.
This report, including the opinions, has been prepared for and only for the company’s members as a body in accordance with Chapter 3of Part 16 of the Companies Act 2006 and for no other purpose. We do not, in giving these opinions, accept or assume responsibility forany other purpose or to any other person to whom this report is shown or into whose hands it may come save where expressly agreedby our prior consent in writing.
What an audit of financial statements involvesWe conducted our audit in accordance with ISAs (UK & Ireland). An audit involves obtaining evidence about the amounts anddisclosures in the financial statements sufficient to give reasonable assurance that the financial statements are free from materialmisstatement, whether caused by fraud or error. This includes an assessment of:
whether the accounting policies are appropriate to the company’s circumstances and have been consistently applied andadequately disclosed;
the reasonableness of significant accounting estimates made by the directors; and
the overall presentation of the financial statements.
We primarily focus our work in these areas by assessing the directors’ judgements against available evidence, forming our ownjudgements, and evaluating the disclosures in the financial statements.
We test and examine information, using sampling and other auditing techniques, to the extent we consider necessary to provide areasonable basis for us to draw conclusions. We obtain audit evidence through testing the effectiveness of controls, substantiveprocedures or a combination of both.
In addition, we read all the financial and non-financial information in the Annual Report to identify material inconsistencies with theaudited financial statements and to identify any information that is apparently materially incorrect based on, or materially inconsistentwith, the knowledge acquired by us in the course of performing the audit. If we become aware of any apparent material misstatementsor inconsistencies we consider the implications for our report. With respect to the Strategic Report and Report of the directors, weconsider whether those reports include the disclosures required by applicable legal requirements.
Other matter
We have reported separately on the group financial statements of Doncasters Group Limited for the year ended 31 December 2016.That report includes an emphasis of matter.
David Teager (Senior Statutory Auditor)for and on behalf of PricewaterhouseCoopers LLPChartered Accountants and Statutory AuditorsEast Midlands30 March 2017
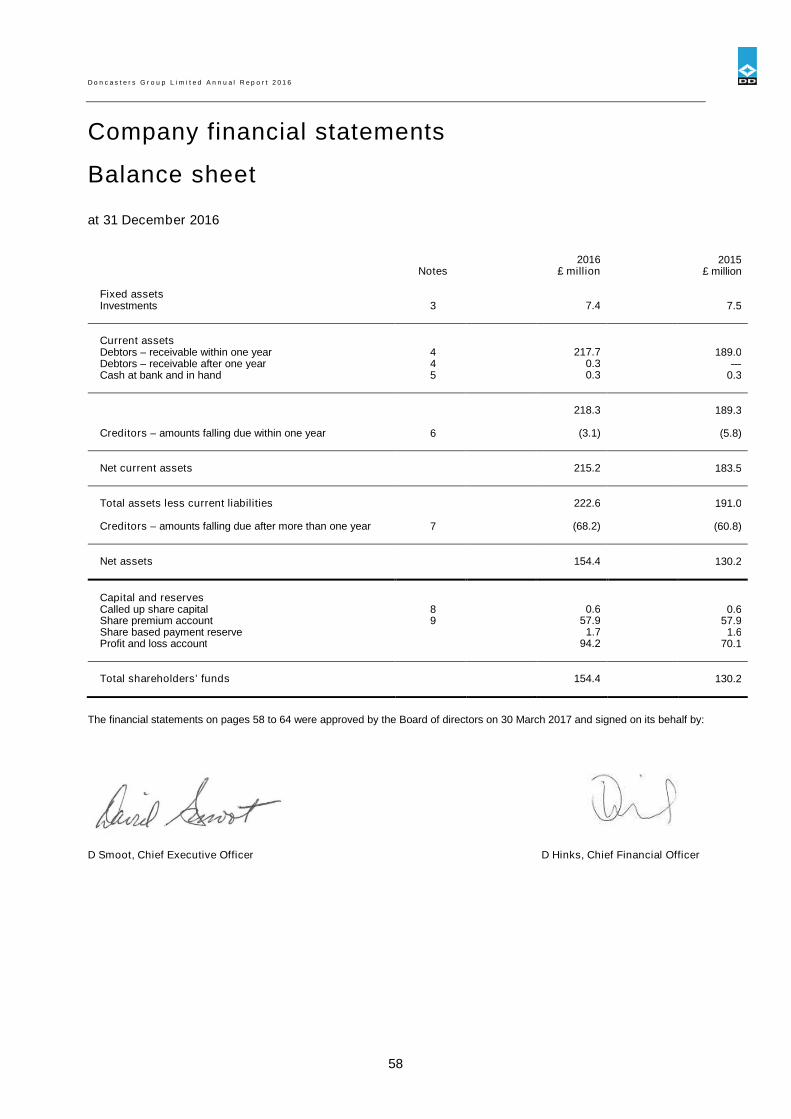
D o n c a s t e r s G r o u p L i m i t e d A n n u a l R e p o r t 2 0 1 6
58
Company financial statements
Balance sheet
at 31 December 2016
2016 2015Notes £ million £ million
Fixed assetsInvestments 3 7.4 7.5
Current assetsDebtors – receivable within one year 4 217.7 189.0Debtors – receivable after one year 4 0.3 —Cash at bank and in hand 5 0.3 0.3
218.3 189.3
Creditors – amounts falling due within one year 6 (3.1) (5.8)
Net current assets 215.2 183.5
Total assets less current liabilities 222.6 191.0
Creditors – amounts falling due after more than one year 7 (68.2) (60.8)
Net assets 154.4 130.2
Capital and reservesCalled up share capital 8 0.6 0.6Share premium account 9 57.9 57.9Share based payment reserve 1.7 1.6Profit and loss account 94.2 70.1
Total shareholders’ funds 154.4 130.2
The financial statements on pages 58 to 64 were approved by the Board of directors on 30 March 2017 and signed on its behalf by:
D Smoot, Chief Executive Officer D Hinks, Chief Financial Officer
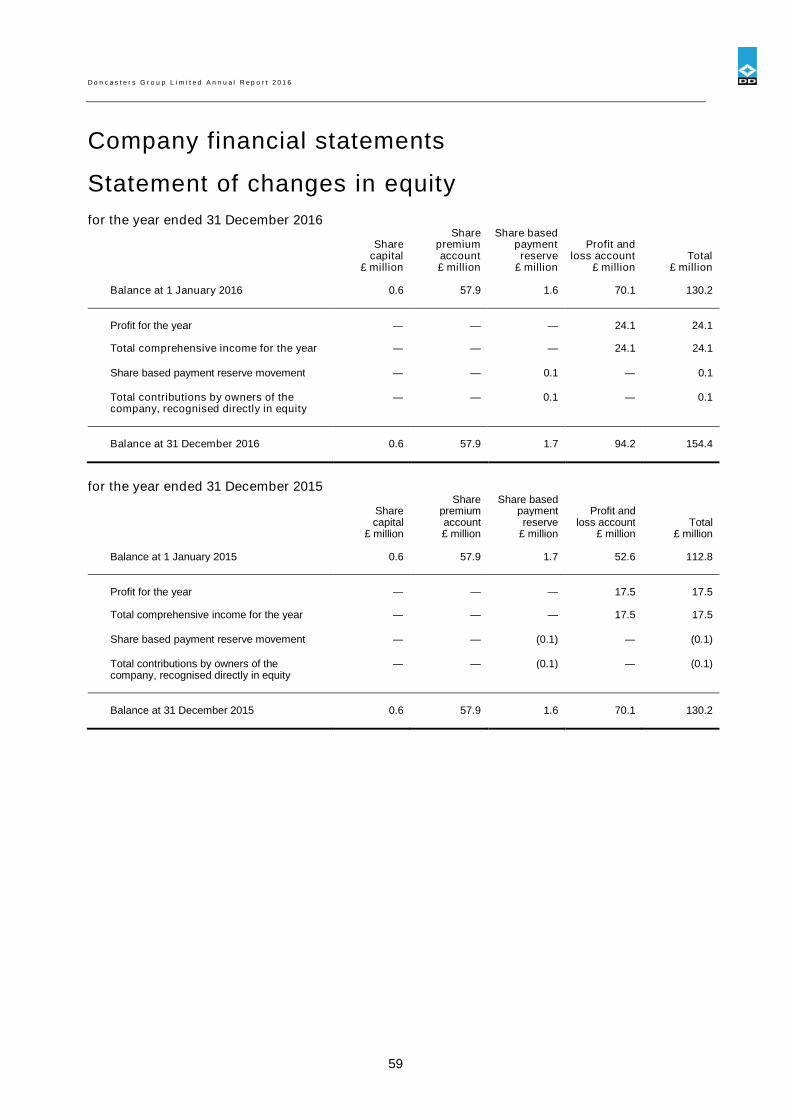
D o n c a s t e r s G r o u p L i m i t e d A n n u a l R e p o r t 2 0 1 6
59
Company financial statements
Statement of changes in equity
for the year ended 31 December 2016Share Share based
Share premium payment Profit andcapital account reserve loss account Total
£ million £ million £ million £ million £ million
Balance at 1 January 2016 0.6 57.9 1.6 70.1 130.2
Profit for the year — — — 24.1 24.1
Total comprehensive income for the year — — — 24.1 24.1
Share based payment reserve movement — — 0.1 — 0.1
Total contributions by owners of thecompany, recognised directly in equity
— — 0.1 — 0.1
Balance at 31 December 2016 0.6 57.9 1.7 94.2 154.4
for the year ended 31 December 2015Share Share based
Share premium payment Profit andcapital account reserve loss account Total
£ million £ million £ million £ million £ million
Balance at 1 January 2015 0.6 57.9 1.7 52.6 112.8
Profit for the year — — — 17.5 17.5
Total comprehensive income for the year — — — 17.5 17.5
Share based payment reserve movement — — (0.1) — (0.1)
Total contributions by owners of thecompany, recognised directly in equity
— — (0.1) — (0.1)
Balance at 31 December 2015 0.6 57.9 1.6 70.1 130.2
D o n c a s t e r s G r o u p L i m i t e d A n n u a l R e p o r t 2 0 1 6
60
Notes to the Company financial statements
1 Accounting policies
Basis of preparation
These financial statements have been prepared under the historical cost convention and in accordance with applicable accountingstandards in the United Kingdom and the Companies Act 2006. The Board has reviewed the accounting policies adopted in thefinancial statements and considers them to be the most appropriate for the Company. The principal accounting policies, as set outbelow, have been applied consistently throughout the year.
These individual financial statements have been prepared in compliance with United Kingdom Accounting Standards, includingFinancial Reporting Standard 102, ‘‘The Financial Reporting Standard applicable in the United Kingdom and the Republic ofIreland’’ (‘‘FRS 102’’) and the Companies Act 2006.
The Company’s functional and presentational currency is the pound sterling.
The going concern assessment of the Company is dependent on the going concern assessment of the Group, due to being anobligor to the loan facilities of the Group. The Group has substantial loan arrangements with a number of financial institutions withmaturity dates between 2018 and 2021.
The Directors have performed a going concern assessment by reviewing the latest forecasts and trading prospects of the Group.The forecasts for 2017 have been formally reviewed and adopted by the Board. Additionally the Directors have considered longerrange forecasts into 2018 in line with the multi-year plan prepared and approved by the Board. These forecasts indicate animprovement in operating performance in 2017 which is linked to the increasing order book, generally favourable markets andimproving operational performance as new products are industrialised. The Directors have also considered available headroomunder the Group’s facilities and are satisfied that sufficient headroom exists and levers are available to the Group to manage anumber of reasonable down side sensitivities in terms of trading and cash performance. In this regard it should also be noted thatthe Group’s £110 million revolving credit facilities are due for renewal in April 2018 and the Directors are satisfied that the mostlikely outcome is that these are extended on terms acceptable to the Group. Whilst no final agreement has been reached regardingthe extension of these revolving credit facilities the Directors have received indications of support to renew the facility as it fallsdue. While there can be no certainty that these forecasts can be achieved, the Directors can see no reasonable outcome wherethe Group would not have sufficient financial resources to meet financial obligations as they fall due.
Dubai International Capital LLC (“DIC”), the majority owner of the Group, had certain debt facilities which matured on 31 December2016 for which the shares in the Group are held as collateral. A sale process was initiated in 2016 for DIC to dispose of the Groupand generate proceeds to repay a substantial share of DIC’s debt facilities. The sale process has generated significant interest anda potential buyer is currently in exclusive discussions to agree a transaction in the first half of 2017. At this stage the Directorsbelieve there is nothing to suggest that the DIC lenders would take actions detrimental to a successful sale of the Group or itsability to continue trading as a going concern; in the event that the sale of the Group does not take place, they expect the DIC debtfacilities to be extended or restructured without any disruption to the Group. However, there is no certainty as to the DIC lenders’actions. Additionally the expected sale proceeds for the Group are likely to lead to the need to restructure the unsecuredsubordinated loan notes but until final timings and proceeds are known this action is not certain.
The conditions outlined above and as described within the financial statements indicate the existence of material uncertainties,which may cast significant doubt on the Group’s ability to continue as a going concern. However, in consideration of all of therelevant factors the Directors have concluded that it is appropriate to prepare the accounts on a going concern basis. Therefore,the financial statements do not include the adjustments that would result if the Group and Company were unable to continue as agoing concern.
As permitted by section 408 of the Companies Act 2006 a separate profit and loss account has not been included as part of theseCompany financial statements. Under FRS 102 the Company is exempt from the requirement to prepare a statement of cashflows as the consolidated statement of cash flows has been published.
As permitted by FRS 102, the Company is not required to disclose transactions with group companies qualifying as related parties.The results of Doncasters Group Limited are ultimately consolidated into the financial statements of Dubai Holding LLC, P.O. Box66000, Dubai, United Arab Emirates, being the largest entity into which these results are consolidated.
The company has chosen to adopt Sections 11 and 12 of FRS 102 in respect of financial instruments.
Estimation techniques
Income taxesIn determining the provisions for income tax and deferred tax it is necessary to consider transactions in a small number of key taxjurisdictions for which the ultimate tax determination is uncertain and may depend upon agreement with the relevant taxauthorities. To the extent that the final outcome differs from the tax that has been provided, adjustments will be made to income taxand deferred tax provisions held in the period the determination is made. The recognition of deferred tax assets requires certainassumptions to be made regarding the utilisation of tax losses and interest deductions for future periods.
Investments
Investments in subsidiary undertakings are stated at cost, less any provision for diminution in value. Investments denominated inforeign currencies are translated into sterling at year-end exchange rates.
D o n c a s t e r s G r o u p L i m i t e d A n n u a l R e p o r t 2 0 1 6
61
Financial liabilities
The Company holds certain basic financial liabilities in the form of creditors owed to both external parties and subsidiaryundertakings. These constitute financing transactions, where the debt instrument is measured at the present value of the futurepayments discounted at a market rate of interest. Debt instruments are subsequently carried at amortised cost using the effectiveinterest rate method.
Derivative financial instruments
Derivative financial instruments are recognised at fair value on the date the derivative contract is entered into and aresubsequently re-measured at fair value at each balance sheet date. To the extent that the maturity of the financial instrument ismore than 12 months from the balance sheet date the fair value is reported as a non-current asset or liability. Derivative financialinstruments with maturities of less than 12 months from the balance sheet are shown as current assets or liabilities.
2 Net operating charges
Auditors’ remuneration for the statutory audit of the Company’s individual financial statements was £0.1 million (2015: £0.1 million).Other fees paid to the auditors are disclosed in Note 4 to the Group financial statements.
The Directors’ remuneration was paid by Doncasters Limited, a subsidiary of Doncasters Group Limited and by Dubai InternationalCapital LLC, the owners of Doncasters Group Limited and is disclosed in the Report of the directors on page 6.
D o n c a s t e r s G r o u p L i m i t e d A n n u a l R e p o r t 2 0 1 6
62
3 Investments
Investments in group undertakingsShares Loans Share based
paymentsTotal
Cost and net book value £ million £ million £ million £ million
At 1 January 2016 3.0 2.9 1.6 7.5
Additions — 0.3 0.1 0.4Repayments — (0.5) — (0.5)
At 31 December 2016 3.0 2.7 1.7 7.4
The directors believe the carrying value of the investments is supported by their underlying net assets.
Share based payments relate to investments made by the company into subsidiary entities in the form of long-term incentive plansfor certain employees.
4 Debtors2016 2015
£ million £ millionAmounts due within one year:
Owed by subsidiary undertakings 93.0 93.0Interest receivable from subsidiary undertakings 121.0 95.5Other debtors 0.5 0.5Derivative financial instruments 3.2 —
217.7 189.0
Amounts due after one year:
Deferred tax 0.3 —
Amounts owed by subsidiary undertakings are unsecured, have no fixed repayment date and bear interest at rates between 12.0%and 15.5%.
The derivative financial instruments take the form of a cross currency swap which is measured at fair value through profit and loss.The key assumptions used in valuing the derivatives are the forward exchange rates for GBP:USD and GBP:EUR. The Companyis committed to receive US$ 62,900,000 and sell € 59,700,000 and receive a fixed sterling amount in relation to these contracts.The contract matures within 9 months. All other debtors except for deferred tax are valued at amortised cost using the effectiveinterest method.
5 Cash at bank and in hand
2016 2015£ million £ million
Cash at bank and in hand 0.3 0.3
6 Creditors – amounts falling due within one year
2016 2015£ million £ million
Owed to subsidiary undertakings 3.1 5.8
Amounts owed to subsidiary undertakings are unsecured, have no fixed repayment date and are interest free.
All creditors are financial liabilities that are debt instruments measured at amortised cost.
D o n c a s t e r s G r o u p L i m i t e d A n n u a l R e p o r t 2 0 1 6
63
7 Creditors – amounts falling due after more than one year
2016 2015£ million £ million
Unsecured subordinated loan notes 68.2 60.8
The Unsecured subordinated loan notes bear interest at a fixed rate of 12.0%. The loan notes are repayable on 10 April 2021. Theloan notes are held by Dubai International Capital LLC and its subsidiaries. They are listed on the Channel Islands SecuritiesExchange. Disclosure in relation to these related party transactions is included in note 24 to the Group financial statements.
All creditors are financial liabilities that are debt instruments measured at amortised cost.
8 Called up share capital
Full details of the Company’s share capital are given in note 21 to the Group financial statements.
9 Share premium account
Full details of the Company’s share premium are given in note 21 to the Group financial statements.
10 Contingent liabilities
The Company has given guarantees in respect of uncommitted credit facilities for certain of its subsidiaries, property leases andother leasing arrangements and for the performance by some current and former subsidiaries of certain contracts.
D o n c a s t e r s G r o u p L i m i t e d A n n u a l R e p o r t 2 0 1 6
64
11 Subsidiary undertakings
The registered office of Doncasters Group Limited is Millennium Court, First Avenue, Burton-Upon-Trent, Staffordshire DE14 2WH.
The subsidiary undertakings are:
Subsidiary name Function Country ofincorporation
Registered office address
Certified Alloy Products Inc Trading company United States 2710 Gateway Oaks Drive Suite 150N, Sacramento, CA
Deritend International Limited Trading company United Kingdom Millennium Court, First Avenue, Burton-Upon-Trent, Staffordshire
Doncasters Aerospace Limited Trading company United Kingdom Millennium Court, First Avenue, Burton-Upon-Trent, Staffordshire
Doncasters Inc Trading company United States 2711 Centerville Road Suite 400, Wilmington, DE
Doncasters Limited Trading company United Kingdom Millennium Court, First Avenue, Burton-Upon-Trent, Staffordshire
Doncasters Precision Castings –Bochum GmbH
Trading company Germany Bessemerstrasse 80, 44793 Bochum
Erie Bolt Corporation Trading company United States 2595 Interstate Drive, Suite 103, Harrisburg, PA
Ferry Cap & Set Screw Company Trading company United States 50 West Broad Street Suite 1800, Columbus, OH
Integrated Energy Technologies Inc Trading company United States 2711 Centerville Road Suite 400, Wilmington, DE
Nelson (Tianjin) InternationalTrading Co. Ltd
Trading company China 18 Guomao Road, Free Zone, Tianjin
Nelson Bolzenschweiss‐TechnikGmbH & Co. KG
Trading company Germany Flurstraße 7-19, 58285 Gevelsberg
Nelson Fastener Systems de MexicoSA de CV
Trading company Mexico 211 Calle Diego Deibarra Aguascalientes Mexico
Nelson Saldatura Perni S.r.l Trading company Italy Via Miraflores 20, Nichelino, (TO)
Nelson Soudage de Goujons SAS Trading company France 8 Rue de l'Angoumois Zi du Chemin Vert 95100, Argenteuil
Nelson Stud Welding Canada Inc Trading company Canada 6199A Danville Road, Mississauga, Ontario
Nelson Stud Welding Inc Trading company United States 2711 Centerville Road Suite 400, Wilmington, DE
Nelson Stud Welding India PrivateLimited
Trading company India D-68A, First Floor, Freedmon Fighter Enclave, Neb Sarai, NewDelhi, Delhi
Nelson Stud Welding InternationalInc
Trading company United States 2711 Centerville Road Suite 400, Wilmington, DE
Nelson Stud Welding TianjinCompany Ltd
Trading company China DEDA Industrial Park, 39 Yijin Road, Dongli Economic DevelopmentArea, Tianjin
Paralloy Limited Trading company United Kingdom Millennium Court, First Avenue, Burton-Upon-Trent, Staffordshire
Ross & Catherall Limited Trading company United Kingdom Millennium Court, First Avenue, Burton-Upon-Trent, Staffordshire
Settas SA Trading company Belgium Allee Centrale, Zone Industrielle, B6040 Jumet
Southern Tool LLC Trading company United States 150 South Perry Street, Montgomery, AL
Specialty Bar Products Company Trading company United States 2595 Interstate Drive, Suite 103, Harrisburg, PA
Spiegelberg Manufacturing Inc Trading company United States 50 West Broad Street Suite 1800, Columbus, OH
TOG Manufacturing Company Inc. Trading company United States 84 State Street, Boston, MA
Triplex Lloyd Properties Limited Trading company United Kingdom Millennium Court, First Avenue, Burton-Upon-Trent, Staffordshire
Trucast (Europe) Limited Trading company United Kingdom Millennium Court, First Avenue, Burton-Upon-Trent, Staffordshire
Trucast (North America) LLC Trading company United States 2711 Centerville Road Suite 400, Wilmington, DE
Trucast de Mexico SA de CV Trading company Mexico Blvd. Interamerican No. 302, Parque Finsa, 66600 Ciudad Apodaca
Trucast Limited Trading company United Kingdom Millennium Court, First Avenue, Burton-Upon-Trent, Staffordshire
Trucast LLC Trading company United States 2711 Centerville Road Suite 400, Wilmington, DE
Doncasters Blaenavon Limited Holding company United Kingdom Millennium Court, First Avenue, Burton-Upon-Trent, Staffordshire
Doncasters UK Finance Limited Holding company United Kingdom Millennium Court, First Avenue, Burton-Upon-Trent, Staffordshire
Doncasters US 2 LLC Holding company United States 2711 Centerville Road Suite 400, Wilmington, DE
Doncasters US Holdings Inc Holding company United States 2711 Centerville Road Suite 400, Wilmington, DE
Dundee Holdco 4 Limited Holding company United Kingdom Millennium Court, First Avenue, Burton-Upon-Trent, Staffordshire
Dundee Holdco GmbH Holding company Germany Bessemerstrasse 80, 44793 Bochum
Dundee PikCo Limited Holding company United Kingdom Millennium Court, First Avenue, Burton-Upon-Trent, Staffordshire
Fabri-Steel CV Holding company Netherlands Prins Bernhardplein 200, 1097 JB Amsterdam
Nelson Bolzenschweiss-TechnikVerwaltungs GmbH
Holding company Germany Flurstrasse 7-19, 58285 Gevelsberg
Nelson Stud Welding Holdings Inc Holding company Mauritius PO Box 80, Felix House, 24 Dr Joseph Riviere Street, Port Louis
NSW Fabristeel Netherlands B.V. Holding company Netherlands Prins Bernhardplein 200, 1097 JB Amsterdam
TOG Holdings Inc Holding company United States 2711 Centerville Road Suite 400, Wilmington, DE
Triplex Lloyd Limited Holding company United Kingdom Millennium Court, First Avenue, Burton-Upon-Trent, Staffordshire
Doncasters US Finance LLC Financing company United States 2711 Centerville Road Suite 400, Wilmington, DE
Doncasters US LLC Financing company United States 2711 Centerville Road Suite 400, Wilmington, DE
Dundee Holdco 2 Limited Financing company United Kingdom Millennium Court, First Avenue, Burton-Upon-Trent, Staffordshire
D o n c a s t e r s G r o u p L i m i t e d A n n u a l R e p o r t 2 0 1 6
65
11 Subsidiary undertakings (continued)
Subsidiary name Function Country ofincorporation
Registered office address
Dundee Holdco 3 Limited Financing company United Kingdom Millennium Court, First Avenue, Burton-Upon-Trent, Staffordshire
Anodic Machining TechnologiesLimited
Dormant company United Kingdom Millennium Court, First Avenue, Burton-Upon-Trent, Staffordshire
Bulldog Barrels LLC Dormant company United States 2595 Interstate Drive, Suite 103, Harrisburg, PA
Clovepark Limited Dormant company United Kingdom Millennium Court, First Avenue, Burton-Upon-Trent, Staffordshire
Cranford 1040 Limited Dormant company United Kingdom Millennium Court, First Avenue, Burton-Upon-Trent, Staffordshire
Cranford 1041 Limited Dormant company United Kingdom Millennium Court, First Avenue, Burton-Upon-Trent, Staffordshire
Daniel Doncaster & Sons Limited Dormant company United Kingdom Millennium Court, First Avenue, Burton-Upon-Trent, Staffordshire
Deritend Lloyd Pension TrusteesLimited
Dormant company United Kingdom Millennium Court, First Avenue, Burton-Upon-Trent, Staffordshire
Doncasters 456 Limited Dormant company United Kingdom Millennium Court, First Avenue, Burton-Upon-Trent, Staffordshire
Doncasters Ceramics Limited Dormant company United Kingdom Millennium Court, First Avenue, Burton-Upon-Trent, Staffordshire
Doncasters de Mexico SA de CV Dormant company Mexico Blvd. Interamerican No. 302, Parque Finsa, 66600 Ciudad Apodaca
Doncasters International Limited Dormant company United Kingdom Millennium Court, First Avenue, Burton-Upon-Trent, Staffordshire
Doncasters LLC Dormant company United Kingdom Millennium Court, First Avenue, Burton-Upon-Trent, Staffordshire
Doncasters Middle East Limited Dormant company United Kingdom Millennium Court, First Avenue, Burton-Upon-Trent, Staffordshire
Doncasters Monk Bridge Limited Dormant company United Kingdom Millennium Court, First Avenue, Burton-Upon-Trent, Staffordshire
Doncasters Pension TrusteesLimited
Dormant company United Kingdom Millennium Court, First Avenue, Burton-Upon-Trent, Staffordshire
Doncasters Precision Castings –Deritend Limited
Dormant company United Kingdom Millennium Court, First Avenue, Burton-Upon-Trent, Staffordshire
Doncasters Precision ForgingsLimited
Dormant company United Kingdom Millennium Court, First Avenue, Burton-Upon-Trent, Staffordshire
Doncasters Structures Limited Dormant company United Kingdom Millennium Court, First Avenue, Burton-Upon-Trent, Staffordshire
Doncasters UK Holdings Limited Dormant company United Kingdom Millennium Court, First Avenue, Burton-Upon-Trent, Staffordshire
E. D. H. Limited Dormant company United Kingdom Millennium Court, First Avenue, Burton-Upon-Trent, Staffordshire
Doncasters 1516 Limited Dormant company United Kingdom Millennium Court, First Avenue, Burton-Upon-Trent, Staffordshire
IEP Structures Limited Dormant company United Kingdom Millennium Court, First Avenue, Burton-Upon-Trent, Staffordshire
Leatherbay Limited Dormant company United Kingdom Millennium Court, First Avenue, Burton-Upon-Trent, Staffordshire
RCG Holdings Limited Dormant company United Kingdom Millennium Court, First Avenue, Burton-Upon-Trent, Staffordshire
Ross Catherall (Holdings) Limited Dormant company United Kingdom Millennium Court, First Avenue, Burton-Upon-Trent, Staffordshire
Ross Catherall (US Holdings)Limited
Dormant company United Kingdom Millennium Court, First Avenue, Burton-Upon-Trent, Staffordshire
Ross Catherall Castings Limited Dormant company United Kingdom Millennium Court, First Avenue, Burton-Upon-Trent, Staffordshire
Ross Catherall Group Limited Dormant company United Kingdom Millennium Court, First Avenue, Burton-Upon-Trent, Staffordshire
Ross Catherall Metals (Holdings)Limited
Dormant company United Kingdom Millennium Court, First Avenue, Burton-Upon-Trent, Staffordshire
Ross Catherall Metals Limited Dormant company United Kingdom Millennium Court, First Avenue, Burton-Upon-Trent, Staffordshire
Ross Catherall Superalloys Limited Dormant company United Kingdom Millennium Court, First Avenue, Burton-Upon-Trent, Staffordshire
Sterling International TechnologyLimited
Dormant company United Kingdom Millennium Court, First Avenue, Burton-Upon-Trent, Staffordshire
Triplex Lloyd Building ProductsLimited
Dormant company United Kingdom Millennium Court, First Avenue, Burton-Upon-Trent, Staffordshire
Triplex Lloyd Corporate ServicesLimited
Dormant company United Kingdom Millennium Court, First Avenue, Burton-Upon-Trent, Staffordshire
Triplex Lloyd Nominees Limited Dormant company United Kingdom Millennium Court, First Avenue, Burton-Upon-Trent, Staffordshire
Triplex Lloyd Pensions ManagementLimited
Dormant company United Kingdom Millennium Court, First Avenue, Burton-Upon-Trent, Staffordshire
All are wholly owned indirect subsidiaries other than Dundee Holdco 2 Limited which is a wholly owned direct subsidiary. All areincorporated in the United Kingdom unless otherwise indicated.
The German subsidiary company Nelson Bolzenschweiss-Technik GmbH & Co. KG takes exemption from publishing its individualfinancial statements and from preparing a management report through its inclusion in these consolidated financial statements,according to section 264b of the German Commercial Code (HGB).