dona bay watershed management plan: salinity …
TRANSCRIPT
DONA BAY WATERSHED MANAGEMENT PLAN: Salinity Targets for Watershed Management
SARASOTA COUNTY - KIMLEY HORN AND ASSOCIATES MASTER AGREEMENT FOR CONTINUING PROFESSIONAL SERVICES
TASK 3: WATERSHED GOALS TASK 4.1.1.1: LIFE HISTORY REQUIREMENTS
TASK 4.1.1.2: OYSTER SURVEY (INDMDUAL PROJECT ORDER NUMBER 1)
MARCH 29, 2006
Submitted to:
MIKE JONES
SARASOTA COUNTY ENVIRONMENTAL SERVICES
2817 CATTLEMEN ROAD
SARASOTA, FLORIDA 34232
Submitted by:
E. D. ESTEVEZ CENTER FOR COASTAL ECOLOGY
MOTE MARINE LABORATORY
1600 KEN THOMPSON PARKWAY
SARASOTA, FLORIDA 34236
MOTE MARINE LABORATORY TECHNICAL REPORT NO. 1090
MOTE MARINE LABORATORY

INTRODUCTION
THE Dona Bay Watershed Management Plan (DBWMP) is a regional initiative that promotes and furthers the implementation of the Sarasota County Comprehensive Plan, Comprehensive Conservation and Management Plans of the Sarasota Bay and Charlotte Harbor National Estuary Programs, and the Southwest Florida Water Management District's Southern Coastal Comprehensive Watershed Management Plan.
Specifically, this initiative is to plan, design, and implement a comprehensive watershed management plan and projects for the Dona Bay watershed to achieve the following general objectives: provide a more natural freshwater/saltwater regime in the tidal portions of Dona Bay; provide a more natural hydrologic regime for the Dona Bay watershed; protect existing and future property owners from flood damage; protect and/or improve existing water quality; develop ecosystem goals and targets based on the requirements of environmental and biological indicators, and develop potential alternative surface water supply options that are consistent with, and support other plan objectives.
The DBWMP is being developed by a team of six organizations, including Mote Marine Laboratory, led by Kimley-Horn and Associates in coordination with Sarasota County Environmental Services. Nine tasks or phases comprise the technical elements of the DBWMP. The second technical task for Mote Marine Laboratory is contributing to the development of watershed goals for the Dona Bay watershed. This report specifically outlines a rationale and method for the use of estuarine information in the establishment of watershed goals, and provides relevant estuarine resource targets. An Appendix reports on findings of a new oyster study in Dona Bay and Shakett Creek.
ENVIRONMENTAL SETTING
Not counting basin alterations and augmented stream flows, the salinity trend of the Dona Bay study area during the past few centuries and especially the 20th Century has been one of increase. Sea level rise, the natural opening of Midnight Pass, construction of the Intracoastal Waterway, and inlet stabilization have been working to increase the reach of tides into and influence of salt waters upon the Bay. The increased connection has influenced water levels and circulation, sedimentation, salinity, and the numbers and kinds of plants and animals inhabiting the study area. In this context the stabilization and maintenance of the inlet may be viewed as consistent with natural trends. During this period, the major source of natural variation was probably related to the incidence and severity oftropical storms and hurricanes.
Without the influence of humans, freshwater inflows would have remained the same. Although an increase in rainfall and runoff might be expected during warmer climate periods, there is no local evidence for trends in increasing rainfall in the area beyond those attributable to known cyclicity. Three principal human actions have caused freshwater inflows to
2
increase: diversion of Cow Pen Slough from the Myakka River; inland expansion of the effective watershed of Cow Pen Slough, and transformation of natural land cover to land uses with heightened runoff. The timing of inflows has been changed by these practices and also by instream structures.
Increased flows and flow rectification are significant departures from "natural" conditions insofar as the creek and bay are concerned, and have de-stabilized the marine environment. When coupled with natural and cultural forces raising salinity in Dona Bay, the combination of increased inflows and marine effects has created a strong salinity gradient over a relatively short distance, and a local area capable of rapid, high-amplitude oscillations in salinity.
RATIONALE AND METHOD
A Valued Ecosystem Component (VEC) approach is employed to develop management targets for Dona Bay. A VEC is a population, species, community, habitat, or an ecosystem function, recognized as a natural and desirable element of a given management domain (forest, lake, estuary, etc.). Valued ecosystem components are chosen when sufficient data exist within the domain, or in other settings where data are transferable to the domain, to support the establishment of environmental targets for restoration.
By this method,
1. Valued ecosystem components are identified for Dona Bay and Shakett Creek; 2. Desired spatial distributions for each VEC are determined; 3. Environmental variables that regulate VEC distributions are identified; 4. Target values for environmental variables are recommended, and 5. Engineering and hydrological studies are made to determine the feasibility of achieving the target values.
This report addresses steps one through four with the expectation that each step will be refined as the DBWMP progresses. Ongoing studies by other members of the project team will contribute to these recommendations. Once target values for environmental variables are refined, their practical feasibility under various watershed and stream management scenarios can be evaluated by engineering and hydrological studies.
GEOGRAPHICAL DEFINITIONS
The Dona Bay study area is defined as extending from Venice Inlet to US 41. The Shakett Creek study area is defined as extending from US 41 to the downstream-most control structure on Cow Pen Slough (Mike Jones, personal communication).
3

V ALUED ECOSYSTEM COMPONENTS IDENTIFIED FOR DONA BAY
Four VECs are employed for Dona Bay-location and size of tidal fresh waters; submerged vascular aquatic vegetation (seagrasses), the hard clam Mercenaria campechiensis, and the American oyster, Crassostrea virginica. Additional information is provided for three valued fish species common in Sarasota County waters.
DESIRED SPATIAL DISTRIBUTIONS
A. Tidal Fresh Water: Based on historical information and data from other tidal streams in southwest Florida,
Tidal fresh waters will persist during all times, except during extended natural droughts, in Shakett Creek upstream of Fox Creek.
B. Seagrasses: Based on their known past and modem distributions,
Ruppia maritima (widgeongrass) and Halodule wrightii (shoalgrass) will be the principal SAY species west of US 41 (river kilometer [RK] 2.0). Their cover and relative abundances will alternate depending on seasonal and annual variations in stream flow and salinity, and Halodule may also occur west of US 41 in wet periods.
Syringodiumfiliforme (manatee grass) and Thalassia testudinum (turtle grass) will be the principal SA V species in the lower (western) reaches of Dona Bay, extending north into lower Lyons Bay and south into lower Roberts Bay. Their cover and relative abundances will alternate depending on seasonal and annual variations in salinity and water clarity, and both may also occur in middle and upper Dona Bay in dry periods.
C. Hard Clams: Based on their known past and modem distributions,
Mercenaria campechiensis will persist in subtidal and low intertidal beds of Syringodium and Thalassia. Hard clams will recruit into middle Dona Bay in dry periods.
D. Oysters: Based on their known past and modem distributions,
Crassostrea virginica will persist as living oyster reefs in lower Shakett Creek and extend as living reefs west into middle Dona Bay.
4
ENVIRONMENTAL VARIABLES REGULATING DONA BAY VECS
This report focuses on the role of salinity in regulating seagrasses, hard clams, and oysters. As findings by other team members become available the roles of water clarity, dissolved oxygen, or other variables may be considered in addition to salinity. The following sections are adapted from Estevez (2000) and Estevez and Marshall (1993).
A. Tidal Freshwaters
Tidal fresh water reaches of coastal streams provide habitat for the larval and juvenile stages of numerous valued species, and also support a unique flora and fauna. Although the historic location of altered urban streams is often unknown, studies of relatively unaltered coastal streams have identified proxy records for the upstream extent of saltwater encroachment. Estevez, Edwards and Hayward (1991) reported that the transition of bankside soils from alluvial to tidal, as depicted in first generation USDA soil surveys, correspond to long-term surface salinity means ofless than 2.0 ppt. The 1959 Soil Survey for Sarasota County depicts the upstream extent of tidal soil in Shakett Creek at a point approximately 2,000 ft upstream of its confluence with Fox Creek, leaving a relatively short and shallow reach of "Salt Creek" as usually fresh in nature.
Surface and bottom salinity where Fox Creek enters Shakett Creek should average less than 2.0 ppt.
B. Seagrasses
Seagrasses found near Dona Bay include Halodule wrightii, Thalassia testudinum, Syringodium filiforme, and possibly Ruppia maritima. Ruppia is not a true marine plant but it often occurs in low salinity waters.
Using available SWFWMD aerial photography of seagrasses in the region, approximately 36% of Dona Bay's total surface area has seagrass. Compared to Roberts Bay (43% seagrass) and Lyons Bay (75% seagrass), Dona Bay has the lowest seagrass coverage of Venice inland waters.
Seagrass beds have a variety of functions within estuarine habitats (Wood et aI., 1969). They are important as a structural habitat for juveniles and adults of many animal species. Seagrasses anchor sediments and slow water currents to the point at which part of the water column sediment load settles to the bottom (Ward et aI., 1984). Nutrients carried by these sediments are utilized directly by the seagrass plants and indirectly by the grazers and detritus feeders within the seagrass beds. Reductions in seagrass bed coverage usually result in drastic shifts in community composition. Major seagrass losses typically change the nature of or cause large decreases in the productivity of fisheries within the affected areas (Livingston, 1987). A study in northeastern Florida Bay (Montague et aI., 1989) demonstrated that
5

seagrasses and benthic fauna were much less abundant where bottom salinities were highly variable. Montague et al. (1989) stated that:
"Submerged vegetation found in small quantity at the upstream stations ... are known to thrive elsewhere at salinities comparable to the mean salinities found at those stations. Frequent, large, and sudden variations in salinity at a station ... might reset succession, preventing good development of anyone benthic community."
In a rule-based ecological model of an estuarine lake, Starfield et al. (1989) concluded that the abundance of underwater plant biomass was sensitive to the rate of change of salinity rather than the salinity level per se, but these model outputs have not yet been confirmed. Fears (1992) tested the effects of salinity shocks of various intensities and durations on the growth rate and survival of Thalassia, Halodule, and Syringodium. His experimental design did not mimic situations where drastic salinity changes occur on tidal, daily, weekly, or longer temporal cycles. Extreme variation in salinities in and near Dona Bay (Jones, 2004) may be a major cause of SA V limitation.
Ruppia maritima
Wigeongrass is often found with the seagrasses but is not a true marine plant; it is considered a freshwater species with a pronounced salinity tolerance. It behaves as an annual in habitats subject to drought, lethal increases in salinity, or other extremes, or as a perennial in deeper, more stable environments, and has specialized features enabling survival under varying salinities and high temperature beyond those tolerated by other submersed angiosperms. Ruppia usually occurs at low intertidal elevations in estuaries, but mixes with true seagrasses up to at least 1.5 km offshore in large oceanic bays.
Widgeongrass has been observed in a wide range of salinities from fresh water to hypersaline waters (Kantrud, 1991), however, a re-analysis of distributional data by Estevez (2000) shows that particular Ruppia populations grow in comparatively narrow salinity ranges. It has not been reported from Shakett Creek but grows in tidal freshwater reaches of the Myakka River.
Halodule wrightii
In an early study (McMahan, 1968) pots of Halodule maintained vigorous growth in salinities from 23 to 37 ppt, for 5 weeks, and it survived in salinities up to 60 ppt. In a separate experiment an attempt was made to grow Halodule at salinities ranging from 0 to 87 ppt. It survived for 6 weeks in salinities ranging from 3.5 to 52.5 ppt. After 2 weeks at salinities under 9 ppt Halodule began to show adverse effects. Fears (1993) demonstrated that Halodule could tolerate short term, to 24 hrs duration, salinity shocks in fresh water. He warned that longer duration exposures or repeated shocks could kill this seagrass. Field data on Halodule distribution near river mouths and on tidally exposed sandbars also suggest that it can tolerate wide salinity fluctuations.
6

No information is available on the reproduction and germination of this seagrass under artificially manipulated salinity regimes. Halodule flowers have been reported to occur in various areas at temperatures between 22°C and 26 °c and in salinities ranging from 26.0 ppt to 36.0 ppt (Moffler and Durako, 1987).
Doering et al. (2002) report that "laboratory experiments indicated that (Halodule) mortality could occur at salinities < 6ppt, with little growth occurring between 6ppt and 12ppt. Field data indicated that higher blade densities (> 600 blades per square meter) tend to occur at salinities greater than 12ppt. Relationships between salinity in the estuary and discharge from the Caloosahatchee River indicated that flows > 8.5 m cubic meters per second would produce tolerable salinity « 1 Oppt) for V americana and flows < 79 cubic meters per second would avoid lethal salinities « 6ppt) for H. wrightii."
Syringodium filiforme
Phillips (1960) summarized observations related to salinity effects on the distribution of S. filiforme. His summary suggested that Halodule is more tolerant of low salinities. Phillips reported dense beds of Syringodium in the Indian River Lagoon in salinities of 22 - 35 ppt. He suggests that an optimum salinity level to support Syringodium should exceed 20 - 25 ppt.
Fears' (1993) results showed that Syringodium growth rates were not noticeably affected by salinity shocks (= submergence in water of low or zero salinity) until they were placed in freshwater for 24 hrs. Less harsh treatment did not result in noticeable growth rate decreases for this species.
Syringodium is rarely seen in flower in Florida waters (Phillips, 1960) and therefore no information exists on the effects of salinity on the processes of reproduction and seed germination.
Thalassia testudinum
A dominant species throughout its range, Thalassia nonetheless constitutes a relatively minor element of Dona Bay's seagrass cover. The paucity of Thalassia may be explained by the Bay's extensive history of dredging and spoiling, coupled with extremes in freshwater inflow. Thalassia is intolerant oflow salinity (Fears, 1993), and is a slow spreading, poor colonizer among seagrass species. These characteristics give Thalassia a low recovery rate during favorable salinity periods. The areal extent of Thalassia suggests that modem Thalassia beds are not very old.
Many species of seagrasses seem to disappear soon after the introduction of large freshwater inflows (BeHan, 1972), or species diversity among seagrasses is reduced. Thereafter, salinity or other impacts become more difficult to observe because affected living resources left in the area tend to be eurytopic.
7

To create conditions favorable for Ruppia within itsdesired range, mean bottom salinity should be maintained near 5 ppt, with a standard deviation about the mean less than 10 ppt.
To restore and enhance Halodule within its desired range, mean bottom salinity should be maintained near 25 ppt, with a standard deviation about the mean less than 10 ppt.
To enhance the potential for Syringodium and Thalassia growth in their desired range, the duration of bottom salinities of zero ppt should be kept to less than 24 hours.
C. Hard Clams
Live hard clams occur in Lyons Bay but to date only dead clams have been collected from either Dona Bay or Roberts Bay (Estevez, 2005).
Adult hard clams survive short spells of lowered salinities by closing their valves, and stop pumping at salinities below 15 ppt (Eversole, 1987). Survival times under adverse environmental conditions are age/size dependent. Ambient temperatures and dissolved oxygen levels alter salinity tolerances and survival times. Larval and juvenile clams are more susceptible to low salinities because they lack the protection of the heavy, thick shells of older clams (Wells, 1957). Fishermen in the Indian River lagoon have noted that small clams can tolerate low salinity for 2 to 3 hours while adults may be able to withstand low salinity for several days.
Hard clams already stressed by other environmental factors may be more susceptible to salinity stress (Wells, 1957). High temperatures, for example, increase respiratory demands and decrease the length of valve closure periods (Barnes, 1987). Elevated summertime water temperatures and high biological oxygen demands, created by excess nutrient supplies, reduce dissolved oxygen availability (Windsor, 1985) below the metabolic needs of clams stressed by low salinities.
Sudden increases in salinity, exceeding 8 parts per thousand (ppt) are also lethal to hard clams (M. Castagna, Virginia Institute of Marine Science, personal communication). In fact, hard clams can tolerate a larger decrease -- drops of up to 15 ppt -- if the lowest salinities remain above seasonally changing and geographically variable lethal salinity limits.
Distributional patterns of Mercenaria mercenaria in several areas suggest that salinity has a strong influence either on recruitment or on subsequent post-recruitment survival and growth (Wells, 1957; Walker and Tenore, 1984; Craig et aI., 1988). Physiological changes occur within clam tissues when exposed to low salinities. Clam tissues leak amino acids at salinities that truly euryhaline species, such as Mytilus and many others, can tolerate without amino acid losses (Rice and Stephens, 1988). Amino acid loss continued after a 5-day acclimation period, at 17.0 ppt, for adult Mercenaria. Net losses of amino acids can be used as an index of a species' ability to tolerate salinity fluctuations. Adult Mercenaria can tolerate long exposures
8

to lowered salinities by tightly closing their thick valves (Wells, 1957), but the duration of the maximal period of closure is a function of temperature.
Patterns of shell growth in adult hard clams have been studied in 10 southeastern estuaries (Jones, et aI. 1990). Florida clams have higher growth rates and shorter life spans than northern clams. Shells exhibit a bimodal growth pattern with peak rates of new shell deposition in the spring and late fall of the year. Shell growth is lowest in summer when temperatures are highest and salinities are lowest. Salinity data for three sites are available. At no time were monthly salinities below 10 ppt. In 3 months (8% of 36 station-months), salinities were lower than 15 ppt. Salinities were between 15 and 20 ppt during 33% of visits and salinities were greater than 20 ppt on more than half (56%) of the visits.
Salinity requirements of embryonic, larval, and juvenile clams change throughout development and early growth (Mulholland, 1984). Temperature has a complicating effect on the interpretation of salinity requirements of Mercenaria mercenaria and M. campechiensis . Female clams in spawning state were found to be almost continuously present in the Indian River near Melbourne (Hessel man et aI. , 1989). A strong biphasic period of spring (March -June) and fall (August - October) ripening and spawning of female littleneck hard clams in Was saw Sound, Georgia, was reported by Pline (1964). There was a strong correlation between recruitment failure and depressed winter salinity « 30 ppt) in winter. Hard clams postponed high experimental mortality in 10.0 ppt salinity by remaining tightly closed for 4 to 5 weeks, but eventually succumbed.
Studies of the salinity requirements of larval and juvenile clams find that the minimum tolerable salinity was 20 ppt or greater. Given that low-latitude clam populations encounter higher water temperatures, published salinity requirements of larval clams suggest that it would be advisable to avoid salinity decreases to levels below 20 ppt at least during spawning and preferably throughout the year.
Wells (1957) noted that few hard clams were found in parts of Chincoteague Bay where salinities often reached levels ranging from 13 to 21 ppt. The western and northern margins of the bay are affected by fresh water from creeks and rivers. Wells stated that productive clam beds in Chincoteague Bay are located near inlets in relatively saline waters. Further south in Georgia's Was saw Sound, dense clam beds (with finds of >15115 min effort) are mostly located in the shallow waters of the Sound within 6 km of coastal inlets .
Adult clams can, under certain conditions, tolerate low salinities for extended periods. Burrell (1977) found that oysters, although tolerant of lower salinities than clams, suffered much higher mortality during floodwater discharges from the Santee River system in South Carolina. Salinities remained below 10 ppt for 2 to 3-week periods. Oysters suffered mortalities ranging from 32% to 66% in various areas while clam mortality was less than 5%. Clam and oyster internal liquors remained at higher salinities than did their ambient environment. Hard clams can withstand direct exposures to fresh water for up to 114 hours (Pearse, 1936). Despite these extreme exposures, Eversole (1987) describes the hard clam as
9

only moderately euryhaline and concludes, in reviewing the literature on clam responses to salinity, that optimum salinities for egg development, larval growth and survival, and adult growth are in the 24 to 28 ppt range.
In general , salinity below 15 ppt may be considered "low;" such salinities affect clam physiology, behavior, reproduction, and survival. Small clams may survive low salinities for hours while large clams may survive for days, or even weeks, but they do so under stressful conditions.
A bottom salinity of 20 ppt is recommended as the lowest average salinity genuinely suitable for hard clams in Dona Bay. This value emerges from divergent studies of shell growth, spawning, larval growth, and field studies. In the spring and fall, when shell growth and spawning are normally at peak levels, salinities of 25 ppt or greater would be protective. With these as reference-points, salinity characteristics that may be recommended to maintain and enhance hard clam populations are that, within their desired range:
1. For a year as a whole, mean bottom salinity should be maintained at levels above 20 ppt. 2. The lower limit of bottom salinity should be 10 ppt and the upper limit can equal oceanic values. 3. In summer, mean bottom salinities should exceed 20 ppt and be associated with standard deviations not greater than 5 ppt. Excursions of summer-time salinity below 15 ppt should not persist for more than 1 week (7 days). 4. During other times of the year, mean bottom salinities should be equal to or exceed 25 ppt and be associated with standard deviations not greater than 5 ppt. 5. Successive high tide, bottom salinities should not increase by more than 5 ppt, and successive low tide, bottom salinities should not decrease by more than 10 ppt, beyond background rates as a result of surface water management operations.
D. Oysters
Oysters were once present in sufficient quantities to form significant archaeological formations at Venice. Jones (2005) reported a one year increase in percentages oflive oysters and number of live oysters at fixed stations in Shakett Creek and Dona Bay, significant improvements since 2003. All measures of oyster abundance and condition indicate that Shakett Creek and Dona Bay experience intermittent conditions inimical to oyster success.
Oysters are immobile, after a larval stage, and are therefore subject to the permanent effects of salinity changes due to alterations of riverine inflow, ocean influence, or circulation. Low riverine flows of short duration result in high salinities in Apalachicola Bay and result in increased predation on newly settled spat; population sizes of adult, harvestable oysters are reduced 2 and 3 years later (Wilber, 1992). Wilber found little evidence that high flows of short duration (:s 30 days) adversely affected oyster harvests for the same or subsequent years. Her analyses were based on river flow data (kept by the Northwest Florida Water Management District) and oyster harvest data from 1960 to 1981.
10

Oysters can avoid predation by tolerating salinity fluctuations that their natural predators cannot tolerate (Gunter, 1955). Low salinities kill oyster drills and starfish (Sellers and Stanley,1984). Maintenance of salinities within ranges above the lower tolerance limits of oyster predators usually results in major declines in oyster abundance (Allen and Turner, 1989). Ortega and Sutherland (1992) found adequate spat settlement in both low salinity « 15 ppt) and high salinity (> 20 ppt) reaches ofPamlico and Core Sounds, North Carolina. Algal turfs and poor sediment inhibited growth in low salinity areas and competition by fouling organisms retarded success in high salinity areas.
Salinity requirements of Crassostrea virginica are reviewed in Sellers and Stanley (1984). Adult oysters tolerate a salinity range of 5 to 30 ppt. They do best within a salinity range of 10 to 28 ppt (Loosanoff 1965a). Salinities below 7.5 ppt inhibit spawning. Maximum larval growth and survival occur above salinities of 12.5 ppt and maximum spat growth occurs between 15 and 20 ppt.
Oysters can tolerate salinities as low as 6.0 ppt for 14 days, and 3.0 ppt for up to 30 days (Loosanoff 1965b). When flood conditions persist for 30 days or more, oyster mortalities typically reach 100% (Allen and Turner, 1989). Sellers and Stanley (1984) reported major oyster mortalities in several areas that were affected by major floods when salinities remained below 2 ppt for extended periods.
On Louisiana's state seed grounds Chatry et al. (1983) found that salinity in the setting year is the prime determining factor for the production of seed oysters. Both high and low salinities resulted in poor seed production. Low salinities resulted in insufficient setting while the negative effects of high salinities were believed due to the effects of predation on oyster spat. The maintenance of optimum setting salinities was most critical from May through September. To optimize Louisiana spat production, Chatry et al. recommended May salinities between 6 to 8 ppt; salinities should average 13 ppt in June and July and not increase to greater than 15 ppt until late August, and September salinities should not average more than 20 ppt.
Volety et al. (2005) report that "oysters in the Caloosahatchee estuary spawn continuously from April to October, a period that coincides with freshwater releases into the estuary. Upstream, sub-tidal locations exhibited good spat recruitment, low disease intensity, and higher juvenile growth rates compared to downstream, intertidal sites. High freshwater flows during summer either flushes out oyster larvae and spat from areas with suitable cultch and/or reduce, salinities to levels that are unfavorable for spat settlement and survival. Freshwater releases in the range of 500 to 2000 CFS (cubic feet per second) will result in optimum salinities for oysters. Limited freshwater releases during winter coupled with decreased releases in summer should result in decreased P. marinus infections, suitable conditions for survival and enhancement of oyster reefs in the Caloosahatchee River."
Based on a review of oyster salinity requirements, to promote reefs in desired areas:
11

1. Salinities in areas where oyster bars are desired can be allowed to fluctuate broadly between 10 to 28 ppt, and these areas should possess strong longitudinal salinity gradients and mlxmg. 2. Lower salinities can be briefly tolerated by adult oysters. Salinities less than 6 ppt should not be allowed to persist longer than 2 weeks, nor should salinities lower than 2 ppt be allowed for longer than a week. 3. To protect recruitment, salinity during local spawning seasons should be above 10 ppt. Optimal larval and spat growth and survival can be obtained in salinities between 12.5 and 20 ppt.
Once salinity data have been analyzed by other members of the project team, these guidelines will need to be tested against new data for Dona Bay oysters (Appendix 1).
E. Fish
Fish populations may be affected greatly by rapid salinity shifts. Spotted seatrout (Cynoscion nebulosus), snook (Centropomus undecimalis), and red drum (Sciaenops ocellatus) are common residents of Venice waters. They are variably affected by low salinities, and a single salinity regime may not be suitable for all three species. Additionally, these three fish are dependent on a rich and diverse invertebrate and fish-based food chain. Altered salinities can be predicted to have different effects on each of the prey species of the three carnivorous species. A study of salinity change effects on fish and invertebrate populations in the St. Lucie estuary (Haunert and Startzman, 1980), while informative, was concerned with shortterm changes in fish and invertebrate populations. They did not consider the long-term biotic changes in this estuary that resulted from the permanent alteration of stream flow caused by the various water control structures upstream from the St. Lucie Estuary. Their study basically reported that animal communities which had already been affected by a long history of stream flow alterations were not significantly affected by a single test discharge.
Adults of the three species are mobile, and they have wide salinity tolerance ranges (Haunert and Startzman, 1980; Banks et aI., 1991). Their larvae and juveniles are poor to weak swimmers and have more narrow salinity tolerance ranges. Adult snook, for example, spawn in inlets and spend much time in the vicinity of dams feeding on freshwater prey species that are stunned or killed by their passage over dams (Marshall, 1958; Seaman and Collins, 1983). Much of the following discussion centers on the salinity requirements of the larval and juvenile stages of these three fishes.
Spotted Seatrout
Banks et ai. (1991) demonstrated that salinity tolerances of spotted seatrout are age-linked. Upper and lower tolerances changed during early growth. The results of this study were complicated by the fact that seatrout embryos -- acclimated to altered salinities -- produced larvae that were more tolerant of extreme salinities. The narrowest range of salinity tolerance, 6.4 to 42 .5 ppt, occurred on day 3 after hatching. Feeding begins on day 3 after hatching; the
12

change from dependency on yolk to exogenous foods and the immature state of the osmoregulatory system undoubtedly account for the higher sensitivity to salinity change. Salinity ranges for successful reproduction and larval survival of spotted seatrout were approximately 20 - 45 ppt and 10 - 40 ppt, respectively (Holt and Banks, 1989).
Seatrout spawn in deep channels adjacent to seagrass beds or in tidal portions of estuaries (Lorio and Perret, 1978). The Intracoastal Waterway in the vicinity of Dona Bay would fully fit this description of optimum spawning grounds. Florida's spotted seatrout spawn from April through September with peaks in late Mayor early June (Lorio and Perret, 1978). Salinity reductions, to levels below the tolerance limits of seatrout larvae (below 10 ppt), during this time could cause tremendous mortalities to occur among populations of recently hatched seatrout larvae.
Sudden, massive salinity reductions have been observed to cause either mass migrations from or mortalities of adult seatrout in Florida estuaries (Tabb, 1966). Adult seatrout are a truly euryhaline species, but they apparently cannot tolerate sudden salinity changes of the type that may occur during hurricanes or tropical storms.
Snook
Snook utilize a series of habitat types that are dependent upon the growth stage of this species (Gi lmore et aI. , 1983). Juvenile snook, ranging from 11-156 mm SL (mean = 27.5 mm) reside for 10 to 70 days within the freshwater tributaries of the Indian River Lagoon. Larger juveniles, from 10-174 mm SL (mean = 67 mm) are found in marsh habitats where they remain from 60 to 90 days. Freshwater and marsh recruitment peak in summer and fall (Gilmore et ai , 1983). Juvenile snook move from marshes to seagrass meadows after reaching lengths from 100 to 150 mm SL at ages of 4 months or more.
Snook diets change during juvenile growth and adult maturation. In freshwater , juveniles prey upon microcrustacea, palaemonid shrimp, and neonatal mosquitofish, Gambusia affinis (Gilbert et ai , 1983). Saltmarsh juveniles prey upon sheep shead minnows (Cyprinodon variegatus) , mosquito fish, palaemonid shrimp, and microcrustacea (mysids, copepoda, etc.). In seagrass beds, larger juveniles prey upon a variety of fish and penaeid shrimp (Gilbert et aI. , 1983). Adult snook switch diets as they move from areas of higher to lower salinity (Marshall , 1958).
Snook survive in freshwater but they cannot reproduce because their spermatozoa require activation by saltwater (Seaman and Collins, 1983). Large releases of freshwater into Shakett Creek probably do not compromise the osmoregulatory abilities of the common snook, but increased flows could wash weakly swimming juveniles and their prey from the prefelTed lowsalinity habitats.
Red Drum
13
Red drum are tolerant of a wide range of salinities (reviewed by Reagan, 1985). Adults have been collected from areas of virtual freshwater (0.3 ppt in Louisiana) and from areas with salinities exceeding that of full strength seawater (40 - 50 ppt in Texas). Small fish are more common at low salinities, and large fish seem to prefer higher salinities (Yokel, 1966). Perret et al. (1980) summarized numerous studies from widely scattered areas to report that juvenile red drum have been captured at salinities ranging from 0 ppt to 30 ppt. Highest catches of small red drum in Mississippi occurred when sa linities ranged from 20 to 25 ppt.
Red drum larvae have salinity tolerances of 15 - 35 parts per thousand, somewhat nan"ower than the salinity range tolerated by larval spotted seatrout (Holt and Banks, 1989). These authors found that salinities above and below these ranges significantly impaired all phases of reproduction and larval development in red drum.
Adult red drum are likely to swim away from areas with salinities above or below their preference range. Juveniles may be able to tolerate extremely low salinities, but their rates of acclimation to freshwater are not known. A sudden salinity shock could have a large negative impact on red drum juveniles.
Based on a review of seatrout, snook, and red drum salinity requirements:
I. Salinities must be held at seasonally appropriate levels within nursery grounds and spawning areas for each of these three species. When red drum and seatrout larvae are present the red drum larval tolerance range of 15 -35 ppt should not be exceeded.
2. Juvenile snook must have access to freshwater nursery areas such as those which exist in the upper reaches of Shakett Creek. Salt-water should not be allowed to encroach on these areas due to its lethal effects on many of the prey species consumed by juvenile snook. Existing flood control structures may block juvenile snook from a large part of their favored nursery habitat.
TARGET VALUES FOR SALINITY IN DONA BAY
Ecological features of Dona Bay and tidal coastlines generally are created through the action of geological, hydrological , chemical, and biological forces. The distribution , composition, abundance and condition of living resources along these coasts acquire common features and regionally unique features (Odum et aI., 1975). Soils, wetlands, seagrass beds, oyster reefs, and other structural ecosystem features develop in analogous ways across estuaries within specific climatic zones. The relationship of these features to freshwater inflow, tidal amplitude, salinity and other dynamical features also follow regular patterns. Productivity of individual species is regulated by the overlap of structural and dynamic habitat (Browder and Moore, 1981).
14
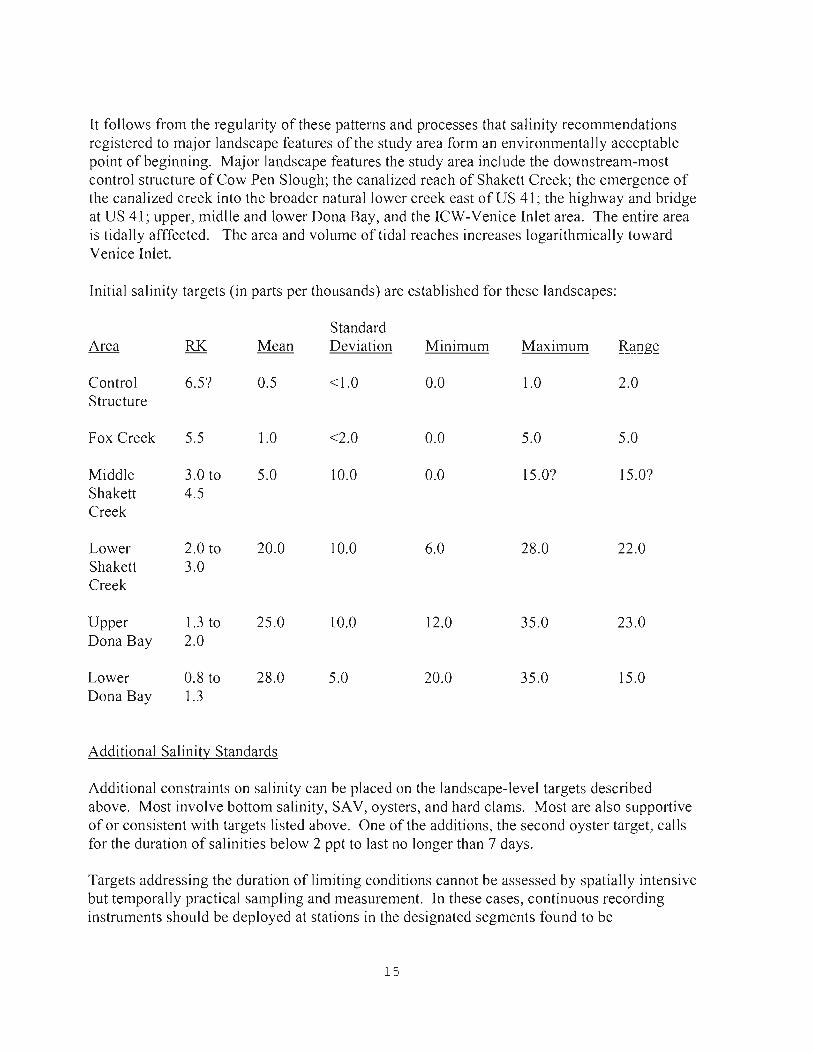
It follows from the regularity of these patterns and processes that salinity recommendations registered to major landscape features of the study area form an environmentally acceptable point of beginning. Major landscape features the study area include the downstream-most control structure of Cow Pen Slough; the canalized reach of Shakett Creek; the emergence of the canalized creek into the broader natural lower creek east of US 41 ; the highway and bridge at US 41 ; upper, midlle and lower Dona Bay, and the ICW-Venice Inlet area. The entire area is tidally afffected. The area and volume of tidal reaches increases logarithmically toward Venice Inlet.
Initial salinity targets (in parts per thousands) are established for these landscapes:
Standard Area RK Mean Deviation Minimum Maximum Range
Control 6.5? 0.5 <1.0 0.0 1.0 2.0 Structure
Fox Creek 5.5 1.0 <2.0 0.0 5.0 5.0
Middle 3.0 to 5.0 10.0 0.0 15.0? 15.0? Shakett 4.5 Creek
Lower 2.0 to 20.0 10.0 6.0 28.0 22.0 Shakett 3.0 Creek
Upper 1.3 to 25.0 10.0 12.0 35 .0 23.0 Dona Bay 2.0
Lower 0.8 to 28.0 5.0 20.0 35.0 15.0 Dona Bay 1.3
Additional Salinity Standards
Additional constraints on salinity can be placed on the landscape-level targets described above. Most involve bottom s~linity, SA V, oysters, and hard clams. Most are also supportive of or consistent with targets listed above. One of the additions, the second oyster target, calls for the duration of salinities below 2 ppt to last no longer than 7 days .
Targets addressing the duration of limiting conditions cannot be assessed by spatially intensive but temporally practical sampling and measurement. In these cases, continuous recording instruments should be deployed at stations in the designated segments found to be
15

representative of potentially critical conditions. Because the duration targets pertain to neighboring segments, it may be possible to employ just one such instrument in the vicinity of the U.S. 41 bridge. Because the critical targets reflect summer and/or high discharge periods, instrument use could be restricted to times and conditions when duration limits were most likely to be exceeded.
Additional salinity (S) targets, in parts per thousand (ppt).
Target
Mean bottom S = 25 ppt ± 10 ppt or less
o ppt duration at bottom < 24 hr.
Annual mean bottom S > 20 ppt.
Minimum bottom S :::: 10 ppt.
Summer mean bottom S > 20 ppt ± 5 ppt or less
Duration of summer mean bottom S < 15 ppt:s 7 days
Non-summer mean bottom S :::: 25 ppt ± 5 ppt or less
Duration of S < 6 ppt < 14 days
Duration of S < 2 ppt < 7 days
Affected VEe
Halodule
Syringodium and Thalassia
Mercenaria
Mercenaria
Mercenaria
Mercenaria
Mercenaria
Crassostrea
Crassostrea
16

Rate Limits
We found very little useful information concerning the maximum rates of salinity change tolerable by estuarine or marine organisms. The only finding, for hard clams,
Successive high tide, bottom salinities should not increase by more than 5 ppt, and successive low tide, bottom salinities should not decrease by more than 10 ppt, beyond background rates I as a result of surface water management operations,
requires explanation. Based on personal communications with scientists and fishermen in the clam industry, the amplitude of tolerable "sudden" salinity increases and decreases were trimmed and are expressed in terms of successive tides. This modification results in the fastest possible rate of salinity change that is measurable. Without better data on real-time rates of salinity change in lower Dona Bay, we felt obligated to take the additional precaution of suggesting that the limits be contingent upon a comparison to "background" rates of change. A definition of background is offered but it does little to change our view that this target should be advisory rather than certain.
In the event that all salinity targets cannot simultaneously be met, the following priorities are suggested. Minimum targets are more important than maximum targets. In upstream waters, low mean salinities are more important than their variation. In marine waters, low variation is probably more important than the mean salinities they accompany.
1/ Defined as the rates of salinity change that would occur between reference tides in the absence of surface water management structures and operations.
17

REFERENCES
Arnold, W.S. , Bert, T.M., Marelli, D.C., Cruz-Lopez, H. , and Gill, P.A. 1996. Genotypespecific growth of hard clams (genus Mercenaria) in a hybrid zone: Variation among habitats . Marine Biology. Vol. 125, no. 1, pp. 129-139.
Bahr, L.M. and W.P. Lanier, 1981. The ecology of intertidal oyster reefs of the South Atlantic coast: a community profile. U.S. Fish and Wildlife Service, Office of Biological Services, Washington, D.C. FWS/OBS-81115. 105 pp.
Banks, M.A. , G.J. Holt, and J.M. Wakeman, 1991. Age-linked changes in salinity tolerance of larval spotted seatrout (Cynoscion nebulosus, Cuvier). J. Fish Biology 39: 505-514.
Barnes, R.D., 1987. Invertebrate Zoology, Fifth Edition. Saunders College Publishing, Philadelphia. 898 pp.
Bellan, G. 1972. Effects of an artificial stream on marine communities. Marine Pollution Bulletin 3:74-78.
Browder, J.A. and D. Moore, 1981. A new approach to determining the quantitative relationship between fishery production and the flow of fresh water to estuaries, pp. 403-430 in R. Cross and D. Williams (eds.), Proc. Nat. Symp. on Freshwater Flow to Estuaries. Vol. 1 FWS/OBS-81104. U.S. Fish and Wildlife Service, Washington, D.C.
Burrell , V.G., 1977. Mortalities of oysters and hard clams associated with heavy runoff in the Santee River System, South Carolina in the spring of 1975. Proc. Natl. Shellfish. Assoc. 67: 35-43 .
Chatry, M., R.J. Dugas, and K.A. Easley, 1983. Optimum salinity regime for oyster production on Louisiana's state seed grounds. Contrib. Mar. Sci. 26: 81 -94.
Craig, M.A., T.J. Bright, and S.R. Gittings., 1988. Growth of Mercenaria mercenaria and Mercenaria mercenaria texana seed clams planted in two Texas bays. Aquaculture 71 : 193-207 .
Davis, H.C. 1958. Survival and growth of clam and oyster larvae at different salinities. BioI. Bull. (Woods Hole) 114: 296-307.
Dawson, C.E. , 1955. A study of the oyster biology and hydrography at Crystal River, Florida. Contrib. Inst. Mar. Sci. Univ. Texas 4(1): 279-302.
18

Doering, P.H., Chamberlain, R.H., and Haunert, D.E. 2002. Using Submerged Aquatic Vegetation to Establish Minimum and Maximum Freshwater Inflows to the Caloosahatchee Estuary, Florida. Estuaries Vol. 25, no. 6B, pp. 1343-1354.
Estevez, E.D. 2000. Matching salinity metrics to estuarine seagrasses for freshwater inflow management, Ch. 22 in S. Bortone (ed.), Seagrasses: Monitroring, Ecology, Physiology and Management. CRC Press, Boca Raton.
Estevez, E.D. 2005. Molluscan bioindicators of the tidal Myakka River and Inshore Waters of Venice, Florida. Mote Marine Laboratory Technical Report No. 990.
Estevez, E.D., R.E. Edwards and D.M. Hayward. 1991. An ecological overview of Tampa Bay;s tidal rivers, pp. 263-277 in S.F. Treat and P.A. Clark (eds.), Proceedings, Tampa Bay Scientific Information Symposium 2. Tampa Bay Regional Planning Council.
Estevez, E.D. and M.l Marshall. 1992. Sebastian River Salinity Regime, Parts 3 and 4: Recommended Targets. Contract 92W-177 Report to St. Johns River Water Management District. Mote Marine Laboratory Technical Report No. 308. 171 p.
Eversole, A.G., 1987. Species profiles: life histories and environmental requirements of coastal fishes and invertebrates (South Atlantic): Hard Clam. U.S. Fish and Wildlife Service Biological Report 82(11.75). 33 pp.
Fears, S. 1993. The role of salinity fluctuation in determining seagrass distribution and species composition. Master of Science thesis, Department of Environmental Engineering, University of Florida, Gainesville. 91 p.
Gilmore, R.G., C.J. Donohue, and D.W. Cooke, 1983. Observations on the distribution and biology of east-central Florida populations of the common snook, Centropomus undecimalis (Bloch). Fla. Sci. 46 : 313-336.
Gunter, G., 1955. Mortality of oysters and abundance of certain associates as related to salinity. Ecology 36: 601-605.
Hesselman, D.M., B.l Barber, and N.J. Blake., 1989. The reproductive cycle of adult hard clams, Mercenaria spp. in the Indian River Lagoon, Florida. l Shellfish Res. 8: 43-49.
Holt, G.l and M. Banks, 1989. II. Salinity tolerance in larvae of spotted seatrout, red drum, and atlantic croaker. pp. 46-81 in: Salinity requirements for reproduction and larval development of several important fishes in Texas estuaries. Final report to the Texas Water Development Board.
Jones, M. 2005. Dona and Robert's Bay Second Annual Watershed and Estuary Report. Sarasota County Environmental Services.
19

Jones, D.S. , I.R. Quitmyer, W.S. Arnold and D.C. Marelli, 1990. Annual shell banding, age, and growth rate of hard clams (Mercenaria spp.) from Florida. J. Shellfish Res. 9:215-225.
Kantrud, H.A. 1991. Wigeongrass (Ruppia maritima): a literature review. USFWS, Fish and Wildlife Research 10,58 p.
Livingston, RJ. , 1987. Historic trends of human impacts on seagrass meadows in Florida. pp. 139-152 in MJ. Durako, R.c. Phillips, and R.R. Lewis (eds.). Proceedings of the Symposium on Subtropical-Tropical Seagrasses of the Southeastern United States. Fla. Mar. Res. Publ. No. 42. , Florida Marine Research Institute, St. Petersburg, Florida.
Loosanoff, V.L., 1965(a). The American or eastern oyster. U.S. Fish. Wildlife Servo Circ. 205. 36pp.
Loosanoff, V.L., 1965(b). Gonad development and discharge of spawn in oysters of Long Island Sound. BioI. Bull. 129: 546-56l.
Lorio, WJ. and W.S. Perret, 1978. Biology and ecology of the spotted seatrout (Cynoscion nebulosus Cuvier). Proc. Red Drum and Seatrout Colloquium, Oct. 19-20,7-13.
Marshall, A.R. , 1958. A survey of the snook fishery of Florida with studies of the biology of the principal species, Centropomus undecimalis (Bloch). Fla. Board Conserv. Mar. Res. Lab. Tech Ser. No. Il. 37pp.
McMahan, C. A. 1968. Biomass and salinity tolerance of shoal grass and manatee grass in Lower Laguna Madre, Texas. J. Wildl. Manag. 32, 501-506.
Moffler, M.D. and M.J. Durako, 1987. Reproductive biology of the tropical-subtropical seagrasses of the southeastern United States. In: MJ. Durako, R.C. Phillips, and R.R. Lewis, III, (eds.) Proceedings of the Symposium on Subtropical-Tropical Seagrasses of the Southeastern United States, pp. 77-88. Florida Marine Research Publications Number 42, Florida Department of Natural Resources, Bureau of Marine Research , St. Petersburg, Florida.
Odum, H.T., BJ. Copeland and E.A. McMahan, 1975. Coastal Ecological Systems of the United States. Conservation Foundation, Washington, D.C.
Pearse, A.S., 1936. Estuarine animals at Beaufort, North Carolina. J. Elisha Mitchell Sci. Soc. 52 : 174-222.
Perret, W.S., J.E. Weaver, R.O. Williams, P.L. Johansen, T.D. McIlwain, R.C. Raulerson, and W.M. Tatum, 1980. Fishery profiles of red drum and spotted seatrout. Gulf States Marine Fisheries Commission, Ocean Springs, Mississippi. 60 pp.
20

Pline, M.J., 1964. Reproductive cycle and low salinity stress in adult Mercenaria mercenaria of Was saw Sound, Georgia. M.Sc. Thesis, Georgia Institute of Technology School of Applied Biology. 74 p.
Reagan, R.E. , 1985. Species profiles: life histories and environmental requirements of coastal fishes and invertebrates (Gulf of Mexico). Biological Report 82(11.36), TR EL-82-4, U.S. Fish and Wildlife Service. 16 pp.
Seaman, W. , Jr. and M. Collins, 1983. Species profiles: life histories and environmental requirements of coastal fishes and invertebrates (South Florida)--Snook. US. Fish Wildl. Servo FWS/OBS-82111.16. US. Army Corps of Engineers, TR EL--82-4. 16 pp.
Sellers, M.A. and J.G. Stanley, 1984. Species profiles : life histories and environmental requirements of coastal fishes and invertebrates (North Atlantic) -- American oyster. US. Fish Wildl. Servo FWS/OBS-8211 1.23. US. Army Corps of Engineers, TR EL--82-4. 15pp.
Starfield, A.M., B.P. Farm and R.H. Taylor, 1989. A rule-based ecological model for the management of an estuarine lake. Ecol. Modelling 46: 107-119.
Tabb, D.C. , 1966. The estuary as a habitat for spotted seatrout, Cynoscion nebulosus. Am. Fish. Soc. Spec. Publ. 3: 58-67.
Volety, A.S., Tolley, G. , Savarese, M. , and Winstead, J.T. 2004. Role of anthropogenic and environmental variability on the physiological and ecological responses of oysters in southwest Florida. Journal of Shellfish Research. Vol. 23 , no. 1, pp. 315-316.
Volety, A.K., Tolley, S.G., Savarese, M. , Rsanake, E. , Haynes, L. , Winstead, J.T. , Barnes, T. and Doering, P.H. 2005. The role of oysters and adaptive resource management in setting restoration targets for southwest Florida estuaries. Journal of Shellfish Research Vol. 24, no. 1, p. 338.
Walker, R.L. and K.R. Tenore., 1984. The distribution and production of the hard clam, Mercenaria mercenaria in Wassaw Sound, Georgia. Estuaries 7: 19-27.
Ward, L.G., W.M Kemp, and W.R. Boynton, 1984. The influence of waves and seagrass communities on suspended particulates in an estuarine embayment. Marine Geology 59:85-103.
Wells, H.W. , 1957. Abundance of the hard clam Mercenaria mercenaria in relation to environmental factors. Ecology 38, 123-128.
Wilber, D., 1992. Associations between freshwater inflows and oyster productivity in Apalachicola Bay, Florida. Estuarine, Coastal and Shelf Science 35: 179-190.
21

Windsor,1.G., 1985. Nationwide review of oxygen depletion and eutrophication in estuarine and coastal waters: Florida region. Florida Institute of Technology, Melbourne.
Wood, E.1.F., W.E. Odum, and J.e. Zieman, 1969. Influence of sea grasses on the productivity of coastal lagoons. Lagunas Costeras. pp. 495-502 in Proc. UN Symposio Mem. Simp. Intern. UNAM-UNESCO, Mexico, D.F. Nov. 1967.
Yokel , B.J. , 1966. A contribution to the biology and distribution of the red drum, Sciaenops ocellata. M.S. Thesis, Univ. Miami, Coral Gables: 160pp.
22
APPENDIX 1: A STUDY OF OYSTERS IN DONA BAY
BACKGROUND
Sarasota County has embraced the use of American oysters as bioindicator organisms in Dona and Roberts Bays, and their tributaries. Jones (2004) used 1948 and ground-truthed 2001 aerial photographs to depict historic and modem reef distributions, and modem live:dead ratios and spat settlement. About ten percent of historic oyster cover has been lost. Lyon's Bay had the most live and percent live oysters. Few live oysters were found upstream of US 41 in Shakett or Curry creeks and oysters in Dona Bay were mostly dead. The most live beds and robust oysters occurred between RK 2.1 -3.3 on Shakett Creek.
Jones (2005) found that oysters in Shakett and Curry creeks and their respective bays generally inproved during the following year, while Lyons Bay oysters were unchanged. In Shakett Creek, live oysters upstream of US 41 increased from <50% in 2003 to >75% in 2004. Percent live oysters also increased in Dona Bay. The 2003 mortality event was attributed to an abnormally wet, rainy season.
Also in 2004, Estevez (2005) surveyed mollusks at half-kilometer intervals in Dona Bay and Shakett Creek, from Venice Inlet to the Cow Pen Slough control structure near RK 6.0. Oyster was the dominant species and it with another 9 species comprised 90% of the collection. Oyster range was greater for dead material than live and more live oyster was found intertidally than in the subtidal. Jones (2004) and Estevez (2005) also probed sediments in Dona Bay and Shakett Creek for buried, relict reefs. There is evidence that historic oysters occurred farther upstream than modem ones in Curry Creek, but habitat alterations associated with channelization of Cow Pen Slough prevent a similar conclusion for Shakett Creek.
Other oyster-related investigations are underway or recently finished. As part of the DBWMP, the USF Department of Geology has conducted a study of sediments and sedimentation in the study area. Field work for that effort is complete and a report is forthcoming. Also, SCG is implementing a county-wide oyster monitoring program that will occupy existing stations in Dona Bay and Shakett Creek.
As part of the development of resource management targets for the DBWMP, Mote Marine Laboratory performed another oyster survey. Originally intending to use oyster epibiont and predator damage as a proxy record for historical salinities in Dona Bay and Shakett Creek, preliminary sampling found that shell damage was insufficent for use as a salinity proxy. Also, concerns for sampling buried reefs so as to address time-averaging issues discussed by Lindland et al. (2001) could not be addressed within the present scope of study.
In order to further the development of ecological targets for the study area, a related study of oyster condition, defined as largest live and largest dead shells, was undertaken. This metric
23

was developed in the Loxahatchee River and has been applied in SWFWMD minimum flows and levels studies of the Alafia River (Estevez 1990; Culter et aI., 2001).
METHODS
Intertidal reefs in Dona Bay and Shakett Creek were visited in May 2006. At each site, fifteen oyster clumps were haphazardly collected across the reef and along the perimeter of the reef. Each clump was dissected and the height of the largest living and largest dead oyster was measured to the nearest millimeter.
Oysters do not grow as reefs at RK O.S near Venice Inlet. There, oysters were located by snorkeling and wading along boulder rip-rap and mangrove shorelines and measurements were made on oysters encountered at mid to low intertidal elevations.
RESULTS
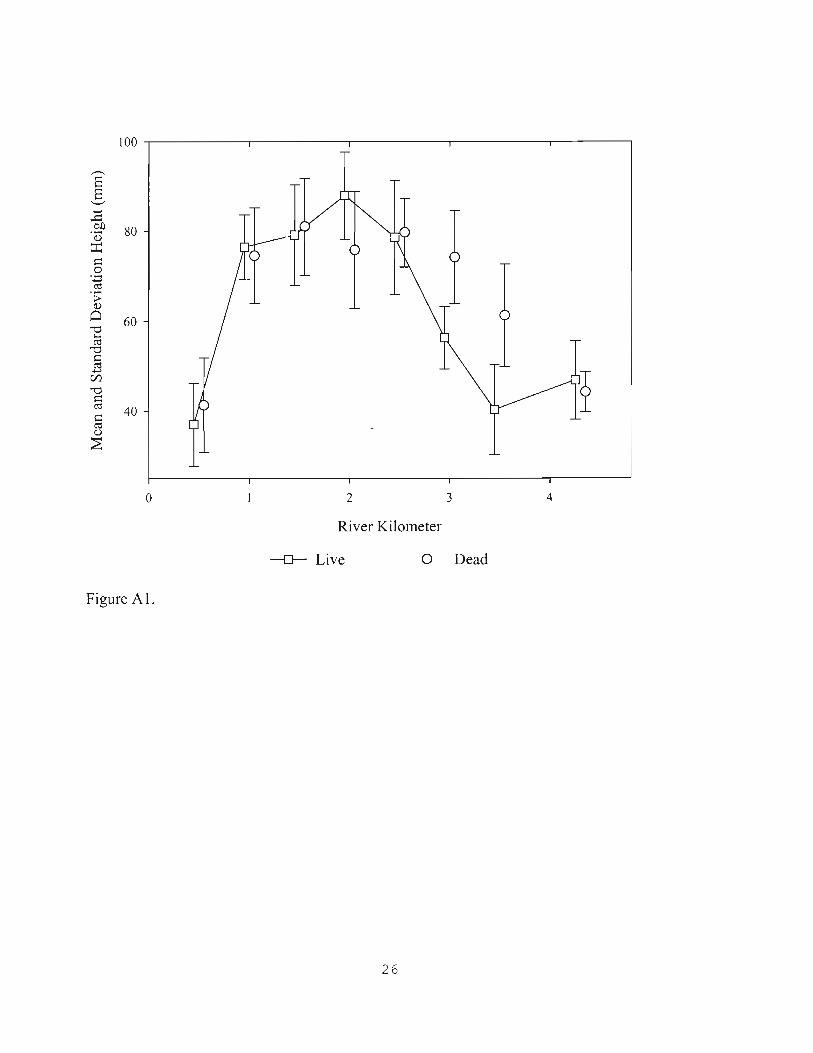
Figures A 1 and A2 depict means and standard deviations of live and dead oyster heights, and box-and-whisker plots of data distributions, respectively.
Mean heights are lowest at RK O.S near Venice Inlet, and at RK 3.S to 4.3 in Shakett Creek (Figure AI). Mean values are highest at RK 1.0 to 2.S but differ between live and dead material. Largest dead oysters occur from RK 1.0 to 3.0 whereas largest live oysters occur over a shorter range, from RK 1.0 to 2.S with a peak value at RK 2.0. More large dead oysters occur farther upstream in Shakett Creek, than do large live ones.
Figure A2 depicts data distribution as percentiles-- st\ 10th ,2Sth ,SOth (median),7Sth, 90th , and 9Sth .
DISCUSSION
Oyster sizes assessed by this method tend to identify upstream and downstream reaches where suboptimal oyster conditions exist. In high salinity water near Venice Inlet, small oyster size may be related to limited food supply, higher salinity, and mortality caused by marine parasites, diseases, and predators. In low salinity reaches, small oyster size may be caused by mortality resulting from prolonged exposure to fresh water, oxygen stress, or poor recruitment.
The RK "footprint" of large dead oysters is larger than for live oysters, signifying that favorable conditions for oysters have existed over a longer reach of the study area than has existed for the few years since the largest living oysters have matured. Jones (2004) observed that the most live beds and robust oysters of2003 occurred between RK 2.1-3.3, which includes part of but was also upstream of the optimal zone identified in the 2006 survey. This
24
difference is consistent with the finding that larger dead oysters occun'ed farther upstream than live ones in 2006,
CONCLUSION AND RECOMMENDA nON
The present study adds spatial detail to the organization and condition of oyster resources in Dona Bay and Shakett Creek. The pattern oflargest live and dead oyster heights is comparable to that seen in other coastal rivers sampled by the same method, and depicts two common findings: that a central reach of largest oysters occurs between reaches with smaller animals; and that the reach oflarge dead material is longer than that for large live material. Over an antecedent period of unknown length, and also for the past few years, optimal oyster conditions have occurred between RK 1.0 to 3.0.
Further study of surface water quality data near and upstream of RK 3.0 should be undertaken by other members of the DBWMP team to identify conditions that may be depressing oyster success.
REFERENCES
Culter, 1.K., Estevez, E.D., Sprinkel, 1., Leverone, 1. , Baird, A., Osterhoudt, 1. and D. Ingrao. 200 I. An investigation of relationships between freshwater inflows and benthic macroinveliebrates in the Alafia River estuary. Mote Marine Laboratory Technical Report no.773.
Estevez, E.D. 1990. Environmental studies of the tidal Loxahatchee River / Palm Beach and Martin Counties, Florida. Mote Marine Laboratory Technical Report no.181.
Estevez, E.D. 2005. Molluscan Bioindicators of the Tidal Myakka River and Inshore Waters of Venice, Florida. Mote Marine Laboratory Technical Report No. 990.
Jones, M. 2004. Dona and Robert's Bay Estuary Analysis. Sarasota County Environmental Services.
Jones, M. 2005. Dona and Robert's Bay Second Annual Watershed and Estuary Report: 2004. Sarasota County Environmental Services.
Lindland, E., C. Burt, 1. Edlin, M. Elkins, 1. Leavor, 1. Mallon, M. Myers, S. Obley, M. Savarese, and G. A. Goodfriend. 200 l. Time averaging on oyster reefs: implications for environmental reconstruction and historical change. Geological Society of America 33(2):A74.
25
100
,-.., E E
"-" ...... ..c: on 80 .Q)
::r: I=l .S ...... ro .......
;>-<l)
Q 60 "0 '-' ro
I~ "0 I=l ro ......
r:/)
"0 I=l ro 40 I=l ro <l)
~
o 2 3 4
River Kilometer
-cr Live o Dead
Figure AI.
26

• • • • \00
• •
D •
,.-.,
~ • § 80
'-" ...... ...s::: OJ)
. ~ •
~ ~ • • • I-< 60 • (1) • ...... • (J:l • » • 0
~ 40 • •
• 20 ~
0.5 1.0 1.5 2.0 2.5 3.0 3.5 4.3
River Kilometer
~ Live ~Dead
Figure A2.
27