domestic trade and services -...
TRANSCRIPT

The State of Hawaii Data Book 2001 http://www.state.hi.us/dbedt/
Section 23
DOMESTIC TRADE AND SERVICES This section presents statistics relating to retail and wholesale trade; hotels; and selected personal, business, automotive, repair, and amusement services, including the motion picture industry. Related data are included in Sections 7, 12, 14 and 15. The major sources of these data are the U.S. Census Bureau, 1997 Economic Census, Geographic Area Series, Retail Trade, Wholesale Trade, and all others relating to the services industry. Statistics on the retailing, wholesaling, and services tax bases are available from the Hawaii State Department of Taxation. Data on hotel room counts, occupancy and other characteristics are published by the Hawaii State Department of Business, Economic Development & Tourism's Tourism Research Branch. The Film Industry Branch of the Hawaii State Department of Business, Economic Development & Tourism compiles data on motion picture and television production. A summary of figures on trade and services in earlier years appears in Historical Statistics of Hawaii, Section 20. The Statistical Abstract of the United States: 2001, Section 22 and 27, presents similar data for other states and the nation as a whole.

Table 23.01-- GENERAL EXCISE TAX BASE FOR TRADE AND SERVICE ACTIVITIES: 1985 TO 2001
[In thousands of dollars. Data are on a cash basis accounting]
Year reported 1/ Retailing Services 2/
Amusement, etc. 3/
Intermediary services Wholesaling
1985 8,499,254 2,481,669 154,830 116,300 4,095,2201986 9,239,373 2,784,169 159,881 127,992 4,443,1661987 9,449,673 2,896,159 157,824 148,557 5,188,2151988 10,385,974 3,287,715 165,729 182,138 5,683,8151989 11,607,779 3,699,003 184,154 189,018 6,595,5691990 12,827,883 4,276,876 201,003 349,111 7,494,3301991 13,398,382 4,888,164 209,128 451,078 7,722,7521992 13,846,332 5,032,682 229,091 247,850 7,498,6211993 13,976,048 5,092,654 226,443 218,173 7,646,2151994 14,569,798 5,270,844 238,195 265,755 7,622,3661995 15,050,113 5,351,079 233,843 264,193 7,808,1031996 16,091,429 5,618,027 246,232 292,250 8,153,1551997 15,973,955 5,414,691 229,802 283,064 8,101,8941998 15,730,858 5,545,001 232,288 320,845 8,030,4481999 15,957,379 5,647,648 220,959 298,815 8,059,2602000 17,453,936 6,045,695 253,484 378,574 9,082,5852001 17,823,297 6,426,452 249,098 322,183 9,171,140
1/ Calendar year in which reported, including "prior years" reports. Income received in December is reported the following January, hence these annual totals generally refer to an "income year" ended November 30. 2/ Includes both business and professional services but excludes hotels, theater, amusement, broadcasting,and intermediary services. 3/ Theater, amusement, broadcasting, etc. Source: Hawaii State Department of Taxation, "General Excise and Use Tax Base" (annual tabular release).
The State of Hawaii Data Book 2001 http://www.state.hi.us/dbedt/

Table 23.02-- RETAIL ESTABLISHMENTS, BY PAYROLL STATUS: 1972 TO 1997
[Coverage has differed somewhat from census to census]
Number of establishments Sales (million dollars)
Year TotalWith
payrollWithout payroll Total
With payroll
Without payroll
old definition:1972 6,392 4,491 1,901 1,865 1,820 45 1977 7,388 5,273 2,115 3,294 3,223 71 1982 8,917 6,139 2,778 5,193 5,102 92 1987 11,143 7,195 3,948 8,267 8,084 183 1992 13,185 7,807 5,378 11,510 11,250 260 1997 17,478 7,860 9,618 13,638 13,299 339 new definition:1997 1/ 14,098 5,088 9,010 11,628 11,318 310
1/ Excludes foodservices (eating and drinking places), included in earlier censuses. Source: U.S. Bureau of the Census, 1972 Census of Retail Trade, Hawaii, RC72-A-12 (July 1974), table 1;1977 Census of Retail Trade, Hawaii, RC77-A-12 (June 1979), table 1; 1982 Census of Retail Trade, Hawaii,RC82-A-12 (September 1984), table 1; 1987 Census of Retail Trade, Hawaii, RC87-A-12 (May 1989), table 1,and Nonemployer Statistics Series, West, RC87-N-4 (February 1990), table 2; 1992 Census of Retail Trade,Hawaii, RC92-A-12 (October 1994), table 1, and Nonemployer Statistics Series, Summary, RC92-N-1 (February 1995), table 3; 1997 Economic Census, Retail Trade, Hawaii , EC97R44A-HI (November 1999), table 1; 1997 Economic Census Accomodation and Foodservices , EC97R72A-HI (October 1999), table 1; and 1997 Economic Census, Nonemployer Statistics , EC97X-CS4 (January 2001), table 2.
The State of Hawaii Data Book 2001 http://www.state.hi.us/dbedt/

Table 23.03-- FOODSERVICES & DRINKING PLACES (NAICS 722)BY TYPE OF SERVICE: 1997
NAICS code Type of service
Establish-ments
(number)Sales
($1,000)
Employees, week
including March 12
Annual payroll ($1,000)
722 Foodservices & drinking places 2,772 1,980,996 47,978 555,115 7221 Full-service restaurants 1,207 1,002,421 25,170 309,458 7222 Limited-service eating places 1,185 723,521 17,988 178,691 7223 Special foodservices 96 162,149 2,846 46,009 72231 Foodservice contractors 51 142,848 2,267 40,228 72232 Caterers 22 12,597 447 4,173 72233 Mobile foodservices 23 6,704 132 1,608 7224 Drinking places 284 92,905 1,974 20,957
Source: U.S. Bureau of the Census, 1997 Economic Census, Accommodation and Foodservices, Geographic Area Series EC97R72A-HI (October 1999), p. 7.
The State of Hawaii Data Book 2001 http://www.state.hi.us/dbedt/

Table 23.04-- CHARACTERISTICS OF RETAIL ESTABLISHMENTS (NAICS 44-45) WITH PAYROLL, BY BROAD GEOGRAPHIC AREAS: 1997
[Excludes establishments without payroll and all establishments operated by the armed forces]
SubjectState total Oahu
Other Islands
Number of establishments 5,088 3,269 1,819 Sales ($1,000) 11,317,752 8,264,716 3,053,036 Annual payroll ($1,000) 1,161,805 823,553 338,252 First quarter payroll ($1,000) 281,093 199,128 81,965 Paid employees for pay period including March 12 64,218 44,960 19,258
Source: U.S. Bureau of the Census, 1997 Economic Census, Retail Trade, Hawaii, EC97R44A-HI (November 1999), tables 1, 2.
The State of Hawaii Data Book 2001 http://www.state.hi.us/dbedt/

Table 23.05-- RETAIL ESTABLISHMENTS (NAICS 44-45) WITH PAYROLL, FOR COUNTIES AND SELECTED URBAN PLACES: 1997
[Excludes establishments without payroll and establishments operated by the armed forces]
Geographic areaNumber of
establishmentsSales
($1,000)
Annual payroll ($1,000)
Paid employees for pay period
including March 12
State total 5,088 11,317,752 1,161,805 64,218
Hawaii County 688 1,183,054 128,529 7,587 Captain Cook 7 8,266 671 36 Hilo 261 552,226 63,033 3,696 Holualoa 10 3,298 215 19 Kailua 180 347,694 34,911 1,930
Honolulu County 3,269 8,264,716 823,553 44,960 Aiea 140 311,300 35,589 2,539 Ewa Beach 17 34,770 3,766 194 Halawa 9 5,795 1,128 55 Honolulu 2,258 5,483,510 534,745 27,812 Kailua 104 227,863 27,505 1,758 Kaneohe 137 371,808 37,739 2,171 Laie 7 15,088 1,857 136 Maunawili 7 6,186 559 34 Mililani Town 50 176,798 19,549 1,181 Nanakuli 12 27,729 2,325 148 Pearl City 50 239,662 18,809 1,062 Wahiawa 43 85,223 9,703 500 Waialua 12 4,635 591 63 Waianae 23 67,704 7,621 427 Waimalu 84 251,665 27,022 1,259 Waimanalo 11 12,513 1,361 86 Waipahu 119 378,262 39,561 1,908
Kauai County 326 510,684 59,002 3,427 Kalaheo 10 8,415 900 70 Kapaa 86 106,699 12,065 712 Lihue 102 238,693 27,520 1,490
Maui County 805 1,359,298 150,721 8,244 Haiku-Pauwela 7 4,325 483 30 Island of Lanai 7 7,656 1,098 55 Island of Molokai 1/ 15 28,391 3,441 196
Continued on next page.
The State of Hawaii Data Book 2001 http://www.state.hi.us/dbedt/

Table 23.05-- RETAIL ESTABLISHMENTS (NAICS 44-45) WITH PAYROLL, FOR COUNTIES AND SELECTED URBAN PLACES: 1997 -- Con.
Geographic areaNumber of
establishmentsSales
($1,000)
Annual payroll ($1,000)
Paid employees for pay period
including March 12
Maui County - Con. Kahului 203 583,649 59,310 3,405 Kihei 82 123,551 12,785 720 Lahaina 242 299,657 37,875 1,873 Makawao 24 10,241 1,389 108 Napili-Honokowai 9 12,195 1,173 62 Pukalani 10 35,689 3,756 197 Wailea-Makena 22 20,371 2,487 162 Wailuku 64 107,198 12,027 604
1/ Sales, payroll, and paid employess are for the 14 retail establishments in Kaunakakai. Source: U.S. Bureau of the Census, 1997 Economic Census, Retail Trade, Hawaii, EC97R44A-HI (November 1999); table 1,3, and 4.
The State of Hawaii Data Book 2001 http://www.state.hi.us/dbedt/

Table 23.06-- RETAIL ESTABLISHMENTS WITH PAYROLL, BY KIND OF BUSINESS: 1997
[Excludes establishments without payroll. Also excludes establishments operated by the armed forces]
NAICS code Kind of business
Number of establish-
mentsSales
($1,000)
Annual payroll ($1,000)
Paid employ-ees 1/
44-45 Retail trade 5,088 11,317,752 1,161,805 64,218
441 Motor vehicle and parts dealers 313 1,761,391 167,121 5,739 442 Furniture and home furnishing stores 194 194,421 29,622 1,393 443 Electronic's and appliance stores 168 236,489 24,169 1,345 444 Building material, garden equipment 278 676,787 78,874 3,127 445 Food and beverage stores 699 1,989,435 210,465 12,269 446 Health and personal care stores 309 764,851 88,198 3,866 447 Gasoline stations 360 728,210 56,679 3,884 448 Clothing and accessory stores 1,389 1,751,735 192,240 11,409 451 Sporting goods, hobby, book,
and music stores 369 376,741 44,730 3,254 452 General merchandise stores 136 2,273,713 185,352 12,586 453 Miscellaneous store retailers 764 468,002 68,703 4,706 454 Nonstore retailers 109 95,977 15,652 640
1/ For pay period including March 12. Source: U.S. Bureau of the Census, 1997 Economic Census, Retail Trade, Hawaii, EC97R44A-HI(November 1999), table 1.
The State of Hawaii Data Book 2001 http://www.state.hi.us/dbedt/

Table 23.07-- PRIVATE INDUSTRY RETAIL EMPLOYMENT AND WAGES, ANNUAL AVERAGES: 2000
SIC code Retail trade
No. of establish-
ments
Average employ-
ment
Total wages
($1,000)Average
wage
Total 7,439 115,379 2,103,475 18,231
5231 Paint, glass, and wallpaper stores 13 129 4,617 35,721 5251 Hardware stores 51 1,397 31,614 22,634 5311 Department stores 60 10,963 209,323 19,094 5331 Variety stores 18 276 5,138 18,598 5399 Misc. general merchandise stores 56 525 7,719 14,693 5411 Grocery stores 382 11,139 222,154 19,944 5421 Meat and fish markets 48 335 5,955 17,797 5441 Candy, nut, and confectionery stores 38 256 2,979 11,644 5461 Retail bakeries 125 1,206 17,335 14,380 5499 Misc. food stores 96 853 12,658 14,838 5511 New and used car dealers 76 3,939 167,628 42,560 5521 Used car dealers 20 124 5,351 43,065 5531 Auto and home supply stores 182 1,669 39,997 23,963 5541 Gasoline service stations 267 3,202 52,674 16,450 5551 Boat dealers 18 96 2,038 21,250 5571 Motorcycle dealers 22 179 5,278 29,571 5611 Men's and boys' clothing stores 55 616 9,139 14,842 5621 Women's clothing stores 254 2,152 38,221 17,762 5632 Women's accessory and specialty stores 87 593 14,183 23,921 5641 Children's and infants' wear stores 19 130 1,479 11,405 5651 Family clothing stores 112 2,216 36,176 16,325 5661 Shoe stores 95 1,075 20,250 18,832 5699 Misc. apparel and accessory stores 181 1,390 21,250 15,290 5712 Furniture stores 90 709 21,523 30,349 5713 Floor covering stores 29 276 8,564 30,991 5714 Drapery and upholstery stores 13 24 636 26,506 5719 Misc. homefurnishing stores 40 361 5,678 15,741 5722 Household appliance stores 39 237 6,244 26,364 5731 Radio, TV, and electronic stores 87 678 14,962 22,073 5734 Computer and software stores 41 475 14,177 29,877 5735 Record and prerecorded tape stores 35 396 4,989 12,600 5736 Musical instrument stores 17 112 2,187 19,471 581 Eating and drinking places 2,766 50,137 692,864 13,819 5912 Drug stores and proprietary stores 160 3,861 105,998 27,452 5932 Used merchandise stores 72 361 5,630 15,577 5941 Sporting goods and bicycle shops 164 1,250 21,667 17,330 5942 Book stores 62 752 11,402 15,166
Continued on next page.
The State of Hawaii Data Book 2001 http://www.state.hi.us/dbedt/

Table 23.07-- PRIVATE INDUSTRY RETAIL EMPLOYMENT AND WAGES, ANNUAL AVERAGES: 2000 - Con.
SIC code Retail trade
No. of establish-
ments
Average employ-
ment
Total wages
($1,000)Average
wage
5943 Stationery stores 29 195 4,065 20,893 5944 Jewelry stores 360 2,183 59,930 27,452 5945 Hobby, toy, and game shops 33 406 5,280 13,015 5946 Camera and photographic supply stores 6 27 564 20,623 5947 Gift, novelty, and souvenir shops 352 3,459 72,697 21,017 5948 Luggage and leather goods stores 29 391 12,326 31,566 5949 Sewing, needlework, and piece goods 22 253 3,486 13,761 5963 Direct selling establishments 48 181 4,471 24,679 5992 Florists 119 634 8,364 13,186 5995 Optical goods stores 51 304 6,829 22,470 5999 Misc. retail stores, not elsewhere classified 309 1,772 41,851 23,617
Source: U.S. Department of Labor, Employment and Wages Annual Averages (annnual).
The State of Hawaii Data Book 2001 http://www.state.hi.us/dbedt/

Table 23.08-- RETAIL TRADE AND FOOD SERVICES SALES, BY TYPE OF STORE: 2000
[In millions of dollars; data are estimates]
Kind of store NAICS code 1/ 2000
All stores 2/ 11,902 Total Retail sales and food and drink 13,915
Motor vehicle and parts dealers 441 2,265 Furniture and home furnishings 442 192 Electronics and appliances 443 213 Building and material supply 444 660 Food and beverage stores 445 2,179 Health and personal care 446 854 Gasoline service stations 447 687 Clothing and accessories 448 1,578 Sporting goods, hobby, book, & music stores 451 362 General merchandise 452 2,344 Miscellaneous store 453 482 Nonstore retailers 454 86 Food services & drinking establishments 722 2,013
1/ Datatable has been altered from previous year, table no longer use SIC code for classification purposes. 2/ Includes other types of stores, not shown separately. Source: Market Statistics (a division of Claritas Inc., Arlington VA), estimates cited in Statistical Abstractof the United States: 2001, pp. 646-647.
The State of Hawaii Data Book 2001 http://www.state.hi.us/dbedt/

Table 23.09-- CHARACTERISTICS OF MAJOR SHOPPING CENTERS: 1998
[Includes all centers on Oahu with more than 250,000 square feet of gross leaseable area and all centers on other islands with more than 150,000 square feet]
Island and name of center LocationYear
opened
Site area
(acres)
Gross leaseable
area (1,000 square
feet)Parking spaces
Number of stores
Oahu: Ala Moana Center Honolulu 1959 50 1,500 7,800 200 Kahala Mall Honolulu 1970 20 407 1,800 86 Koko Marina S.C. Honolulu 1963 15 281 855 68 Mililani Town Center Mililani 1988 45 434 1,675 85 Moanalua S.C. Honolulu 1952 15 250 500 50+ Pearl City S.C. Pearl City 1967 14 252 837 34 Pearl Highlands Center Pearl City 1993 13 410 1,847 20 Pearlridge Center Aiea 1972 56 1,400 6,600 170 Royal Hawaiian S.C. Honolulu 1980 7 280 614 150 Waikele Center Waipahu 1993 42 522 2,162 25 Windward Mall S.C. Kaneohe 1982 32 530 2,300 100
Hawaii: Kaiko'o Mall S.C. Hilo 1970 15 220 950 33 Keauhou Shopping Center Kailua 1984 22 170 893 48 Pines Plaza Kailua 1992 1 161 64 (NA) Prince Kuhio Plaza Hilo 1985 46 506 2,831 75 Waiakea Center Hilo 1997 18 229 1,157 16
Maui: Apex Building Kahului 1995 11 281 146 (NA) Kaahumanu Center Kahului 1972 32 573 2,864 102 Lahaina Market Place Lahaina 1969 2 208 16 17 Maui Mall Kahului 1972 27 191 1,272 48 Maui Marketplace Kahului 1997 20 315 1,400 25
Kauai: Kukui Grove Center Lihue 1982 49 461 2,552 64 Poipu Shopping Village Koloa 1985 4 378 182 34
NA Not available. Source: International Council of Shopping Centers, Hawaii Chapter, Hawaii Shopping CenterDirectory 1998.
The State of Hawaii Data Book 2001 http://www.state.hi.us/dbedt/

Table 23.10-- CHARACTERISTICS OF SHOPPING MALLS: 1997 TO 2000
Subject 1997 1998 1999 2000
Number of shopping centers 186 186 188 194 Leasable retail area (million square feet) 19.4 19.4 19.6 20.2 Adults shopping in centers (Monthly in millions) 0.8 0.8 0.8 1/ 0.8 Retail sales (billions of dollars) 3.34 3.37 3.54 3.75
1/ Hawaii ranked 41st among the 50 states.Source: The Honolulu Advertiser , June 3, 2001, p.G1.
The State of Hawaii Data Book 2001 http://www.state.hi.us/dbedt/

Table 23.11-- SHOPPING CENTER CHARACTERISTICS: 1997 TO 2000
Characteristic 1997 1998 1999 2000
Number 182 182 184 190 Gross leasable area (mil. sq. ft.) 19 19 20 20 Retail sales (bil. dol.) 3.9 4.2 4.6 5.1
Source: Statistical Abstract of the United States: 2001 (p. 656) and earlier editions.
The State of Hawaii Data Book 2001 http://www.state.hi.us/dbedt/

Table 23.12-- CHARACTERISTICS OF EATING AND DRINKING PLACES: 1997
SubjectFull- service restaurants
Limited-service
restaurants CafeteriasDrinking Places
Establishments in business at end of year 1,168 926 8 266 Sales, calendar year (million dollars) 1002.4 653.7 2.8 92.9 Seats, Dec. 31 98,059 28,190 453 16,278
Average cost per meal (establishments): Less than $5.00 134 356 3 ... $30.00 or more 54 - - ...
Menu type or specialty (establishments): Italian 41 6 - ... Mexican 29 46 - ... Chinese 246 43 - ... Other ethnic 408 153 - ... Seafood 61 2 - ... Steak 22 11 - ... Pizza 50 258 - ... Chicken - 46 - ... Hamburger 1 216 - ... Sub shop 6 41 - ... Other food specialty 15 38 - ... American 328 111 8 ...
Source: U.S. Census Bureau, 1997 Economic Census, Miscellaneous Subjects, EC97R72S-SB(RV)(December 2000), pp. 25, 43, 53-54.
The State of Hawaii Data Book 2001 http://www.state.hi.us/dbedt/

Table 23.13-- DUTY-FREE STORE REVENUES: 1985 TO 2001
[In dollars. These sales revenues are not included in the general excise and use tax base data cited elsewhere in this volume]
Year Revenues Year Revenues
1985 180,126,919 1994 413,417,5551986 270,891,959 1995 419,548,5141987 369,788,429 1996 425,824,7481988 445,072,755 1997 355,636,3551989 451,185,041 1998 271,692,7981990 413,932,037 1999 192,429,7721991 378,587,469 2000 229,392,9001992 421,953,644 2001 215,257,1931993 397,322,968
Source: DFS Hawaii, records, for 1995-2001 data Hawaii State Department of Transportation, Airport Division records.
The State of Hawaii Data Book 2001 http://www.state.hi.us/dbedt/

Table 23.14-- ALCOHOLIC BEVERAGE SALES, BY TYPE: 1999 TO 2001
Wine gallons of 128 fluid ounces
Category 1999 2000 2001
Wholesale value, 2001
(dollars)
All types 32,933,885 33,707,562 33,773,901 340,352,839
Distilled spirits 1,337,880 1,434,126 1,467,944 65,662,179 Sparkling wine 259,422 208,264 214,201 11,529,851 Still wine 2,715,869 2,793,299 2,824,342 85,801,306 Cooler beverage 216,118 206,902 229,674 3,054,167 Draft beer 1,735,885 1,927,724 1,976,106 8,846,862 Beer other than draft 26,668,711 27,137,247 27,061,634 165,458,474
Source: Hawaii State Department of Taxation, Tax Research and Planning, records.
The State of Hawaii Data Book 2001 http://www.state.hi.us/dbedt/

Table 23.15-- MERCHANDISE LINE SALES FOR RETAIL TRADE IN HAWAII: 1997
Sales of specified merchandise line
As percent of total sales of --
Merchan-dise line
codeKind of business and
merchandise line
Number of
establish-ments
Amount ($1,000)
Establish-ments
handling line
All establish-
ments
Retail trade 5,088 11,317,752 (X) 100.0
100 Groceries and other food items 1,298 1,910,787 40.1 16.9 120 Meals and snacks 430 119,935 6.0 1.1 140 Packaged alcoholic beverages 743 280,830 7.1 2.5 150 Cigars, cigarettes, and tobacco 976 193,535 4.3 1.7 160 Drugs, health aids, and beauty aids 1,035 776,494 14.7 6.9 180 Soaps, detergents, and household
cleaners 547 95,687 2.7 0.8 190 Paper and related products 634 117,699 3.3 1.0 200 Men's wear 931 468,259 13.0 4.1 220 Women's, juniors', and misses' wear 1,113 936,203 24.7 8.3 240 Children's wear 511 139,497 6.9 1.2 260 Footwear 773 298,683 8.6 2.6 270 Sewing, knitting, and needlework
goods 154 21,438 2.1 0.2 280 Curtains, draperies, and dry goods 185 63,319 3.9 0.6 300 Major household appliances 106 92,644 21.1 0.8 310 Small electric appliances 180 30,988 1.3 0.3 320 Televisions, video equipment,
videotapes 217 67,820 5.4 0.6 330 Audio equipment, musical
instruments and supplies 320 119,940 10.2 1.1 340 Furniture and sleep equipment 214 125,314 12.4 1.1 360 Floor coverings 94 60,348 14.3 0.5 370 Computer hardware, software, and
supplies 112 124,338 28.2 1.1 380 Kitchenware and homefurnishings 609 132,298 3.7 1.2 400 Jewelry 1,056 498,437 12.6 4.4 420 Books 404 89,691 3.7 0.8 440 Photographic equipment and
supplies 247 33,259 1.5 0.3 460 Toys, hobby goods, and games 453 116,057 3.8 1.0 490 Optical goods 278 45,595 5.0 0.4
Continued on next page.
The State of Hawaii Data Book 2001 http://www.state.hi.us/dbedt/

Table 23.15-- MERCHANDISE LINE SALES FOR RETAIL TRADE IN HAWAII: 1997 -- Con.
Sales of specified merchandise line
As percent of total sales of --
Merchan-dise line
codeKind of business and
merchandise line
Number of
establish-ments
Amount ($1,000)
Establish-ments
handling line
All establish-
ments
500 Sporting goods 406 163,942 6.8 1.4 600 Hardware, tools, and plumbing and
electrical supplies 385 294,216 9.2 2.6 620 Lawn and garden equipment 449 150,684 5.3 1.3 640 Lumber, millwork, building materials 168 204,318 46.0 1.8 670 Paint and related preservatives and
supplies 153 71,393 12.9 0.6 690 Wallpaper 14 596 2.5 0.0 700 Cars, vans, trucks, and other
powered vehicles 96 1,274,548 84.4 11.3 720 Automotive fuels 380 538,555 70.4 4.8 730 Automotive lubricants 590 39,541 1.2 0.3 740 Automotive tires, batteries,
accessories 483 312,323 13.0 2.8 780 Household fuels 44 34,238 32.0 0.3 800 Pets, pet foods, and pet supplies 341 64,066 2.6 0.6 850 All other merchandise 1,749 699,275 12.5 6.2
9810 All other merchandise 754 193,773 6.2 1.7 9900 Nonmerchandise receipts 958 316,673 7.5 2.8
X Not applicable. Source: U.S. Census Bureau, Economic Census 1997, extracted from American FactFinder from Census Bureau website, E9744L1.MBD: Retail Trade: Merchandise Lines by Kind of Business: 1997 (Table 1).
The State of Hawaii Data Book 2001 http://www.state.hi.us/dbedt/

Table 23.16-- WHOLESALE TRADE ESTABLISHMENTS AND SALES: 1939 TO 1997
[Based on then-current definition]
YearNumber of
establishmentsSales
($1,000) YearNumber of
establishmentsSales
($1,000)
1939 704 97,045 1972 1,336 1,538,4291948 702 480,734 1977 1,569 2,571,4891954 594 581,940 1982 1,737 4,084,3691958 793 618,155 1987 1,998 5,362,4901963 974 735,205 1992 2,202 8,001,6211967 1,030 1,013,813 1997 1,872 7,147,462
Source: Robert C. Schmitt, Historical Statistics of Hawaii (1977), table 20.7; U.S. Census Bureau, 1977 Census of Wholesale Trade, WC77-A-12 (Rev.), 1982 Census of Wholesale Trade, WC82-A-12, 1987 Census of Wholesale Trade, WC87-A-12, and 1992 Census of Wholesale Trade, WC92-A-12, 1997 EconomicCensus, Wholesale Trade, Hawaii, EC97W42A-HI(RV) (March 2000), table1.
The State of Hawaii Data Book 2001 http://www.state.hi.us/dbedt/

Table 23.17-- CHARACTERISTICS OF WHOLESALE ESTABLISHMENTS (NAICS 42), BY BROAD GEOGRAPHIC AREAS: 1997
Subject State total Oahu Neighbor Islands
Number of establishments 1,872 1,463 409 Sales ($1,000) 7,147,462 6,079,891 1,067,571 Annual payroll ($1,000) 575,955 486,975 88,980 First quarter payroll ($1,000) 138,454 117,329 21,125 Paid employees for pay period including March 12 (number) 18,532 15,423 3,109 Operating expenses ($1,000) 1,213,543 1,017,689 195,854 Inventories ($1,000): Beginning of year 691,610 604,482 87,128 End of year 734,465 642,470 91,995
Source: U.S. Census Bureau, 1997 Economic Census, Wholesale Trade, Geographic Area Series, Hawaii, EC97W42A-HI(RV) (March 2000), table 1 and 5.
The State of Hawaii Data Book 2001 http://www.state.hi.us/dbedt/

Table 23.18-- WHOLESALE TRADE, BY TYPE OF OPERATION AND KIND OF BUSINESS: 1997
NAICS codes
Type of operation and kind of business
Number of establish-
mentsSales
($1,000)
Annual payroll ($1000)
Paid employees, pay period including March 12
42 Wholesale trade 1,872 7,147,462 575,955 18,532
Type of operation: Merchant wholesalers 1,606 5,088,686 473,494 15,934 Manufacturers' sales branches and sales offices 108 1,369,799 80,676 1,829 Agents, brokers, and commission merchants 158 688,977 21,785 769
Kind of business: 4211 Motor vehicles and motor vehicle
parts and supplies 59 299,862 18,818 738 4212 Furniture and homefurnishings 60 112,853 11,496 415 4213 Lumber and other construction 4213 materials 53 175,511 14,784 405 4214 Professional and commercial
equipment and supplies 152 549,838 76,398 1,840 4215 Metals and minerals, except
petroleum 29 63,686 8,448 246 4216 Electrical goods 112 350,849 35,000 930 4217 Hardware, and plumbing and
heating equipment and supplies 76 132,140 17,209 511 4218 Machinery, equipment, and supplies 141 271,903 42,255 1,220 4219 Miscellaneous durable goods 207 265,527 26,884 1,034 4221 Paper and paper products 76 274,118 28,497 923 4222 Drugs, drug proprietaries, and
druggists' sundries 58 501,086 23,380 668 4223 Apparel, piece goods, and notions 156 284,985 24,818 1,006 4224 Groceries and related products 381 2,188,753 152,857 5,663 4225 Farm-product raw materials 9 11,733 1,182 70 4226 Chemicals and allied products 49 106,947 11,425 339 4227 Petroleum and petroleum products 43 898,052 22,372 518 4228 Beer, wine, and distilled alcoholic
beverages 31 354,613 31,352 816 4229 Miscellaneous nondurable goods 180 305,006 28,780 1,190
Source: U.S. Census Bureau, 1997 Economic Census, Wholesale Trade, Geographic Area Series, Hawaii, EC97W42A-HI(RV) (March 2000), table 1.
The State of Hawaii Data Book 2001 http://www.state.hi.us/dbedt/

Table 23.19-- WHOLESALE TRADE, FOR COUNTIES AND SPECIFIED PLACES: 1997
All wholesalers Merchant wholesalers
Geographic areaNumber of
establishmentsSales
($1,000) Number of
establishmentsSales
($1,000)
State total 1,872 7,147,462 1,606 5,088,686
Hawaii County 179 457,317 156 367,182 Hilo 87 314,200 75 240,104 Kailua 34 60,574 32 (D)
Honolulu County 1,463 6,079,891 1,244 4,215,679 Aiea 70 293,347 60 229,327 Ewa Beach 11 352,507 7 (D) Halawa 10 4,554 10 4,554 Honolulu 1,114 4,537,499 950 2,987,420 Kailua 26 58,412 17 27,758 Kaneohe 22 23,091 17 13,278 Mililani Town 14 37,540 12 (D) Pearl City 37 176,063 33 (D) Wahiawa 5 5,005 5 5,005 Waimalu 18 10,026 15 (D) Waipahu 60 364,737 54 356,431
Kauai County 64 176,689 55 (D) Lihue 35 112,582 29 (D)
Maui County 166 433,565 151 (D) Island of Lanai 2 (D) 1 (D) Kaunakakai 4 3,308 4 3,308 Makawao 7 4,816 6 (D) Kahului 54 205,784 50 193,860 Kihei 10 15,910 10 15,910 Lahaina 9 6,009 8 (D) Wailuku 45 126,858 42 (D)
D Withheld to avoid disclosing data for individual companies. Source: U.S. Census Bureau, 1997 Economic Census, Wholesale Trade, Hawaii, EC97W42A-HI(RV)(March 2000), table 5 and 7.
The State of Hawaii Data Book 2001 http://www.state.hi.us/dbedt/
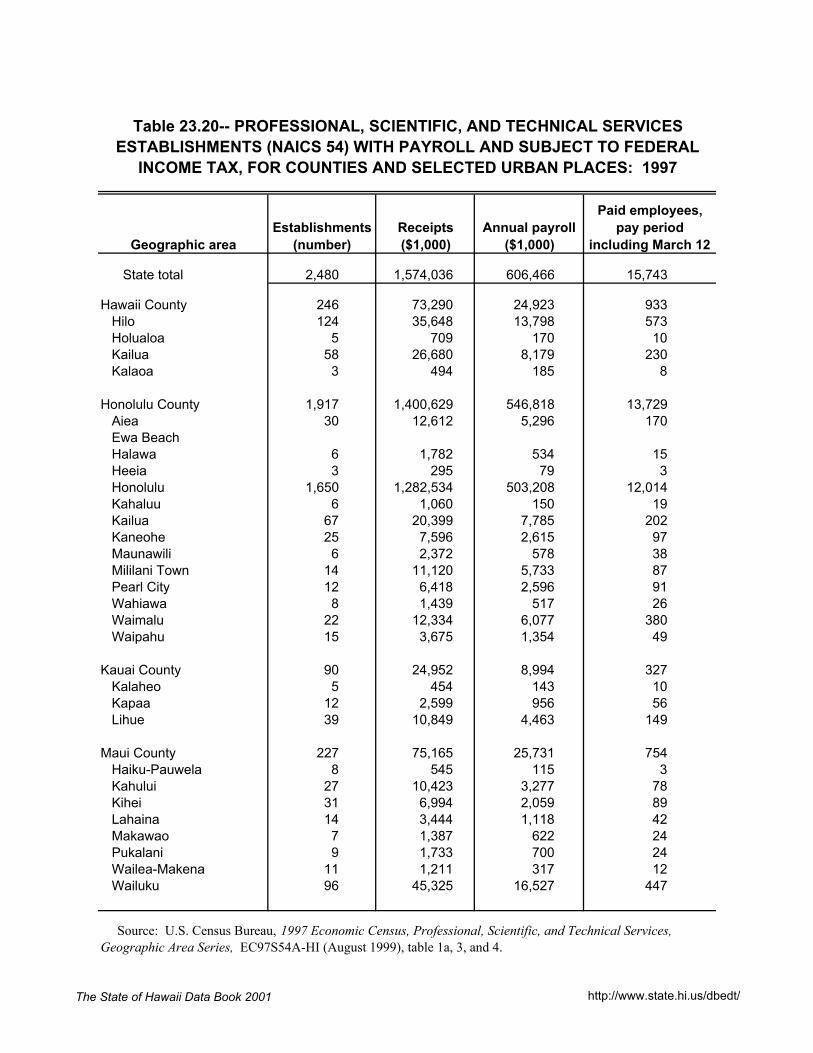
Table 23.20-- PROFESSIONAL, SCIENTIFIC, AND TECHNICAL SERVICES ESTABLISHMENTS (NAICS 54) WITH PAYROLL AND SUBJECT TO FEDERAL
INCOME TAX, FOR COUNTIES AND SELECTED URBAN PLACES: 1997
Geographic areaEstablishments
(number)Receipts ($1,000)
Annual payroll ($1,000)
Paid employees, pay period
including March 12
State total 2,480 1,574,036 606,466 15,743
Hawaii County 246 73,290 24,923 933 Hilo 124 35,648 13,798 573 Holualoa 5 709 170 10 Kailua 58 26,680 8,179 230 Kalaoa 3 494 185 8
Honolulu County 1,917 1,400,629 546,818 13,729 Aiea 30 12,612 5,296 170 Ewa Beach Halawa 6 1,782 534 15 Heeia 3 295 79 3 Honolulu 1,650 1,282,534 503,208 12,014 Kahaluu 6 1,060 150 19 Kailua 67 20,399 7,785 202 Kaneohe 25 7,596 2,615 97 Maunawili 6 2,372 578 38 Mililani Town 14 11,120 5,733 87 Pearl City 12 6,418 2,596 91 Wahiawa 8 1,439 517 26 Waimalu 22 12,334 6,077 380 Waipahu 15 3,675 1,354 49
Kauai County 90 24,952 8,994 327 Kalaheo 5 454 143 10 Kapaa 12 2,599 956 56 Lihue 39 10,849 4,463 149
Maui County 227 75,165 25,731 754 Haiku-Pauwela 8 545 115 3 Kahului 27 10,423 3,277 78 Kihei 31 6,994 2,059 89 Lahaina 14 3,444 1,118 42 Makawao 7 1,387 622 24 Pukalani 9 1,733 700 24 Wailea-Makena 11 1,211 317 12 Wailuku 96 45,325 16,527 447
Source: U.S. Census Bureau, 1997 Economic Census, Professional, Scientific, and Technical Services,Geographic Area Series, EC97S54A-HI (August 1999), table 1a, 3, and 4.
The State of Hawaii Data Book 2001 http://www.state.hi.us/dbedt/

Table 23.21-- ADMINISTRATIVE AND SUPPORT AND WASTE MANAGEMENT AND REMEDIATION SERVICES ESTABLISHMENTS (NAICS 56) WITH PAYROLL AND SUBJECT TO FEDERAL INCOME TAX, FOR COUNTIES AND SELECTED
URBAN PLACES: 1997
Geographic areaEstablishments
(number)Receipts ($1,000)
Annual payroll ($1,000)
Paid employees, pay period
including March 12
State total 1,541 1,519,140 638,465 32,488
Hawaii County 154 87,034 46,908 2,813 Hilo 54 24,379 12,379 1,111 Holualoa 6 1,590 488 28 Kailua 52 45,446 30,497 1,483
Honolulu County 1,126 1,316,348 549,216 27,170 Ahuimanu 4 464 173 16 Aiea 32 21,868 9,945 689 Ewa Beach 8 3,022 1,627 54 Halawa 6 924 240 21 Honolulu 872 1,123,068 490,859 24,122 Kailua 26 5,642 2,312 113 Kaneohe 29 5,754 2,234 113 Mililani Town 13 2,381 782 94 Pearl City 22 11,901 4,330 271 Wahiawa 9 2,720 614 29 Waianae 7 1,248 604 38 Waimalu 18 10,603 4,726 309 Waipahu 17 6,160 2,397 154 Waipio 3 453 251 18
Kauai County 67 25,822 8,123 483 Kapaa 7 1,310 159 6 Lihue 32 13,822 4,782 320
Maui County 194 89,936 34,218 2,022 Haiku-Pauwela 4 794 217 15 Kahului 34 26,652 10,895 800 Kihei 28 5,649 2,171 107 Lahaina 30 17,525 6,288 363 Makawao 4 417 77 4 Napili-Honokowai 3 258 161 6 Pukalani 5 849 361 13 Wailea-Makena 14 6,804 3,965 170 Wailuku 40 17,948 6,278 302
Source: U.S. Census Bureau, 1997 Economic Census, Administrative and Support and Waste Managementand Remediation Services, Geographic Area Series, EC97S56A-HI (September 1999), table 1, 3, and 4.
The State of Hawaii Data Book 2001 http://www.state.hi.us/dbedt/

Table 23.22-- EDUCATIONAL SERVICES ESTABLISHMENTS (NAICS 61) WITH PAYROLL AND SUBJECT TO FEDERAL INCOME TAX, FOR COUNTIES AND
SELECTED URBAN PLACES: 1997
Geographic areaEstablishments
(number)Receipts ($1,000)
Annual payroll ($1,000)
Paid employees, pay period
including March 12
State total 209 52,837 18,679 1,214
Hawaii County 21 5,012 1,513 104 Hilo 8 1,472 423 41 Kailua 5 1,828 520 44
Honolulu County 149 42,009 15,778 994 Aiea 6 2,674 883 57 Honolulu 101 31,857 12,784 703 Kailua 4 550 263 25 Kaneohe 4 348 92 8 Mililani Town 3 518 124 24 Pearl City 5 295 95 17 Waimalu 6 1,074 341 27
Kauai County 6 957 161 25
Maui County 33 4,859 1,227 91 Kahului 7 952 172 15 Kihei 5 742 272 8 Lahaina 5 707 121 9 Wailuku 7 830 152 17
Source: U.S. Census Bureau, 1997 Economic Census, Educational Services, Geographic Area Series, EC97S61A-HI (August 1999), table 1a, 3, and 4.
The State of Hawaii Data Book 2001 http://www.state.hi.us/dbedt/

Table 23.23-- ARTS, ENTERTAINMENT, AND RECREATION ESTABLISHMENTS (NAICS 71) WITH PAYROLL AND SUBJECT TO FEDERAL INCOME TAX, FOR
COUNTIES AND SELECTED URBAN PLACES: 1997
Geographic areaEstablishments
(number)Receipts ($1,000)
Annual payroll ($1,000)
Paid employees, pay period
including March 12
State total 386 409,640 116,600 6,925
Hawaii County 45 34,417 10,689 653 Hilo 11 4,186 1,023 129 Kailua 12 6,231 1,920 123
Honolulu County 234 273,565 79,051 4,915 Aiea 6 8,497 2,769 169 Honolulu 159 143,529 43,151 2,592 Kailua 9 11,847 3,367 248 Kaneohe 6 4,138 1,353 72 Mililani Town 3 6,807 2,183 149 Pearl City 5 2,174 600 37 Waimalu 9 11,236 2,990 208
Kauai County 27 23,514 6,721 412 Kapaa 5 2,244 618 75 Lihue 11 9,852 2,773 181
Maui County 80 78,144 20,139 945 Kahului 6 3,359 931 61 Kihei 18 11,712 3,505 186 Lahaina 21 35,398 8,327 260
Source: U.S. Census Bureau, 1997 Economic Census, Arts, Entertainment, and Recreation,Geographic Area Series, EC97S71A-HI (August 1999), table 1a, 3, and 4.
The State of Hawaii Data Book 2001 http://www.state.hi.us/dbedt/

Table 23.24-- OTHER SERVICES (EXCEPT PUBLIC ADMINISTRATION) ESTABLISHMENTS (NAICS 81) WITH PAYROLL AND SUBJECT TO FEDERAL
INCOME TAX, FOR COUNTIES AND SELECTED URBAN PLACES: 1997
Geographic areaEstablishments
(number)Receipts ($1,000)
Annual payroll ($1,000)
Paid employees, pay period
including March 12
State total 1,476 683,196 206,420 10,375
Hawaii County 157 50,292 14,470 808 Hilo 76 28,639 8,871 476 Kailua 46 16,819 4,580 243
Honolulu County 1,097 560,782 170,662 8,402 Aiea 50 24,266 7,058 304 Ewa Beach 6 5,025 1,245 41 Halawa 5 691 208 13 Honolulu 748 395,504 116,973 5,786 Kailua 36 13,259 4,662 229 Kaneohe 55 37,045 12,219 729 Laie 3 759 203 18 Mililani Town 18 3,644 1,200 91 Pearl City 27 15,574 4,565 197 Wahiawa 24 12,425 4,270 196 Waianae 7 789 245 24 Waimalu 28 13,541 4,311 220 Waipahu 55 22,879 7,413 291
Kauai County 59 17,942 5,101 281 Kapaa 8 1,602 442 31 Lihue 25 8,214 2,505 98
Maui County 163 54,180 16,187 884 Island of Lanai 1 (D) (D) (a) Haiku-Pauwela 4 960 178 11 Kahului 35 18,293 6,323 341 Kihei 18 3,952 1,099 52 Lahaina 19 4,539 1,212 65 Pukalani 8 1,051 213 14 Wailea-Makena 8 1,856 537 28 Wailuku 46 18,164 5,686 321
a 0 to 19 employees. D Withheld to avoid disclosing data for individual companies. Source: U.S. Census Bureau, 1997 Economic Census, Other Services (Except Public Administration),Geographic Area Series, EC97S81A-HI (December 1999), table 1a, 3, and 4.
The State of Hawaii Data Book 2001 http://www.state.hi.us/dbedt/

Table 23.25-- PROFESSIONAL, SCIENTIFIC, AND TECHNICAL SERVICES ESTABLISHMENTS WITH PAYROLL, BY KIND OF BUSINESS OR
OPERATION: 1997
NAICS code Kind of business or operation
Establish-ments
(number)
Receipts/Revenues ($1,000)
Annual payroll ($1,000)
Paid employees, pay period including March 12
Firms Subject to Federal Income Tax
54 Professional, scientific, and technical services 2,480 1,574,036 606,466 15,743
541 Professional, scientific, and technical services 2,480 1,574,036 606,466 15,743
5411 Legal services 786 530,852 213,614 4,325 5412 Accounting, tax return prep,
bookkeeping, and payroll services 467 212,380 82,032 3,155 5413 Architectural, enginerring, and related
services 498 426,024 168,162 3,735 5414 Specialized design services 88 35,232 7,711 263 5415 Computer systems design and related
services 124 97,935 38,367 906 5416 Management, scientific, and technical
consulting services 240 97,727 32,117 980 5417 Scientific research and development
services 18 42,455 21,047 274 5418 Advertising and related services 135 78,571 28,015 811 5419 Other professional, scientific, and
technical services 124 52,860 15,401 1,294
Firms Exempt from Federal Income Tax
54 Professional, scientific, and technical services 43 88,140 21,507 472
541 Professional, scientific, and technical services 43 88,140 21,507 472
5411 Legal services 18 6,396 3,688 106 5417 Scientific research and development
services 25 81,744 17,819 366
Source: U.S. Census Bureau, 1997 Economic Census, Professional, Scientific, and Technical Services, Geographic Area Series, EC97S54A-HI (August 1999), table 1a and 1b.
The State of Hawaii Data Book 2001 http://www.state.hi.us/dbedt/

Table 23.26-- ADMINISTRATIVE AND SUPPORT AND WASTE MANAGEMENT AND REMEDIATION SERVICES ESTABLISHMENTS WITH PAYROLL AND
SUBJECT TO FEDERAL INCOME TAX, BY KIND OF BUSINESS OR OPERATION: 1997
NAICS code Kind of business or operation
Establish-ments
(number)Receipts ($1,000)
Annual payroll ($1,000)
Paid employees, pay period including March 12
56 Administrative and support and waste management and remediation services 1,541 1,519,140 638,465 32,488
561 Administrative and support services 1,458 1,345,293 599,457 31,406 5611 Office administrative services 109 95,460 45,720 1,568 5612 Facilities support services 7 16,344 8,736 234 5613 Employment services 81 191,650 137,072 8,565 5614 Business support services 123 280,769 105,585 4,062 5615 Travel arrangement and reservation
services 597 444,280 149,582 6,106 5616 Investigation and security services 101 120,246 71,232 5,182 5617 Services to buildings and dwellings 353 157,144 69,301 4,648 5619 Other support services 87 39,400 12,229 1,041
562 Waste management and remediation services 83 173,847 39,008 1,082
5621 Waste collection 28 78,917 15,910 476 5622 Waste treatment and disposal 15 26,958 3,734 160 5629 Remediation and other waste
management services 40 67,972 19,364 446
Source: U.S. Census Bureau, 1997 Economic Census, Administrative and Support and Waste Management and Remediation Services, Geographic Area Series, EC97S56A-HI (September 1999), table 1.
The State of Hawaii Data Book 2001 http://www.state.hi.us/dbedt/

Table 23.27-- EDUCATIONAL SERVICES ESTABLISHMENTS WITH PAYROLL, BY KIND OF BUSINESS OR OPERATION: 1997
NAICS code Kind of business or operation
Establish-ments
(number)
Receipts/Revenues ($1,000)
Annual payroll ($1,000)
Paid employees, pay period including March 12
Firms Subject to Federal Income Tax
61 Educational services 209 52,837 18,679 1,214
611 Educational services 209 52,837 18,679 1,214 6114 Business schools, and computer and
management training 22 7,170 4,137 166 6115 Technical and trade schools 19 7,313 2,179 137 6116 Other schools and instruction 157 35,904 11,390 880 6117 Educational support services 11 2,450 973 31
Firms Exempt from Federal Income Tax
61 Educational services 68 22,849 7,417 396
611 Educational services 68 22,849 7,417 396 Business schools, and computer and
6114 management training 5 1,517 549 23 6115 Technical and trade schools 10 6,269 1,611 47 6116 Other schools and instruction 46 8,290 3,397 260 6117 Educational support services 7 6,773 1,860 66
Source: U.S. Census Bureau, 1997 Economic Census, Education Services, Geographic Area Series,EC97S61A-HI (August 1999), table 1a and 1b.
The State of Hawaii Data Book 2001 http://www.state.hi.us/dbedt/

Table 23.28-- ARTS, ENTERTAINMENT, AND RECREATION ESTABLISHMENTS WITH PAYROLL, BY KIND OF BUSINESS OR OPERATION: 1997
NAICS code Kind of business or operation
Establish-ments
(number)
Receipts/Revenues ($1,000)
Annual payroll ($1,000)
Paid employees, pay period including March 12
Firms Subject to Federal Income Tax
71 Arts, entertainment, and recreation 386 409,640 116,600 6,925
711 Performing arts, spectator sports, and related industries 107 94,597 25,505 1,528
7111 Performing arts companies 49 66,471 18,733 1,197 7112 Spectator sports 4 1,259 890 22 7113 Promoters of performing arts, sports, and
similar events 13 14,804 1,765 129 7114 Agents/managers for artist, athletes, and
other public figures 14 6,342 1,829 121 7115 Independent artists, writers, and
performers 27 5,721 2,288 59
712 Museums, historical sites, and similar institutions 11 4,640 1,216 114
7121 Museums, historical sites, and similar institutions 11 4,640 1,216 114
713 Amusement, gambling, and recreation industries 268 310,403 89,879 5,283
7131 Amusement parks and arcades 34 36,131 7,513 488 7139 Other amusement and recreation services 234 274,272 82,366 4,795
Firms Exempt from Federal Income Tax
71 Arts, entertainment, and recreation 84 136,795 46,036 2,806
711 Performing arts, spectator sports, and related industries 20 15,003 5,478 300
7111 Performing arts companies 17 13,319 5,121 273 7113 Promoters of performing arts, sports, and
similar events 3 1,684 357 27
712 Museums, historical sites, and similar institutions 39 87,388 29,861 1,881
7121 Museums, historical sites, and similar institutions 39 87,388 29,861 1,881
713 Amusement, gambling, and recreation industries 25 34,404 10,697 625
7139 Other amusement and recreation services 25 34,404 10,697 625
Source: U.S. Census Bureau, 1997 Economic Census, Arts, Entertainment, and Recreation, GeographicArea Series, EC97S71A-HI (August 1999), table 1a and 1b.
The State of Hawaii Data Book 2001 http://www.state.hi.us/dbedt/

Table 23.29-- OTHER SERVICES (EXCEPT PUBLIC ADMINISTRATION) ESTABLISHMENTS WITH PAYROLL, BY KIND OF BUSINESS OR
OPERATION: 1997
NAICS code Kind of business or operation
Establish-ments
(number)Receipts ($1,000)
Annual payroll ($1,000)
Paid employees, pay period including March 12
Firms Subject to Federal Income Tax
81 Other services (except public admin.) 1,476 683,196 206,420 10,375
811 Repair and maintenance 710 352,182 101,332 3,941 8111 Automotive repair and maintenance 461 224,739 62,749 2,608 8112 Electronic and precision equipment repair
and maintenance 61 20,854 5,453 213 8113 Commercial and industrial machinery and
equipment repair and maintenance 74 51,598 15,190 455 8114 Personal and household goods repair and
maintenance 114 54,991 17,940 665
812 Personal and laundry services 766 331,014 105,088 6,434 8121 Personal care services 382 66,763 27,338 1,946 8122 Death care services 37 60,232 19,835 898 8123 Drycleaning and laundry services 93 87,468 31,554 2,042 8129 Other personal services 254 116,551 26,361 1,548
Firms Exempt from Federal Income Tax
81 Other services (except public admin.) 1,135 657,578 137,517 7,096
813 Religious/grantmaking/civic/professional and similar organization 1,135 657,578 137,517 7,096
8132 Grantmaking and giving services 52 117,512 11,253 476 8133 Social advocacy organizations 48 51,627 14,613 566 8134 Civic and social organizations 73 35,716 14,834 1,226 8139 Business/professional/labor/political/and
similar organizations 962 452,723 96,817 4,828
Source: U.S. Census Bureau, 1997 Economic Census, Other Services (Except Public Administration),Geographic Area Series, EC97S81A-HI (December 1999), table 1a and 1b.
The State of Hawaii Data Book 2001 http://www.state.hi.us/dbedt/

Table 23.30-- TRAVEL ARRANGEMENT AND RESERVATION SERVICES (NAICS 5615): 1997
[Includes only establishments with payroll]
NAICS code Kind of business Establishments
Revenue ($1,000)
Annual payroll ($1,000)
Paid employees,
Mar. 12
5615 All establishments 597 444,280 149,582 6,106 56151 Travel agencies 362 201,872 70,943 2,845 56152 Tour operators 180 151,139 61,289 2,440 56159 Other travel arrangement
& reservation services 1/ 55 91,269 17,350 821
1/ Includes convention & visitors bureaus (13 establishments). Excludes convention and trade show organizers (NAICS 56192; 22 establishments). Source: U.S. Bureau of the Census, 1997 Economic Census, Administrative and Support and WasteManagement and Remediation Services, Hawaii (Sept. 1999), table 1.
The State of Hawaii Data Book 2001 http://www.state.hi.us/dbedt/

Table 23.31-- ACCOMMODATION AND FOODSERVICES (NAICS 72), FOR COUNTIES AND SPECIFIED PLACES: 1997
Geographic areaNumber of
establishmentsSales
($1,000) Annual payroll
($1000)
Paid employees for
pay period including March 12 (number)
State total 3,081 5,007,899 1,507,538 88,083
Hawaii County 326 546,576 188,103 10,441 Hilo 116 64,725 18,517 1,881 Kailua 91 98,669 34,903 2,220
Honolulu County 2,125 3,036,837 852,782 53,916 Aiea 81 38,136 10,147 995 Ewa Beach 16 10,308 2,578 254 Halawa 10 5,636 1,247 129 Honolulu 1,503 2,603,981 733,432 42,549 Kaneohe 60 36,854 9,527 1,009 Laie 7 4,837 1,232 139 Nanakuli 4 3,327 764 96 Pearl City 42 27,917 7,201 734 Wahiawa 43 23,650 6,296 639 Waimalu 43 39,766 10,181 884 Waimanalo Beach 4 1,758 447 53 Waipahu 77 48,675 12,569 1,287
Kauai County 210 293,784 102,273 5,775 Kapaa 47 43,520 15,087 1,045 Lihue 62 81,036 34,892 1,824
Maui County 420 1,130,702 364,380 17,951 Island of Lanai 2 (D) (D) (b) Island of Molokai 4 3,922 1540 143 Haiku-Pauwela 3 932 199 28 Kahului 63 56,199 15,285 1,162 Kihei 74 82,830 27,889 1,639 Lahaina 100 218,043 60,212 3,514 Napili-Honokowai 22 76,654 21,087 1,123 Pukalani 10 4,534 1,083 129 Wailea-Makena 19 209,787 66,079 2,725
D Withheld to avoid disclosing data for individual companies. b 20-99 employees. Source: U.S. Census Bureau, 1997 Economic Census, Accommodation and Foodservices, Geographic Area Series, Hawaii, EC97R72A-HI, (October 1999), table 3 and 4.
The State of Hawaii Data Book 2001 http://www.state.hi.us/dbedt/

Table 23.32-- ACCOMMODATION AND FOODSERVICES: 1997
[Includes only establishments with payroll. Apparently excludes condominium units in rental pools for transient use]
NAICS codes Subject
Number of establish-
mentsReceipts ($1,000)
Annual payroll ($1,000)
Paid employees, pay period including March 12
72 Acommodation and foodservices 3,081 5,007,899 1,507,538 88,083
721 Accommodation 309 3,026,903 952,423 40,105
7211 Traveler accommodation 294 3,024,571 951,821 40,064 72111 Hotels 280 3,020,867 950,983 39,990 7211101 25 guestrooms or more 241 3,009,173 948,715 39,823 7211102 Less than 25 guestrooms 23 6,854 1,412 90 7211103 Motels 16 4,840 856 77 72119 Other traveler accommodation 1/ 14 3,704 838 74 7212 RV parks and recreational camps 6 603 171 12 7213 Rooming and boarding houses 9 1,729 431 29
722 Foodservices and drinking places 2,772 1,980,996 555,115 47,978
7221 Full-service restaurants 1,207 1,002,421 309,458 25,170 7222 Limited-service eating places 1,185 723,521 178,691 17,988 7223 Special foodservices 96 162,149 46,009 2,846 72231 Foodservice contractors 51 142,848 40,228 2,267 72232 Caterers 22 12,597 4,173 447 72233 Mobile foodservices 23 6,704 1,608 132 7224 Drinking Places 284 92,905 20,957 1,974
1/ Includes Bed & breakfast inns and all other traveler accommodations. Source: U.S. Census Bureau, 1997 Economic Census, Accommodation and Foodservices, Hawaii, EC97R72A-HI (October 1999), table 1.
The State of Hawaii Data Book 2001 http://www.state.hi.us/dbedt/

Table 23.33-- MERCHANDISE LINE SALES FOR ACCOMMODATION AND FOODSERVICE IN HAWAII: 1997
Sales of specified merchandise line
As percent of total sales of --
Merchan-dise line
codeKind of business and
merchandise line
Number of
establish-ments
Amount ($1,000)
Establish-ments
handling line
All establish-
ments
Accommodation and foodservices 3,081 5,007,899 (X) 100.0
10 Guestroom or unit rentals 312 2,054,776 67.7 41.0 20 Camp tuition or fee 9 693 4.5 (Z) 30 Telephone service charges 184 42,031 1.6 0.8 40 Gaming receipts 24 148 2.5 (Z) 50 Rental of public rooms 69 17,012 1.2 0.3 60 Membership dues and fees 15 764 0.3 (Z)
100 Groceries and other food items 169 14,024 6.8 0.3 120 Meals and snacks 2,747 2,224,058 48.0 44.4 130 Alcoholic drinks 1,131 344,730 11.1 6.9 140 Packaged alcoholic beverages 44 19,419 6.2 0.4 150 Cigars, cigarettes, and tobacco 74 1,272 0.3 (Z)
9810 All other merchandise 259 80,400 5.4 1.6 9980 Nonmerchandise receipts 374 208,572 7.1 4.2
X Not applicable. Z Less than 0.05 percent. Source: U.S. Census Bureau, Economic Census 1997, extracted from American FactFinder from Census Bureau website, E9772L1.MBD: Accommodation and Food services: Merchandise Lines by Kind of Business:1997 (Table 1).
The State of Hawaii Data Book 2001 http://www.state.hi.us/dbedt/

Table 23.34-- VISITOR ACCOMMODATIONS, BY COUNTIES: 1965 TO 2001
[Number of units]
YearState total
City & County of Honolulu
Hawaii County
Kauai County
Maui County
1965 12,903 10,031 865 776 1,231 1966 14,827 11,083 1,387 860 1,497 1967 17,217 12,598 1,790 1,115 1,714 1968 18,657 13,166 2,188 1,260 2,043 1969 22,801 15,992 2,480 1,914 2,415 1970 26,923 18,449 3,166 2,565 2,743 1971 32,289 22,531 3,435 2,628 3,695 1972 35,797 24,742 4,241 2,719 4,095 1973 36,608 25,108 4,796 2,629 4,075 1974 38,675 25,365 5,234 2,868 5,208 1975 39,632 25,352 5,348 3,102 5,830 1976 42,648 25,851 6,045 3,520 7,232 1977 44,986 27,363 5,929 3,657 8,037 1978 47,070 28,546 6,002 3,786 8,736 1979 49,832 30,065 6,093 4,202 9,472 1980 54,246 34,334 5,889 4,322 9,701 1981 56,769 33,967 6,705 4,738 11,359 1982 57,968 33,492 7,167 5,147 12,162 1983 58,765 34,354 7,469 4,193 12,749 1984 62,448 36,848 7,149 5,313 13,138 1985 65,919 38,600 7,511 5,656 14,152 1986 66,308 39,010 7,280 5,922 14,096 1987 65,318 38,185 7,328 5,956 13,849 1988 69,012 37,841 8,823 7,180 15,168 1989 67,734 36,467 8,161 7,398 15,708 1990 71,266 36,899 8,952 7,546 17,869 1991 72,275 36,623 9,383 7,567 18,702 1992 73,089 36,851 9,170 7,778 19,290 1993 69,502 36,604 9,140 4,631 19,127 1994 70,463 36,194 9,595 5,870 18,804 1995 (NA) (NA) (NA) (NA) (NA) 1996 70,288 36,146 9,558 6,760 17,824 1997 71,025 35,971 9,913 6,589 18,552 1998 71,480 36,206 9,655 6,969 18,650 1999 71,157 35,861 9,815 6,872 18,609 2000 71,506 36,303 9,774 7,159 18,270 2001 72,204 36,824 9,944 7,202 18,234
NA Not available. Source: Hawaii State Department of Business, Economic Development and Tourism, Research and Economic Analysis Division, Visitor Plant Inventory (annual).
The State of Hawaii Data Book 2001 http://www.state.hi.us/dbedt/

Table 23.35-- VISITOR ACCOMMODATIONS, BY TYPE: 1986 TO 2001
Properties Units
Year and month Total Hotels 1/Condo-
miniums 2/ Total Hotels 1/Condo-
miniums 2/
1986: Feb. 523 201 322 66,308 43,309 22,999 1987: Feb. 510 196 314 66,318 43,422 21,896 1988: Feb. 481 203 278 69,012 47,892 21,120 1989: Feb. 452 197 255 67,734 48,894 18,840 1990: Feb. 533 264 269 71,266 52,438 18,828 1991: Feb. 595 313 282 72,275 52,688 19,587 1992: Spring 664 374 295 73,089 51,134 21,955 1993: June 698 406 292 69,502 49,111 20,391 1994: Dec. 692 397 295 70,463 49,436 21,027 1995 (NA) (NA) (NA) (NA) (NA) (NA) 1996: May 770 472 298 70,288 49,737 20,551 1997: Spring 821 607 214 71,025 53,735 17,290 1998: 882 669 213 71,480 54,055 17,425 1999: 832 620 212 71,157 53,954 17,203 2000: 873 668 205 71,506 54,859 16,647 2001 914 712 202 72,204 56,021 16,183
NA Not available. 1/ Hotels, apartment hotels, bed-and-breakfast, bungalows, cottages, hostels, and lodges. Properties with both condo and hotel units are included with condominiums in 1990 and later years; treatment before 1990 not specified. 2/ Condominium accommodations in rental pools for transient use. Includes condo/hotel units. Source: Hawaii Visitors & Convention Bureau, Visitor Plant Inventory, 1986 to 1998; Hawaii State Department of Business, Economic Development and Tourism, Research and Economic Analysis Division, Visitor Plant Inventory (annual) for 1999-2001.
The State of Hawaii Data Book 2001 http://www.state.hi.us/dbedt/

Table 23.36-- VISITOR ACCOMMODATIONS, BY TYPE AND BY ISLANDS: 2000 AND 2001
Properties Units
Year and island Total Hotels 1/Condo-
miniums 2/ Total Hotels 1/Condo-
miniums 2/
2000
State total 873 668 205 71,506 54,859 16,647
Oahu 200 172 28 36,303 32,774 3,529 Waikiki/Honolulu 117 93 24 31,557 28,578 2,979 Rest of Oahu 83 79 4 4,746 4,196 550
Other islands 673 496 177 35,203 22,085 13,118 Hawaii 172 143 29 9,774 7,852 1,922 Maui 241 137 104 17,473 9,706 7,767 Lanai 6 6 - 368 368 - Molokai 10 6 4 429 312 117 Kauai 244 204 40 7,159 3,847 3,312
2001
State total 914 712 202 72,204 56,021 16,183
Oahu 205 180 25 36,824 33,579 3,245 Waikiki/Honolulu 117 95 22 32,016 28,932 3,084 Rest of Oahu 88 85 3 4,808 4,647 161
Other islands 709 532 177 35,380 22,442 12,938 Hawaii 185 156 29 9,944 7,988 1,956 Maui 251 144 107 17,574 9,587 7,987 Lanai 6 6 - 368 368 - Molokai 10 6 4 292 176 116 Kauai 257 220 37 7,202 4,323 2,879
1/ Hotels, apartment hotels, bed-and-breakfast, bungalows, cottages, hostels, and lodges. Properties with both condo and hotel units are included with condominiums. 2/ Condominium accommodations in rental pools for transient use. Includes condo/hotel units. 3/ Accommodation type grouped differently than in previous years. Source: Hawaii State Department of Business, Economic Development and Tourism, Research and Economic Analysis Division, Visitor Plant Inventory (annual).
The State of Hawaii Data Book 2001 http://www.state.hi.us/dbedt/

Table 23.37-- VISITOR ACCOMMODATIONS, BY TYPE AND GEOGRAPHIC AREA: 2001
[Accommodation type grouped differently than in previous years]
Properties Units
Type of accommodation
State total Oahu
Other islands
State total Oahu
Other islands
All types 914 205 709 72,204 36,824 35,380
Apartment-hotel 22 15 7 744 647 97 Bed and breakfast 149 15 134 553 42 511 Condominium 202 25 177 16,183 3,245 12,938 Hotel 161 82 79 50,114 31,546 18,568 Other 1/ 380 68 312 4,610 1,344 3,266
1/ Hostel, lodge, etc. Source: Hawaii State Department of Business, Economic Development and Tourism, Research and Economic Analysis Division, Visitor Plant Inventory (annual).
The State of Hawaii Data Book 2001 http://www.state.hi.us/dbedt/

Table 23.38-- HOTELS AND OTHER LODGING PLACES (NAICS 7211), BY COUNTIES: 1995 TO 2000
County 1995 1/ 1996 1/ 1997 1/ 1998 1999 2000
State total 283 282 291 298 295 273
Hawaii 38 41 41 48 48 47 Honolulu 147 137 138 133 130 122 Kauai 32 31 31 38 36 32 Maui 66 73 81 79 81 72
1/ County Business Patterns data from before 1998 reported in SIC (SIC 70) rather than NAICS.Source: U.S. Bureau of the Census, County Business Patterns, Hawaii (annual report), and unpublished
1994 data.
The State of Hawaii Data Book 2001 http://www.state.hi.us/dbedt/

Table 23.39-- VISITOR ACCOMMODATIONS, BY NIGHTLY PRICE: 2001
[Accommodation type grouped differently than in previous years]
Island and type of accommodation All levels
$100 or
less
$101 to
$250
$251 to
$500Over $500
Number reporting 70,834 14,685 31,131 20,822 4,196
Island: Oahu 36,269 8,984 17,106 9,169 1,010 Hawaii 9,713 1,946 4,090 2,580 1,097 Kauai 7,122 1,032 3,257 2,229 604 Maui 17,070 2,654 6,564 6,558 1,294 Molokai 292 62 104 126 - Lanai 368 7 10 160 191
Type of accommodation: Apartment, apartment-hotel 736 571 161 2 2 Bed and breakfast 492 287 198 7 - Condominium 15,619 3,116 9,849 2,462 192 Hostel 412 412 - - - Hotel 50,081 9,146 20,107 16,937 3,891 Individual vacation unit 1,252 750 415 63 24 Other 2,242 404 400 1,350 88
Note: Based on 804 properties for which information on the class of units was available. Because classof units was reported in terms of percentages, errors may have occur due to rounding. Source: Hawaii State Department of Business, Economic Development and Tourism, Research and Economic Analysis Division, Visitor Plant Inventory (annual).
The State of Hawaii Data Book 2001 http://www.state.hi.us/dbedt/

Table 23.40-- HOTEL ROOMS, OCCUPANCY RATES, AND DAILY ROOM AND GUEST RATES: 1989 TO 2001
[Includes condominium units in rental pools for transient occupancy]
Hotel units 1/
Year State total OahuOther
islandsPercent
occupied 2/
Daily rates per room 2/
(dollars)Guests per
room 2/
1989 67,734 36,467 31,267 79.0 95.83 2.001990 71,266 36,899 34,367 78.8 102.10 2.011991 72,275 36,623 35,652 72.4 101.89 2.011992 73,089 37,279 35,810 72.6 105.59 2.021993 69,502 37,032 32,470 72.0 103.26 2.041994 70,463 36,194 34,269 76.5 105.46 2.041995 (NA) (NA) (NA) 76.6 110.27 2.051996 70,288 36,146 34,142 75.5 127.95 2.071997 71,025 35,971 35,054 74.0 135.94 2.081998 71,480 36,206 35,274 72.1 140.80 2.091999 71,157 35,861 35,296 72.9 144.53 2.092000 3/ 71,506 36,303 35,203 70.0 159.78 2.082001 72,204 36,824 35,380 61.1 159.28 2.05
NA Not available. 1/ February data through 1991; Spring 1992; June 1993; December 1994; and May 1996. 2/ Annual averages for hotels in PKF sample. 3/ Data from PKF for 2000 have been revised from previous year databook. Source: Hawaii State Department of Business, Economic Development, and Tourism, Visitor Plant Inventory (annual); PKF-Hawaii, Trends in the Hotel Industry, Hawaii (December issues), and records.
The State of Hawaii Data Book 2001 http://www.state.hi.us/dbedt/

Table 23.41-- HOTEL ROOM OCCUPANCY AND ROOM RATES, BY GEOGRAPHIC AREAS: 2001
[Includes condominium units in rental pools for transient occupancy]
Geographic areaPercent
occupied
Average daily room rate (dollars)
Average revenue per available
room (dollars)
State total 71.94 157.99 113.66
Oahu 72.87 120.79 88.02 Waikiki 73.14 122.04 89.26 Other Oahu 70.45 109.23 76.95
Hawaii 67.74 182.21 123.43 Hilo 61.48 72.87 44.80 Kona 72.63 94.53 68.66 Kohala 66.85 246.17 164.57
Maui 74.50 210.29 156.66 Kaanapali 77.87 186.66 145.35 West Maui 72.42 195.81 141.80 Other 73.05 237.53 173.52
Kauai 68.33 172.72 118.01 North 67.98 223.94 152.24 Central 66.59 116.44 77.54 South 70.15 212.63 149.17
Molokai 47.36 92.09 43.62
Source: PKF-Hawaii, Trends in the Hotel Industry, Hawaii, December 2001.
The State of Hawaii Data Book 2001 http://www.state.hi.us/dbedt/

Table 23.42-- GENERAL EXCISE TAX BASE FOR RENTALS: 1985 TO 2001
[In thousands of dollars. Data are on a cash basis accounting]
Year reported 1/ Total Hotel rentals All other rentals 2/
1985 3,037,254 1,122,268 1,914,9861986 3,278,450 1,212,782 2,065,6681987 3,443,271 1,369,401 2,073,8701988 3,715,546 1,408,891 2,306,6551989 4,108,740 1,505,071 2,603,6691990 4,401,733 1,572,994 2,828,7391991 4,825,777 1,512,990 3,312,7871992 5,013,293 1,621,751 3,391,5421993 5,035,581 1,527,037 3,508,5441994 5,358,587 1,666,406 3,692,1821995 5,552,792 1,776,527 3,776,2651996 5,859,454 2,057,800 3,801,6551997 5,829,772 2,155,319 3,826,0241998 5,904,196 2,147,217 3,756,9791999 5,845,772 2,158,193 3,687,5802000 6,305,325 2,419,287 3,886,0382001 6,360,999 2,421,813 3,939,186
1/ Calendar year in which reported, including "prior years" reports. Income received in December isreported the following January, hence these annual totals generally refer to an "income year" ended November 30. 2/ Includes residential, office, automobile, and equipment rentals, and land leases. Source: Hawaii State Department of Taxation, "General Excise and Use Tax Base" (annual tabular release).
The State of Hawaii Data Book 2001 http://www.state.hi.us/dbedt/

Table 23.43-- COMPUTER AND SOFTWARE STORES AND SERVICES: 1997
[Data limited to establishments with payroll]
Subject and year
Number of establish-
mentsReceipts ($1,000)
Annual payroll ($1,000)
Paid employees, week inc. March 12
Wholesale trade: Computers and computer peripheral equipment and software (NAICS 42143) 32 150,565 24,786 453
Retail trade: Computer and software stores (NAICS 44312) 37 104,508 7,198 387
Services: Computer and office machine repairs and maintenance (NAICS 811212) 38 15,134 3,638 141 Computer systems design and related services (NAICS 5415) 124 97,935 38,367 906 Data processing services (NAICS 5142) 30 17,949 6,719 187 Software publishers (NAICS 5112) 16 6,253 2,195 61
Source: U.S. Census Bureau, 1997 Economic Census, Retail Trade, Geographic Area Series, Hawaii,EC97R44A-HI (November 1999); 1997 Economic Census, Wholesale Trade, Geographic Area Series, Hawaii,EC97W42-HI (April 2000); 1997 Economic Census, Other Services (Except Pulbic Administration), Geographic Area Series, Hawaii, EC97S81A-HI (December 1999); 1997 Economic Census, Professional, Scientific and Technical Services, Geographic Area Series, Hawaii, EC97S54A-HI (August 1999); 1997 Economic Census,Information, Geographic Area Series, Hawaii, EC97S51A-HI (October 1999).
The State of Hawaii Data Book 2001 http://www.state.hi.us/dbedt/

Table 23.44-- MOTION PICTURE SERVICES: 1977 TO 1997
[Data limited to establishments with payroll. For 1963-1972 data, see Data Book 1990, table 699]
Subject and yearNumber of
establishmentsReceipts ($1,000)
Annual payroll ($1,000)
Paid employees, week inc. March 12
Motion picture production, distribution, and services (SIC 781, 2): 1977 11 926 174 31 1982 16 4,203 1,147 74 1987 25 10,177 2,394 136 1992 50 20,394 6,028 250 1997 2/ 63 33,727 10,660 278
Motion picture theaters (SIC 783): 1977 1/ 50 17,444 (D) (D) 1982 36 21,329 3,195 519 1987 35 (D) (D) (D) 1992 34 (D) (D) (D) 1997 2/ 35 62,133 8,866 1,195
Video tape rental (SIC 784): 1987 78 12,319 2,456 376 1992 78 26,909 5,252 545 1997 2/ 81 23,862 4,346 451
D Withheld to avoid disclosing data for individual companies. 1/ Data include 3 establishments without payroll. 2/ Data for 1997 use NAICS code 51211, 51212, 51219 for motion picture production, distribution, and service; NAICS code 51213 for motion picture theaters; NAICS code 53223 for video tape and disk rental. Source: U.S. Bureau of the Census, 1977 Census of Service Industries, Hawaii, SC77-A-12 (December 1979); 1982 Census of Service Industries, Hawaii, SC82-A-12 (September 1984); 1982 Census of Service Industries, Motion Picture Industry, SC82-I-4 (December 1985); 1987 Census of Service Industries, Hawaii, SC87-A-12 (July 1989); 1992 Census of Service Industries, Hawaii, SC92-A-12 (August 1994); 1997 EconomicCensus, Information, Geographic Area Series, Hawaii , EC97S51A-HI (October 1999); 1997 Economic Census,Real Estate and Rental and Leasing, Geographic Area Series, Hawaii , EC97F53A-HI (August 1999).
The State of Hawaii Data Book 2001 http://www.state.hi.us/dbedt/

Table 23.45-- MOTION PICTURE THEATERS AND SCREENS OPERATED BY MAJOR COMPANIES: APRIL 1999
SubjectAll major
companiesConsolidated
Amusement Co.Wallace Theater
Corp.Signature Theaters
Number of theaters 29 15 13 1 Number of screens 135 79 44 12 Oahu 91 59 20 12 Hawaii 22 10 12 - Maui 17 10 7 - Molokai 3 - 3 - Kauai 2 - 2 -
Source: The Honolulu Advertiser , April 25, 1999, p. G4.
The State of Hawaii Data Book 2001 http://www.state.hi.us/dbedt/

Table 23.46-- MOTION PICTURE AND TELEVISION PRODUCTION: 1996 TO 2000
Subject 1996 1997 1998 1999 2000
Number of features and programs filmed 1/ 7 12 12 10 13 Feature films for theater viewing 6 9 3 2 5 TV movie of the week, television episodic, specials 1 3 6 6 7 Hawaii-based TV network series - - 3 2 1
Expenditures in Hawaii (million dollars) 59.7 70.7 99.1 98.1 136.0 Commercials 10.4 5.5 5.8 8.6 7.5 Hawaii-based TV series - - 28.2 25.0 20.0 Feature films 11.7 22.6 12.6 6.0 51.5 TV specials/episodics/movie of week 3.0 4.5 10.7 12.2 10.3 Others (still photography, sports, exercise or music video, cable, misc.) 6.5 4.3 6.2 9.1 12.1 Documentaries/industrials/news/ educational/travelog/video stock 0.8 3.3 2.6 2.9 2.0 Annual permit holders 11.7 8.5 11.0 11.0 10.3 Private property projects 10.0 15.0 7.0 7.0 15.0 Sports events, annual (private) 5.6 7.0 15.0 15.0 7.0
Tax revenues generated (million dollars) 10.9 13.0 18.2 18.0 25.0
Spending effect on economy (million dollars) 121.8 144.2 198.2 196.0 271.8
1/ For 1996-98, includes only nationally televised series. Source: Hawaii State Department of Business, Economic Development & Tourism, Hawaii Film Office,records.
The State of Hawaii Data Book 2001 http://www.state.hi.us/dbedt/