domestic private capital accumulation and … · domestic private capital accumulation and ......
TRANSCRIPT

International Journal of Academic Research in Business and Social Sciences May 2012, Vol. 2, No. 5
ISSN: 2222-6990
69 www.hrmars.com/journals
DOMESTIC PRIVATE CAPITAL ACCUMULATION AND ECONOMIC DEVELOPMENT IN NIGERIA 1970 -2010
Michael Baghebo, Ph.D Dept. of Economics, Niger Delta University, Wilberforce Island
Bayelsa State, Nigeria
E-mail: [email protected]
Samuel Edoumiekumo PhD Niger Delta University, Wilberforce Island, Bayelsa State
Nigeria E-mail: [email protected]
Abstract This study empirically examine the relationship between Domestic Private Capital Accumulation and Economic Development in Nigeria from 1970-2010. The variables PCGDP, PINV, PUINV, RIR, and INFLA attained stationarity after first differences. The Johansen co integration test of trace and maximum Eigen value statistics was used to establish long run equilibrium relationship among the variables in the model. We also estimated the over parameterized and parsimonious ECM to account for short run dynamic adjustment required for stable long run equilibrium relationship among the variables in the model. All the independent variables (PUINV,PINV, RIR,INFLA) impacts positively on economic development .Public and Private investment conform to apriori expectations while inflation and real interest rate contradicts apriori expectations. The analysis suggest a high degree of macroeconomic stability and a low and predictable inflation rates have a paramount importance to ensure a strong response to Private investment to economic incentives. The overall harmony of macroeconomic policies and stability in the country is essential for the promotion of Private investment. Also proactive measures are required to ensure macroeconomic stability in the country. 1. Introduction Domestic private capital accumulation is the expansion of the productive potential of the economy necessitated by indigenous entrepreneurs. Uremadu (2006), Adegbite and Owuallan (2007) in their studies posits that although FDI is beneficial to host countries by speeding up the process of economic growth and development, its repercussory effect is greater. Developing countries should depend greatly on domestic savings and investment. FDI should at best complement domestic private investment. It is frankly stated in the First National Development Plan that, it has always been the objective of government policy to stimulate the vigorous growth and development of the private sector. The system adopted has been to ensure that the various proposals by Government are consistent with the development of the private sector (First Plan, 1962). It is

International Journal of Academic Research in Business and Social Sciences May 2012, Vol. 2, No. 5
ISSN: 2222-6990
70 www.hrmars.com/journals
obvious from all these that the major plan of the State’s intervention in the economy is to facilitate the development of the private sector, whose role could determine the level of economic development of a country.
For example, the expected Investment boom after the Structural Adjustment Programme (SAP) commenced in 1986 seems not to have materialized. Private Investment share of the GDP is still below 10 per cent. There was an initial rise in Private Investment share of GDP just after the SAP was adopted, but the ratio has since declined from 8.6 per cent to 13.7 per cent (Akpokodje, 1998). Nigeria continues to implement far-reaching trade policy reforms with the hope that Private Investment share of GDP will improve and non-oil exports will boom, the results have been disappointing. Studies have been carried out to examine the determinant of private investment behaviour in Nigeria; here too the results have been controversial and hence inconclusive. Attention has been focused on the traditional determinants of Private Investment such as output, relative prices, and credit/liquidity and so on. It is interesting to note that domestic credit to the Private Sector has continued to expand and relative prices tend to favour investment in such sectors as agriculture and manufacturing. However, the expected investment associated with such favourable environment has not been attained. It seems that some other factors are driving the response of the private sector to investment spending beyond relative prices and current profitability. The study therefore will examine the impact of domestic private capital accumulation on economic development in Nigeria. This may well explain why, despite far reaching reforms implemented, private investment has responded unimpressively. For policy purposes, it is important to know how private sector perception of trade policy reforms affects investment. This will help in the design of more appropriate strategies to stimulate capital accumulation in Nigeria. The rest of the paper is organised as follows: section two is a review of relevant literature. Section three is theoretical framework underlying the study. Methodology and data sources are discussed in section four. Section five contains empirical model specification. The empirical results and discussion of findings are in section six, while section seven discussed policy implications and recommendation. Section eight concludes the paper. 2. The Literature From the policy viewpoint, an extremely important form of uncertainty faced by investors is the credibility of policy reforms. Investment-friendly reforms raise expected returns, but may increase uncertainty if investors believe that the reform measures could be reversed. In such a situation, investor’s perception about the probability of policy reversal becomes a key determinant of the investment response. The above issues are explored by Rodrik (1991) using a model in which investment involves sunk cost of entry and exit. He shows that a reform favourable to capital, but regarded as less than fully credible, will fail to trigger an investment response unless the return on capital is high enough to compensate investors for the losses they would incur should the reversal take place. Similar qualitative conclusions are reached by Qyejide, Ogunkola and Ndunga (2002) who considers the case of a trade reform suspected to be only temporary. An economic policy reform enjoys credibility to the extent that relevant actors, such as domestic and foreign

International Journal of Academic Research in Business and Social Sciences May 2012, Vol. 2, No. 5
ISSN: 2222-6990
71 www.hrmars.com/journals
investors, believe the government will implement and sustain the programme of reforms that it has announced. The identity of relevant actors may vary across time and space, but the issue of credibility seems inescapable, given the sequential nature of economic decision making. At least in principle, a government that dismantles protectionism today can restore it tomorrow, just as a government that cuts taxes now can increase them later. The record of trade liberalization in developing countries is fraud with examples of governments that promise one policy but deliver another, or implemented reforms that were subsequently retracted (Michaely et al., 1991, for a detailed discussion of this issue). If investors doubt the lasting of free trade, for example, they may decide not to shift resources from inefficient, import-substitution industries to more dynamic, export oriented ones. The deterrence to investment arises because exporting involves costs that would be difficult to recover if the government reinstated protectionism. For example, physical capital is typically expensive to install and uniquely appropriate to a particular industry. Likewise, investments in human capital perform best in the activity for which they were designed. Firms will avoid making export related investments in client networks and physical and human capital, unless they believe that public authorities will persist in keeping the economy open. If investors anticipate a policy reversal, then commercial liberalization will hurt import-competitors without stimulating the growth of exports, and the liberal policy will become unsustainable (Rodrik, 1992). This uncertainty regarding the sustainability of the trade liberalization might discourage private investment and the allocation of resources. In particular, it is argued that if sustainability of the liberalization is uncertain, the entrepreneurs will delay investment decision because they do not want to commit resources to a particular sector. Consequently, capital accumulation might slow down, hindering economic growth and development. One important factor determining the potential success of economic reform programmes is the extent and pace at which Private investment responds to the policy changes. Since the expansion of Public Investment is usually constrained as part of fiscal austerity measures embodied in a structural reform programme, the required recovery of investment has to come largely from the private sector. The behaviour of private investment has therefore been a major focus of attention in assessing the reform outcome. The existing evidence across a wide spectrum of developing countries generally points to a decline or stagnation of private investment during the immediate post reform years (Harigan and Mosley, 1991; Greenaway and Morrissey, 1992; Gunning, 1994; Collier, 1995; Dehn, 2000; Lemi and Asefa 2001). This was as a result of perceived lack of credibility and sustainability of government trade policy reforms by private investors (likelihood of policy reversal). Thus making private investors to delay investment decisions even though the outlook of the future is promising and profitability expectations are high. This is because developing countries are fond of formulating sound investment friendly policies to attract foreign investors and only to reverse it later. For example Nigeria moved from the era of regulatory control to deregulation and to guided deregulation. The perceived risk of Investment can be reduced in several ways. Consistent and credible policy formation that minimizes the likelihood of policy reversal maximizes its predictability. Credibility is crucial to capital accumulation, economic growth and over all success of a macroeconomic policy (Chung, 2000; Konings, 2001; Sousa, 2001; Javorcik and

International Journal of Academic Research in Business and Social Sciences May 2012, Vol. 2, No. 5
ISSN: 2222-6990
72 www.hrmars.com/journals
Spataranu, 2004). The credibility issues relating trade and exchange rate policy reforms to Private Investment has been lacking in Nigeria. The literature is replete with evidence that private investment in most developing countries is more directly related to growth than public investment (Akpokodje, 1998; Serven and Salimano, 1992a; Mamatzakis, 2001; Rashid, 2005). Accordingly, it is now widely accepted that the expansion of private investment should be the added impetus for economic growth in developing economies (Chhibber and Dailami, 1990).
Foreign exchange shortage is also widely acknowledged as a potent constraint to private investment. (Akpokodje 2009, Serven 2002) notes that since the bulk of capital goods and raw materials used in the industrial sectors of most developing countries are imported, then, foreign exchange shortages will impinge adversely on private investment. Bilsborrow (1977), in his study on Colombia, introduced a foreign exchange variable defined as the sum of international reserves in the previous period and export earnings in the current year. His results show a significant direct correspondence between foreign exchange availability and private investment. Similarly, Fry (1988), in a study of a group of 61 developing countries, used two variables to mirror foreign exchange availability namely foreign exchange receipts and import capacity. For both, he found a significant positive relationship with private investment.
In recent times, the foreign exchange issue has been examined from a slightly different perspective. A key component of economic reform programmes is the real devaluation of the domestic currency. In the short-run, a real devaluation will depress private investment through its contraction impact on domestic absorption. The main demand side effects are a contraction in private sector wealth and expenditure due to the induced rise in the general price level.
The slump in general economic activity will compel private investors to roll back investment activity. On the supply side, the effect of real devaluation is, however, ambiguous. A real devaluation will induce a rise in foreign prices measured in domestic currency, thereby boosting investment in the tradeable sector while shrinking same in the non-tradeable sector. On balance, a real devaluation is expected to have a negative impact on private investment as a substantial proportion of capital and intermediate goods are obtained offshore. De Melo and Tybout (1986) found a positive but insignificant relationship between the real exchange rate and private investment for Uruguay, while Oshikoya (1994), on the strength of a study of selected African countries, reported a positive and significant effect for middle-income countries and a negative but significant impact for low-income ones. Until the early 1970s, it was generally believed that low interest rates on bank loans and deposits would promote private investment spending- a notion with the Keynessian and neo-classical analyses. But McKinnon, (1973) and Shaw (1973) challenged this conventional theory. They argued that raising interest rates increase the amount people are willing to hold as financial assets by decreasing their holdings on non-financial assets. Thus making it possible for financial institutions to extend more loans to the investors. They further argued that the existence of very low real interest rate would result in the support and expansion of unproductive projects and the channeling of funds into consumption rather than investment, which would be detrimental to private capital formation. They advanced the hypothesis that private investment in developing countries is positively related to the accumulation of real money balance.

International Journal of Academic Research in Business and Social Sciences May 2012, Vol. 2, No. 5
ISSN: 2222-6990
73 www.hrmars.com/journals
3. Theoretical Framework The Neo-Classical approach to investment founded by Jorgenson (1963) was mainly spurred by the desire to address the shortcoming of the Harod Domar formulation, particularly in its simplistic assumptions, this approach introduces factor substitution in the derivation of the demand for capital from the firm’s cost minimization problems. Consequently, the desired capital stock is shown to depend on the rental cost of capital (which, in turn, depend on the price of capital goods, the real interest rate and the depreciation rate) and the level of output. The neoclassical theory of investment provided another explanation for investment expenditure in addition to changes in output. Inducement to invest may also be simulated by favourable changes in relative prices where downward shifts in the real user cost of capital services imply that the firm has to restore equilibrium by cutting down the marginal productivity of capital stock (Jorgensen, 1963). Jorgensen model is based on the theory of optimal capital allocation. Solow’s model of economic growth postulates a continuous production function linking output to the inputs of capital and labour which are substitutable. Solow’s basic assumptions are: one composite commodity is produced; output is regarded as net output after making allowance for the depreciation of capital; constant returns to scale; the two factors – labour and capital are paid according to their marginal physical productivities; flexibility of prices and wages; full employment of the available stock of capital. Given these assumptions, Solow shows in his model that, with variable technical coefficient, there will be tendency for capital - labour ratio to adjust itself through time in the direction of equilibrium ratio. The Solow neoclassical growth model uses a standard aggregate production function in which y =ka (AL)b, where y = GDP, k = stock of capital which may include human as well as physical capital. L = labour and A = efficiency parameter. 4. Methodology and Data
In estimating the model for the study, we used three steps methodology. These steps includes; i. Univariate Statistical Analysis of time series (Test for unit root using Group Unit Root
Test by Levin, Lin and Chu and individual unit root process by Im, Pesaran and Shin Test) to ascertain the stationarity or non stationarity status of the data series.
ii. Multivariate Cointegration Analysis and the estimation of the long run equilibrium models of public capital accumulation using Johansen (Trace and Max-Eigen Statistics) cointegration test.
iii. To obtain the parsimonious short run dynamic models of public capital accumulation through the error correction mechanism which has been shown to better capture the short run dynamics of the relationships.
Data for the study were obtained from various CBN Bulletins, Annual Reports and Statement of Accounts, National Bureau of Statistics [NBS] which cover the period 1970-2010. 5. Empirical model Specification The augmented Solow neoclassical model is use in estimating the role of domestic private capital accumulation in economic development. The Solow neoclassical growth model uses aggregate production function in which

International Journal of Academic Research in Business and Social Sciences May 2012, Vol. 2, No. 5
ISSN: 2222-6990
74 www.hrmars.com/journals
Y = Akᵅ L1-α ………………. (1) Y/L = AKᵅ L1-α/L ……………… (1.1) y=AKα L1-α-1 …………………..(1.2) y= AKα L-α ………………….... (1.3) y= AKα /L α ……………………(1.4) y = Akᵅ ………………….……. (2) where
Y/L =y = real per capita GDP A = efficiency parameter k= stock of physical capital In the augmented Solow neoclassical model, the efficiency parameter (A) is expanded to include inflation and real interest rate. Inflation is included as an independent variable in the model because high rate of inflation has harmful effects on the efficient allocation of resources being particularly detrimental in creating distortions in investment patterns and thus discourages investment generally. High rate of inflation is a sign of macroeconomic instability and government’s inability to manage the economy effectively. K is expanded to include public and private capital. ∆PCGDP = f(∆PINVt, ∆PUINVt, ∆RIRt, INFLAt) The multivariate specification of the equation for estimate in our model is given as ∆LPCGDP = β0 + β1 ∆PINVt + β2 ∆LPUINVt + β3 ∆RIRt + β4 INFLAt + φ………………………………………………………………………(3) β1> 0, β2 > 0, β3 >< 0, β4 < 0 Where ∆LPCGDPt = Change in log of growth rate of real per capita gross domestic
product, a measure of economic development ∆PINVt = change in Private investment ∆LPUINVt = change in log of Public investment ∆RIRt = change in Real interest rate INFLAt = inflation rate Φ = Error term 6.0 Results of domestic private capital accumulation and economic development model 6.1 Results of unit root test for domestic private capital accumulation and economic development model LPCGDP =F(PRINV, LPUINV, RIR, INFLA) Group unit root test: Summary LEVEL Series: LPCGDP, LPUINV, PRINV, RIR, INFLA Cross- Method Statistic Prob.** Sections Obs
Null: Unit root (assumes common unit root process)
Levin, Lin & Chu t* 0.50318 0.6926 5 182

International Journal of Academic Research in Business and Social Sciences May 2012, Vol. 2, No. 5
ISSN: 2222-6990
75 www.hrmars.com/journals
Null: Unit root (assumes individual unit root process)
Im, Pesaran and Shin W-stat -3.73375 0.0001 5 182 ADF - Fisher Chi-square 44.2979 0.0000 5 182 PP - Fisher Chi-square 16.1240 0.0961 5 190 ** Probabilities for Fisher tests are computed using an asymptotic Chi -square distribution. All other tests assume asymptotic normality.
Group unit root test: Summary FIRST DIFFERENCE OF VARIABLES Series: LPCGDP, LPUINV, PRINV, RIR, INFLA Cross- Method Statistic Prob.** Sections Obs
Null: Unit root (assumes common unit root process)
Levin, Lin & Chu t* -4.93970 0.0000 5 175 Null: Unit root (assumes individual unit root process)
Im, Pesaran and Shin W-stat -10.2799 0.0000 5 175 ADF - Fisher Chi-square 104.682 0.0000 5 175 PP - Fisher Chi-square 152.783 0.0000 5 185 ** Probabilities for Fisher tests are computed using an asymptotic Chi -square distribution. All other tests assume asymptotic normality.
Note: L Implies Natural Logarithm Source: Authors Computation
The unit root result shows that all variables LRPCGDP, LPUINV, PINV, RIR, INFLA are stationary after first difference. We therefore reject the null hypothesis (Ho) of non-stationarity for all variables, after first differences. The next step is to perform the Johansen cointegration test for the variables of interest. However, since the Johansen cointegration method is so sensitive to the lag order selection, automatic selection using Bartlett Kernel, selection of maximum lag, based on SIC, Kewey-West bandwidth selection was used. Johansen cointegration test is also implemented with linear deterministic trend. The series are LRPCGDP, LPUINV, PINV, RIR, INFLA. Johansen cointegration test result is presented in section 6.2. The Johansen cointegration Test revealed that the Trace and Maximum Eigen Value Statistics show the existence of two and one cointegrating equation(s) respectively at the five percent level significance. The conclusion drawn from this result is that there exist a unique long-run relationship between LRPCGDP and the regressors (LPUINV, PINV, RIR, INFLA). Since there is one cointegrating vector, an economic interpretation of the long-run LRPCGDP can be obtained by normalizing the estimates of the unrestricted cointegrating vector for the long-run

International Journal of Academic Research in Business and Social Sciences May 2012, Vol. 2, No. 5
ISSN: 2222-6990
76 www.hrmars.com/journals
on the LRPCGDP. The normalized cointegrating equation suggests that there is a negative long run relationship between RPCGDP and the regressors. Interests rate and inflation maintain apriori expectations and are statistically significant. PUINV and PINV are wrongly signed and statistically insignificant.
6.2 Results of Johansen cointegration test for domestic private capital accumulation and economic development model Series: LPCGDP LPUINV PINV RIR INFLA Unrestricted Cointegration Rank Test (Trace) Hypothesized Trace 0.05 No. of CE(s) Eigenvalue Statistic Critical Value Prob.** None * 0.671042 96.38573 69.81889 0.0001 At most 1 * 0.532654 56.35997 47.85613 0.0065 At most 2 0.388813 28.97527 29.79707 0.0620 At most 3 0.267698 11.25059 15.49471 0.1965 At most 4 0.000954 0.034351 3.841466 0.8529 Trace test indicates 2 cointegrating eqn(s) at the 0.05 level * denotes rejection of the hypothesis at the 0.05 level **MacKinnon-Haug-Michelis (1999) p-values Unrestricted Cointegration Rank Test (Maximum Eigenvalue) Hypothesized Max-Eigen 0.05 No. of CE(s) Eigenvalue Statistic Critical Value Prob.** None * 0.671042 40.02576 33.87687 0.0082 At most 1 0.532654 27.38470 27.58434 0.0530 At most 2 0.388813 17.72468 21.13162 0.1405 At most 3 0.267698 11.21624 14.26460 0.1437 At most 4 0.000954 0.034351 3.841466 0.8529 Max-eigenvalue test indicates 1 cointegrating eqn(s) at the 0.05 level * denotes rejection of the hypothesis at the 0.05 level **MacKinnon-Haug-Michelis (1999) p-values
Source: Authors Computation
The identified cointegrating equation was used as an error – correction term (ECM) in the error correction model. This series forms the error correction variable. Thus, the null

International Journal of Academic Research in Business and Social Sciences May 2012, Vol. 2, No. 5
ISSN: 2222-6990
77 www.hrmars.com/journals
hypothesis that there is no co-integration relationship among the variables in the model is rejected at the five percent level of significance. The error correction model was estimated and shows that the system adjust to long run equilibrium. ECMt-1 is the lagged error correction term. The over parameterized model usually deals with problems of model misspecification. This is presented in Section 6.3. In the over parameterized model, the error correction term ECM(-1) is -0.736169 is correctly signed, that is an indication of RPCGDP adjustment to any disequilibrium in the short run. The speed of adjustment is the coefficient of the error correction variable ECM(-1). The coefficient of the ECM is the speed of adjustment from short run to long run equilibrium. It means that about 74 percent departure from previous year’s disequilibrium adjust back to the equilibrium in the current year. The speed of adjustment is high. The ECM(-1) is statistically significant and satisfy apriori expectation. The over parameterized model further shows that RPCGDP is influenced by both current and one lag period of ΔPINV, ΔLPUINV, INFLA and RIR. Private investment in the current and one lag period impact positively and insignificantly on RPCGDP. Inflation in the first lag is negative and insignificant. This satisfy apriori expectations because inflation is properly signed. 6.3 Results of the over-parameterized error correction for domestic private capital accumulation and economic development model Dependent Variable: ΔLPCGDP Coefficient Std. Error t-Statistic Prob. C -1.760519 1.193354 -1.475270 0.1517 ΔLPUINV 4.834954 2.177493 2.220422 0.0350 ΔLPUINV(-1) 1.890049 2.368765 0.797905 0.4319 ΔPINV 3.85E-06 3.72E-06 1.035448 0.3096 ΔPINV(-1) 1.73E-06 5.49E-06 0.314548 0.7555 ΔRIR -0.011828 0.180477 -0.065540 0.9482 ΔRIR(-1) 0.266558 0.180464 1.477067 0.1512 ΔINFLA 0.127065 0.048064 2.643666 0.0135 ΔINFLA(-1) -0.019521 0.050376 -0.387504 0.7014 ECM(-1) -0.736169 0.181462 -4.056874 0.0004 R-squared 0.520281 Mean dependent var 0.013514 Adjusted R-squared 0.360375 S.D. dependent var 5.591470 S.E. of regression 4.471865 Akaike info criterion 6.058948 Sum squared resid 539.9345 Schwarz criterion 6.494331 Log likelihood -102.0905 Hannan-Quinn criter. 6.212441 F-statistic 3.253665 Durbin-Watson stat 1.693330 Prob(F-statistic) 0.008355 Source: Authors Computation

International Journal of Academic Research in Business and Social Sciences May 2012, Vol. 2, No. 5
ISSN: 2222-6990
78 www.hrmars.com/journals
This means that in the first lag, a one percent rise in inflation would result to a 0.019 percent reduction in RPCGDP. In the current period inflation impact positively and significantly on economic development. This means that high rates of inflation in the current period increases economic development. Also in the over parameterized model Real interest rate (RIR) in the current period is properly signed and satisfy apriori expectations. It has negative and insignificant impact on RPCGDP. A one percent change in interest rate result to 0.0118 percent fall in RPCGDP. Thus RIR has a negative and insignificant relationship with RPCGDP. The impact of one lag period of RIR on RPCGDP is positive and insignificant. The result showed that a one percent change in RIR in the one lag period brings about a 0.266558 per cent reduction increase in Economic Development. High interest rate would increase the cost of capital and therefore dampens investment. This result conform with the Keynesian and neoclassical theories of investment but is in conflict with financial repression hypothesis of McKinnon (1973) and Shaw (1973) which hypothesized that low interest rate discourages voluntary savings and reduce the amount of investment funds in the financial intermediation process.
The result is consistent with the findings by (Hermes and Lensink, 2001) that high interest rate may discourage investment more especially when government deficit is financed with banking sector loan. PUINV in the first lag impact positively on RPCGDP but statistically insignificant at the five percent level. The PUINV in the current period positively and significantly impacts on economic development. This means that a one percent change in Public Investment in the current period brings about a 4.8349 per cent increase in Economic Development, but in the one lag period, a unit change in PUINV results to a 1.89 per cent increase in Economic Development. The coefficient of determination (adjusted R2) at 0.360375 used to measure the goodness of fit of the model indicates that about 37 per cent of variations of the dependent variable (RPCGDP) is explained jointly by all the regressors in the model. The adjusted R2 value shows that the overall goodness of fit of the model is not satisfactory. The AIC, SIC and HQ, information criteria shows that the model is correctly specified. The F statistics of 3.2536665measuring the joint significance of all the regressors in the model is statistically significant at the five percent level. The equations standard error of 4.447 implies that about two-thirds of the time, the predicted value of RPCGDP would be within 447 per cent of the actual value. The parsimonious model derived from step wise elimination of jointly insignificant variables in the over parameterized model is presented in Section 6.4.
The result reveals that, ECM(-1) is correctly signed and statistically significant. The negative sign depicts the existence of cointegration relationship among the variables in the model while the statistically significant coefficient of the ECM(-1) implies disequilibrium on the long run. The coefficient of the ECM(-1) is -0.6877 which implies that about 69 per cent departure from long run equilibrium is corrected in the short run. It also means that 68 per cent departure from equilibrium in the previous year adjust back to equilibrium in the current year. The speed of adjustment is high.

International Journal of Academic Research in Business and Social Sciences May 2012, Vol. 2, No. 5
ISSN: 2222-6990
79 www.hrmars.com/journals
6.4 Results of parsimonious error correction for domestic private capital accumulation and economic development model Dependent Variable: ΔLPCGDP Coefficient Std. Error t-Statistic Prob. C -1.192371 0.883338 -1.349847 0.1868 ΔLPUINV 4.443988 2.010570 2.210313 0.0346 ΔPINV 3.51E-06 3.35E-06 1.047553 0.3029 ΔRIR(-1) 0.257688 0.159392 1.616693 0.1161 ΔINFLA 0.123144 0.045250 2.721394 0.0106 ECM(-1) -0.687716 0.149000 -4.615531 0.0001 R-squared 0.503116 Mean dependent var 0.013514 Adjusted R-squared 0.422974 S.D. dependent var 5.591470 S.E. of regression 4.247406 Akaike info criterion 5.877887 Sum squared resid 559.2541 Schwarz criterion 6.139117 Log likelihood -102.7409 Hannan-Quinn criter. 5.969983 F-statistic 6.277770 Durbin-Watson stat 1.803243 Prob(F-statistic) 0.000394
Source: Authors Computation
The adjusted R2 of 0.422794 implies that about 42 per cent variations in the dependent variable is explained jointly by all the regressors in the model. The explanatory power of the model is not satisfactory. The F statistics which measure the joint significance of all the regressors in the model is statistically significant and is a good fit.
The Durbin Watson statistics of approximately two (i.e. 1.803243) means absence of serial correlation. The AIC, SC, and HQ, information criteria shows that the model is correctly specified. The model passes the diagnostic and normality test. We therefore reject the null hypothesis that the error terms are not normally distributed at the five percent level of significance. The error term is properly signed and statistically significant. This means that the ordinary least square estimation is unbiased, has minimum variance, consistent and follow a normal distribution.
All the independent variables (ΔPUINV, ΔPINV, ΔRIR(-1) and INFLA) impacts positively on economic development. Public investment (ΔPUINV) and INFLA are significant while ΔPINV and ΔRIR are insignificant. PUINV and PINV conform to apriori expectations, while INFLA and ΔRIR(-1) contradicts aproiri expectations. High inflation and high interest rate increases RPCGDP.
The results showed that a one percent change in PUINV brings about a 4.43 988 per cent increase in Economic Development. Similarly, a unit change in PINV brings about a 0.00000351 per cent increase in Economic Development. Also a unit change in RIR in the one lag period brings about a 0.257688 per cent increase in Economic Development. A unit rise in

International Journal of Academic Research in Business and Social Sciences May 2012, Vol. 2, No. 5
ISSN: 2222-6990
80 www.hrmars.com/journals
inflation rate results to a o.123144 per cent increase in Economic Development. The assertion that high interest rate impact positively on investment leading to economic growth is in line with the Mackinon (1973) and Shaw (1973) financial repression hypothesis. The assertion that high interest rate encourages voluntary savings and makes fund available for investment through the financial intermediation process by banks. This is in conflict with neoclassical and Keynesian theories of investment which advocate for low interest rate.
6.5 Analysis of the result of domestic private capital accumulation and economic
development model The significant positive impact of public investment on RPCGDP is consistent with
Wagner’s law of rising public investment as national economy grows. Also Ranjan and Sharma (2008) in their study on Government Expenditure and Economic Growth evidence from India, formulated a model that posit a positive relationship between public sector expenditure and economic growth. Government spending rises on the long run thereby causing the economy to grow. Islam (2001) in his study on Wagner’s law revisited also found a long-run positive relationship between government expenditure and GNP per capita. The insignificant positive impact of private investment on RPCGDP conform with apriori expectation. There is need to invigorate the growth of the private sector through package of incentives so as to make the positive impact greater or significant. Thus summing up: the null hypothesis of non stationarity of the variable is rejected at the five percent level of significance because all variables are integrated of the order one 1(1) and attained stationarity after first differences. The null hypothesis of no cointegration relationship among the variables is rejected at the five percent level of significance. This is because of the result revealed by Johansen, Trace and Maximal Eigen value test that identified a long run equilibrium relationship among the variables in the model. The error correction term ECM(-1) has the correct sign and statistically significant, thus satisfying the normality assumption. We therefore reject the null hypothesis that the error term is not normally distributed at the five percent level of significance. Private investment does conform to apriori expectations but insignificant. The null hypothesis of no significant positive relationship between private investment and economic development is therefore rejected at the five percent level of significance. 7. Policy implications and recommendation i. In an import dependent economy like Nigeria, cost of imported inputs rises with
devaluation and depreciation of the naira. This contributes to high inflation rates which hinder export growth by reducing international competitiveness and profitability of existing investment and discourage new and potential investment in the export sector. The implication of the above is that there is need to achieve a stable exchange rate that when combine with export incentives will promote all categories of non-oil export in Nigeria.
ii. The negative impact of real interest rate on private investment poses very important qualitative implications for financial sector efficiency. The monetary authority needs to be proactive in the management of interest rate. Effort should be made to see that
International Journal of Academic Research in Business and Social Sciences May 2012, Vol. 2, No. 5
ISSN: 2222-6990
81 www.hrmars.com/journals
interest rate do not derail the target of increasing investment to about 30 per cent of GDP required to unleash a poverty reduction of at least 7 – 8 per cent by 2015.
8. Conclusion Macroeconomic variables like inflation, interest rate, size of the public and private sectors etc. plays a prominent role in domestic private capital accumulation in Nigeria. Incentives aimed at boosting domestic private capital accumulation must be given to indigenous entrepreneurs to enhance their contribution to economic development. The study revealed that Nigeria’s private sector is growing and need to be encouraged to play the leading role in economic development. The ongoing Privatization of public owned enterprises and the establishment of Local Content Development Board (LCDB) should be sustained.
The present trend in national economic management globally where private sector should be the leading sector be vigorously pursued in Nigeria . Public goods required for private sector participation should be provided by government. Gradual and systematic disengagement of the public sector in some preferred sectors of the economy be encouraged. This will inevitably result to public sector investment playing a complementary role to private sector investment.
In the event of uncertainties in the business environment (Business failure), Foreign Private Investment would vanish but domestic private capital vanish no where. It stays and remains with us. Drawing from the analysis presented in this study, macroeconomic policies should have micro foundation so that the impact of the individual components that make up the aggregate will be considered in policy formulation and implementation.

International Journal of Academic Research in Business and Social Sciences May 2012, Vol. 2, No. 5
ISSN: 2222-6990
82 www.hrmars.com/journals
References Adegbite, E. O. & Owualab, S. I. (2007). 1st national finance and banking conference on
economic reform and the Nigerian financial system. A communiqué read at national conference organized by the Department of Finance, FBA University of Lagos, Nigeria, April 3-4.
Akpokodje, G. (1998). Macroeconomic policies and private investment in Nigeria, In B. E.
Aigbokan (Ed.), Rekindling investment for economic development in Nigeria. Ibadan: The Nigeria Economic Society, 21-34.
Akpokodje, G. (2009). Exchange rate volatility and external trade: The experience of selected
African countries. In A. Adenikinju, D. Busari and S. Olofin (Ed.), Applied econometrics and macroeconometric modelling in Nigeria. Ibadan: Ibadan University Press, 76-83.
Bilsborrow, R. (1977). The determinants of fixed investment by manufacturing firms in
developing countries. IMF Staff Papers, 31, 379-403. Chhiber, A. & Daailami, M. (1990). Fiscal and private investment in developing countries:
Recent evidence on key selected issues. Washington D.C.: The World Bank. Chung, W. (2000). Identifying technology transfer in foreign direct investment: Influence of
industry conditions and investing firm motives, stern school of business. New York: New York University Press.
Collier P. (1995). The marginalization of Africa. International Labour Review, 134 (4-5), 541-557. Dehn, J. (2000). Private investment in developing countries: The effect of commodity shocks
and uncertainty. Oxford: Centre for the study of African Economies, University of Oxford.
Demelo and Tybout, (1986). Trade policy and industrial sector responses in the developing
world: Interpreting the evidence. Brookling trade forum, London, May 5. Fry, M. I. (1988). Money, interest and banking in economic development. Baltimore: John
Hopkins University Press. Greenaway, D. & Morrissey, O. (1992). Structural adjustment and liberalization in developing
countries: What lesson have we learned? Kyklos, 46, 241-261. Gunning, J. W. (1994). Trade reforms in Africa: The role of donors. In J. W. Gunning, H. Kox, W.
Toms and Y. de Wix (Eds.), Trade aid and development. London: Macmillan, 86-98.

International Journal of Academic Research in Business and Social Sciences May 2012, Vol. 2, No. 5
ISSN: 2222-6990
83 www.hrmars.com/journals
Harrigan, J. & Mosley, P. (1991). Evaluating the impact of World Bank structural adjustment lending. Journal of Development Economics 48, 419-427.
Islam, A. M. (2001). Wagner’s law revisited: Cointegration and exogeneity tests for the USA.
Applied Economic Letters, 8, 509 – 551. Javorcik, B. S. & Spatareanu, M. (2004). Disentangling FDI spillover effects: What do firm
perception tell us? Washington DC: The World Bank. Jorgenson, D. W. (1963). Capital theory and investment behaviour. The American Economic
Review, 53 (2), 247-259. Konings, J. (2001). The effects of foreign direct investment on domestic firms: Evidence from
firm level panel data in emerging economies. Economics of Transition, 9(3), 619-633. Lemi, A. & Asefa, S. (2001). Foreign direct investment and uncertainty: The case of African
economies. Proceedings of the international business economics research conference, Reno, Nevada, October 8-12.
Mamatzakis, E. C. (2001). The effects of public expenditure on private investment: An empirical
application. In C. C. Paraskevopollos, T. Geogakopoulos and L. Michelis (Eds.), The asymmetric global economy growth, investment and public policy. Toronto: APF Press, 68-79.
McKinnon, R. I. (1973). Money and capital in economic development. Washington DC: The
Brookings Institutions. Michaely, M., Papageorgiou, D. & Choski, A. M. (1991). Liberalizing foreign trade: Lessons of
experience from the developing world. Cambridge, Massachusetts: Basil Blackwell. Oshikoya, T. (1994). Macroeconomic determinants of domestic private investment in Africa: An
empirical analysis. Economic Development and Cultural Change, 42 (3), 573-596. Oyejide, A. T., Ogunkola, O. E. & Ndungu, N. S. (2002). Trade, investment and growth in Africa:
Patterns, trends and puzzle. Paper presented at the plenary session of the African Economic Research Consortiums biannual research seminar, Nairobi, December 15.
Ranjan, K. D. & Sharma, C. (2008). Government expenditure and economic and economic
growth: Evidence from India. Journal of Public Finance, 6 (3), 60-69. Rashid, A. (2005). Public-private investment linkage. A multi variate cointegration analysis. 21st
annual general meeting and conference, Pakistan Institute of Development Economic, Islamabad, December 19-21.
Rodrik, D. (1991). Policy uncertainty and private investment in developing countries. Journal of
Development Economics, 36 (2), 229-242.

International Journal of Academic Research in Business and Social Sciences May 2012, Vol. 2, No. 5
ISSN: 2222-6990
84 www.hrmars.com/journals
Rodrik, D. (1992). The limits of trade policy reform in developing countries. Journal of Economic
Perspectives, 6 (1), 87-105. Serven, L. (2002). Real exchange rate uncertainty and private investment in developing
countries. Policy Research Works Paper, 2823, 12-21. Serven, L. & Salimano, A. (1992). Private investment and macroeconomic adjustment: A survey.
World Bank Research Observer, 7 (1), 95-114. Shaw, E. (1973). Financial deepening in economic development. New York: Oxford University
Press. Sousa, N. (2001). Multinationals and technology transfer through labour training. Paper
presented at CEPR workshop on “labour markets effect on European foreign investments, Dublin, July 5.
Uremadu, S. O. (2006). The impact of real interest rate on savings mobilisation in Nigeria.
Unpublished Ph.D. thesis, University of Nigeria, Nsukka.
International Journal of Academic Research in Business and Social Sciences May 2012, Vol. 2, No. 5
ISSN: 2222-6990
85 www.hrmars.com/journals
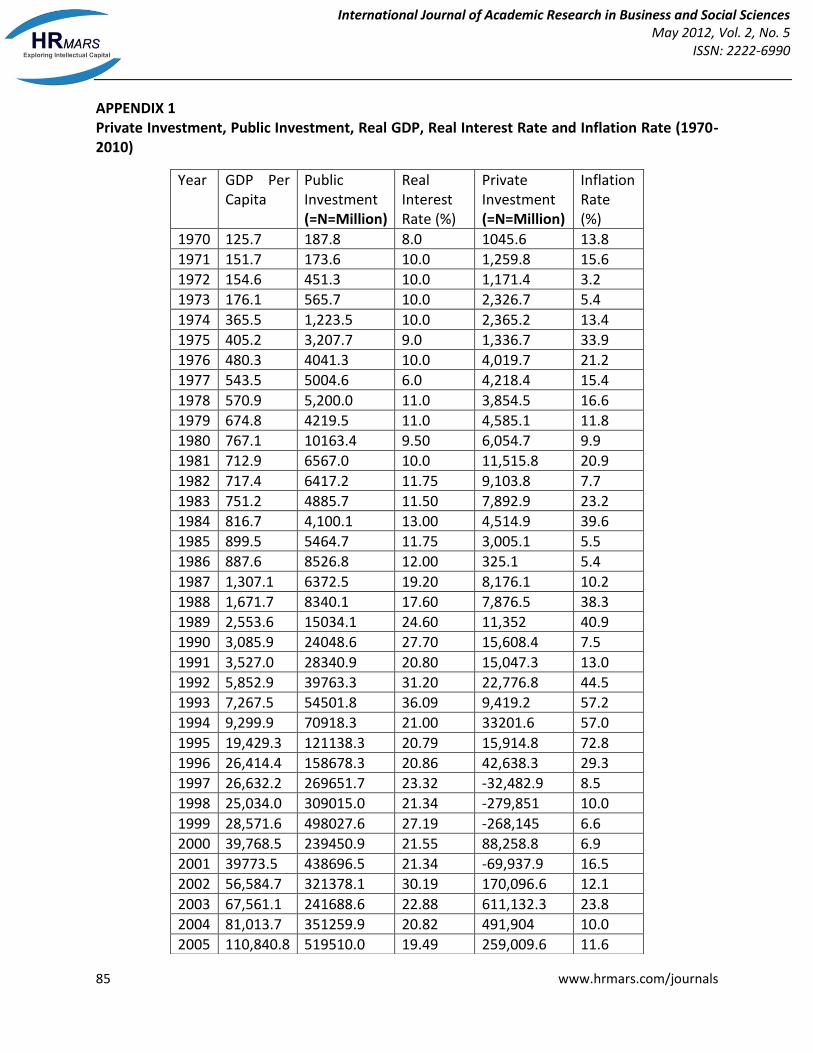
APPENDIX 1 Private Investment, Public Investment, Real GDP, Real Interest Rate and Inflation Rate (1970-2010)
Year GDP Per Capita
Public Investment (=N=Million)
Real Interest Rate (%)
Private Investment (=N=Million)
Inflation Rate (%)
1970 125.7 187.8 8.0 1045.6 13.8
1971 151.7 173.6 10.0 1,259.8 15.6
1972 154.6 451.3 10.0 1,171.4 3.2
1973 176.1 565.7 10.0 2,326.7 5.4
1974 365.5 1,223.5 10.0 2,365.2 13.4
1975 405.2 3,207.7 9.0 1,336.7 33.9
1976 480.3 4041.3 10.0 4,019.7 21.2
1977 543.5 5004.6 6.0 4,218.4 15.4
1978 570.9 5,200.0 11.0 3,854.5 16.6
1979 674.8 4219.5 11.0 4,585.1 11.8
1980 767.1 10163.4 9.50 6,054.7 9.9
1981 712.9 6567.0 10.0 11,515.8 20.9
1982 717.4 6417.2 11.75 9,103.8 7.7
1983 751.2 4885.7 11.50 7,892.9 23.2
1984 816.7 4,100.1 13.00 4,514.9 39.6
1985 899.5 5464.7 11.75 3,005.1 5.5
1986 887.6 8526.8 12.00 325.1 5.4
1987 1,307.1 6372.5 19.20 8,176.1 10.2
1988 1,671.7 8340.1 17.60 7,876.5 38.3
1989 2,553.6 15034.1 24.60 11,352 40.9
1990 3,085.9 24048.6 27.70 15,608.4 7.5
1991 3,527.0 28340.9 20.80 15,047.3 13.0
1992 5,852.9 39763.3 31.20 22,776.8 44.5
1993 7,267.5 54501.8 36.09 9,419.2 57.2
1994 9,299.9 70918.3 21.00 33201.6 57.0
1995 19,429.3 121138.3 20.79 15,914.8 72.8
1996 26,414.4 158678.3 20.86 42,638.3 29.3
1997 26,632.2 269651.7 23.32 -32,482.9 8.5
1998 25,034.0 309015.0 21.34 -279,851 10.0
1999 28,571.6 498027.6 27.19 -268,145 6.6
2000 39,768.5 239450.9 21.55 88,258.8 6.9
2001 39773.5 438696.5 21.34 -69,937.9 16.5
2002 56,584.7 321378.1 30.19 170,096.6 12.1
2003 67,561.1 241688.6 22.88 611,132.3 23.8
2004 81,013.7 351259.9 20.82 491,904 10.0
2005 110,840.8 519510.0 19.49 259,009.6 11.6
International Journal of Academic Research in Business and Social Sciences May 2012, Vol. 2, No. 5
ISSN: 2222-6990
86 www.hrmars.com/journals
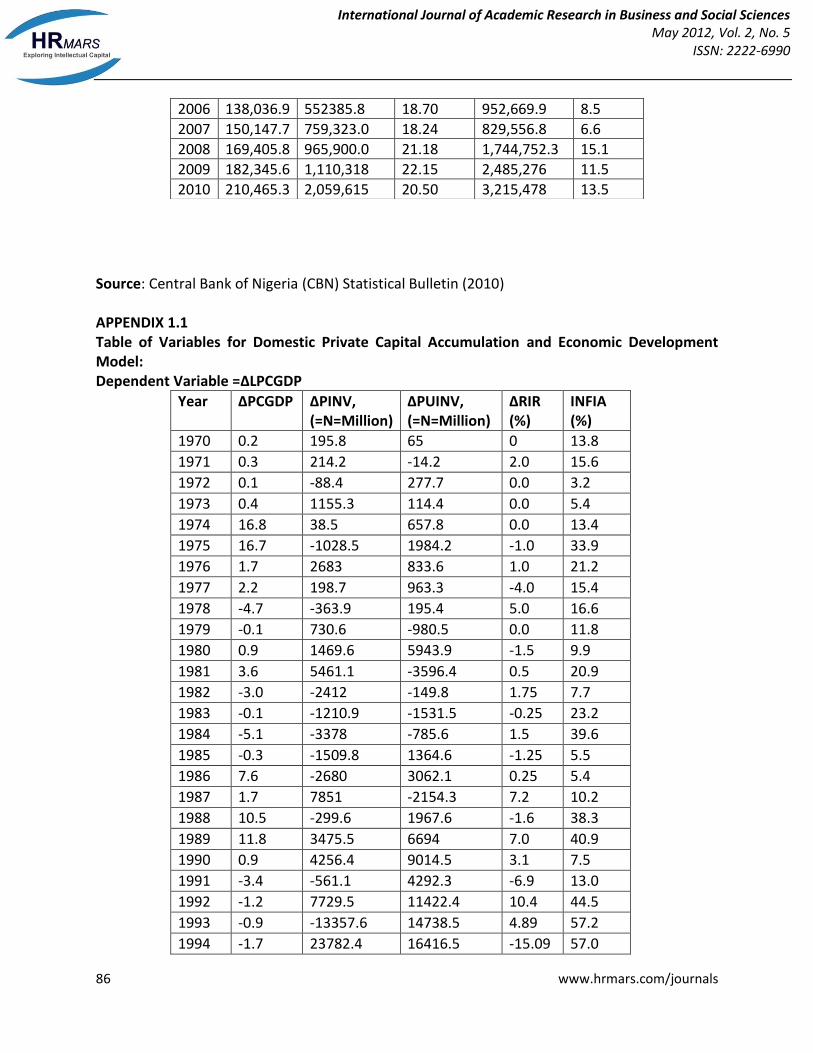
Source: Central Bank of Nigeria (CBN) Statistical Bulletin (2010) APPENDIX 1.1 Table of Variables for Domestic Private Capital Accumulation and Economic Development Model: Dependent Variable =∆LPCGDP
Year ∆PCGDP ∆PINV, (=N=Million)
∆PUINV, (=N=Million)
∆RIR (%)
INFIA (%)
1970 0.2 195.8 65 0 13.8
1971 0.3 214.2 -14.2 2.0 15.6
1972 0.1 -88.4 277.7 0.0 3.2
1973 0.4 1155.3 114.4 0.0 5.4
1974 16.8 38.5 657.8 0.0 13.4
1975 16.7 -1028.5 1984.2 -1.0 33.9
1976 1.7 2683 833.6 1.0 21.2
1977 2.2 198.7 963.3 -4.0 15.4
1978 -4.7 -363.9 195.4 5.0 16.6
1979 -0.1 730.6 -980.5 0.0 11.8
1980 0.9 1469.6 5943.9 -1.5 9.9
1981 3.6 5461.1 -3596.4 0.5 20.9
1982 -3.0 -2412 -149.8 1.75 7.7
1983 -0.1 -1210.9 -1531.5 -0.25 23.2
1984 -5.1 -3378 -785.6 1.5 39.6
1985 -0.3 -1509.8 1364.6 -1.25 5.5
1986 7.6 -2680 3062.1 0.25 5.4
1987 1.7 7851 -2154.3 7.2 10.2
1988 10.5 -299.6 1967.6 -1.6 38.3
1989 11.8 3475.5 6694 7.0 40.9
1990 0.9 4256.4 9014.5 3.1 7.5
1991 -3.4 -561.1 4292.3 -6.9 13.0
1992 -1.2 7729.5 11422.4 10.4 44.5
1993 -0.9 -13357.6 14738.5 4.89 57.2
1994 -1.7 23782.4 16416.5 -15.09 57.0
2006 138,036.9 552385.8 18.70 952,669.9 8.5
2007 150,147.7 759,323.0 18.24 829,556.8 6.6
2008 169,405.8 965,900.0 21.18 1,744,752.3 15.1
2009 182,345.6 1,110,318 22.15 2,485,276 11.5
2010 210,465.3 2,059,615 20.50 3,215,478 13.5

International Journal of Academic Research in Business and Social Sciences May 2012, Vol. 2, No. 5
ISSN: 2222-6990
87 www.hrmars.com/journals
1995 1.4 -17286.8 50220.0 -0.21 72.8
1996 1.0 26723.5 37540 0.07 29.3
1997 0.4 -75121.2 110973.4 2.46 8.5
1998 -1.4 -247368.7 39363.3 -1.98 10.0
1999 -0.3 11706 189012.6 5.85 6.6
2000 2.7 356403.8 -258576.7 -5.64 6.9
2001 -0.8 -158,196.7 199,245.6 -0.21 16.5
2002 0.0 240,034.5 -117,318.4 8.85 12.1
2003 5.0 411,035.7 -79,689.5 -7.31 23.8
2004 -3.0 -119,228.3 109,571.3 -2.06 10.0
2005 -0.1 -232,894.4 168,250.1 -1.33 11.6
2006 -0.5 693,660.3 32,875.8 -0.79 8.5
2007 0.2 -123,113.1 206937.2 -0.46 6.6
2008 0.8 915,195.5 201,577.0 2.94 15.1
2009 0.6 740,523.7 154,418 0.97 11.5
2010 0.4 730,202 949,397 -1.65 13.5
Source: Authors Computation

International Journal of Academic Research in Business and Social Sciences May 2012, Vol. 2, No. 5
ISSN: 2222-6990
88 www.hrmars.com/journals