domestic and foreign investment in advanced economies. …...is used as a proxy of horizontal...
TRANSCRIPT

DOMESTIC AND FOREIGN INVESTMENT IN ADVANCED ECONOMIES. THE ROLE OF INDUSTRY INTEGRATION
Teresa Sastre and Laura Heras Recuero
Documentos de Trabajo N.º 1933
2019

DOMESTIC AND FOREIGN INVESTMENT IN ADVANCED ECONOMIES.
THE ROLE OF INDUSTRY INTEGRATION
DOMESTIC AND FOREIGN INVESTMENT IN ADVANCEDECONOMIES. THE ROLE OF INDUSTRY INTEGRATION (*)
Teresa Sastre and Laura Heras Recuero
BANCO DE ESPAÑA
Documentos de Trabajo. N.º 1933
2019
(*) We thank the participants at the European Network for Research on Investment Workshop organized by the European Investment Bank (Luxembourg, 2018) and the internal seminar at Banco de España (March 2019) for helpful comments and suggestions. The views expressed in this paper are those of the authors and do therefore not necessarily reflect the views of the Banco de España or the Eurosystem.

The Working Paper Series seeks to disseminate original research in economics and finance. All papers have been anonymously refereed. By publishing these papers, the Banco de España aims to contribute to economic analysis and, in particular, to knowledge of the Spanish economy and its international environment.
The opinions and analyses in the Working Paper Series are the responsibility of the authors and, therefore, do not necessarily coincide with those of the Banco de España or the Eurosystem.
The Banco de España disseminates its main reports and most of its publications via the Internet at the following website: http://www.bde.es.
Reproduction for educational and non-commercial purposes is permitted provided that the source is acknowledged.
© BANCO DE ESPAÑA, Madrid, 2019
ISSN: 1579-8666 (on line)

Abstract
Previous research using country or firm data has been inconclusive on the sign of the relation
between domestic and foreign investment. Though several hypotheses have been formulated,
the factors determining the sign of this relationship are not clearly identified yet. In this paper
we explore the role of industry integration in determining the relation between outward foreign
direct investment (FDI) and domestic investment by using disaggregated data at the industry
level and several indicators of industry integration. The proportion of intangible investment
is used as a proxy of horizontal integration and several measures of participation in Global
Value Chains (GVCs) as proxies of vertical integration. The empirical results confirm that the
relationship between outward FDI and domestic investment is very varied and differs across
industries and countries. That relation is positive (complementary) for those industries with
low intensity in intangible investment and high forward integration in GVCs –two features of
vertically integrated industries– and becomes negative for those industries with high intangible
investment (usually more horizontally integrated).
Keywords: investment, foreign direct investment, vertical and horizontal integration, global
value chains.
JEL classification: E22, F21.

Resumen
Los análisis con datos a nivel de empresa o de país no han alcanzado resultados concluyentes
sobre el signo de la relación entre la inversión de las empresas en el exterior y la inversión
en el país de origen de las mismas. Aunque se han formulado varias hipótesis, los factores
que determinan el signo de esta relación aún no han sido claramente identifi cados. En este
trabajo exploramos si el tipo de integración de la industria determina, de algún modo, la
relación entre las salidas de inversión extranjera directa (IED) y la inversión doméstica. Para
ello se utilizan datos desagregados de sectores productivos y varios indicadores del tipo
de integración industrial. La intensidad en activos intangibles se emplea como proxy del
grado de integración horizontal y varios indicadores de participación en las cadenas globales
de valor (CGV) para caracterizar las industrias con mayor grado de integración vertical.
Los resultados empíricos confi rman que la relación entre las salidas de IED y la inversión
doméstica es heterogénea entre sectores y difi ere entre países. La relación es positiva
(complementaria) en aquellos sectores con baja intensidad de inversión en intangibles y
en los de elevada integración en cadenas de valor con predominio de conexiones forward
(hacia el fi nal de la cadena de producción) —dos características de las industrias integradas
verticalmente—. En cambio, resulta negativa en aquellas industrias con un alto grado de
inversión en intangibles, característica más propia de industrias integradas horizontalmente.
Palabras clave: inversión, inversión extranjera directa, integración vertical y horizontal,
cadenas globales de valor.
Códigos JEL: E22, F21.
BANCO DE ESPAÑA 7 DOCUMENTO DE TRABAJO N.º 1933BANCO DE ESPAÑA 7 DOCUMENTO DE TRABAJO N.º 1933
1 Introduction
In the last two decades, the global economy have lived a growing process of internationalisa-
tion of firms, while a large number of emerging countries have become part of the global value
chain. Both processes have been driven by technological developments in the area of com-
munication networks and information (since these developments have substantially reduced
costs), by the liberalisation of capital movements in various regions and by the signing of a
number of trade and economic integration agreements (such as the creation of the euro area
and the European Union, and their enlargement to Eastern European countries, or China
joining the World Trade Organization). All of these factors have contributed to boost the
development of global production chains, a notable increase in cross-border trade and, in
general, the globalisation of economic activity. As a result of this process a growing propor-
tion of world production and investment has been located in emerging economies, driven by
expanding markets and lower production costs. According to UNCTAD, in 1990 the foreign
direct investment inflows to developing countries accounted for 16.9% of total inflows while
in 2017 it was 50.2%.
The internationalisation of production, associated to the expansion of foreign direct in-
vestment, has frequently caused political concerns regarding the effects on home economies.
The fear of either potential job losses or a negative impact on home wages, or both, has been
an argument usually used against the international expansion of companies that were old-time
domestic. Examining the relation between the investments that domestic companies make
abroad and the one generated within the country comes up as a key question in this scenario.
The increasing foreign direct investment to emerging economies has also been pointed out as
a factor behind the slowdown in the recovery of domestic investment in advanced economics
in the aftermath of the financial crisis. Moreover, a potential negative effect of outward
FDI on domestic investment might also be detrimental to productivity developments and,
in some cases, hamper macroeconomic stability by exacerbating external imbalances in some
advanced economies which hold large current account surpluses.
In the event that a multinational firm did not easily increase its worldwide production in
response to rising costs of financial resources, FDI and domestic investment would compete for
financial resources. Then, greater foreign business activity would come at the cost of reduced
domestic activity thus prompting a negative correlation between them1. There is, however,
an alternative view suggesting that growing foreign investment may increase domestic activity
by improving profitability and competitiveness of domestic operations of global firms. In the
case that investment abroad raised the return of domestic production, for example, because
1See Stevens and Lipsey (1992).
2
that investment provided for inputs obtained at low cost, this might positively affect domestic
factor demand (labour and capital) and domestic output. Therefore, whether domestic and
outward investment are positively related (complementary) or negatively (substitutes) seems
to be a matter for empirical testing.
The empirical literature addressing whether outward FDI influences domestic investment
positively (complementarity) or negatively (substitution effect) is generally based on the
theory of comparative advantage (factor endowments and origin and destination country
characteristics) and on the transaction costs paradigm. Countries where labour is relatively
abundant will tend to attract foreign investment from firms seeking labour cost savings. In
the last two decades, cross-country differences in relative factor abundance have given rise
to networks of subsidiaries providing inputs to their parent firms, a process known as global
value chains. These global networks are increasingly associated with foreign direct investment
flows and with an increasing volume of trade in intermediate goods which reflect intra-firm
transactions with production stages located in different countries. However, several empirical
analysis2 have shown that intra-firm trade occurs mostly between capital abundant countries.
The second paradigm used to analyse multinationals decisions to invest abroad is the transac-
tion costs paradigm. For those firms seeking access to foreign markets the existence of barriers
to trade (tariffs, non-tariff barriers), transport costs and oversight and coordination costs are
factors that have a bearing on how they decide to serve foreign markets: either investing
in domestic plants that export their production or establishing a foreign affiliate3, or other
ways to locate production abroad (outsourcing, licensing,. . . ). Advances in communication
technology, trade liberalisation and trade agreements have decreased both international trade
costs (transport costs, tariffs and other trade barriers) and oversight and coordination costs,
thus lowering offshoring and foreign outsourcing costs. This, together with the liberalisation
of capital flows, has modified the previous balance between barriers to trade and coordina-
tion costs, giving rise to an unprecedented expansion of foreign direct investment. Finally,
individual firms’ characteristics and the nature of the industry in which they operate (type of
economies of scale, substitutability among inputs,. . . ) also determine multinational choices
for the organization of production, including its cross-country geographical organisation4.
Though most multinationals adopt complex integration strategies in the geographical or-
ganisation of their production process, the literature has traditionally distinguished two main
polar cases: vertical and horizontal integration of the production process across countries.
Vertical investment takes place when multi-plants fragment production into different stages
2See, for instance, Antras (2003).3In Helpman, Melitz and Yeaple (2004) firms invest abroad when the gains from avoiding trade costs outweigh
the costs of maintaining capacity in multiple markets.4See Helpman (2006).
3
BANCO DE ESPAÑA 8 DOCUMENTO DE TRABAJO N.º 1933BANCO DE ESPAÑA 8 DOCUMENTO DE TRABAJO N.º 1933
that investment provided for inputs obtained at low cost, this might positively affect domestic
factor demand (labour and capital) and domestic output. Therefore, whether domestic and
outward investment are positively related (complementary) or negatively (substitutes) seems
to be a matter for empirical testing.
The empirical literature addressing whether outward FDI influences domestic investment
positively (complementarity) or negatively (substitution effect) is generally based on the
theory of comparative advantage (factor endowments and origin and destination country
characteristics) and on the transaction costs paradigm. Countries where labour is relatively
abundant will tend to attract foreign investment from firms seeking labour cost savings. In
the last two decades, cross-country differences in relative factor abundance have given rise
to networks of subsidiaries providing inputs to their parent firms, a process known as global
value chains. These global networks are increasingly associated with foreign direct investment
flows and with an increasing volume of trade in intermediate goods which reflect intra-firm
transactions with production stages located in different countries. However, several empirical
analysis2 have shown that intra-firm trade occurs mostly between capital abundant countries.
The second paradigm used to analyse multinationals decisions to invest abroad is the transac-
tion costs paradigm. For those firms seeking access to foreign markets the existence of barriers
to trade (tariffs, non-tariff barriers), transport costs and oversight and coordination costs are
factors that have a bearing on how they decide to serve foreign markets: either investing
in domestic plants that export their production or establishing a foreign affiliate3, or other
ways to locate production abroad (outsourcing, licensing,. . . ). Advances in communication
technology, trade liberalisation and trade agreements have decreased both international trade
costs (transport costs, tariffs and other trade barriers) and oversight and coordination costs,
thus lowering offshoring and foreign outsourcing costs. This, together with the liberalisation
of capital flows, has modified the previous balance between barriers to trade and coordina-
tion costs, giving rise to an unprecedented expansion of foreign direct investment. Finally,
individual firms’ characteristics and the nature of the industry in which they operate (type of
economies of scale, substitutability among inputs,. . . ) also determine multinational choices
for the organization of production, including its cross-country geographical organisation4.
Though most multinationals adopt complex integration strategies in the geographical or-
ganisation of their production process, the literature has traditionally distinguished two main
polar cases: vertical and horizontal integration of the production process across countries.
Vertical investment takes place when multi-plants fragment production into different stages
2See, for instance, Antras (2003).3In Helpman, Melitz and Yeaple (2004) firms invest abroad when the gains from avoiding trade costs outweigh
the costs of maintaining capacity in multiple markets.4See Helpman (2006).
3
located in different areas (frequently taking advantage of differences in factor prices across
countries) while horizontal investment is adopted by multi-plant firms that produce similar
goods or services in different countries. Where production is fragmented into stages dis-
tributed across different geographical areas (vertical integration), occasionally structured in
the form of value chains, investment in the different areas will be complementary, either as a
simultaneous response to changes in the determinants of the firm’s global investment or be-
cause production abroad requires inputs produced by the parents or vice versa. Conversely,
if the internationalisation is mainly based on plants in different locations which replicate the
same type of productive process (horizontal integration), —possibly as a result of a decision
to replace exports to these markets with local production, in order to save on transport costs,
benefit from potential labour cost advantages, remove the impact of tariff and non-tariff bar-
riers—, foreign investment would be replacing domestic investment. The knowledge-capital
model of the multinational enterprise provides a synthesis of theory in which both types of
FDI, vertical and horizontal, can emerge endogenously, depending on characteristics of the
home and host country (relative size and factor endowments) and trade costs5.
Most empirical studies can be grouped into two strands. The first one, that has approached
the topic by using aggregated country-data in their analysis, reached mixed conclusions. Un-
der the hypothesis that FDI and domestic investment compete for financial resources that
have a rising cost, a substitutionary relationship can be expected between them. This hypoth-
esis was supported by the first empirical studies on this relationship based on OECD country
data (Feldstein, 1995; Desai, Foley and Hines Jr., 2005) and more recent analyses based on
a wider dataset including emerging economies (Al-Sadig, 2013). However, firms operating
in several countries can access financial resources in different local markets and redistribute
them among the group companies according to their objectives. There may also be that the
relationship between domestic and foreign investment is different in the short and the long
run. At the beginning, when companies decide to move some production stages abroad, a sub-
stitution effect may be expected. Once that step is completed the response to changes in the
determinants of firm’s investment may likely have the same sign across the production stages,
due to the inputs required by the foreign affiliate or by the parent company. Thus time series
evidence for specific countries suggests a positive (complementary) relation between outward
FDI and domestic investment in the long run in Australia and the US, although in Germany
a substitution effect is obtained in the long run (Faeth, 2006; Herzet and Schrooten, 2008).
The fact that the international expansion of firms does not follow a homogenous pattern but
is the outcome of different strategies adopted by multinational firms might be one reason why
country evidence offers these mixed results.
5Markusen et al. (1996), Carr et al. (2001).
4

BANCO DE ESPAÑA 9 DOCUMENTO DE TRABAJO N.º 1933BANCO DE ESPAÑA 9 DOCUMENTO DE TRABAJO N.º 1933
located in different areas (frequently taking advantage of differences in factor prices across
countries) while horizontal investment is adopted by multi-plant firms that produce similar
goods or services in different countries. Where production is fragmented into stages dis-
tributed across different geographical areas (vertical integration), occasionally structured in
the form of value chains, investment in the different areas will be complementary, either as a
simultaneous response to changes in the determinants of the firm’s global investment or be-
cause production abroad requires inputs produced by the parents or vice versa. Conversely,
if the internationalisation is mainly based on plants in different locations which replicate the
same type of productive process (horizontal integration), —possibly as a result of a decision
to replace exports to these markets with local production, in order to save on transport costs,
benefit from potential labour cost advantages, remove the impact of tariff and non-tariff bar-
riers—, foreign investment would be replacing domestic investment. The knowledge-capital
model of the multinational enterprise provides a synthesis of theory in which both types of
FDI, vertical and horizontal, can emerge endogenously, depending on characteristics of the
home and host country (relative size and factor endowments) and trade costs5.
Most empirical studies can be grouped into two strands. The first one, that has approached
the topic by using aggregated country-data in their analysis, reached mixed conclusions. Un-
der the hypothesis that FDI and domestic investment compete for financial resources that
have a rising cost, a substitutionary relationship can be expected between them. This hypoth-
esis was supported by the first empirical studies on this relationship based on OECD country
data (Feldstein, 1995; Desai, Foley and Hines Jr., 2005) and more recent analyses based on
a wider dataset including emerging economies (Al-Sadig, 2013). However, firms operating
in several countries can access financial resources in different local markets and redistribute
them among the group companies according to their objectives. There may also be that the
relationship between domestic and foreign investment is different in the short and the long
run. At the beginning, when companies decide to move some production stages abroad, a sub-
stitution effect may be expected. Once that step is completed the response to changes in the
determinants of firm’s investment may likely have the same sign across the production stages,
due to the inputs required by the foreign affiliate or by the parent company. Thus time series
evidence for specific countries suggests a positive (complementary) relation between outward
FDI and domestic investment in the long run in Australia and the US, although in Germany
a substitution effect is obtained in the long run (Faeth, 2006; Herzet and Schrooten, 2008).
The fact that the international expansion of firms does not follow a homogenous pattern but
is the outcome of different strategies adopted by multinational firms might be one reason why
country evidence offers these mixed results.
5Markusen et al. (1996), Carr et al. (2001).
4
A more granular approach is followed by a second strand of the literature that aims to
account for this diversity by using firm level data. Several studies have examined the relation
between foreign and domestic investment by using data from US multinational firms. This is
the case of Stevens and Lipsey (1992), who found a negative relation between FDI and invest-
ment in home economies on five of the seven US multinational firms that they analysed. On
the contrary, Desai, Foley and Hines Jr. (2005) obtained a positive relation between foreign
and domestic investment, since firms that invest more abroad also invest more in the US. In
the case of Japanese multinational firms, Belderbos et al. (2013) found some substitution of
domestic investment for foreign one. Barba Navaretti et al. (2010) also examine the impact of
outward investment to cheap labour countries on home activities of French and Italian firms
that turn multinational. They found no evidence of a negative effect of outward investment
due to the geographical fragmentation of production and, in the case of Italian firms, foreign
investment even enhance the efficiency of domestic activities in the long term, with a positive
effect on output and employment. Hence the empirical evidence at both macro and micro
level does not clearly indentify those country or firm characteristics determining the type of
foreign investment of multinational firms.
In this paper we explore a different approach based on insights from Helpman (2006),
who points to the role of multinational choices regarding the organization of the production
process (including the cross-country geographical organisation) to understand trade and in-
vestment patterns across national borders, and Helpman et al. (2004) that underline the
need to give an account of cross-industry differences to understand companies’ decision to
invest abroad. This last suggestion is also consistent with the findings by Antras et al (2012)
that the characterisation of different types of vertical integration tends to be stable within
industries and across countries. Then a plausible assumption to characterize the multina-
tional production process is that the way firms organize their production across countries is
not only determined by home and host country comparative advantage and trade costs but
is also linked to industry characteristics related to their production function (i.e. how inputs
are combined to produce output). For that reason we use data disaggregated at the industry
level trying to capture features such as how labour intensive the production process is in each
industry, whether high-skilled workers are needed, the intensity in knowledge-based capital or
other processes that can be used in many plants at the same time or whether more tangible
inputs are needed. By assuming that these differences have a bearing on the type of industry
integration (vertical or horizontal), we aim at identifying vertical and horizontal FDI from
cross-industry differences in their production function, instead of using market conditions in
home and host countries, as suggested by most previously mentioned analyses.
5

BANCO DE ESPAÑA 10 DOCUMENTO DE TRABAJO N.º 1933BANCO DE ESPAÑA 10 DOCUMENTO DE TRABAJO N.º 1933
A more granular approach is followed by a second strand of the literature that aims to
account for this diversity by using firm level data. Several studies have examined the relation
between foreign and domestic investment by using data from US multinational firms. This is
the case of Stevens and Lipsey (1992), who found a negative relation between FDI and invest-
ment in home economies on five of the seven US multinational firms that they analysed. On
the contrary, Desai, Foley and Hines Jr. (2005) obtained a positive relation between foreign
and domestic investment, since firms that invest more abroad also invest more in the US. In
the case of Japanese multinational firms, Belderbos et al. (2013) found some substitution of
domestic investment for foreign one. Barba Navaretti et al. (2010) also examine the impact of
outward investment to cheap labour countries on home activities of French and Italian firms
that turn multinational. They found no evidence of a negative effect of outward investment
due to the geographical fragmentation of production and, in the case of Italian firms, foreign
investment even enhance the efficiency of domestic activities in the long term, with a positive
effect on output and employment. Hence the empirical evidence at both macro and micro
level does not clearly indentify those country or firm characteristics determining the type of
foreign investment of multinational firms.
In this paper we explore a different approach based on insights from Helpman (2006),
who points to the role of multinational choices regarding the organization of the production
process (including the cross-country geographical organisation) to understand trade and in-
vestment patterns across national borders, and Helpman et al. (2004) that underline the
need to give an account of cross-industry differences to understand companies’ decision to
invest abroad. This last suggestion is also consistent with the findings by Antras et al (2012)
that the characterisation of different types of vertical integration tends to be stable within
industries and across countries. Then a plausible assumption to characterize the multina-
tional production process is that the way firms organize their production across countries is
not only determined by home and host country comparative advantage and trade costs but
is also linked to industry characteristics related to their production function (i.e. how inputs
are combined to produce output). For that reason we use data disaggregated at the industry
level trying to capture features such as how labour intensive the production process is in each
industry, whether high-skilled workers are needed, the intensity in knowledge-based capital or
other processes that can be used in many plants at the same time or whether more tangible
inputs are needed. By assuming that these differences have a bearing on the type of industry
integration (vertical or horizontal), we aim at identifying vertical and horizontal FDI from
cross-industry differences in their production function, instead of using market conditions in
home and host countries, as suggested by most previously mentioned analyses.
5
The study by Arndt et al. (2010) argue that industry-level data is more appropriate to
assess the impact of FDI on domestic investment than country or firm-level data, though
their argument is different to ours. Braunerhjelm (2005) also stresses the relevance of indus-
try characteristics to appropriately capture the impact of investing abroad on investment in
home economies. The analysis developed by Geishecker and Gorg (2005) for a wide range
of German industries is also closely related to our identifying strategy. They found that the
link between outward FDI and domestic investment may differs across industries. In par-
ticular, they concluded a predominant vertical FDI component within manufacturing while
FDI would be mainly horizontal in service industries. By using an industry-level approach
in a sample of advanced economies -identifying industries where the predominant production
process is either vertically or horizontally organised-, we think the sign and magnitude of the
relationship between domestic and foreign investment may be captured more accurately than
with country data. If the way firms organize their production were associated to industry
characteristics, the effect of FDI on domestic aggregate investment would be determined by
the industry distribution among vertical and horizontal types, i.e. the productive structure in
home economies. This could help to understand that the FDI effect may be different across
countries with similar characteristics (size, factor endowments, trade costs) and why country
studies have been inconclusive regarding the relationship between foreign and domestic in-
vestment.
To identify the type of production organization predominant in each industry we use
several indicators of vertical and horizontal integration. Usual indicators of participation in
global value chains are used as proxies of vertical integration, as well as two alternative ones
aiming at overcoming some measurement problems pointed out in the recent literature. The
two last ones are built on the proposals by Wang et al (2017). Finally, the share of intangible
investment is used as a proxy of the degree of horizontal integration in each industry, following
a long tradition in industrial organization studies.
2 Empirical model and data
In order to analyse the type of relationship between domestic and foreign direct investment
advanced economies we estimate an equation for gross capital formation with industry-level
data. The specification is based on the neoclassical theory framework where the user cost
of capital plays a prominent role (Jorgenson, 1963). The long run desired capital stock (k∗)depends on demand expectations –proxied by output (y)- and the real user cost of capital
(uc), which is a function of: the relative price of investment to output (pK/pY ), the real cost
6
BANCO DE ESPAÑA 11 DOCUMENTO DE TRABAJO N.º 1933BANCO DE ESPAÑA 11 DOCUMENTO DE TRABAJO N.º 1933
The study by Arndt et al. (2010) argue that industry-level data is more appropriate to
assess the impact of FDI on domestic investment than country or firm-level data, though
their argument is different to ours. Braunerhjelm (2005) also stresses the relevance of indus-
try characteristics to appropriately capture the impact of investing abroad on investment in
home economies. The analysis developed by Geishecker and Gorg (2005) for a wide range
of German industries is also closely related to our identifying strategy. They found that the
link between outward FDI and domestic investment may differs across industries. In par-
ticular, they concluded a predominant vertical FDI component within manufacturing while
FDI would be mainly horizontal in service industries. By using an industry-level approach
in a sample of advanced economies -identifying industries where the predominant production
process is either vertically or horizontally organised-, we think the sign and magnitude of the
relationship between domestic and foreign investment may be captured more accurately than
with country data. If the way firms organize their production were associated to industry
characteristics, the effect of FDI on domestic aggregate investment would be determined by
the industry distribution among vertical and horizontal types, i.e. the productive structure in
home economies. This could help to understand that the FDI effect may be different across
countries with similar characteristics (size, factor endowments, trade costs) and why country
studies have been inconclusive regarding the relationship between foreign and domestic in-
vestment.
To identify the type of production organization predominant in each industry we use
several indicators of vertical and horizontal integration. Usual indicators of participation in
global value chains are used as proxies of vertical integration, as well as two alternative ones
aiming at overcoming some measurement problems pointed out in the recent literature. The
two last ones are built on the proposals by Wang et al (2017). Finally, the share of intangible
investment is used as a proxy of the degree of horizontal integration in each industry, following
a long tradition in industrial organization studies.
2 Empirical model and data
In order to analyse the type of relationship between domestic and foreign direct investment
advanced economies we estimate an equation for gross capital formation with industry-level
data. The specification is based on the neoclassical theory framework where the user cost
of capital plays a prominent role (Jorgenson, 1963). The long run desired capital stock (k∗)depends on demand expectations –proxied by output (y)- and the real user cost of capital
(uc), which is a function of: the relative price of investment to output (pK/pY ), the real cost
6
of finance (ρ), the depreciation rate (δ), the tax rate (t)6 and the change of the relative price
of investment to output (π), which captures expected capital gains /losses.
uc ∼=pK
pY(ρ+ δ − π)
1
(1− t)
k∗ = γ1 ∗ y + γ2 ∗ uc (1)
Lowercase letters indicate logarithm of variables. Firms bring the current capital stock into
line with its desired level by adjusting the level of gross investment (I).
Kt+1 = (1− δ)Kt + It (2)
Several assumptions7 yield a link between investment and capital that allow to rewrite the
expression for the desired capital in terms of gross investment and a lag polynomial structure
applied to investment and the other variables in expression (1).
α(L)� i = β1(L)� y + β2(L)� uc (3)
The simplified notation for lag polynomials stands for a weighted average of past values of
the variables:
α(L)� x = α0 � xt + α1 � xt−1 + α2 � xt−2 + ...
The long run elasticity of investment to output is given by the ratio of polynomials β1(L)/α(L)
for L=1 and is expected to be positive and close to unity, while the elasticity of investment to
user cost is β2(L)/α(L) and it is expected to be negative. Expression (3) provides the basic
specification we use to test whether outward foreign direct investment is complementary to
domestic investment or there is a substitution effect between them.
Our main hypothesis is that the sign of this relationship is related to the type of industry
integration: fragmented into stages distributed across different geographical areas (vertical
integration) or based on plants in different geographical locations which replicate the same
type of productive process (horizontal integration). In this sense, it needs to be pointed
out that there are no pure horizontally or vertically integrated industries but both types of
6The tax adjustment in the user cost of capital should take into account both the effective rate and tax depre-ciation allowances.
7By assuming that net investment is a distributed lag process of changes in the desired capital stock (partialadjustment mechanism due to adjustment costs) and that capital stock and output grow at the same constantrate in the steady state (Bean, 1981), the desired capital stock can be replaced by an expression in terms of grossinvestment and other variables with a lag polynomial structure.
7
BANCO DE ESPAÑA 12 DOCUMENTO DE TRABAJO N.º 1933BANCO DE ESPAÑA 12 DOCUMENTO DE TRABAJO N.º 1933
of finance (ρ), the depreciation rate (δ), the tax rate (t)6 and the change of the relative price
of investment to output (π), which captures expected capital gains /losses.
uc ∼=pK
pY(ρ+ δ − π)
1
(1− t)
k∗ = γ1 ∗ y + γ2 ∗ uc (1)
Lowercase letters indicate logarithm of variables. Firms bring the current capital stock into
line with its desired level by adjusting the level of gross investment (I).
Kt+1 = (1− δ)Kt + It (2)
Several assumptions7 yield a link between investment and capital that allow to rewrite the
expression for the desired capital in terms of gross investment and a lag polynomial structure
applied to investment and the other variables in expression (1).
α(L)� i = β1(L)� y + β2(L)� uc (3)
The simplified notation for lag polynomials stands for a weighted average of past values of
the variables:
α(L)� x = α0 � xt + α1 � xt−1 + α2 � xt−2 + ...
The long run elasticity of investment to output is given by the ratio of polynomials β1(L)/α(L)
for L=1 and is expected to be positive and close to unity, while the elasticity of investment to
user cost is β2(L)/α(L) and it is expected to be negative. Expression (3) provides the basic
specification we use to test whether outward foreign direct investment is complementary to
domestic investment or there is a substitution effect between them.
Our main hypothesis is that the sign of this relationship is related to the type of industry
integration: fragmented into stages distributed across different geographical areas (vertical
integration) or based on plants in different geographical locations which replicate the same
type of productive process (horizontal integration). In this sense, it needs to be pointed
out that there are no pure horizontally or vertically integrated industries but both types of
6The tax adjustment in the user cost of capital should take into account both the effective rate and tax depre-ciation allowances.
7By assuming that net investment is a distributed lag process of changes in the desired capital stock (partialadjustment mechanism due to adjustment costs) and that capital stock and output grow at the same constantrate in the steady state (Bean, 1981), the desired capital stock can be replaced by an expression in terms of grossinvestment and other variables with a lag polynomial structure.
7
integration are frequently combined across the production process. Furthermore, the type of
integration is determined to a large extent by characteristics of the production technology,
thus linked to industry characteristics. Therefore, our empirical strategy is based on using
data disaggregated at the industry-level and identifying industries where the predominant
production process is either vertically or horizontally organised.
The empirical model we estimate is a panel data model as follows:
α(L)� iit = β1(L)� yit + β2(L)� ucit + β3(L)fdiit + β4(L)(fdi ∗ In)it + εit (4)
The dependent variable �ii is the rate of change of real gross capital formation in industry i.
The variable fdi is defined as the ratio of outward foreign direct investment to output in each
industry i and In stands for an indicator variable of vertical / horizontal industry integration
(see table 1 in the Appendix). Several indicators of vertically-organised industries have been
proposed in the empirical literature, such as variables proxying the degree of integration in
global value chains obtained from the world input-output tables8. Other suggested indicators
are the share of high-skilled workers or the intensity in knowledge-based capital. We build on
those suggestions by using the industry intensity in intangible investment as an indicator of
horizontal integration, which has long tradition in industrial organization studies9. Activities
with a technological content linked to creativity and knowledge (intangible assets), that are
usually used on a non-rival basis (they may be used simultaneously at several plants), tend to
generate horizontally organised production structures10. Thus horizontally integrated indus-
tries are expected to show a high share of investment in intangible assets. On the other hand,
in value chains and other vertically integrated industries most of the intermediate inputs are
only used once by each plant along the different production stages. Certainly, intangible
intensity does not provide a clear-cut identification of vertical and horizontal integration, but
it shows to be helpful in identifying the predominant type of integration at the industry level.
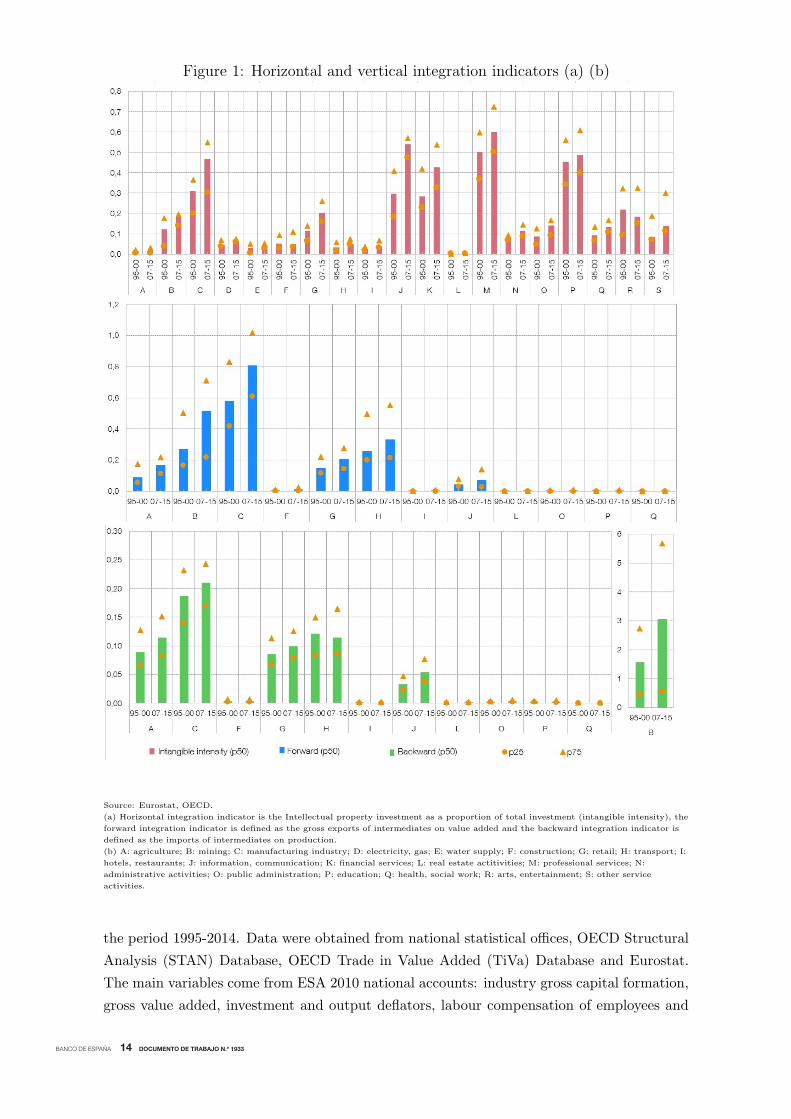
In this study intensity in intangibles is defined as the ratio of investment in intellectual prop-
erty (research and development, databases, software and other intellectual property) to total
gross investment. As shown in figure 1, in advanced economies the intangible median share
ranks from almost zero in agriculture and accommodation and food services up to about 60%
in information and communication and professional and technical activities.
As an alternative approach, we use several indicators of participation in global value chains
as proxies of vertical integration. The first one is based on the idea proposed by Koopman
8For instance, the World Input-Output Database or the WTO-OECD Trade in Value Added (TiVA) Database.9See Perry (1989) for an overview of this literature. More recently, Braunerhjelm (2005) also used research and
development as an integration indicator to conduct a similar exercise for industrial sectors in Sweden.10See Williamson (1985).
8
integration are frequently combined across the production process. Furthermore, the type of
integration is determined to a large extent by characteristics of the production technology,
thus linked to industry characteristics. Therefore, our empirical strategy is based on using
data disaggregated at the industry-level and identifying industries where the predominant
production process is either vertically or horizontally organised.
The empirical model we estimate is a panel data model as follows:
α(L)� iit = β1(L)� yit + β2(L)� ucit + β3(L)fdiit + β4(L)(fdi ∗ In)it + εit (4)
The dependent variable �ii is the rate of change of real gross capital formation in industry i.
The variable fdi is defined as the ratio of outward foreign direct investment to output in each
industry i and In stands for an indicator variable of vertical / horizontal industry integration
(see table 1 in the Appendix). Several indicators of vertically-organised industries have been
proposed in the empirical literature, such as variables proxying the degree of integration in
global value chains obtained from the world input-output tables8. Other suggested indicators
are the share of high-skilled workers or the intensity in knowledge-based capital. We build on
those suggestions by using the industry intensity in intangible investment as an indicator of
horizontal integration, which has long tradition in industrial organization studies9. Activities
with a technological content linked to creativity and knowledge (intangible assets), that are
usually used on a non-rival basis (they may be used simultaneously at several plants), tend to
generate horizontally organised production structures10. Thus horizontally integrated indus-
tries are expected to show a high share of investment in intangible assets. On the other hand,
in value chains and other vertically integrated industries most of the intermediate inputs are
only used once by each plant along the different production stages. Certainly, intangible
intensity does not provide a clear-cut identification of vertical and horizontal integration, but
it shows to be helpful in identifying the predominant type of integration at the industry level.
In this study intensity in intangibles is defined as the ratio of investment in intellectual prop-
erty (research and development, databases, software and other intellectual property) to total
gross investment. As shown in figure 1, in advanced economies the intangible median share
ranks from almost zero in agriculture and accommodation and food services up to about 60%
in information and communication and professional and technical activities.
As an alternative approach, we use several indicators of participation in global value chains
as proxies of vertical integration. The first one is based on the idea proposed by Koopman
8For instance, the World Input-Output Database or the WTO-OECD Trade in Value Added (TiVA) Database.9See Perry (1989) for an overview of this literature. More recently, Braunerhjelm (2005) also used research and
development as an integration indicator to conduct a similar exercise for industrial sectors in Sweden.10See Williamson (1985).
8
BANCO DE ESPAÑA 13 DOCUMENTO DE TRABAJO N.º 1933BANCO DE ESPAÑA 13 DOCUMENTO DE TRABAJO N.º 1933
integration are frequently combined across the production process. Furthermore, the type of
integration is determined to a large extent by characteristics of the production technology,
thus linked to industry characteristics. Therefore, our empirical strategy is based on using
data disaggregated at the industry-level and identifying industries where the predominant
production process is either vertically or horizontally organised.
The empirical model we estimate is a panel data model as follows:
α(L)� iit = β1(L)� yit + β2(L)� ucit + β3(L)fdiit + β4(L)(fdi ∗ In)it + εit (4)
The dependent variable �ii is the rate of change of real gross capital formation in industry i.
The variable fdi is defined as the ratio of outward foreign direct investment to output in each
industry i and In stands for an indicator variable of vertical / horizontal industry integration
(see table 1 in the Appendix). Several indicators of vertically-organised industries have been
proposed in the empirical literature, such as variables proxying the degree of integration in
global value chains obtained from the world input-output tables8. Other suggested indicators
are the share of high-skilled workers or the intensity in knowledge-based capital. We build on
those suggestions by using the industry intensity in intangible investment as an indicator of
horizontal integration, which has long tradition in industrial organization studies9. Activities
with a technological content linked to creativity and knowledge (intangible assets), that are
usually used on a non-rival basis (they may be used simultaneously at several plants), tend to
generate horizontally organised production structures10. Thus horizontally integrated indus-
tries are expected to show a high share of investment in intangible assets. On the other hand,
in value chains and other vertically integrated industries most of the intermediate inputs are
only used once by each plant along the different production stages. Certainly, intangible
intensity does not provide a clear-cut identification of vertical and horizontal integration, but
it shows to be helpful in identifying the predominant type of integration at the industry level.
In this study intensity in intangibles is defined as the ratio of investment in intellectual prop-
erty (research and development, databases, software and other intellectual property) to total
gross investment. As shown in figure 1, in advanced economies the intangible median share
ranks from almost zero in agriculture and accommodation and food services up to about 60%
in information and communication and professional and technical activities.
As an alternative approach, we use several indicators of participation in global value chains
as proxies of vertical integration. The first one is based on the idea proposed by Koopman
8For instance, the World Input-Output Database or the WTO-OECD Trade in Value Added (TiVA) Database.9See Perry (1989) for an overview of this literature. More recently, Braunerhjelm (2005) also used research and
development as an integration indicator to conduct a similar exercise for industrial sectors in Sweden.10See Williamson (1985).
8
et al (2010) that integrated forward and backward measures of vertical specialisation in one
single indicator using value-added trade data. In this paper we use the sum of two vertical
integration indicators (one forward and one backward) which are commonly used in the liter-
ature. The first one is the domestic value added embodied in foreign exports as share of gross
exports, and the backward indicator is the foreign value added share of gross exports. These
indicators are not free of problems when measuring global value chains participation, as it has
been pointed out in more recent literature11. The solely focus on complex GVCs12 and the
use of gross exports in the denominator have been highlighted as two of the main problems
of those indicators. The first aspect leads to the exclusion of those GVCs involving only one
cross-border trade transaction while the second one tends to overestimate the participation
in GVCs in those industries where the level of direct exports is small. Therefore, to address
these issues we construct two additional indicators of backward and forward participation
based on those proposed by Wang et al (2017) by using variables from the OECD Trade in
Value Added database. The forward participation indicator is defined as the ratio of exports
of intermediates over value added and the backward indicator is obtained as the imports
of intermediates over final production. It is worth mentioning that the correlation between
these vertical integration variables and our indicator of horizontal integration is very close
to zero. In practice, this means GVC indicators and intellectual property contain different
information as expected, and when using them in an alternative way, it would be reassuring
in case the results obtained with both of them are mutually consistent.
Equation (4) also includes the controls of a basic investment equation, represented by
expression (3): the rate of change of output in industry i (�yi) and the rate of change of
user cost of capital in industry (�uci). The latter is defined as in expression (1) assuming
the industry depreciation rate keeps fairly stable over time. The tax component considered
in the user cost proxies very roghtly the actual effect of taxation on this cost (due to data
availabity issues13). The error term in equation (4) does not include industry-specific fixed
effects that could affect investment levels since the equation is specified in first differences
and they are wiped out.
11Wang et al (2017).12Complex value chains are those which involve at least two cross-border trade transactions.13Information on tax depreciation allowances at industry-level seems not to be available. Therefore, only country
corporate tax rates were considered to obtain the user cost variable.
9
This study employs a dataset that contains information for 19 productive sectors (ISIC 4,
highest level) –including both industrial and service sectors- in 19 advanced economies over
the period 1995-2014. Data were obtained from national statistical offices, OECD Structural
Analysis (STAN) Database, OECD Trade in Value Added (TiVa) Database and Eurostat.
The main variables come from ESA 2010 national accounts: industry gross capital formation,
gross value added, investment and output deflators, labour compensation of employees and
investment in intellectual property. Industry outward foreign direct investment14, country
interest rates and vertical integration indicators were obtained from OECD databases while
effective tax rates are those of the Oxford University Centre for Business Taxation. All data
are at yearly frequency.
3 Main empirical results
Horizontal integration
Table 1 shows the main results of estimating equation (4) when the horizontal integration in-
dicator is considered. In the first two columns the specification includes FDI outflows without
the horizontal integration indicator. The first column corresponds to our basic specification
while column (2) incorporates country fixed effects to give account of possible unobserved
time-invariant differences across countries such as labour market regulation or institutional
framework that could impact industry investment rates of change. Column (3) has the same
specification as column (2) with an additional variable: the interaction of foreign investment
with the industry intangible intensity which is our proposed horizontal integration indicator.
The three first columns were estimated by ordinary least squares (OLS). The coefficient on
value added is positive and the one on user cost is negative as expected according to the neo-
classical model. Both are statistically significant at 1 percent level. In all specifications the
estimated coefficient of FDI outflows is also significant and positive indicating that industry-
level domestic investment tends to grow while foreign direct investment abroad also increases,
suggesting some source of complementarity between them. However, as reported in column
(3) this complementarity is diminished in those industries with a high intangible share, the
most prone to be horizontally integrated. Furthermore, if intangible intensity is high enough
the link between domestic and foreign direct investment may become negative pointing to a
substitution between them. Thus, the more horizontally integrated an industry is, their FDI
outflows will usually be associated with lower domestic investment15.
14Data sources for FDI figures are harmonized balance of payments statistics according to the Fifth Manual ofthe Balance of Payments (BMD3).
15Different time-changing controls (country and time fixed effects, as well as country-time fixed effecs) werealso tested. It was found that industry production and user cost of capital account for most of the changes inmacroeconomic conditions, even common cross-country effects.
11
BANCO DE ESPAÑA 14 DOCUMENTO DE TRABAJO N.º 1933BANCO DE ESPAÑA 14 DOCUMENTO DE TRABAJO N.º 1933
Figure 1: Horizontal and vertical integration indicators (a) (b)
Source: Eurostat, OECD.
(a) Horizontal integration indicator is the Intellectual property investment as a proportion of total investment (intangible intensity), the
forward integration indicator is defined as the gross exports of intermediates on value added and the backward integration indicator is
defined as the imports of intermediates on production.
(b) A: agriculture; B: mining; C: manufacturing industry; D: electricity, gas; E: water supply; F: construction; G: retail; H: transport; I:
hotels, restaurants; J: information, communication; K: financial services; L: real estate actitivities; M: professional services; N:
administrative activities; O: public administration; P: education; Q: health, social work; R: arts, entertainment; S: other service
activities.
10
This study employs a dataset that contains information for 19 productive sectors (ISIC 4,
highest level) –including both industrial and service sectors- in 19 advanced economies over
the period 1995-2014. Data were obtained from national statistical offices, OECD Structural
Analysis (STAN) Database, OECD Trade in Value Added (TiVa) Database and Eurostat.
The main variables come from ESA 2010 national accounts: industry gross capital formation,
gross value added, investment and output deflators, labour compensation of employees and
investment in intellectual property. Industry outward foreign direct investment14, country
interest rates and vertical integration indicators were obtained from OECD databases while
effective tax rates are those of the Oxford University Centre for Business Taxation. All data
are at yearly frequency.
3 Main empirical results
Horizontal integration
Table 1 shows the main results of estimating equation (4) when the horizontal integration in-
dicator is considered. In the first two columns the specification includes FDI outflows without
the horizontal integration indicator. The first column corresponds to our basic specification
while column (2) incorporates country fixed effects to give account of possible unobserved
time-invariant differences across countries such as labour market regulation or institutional
framework that could impact industry investment rates of change. Column (3) has the same
specification as column (2) with an additional variable: the interaction of foreign investment
with the industry intangible intensity which is our proposed horizontal integration indicator.
The three first columns were estimated by ordinary least squares (OLS). The coefficient on
value added is positive and the one on user cost is negative as expected according to the neo-
classical model. Both are statistically significant at 1 percent level. In all specifications the
estimated coefficient of FDI outflows is also significant and positive indicating that industry-
level domestic investment tends to grow while foreign direct investment abroad also increases,
suggesting some source of complementarity between them. However, as reported in column
(3) this complementarity is diminished in those industries with a high intangible share, the
most prone to be horizontally integrated. Furthermore, if intangible intensity is high enough
the link between domestic and foreign direct investment may become negative pointing to a
substitution between them. Thus, the more horizontally integrated an industry is, their FDI
outflows will usually be associated with lower domestic investment15.
14Data sources for FDI figures are harmonized balance of payments statistics according to the Fifth Manual ofthe Balance of Payments (BMD3).
15Different time-changing controls (country and time fixed effects, as well as country-time fixed effecs) werealso tested. It was found that industry production and user cost of capital account for most of the changes inmacroeconomic conditions, even common cross-country effects.
11

BANCO DE ESPAÑA 15 DOCUMENTO DE TRABAJO N.º 1933BANCO DE ESPAÑA 15 DOCUMENTO DE TRABAJO N.º 1933
This study employs a dataset that contains information for 19 productive sectors (ISIC 4,
highest level) –including both industrial and service sectors- in 19 advanced economies over
the period 1995-2014. Data were obtained from national statistical offices, OECD Structural
Analysis (STAN) Database, OECD Trade in Value Added (TiVa) Database and Eurostat.
The main variables come from ESA 2010 national accounts: industry gross capital formation,
gross value added, investment and output deflators, labour compensation of employees and
investment in intellectual property. Industry outward foreign direct investment14, country
interest rates and vertical integration indicators were obtained from OECD databases while
effective tax rates are those of the Oxford University Centre for Business Taxation. All data
are at yearly frequency.
3 Main empirical results
Horizontal integration
Table 1 shows the main results of estimating equation (4) when the horizontal integration in-
dicator is considered. In the first two columns the specification includes FDI outflows without
the horizontal integration indicator. The first column corresponds to our basic specification
while column (2) incorporates country fixed effects to give account of possible unobserved
time-invariant differences across countries such as labour market regulation or institutional
framework that could impact industry investment rates of change. Column (3) has the same
specification as column (2) with an additional variable: the interaction of foreign investment
with the industry intangible intensity which is our proposed horizontal integration indicator.
The three first columns were estimated by ordinary least squares (OLS). The coefficient on
value added is positive and the one on user cost is negative as expected according to the neo-
classical model. Both are statistically significant at 1 percent level. In all specifications the
estimated coefficient of FDI outflows is also significant and positive indicating that industry-
level domestic investment tends to grow while foreign direct investment abroad also increases,
suggesting some source of complementarity between them. However, as reported in column
(3) this complementarity is diminished in those industries with a high intangible share, the
most prone to be horizontally integrated. Furthermore, if intangible intensity is high enough
the link between domestic and foreign direct investment may become negative pointing to a
substitution between them. Thus, the more horizontally integrated an industry is, their FDI
outflows will usually be associated with lower domestic investment15.
14Data sources for FDI figures are harmonized balance of payments statistics according to the Fifth Manual ofthe Balance of Payments (BMD3).
15Different time-changing controls (country and time fixed effects, as well as country-time fixed effecs) werealso tested. It was found that industry production and user cost of capital account for most of the changes inmacroeconomic conditions, even common cross-country effects.
11
Potential endogeneity issues due to the simultaneous determination of industry gross fixed
investment and the user cost (that includes the relative price of capital) were partially ad-
dressed by including the user cost lagged one period in OLS estimations. There are, however,
other sources of bias in these estimates like the correlation between output and investment
and the two-way relationship between FDI and investment. Firms usually make simultane-
ous decisions about domestic and foreign investment. Those factors that lead firms to change
investment in home countries (market or trade conditions, production costs, etc.) may also
determine the rate of investment abroad.
Table 1: Horizontal integration estimations
(1) (2) (3) (4) (5)OLS OLS OLS IV IV
Dependent variable: D.log(Real investment)D.log (Real investment (-1)) -0.07 -0.09 -0.14 -0.04 -0.12**
(0.06) (0.06) (0.09) (0.06) (0.06)D.log (Value added) 0.53*** 0.50*** 0.61*** 1.34*** 1.21***
(0.15) (0.14) (0.19) (0.28) (0.26)D.log (User cost of capital (-1)) -0.23*** -0.21*** -0.16*** -0.26*** -0.26***
(0.05) (0.05) (0.05) (0.09) (0.09)FDI (-1) 0.03*** 0.03*** 0.19*** 0.05** 0.60**
(0.00) (0.01) (0.03) (0.02) (0.30)FDI*Intelectual property -0.48*** -1.73**
(0.07) (0.88)Fixed effects - Country Country - -No. of Observations 2494 2494 1847 2319 1719No. of Groups 202 202 146 200 1442nd Order Correlation (p-value) - - - 0.96 0.77Hansen test (p-value) - - - 0.09 0.23
Notes: All regressions include a constant term. Robust standard errors are shown in parenthesis and are clustered at the industry-level
in the case of OLS estimations. Robust standard clustered errors corrected at country-industry level are reported in the case of IV
estimations. Asterisks (*,**,***) indicate the level of significance (10%, 5%, 1%) of coefficients. Equations (4) and (5) are estimated by
using the system GMM procedure. Lagged investment, valued added and user cost of capital are instrumented with internal instruments
(lags for the difference equation and differences for the level equation). FDI is instrumented with the fitted values of country regressions
on the GDP of emerging economies and sector fixed effects.
To address the potential bias in OLS estimates due to these sources of endogeneity, equa-
tion (4) was also estimated by instrumental variable techniques. Two types of instruments
were used: 1) a set of internal instruments based in Arellano and Bond’s methodology16, that
are used for output and user cost variables; 2) an instrument for FDI outflows obtained from a
regression of this variable on GDP rate of change in several emerging economies areas (Latin
America, East Asia and Eastern Europe) which are the main destination countries of foreign
direct investment from advanced economies17. The regressions are country-dependent since
cultural and historical reasons seem to favour FDI destinations that are different for each
advanced economy. The fitted values of these regressions are used to compute the instrument
16Appropriate lagged values (level) are used as instruments for the variables in an equation in differences.17This idea is similar to the one addopted by Desai et al (2009) that obtain instruments in this way, with the
difference that they use firm-level data.
12
This study employs a dataset that contains information for 19 productive sectors (ISIC 4,
highest level) –including both industrial and service sectors- in 19 advanced economies over
the period 1995-2014. Data were obtained from national statistical offices, OECD Structural
Analysis (STAN) Database, OECD Trade in Value Added (TiVa) Database and Eurostat.
The main variables come from ESA 2010 national accounts: industry gross capital formation,
gross value added, investment and output deflators, labour compensation of employees and
investment in intellectual property. Industry outward foreign direct investment14, country
interest rates and vertical integration indicators were obtained from OECD databases while
effective tax rates are those of the Oxford University Centre for Business Taxation. All data
are at yearly frequency.
3 Main empirical results
Horizontal integration
Table 1 shows the main results of estimating equation (4) when the horizontal integration in-
dicator is considered. In the first two columns the specification includes FDI outflows without
the horizontal integration indicator. The first column corresponds to our basic specification
while column (2) incorporates country fixed effects to give account of possible unobserved
time-invariant differences across countries such as labour market regulation or institutional
framework that could impact industry investment rates of change. Column (3) has the same
specification as column (2) with an additional variable: the interaction of foreign investment
with the industry intangible intensity which is our proposed horizontal integration indicator.
The three first columns were estimated by ordinary least squares (OLS). The coefficient on
value added is positive and the one on user cost is negative as expected according to the neo-
classical model. Both are statistically significant at 1 percent level. In all specifications the
estimated coefficient of FDI outflows is also significant and positive indicating that industry-
level domestic investment tends to grow while foreign direct investment abroad also increases,
suggesting some source of complementarity between them. However, as reported in column
(3) this complementarity is diminished in those industries with a high intangible share, the
most prone to be horizontally integrated. Furthermore, if intangible intensity is high enough
the link between domestic and foreign direct investment may become negative pointing to a
substitution between them. Thus, the more horizontally integrated an industry is, their FDI
outflows will usually be associated with lower domestic investment15.
14Data sources for FDI figures are harmonized balance of payments statistics according to the Fifth Manual ofthe Balance of Payments (BMD3).
15Different time-changing controls (country and time fixed effects, as well as country-time fixed effecs) werealso tested. It was found that industry production and user cost of capital account for most of the changes inmacroeconomic conditions, even common cross-country effects.
11

BANCO DE ESPAÑA 16 DOCUMENTO DE TRABAJO N.º 1933BANCO DE ESPAÑA 16 DOCUMENTO DE TRABAJO N.º 1933
Potential endogeneity issues due to the simultaneous determination of industry gross fixed
investment and the user cost (that includes the relative price of capital) were partially ad-
dressed by including the user cost lagged one period in OLS estimations. There are, however,
other sources of bias in these estimates like the correlation between output and investment
and the two-way relationship between FDI and investment. Firms usually make simultane-
ous decisions about domestic and foreign investment. Those factors that lead firms to change
investment in home countries (market or trade conditions, production costs, etc.) may also
determine the rate of investment abroad.
Table 1: Horizontal integration estimations
(1) (2) (3) (4) (5)OLS OLS OLS IV IV
Dependent variable: D.log(Real investment)D.log (Real investment (-1)) -0.07 -0.09 -0.14 -0.04 -0.12**
(0.06) (0.06) (0.09) (0.06) (0.06)D.log (Value added) 0.53*** 0.50*** 0.61*** 1.34*** 1.21***
(0.15) (0.14) (0.19) (0.28) (0.26)D.log (User cost of capital (-1)) -0.23*** -0.21*** -0.16*** -0.26*** -0.26***
(0.05) (0.05) (0.05) (0.09) (0.09)FDI (-1) 0.03*** 0.03*** 0.19*** 0.05** 0.60**
(0.00) (0.01) (0.03) (0.02) (0.30)FDI*Intelectual property -0.48*** -1.73**
(0.07) (0.88)Fixed effects - Country Country - -No. of Observations 2494 2494 1847 2319 1719No. of Groups 202 202 146 200 1442nd Order Correlation (p-value) - - - 0.96 0.77Hansen test (p-value) - - - 0.09 0.23
Notes: All regressions include a constant term. Robust standard errors are shown in parenthesis and are clustered at the industry-level
in the case of OLS estimations. Robust standard clustered errors corrected at country-industry level are reported in the case of IV
estimations. Asterisks (*,**,***) indicate the level of significance (10%, 5%, 1%) of coefficients. Equations (4) and (5) are estimated by
using the system GMM procedure. Lagged investment, valued added and user cost of capital are instrumented with internal instruments
(lags for the difference equation and differences for the level equation). FDI is instrumented with the fitted values of country regressions
on the GDP of emerging economies and sector fixed effects.
To address the potential bias in OLS estimates due to these sources of endogeneity, equa-
tion (4) was also estimated by instrumental variable techniques. Two types of instruments
were used: 1) a set of internal instruments based in Arellano and Bond’s methodology16, that
are used for output and user cost variables; 2) an instrument for FDI outflows obtained from a
regression of this variable on GDP rate of change in several emerging economies areas (Latin
America, East Asia and Eastern Europe) which are the main destination countries of foreign
direct investment from advanced economies17. The regressions are country-dependent since
cultural and historical reasons seem to favour FDI destinations that are different for each
advanced economy. The fitted values of these regressions are used to compute the instrument
16Appropriate lagged values (level) are used as instruments for the variables in an equation in differences.17This idea is similar to the one addopted by Desai et al (2009) that obtain instruments in this way, with the
difference that they use firm-level data.
12
for FDI in the estimations reported in columns (4) and (5) of table 1. This instrument is
correlated with economic factors at the FDI destination countries and is much less likely to
be correlated with factors underlying domestic investment.
The IV estimation technique used is the system-GMM estimator18 which has better prop-
erties than Arellano-Bond estimator when lagged levels are weak instruments. Sargan/Hansen
test is performed to check for the validity of the over-identifying conditions implied by the
use of the instruments in the estimations. In addition, we test for the absence of second order
serial correlation of the differenced error term, an assumption needed to use Arellano-Bond
and system-GMM estimators.
Figure 2: Effect of foreign investment on real investment growth (a)(b)
Source: Eurostat, OECD, own calculations.
(a) A: agriculture; B: mining; C: manufacturing industry; D: electricity, gas; E: water supply; F: construction; G: retail; H: transport; I:
hotels, restaurants; J: information, communication; K: financial services; L: real estate actitivities; M: professional services; N:
administrative activities; O: public administration; P: education; Q: health, social work; R: arts, entertainment; S: other service
activities.
(b) Assessed at the median of intangible assets for each sector.
The results presented in columns (4) and (5) show that the coefficient of outward FDI is
positive, as in OLS estimations, and its interaction with the intellectual property intensity
keeps on being negative. The main changes are in the magnitude of the coefficients, consistent
with an endogeneity bias of OLS estimates. The IV estimations are larger (in absolute value)
both for the FDI terms and for the other variables in equation (4). According to these results,
the effect of FDI on domestic investment is positive for those industries in which intensity in
intangibles is low. If it is close to zero, the short run effect of a 1 percent point increase in FDI
outflows (measured by the ratio of FDI flows to industry gross value added) is an increase of
0.60 percentage points in the change of rate of domestic investment, as reported in column
(5). On the other hand, for those industries with high or increasing intensity in intangibles
18See Arellano (1995) and Blundell (1998).
13
Potential endogeneity issues due to the simultaneous determination of industry gross fixed
investment and the user cost (that includes the relative price of capital) were partially ad-
dressed by including the user cost lagged one period in OLS estimations. There are, however,
other sources of bias in these estimates like the correlation between output and investment
and the two-way relationship between FDI and investment. Firms usually make simultane-
ous decisions about domestic and foreign investment. Those factors that lead firms to change
investment in home countries (market or trade conditions, production costs, etc.) may also
determine the rate of investment abroad.
Table 1: Horizontal integration estimations
(1) (2) (3) (4) (5)OLS OLS OLS IV IV
Dependent variable: D.log(Real investment)D.log (Real investment (-1)) -0.07 -0.09 -0.14 -0.04 -0.12**
(0.06) (0.06) (0.09) (0.06) (0.06)D.log (Value added) 0.53*** 0.50*** 0.61*** 1.34*** 1.21***
(0.15) (0.14) (0.19) (0.28) (0.26)D.log (User cost of capital (-1)) -0.23*** -0.21*** -0.16*** -0.26*** -0.26***
(0.05) (0.05) (0.05) (0.09) (0.09)FDI (-1) 0.03*** 0.03*** 0.19*** 0.05** 0.60**
(0.00) (0.01) (0.03) (0.02) (0.30)FDI*Intelectual property -0.48*** -1.73**
(0.07) (0.88)Fixed effects - Country Country - -No. of Observations 2494 2494 1847 2319 1719No. of Groups 202 202 146 200 1442nd Order Correlation (p-value) - - - 0.96 0.77Hansen test (p-value) - - - 0.09 0.23
Notes: All regressions include a constant term. Robust standard errors are shown in parenthesis and are clustered at the industry-level
in the case of OLS estimations. Robust standard clustered errors corrected at country-industry level are reported in the case of IV
estimations. Asterisks (*,**,***) indicate the level of significance (10%, 5%, 1%) of coefficients. Equations (4) and (5) are estimated by
using the system GMM procedure. Lagged investment, valued added and user cost of capital are instrumented with internal instruments
(lags for the difference equation and differences for the level equation). FDI is instrumented with the fitted values of country regressions
on the GDP of emerging economies and sector fixed effects.
To address the potential bias in OLS estimates due to these sources of endogeneity, equa-
tion (4) was also estimated by instrumental variable techniques. Two types of instruments
were used: 1) a set of internal instruments based in Arellano and Bond’s methodology16, that
are used for output and user cost variables; 2) an instrument for FDI outflows obtained from a
regression of this variable on GDP rate of change in several emerging economies areas (Latin
America, East Asia and Eastern Europe) which are the main destination countries of foreign
direct investment from advanced economies17. The regressions are country-dependent since
cultural and historical reasons seem to favour FDI destinations that are different for each
advanced economy. The fitted values of these regressions are used to compute the instrument
16Appropriate lagged values (level) are used as instruments for the variables in an equation in differences.17This idea is similar to the one addopted by Desai et al (2009) that obtain instruments in this way, with the
difference that they use firm-level data.
12
for FDI in the estimations reported in columns (4) and (5) of table 1. This instrument is
correlated with economic factors at the FDI destination countries and is much less likely to
be correlated with factors underlying domestic investment.
The IV estimation technique used is the system-GMM estimator18 which has better prop-
erties than Arellano-Bond estimator when lagged levels are weak instruments. Sargan/Hansen
test is performed to check for the validity of the over-identifying conditions implied by the
use of the instruments in the estimations. In addition, we test for the absence of second order
serial correlation of the differenced error term, an assumption needed to use Arellano-Bond
and system-GMM estimators.
Figure 2: Effect of foreign investment on real investment growth (a)(b)
Source: Eurostat, OECD, own calculations.
(a) A: agriculture; B: mining; C: manufacturing industry; D: electricity, gas; E: water supply; F: construction; G: retail; H: transport; I:
hotels, restaurants; J: information, communication; K: financial services; L: real estate actitivities; M: professional services; N:
administrative activities; O: public administration; P: education; Q: health, social work; R: arts, entertainment; S: other service
activities.
(b) Assessed at the median of intangible assets for each sector.
The results presented in columns (4) and (5) show that the coefficient of outward FDI is
positive, as in OLS estimations, and its interaction with the intellectual property intensity
keeps on being negative. The main changes are in the magnitude of the coefficients, consistent
with an endogeneity bias of OLS estimates. The IV estimations are larger (in absolute value)
both for the FDI terms and for the other variables in equation (4). According to these results,
the effect of FDI on domestic investment is positive for those industries in which intensity in
intangibles is low. If it is close to zero, the short run effect of a 1 percent point increase in FDI
outflows (measured by the ratio of FDI flows to industry gross value added) is an increase of
0.60 percentage points in the change of rate of domestic investment, as reported in column
(5). On the other hand, for those industries with high or increasing intensity in intangibles
18See Arellano (1995) and Blundell (1998).
13

BANCO DE ESPAÑA 17 DOCUMENTO DE TRABAJO N.º 1933BANCO DE ESPAÑA 17 DOCUMENTO DE TRABAJO N.º 1933
for FDI in the estimations reported in columns (4) and (5) of table 1. This instrument is
correlated with economic factors at the FDI destination countries and is much less likely to
be correlated with factors underlying domestic investment.
The IV estimation technique used is the system-GMM estimator18 which has better prop-
erties than Arellano-Bond estimator when lagged levels are weak instruments. Sargan/Hansen
test is performed to check for the validity of the over-identifying conditions implied by the
use of the instruments in the estimations. In addition, we test for the absence of second order
serial correlation of the differenced error term, an assumption needed to use Arellano-Bond
and system-GMM estimators.
Figure 2: Effect of foreign investment on real investment growth (a)(b)
Source: Eurostat, OECD, own calculations.
(a) A: agriculture; B: mining; C: manufacturing industry; D: electricity, gas; E: water supply; F: construction; G: retail; H: transport; I:
hotels, restaurants; J: information, communication; K: financial services; L: real estate actitivities; M: professional services; N:
administrative activities; O: public administration; P: education; Q: health, social work; R: arts, entertainment; S: other service
activities.
(b) Assessed at the median of intangible assets for each sector.
The results presented in columns (4) and (5) show that the coefficient of outward FDI is
positive, as in OLS estimations, and its interaction with the intellectual property intensity
keeps on being negative. The main changes are in the magnitude of the coefficients, consistent
with an endogeneity bias of OLS estimates. The IV estimations are larger (in absolute value)
both for the FDI terms and for the other variables in equation (4). According to these results,
the effect of FDI on domestic investment is positive for those industries in which intensity in
intangibles is low. If it is close to zero, the short run effect of a 1 percent point increase in FDI
outflows (measured by the ratio of FDI flows to industry gross value added) is an increase of
0.60 percentage points in the change of rate of domestic investment, as reported in column
(5). On the other hand, for those industries with high or increasing intensity in intangibles
18See Arellano (1995) and Blundell (1998).
13
the impact on domestic investment will be lower and it depends on the intangible share of
investment in each industry. In some cases it may become negative as shown in figure 2 that
presents the net effect for the median of different industries. For example, in manufacturing
FDI outflows would have had a negative impact on domestic investment in the period after the
crisis, given the increase in intangible intensity. In professional services (M) the effect would
have been negative for the whole period covered by our database. Furthermore, in those
countries in which intensity in intellectual property is low (for example in manufacturing)
the effect of FDI may still be positive in the latest years. The diversity of effects across
industries may help explain why firm and country studies –that do not take into account the
vertical /horizontal integration of production organisation- have been inconclusive regarding
the relationship between foreign and domestic investment.
Vertical integration
Table 2 shows the results of estimating equation (4) using several indicators of vertical in-
tegration. The first column corresponds to the specification when the vertical integration
indicator inspired by Koopman et al (2010) is interacted with the FDI variable. Column
(2) displays the estimation with our proposed forward integration indicator and column (3)
shows the results with our backward integration indicator, both based on Wang et al (2017).
In all of them the coefficients of value added and user cost of capital remain with the expected
sign and are significant at 1 percent level. The effect of FDI outflows on domestic invest-
ment is positive and, given the positive sign of the interaction with the forward indicator,
it seems to be increasing with the degree of industry forward integration into value chains
(column 2). This means that the relationship between outward FDI and domestic investment
is complementary and stronger in those industries accounting for more forward linkages. The
reason why forward linkages give rise to a positive correlation between investment abroad
and domestic investment while this association is not found in industries with predominantly
backward vertical integration is not clear. In the empirical literature the latter is frequently
associated to a cost saving strategy of multinational firms which try to obtain parts and com-
ponents in foreign countries with lower labour costs. Forward linkages are more commmon
in market-seeking strategies when the international firm tries to get a closer relationship to
customers by setting and affiliate or acquiring some local company. According to our results
only this latter type of international linkages whould have a positive impact on domestic
investment. Closely related results are obtained by Onaran et al. (2010). They find that FDI
to high-wage countries is positively related to domestic investment due to market creation
and market seeking effects, while FDI to low-wage countries, which is more likely to originate
vertical backward integration, tends to substitute investment in home economies. On the
other hand, as mentioned in section 1, Barba Navaretti et al. (2010) find that investments
14
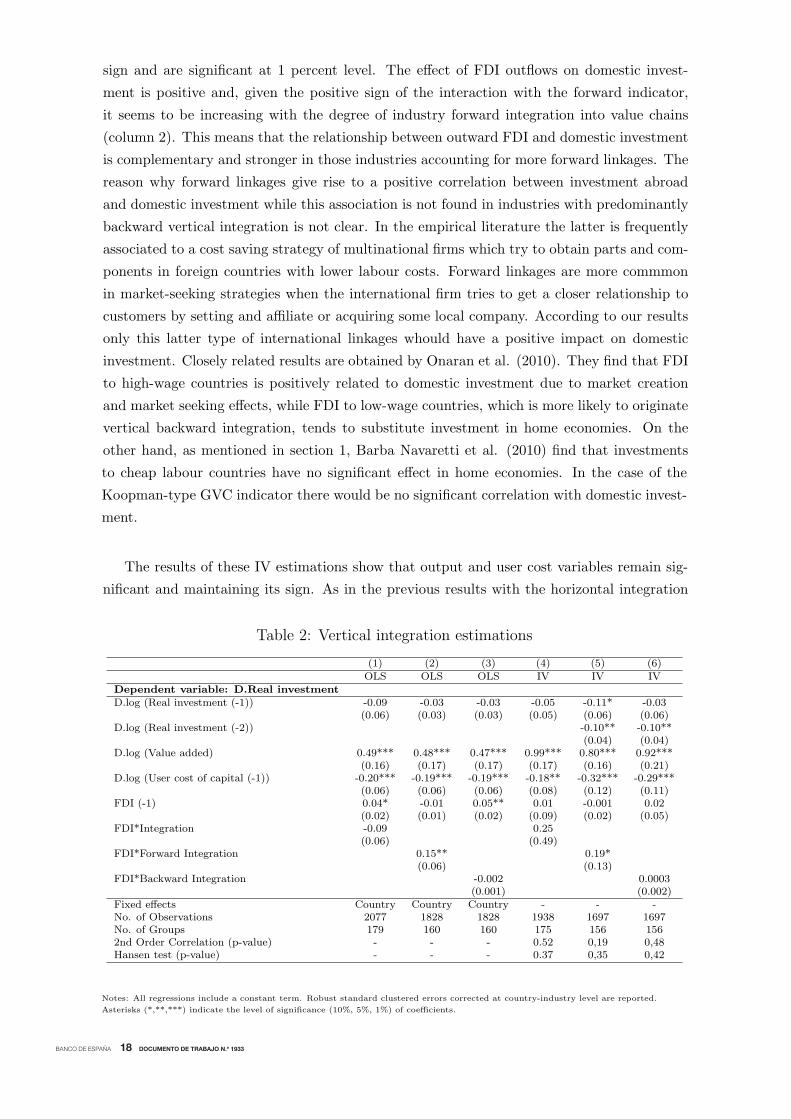
BANCO DE ESPAÑA 18 DOCUMENTO DE TRABAJO N.º 1933BANCO DE ESPAÑA 18 DOCUMENTO DE TRABAJO N.º 1933
the impact on domestic investment will be lower and it depends on the intangible share of
investment in each industry. In some cases it may become negative as shown in figure 2 that
presents the net effect for the median of different industries. For example, in manufacturing
FDI outflows would have had a negative impact on domestic investment in the period after the
crisis, given the increase in intangible intensity. In professional services (M) the effect would
have been negative for the whole period covered by our database. Furthermore, in those
countries in which intensity in intellectual property is low (for example in manufacturing)
the effect of FDI may still be positive in the latest years. The diversity of effects across
industries may help explain why firm and country studies –that do not take into account the
vertical /horizontal integration of production organisation- have been inconclusive regarding
the relationship between foreign and domestic investment.
Vertical integration
Table 2 shows the results of estimating equation (4) using several indicators of vertical in-
tegration. The first column corresponds to the specification when the vertical integration
indicator inspired by Koopman et al (2010) is interacted with the FDI variable. Column
(2) displays the estimation with our proposed forward integration indicator and column (3)
shows the results with our backward integration indicator, both based on Wang et al (2017).
In all of them the coefficients of value added and user cost of capital remain with the expected
sign and are significant at 1 percent level. The effect of FDI outflows on domestic invest-
ment is positive and, given the positive sign of the interaction with the forward indicator,
it seems to be increasing with the degree of industry forward integration into value chains
(column 2). This means that the relationship between outward FDI and domestic investment
is complementary and stronger in those industries accounting for more forward linkages. The
reason why forward linkages give rise to a positive correlation between investment abroad
and domestic investment while this association is not found in industries with predominantly
backward vertical integration is not clear. In the empirical literature the latter is frequently
associated to a cost saving strategy of multinational firms which try to obtain parts and com-
ponents in foreign countries with lower labour costs. Forward linkages are more commmon
in market-seeking strategies when the international firm tries to get a closer relationship to
customers by setting and affiliate or acquiring some local company. According to our results
only this latter type of international linkages whould have a positive impact on domestic
investment. Closely related results are obtained by Onaran et al. (2010). They find that FDI
to high-wage countries is positively related to domestic investment due to market creation
and market seeking effects, while FDI to low-wage countries, which is more likely to originate
vertical backward integration, tends to substitute investment in home economies. On the
other hand, as mentioned in section 1, Barba Navaretti et al. (2010) find that investments
14
to cheap labour countries have no significant effect in home economies. In the case of the
Koopman-type GVC indicator there would be no significant correlation with domestic invest-
ment.
Due to potential endogeneity issues, we also estimate the previous equations by instru-
mental variables techniques, the results of which are shown in columns from (4) to (6). As
in the analysis with the horizontal integration proxy, we use two types of instruments in
the framework of a system GMM: 1) internal instruments (for output, user cost and vertical
integration measures); 2) the specific instrument for FDI outflows already described. The
IV estimates in columns (5) and (6) include the second lag of the endogenous variable to
make sure there is no second order serial correlation in the error term, and the set of internal
instruments in these specifications is appropiately changed (instruments start at the third
lag).
Table 2: Vertical integration estimations
(1) (2) (3) (4) (5) (6)OLS OLS OLS IV IV IV
Dependent variable: D.Real investmentD.log (Real investment (-1)) -0.09 -0.03 -0.03 -0.05 -0.11* -0.03
(0.06) (0.03) (0.03) (0.05) (0.06) (0.06)D.log (Real investment (-2)) -0.10** -0.10**
(0.04) (0.04)D.log (Value added) 0.49*** 0.48*** 0.47*** 0.99*** 0.80*** 0.92***
(0.16) (0.17) (0.17) (0.17) (0.16) (0.21)D.log (User cost of capital (-1)) -0.20*** -0.19*** -0.19*** -0.18** -0.32*** -0.29***
(0.06) (0.06) (0.06) (0.08) (0.12) (0.11)FDI (-1) 0.04* -0.01 0.05** 0.01 -0.001 0.02
(0.02) (0.01) (0.02) (0.09) (0.02) (0.05)FDI*Integration -0.09 0.25
(0.06) (0.49)FDI*Forward Integration 0.15** 0.19*
(0.06) (0.13)FDI*Backward Integration -0.002 0.0003
(0.001) (0.002)Fixed effects Country Country Country - - -No. of Observations 2077 1828 1828 1938 1697 1697No. of Groups 179 160 160 175 156 1562nd Order Correlation (p-value) - - - 0.52 0,19 0,48Hansen test (p-value) - - - 0.37 0,35 0,42
Notes: All regressions include a constant term. Robust standard clustered errors corrected at country-industry level are reported.
Asterisks (*,**,***) indicate the level of significance (10%, 5%, 1%) of coefficients.
The results of these IV estimations show that output and user cost variables remain sig-
nificant and maintaining its sign. As in the previous results with the horizontal integration
variable, the value of the coefficient of output is larger (in absolute value) than in OLS esti-
mates. The main change in IV estimates is that FDI outflows turn non-significant suggesting
that the average effect of FDI on domestic investment is close to zero when the specification
does not include any variable to proxy industry horizontal integration. The positive effect
15
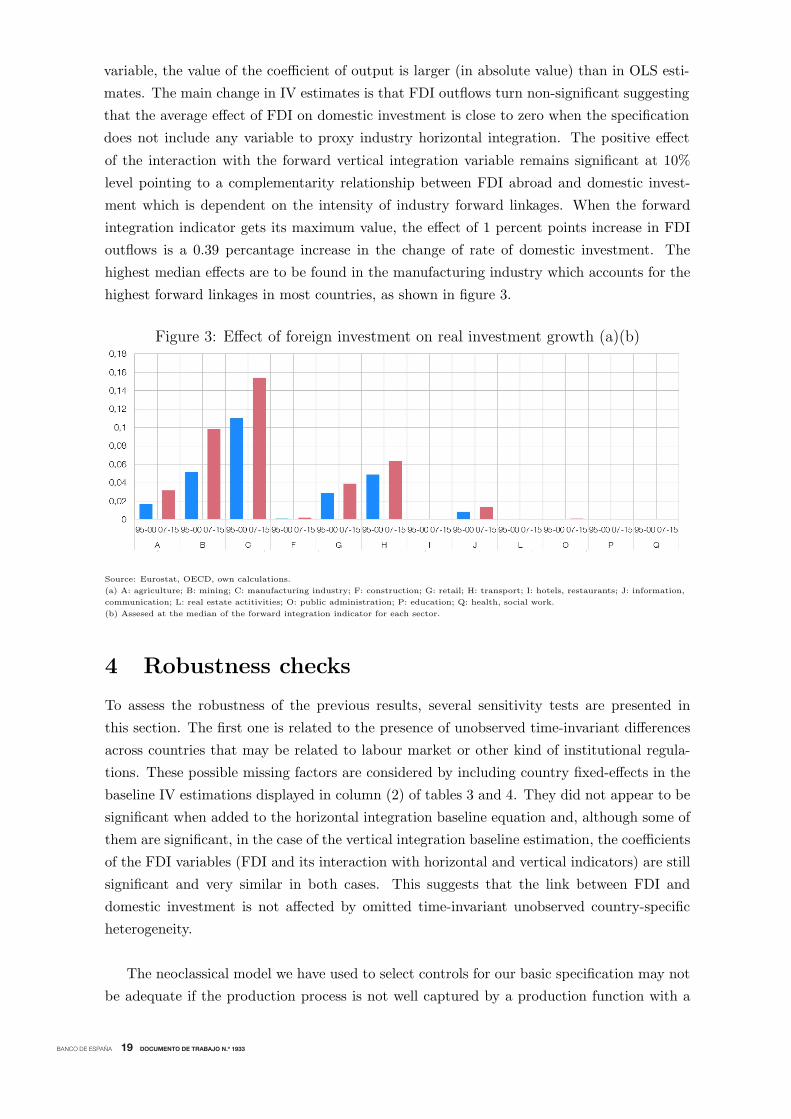
BANCO DE ESPAÑA 19 DOCUMENTO DE TRABAJO N.º 1933BANCO DE ESPAÑA 19 DOCUMENTO DE TRABAJO N.º 1933
to cheap labour countries have no significant effect in home economies. In the case of the
Koopman-type GVC indicator there would be no significant correlation with domestic invest-
ment.
Due to potential endogeneity issues, we also estimate the previous equations by instru-
mental variables techniques, the results of which are shown in columns from (4) to (6). As
in the analysis with the horizontal integration proxy, we use two types of instruments in
the framework of a system GMM: 1) internal instruments (for output, user cost and vertical
integration measures); 2) the specific instrument for FDI outflows already described. The
IV estimates in columns (5) and (6) include the second lag of the endogenous variable to
make sure there is no second order serial correlation in the error term, and the set of internal
instruments in these specifications is appropiately changed (instruments start at the third
lag).
Table 2: Vertical integration estimations
(1) (2) (3) (4) (5) (6)OLS OLS OLS IV IV IV
Dependent variable: D.Real investmentD.log (Real investment (-1)) -0.09 -0.03 -0.03 -0.05 -0.11* -0.03
(0.06) (0.03) (0.03) (0.05) (0.06) (0.06)D.log (Real investment (-2)) -0.10** -0.10**
(0.04) (0.04)D.log (Value added) 0.49*** 0.48*** 0.47*** 0.99*** 0.80*** 0.92***
(0.16) (0.17) (0.17) (0.17) (0.16) (0.21)D.log (User cost of capital (-1)) -0.20*** -0.19*** -0.19*** -0.18** -0.32*** -0.29***
(0.06) (0.06) (0.06) (0.08) (0.12) (0.11)FDI (-1) 0.04* -0.01 0.05** 0.01 -0.001 0.02
(0.02) (0.01) (0.02) (0.09) (0.02) (0.05)FDI*Integration -0.09 0.25
(0.06) (0.49)FDI*Forward Integration 0.15** 0.19*
(0.06) (0.13)FDI*Backward Integration -0.002 0.0003
(0.001) (0.002)Fixed effects Country Country Country - - -No. of Observations 2077 1828 1828 1938 1697 1697No. of Groups 179 160 160 175 156 1562nd Order Correlation (p-value) - - - 0.52 0,19 0,48Hansen test (p-value) - - - 0.37 0,35 0,42
Notes: All regressions include a constant term. Robust standard clustered errors corrected at country-industry level are reported.
Asterisks (*,**,***) indicate the level of significance (10%, 5%, 1%) of coefficients.
The results of these IV estimations show that output and user cost variables remain sig-
nificant and maintaining its sign. As in the previous results with the horizontal integration
variable, the value of the coefficient of output is larger (in absolute value) than in OLS esti-
mates. The main change in IV estimates is that FDI outflows turn non-significant suggesting
that the average effect of FDI on domestic investment is close to zero when the specification
does not include any variable to proxy industry horizontal integration. The positive effect
15of the interaction with the forward vertical integration variable remains significant at 10%
level pointing to a complementarity relationship between FDI abroad and domestic invest-
ment which is dependent on the intensity of industry forward linkages. When the forward
integration indicator gets its maximum value, the effect of 1 percent points increase in FDI
outflows is a 0.39 percantage increase in the change of rate of domestic investment. The
highest median effects are to be found in the manufacturing industry which accounts for the
highest forward linkages in most countries, as shown in figure 3.
Figure 3: Effect of foreign investment on real investment growth (a)(b)
Source: Eurostat, OECD, own calculations.
(a) A: agriculture; B: mining; C: manufacturing industry; F: construction; G: retail; H: transport; I: hotels, restaurants; J: information,
communication; L: real estate actitivities; O: public administration; P: education; Q: health, social work.
(b) Assesed at the median of the forward integration indicator for each sector.
4 Robustness checks
To assess the robustness of the previous results, several sensitivity tests are presented in
this section. The first one is related to the presence of unobserved time-invariant differences
across countries that may be related to labour market or other kind of institutional regula-
tions. These possible missing factors are considered by including country fixed-effects in the
baseline IV estimations displayed in column (2) of tables 3 and 4. They did not appear to be
significant when added to the horizontal integration baseline equation and, although some of
them are significant, in the case of the vertical integration baseline estimation, the coefficients
of the FDI variables (FDI and its interaction with horizontal and vertical indicators) are still
significant and very similar in both cases. This suggests that the link between FDI and
domestic investment is not affected by omitted time-invariant unobserved country-specific
heterogeneity.
The neoclassical model we have used to select controls for our basic specification may not
be adequate if the production process is not well captured by a production function with a
16
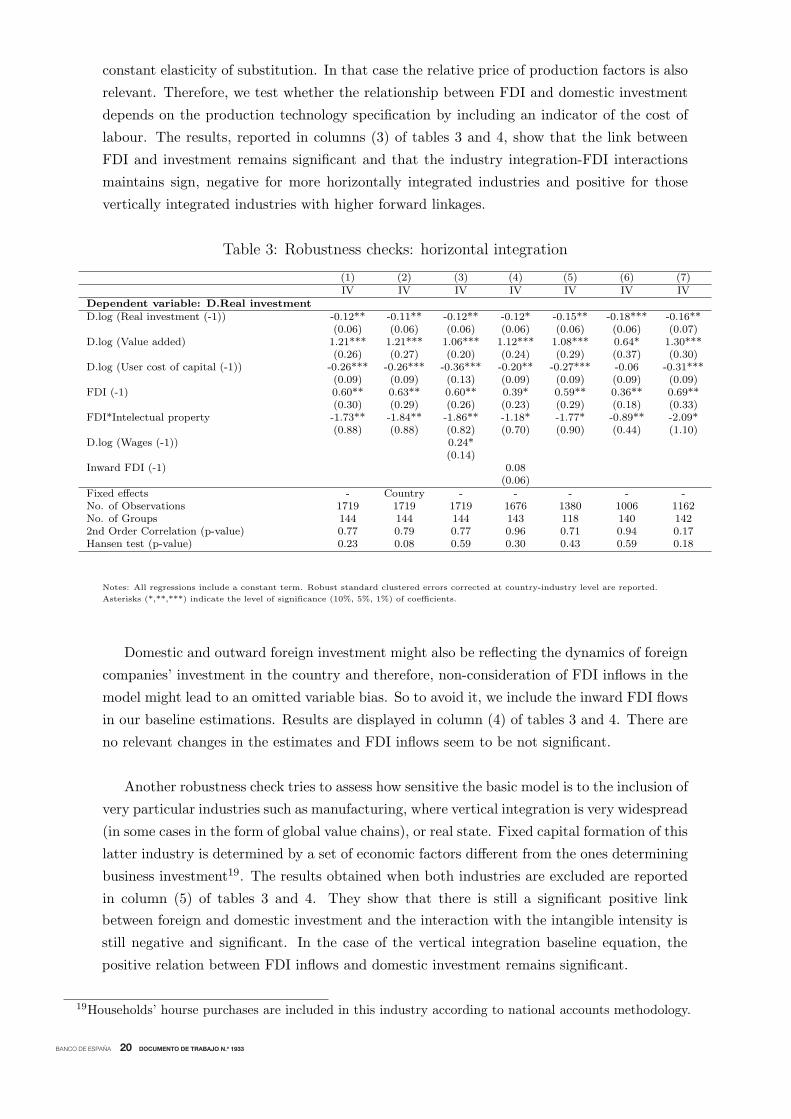
BANCO DE ESPAÑA 20 DOCUMENTO DE TRABAJO N.º 1933BANCO DE ESPAÑA 20 DOCUMENTO DE TRABAJO N.º 1933
constant elasticity of substitution. In that case the relative price of production factors is also
relevant. Therefore, we test whether the relationship between FDI and domestic investment
depends on the production technology specification by including an indicator of the cost of
labour. The results, reported in columns (3) of tables 3 and 4, show that the link between
FDI and investment remains significant and that the industry integration-FDI interactions
maintains sign, negative for more horizontally integrated industries and positive for those
vertically integrated industries with higher forward linkages.
Table 3: Robustness checks: horizontal integration
(1) (2) (3) (4) (5) (6) (7)IV IV IV IV IV IV IV
Dependent variable: D.Real investmentD.log (Real investment (-1)) -0.12** -0.11** -0.12** -0.12* -0.15** -0.18*** -0.16**
(0.06) (0.06) (0.06) (0.06) (0.06) (0.06) (0.07)D.log (Value added) 1.21*** 1.21*** 1.06*** 1.12*** 1.08*** 0.64* 1.30***
(0.26) (0.27) (0.20) (0.24) (0.29) (0.37) (0.30)D.log (User cost of capital (-1)) -0.26*** -0.26*** -0.36*** -0.20** -0.27*** -0.06 -0.31***
(0.09) (0.09) (0.13) (0.09) (0.09) (0.09) (0.09)FDI (-1) 0.60** 0.63** 0.60** 0.39* 0.59** 0.36** 0.69**
(0.30) (0.29) (0.26) (0.23) (0.29) (0.18) (0.33)FDI*Intelectual property -1.73** -1.84** -1.86** -1.18* -1.77* -0.89** -2.09*
(0.88) (0.88) (0.82) (0.70) (0.90) (0.44) (1.10)D.log (Wages (-1)) 0.24*
(0.14)Inward FDI (-1) 0.08
(0.06)Fixed effects - Country - - - - -No. of Observations 1719 1719 1719 1676 1380 1006 1162No. of Groups 144 144 144 143 118 140 1422nd Order Correlation (p-value) 0.77 0.79 0.77 0.96 0.71 0.94 0.17Hansen test (p-value) 0.23 0.08 0.59 0.30 0.43 0.59 0.18
Notes: All regressions include a constant term. Robust standard clustered errors corrected at country-industry level are reported.
Asterisks (*,**,***) indicate the level of significance (10%, 5%, 1%) of coefficients.
Domestic and outward foreign investment might also be reflecting the dynamics of foreign
companies’ investment in the country and therefore, non-consideration of FDI inflows in the
model might lead to an omitted variable bias. So to avoid it, we include the inward FDI flows
in our baseline estimations. Results are displayed in column (4) of tables 3 and 4. There are
no relevant changes in the estimates and FDI inflows seem to be not significant.
Another robustness check tries to assess how sensitive the basic model is to the inclusion of
very particular industries such as manufacturing, where vertical integration is very widespread
(in some cases in the form of global value chains), or real state. Fixed capital formation of this
latter industry is determined by a set of economic factors different from the ones determining
business investment19. The results obtained when both industries are excluded are reported
in column (5) of tables 3 and 4. They show that there is still a significant positive link
19Households’ hourse purchases are included in this industry according to national accounts methodology.
17
between foreign and domestic investment and the interaction with the intangible intensity is
still negative and significant. In the case of the vertical integration baseline equation, the
positive relation between FDI inflows and domestic investment remains significant.
Table 4: Robustness checks: vertical integration
(1) (2) (3) (4) (5) (6)Dependent variable: D.Real investmentD.log (Real investment (-1)) -0.11* -0.06 -0.24*** -0.11 -0.13* -0.02
(0.06) (0.07) (0.09) (0.07) (0.08) (0.09)D.log (Real investment (-2)) -0.10** -0.09** -0.13*** -0.10** -0.09* -0.13**
(0.04) (0.04) (0.04) (0.04) (0.05) (0.06)D.log (Value added) 0.80*** 0.90*** 0.81*** 0.74*** 0.86*** 0.80***
(0.16) (0.19) (0.20) (0.19) (0.21) (0.18)D.log (User cost of capital (-1)) -0.32*** -0.39*** -1.34*** -0.27** -0.20* -0.22*
(0.12) (0.13) (0.38) (0.12) (0.11) (0.12)FDI (-1) -0.001 0.005 0.005 -0.01 -0.01 0.006
(0.02) (0.02) (0.06) (0.02) (0.02) (0.02)FDI*Forward Integration 0.19* 0.18* 0.23* 0.27** 0.27* 0.21**
(0.13) (0.11) (0.13) (0.12) (0.16) (0.09)D.log (Wages (-1)) 1.02***
(0.29)Inward FDI (-1) -0.16
(0.14)Fixed effects - Country - - - -No. of Observations 1697 1697 1547 1627 1274 1021No. of Groups 156 156 140 151 121 1532nd Order Correlation (p-value) 0,19 0,31 0,12 0,12 0,15 0,22Hansen test (p-value) 0,35 0.19 0,23 0,36 0,15 0,16
Notes: All regressions include a constant term. Robust standard clustered errors corrected at country-industry level are reported.
Asterisks (*,**,***) indicate the level of significance (10%, 5%, 1%) of coefficients.
Last robustness checks explore the stability of the model when different time periods are
considered: the first one covering the pre-crisis years and the second one much affected by the
economic crisis period. In the pre-crisis period, the results, displayed in column (6) of table
3 for the horizontal integration analysis, show a positive and significant relation between
FDI outflows and domestic investment, as well as a negative sign in the interaction term.
Nevertheless, coefficients are smaller in magnitude and the user cost becomes not significant,
probably reflecting measurement problems of the horizontal integration indicator in the first
years of the sample and the dynamics of intangible assets, which were negligible in official
statistics in the years before the 2000s. Estimations for the second period are shown in
the last column of tables 3 and 4 for the preferred equations in our horizontal and vertical
integration analyses, respectively. In these two cases, the basic results remain unchanged in
terms of sign, size and significance.
5 Concluding remarks
The empirical results presented in this study show that the relationship between outward FDI
and domestic investment is very varied and may differ across industries and across countries.
18
constant elasticity of substitution. In that case the relative price of production factors is also
relevant. Therefore, we test whether the relationship between FDI and domestic investment
depends on the production technology specification by including an indicator of the cost of
labour. The results, reported in columns (3) of tables 3 and 4, show that the link between
FDI and investment remains significant and that the industry integration-FDI interactions
maintains sign, negative for more horizontally integrated industries and positive for those
vertically integrated industries with higher forward linkages.
Table 3: Robustness checks: horizontal integration
(1) (2) (3) (4) (5) (6) (7)IV IV IV IV IV IV IV
Dependent variable: D.Real investmentD.log (Real investment (-1)) -0.12** -0.11** -0.12** -0.12* -0.15** -0.18*** -0.16**
(0.06) (0.06) (0.06) (0.06) (0.06) (0.06) (0.07)D.log (Value added) 1.21*** 1.21*** 1.06*** 1.12*** 1.08*** 0.64* 1.30***
(0.26) (0.27) (0.20) (0.24) (0.29) (0.37) (0.30)D.log (User cost of capital (-1)) -0.26*** -0.26*** -0.36*** -0.20** -0.27*** -0.06 -0.31***
(0.09) (0.09) (0.13) (0.09) (0.09) (0.09) (0.09)FDI (-1) 0.60** 0.63** 0.60** 0.39* 0.59** 0.36** 0.69**
(0.30) (0.29) (0.26) (0.23) (0.29) (0.18) (0.33)FDI*Intelectual property -1.73** -1.84** -1.86** -1.18* -1.77* -0.89** -2.09*
(0.88) (0.88) (0.82) (0.70) (0.90) (0.44) (1.10)D.log (Wages (-1)) 0.24*
(0.14)Inward FDI (-1) 0.08
(0.06)Fixed effects - Country - - - - -No. of Observations 1719 1719 1719 1676 1380 1006 1162No. of Groups 144 144 144 143 118 140 1422nd Order Correlation (p-value) 0.77 0.79 0.77 0.96 0.71 0.94 0.17Hansen test (p-value) 0.23 0.08 0.59 0.30 0.43 0.59 0.18
Notes: All regressions include a constant term. Robust standard clustered errors corrected at country-industry level are reported.
Asterisks (*,**,***) indicate the level of significance (10%, 5%, 1%) of coefficients.
Domestic and outward foreign investment might also be reflecting the dynamics of foreign
companies’ investment in the country and therefore, non-consideration of FDI inflows in the
model might lead to an omitted variable bias. So to avoid it, we include the inward FDI flows
in our baseline estimations. Results are displayed in column (4) of tables 3 and 4. There are
no relevant changes in the estimates and FDI inflows seem to be not significant.
Another robustness check tries to assess how sensitive the basic model is to the inclusion of
very particular industries such as manufacturing, where vertical integration is very widespread
(in some cases in the form of global value chains), or real state. Fixed capital formation of this
latter industry is determined by a set of economic factors different from the ones determining
business investment19. The results obtained when both industries are excluded are reported
in column (5) of tables 3 and 4. They show that there is still a significant positive link
19Households’ hourse purchases are included in this industry according to national accounts methodology.
17

BANCO DE ESPAÑA 21 DOCUMENTO DE TRABAJO N.º 1933BANCO DE ESPAÑA 21 DOCUMENTO DE TRABAJO N.º 1933
between foreign and domestic investment and the interaction with the intangible intensity is
still negative and significant. In the case of the vertical integration baseline equation, the
positive relation between FDI inflows and domestic investment remains significant.
Table 4: Robustness checks: vertical integration
(1) (2) (3) (4) (5) (6)Dependent variable: D.Real investmentD.log (Real investment (-1)) -0.11* -0.06 -0.24*** -0.11 -0.13* -0.02
(0.06) (0.07) (0.09) (0.07) (0.08) (0.09)D.log (Real investment (-2)) -0.10** -0.09** -0.13*** -0.10** -0.09* -0.13**
(0.04) (0.04) (0.04) (0.04) (0.05) (0.06)D.log (Value added) 0.80*** 0.90*** 0.81*** 0.74*** 0.86*** 0.80***
(0.16) (0.19) (0.20) (0.19) (0.21) (0.18)D.log (User cost of capital (-1)) -0.32*** -0.39*** -1.34*** -0.27** -0.20* -0.22*
(0.12) (0.13) (0.38) (0.12) (0.11) (0.12)FDI (-1) -0.001 0.005 0.005 -0.01 -0.01 0.006
(0.02) (0.02) (0.06) (0.02) (0.02) (0.02)FDI*Forward Integration 0.19* 0.18* 0.23* 0.27** 0.27* 0.21**
(0.13) (0.11) (0.13) (0.12) (0.16) (0.09)D.log (Wages (-1)) 1.02***
(0.29)Inward FDI (-1) -0.16
(0.14)Fixed effects - Country - - - -No. of Observations 1697 1697 1547 1627 1274 1021No. of Groups 156 156 140 151 121 1532nd Order Correlation (p-value) 0,19 0,31 0,12 0,12 0,15 0,22Hansen test (p-value) 0,35 0.19 0,23 0,36 0,15 0,16
Notes: All regressions include a constant term. Robust standard clustered errors corrected at country-industry level are reported.
Asterisks (*,**,***) indicate the level of significance (10%, 5%, 1%) of coefficients.
Last robustness checks explore the stability of the model when different time periods are
considered: the first one covering the pre-crisis years and the second one much affected by the
economic crisis period. In the pre-crisis period, the results, displayed in column (6) of table
3 for the horizontal integration analysis, show a positive and significant relation between
FDI outflows and domestic investment, as well as a negative sign in the interaction term.
Nevertheless, coefficients are smaller in magnitude and the user cost becomes not significant,
probably reflecting measurement problems of the horizontal integration indicator in the first
years of the sample and the dynamics of intangible assets, which were negligible in official
statistics in the years before the 2000s. Estimations for the second period are shown in
the last column of tables 3 and 4 for the preferred equations in our horizontal and vertical
integration analyses, respectively. In these two cases, the basic results remain unchanged in
terms of sign, size and significance.
5 Concluding remarks
The empirical results presented in this study show that the relationship between outward FDI
and domestic investment is very varied and may differ across industries and across countries.
18That relationship is positive (complementarity) for those industries with high forward inte-
gration in GVCs or low intensity in intangible investment (features of vertically integrated
industries), gets smaller as industries increase their share of intellectual property assets, and
becomes negative in those industries with high intangible intensity (horizontally integrated).
These results give support to the hypothesis that the vertical / horizontal integration of
production predominant in each industry is one of the drivers that determine the type of re-
lationship between FDI and gross fixed capital investment in home economies. Furthermore,
the diversity of effects across industries may help to explain why firm and country studies
–that do not usually consider the vertical /horizontal integration of production organisation-
have been inconclusive when examining this relationship.
On average the complementarity relationship is predominant in most advanced economies.
This highlights the potential of spillovers across countries by means of the FDI channel, which
is especially relevant in areas closely connected through FDI links, as it is the case in the EU.
These externalities call for a coordination to avoid barriers to trade and capital mobility, as
well as for avoiding policies aimed at discouraging foreign investment. The complementarity
between FDI and investment in home economies also help to explain, at least in some part,
the synchronized weakness of investment observed in several advanced economies after the
financial crisis.
The outlook of an increasing share of investment dedicated to intellectual property assets,
which are prone to be used in different plants across several countries, leads us to expect an
increasing pressure over firms to adopt a more horizontal organization of production across
countries. A higher substitution of domestic investment for FDI thus appears likely. Against
this perspective, policies should try to offset the potential negative impact on long run growth
by favouring productivity-enhancing growth, as well as by mitigating the adjustment costs in
home economies.
19
BANCO DE ESPAÑA 22 DOCUMENTO DE TRABAJO N.º 1933BANCO DE ESPAÑA 22 DOCUMENTO DE TRABAJO N.º 1933
That relationship is positive (complementarity) for those industries with high forward inte-
gration in GVCs or low intensity in intangible investment (features of vertically integrated
industries), gets smaller as industries increase their share of intellectual property assets, and
becomes negative in those industries with high intangible intensity (horizontally integrated).
These results give support to the hypothesis that the vertical / horizontal integration of
production predominant in each industry is one of the drivers that determine the type of re-
lationship between FDI and gross fixed capital investment in home economies. Furthermore,
the diversity of effects across industries may help to explain why firm and country studies
–that do not usually consider the vertical /horizontal integration of production organisation-
have been inconclusive when examining this relationship.
On average the complementarity relationship is predominant in most advanced economies.
This highlights the potential of spillovers across countries by means of the FDI channel, which
is especially relevant in areas closely connected through FDI links, as it is the case in the EU.
These externalities call for a coordination to avoid barriers to trade and capital mobility, as
well as for avoiding policies aimed at discouraging foreign investment. The complementarity
between FDI and investment in home economies also help to explain, at least in some part,
the synchronized weakness of investment observed in several advanced economies after the
financial crisis.
The outlook of an increasing share of investment dedicated to intellectual property assets,
which are prone to be used in different plants across several countries, leads us to expect an
increasing pressure over firms to adopt a more horizontal organization of production across
countries. A higher substitution of domestic investment for FDI thus appears likely. Against
this perspective, policies should try to offset the potential negative impact on long run growth
by favouring productivity-enhancing growth, as well as by mitigating the adjustment costs in
home economies.
19
BANCO DE ESPAÑA 23 DOCUMENTO DE TRABAJO N.º 1933BANCO DE ESPAÑA 23 DOCUMENTO DE TRABAJO N.º 1933
References
Al-Sadig, A. J. (2013). Outward foreign direct investment and domestic investment: the case
of developing countries. IMF Working Paper, WP/13/52.
Antras, P. (2003). Firms, contracts, and trade structure. Quarterly Journal of Economics,
Vol. 118 (4), 1375-1418.
Antras, P., Chor, D., Fally, T., and Hillberry, R. (2012). Measuring the upstreamness of
production and trade flows. The American Economic Review, Vol. 102, No. 3, 412-416.
Arellano, M. (1995). Another look at the instrumental variable esitmation of error-component
models. Journal of Econometrics, No. 68, 29-52.
Arndt, C., Buch, C. M., and Schnitzer, M. E. (2010). FDI and domestic investment: an
industry-level view. The B.E. Journal of Economic Analysis and Policy, De Gruyter, Vol.
10, Issue 1, 1-22.
Barba Navaretti, G., Castellani, D., and Disdier, A.-C. (2010). How does investing in cheap
labour countries affect performance at home? France and Italy. Oxford Economic Papers,
Vol. 62, No. 2, 234-260.
Bean, C. (1981). An econometric model of manufacturing investment in the UK. The Eco-
nomic Journal, Vol. 91, 106-121.
Belderbos, R., Fukao, K., Ito, K., and Letterie, W. (2013). Global fixed capital investment
by multinational firms. Economica, No. 80, 274-299.
Blundell, R. A. (1998). Initial conditions and moment restrictions in dynamic panel data
models. Journal of Econometrics, No. 87, 115-143.
Braunerhjelm P., L. O. (2005). The relationship between domestic and outward foreign direct
investment. International Busines Review, No. 14, 677-694.
Carr, D. L., Markusen, J. R., and Maskus, K. E. (2001). Estimating the knowledge-capital
model of the multinational enterprise. The American Economic Review, Vol. 91, No. 3,
693-708.
20Desai, M. A., Foley, C. F., and Hines Jr., J. R. (2005). Foreign Direct Investment and the
Domestic Capital Stock. Cambridge, MA: National Bureau of Economic Research.
Desai, M. A., Foley, C. F., and Hines Jr., J. R. (2009). Domestic effects of the foreign ac-
tivities of US multinationals. American Economic Journal: Economic Policy, Vol.1, Issue 1,
181–203.
Faeth, I. (2006). Consequences of FDI in Australia-Casual Links Between FDI, Domestic
Investment, Economic Growth and Trade. The University of Melbourne. Department of Eco-
nomics. Research Paper No. 977.
Feldstein, M. (1995). The Effects of Outbound Foreign Direct Investment on the Domestic
Capital Stock. In M. Feldstein, J. R. Hines Jr., and R. G. Hubbard, The Effects of Taxation
on Multinational Corporations (pp. 43-66). University of Chicago Press.
Geishecker, I., and Gorg, H. (2005). The vertical investment controversy: Re-estimating the
knowledge-capital model for different types of FDI. U. of Nottingham Working Paper No.
2005-03.
Helpman, E. (2006). Trade, FDI, and the organization of firms. Journal of Economic Liter-
ature, Vol. 44, No. 3, 589-630.
Helpman, E., Melitz, M. J., and Yeaple, S. R. (2004). Export versus FDI with heterogeneous
firms. American Economic Review, Vol. 94, Issue 1, 300-316.
Herzer, D., and Schrooten, M. (2008). Outward FDI and domestic investment in two indus-
trialized countries. Economics Letters, Vol. 99, Issue 1, 139-143.
Jorgenson, D. (1963). Capital theory and investment behaviour. American Economic Re-
view, vol 53, 247-56.
Koopman, R., Powers, W., Wang, Z., and Wei, S.-J. (2010). Give credit where credit is due:
tracing value added in global production chains. Cambridge, MA: NBER Working Paper Se-
ries.
Markusen, J. R. (1995). The boundaries of multinational enterprises and the theory of inter-
national trade. The Journal of Economic Perspectives, Vol. 9, No. 2, 169-189.
21

BANCO DE ESPAÑA 24 DOCUMENTO DE TRABAJO N.º 1933BANCO DE ESPAÑA 24 DOCUMENTO DE TRABAJO N.º 1933
Desai, M. A., Foley, C. F., and Hines Jr., J. R. (2005). Foreign Direct Investment and the
Domestic Capital Stock. Cambridge, MA: National Bureau of Economic Research.
Desai, M. A., Foley, C. F., and Hines Jr., J. R. (2009). Domestic effects of the foreign ac-
tivities of US multinationals. American Economic Journal: Economic Policy, Vol.1, Issue 1,
181–203.
Faeth, I. (2006). Consequences of FDI in Australia-Casual Links Between FDI, Domestic
Investment, Economic Growth and Trade. The University of Melbourne. Department of Eco-
nomics. Research Paper No. 977.
Feldstein, M. (1995). The Effects of Outbound Foreign Direct Investment on the Domestic
Capital Stock. In M. Feldstein, J. R. Hines Jr., and R. G. Hubbard, The Effects of Taxation
on Multinational Corporations (pp. 43-66). University of Chicago Press.
Geishecker, I., and Gorg, H. (2005). The vertical investment controversy: Re-estimating the
knowledge-capital model for different types of FDI. U. of Nottingham Working Paper No.
2005-03.
Helpman, E. (2006). Trade, FDI, and the organization of firms. Journal of Economic Liter-
ature, Vol. 44, No. 3, 589-630.
Helpman, E., Melitz, M. J., and Yeaple, S. R. (2004). Export versus FDI with heterogeneous
firms. American Economic Review, Vol. 94, Issue 1, 300-316.
Herzer, D., and Schrooten, M. (2008). Outward FDI and domestic investment in two indus-
trialized countries. Economics Letters, Vol. 99, Issue 1, 139-143.
Jorgenson, D. (1963). Capital theory and investment behaviour. American Economic Re-
view, vol 53, 247-56.
Koopman, R., Powers, W., Wang, Z., and Wei, S.-J. (2010). Give credit where credit is due:
tracing value added in global production chains. Cambridge, MA: NBER Working Paper Se-
ries.
Markusen, J. R. (1995). The boundaries of multinational enterprises and the theory of inter-
national trade. The Journal of Economic Perspectives, Vol. 9, No. 2, 169-189.
21Onaran, O., Stockhammer, E., and Zwickl, K. (2013). FDI and domestic investment in Ger-
many: crowding in or out? International Review of Applied Economics. Vol. 27, Issue 4,
429-448.
Perry, M. K. (1989). Vertical integration: Determinants and effects. In R. S. Willig, Hand-
book of industrial organisation, Vol. 1.
Stevens, G. V., and Lipsey, R. E. (1992). Interactions between domestic and foreign invest-
ment. Journal of International Money and Finance, Vol. 11, Issue 1, 40-62.
Wang, Z., Wei, S.-J., Yu, X., and Zhu, K. (2017). Measures of participation in global value
chains and global business cycles. Cambridge, MA: NBER Working Paper Series.
Williamson, O. (1985). The Economic Institutions of Capitalism. New York: Free Press.
22

BANCO DE ESPAÑA 25 DOCUMENTO DE TRABAJO N.º 1933BANCO DE ESPAÑA 25 DOCUMENTO DE TRABAJO N.º 1933
Onaran, O., Stockhammer, E., and Zwickl, K. (2013). FDI and domestic investment in Ger-
many: crowding in or out? International Review of Applied Economics. Vol. 27, Issue 4,
429-448.
Perry, M. K. (1989). Vertical integration: Determinants and effects. In R. S. Willig, Hand-
book of industrial organisation, Vol. 1.
Stevens, G. V., and Lipsey, R. E. (1992). Interactions between domestic and foreign invest-
ment. Journal of International Money and Finance, Vol. 11, Issue 1, 40-62.
Wang, Z., Wei, S.-J., Yu, X., and Zhu, K. (2017). Measures of participation in global value
chains and global business cycles. Cambridge, MA: NBER Working Paper Series.
Williamson, O. (1985). The Economic Institutions of Capitalism. New York: Free Press.
22

BANCO DE ESPAÑA 26 DOCUMENTO DE TRABAJO N.º 1933BANCO DE ESPAÑA 26 DOCUMENTO DE TRABAJO N.º 1933
Statistical Appendix
Table 1: Variable definition and sources
Variable Definition SourceReal domestic investment Real gross fixed capital formation STAN Database for
Structural Analysis (ISICRev. 4) (OECD)
Value added Real gross value added STAN Database forStructural Analysis (ISICRev. 4) (OECD)
Relative price of capitalgoods
Ratio of investment deflator overgross value added deflator
STAN Database forStructural Analysis (ISICRev. 4) (OECD)
Real cost of finance Long term public debt interest rateover gross value added deflator
STAN Database forStructural Analysis (ISICRev. 4), Economic Out-look Database (OECD)
Corporate tax rate Corporate effective average taxrate
CBT Tax Database, Ox-ford University Center forBusiness Taxation
Foreign direct investment(FDI)
Ratio of outward foreign direct in-vestment to gross value added
FDI Statistics accordingto BMD3 (OECD)
Intangible investmentshare
Ratio of intellectual property in-vestment to total gross fixed in-vestment
Eurostat
Real wage Wage per employee over grossvalue added deflator
STAN Database forStructural Analysis (ISICRev. 4) (OECD)
Global Value Chain inte-gration
Domestic value added embodied inforeign exports as a share of grossexports (Forward integration indi-cator) + Foreign value added shareof gross exports (Backward inte-gration)
TiVA database (OECD)
Forward integration inGlobal Value Chains
Gross exports of intermediatesover value added
TiVA database (OECD)
Backward integration inGlobal Value Chains
Gross imports of intermediatesover final production
TiVA database (OECD)
23
Table 2: Descriptive statistics
Variable Obs Mean Std. Dev. Min. P25 P50 P75 Max.D.log(Real investment) 6402 0,023 0,179 -2,286 -0,046 0,028 0,099 2,362D.log(Value added) 6574 0,018 0,061 -0,709 -0,005 0,018 0,045 0,466D.log(User cost of capital) 5891 -0,017 0,073 -0,602 -0,045 -0,015 0,011 0,666FDI over gross value added 2886 0,063 0,291 -1,181 0,000 0,007 0,038 5,906Intelectual property share 5177 0,194 0,264 -6,346 0,042 0,110 0,301 10,050D.log(Wages) 6021 0,019 0,078 -0,627 -0,009 0,018 0,050 0,660Integration 4058 0,156 0,123 0,005 0,072 0,124 0,193 0,668Forward integration 3783 0,166 0,270 0,000 0,001 0,022 0,215 2,027Backward integration 3784 0,351 1,689 0,000 0,002 0,016 0,120 36,604
24
BANCO DE ESPAÑA PUBLICATIONS
WORKING PAPERS
1830 JACOPO TIMINI and MARINA CONESA: Chinese exports and non-tariff measures: testing for heterogeneous effects at the
product level.
1831 JAVIER ANDRÉS, JOSÉ E. BOSCÁ, JAVIER FERRI and CRISTINA FUENTES-ALBERO: Households’ balance sheets and
the effect of fiscal policy.
1832 ÓSCAR ARCE, MIGUEL GARCÍA-POSADA, SERGIO MAYORDOMO and STEVEN ONGENA: Adapting lending policies
when negative interest rates hit banks’ profits.
1833 VICENTE SALAS, LUCIO SAN JUAN and JAVIER VALLÉS: Corporate cost and profit shares in the euro area and the US:
the same story?
1834 MARTÍN GONZÁLEZ-EIRAS and CARLOS SANZ: Women’s representation in politics: voter bias, party bias, and electoral
systems.
1835 MÓNICA CORREA-LÓPEZ and BEATRIZ DE BLAS: Faraway, so close! Technology diffusion and firm heterogeneity in the
medium term cycle of advanced economies.
1836 JACOPO TIMINI: The margins of trade: market entry and sector spillovers, the case of Italy (1862-1913).
1837 HENRIQUE S. BASSO and OMAR RACHEDI: The young, the old, and the government: demographics and fiscal
multipliers.
1838 PAU ROLDÁN and SONIA GILBUKH: Firm dynamics and pricing under customer capital accumulation.
1839 GUILHERME BANDEIRA, JORDI CABALLÉ and EUGENIA VELLA: Should I stay or should I go? Austerity,
unemployment and migration.
1840 ALESSIO MORO and OMAR RACHEDI: The changing structure of government consumption spending.
1841 GERGELY GANICS, ATSUSHI INOUE and BARBARA ROSSI: Confidence intervals for bias and size distortion in IV
and local projections – IV models.
1842 MARÍA GIL, JAVIER J. PÉREZ, A. JESÚS SÁNCHEZ and ALBERTO URTASUN: Nowcasting private consumption:
traditional indicators, uncertainty measures, credit cards and some internet data.
1843 MATÍAS LAMAS and JAVIER MENCÍA: What drives sovereign debt portfolios of banks in a crisis context?
1844 MIGUEL ALMUNIA, POL ANTRÀS, DAVID LÓPEZ-RODRÍGUEZ and EDUARDO MORALES: Venting out: exports during
a domestic slump.
1845 LUCA FORNARO and FEDERICA ROMEI: The paradox of global thrift.
1846 JUAN S. MORA-SANGUINETTI and MARTA MARTÍNEZ-MATUTE: An economic analysis of court fees: evidence from
the Spanish civil jurisdiction.
1847 MIKEL BEDAYO, ÁNGEL ESTRADA and JESÚS SAURINA: Bank capital, lending booms, and busts. Evidence from
Spain in the last 150 years.
1848 DANIEL DEJUÁN and CORINNA GHIRELLI: Policy uncertainty and investment in Spain.
1849 CRISTINA BARCELÓ and ERNESTO VILLANUEVA: The risk of job loss, household formation and housing demand:
evidence from differences in severance payments.
1850 FEDERICO TAGLIATI: Welfare effects of an in-kind transfer program: evidence from Mexico.
1851 ÓSCAR ARCE, GALO NUÑO, DOMINIK THALER and CARLOS THOMAS: A large central bank balance sheet? Floor vs
corridor systems in a New Keynesian environment.
1901 EDUARDO GUTIÉRREZ and ENRIQUE MORAL-BENITO: Trade and credit: revisiting the evidence.
1902 LAURENT CAVENAILE and PAU ROLDAN: Advertising, innovation and economic growth.
1903 DESISLAVA C. ANDREEVA and MIGUEL GARCÍA-POSADA: The impact of the ECB’s targeted long-term refinancing
operations on banks’ lending policies: the role of competition.
1904 ANDREA ALBANESE, CORINNA GHIRELLI and MATTEO PICCHIO: Timed to say goodbye: does unemployment
benefit eligibility affect worker layoffs?
1905 CORINNA GHIRELLI, MARÍA GIL, JAVIER J. PÉREZ and ALBERTO URTASUN: Measuring economic and economic
policy uncertainty, and their macroeconomic effects: the case of Spain.
1906 CORINNA GHIRELLI, JAVIER J. PÉREZ and ALBERTO URTASUN: A new economic policy uncertainty index for Spain.
1907 ESTEBAN GARCÍA-MIRALLES, NEZIH GUNER and ROBERTO RAMOS: The Spanish personal income tax:
facts and parametric estimates.
1908 SERGIO MAYORDOMO and OMAR RACHEDI: The China syndrome affects banks: the credit supply channel of
foreign import competition.

1909 MÓNICA CORREA-LÓPEZ, MATÍAS PACCE and KATHI SCHLEPPER: Exploring trend inflation dynamics in Euro Area
countries.
1910 JAMES COSTAIN, ANTON NAKOV and BORJA PETIT: Monetary policy implications of state-dependent prices and wages.
1911 JAMES CLOYNE, CLODOMIRO FERREIRA, MAREN FROEMEL and PAOLO SURICO: Monetary policy, corporate
finance and investment.
1912 CHRISTIAN CASTRO and JORGE E. GALÁN: Drivers of productivity in the Spanish banking sector: recent evidence.
1913 SUSANA PÁRRAGA RODRÍGUEZ: The effects of pension-related policies on household spending.
1914 MÁXIMO CAMACHO, MARÍA DOLORES GADEA and ANA GÓMEZ LOSCOS: A new approach to dating the reference
cycle.
1915 LAURA HOSPIDO, LUC LAEVEN and ANA LAMO: The gender promotion gap: evidence from Central Banking.
1916 PABLO AGUILAR, STEPHAN FAHR, EDDIE GERBA and SAMUEL HURTADO: Quest for robust optimal
macroprudential policy.
1917 CARMEN BROTO and MATÍAS LAMAS: Is market liquidity less resilient after the financial crisis? Evidence for US
treasuries.
1918 LAURA HOSPIDO and CARLOS SANZ: Gender Gaps in the Evaluation of Research: Evidence from Submissions to
Economics Conferences.
1919 SAKI BIGIO, GALO NUÑO and JUAN PASSADORE: A framework for debt-maturity management.
1920 LUIS J. ÁLVAREZ, MARÍA DOLORES GADEA and ANA GÓMEZ-LOSCOS: Inflation interdependence in advanced
economies.
1921 DIEGO BODAS, JUAN R. GARCÍA LÓPEZ, JUAN MURILLO ARIAS, MATÍAS J. PACCE, TOMASA RODRIGO LÓPEZ,
JUAN DE DIOS ROMERO PALOP, PEP RUIZ DE AGUIRRE, CAMILO A. ULLOA and HERIBERT VALERO LAPAZ:
Measuring retail trade using card transactional data.
1922 MARIO ALLOZA and CARLOS SANZ: Jobs multipliers: evidence from a large fiscal stimulus in Spain.
1923 KATARZYNA BUDNIK, MASSIMILIANO AFFINITO, GAIA BARBIC, SAIFFEDINE BEN HADJ, ÉDOUARD CHRÉTIEN,
HANS DEWACHTER, CLARA ISABEL GONZÁLEZ, JENNY HU, LAURI JANTUNEN, RAMONA JIMBOREAN,
OTSO MANNINEN, RICARDO MARTINHO, JAVIER MENCÍA, ELENA MOUSARRI, LAURYNAS NARUŠEVIČIUS,
GIULIO NICOLETTI, MICHAEL O’GRADY, SELCUK OZSAHIN, ANA REGINA PEREIRA, JAIRO RIVERA-ROZO,
CONSTANTINOS TRIKOUPIS, FABRIZIO VENDITTI and SOFÍA VELASCO: The benefits and costs of adjusting bank
capitalisation: evidence from Euro Area countries.
1924 MIGUEL ALMUNIA and DAVID LÓPEZ-RODRÍGUEZ: The elasticity of taxable income in Spain: 1999-2014.
1925 DANILO LEIVA-LEON and LORENZO DUCTOR: Fluctuations in global macro volatility.
1926 JEF BOECKX, MAARTEN DOSSCHE, ALESSANDRO GALESI, BORIS HOFMANN and GERT PEERSMAN:
Do SVARs with sign restrictions not identify unconventional monetary policy shocks?
1927 DANIEL DEJUÁN and JUAN S. MORA-SANGUINETTI: Quality of enforcement and investment decisions. Firm-level
evidence from Spain.
1928 MARIO IZQUIERDO, ENRIQUE MORAL-BENITO and ELVIRA PRADES: Propagation of sector-specific shocks within
Spain and other countries.
1929 MIGUEL CASARES, LUCA DEIDDA and JOSÉ E. GALDÓN-SÁNCHEZ: On financial frictions and firm market power.
1930 MICHAEL FUNKE, DANILO LEIVA-LEON and ANDREW TSANG: Mapping China’s time-varying house price landscape.
1931 JORGE E. GALÁN and MATÍAS LAMAS: Beyond the LTV ratio: new macroprudential lessons from Spain.
1932 JACOPO TIMINI: Staying dry on Spanish wine: the rejection of the 1905 Spanish-Italian trade agreement.
1933 TERESA SASTRE and LAURA HERAS RECUERO: Domestic and foreign investment in advanced economies. The role
of industry integration.
Unidad de Servicios AuxiliaresAlcalá, 48 - 28014 Madrid
E-mail: [email protected]