dolphin corporate presentation pareto 2011 finalmb.cision.com/main/10900/9669162/304534.pdf ·...
TRANSCRIPT

DOLPHIN GROUP ASA
CORPORATE PRESENTATION
AUGUST 31TH 2011
PARETO SECURITIES’ 18TH ANNUAL
OIL & OFFSHORE CONFERENCE
BY
ATLE JACOBSEN (CEO)

DISCLAIMER
2
This presentation includes and is based, inter alia, on forward-looking information and statements that are subject to risksand uncertainties that could cause actual results to differ. Such forward-looking information and statements are based oncurrent expectations, estimates and projections about global economic conditions, the economic conditions of the regionsand industries that are major markets for Dolphin Group ASA (Dolphin) and its subsidiaries. These expectations, estimatesand projections are generally identifiable by statements containing words such as "expects", "believes", "estimates" or similarexpressions. Important factors that could cause actual results to differ materially from those expectations include, amongothers, economic and market conditions in the geographic areas and industries that are or will be major markets for theDolphins businesses, oil prices, market acceptance of new products and services, changes in governmental regulations,interest rates, fluctuations in currency exchange rates and such other factors as may be discussed from time to time.Although Dolphin believes that its expectations and the information in this Report were based upon reasonable assumptionsat the time when they were made, it can give no assurance that those expectations will be achieved or that the actual resultswill be as set out in this Report. Dolphin nor any other company within the Dolphin group is making any representation orwarranty, expressed or implied, as to the accuracy, reliability or completeness of the information in the Report, and neitherDolphin, any other company within the Dolphin Group nor any of their directors, officers or employees will have any liability toyou or any other persons resulting from your use of the information in the Report. Dolphin undertakes no obligation to publiclyupdate or revise any forward-looking information or statements in the Report.
There may have been changes in matters which affect Dolphin Group subsequent to the date of this presentation. Neither theissue nor delivery of this presentation shall under any circumstance create any implication that the information containedherein is correct as of any time subsequent to the date hereof or that the affairs of Dolphin Group has not since changed, andDolphin Group does not intend, and does not assume any obligation, to update or correct any information included in thispresentation. The contents of this presentation are not to be construed as legal, business, investment or tax advice. Eachrecipient should consult with its own legal, business, investment and tax adviser as to legal, business, investment and taxadvice. This presentation is subject to Norwegian law, and any dispute arising in respect of this presentation is subject to theexclusive jurisdiction of the Norwegian courts.

AGENDA
I. Dolphin Group overview
II. Dolphin Geophysical
III. Q2 Highlights
IV. Outlook
V. Appendix – Q2 Financials and guidance for 2011
3

GROUP OVERVIEW
Dolphin Group ASA
Dolphin Interconnect Solutions
G&GContract
AcquisitionMulti-Client
Dolphin Geophysical
4

• Position Dolphin as a single bet on seismic market rebound
• Focus on high-end vessels meeting customer and oil company
expectations
Clear-cut seismic
market exposure
Low cost vessel base
Securing operational
efficiency
Delivering
shareholder value
• Long term TC agreements with vessel owning companies
• Strong relative cash cost efficiency per streamer per day
• High utilization and OPEX savings due to proven vessel design
• Capitalize on fleet specifications and operational experience
• Healthy balance between contract seismic and MC
• Generate strong, stable and healthy cash flow
• Potential additional vessels represent opportunities for growth
• Flexible and attractive structure to reach critical mass based on sound
investment decisions
Business strategy
1
2
3
4
0
2 000
4 000
6 000
8 000
10 000
12 000
14 000
94 95 96 97 98 99 '00 '01 '02 '03 '04 '05 '06 '07 '08 09E 10E 11E 12E
Glo
bal S
eism
ic S
pend
ing
(US
Dm
)
0
20
40
60
80
100
120
Oil
Pri
ce (
US
D/b
bl)
Seismic spending Oil price (Brent avg)
CGG-Veritas23 %
Western Geco19 %
PGS16 %
DOLPH Geo5 %
Fugro13 %
Polarcus13 %
Others11 %
VISION & STRATEGY
5

MANAGEMENT TEAM
6
Dr. Gareth Williams (Chief Geophysicist), Bjarne Stavenes (Technical Vice President), Mike Hodge (QHSE Vice President), Peter Hooper (Operations Vice President), Erik Hokholt (CFO), Atle Jacobsen (CEO), Phil Suter (Marketing & Sales Vice President), Tim Wells (President Western Hemisphere), Ian T. Edwards (Multi-Client Vice President).
Supported by 155 highly skilled and motivated emplo yees

DOLPHIN - FLEET PLAN EXPANSION
Q4 ’12Polar Duke (3D, 12-14)
NB 533 (3D, 12-14 str)NB 535 (3D, 16-18str)
(alt NB 123)Polar Explorer (2D)
� Delivered Jan 2011 � Delivered May 2011 NB 535 option
considered replaced� Delivery Q1 ‘12
Artemis Arctic (3D -6/8str)
Artemis Atlantic (2D)
� Delivered May 2011 � Delivered May 2011
Q4 ’11
May ’11Jan ’11
7

HIGH END 3D FLEET – POLAR DUKE
• Excellent performance for TGS in the Barents Sea . Close
to 100% uptime experienced since production start
• The vessel is utilizing 10x6km streamers
• The contract has been extended and now runs into
October
• Awaiting the final outcome of tendering and contract
negotiations for winter season work
• Sentinel Solid Streamer
• New Seal 428 system (redundancy/hot swap, continuous
recording, long offset/WAZ-undershoot multi-vessel
operations/designed for large spreads)
• Nautilus Steerable streamers (4D, heavy weather control,
integrated acoustics)
Vessel Status
Equipped with the latest acquisition technology
8
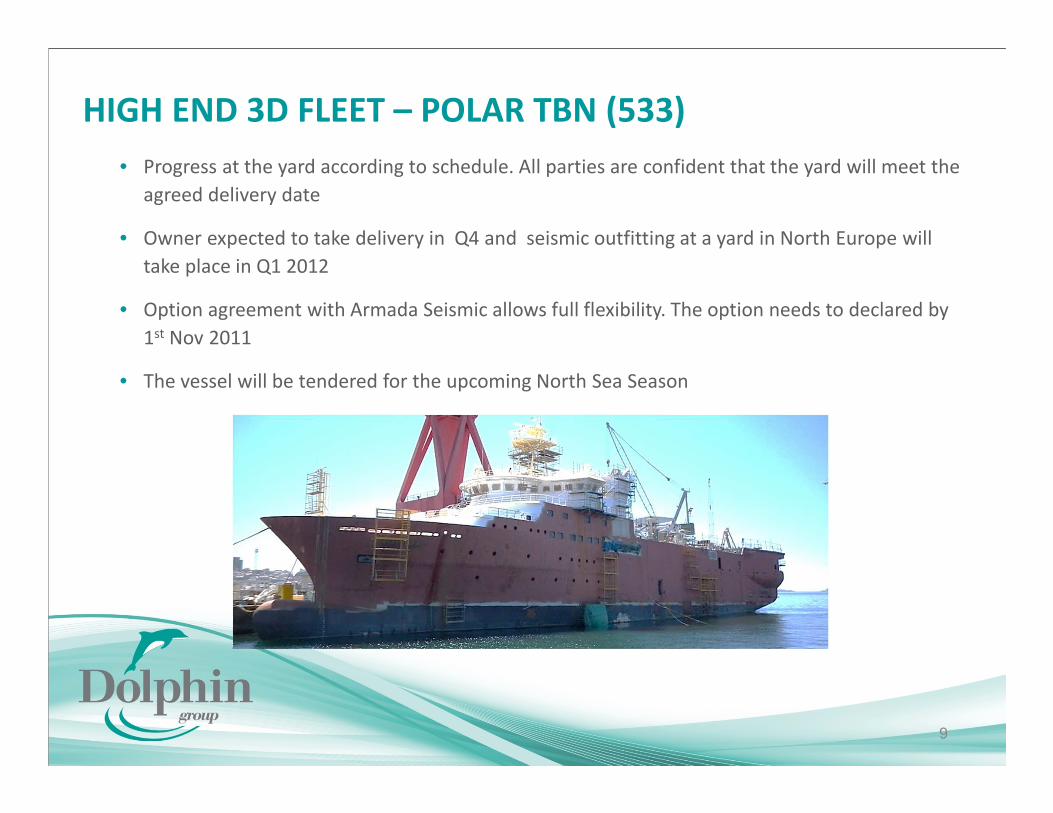
• Progress at the yard according to schedule. All parties are confident that the yard will meet the
agreed delivery date
• Owner expected to take delivery in Q4 and seismic outfitting at a yard in North Europe will
take place in Q1 2012
• Option agreement with Armada Seismic allows full flexibility. The option needs to declared by
1st Nov 2011
• The vessel will be tendered for the upcoming North Sea Season
HIGH END 3D FLEET – POLAR TBN (533)
9

Artemis Arctic – 6/8 streamers
MEDIUM CAPACITY 3D FLEET – ARTEMIS ARCTIC
• Full season for Lotos and Lundin in the North
Sea
• Outperformed our internal production target
in Q2
• Received LOI for 2-3 months work (incl. paid
transit) for NOC outside the North Sea. Starts
in Q4 alternatively Q1 pending backlog
development
• Upgrade to 8 streamers planned for after the
North Sea season
10

ICE CLASS - 2D FLEET
• Vessel currently in production for GXT
offshore Greenland. Estimated completion
in end Q3
• Vessel is planned for a regional 2D MC
project offshore Brazil , from early Q4
Polar Explorer
• Vessel currently in production on regional
2D MC project in North West Africa
• Vessel is scheduled to continue on this
program until the end of Q4
Artemis Atlantic
Limited availability of 2D vessel with highest ice class ---> premium day rates
11

VERY COST COMPETITIVE HIGH END VESSELS
• Vessel design offers substantial cost advantage
• Polar Duke and NB 533 may operate on heavy (bunker) fuel – offering a substantial cost advantage in many geographical regions
• Daily cost savings of USD 9,000 equals nearly 5% on bottom-line margins
• Dolphin is chartering the vessels and do not require a marine management organization
• Dolphin are isolated from any cost overruns when it comes to marine maintenance, OPEX and docking cost
• The chartering structure de-risks the off-hire scenarios. If the vessels is off-hire due to marine mismanagement or failures with the vessels (propulsion, compressors...etc) then Dolphin is not liable for paying charter rate and OPEX is reduces by close to 50%
Cost efficient vessels Fuel costs (USD/day)*
2003 2004 2005 2006 2007 2008 2009 2010
3,107 6,450 9,018 9,462 9,072 15,435 5,902 8,893
Daily opex savings with use of Bunker fuel instead of Marine gas oil
(USD/day)*
*Based on a consumption of 40 tonnes per day. In a 14 streamer operation fuel consumption rises to 50-55 tons per day – creating even larger cost advantages (Source. First Sec.)
12
0
10 000
20 000
30 000
40 000
50 000
60 000
mai
. 02
aug
. 02
nov.
02
feb
. 03
mai
. 03
aug
. 03
nov.
03
feb
. 04
mai
. 04
aug
. 04
nov.
04
feb
. 05
mai
. 05
aug
. 05
nov.
05
feb
. 06
mai
. 06
aug
. 06
nov.
06
feb
. 07
mai
. 07
aug
. 07
nov.
07
feb
. 08
mai
. 08
aug
. 08
nov.
08
feb
. 09
mai
. 09
aug
. 09
nov.
09
feb
. 10
mai
. 10
aug
. 10
nov.
10
feb
. 11
mai
. 11
aug
. 11
US
D/d
ay
Gas Oil Bunker fuel

MULTI-CLIENT PROJECTS
North West Africa Brazil
• 20,000 km long offset 2D data planned,
12,000 km acquired to date
• Joint project with TGS-Nopec
• 28,000 km long offset 2D data planned.
Phase I will be 12,000 km
• Joint project with Spectrum
• Scheduled project start October
13

Q2 HIGHLIGHTS
• Successful start-up of all seismic vessels
• Consolidating seismic capacity by adding cost favorable vessels
• Significant new contract awards in the North Sea
• Launch of our first Multi-Client project in North West Africa in joint
venture with TGS
• Highly competent and motivated employees provide excellent
operations resulting in earnings exceeding our expectations
• Second quarter consolidated revenues at USD 24 million, positive
Operating Profit (EBIT) of USD 2.1 million and Net Earnings after Tax of
USD 1.5 million
14

Q2 KEY FINANCIAL FIGURES
15
USD amount Q2 2011 YTD 2011 Year 2010
Net operating revenues 24,060,957 24,497,394 1,647,947
EBITDA 3,823,109 46,858 -1,063,386
EBIT 2,112,797 -1,852,636 -4,315,435
Profit before taxes 1,545,710 -989,635 -4,296,568
Net income 1,545,710 -116,824 78,333
Diluted earnings per share ($ per share) 0.01 0.00 0.01
Cash and cash equivalents ( period end) 25,546,281 25,546,281 62,642,551
Total Assets (period end) 144,957,943 144,957,943 70,963,779
Total Equity (period end) 72,268,768 72,268,768 69,753,679
Equity ratio 49.9% 49.9% 98.3%
EBIT Margin Geophysical business 10.2%

Geographical target areas
GLOBAL MARKET OUTLOOK
Fleet Location
16

SUMMARY
Delivered on Business Plan - Phase I
• Profitable in the first quarter of seismic operation
• Cost efficient fleet, high-end technology, competent and
motivated employees
• Fast expansion into highly profitable 2D multi-client segment
• Fully developed organization with capability to support
further rapid growth
Ready for Business Plan - Phase II
• Further developing Multi-Client as a highly profitable
business
• Strengthening Dolphin’s geology and geophysical (G&G)
services
• Further increase seismic vessel capacity
17

APPENDIX
18
DETAILED FINANCIALS AND GUIDANCE FOR 2011

19
0
0.5
1
1.5
2
2.5
3
3.5
4
4.5
01-01-2010 01-07-2010 01-01-2011 01-07-2011
Sha
re p
rice
(NO
K)
SHARE PRICE DEVELOPMENT AND LARGEST SHAREHOLDERS
Share price development since 1 January 2010 Top 20 shareholders (15 Aug 2011)
Source: Manamind, Factset
Investor Shares Ownership
Morgan Stanley & Co Inc. New York (Nominee) 31,812,100 19.32%
Six Sis AG (Nominee) 31,042,290 18.85%
Holberg Norden 10,107,085 6.14%
HSBC Bank (Nominee) 9,832,000 5.97%
Varma Mutual Pension Insurance 6,975,800 4.24%
MP Pensjon PK 4,816,000 2.92%
Storebrand vekst 4,611,970 2.80%
Holberg Norge 3,820,967 2.32%
NHO – P665AK 3,000,000 1.82%
Taj Holding AS 2,900,015 1.76%
Økonomi og regnskapsbistand 2,900,000 1.76%
Three M AS 2,817,034 1.71%
Delphi Norden 2,700,000 1.64%
Fjord Partners Invest AS 2,500,000 1.52%
UBS AG, London Branch (Nominee) 2,408,000 1.46%
UBS AG, London Branch Equities 1,987,100 1.47%
Alfred Berg Gambak VPF 1,922,000 1.17%
SEB Enskilda ASA 1,850,015 1.12%
Abolutt Forvaltning AS 1,500,000 0.91%
Arvarius AS 1,400,000 0.85%
Total owned by top 20 130,902,376 79.49%
Shares outstanding 164,683,705 100.0%
Private Placement
Market Cap: NOK 14.6m
Subsequent offering
Market Cap:NOK 15.6m
Private Placement
Market Cap: 481.2m
Subsequent offering
Market Cap: 517.1m
� Listed on Oslo Stock Exchange
� Number of outstanding shares: 164,683,705
� Market cap: NOK 494.1m (share price: NOK 3.0)

FINANCIALS – SECOND QUARTER AND FIRST HALF 2011
USD Q2 2011 Q2 2010 YTD 2011 YTD 2010 Year 2010
Net Operating Revenues 24,060,957 396,195 24,497,394 732,211 1,647,947
Operating expenses
Cost of sales 17,389,191 452,217 19,569,487 849,169 1,800,056
SG&A 2,321,211 178,238 3,916,371 385,451 842,757
Share based compensation 527,446 4,180 964,678 8,620 68,520
Total operating expenses 20,237,848 634,635 24,450,536 1,243,240 2,711,333
EBITDA 3,823,109 -238,440 46,858 -511,029 -1,063,386
Depreciation and write down 1,710,313 189,672 1,899,495 384,806 765,990
Operating profit (EBIT) 2,112,797 -428,112 -1,852,636 -895,835 -1,829,375
Start-up expenses - Geophysical segment 0 0 0 0 2,486,060
Operating profit (EBIT) 2,112,797 -428,112 -1,852,636 -895,835 -4,315,435
Net financial items -567,087 12,685 863,001 39,694 18,868
Profit before taxes 1,545,710 -415,427 -989,635 -856,141 -4,296,568
Tax expense 0 -34,867 872,811 -69,596 -4,374,901
Net Income 1,545,710 -380,559 -116,824 -786,544 78,333
Basic earnings per share 0 0 0 0 0
Diluted earnings per share 0 0 0 0 0
Average share outstanding 164,683,705 3,844,404 164,017,407 3,844,404 10,603,735
Average share outstanding diluted 171,013,993 3,844,404 169,961,277 3,844,404 10,685,324
20

FINANCIALS – SEGMENT FINANCIALS
USD Geophysical Interconnect
Consolidated
accounts
Q2 2011 Q2 2011 Q2 2011
Net operating revenues 23,534,111 526,846 24,060,957
Operating expenses
Cost of sales 17,273,590 115,601 17,389,191
SG&A 1,799,569 521,642 2,321,211
Share based compensation 520,381 7,065 527,446
Total operating expenses 19,593,540 644,308 20,237,848
EBITDA 3,940,571 (117,462) 3,823,109
Depreciation, amortization and write-downs 1,551,641 158,672 1,710,313
Operating profit (EBIT) 2,388,930 (276,134) 2,112,796
Investment in operating equipment/intangible assets 7,617,624 142,675 7,760,299
EBIT magin 10.2% -52.4% 8.8%
21
DOLPHIN – ASSUMPTIONS AND GUIDANCE 2011
� Vessel capacity
� Polar Explorer (2D) on T/C end January 2011
� Polar Duke (3D) on T/C mid May 2011
� Polar NB 533 (3D) on T/C March 2012
� Artemis Atlantic (2D) on T/C early May 2011
� Artemis Arctic (3D) on T/C mid May 2011
� Pricing, costs, utilization
� Expected day-rate of ~200’-230 USD/day on 3D high-end seismic vessels
� Cash OPEX of ~115’ USD/day
� Utilization 80-88%, extra conservative first months of start-up
� Total overhead costs 2011 ~USD 8,5m , thereafter USD 2,5-3,0 million per quarter in 2012
� Multi Client activities
� One out of two 2D vessels permanently planned in the MCS market
� Acquired 2D West Africa library USD 3,5 million in 2011
� No 3D MC projects planned for 2011, longer term up-to 15% of 3D capacity can be allocated
22