dole 2001 annual
TRANSCRIPT
Dole Food Company, Inc.Annual Report 2001
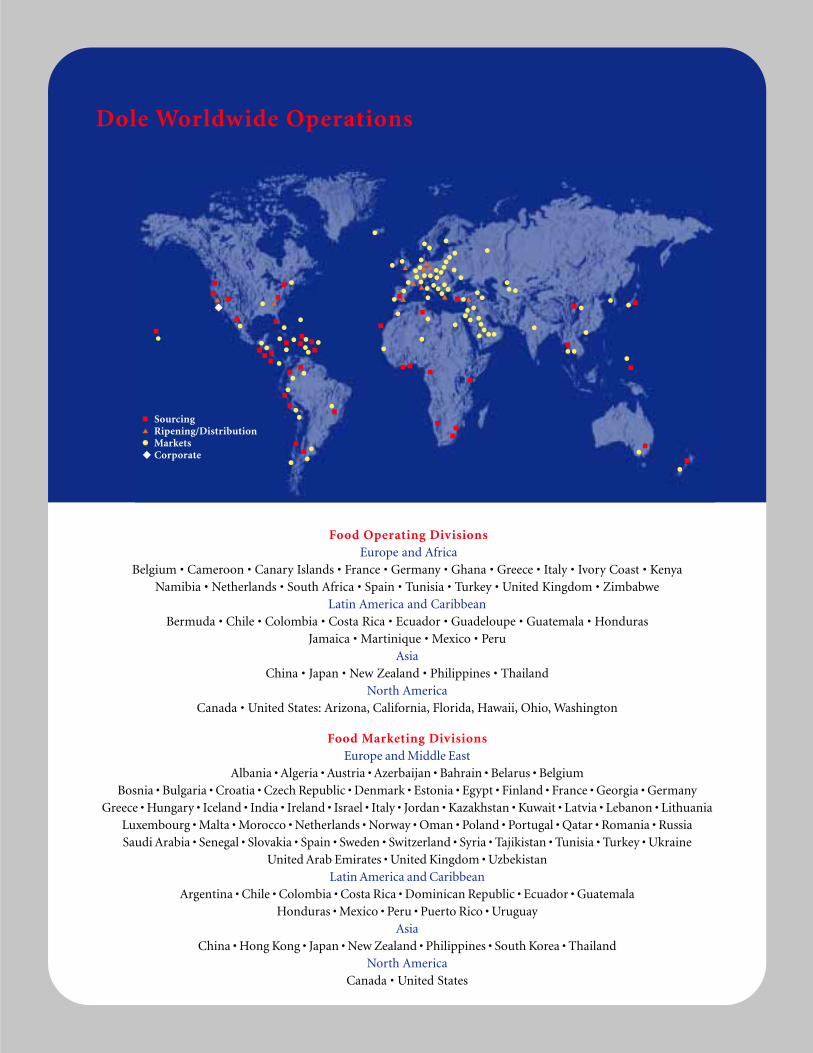
Food Operating DivisionsEurope and Africa
Belgium • Cameroon • Canary Islands • France • Germany • Ghana • Greece • Italy • Ivory Coast • KenyaNamibia • Netherlands • South Africa • Spain • Tunisia • Turkey • United Kingdom • Zimbabwe
Latin America and CaribbeanBermuda • Chile • Colombia • Costa Rica • Ecuador • Guadeloupe • Guatemala • Honduras
Jamaica • Martinique • Mexico • Peru Asia
China • Japan • New Zealand • Philippines • ThailandNorth America
Canada • United States: Arizona, California, Florida, Hawaii, Ohio, Washington
Food Marketing DivisionsEurope and Middle East
Albania • Algeria • Austria • Azerbaijan • Bahrain • Belarus • BelgiumBosnia • Bulgaria • Croatia • Czech Republic • Denmark • Estonia • Egypt • Finland • France • Georgia • Germany
Greece • Hungary • Iceland • India • Ireland • Israel • Italy • Jordan • Kazakhstan • Kuwait • Latvia • Lebanon • LithuaniaLuxembourg • Malta • Morocco • Netherlands • Norway • Oman • Poland • Portugal • Qatar • Romania • RussiaSaudi Arabia • Senegal • Slovakia • Spain • Sweden • Switzerland • Syria • Tajikistan • Tunisia • Turkey • Ukraine
United Arab Emirates • United Kingdom • UzbekistanLatin America and Caribbean
Argentina • Chile • Colombia • Costa Rica • Dominican Republic • Ecuador • GuatemalaHonduras • Mexico • Peru • Puerto Rico • Uruguay
AsiaChina • Hong Kong • Japan • New Zealand • Philippines • South Korea • Thailand
North America Canada • United States
Dole Worldwide Operations
SourcingRipening/DistributionMarketsCorporate
■
▲
●
◆
◆▲
▲▲
▲
▲
▲
▲
▲▲
▲
▲
Dole Food Company, Inc. Annual Report 2001 1
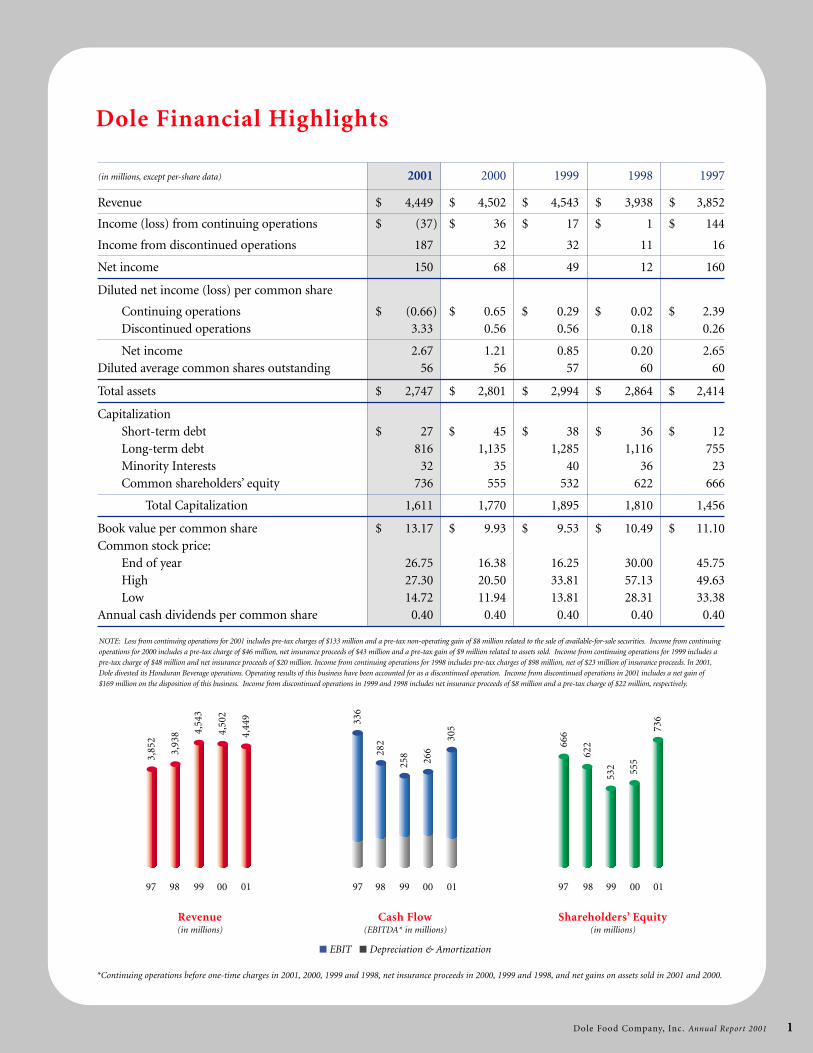
Cash Flow(EBITDA* in millions)
■ EBIT ■ Depreciation & Amortization
Shareholders’ Equity(in millions)
NOTE: Loss from continuing operations for 2001 includes pre-tax charges of $133 million and a pre-tax non-operating gain of $8 million related to the sale of available-for-sale securities. Income from continuing
operations for 2000 includes a pre-tax charge of $46 million, net insurance proceeds of $43 million and a pre-tax gain of $9 million related to assets sold. Income from continuing operations for 1999 includes a
pre-tax charge of $48 million and net insurance proceeds of $20 million. Income from continuing operations for 1998 includes pre-tax charges of $98 million, net of $23 million of insurance proceeds. In 2001,
Dole divested its Honduran Beverage operations. Operating results of this business have been accounted for as a discontinued operation. Income from discontinued operations in 2001 includes a net gain of
$169 million on the disposition of this business. Income from discontinued operations in 1999 and 1998 includes net insurance proceeds of $8 million and a pre-tax charge of $22 million, respectively.
Revenue(in millions)
97 98 99 00 01 97 98 99 00 01 97 98 99 00 01
*Continuing operations before one-time charges in 2001, 2000, 1999 and 1998, net insurance proceeds in 2000, 1999 and 1998, and net gains on assets sold in 2001 and 2000.
3,85
2
3,93
8 4,54
3
4,50
2
4,44
9 336
282
258
266
305
532 55
5
736
62266
6
(in millions, except per-share data) 2001 2000 1999 1998 1997
Revenue $ 4,449 $ 4,502 $ 4,543 $ 3,938 $ 3,852
Income (loss) from continuing operations $ (37) $ 36 $ 17 $ 1 $ 144
Income from discontinued operations 187 32 32 11 16
Net income 150 68 49 12 160
Diluted net income (loss) per common share
Continuing operations $ (0.66) $ (0.65) $ 0.29 $ 0.02 $ 2.39Discontinued operations 3.33 0.56 0.56 0.18 0.26
Net income 2.67 1.21 0.85 0.20 2.65Diluted average common shares outstanding 56 56 57 60 60
Total assets $ 2,747 $ 2,801 $ 2,994 $ 2,864 $ 2,414
CapitalizationShort-term debt $ 27 $ 45 $ 38 $ 36 $ 12Long-term debt 816 1,135 1,285 1,116 755Minority Interests 32 35 40 36 23Common shareholders’ equity 736 555 532 622 666
Total Capitalization 1,611 1,770 1,895 1,810 1,456
Book value per common share $ 13.17 $ 9.93 $ 9.53 $ 10.49 $ 11.10Common stock price:
End of year 26.75 16.38 16.25 30.00 45.75High 27.30 20.50 33.81 57.13 49.63Low 14.72 11.94 13.81 28.31 33.38
Annual cash dividends per common share 0.40 0.40 0.40 0.40 0.40
Dole Financial Highlights
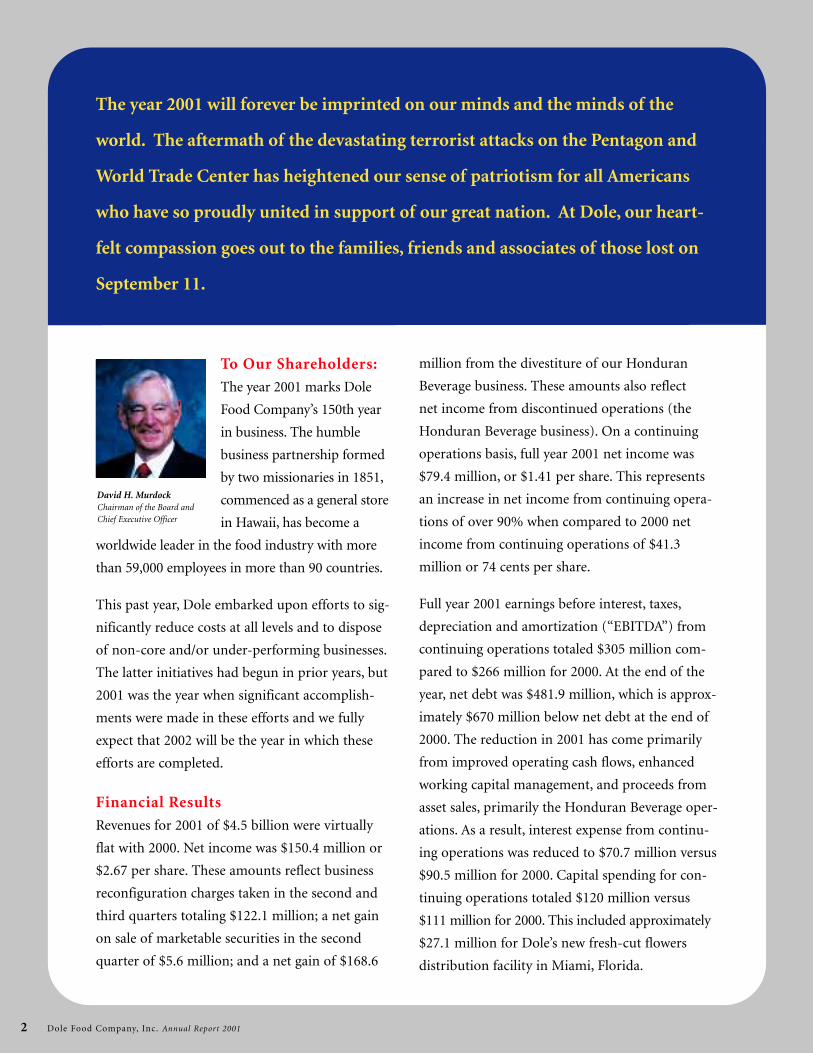
To Our Shareholders:
The year 2001 marks Dole
Food Company’s 150th year
in business. The humble
business partnership formed
by two missionaries in 1851,
commenced as a general store
in Hawaii, has become a
worldwide leader in the food industry with more
than 59,000 employees in more than 90 countries.
This past year, Dole embarked upon efforts to sig-
nificantly reduce costs at all levels and to dispose
of non-core and/or under-performing businesses.
The latter initiatives had begun in prior years, but
2001 was the year when significant accomplish-
ments were made in these efforts and we fully
expect that 2002 will be the year in which these
efforts are completed.
Financial Results
Revenues for 2001 of $4.5 billion were virtually
flat with 2000. Net income was $150.4 million or
$2.67 per share. These amounts reflect business
reconfiguration charges taken in the second and
third quarters totaling $122.1 million; a net gain
on sale of marketable securities in the second
quarter of $5.6 million; and a net gain of $168.6
million from the divestiture of our Honduran
Beverage business. These amounts also reflect
net income from discontinued operations (the
Honduran Beverage business). On a continuing
operations basis, full year 2001 net income was
$79.4 million, or $1.41 per share. This represents
an increase in net income from continuing opera-
tions of over 90% when compared to 2000 net
income from continuing operations of $41.3
million or 74 cents per share.
Full year 2001 earnings before interest, taxes,
depreciation and amortization (“EBITDA”) from
continuing operations totaled $305 million com-
pared to $266 million for 2000. At the end of the
year, net debt was $481.9 million, which is approx-
imately $670 million below net debt at the end of
2000. The reduction in 2001 has come primarily
from improved operating cash flows, enhanced
working capital management, and proceeds from
asset sales, primarily the Honduran Beverage oper-
ations. As a result, interest expense from continu-
ing operations was reduced to $70.7 million versus
$90.5 million for 2000. Capital spending for con-
tinuing operations totaled $120 million versus
$111 million for 2000. This included approximately
$27.1 million for Dole’s new fresh-cut flowers
distribution facility in Miami, Florida.
The year 2001 will forever be imprinted on our minds and the minds of the
world. The aftermath of the devastating terrorist attacks on the Pentagon and
World Trade Center has heightened our sense of patriotism for all Americans
who have so proudly united in support of our great nation. At Dole, our heart-
felt compassion goes out to the families, friends and associates of those lost on
September 11.
Dole Food Company, Inc. Annual Report 2001 2
David H. MurdockChairman of the Board andChief Executive Officer

Divestiture of Honduran Beverage Operations
On November 28, 2001, Dole consummated the
divestiture of its 97% stake in the Cerveceria
Hondureña S.A. beverage operations located in
Honduras through a stock exchange transaction
with a subsidiary of South African Breweries plc.
Subsequent to the stock exchange transaction, Dole
received $537 million of cash, which resulted in a
net gain to the company of $168.6 million. The net
proceeds were immediately used to pay down debt.
The disposition of this business was in line with
Dole’s strategy of divesting itself of non-core assets.
We wish our long time Cerveceria Hondureña asso-
ciates much success with South African Breweries.
New Miami Facility
In December 2001, Dole’s Florida-based fresh-cut
flowers distribution operation moved into a new
328,000 square foot building. Approximately
200,000 square feet of this state-of-the-art facility
is refrigerated.
Management Changes
Our 150-year history and strong foundation affords
Dole the ability of being able to draw from an
experienced and competent management base.
In 2001, we were able to promote and reposition
from within our ranks several members of senior
and middle management.
Dole Food Company, Inc. Annual Report 2001 3
Dole Food Company Board of Directors(Seated, right to left): David H. Murdock, Lawrence A. Kern
(Standing, right to left): Zoltan Merszei, Lawrence M. Johnson, David A. DeLorenzo, E. Rolland Dickson, M.D., Mike Curb, Richard M. Ferry
In February 2001, Lawrence (Larry) A. Kern was
appointed President and Chief Operating Officer.
He was previously President of Dole’s highly
successful Fresh Vegetables business where he
pioneered its transformation from a commodity
vegetables operation to a balanced business with a
strong value-added revenue base complemented
by a right-sized commodity vegetables operation.
Eric M. Schwartz succeeded Mr. Kern as President
of Dole Worldwide Fresh Vegetables. He was previ-
ously Senior Vice President of Operations at this
division. Richard A. Harrah was appointed
President of Dole’s Latin American production
operations. He was previously Vice President of
Operations at Dole Fresh Flowers. Prior to joining
Dole, he had extensive experience in the banana
industry, serving in senior executive capacities in
the food industry. Scott Greenwood was appointed
President of Dole’s Fresh Flowers division. He
was previously Vice President of Sales for Dole
Packaged Foods. Michael J. Cavallero was promoted
to President of Dole North American Tropical
Fresh Fruit, previously serving that division as
Vice President of Sales and Marketing.
During 2001, David DeLorenzo retired as Vice
Chairman, having served the company in various
executive capacities for 31 years. His knowledge,
loyalty, dedication and integrity were instrumental
in making Dole a global leader in the industry.
Mr. DeLorenzo will continue to serve as a member
of the Board of Directors.
Financing Activities
In August 2001, Dole renewed its 364-day revolv-
ing credit facility for $200 million. Agents in the
facility are Bank of America and the Bank of Nova
Scotia. There have been no borrowings under this
facility. Toward the end of 2001, all of the out-
standing borrowings under the company’s $400
million, five-year revolving credit facility were
repaid, primarily with proceeds from the disposi-
tion of the Honduran Beverage business. As a
result, at year-end 2001, Dole’s reduced outstanding
borrowings only consist of $775 million of long-
term bonds and limited foreign borrowings.
Outlook
Having completed major cost-cutting initiatives in
2001 coupled with the divestiture of major non-
core and under-performing assets during the year,
Dole will focus on expanding its core businesses in
key markets. In 2002, management will continue
to dedicate efforts to completing the divestiture of
a few remaining non-core and under-performing
businesses but these efforts are largely behind us.
As there can be no substitute for being the low
cost provider to our markets, we will maintain our
focus on achieving a reduced cost structure. We
will also seek new opportunities both internally
and externally to expand our product offerings
and grow our revenue base. We begin 2002 with
confidence in our abilities to profitably grow our
core businesses while maintaining genuine con-
cern for the well-being of our people and the
consumer. Our realigned management team is
prepared for these challenges.
We would like to express our gratitude to our
employees, shareholders and customers for their
continued support and confidence.
Sincerely,
David H. Murdock
Chairman and Chief Executive Officer
Dole Food Company, Inc. Annual Report 2001 4

The Encyclopedia of
Foods: A Guide to
Healthy Nutrition
is a beautifully
photographed and
illustrated 500-page
book that is part of
Dole’s ongoing effort
to promote healthy,
nutritious foods and
lifestyles. The definitive resource on what to eat
for maximum health, the Encyclopedia provides
an overview of the principles of nutrition. The
foods that we eat play a major role in the prevention
and treatment of coronary artery disease, cancer,
stroke and diabetes, the four leading causes of
death in the United States. The role of nutrition in
other common medical conditions such as obesity,
high blood pressure and osteoporosis is discussed.
The Encyclopedia stresses and illustrates the
importance of the Food Guide Pyramid, health
implications of the various food groups as well as
nutrient contents, history and recommended uses.
An invaluable resource for linking food and
health, key features include:
• Narrative of the food groups – fruits, vegetables,
grains, high-protein foods, dairy foods, herbs,
spices, beverages, fats, oils and sweeteners.
• Overview of the basic principles of nutrition,
recommendations for nutrient intake, the role
of each nutrient and the US Dietary Guidelines
for Americans and how it translates into healthy
food selections.
• Creative ways to select, plan and prepare health-
ful meals, including two weeks of nutritionally
balanced menus and ways to modify favorite
family recipes to be healthful and delicious.
• Information on supplements, antioxidants,
phytochemicals, functional foods and new
food technology.
To order on-line, please go to www.dole.com.
The Encyclopedia of Foods: A Guide to Healthy
Nutrition is available for $19.95, plus $3.00
shipping and handling per book.
Dole Food Company, Inc. Annual Report 2001 5
Exercise for Health Healthy Prepared Meals Fiber and Vitamin Sources Food-Health Connection
Encyclopedia of Foods: A Guide to Healthy Nutrition
This book was prepared by medical and nutrition experts from the Mayo Clinic,
University of California Los Angeles and the Dole Food Company, Inc.
Dole Food Company, Inc. Annual Report 2001 6
During the year 2001, operat-
ing management made sig-
nificant strides in transform-
ing the Dole Food Company
from a production driven
company into a sales and
market driven one. This was
accomplished by undertaking
a review of our current customer base and focusing
only on those that were deemed to be strategically
important and profitable business partners. This
effort was further supported by a review of our
markets and the businesses in those markets,
which resulted in our initiating steps to exit
markets and businesses determined to be non-core
or under-performing. In addition, we focused on
dramatically reducing our costs worldwide.
As a result of these initiatives, total worldwide
revenues of $4.45 billion for 2001 were essentially
even with 2000. Revenues for 2001 were signifi-
cantly higher in most of our core businesses pri-
marily as a result of higher volumes and prices for
North American bananas, higher volumes and
prices for our Premium Select pineapple in North
America and Europe, increased volumes for our
North American packaged salads business consis-
tent with category growth, and increased volumes
of our FRUIT BOWLS® and FRUIT-N-GEL
BOWLS™ in North America. However, these
increases were offset by the impact on revenues
of asset sales and business shutdowns, which
accounted for approximately $140 million of
revenues in 2000 that were not realized in 2001.
The weak euro and yen to US dollar exchange rates
negatively impacted revenues by approximately
$85 million. Additional offsets included reductions
in our banana volumes to unprofitable markets in
Eastern Europe and lower year-over-year pricing in
our commodity vegetables business.
Earnings before interest and taxes (“EBIT”) from
continuing operations was $187 million, versus
$141 million for 2000. Improved EBIT in the
company’s fresh fruit segment, primarily due to
higher banana and fresh pineapple profits in
North America and Europe, was slightly offset by
losses in the California deciduous and Northwest
apples businesses, which the company is exiting.
EBIT was also higher in the company’s fresh veg-
etables segment as a result of category growth for
packaged salads which offset lower commodity
vegetables pricing, and in the packaged foods
segment as a result of increased FRUIT BOWL
and FRUIT-N-GEL BOWL sales volumes and
lower production costs. Earnings were lower in
the fresh-cut flowers segment, due to unfavorable
market conditions, which resulted in lower sales
volumes. Consulting fees relative to the cost
savings programs implemented during the year
served as a one-time partial offset to EBIT growth.
Operational Review
The year of 2001 was a year of change, challenge and achievement for the Dole
Food Company as we transformed into a more sales and marketing driven company.
We look to our key customers and vendors to be our strategic business partners.
Lawrence A. KernPresident andChief Operating Officer
We recently finished the strategic and operational
reviews of our North American banana and fresh-
cut flowers businesses, and have begun to imple-
ment changes. We completed the reviews of our
European, Latin American and Asian banana
operations some time ago, and implementation of
process enhancements are well on their way. Our
strategic sourcing and logistics and distribution
analyses are also complete and implementation is
nearing completion. To date, we have identified
100% of our goal of $200 million of annual
improvements to future operating results that
should be realized on a steady state basis by 2003.
These programs contributed approximately $93
million of pre-tax operating earnings, before off-
sets, during 2001. These programs also resulted in
$28 million of one-time pre-tax charges to income
in the second quarter and $105 million of pre-tax
charges in the third quarter of 2001. No additional
charges from these programs were made in the
fourth quarter and we expect that there will be no
further significant charges associated with these
programs in the future.
Of the $93 million in 2001 profit improvement,
approximately $25 million dropped through to
pre-tax income. The offsets of approximately
$68 million were mainly from the impact of lower
pricing for commodity vegetables, reduced sales
volumes for fresh-cut flowers, the effect of foreign
currency exchange, primarily from the yen, the
absence of earnings from the Honduran Beverage
business and consulting costs associated with the
strategic and operational reviews of our businesses.
The non-recurring portion of these offsets was
approximately $13 million. Therefore, excluding
the non-recurring offsets, about 40 percent of the
profit improvements added to pre-tax profit for 2001.
Dole Food Company, Inc. Annual Report 2001 7
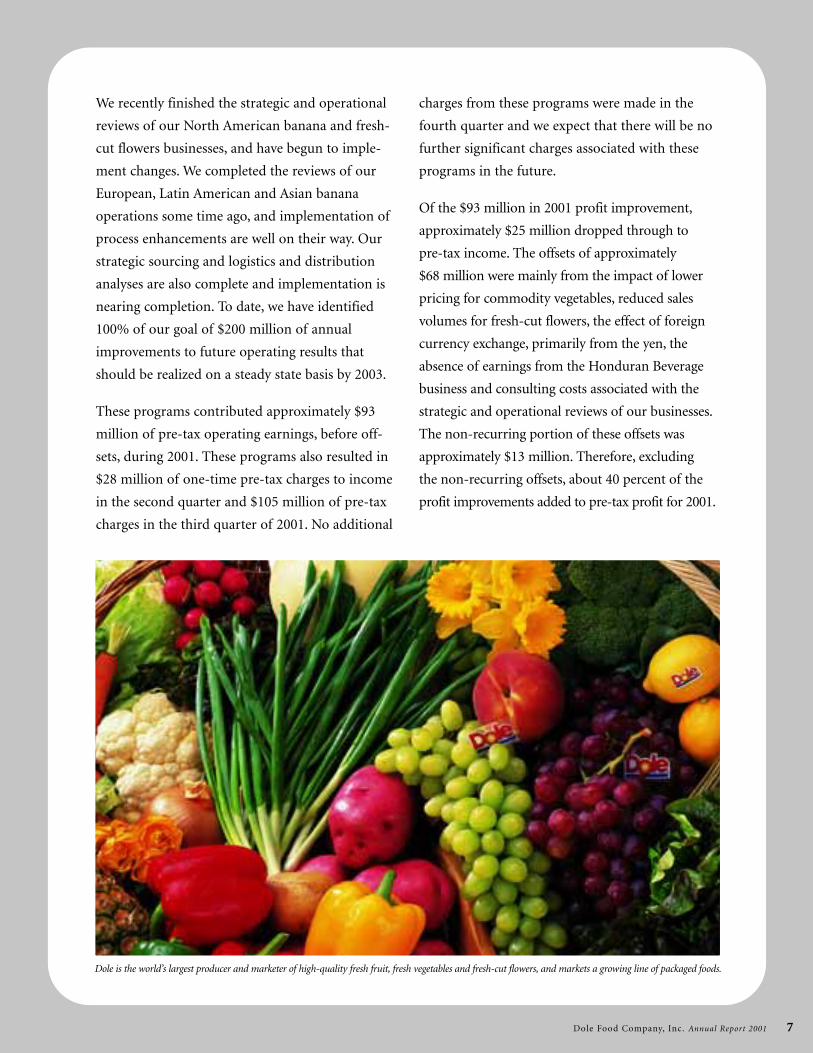
Dole is the world’s largest producer and marketer of high-quality fresh fruit, fresh vegetables and fresh-cut flowers, and markets a growing line of packaged foods.
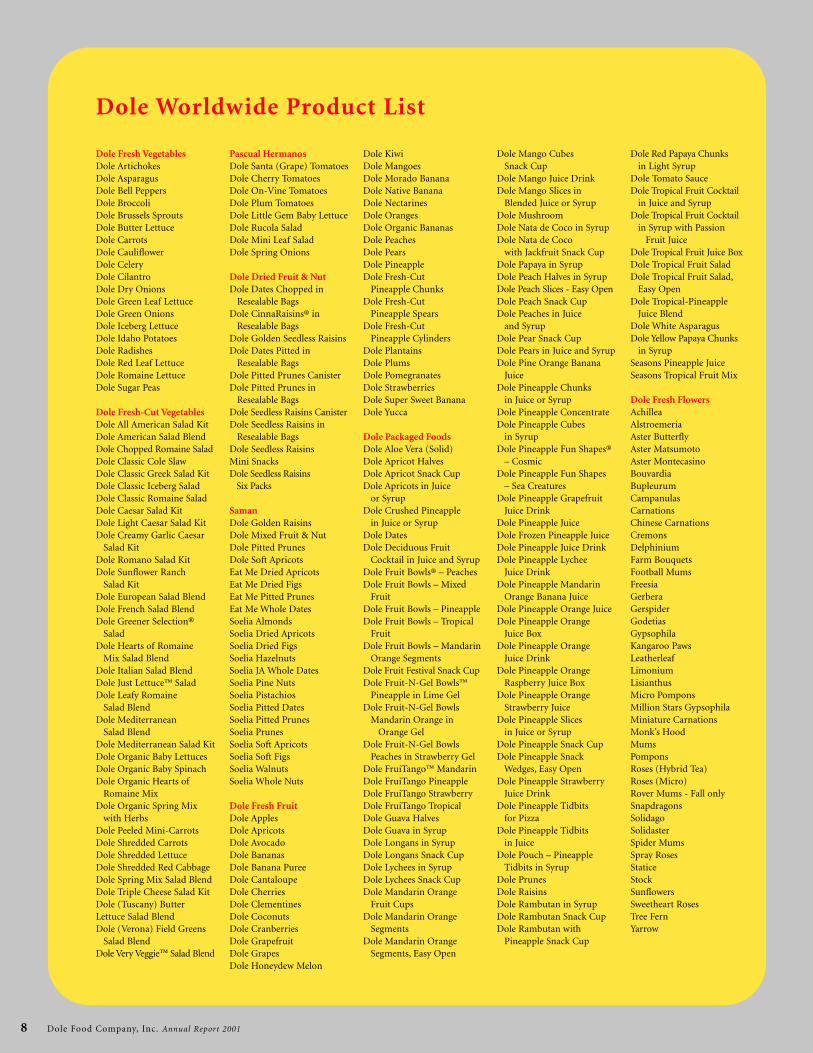
Dole Worldwide Product List
Dole Fresh VegetablesDole ArtichokesDole AsparagusDole Bell PeppersDole BroccoliDole Brussels SproutsDole Butter LettuceDole CarrotsDole CauliflowerDole CeleryDole CilantroDole Dry OnionsDole Green Leaf LettuceDole Green OnionsDole Iceberg LettuceDole Idaho PotatoesDole RadishesDole Red Leaf LettuceDole Romaine LettuceDole Sugar Peas
Dole Fresh-Cut VegetablesDole All American Salad KitDole American Salad BlendDole Chopped Romaine SaladDole Classic Cole SlawDole Classic Greek Salad KitDole Classic Iceberg SaladDole Classic Romaine SaladDole Caesar Salad KitDole Light Caesar Salad KitDole Creamy Garlic Caesar
Salad KitDole Romano Salad KitDole Sunflower Ranch
Salad KitDole European Salad BlendDole French Salad BlendDole Greener Selection®
SaladDole Hearts of Romaine
Mix Salad BlendDole Italian Salad BlendDole Just Lettuce™ SaladDole Leafy Romaine
Salad BlendDole Mediterranean
Salad Blend Dole Mediterranean Salad KitDole Organic Baby LettucesDole Organic Baby SpinachDole Organic Hearts of
Romaine MixDole Organic Spring Mix
with HerbsDole Peeled Mini-CarrotsDole Shredded CarrotsDole Shredded LettuceDole Shredded Red CabbageDole Spring Mix Salad BlendDole Triple Cheese Salad KitDole (Tuscany) ButterLettuce Salad BlendDole (Verona) Field Greens
Salad BlendDole Very Veggie™ Salad Blend
Pascual HermanosDole Santa (Grape) TomatoesDole Cherry TomatoesDole On-Vine TomatoesDole Plum TomatoesDole Little Gem Baby LettuceDole Rucola SaladDole Mini Leaf SaladDole Spring Onions
Dole Dried Fruit & NutDole Dates Chopped in
Resealable BagsDole CinnaRaisins® in
Resealable BagsDole Golden Seedless RaisinsDole Dates Pitted in
Resealable BagsDole Pitted Prunes CanisterDole Pitted Prunes in
Resealable BagsDole Seedless Raisins CanisterDole Seedless Raisins in
Resealable BagsDole Seedless Raisins Mini SnacksDole Seedless Raisins
Six Packs
SamanDole Golden RaisinsDole Mixed Fruit & NutDole Pitted PrunesDole Soft ApricotsEat Me Dried ApricotsEat Me Dried FigsEat Me Pitted PrunesEat Me Whole DatesSoelia AlmondsSoelia Dried ApricotsSoelia Dried FigsSoelia HazelnutsSoelia JA Whole DatesSoelia Pine NutsSoelia PistachiosSoelia Pitted DatesSoelia Pitted PrunesSoelia PrunesSoelia Soft ApricotsSoelia Soft FigsSoelia WalnutsSoelia Whole Nuts
Dole Fresh FruitDole ApplesDole ApricotsDole AvocadoDole BananasDole Banana Puree Dole CantaloupeDole CherriesDole ClementinesDole CoconutsDole CranberriesDole GrapefruitDole GrapesDole Honeydew Melon
Dole KiwiDole MangoesDole Morado BananaDole Native BananaDole NectarinesDole OrangesDole Organic BananasDole PeachesDole PearsDole PineappleDole Fresh-Cut
Pineapple ChunksDole Fresh-Cut
Pineapple SpearsDole Fresh-Cut
Pineapple CylindersDole Plantains Dole PlumsDole PomegranatesDole StrawberriesDole Super Sweet BananaDole Yucca
Dole Packaged FoodsDole Aloe Vera (Solid)Dole Apricot HalvesDole Apricot Snack CupDole Apricots in Juice
or SyrupDole Crushed Pineapple
in Juice or SyrupDole DatesDole Deciduous Fruit
Cocktail in Juice and SyrupDole Fruit Bowls® – PeachesDole Fruit Bowls – Mixed
FruitDole Fruit Bowls – Pineapple Dole Fruit Bowls – Tropical
Fruit Dole Fruit Bowls – Mandarin
Orange SegmentsDole Fruit Festival Snack CupDole Fruit-N-Gel Bowls™
Pineapple in Lime GelDole Fruit-N-Gel Bowls
Mandarin Orange inOrange Gel
Dole Fruit-N-Gel BowlsPeaches in Strawberry Gel
Dole FruiTango™ MandarinDole FruiTango PineappleDole FruiTango StrawberryDole FruiTango TropicalDole Guava HalvesDole Guava in SyrupDole Longans in SyrupDole Longans Snack CupDole Lychees in SyrupDole Lychees Snack CupDole Mandarin Orange
Fruit CupsDole Mandarin Orange
SegmentsDole Mandarin Orange
Segments, Easy Open
Dole Mango Cubes Snack Cup
Dole Mango Juice DrinkDole Mango Slices in
Blended Juice or SyrupDole MushroomDole Nata de Coco in SyrupDole Nata de Coco
with Jackfruit Snack CupDole Papaya in SyrupDole Peach Halves in SyrupDole Peach Slices - Easy OpenDole Peach Snack CupDole Peaches in Juice
and SyrupDole Pear Snack CupDole Pears in Juice and SyrupDole Pine Orange Banana
JuiceDole Pineapple Chunks
in Juice or SyrupDole Pineapple ConcentrateDole Pineapple Cubes
in SyrupDole Pineapple Fun Shapes®
– CosmicDole Pineapple Fun Shapes
– Sea CreaturesDole Pineapple Grapefruit
Juice DrinkDole Pineapple JuiceDole Frozen Pineapple JuiceDole Pineapple Juice DrinkDole Pineapple Lychee
Juice DrinkDole Pineapple Mandarin
Orange Banana JuiceDole Pineapple Orange JuiceDole Pineapple Orange
Juice BoxDole Pineapple Orange
Juice DrinkDole Pineapple Orange
Raspberry Juice BoxDole Pineapple Orange
Strawberry JuiceDole Pineapple Slices
in Juice or SyrupDole Pineapple Snack CupDole Pineapple Snack
Wedges, Easy OpenDole Pineapple Strawberry
Juice DrinkDole Pineapple Tidbits
for PizzaDole Pineapple Tidbits
in JuiceDole Pouch – Pineapple
Tidbits in SyrupDole PrunesDole RaisinsDole Rambutan in SyrupDole Rambutan Snack CupDole Rambutan with
Pineapple Snack Cup
Dole Red Papaya Chunksin Light Syrup
Dole Tomato SauceDole Tropical Fruit Cocktail
in Juice and SyrupDole Tropical Fruit Cocktail
in Syrup with Passion Fruit Juice
Dole Tropical Fruit Juice BoxDole Tropical Fruit SaladDole Tropical Fruit Salad,
Easy OpenDole Tropical-Pineapple
Juice BlendDole White AsparagusDole Yellow Papaya Chunks
in SyrupSeasons Pineapple JuiceSeasons Tropical Fruit Mix
Dole Fresh FlowersAchilleaAlstroemeriaAster ButterflyAster MatsumotoAster MontecasinoBouvardiaBupleurumCampanulasCarnationsChinese CarnationsCremonsDelphiniumFarm BouquetsFootball MumsFreesiaGerberaGerspiderGodetiasGypsophilaKangaroo PawsLeatherleafLimoniumLisianthusMicro PomponsMillion Stars GypsophilaMiniature CarnationsMonk’s HoodMumsPomponsRoses (Hybrid Tea)Roses (Micro)Rover Mums - Fall onlySnapdragonsSolidagoSolidasterSpider MumsSpray RosesStaticeStockSunflowersSweetheart RosesTree FernYarrow
Dole Food Company, Inc. Annual Report 2001 8
Dole Food Company, Inc. Annual Report 2001 9
North America
During 2001,
Dole bananas,
already the num-
ber one banana
brand in North
America, continued to grow in market share. Our
experienced and knowledgeable sales team worked
to solidify strong relationships with retail customers
and emphasized building new partnerships with
wholesalers. In the produce industry in North
America today, wholesale partners are key to our
distribution and expansion into independent
markets and chains that do not have their own
ripening facilities.
In early 2001, we expanded our fresh fruit product
line by introducing organic bananas under the
DOLE brand. The introduction proved successful,
as we have found that organic produce is a grow-
ing category throughout North America.
Although our food service airline business was some-
what affected by the September 11 tragedy, we were
still able to expand our bananas into new outlets. We
feel our success in the food service arena has much to
do with our innovative packaging designs that meet
the needs of food service accounts.
We continued to develop relationships with school
districts across the country, emphasizing Dole’s
commitment to nutrition education and the 5 A
Day message. While our new version of Dole’s
5 A Day nutrition education CD-ROM was get-
ting into classrooms, we were getting more Dole
bananas onto school breakfast and lunch menus.
In marketing, we continued to grow our brand
through promotions like the Dole Banana Shuffle,
tie-ins with major national brands and a sweep-
stakes that sent the winners on a trip to the Williams
World Classic Golf Tournament. In advertising, our
focus is to reach consumers with a nutrition message
that also portrays our products as fun.
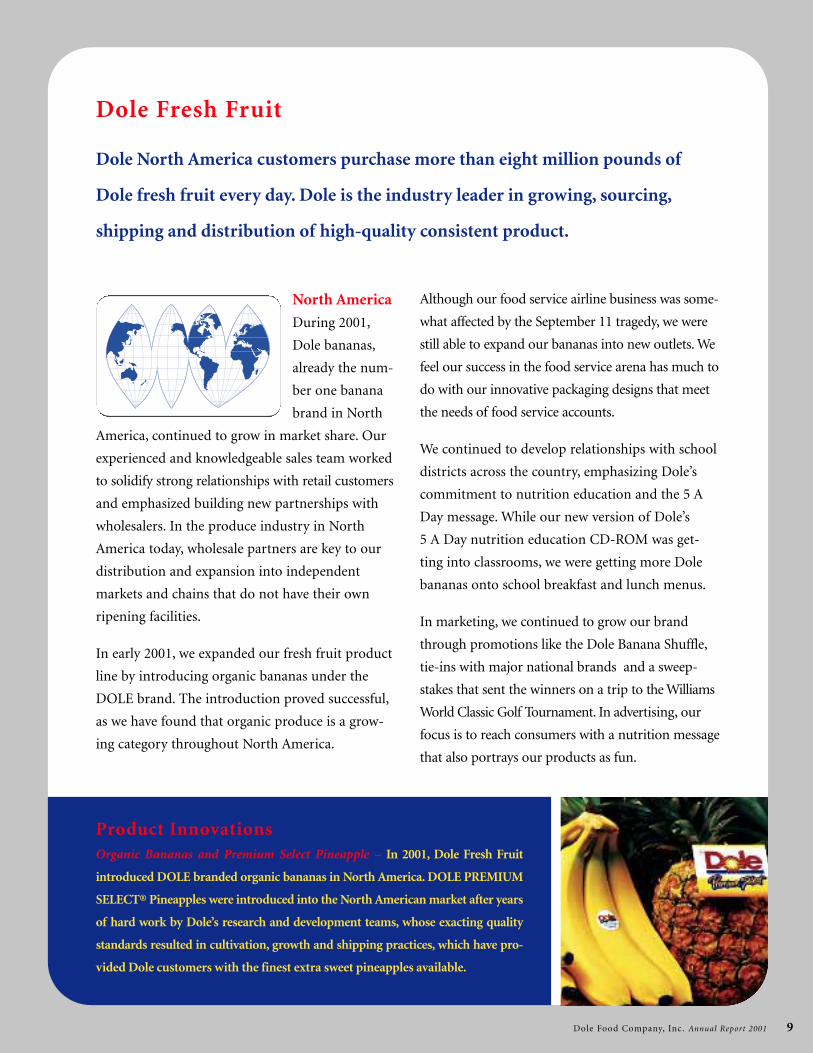
Dole Fresh Fruit
Dole North America customers purchase more than eight million pounds of
Dole fresh fruit every day. Dole is the industry leader in growing, sourcing,
shipping and distribution of high-quality consistent product.
Product InnovationsOrganic Bananas and Premium Select Pineapple – In 2001, Dole Fresh Fruit
introduced DOLE branded organic bananas in North America. DOLE PREMIUM
SELECT® Pineapples were introduced into the North American market after years
of hard work by Dole’s research and development teams, whose exacting quality
standards resulted in cultivation, growth and shipping practices, which have pro-
vided Dole customers with the finest extra sweet pineapples available.
Dole Food Company, Inc. Annual Report 2001 10
Dole’s pineapple category grew in North America
over the past year. In Hawaii, Dole refocused on its
core business of pineapples while other less prof-
itable product lines were eliminated to redirect
all resources toward expanding the category. Our
other tropical product categories, such as melons
as well as cranberries, continue to grow.
Dole’s North American deciduous program
achieved record revenues and solidified the number
one position in the market for the 2001 season.
Dole improved its stone fruit market share
considerably over the previous year, ranking as
the market leader in Chilean stone fruit imports.
This program complements Dole’s Chilean grape
program, which is also number one in North
America. Dole continues to import a full line of
apples and pears from Chile and completed a very
successful introduction of DOLE branded avoca-
dos into North America.
Dole’s South African import program is relatively
small but has an optimistic outlook for growth in
the deciduous and citrus categories. South Africa
offers a full line of table grapes, including varieties
that are new to our overall program. South African
citrus imports enable us to offer an additional line
of products to our customers through the summer
months. These programs nicely parallel with and
add depth to our Chilean business and complement
our existing product line. We foresee continued
growth opportunities in this area.
Europe
Dole Europe dramatically improved its revenue
and profit performance during 2001 through a
restructuring of its banana business that eliminated
one-third of its overhead, consolidated shipping
services and concentrated activities on servicing
supermarkets directly.
Dole Europe also introduced new banana packaging
presentations for “Baby Bananas” and “Gourmet
Bananas” as well as single finger displays for con-
venience stores. Banana production and marketing
has also been expanded to consider the growing
demand for organically grown bananas. With these
new banana presentations, Dole Europe is working
with its retail partners to broaden product offer-
ings in order to appeal to the increasing demands
of our consumers.
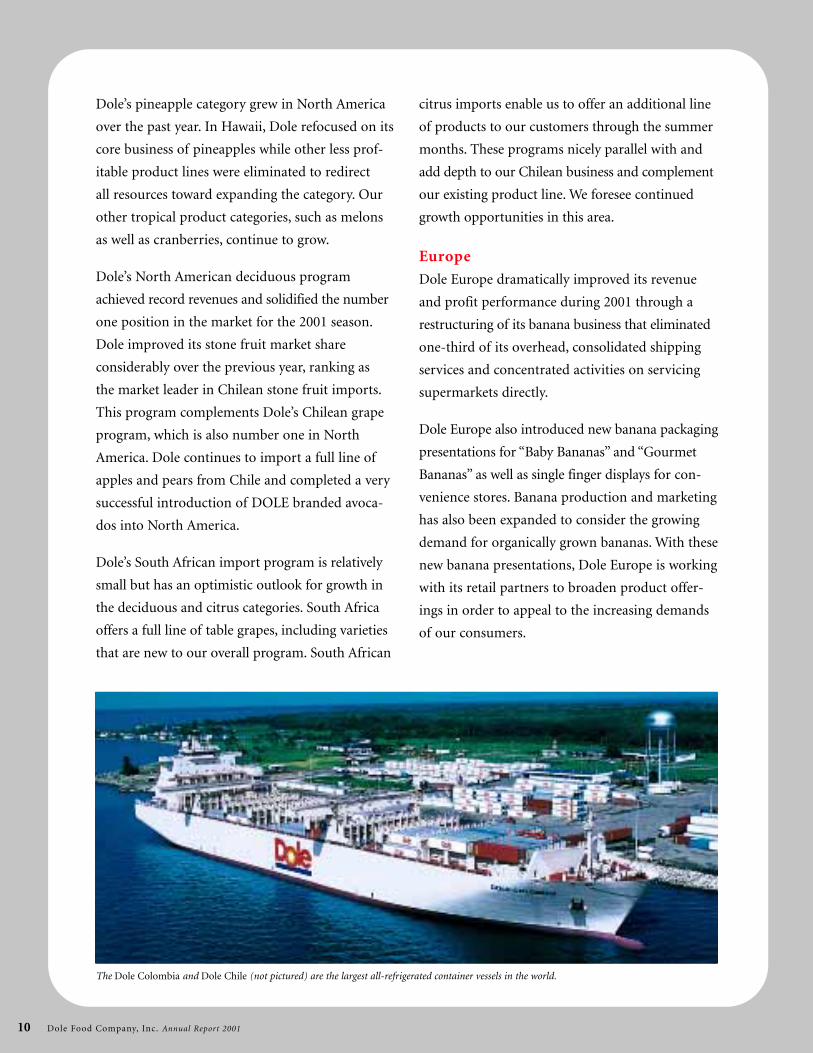
The Dole Colombia and Dole Chile (not pictured) are the largest all-refrigerated container vessels in the world.
Dole Food Company, Inc. Annual Report 2001 11

Dole Food Company, Inc. Annual Report 2001 12
Fact from Encyclopedia of Foods Fruit is a valuable source of fiber, vitamin C, some of the B
vitamins, vitamin A, and other antioxidants and phytonutri-
ents. A diet that contains ample amounts of fruits and veg-
etables is associated with a reduced risk for cancer. There is
no evidence that mineral or vitamin supplements are better
than obtaining nutrients though whole foods.
Dole Europe’s ripening and distribution activity
reached almost $1 billion in revenue for 2001. Of
particular note, we have expanded our German
distribution to the Berlin area to better service
rapidly expanding retailers in the new German
capital, which may be the center of an expanded
European Union.
A major concern to European consumers is food
safety. Following concerns about various contamina-
tion incidents, retailers are demanding strict suppli-
er accountability. Dole is a leader in full traceability
of its supply chain. For example, Dole South Africa
has been recognized by some leading European
retailers as a reliable supplier with systems in place
to trace produce from the supermarket shelf back
to the tree or vine where it grew. Dole Europe is
expanding this capability throughout its businesses.
Complete accountability for each product will pro-
vide consumers with the comfort they desire.
Dole Europe’s mission is one of service to its retail
customers and satisfaction of consumer demand.
Asia
In Asia, Dole faced tough challenges due to weak
economic conditions in its primary markets and
the strength of the US dollar. In addition, the
Asian banana industry suffered from over-supply.
In order to address this situation, Dole Asia com-
pleted a restructuring of its operations including
reducing volumes from company as well as inde-
pendent grower farms, and downsizing adminis-
trative overhead. These steps have allowed Dole
Asia to re-focus on its strategy of innovative agri-
cultural excellence aligned with customer require-
ments for high quality fresh fruits and vegetables.
Dole Asia is confident that the significant expan-
sion of niche and value-added products form a
solid foundation for future profitable growth.
Latin America
Banana industry volumes were down year over
year by about 5% due to cooler than normal
weather in South America, which contributed to
overall better pricing in North America and
Europe. As part of Dole’s cost reduction and profit
improvement strategy, it exited unprofitable mar-
kets and, accordingly, adjusted its volume to meet
its core market requirements. Through increased
ship utilization and higher productivity from its
own farms, delivered costs significantly improved
in 2001. Dole bananas are grown on 15,000
hectares of Company owned farms and about
29,000 hectares of independent producers’ farms.
Dole’s new organic banana farm in Ecuador,
Nuevo Esperanza (New Hope), came into full
production bringing to North America the highest
quality organic bananas available in the market.
An independent grower program was also started
in Peru to provide additional volume of high
quality organic bananas.
Dole has expanded its Premium Select pineapple
operations in Latin America and now sources
from fully operational farms in Costa Rica,
Ecuador and Honduras.
All of Dole’s Latin American farming operations
became fully certified under an Environmental
Management System to ISO 14001 international
standards. Certifications oversee compliance of
applicable laws on worker safety and environmen-
tal protection by our farms and those of our inde-
pendent growers.
Over 22,000 Dole employees throughout Latin
America are dedicated to bringing to market the
highest quality and safest fresh fruit possible.
Dole Food Company, Inc. Annual Report 2001 13
Dole Food Company, Inc. Annual Report 2001 14
Earnings from
operations in
Dole’s fresh veg-
etables segment
were up due to
cost reduction
efforts and continued growth in revenues of the
packaged salads business. Dole’s retail packaged
salads not only maintained a leading market
share position, but growth exceeded that of this
category segment in the food industry. Dole Fresh
Vegetables continued to expand production and
distribution capabilities by completing significant
expansion projects in the Springfield, Ohio plant,
where a 30,000 square foot addition was added,
and the Yuma, Arizona facilities, where a 70,000
square foot addition is being added. Dole’s Yuma
production facility will transition from a five-
month seasonal operation to a year-round produc-
tion operation in the fall of 2002 to accommodate
the growth.
Dole Fresh Vegetables also continued to lead the
fresh-cut salad category in new product introduc-
tions. JUST LETTUCE™, a product containing a
mix of both iceberg and romaine lettuces, and
Hearts of Romaine Mix, have quickly become two
of the most popular salads in the premium salad
segments. New product development continues
to be a key driver in the growth of the segment,
accounting for over twenty percent of Dole’s
value-added volume growth year over year.
In the international markets, Dole also began
operation of its second green field production site
in Scandinavia. Helsingborg, Sweden, is the home
of the second fresh-cut plant now in operation
which provides DOLE branded retail salad prod-
ucts to the Sweden, Finland, and Denmark mar-
kets. The plants were designed with the same
stringent food safety requirements that were the
cornerstone of the North American facilities
design. Making multiple markets possible under
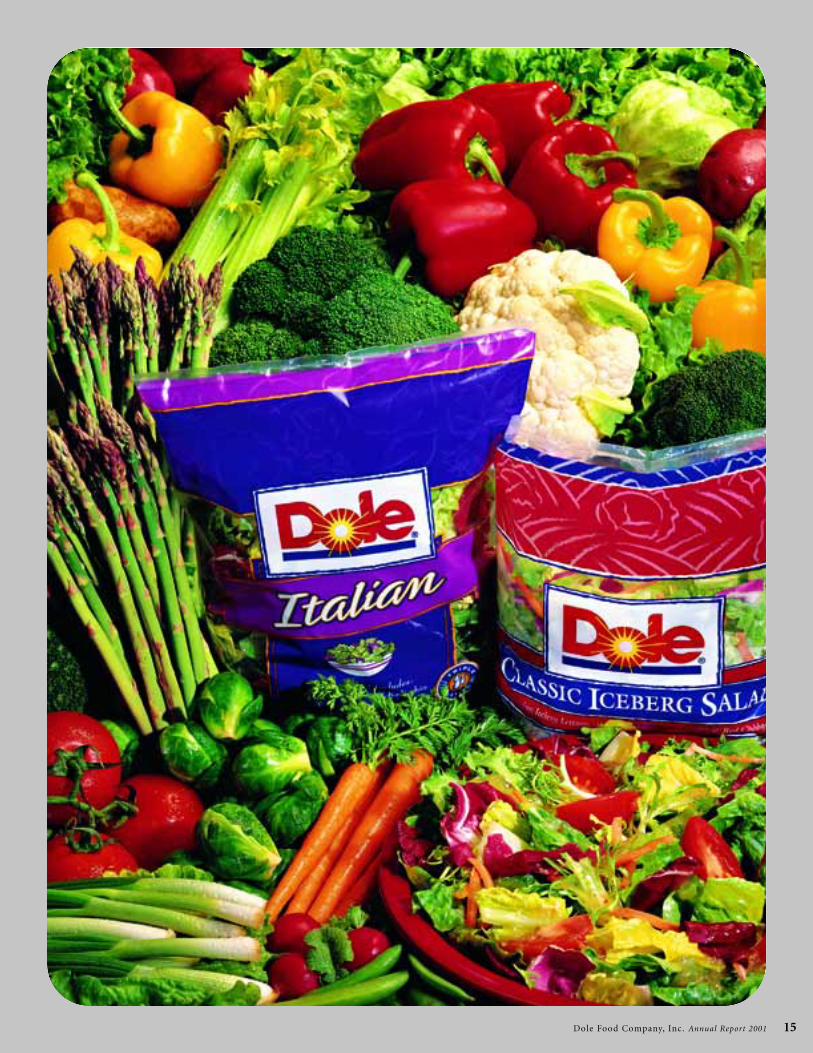
Hot New ProductsSalad Packages - Dole Fresh Vegetables led the category in new product intro-
ductions in 2001. JUST LETTUCE, introduced in January, is a new variety of
Premium Classics consisting of iceberg and romaine. It has become one of the
most popular salads in the category. Hearts of Romaine Mix was rolled out in
June, and quickly became one of our leading Salad Blends.
Dole Fresh Vegetables
In 2001, consumers purchased more Dole salads than any other brand. Dole’s
unit market share of the category was 37.3%. On average, consumers in the
United States buy 1,166,000 bags of Dole salads every day.
Dole Food Company, Inc. Annual Report 2001 15

Dole Food Company, Inc. Annual Report 2001 16
Fact from Encyclopedia of Foods Vegetables contribute significant amounts of vitamins,
minerals, soluble and insoluble fiber, and other phytonutri-
ents to our diets. The goal is to have at least three servings
of vegetables every day. Variety and different colors and
kinds of vegetables are important.
the DOLE brand, the actual packaging is printed
with trilingual instruction and labeling. Dole also
announced and has made plans for the divestiture
of Pascual Hermanos, which is a commodity busi-
ness located in Spain. With the exception of a
small citrus business, the divestiture plan calls for
Pascual Hermanos to be sold as an operating entity.
Offsetting improved results from packaged salads
in North America were divestiture costs relating
to the sale and or closure of non-performing
businesses in the deciduous segment and lower
commodity vegetable prices in North America.
Dole Fresh Vegetables ceased operations at its
Washington apple business. Most of the assets
of the apple business have either been sold or
are currently under escrow. Dole Fresh Vegetables
has also divested most of the assets associated
with the California Deciduous business.
Although commodity pricing was very strong,
results were below the record levels realized in
2000. Cost reduction efforts in the commodity
business were aggressive and helped in part to
offset cost increases in land rents, fertilizers, and
energy costs. Energy cost increases and supply
presented a significant challenge in 2001 and
continue to be at the forefront of challenges
ahead in the coming years.
Fresh Vegetables’ commodity program was suc-
cessful in obtaining marketing agreements leverag-
ing the DOLE brand in other commodities such as
potatoes. Dole Fresh Vegetables continues to offer
premium quality commodity vegetables to the
produce market, and is continuing to seek part-
nerships that will expand our vegetable presence
on the produce shelf.
In reference to food safety, The American Institute
of Baking, one of the nation’s leading independent
third party auditors for food safety practices, has
again rated both Dole value-added year-round
production facilities in California and Ohio as
“Superior”, which is the highest rating possible.
The Soledad plant initiated and completed a fif-
teen-month study with the Food and Drug
Administration on HACCP practices (Hazard
Analysis of Critical Control Points for food safety)
for the processing of pre-cut vegetables. Originally
developed by NASA, a HACCP program identifies
and eliminates any vectors of risk in a production
process so that food safety is proactive instead of
reactive. Examples that make up a HACCP pro-
gram include metal detectors on all production
lines, stainless steel construction of equipment for
ease of cleaning, and a comprehensive and docu-
mented daily sanitation program. The outcome of
the study was that, through information sharing
and hands-on training with Dole Fresh Vegetables
Quality Assurance personnel and FDA auditors,
there is a better understanding of the unique
pre-cut vegetable production process from both
a company and a regulatory standpoint.
Dole Food Company, Inc. Annual Report 2001 17
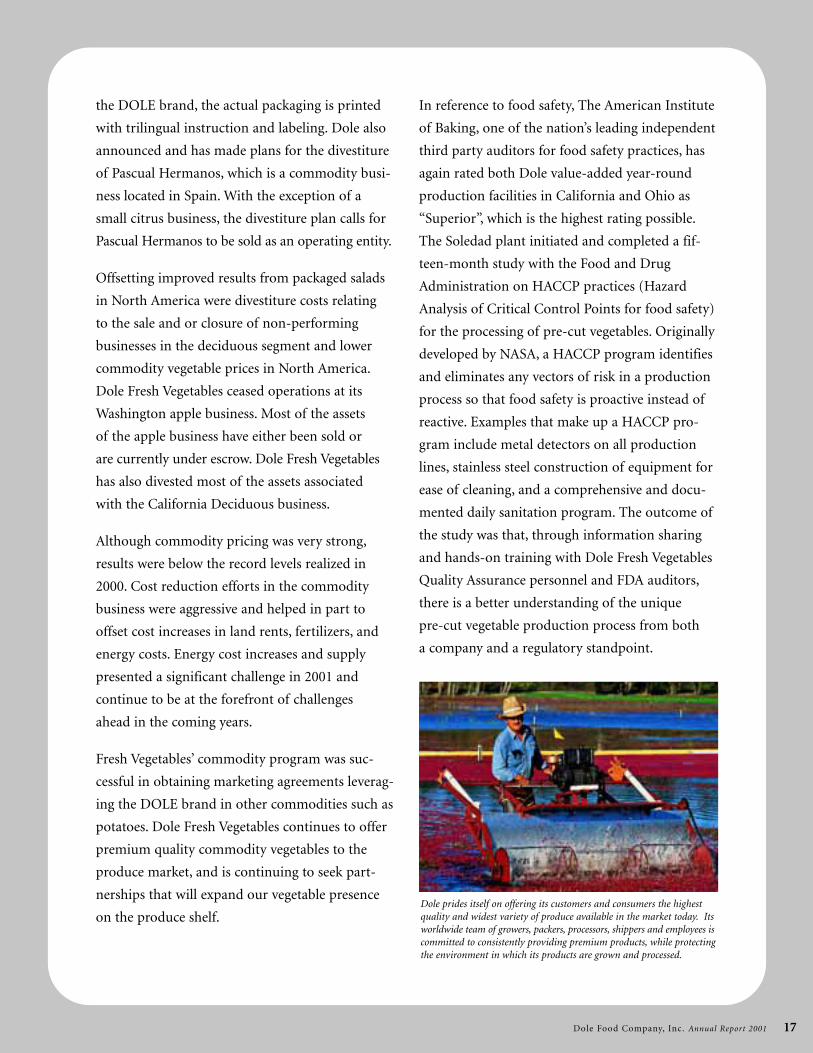
Dole prides itself on offering its customers and consumers the highestquality and widest variety of produce available in the market today. Itsworldwide team of growers, packers, processors, shippers and employees iscommitted to consistently providing premium products, while protectingthe environment in which its products are grown and processed.
Dole Food Company, Inc. Annual Report 2001 18
Operating results
in Dole’s pack-
aged foods busi-
ness increased,
primarily due to
higher volumes
of new products and lower production costs in the
company’s Asian processing plants. Our FRUIT
BOWLS continued to achieve excellent market
performance with a 40% market share for the year.
This was partly due to the successful launch of
Mandarin FRUIT BOWLS, which is now the
number two item in this category, right behind
Peaches. Additionally, the performance of our new
FRUIT-N-GEL BOWLS surpassed our expecta-
tions as well as exceeded those of our retailers.
Despite worldwide excess supply of pineapple and
concentrate in 2001, and price competition, Dole
maintained its overall revenue and market posi-
tion in these businesses. The marketing effort for
canned pineapple is focused on teaching consumers
how to eat more nutritiously by using this product
in their everyday meals and snacks. Looking for-
ward to 2002, the Thai pineapple industry, which
supplies about one third of the world’s canned
pineapple, is moving into a short supply cycle.
However, with dual sourcing capability (Phil-
ippines and Thailand), Dole is well supplied and
well positioned to gain market share. For canned
pineapple juice, the marketing effort is aimed at
delivering the message that Dole is 100% juice
and therefore a better-for-you alternative.
To further boost Dole’s presence in the marketplace,
a new product called 100% Juice FRUITANGO™
is being expanded into retail markets. This is a line
of single-serve, tropical juice blends in a “slim”
eight-ounce can, with four flavors: Pineapple,
Strawberry, Mandarin and Tropical. This product
tested extremely well in the club store channel,
and has since been expanded nationally. The retail
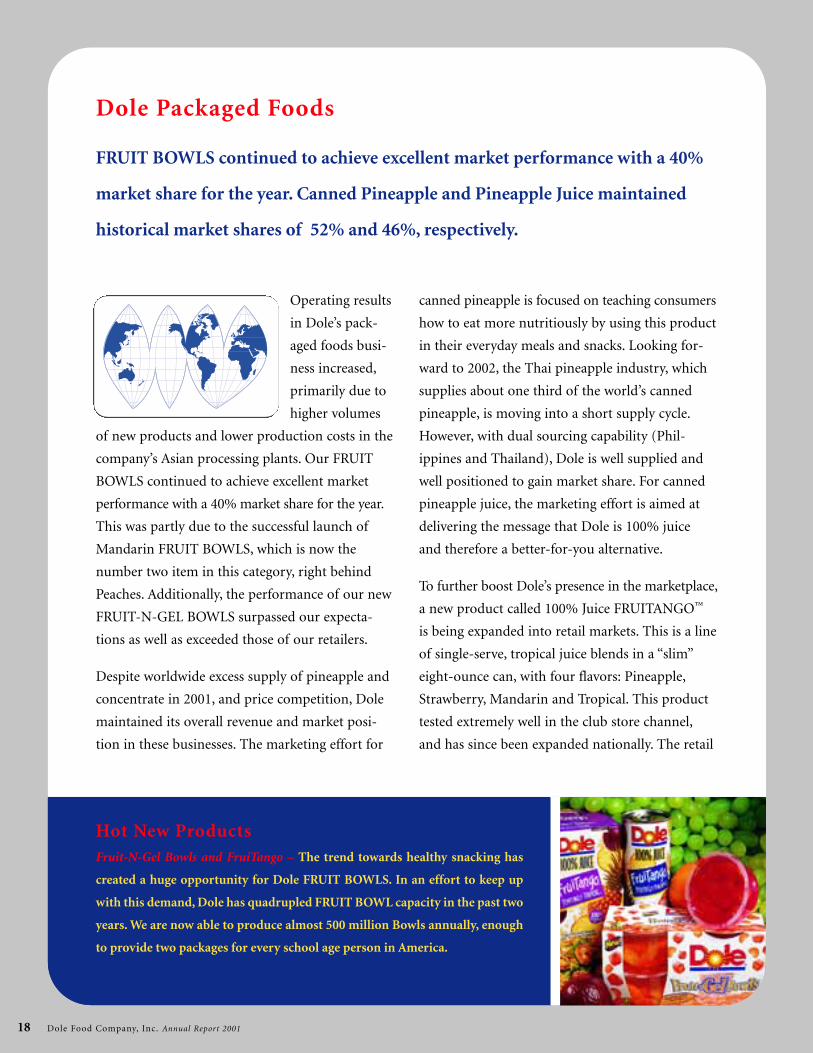
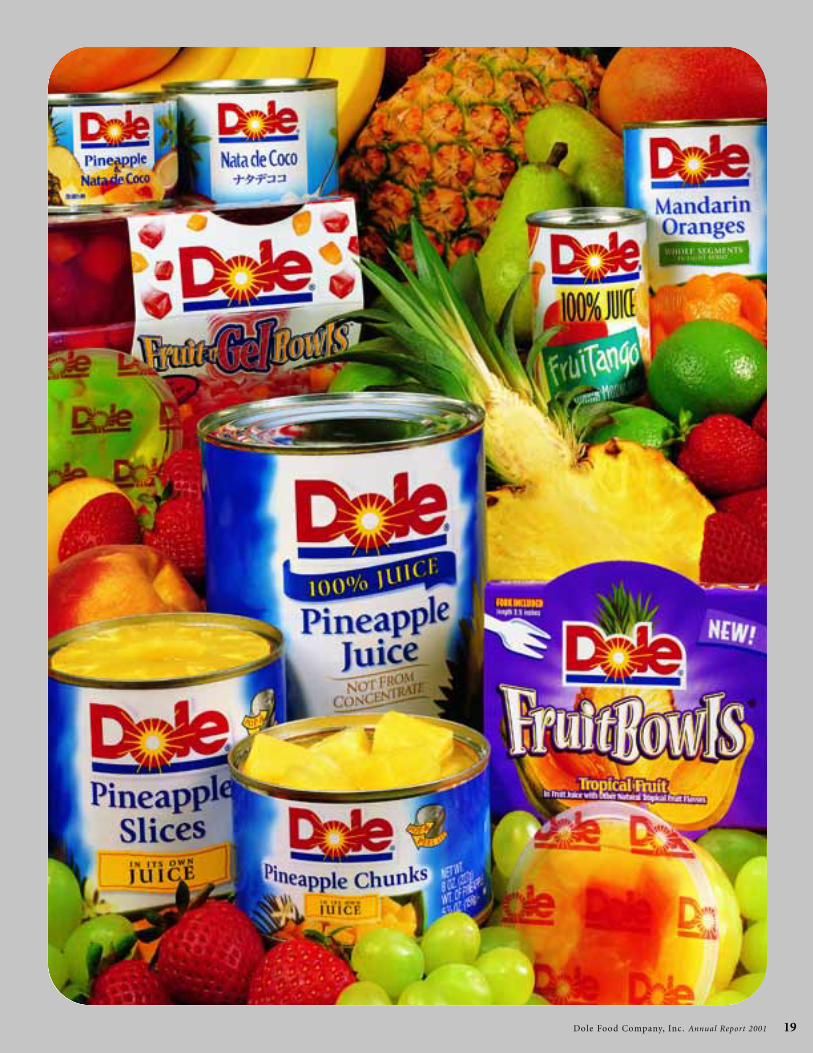
Dole Packaged Foods
FRUIT BOWLS continued to achieve excellent market performance with a 40%
market share for the year. Canned Pineapple and Pineapple Juice maintained
historical market shares of 52% and 46%, respectively.
Hot New ProductsFruit-N-Gel Bowls and FruiTango – The trend towards healthy snacking has
created a huge opportunity for Dole FRUIT BOWLS. In an effort to keep up
with this demand, Dole has quadrupled FRUIT BOWL capacity in the past two
years. We are now able to produce almost 500 million Bowls annually, enough
to provide two packages for every school age person in America.
Dole Food Company, Inc. Annual Report 2001 19

Dole Food Company, Inc. Annual Report 2001 20
Fact from Encyclopedia of Foods When it comes to eating at home, your meals can only be as
good as the food you have in your kitchen. Be sure you have
plenty of fruits, vegetables, and whole grains on hand so you
can translate your plan for healthful eating into enjoyable
and nutritious meals.
Dole Food Company, Inc. Annual Report 2001 21
expansion is being supported with television and
radio advertising, as well as in-store and local market
programs. This product is also getting a good
reception in the convenience store channel.
Given the success of the FRUIT BOWLS franchise,
six new items will be launched in the spring of
2002. Four of the items are single-serve and come
with a fork, for on-the-go consumption. These are
larger than the regular FRUIT BOWLS because
they are targeted specifically towards adults. The
four flavors are: Peaches, Pineapple, Mandarin
Orange and Tropical Fruit. These products are
expected to be particularly popular in convenience
stores. The other two items are reduced sugar
FRUIT-N-GEL BOWLS. These two products have
one-third less calories than regular FRUIT-N-GEL
BOWLS and come in the four-pack, four-ounce
cup format. The two flavors are: Pears in Kiwi-
Berry Gel, and Papaya in Peach Gel. These product
launches are supported by television advertising,
consumer promotion and public relations pro-
grams. In addition, significant resources have been
applied towards developing the next generation of
FRUIT BOWLS products.
With continued increasing demand for FRUIT
BOWLS, Dole is making additional investments
in its Asian canneries. These investments will go
toward state-of-the-art production equipment that
will ensure Dole’s position as industry innovator
and low cost producer. Dole is now packing as
many plastic cups as traditional cans.
With a broader line of convenience-oriented prod-
ucts, Dole is gaining expanded distribution in
non-grocery channels. This is important because
they are growing faster than the grocery channel,
some of the largest U.S. retailers are in these channels
and the costs of gaining new distribution in them
is less. In the last year, Dole has gained significant
new distribution in the drug, convenience store
and mass merchandiser channels, and has become
an increasingly dominant presence in the club
store snack cup business.
Aside from FRUIT BOWLS, new product develop-
ment efforts are underway for other value-added
packaging formats. A multi-serve, resealable plastic
bottle is being tested in a limited number of retail
channels, and a multi-serve pouch is being tested
in the foodservice sector. This packaging is intended
to deliver fruit to the end user in more convenient
and user-friendly ways, so as to increase overall
fruit consumption.
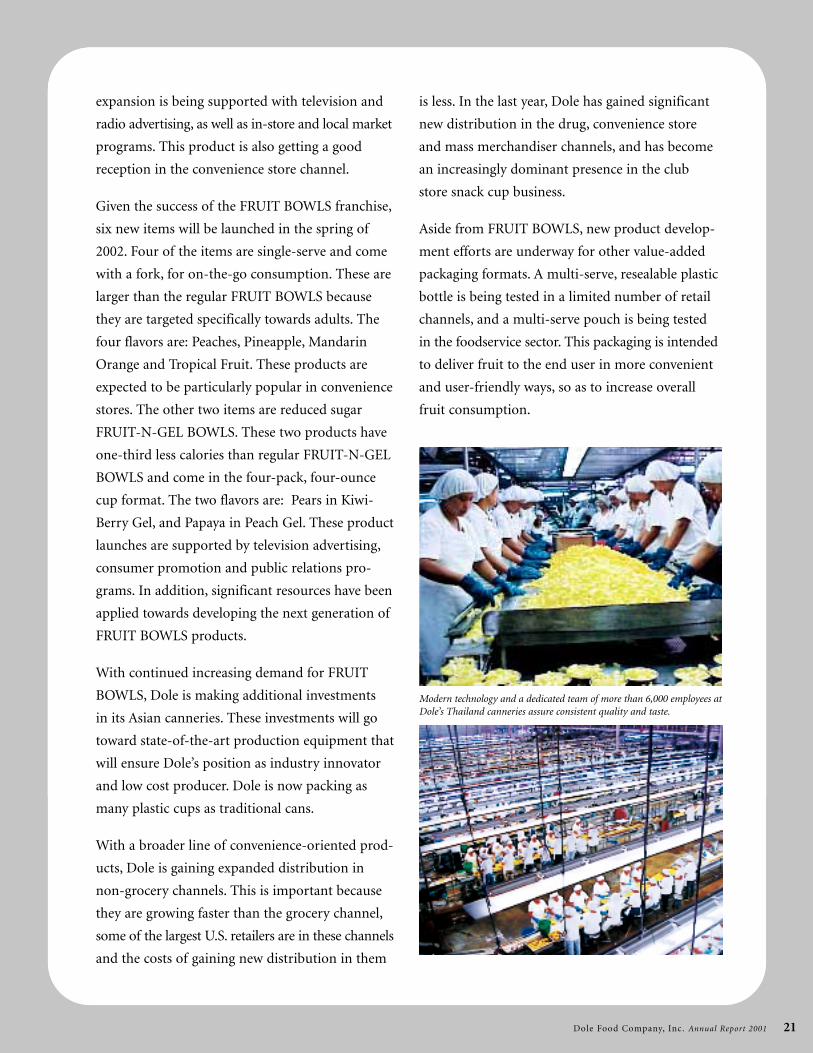
Modern technology and a dedicated team of more than 6,000 employees atDole’s Thailand canneries assure consistent quality and taste.
Dole Food Company, Inc. Annual Report 2001 22
We were some-
what disappoint-
ed with the per-
formance of our
fresh-cut flowers
segment during
the year, where we continued to experience inte-
gration challenges and unfavorable market condi-
tions. These have slowed our progress in reposi-
tioning this business. We are looking forward to
enhanced distribution efficiencies from our
Miami, Florida-based operations, which were
recently relocated into a new combined world-
wide divisional headquarters facility.
This new 328,000 square foot facility centralizes
production, warehousing and shipping opera-
tions, in addition to housing sales, marketing
and administrative offices. Located on 17 acres
in International Corporate Park, the new facility
began operations on December 17, 2001 with
300 employees, and will operate year-round. A
unique merchandising room showcases Dole’s 820
varieties of fresh-cut flowers, including 170 vari-
eties of roses, to prospective customers. Also, a
modern technical laboratory allows for continual
floral research and development. The consolida-
tion of operations from up to seven buildings at
peak holiday periods into one state-of-the-art
facility will streamline the handling of flowers
from production to distribution to receipt by our
customers. This will significantly improve cold-
chain management and tighten inventory control
and handling of product resulting in reduced
shrink costs and improved flower quality.
Within the facility, over 200,000 square feet is
refrigerated by a glycol ammonia system. This
system can control the variability in temperature
within one-half degree, which has been proven
to increase the vase life of fresh-cut flowers. This
expansive refrigerated space allows for no inter-
ruption in the cold chain, ensuring top quality
products to the customer. A receiving area of
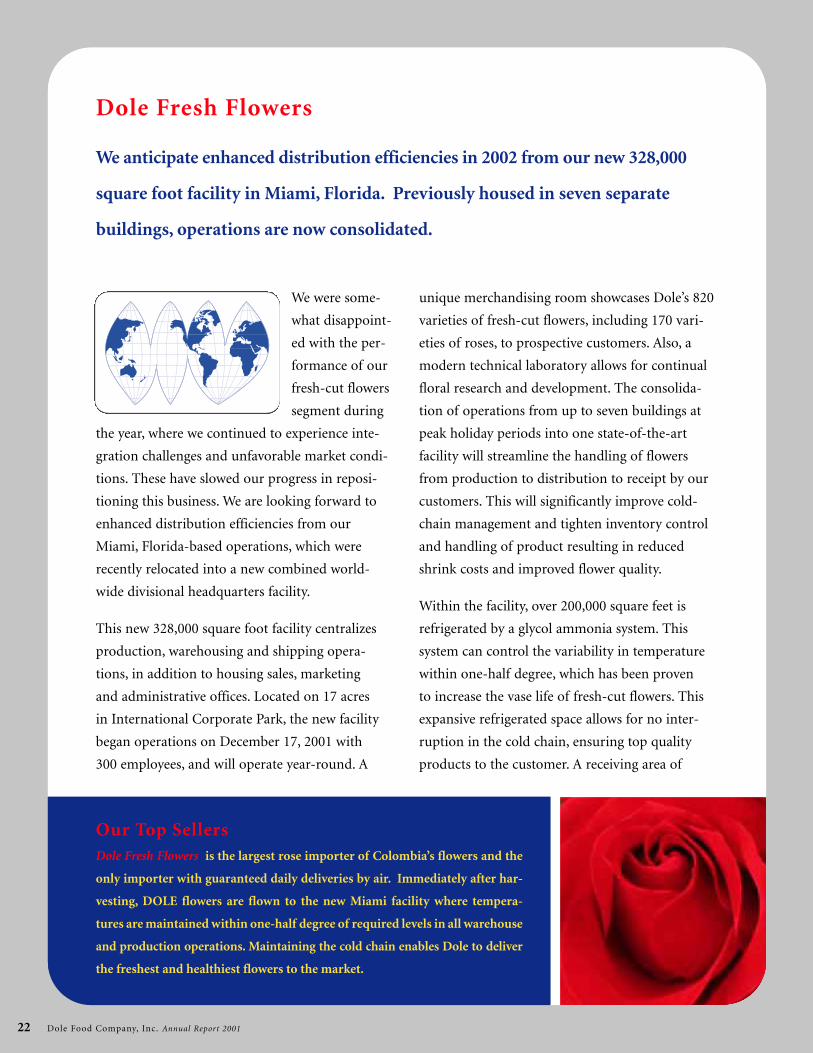
Dole Fresh Flowers
We anticipate enhanced distribution efficiencies in 2002 from our new 328,000
square foot facility in Miami, Florida. Previously housed in seven separate
buildings, operations are now consolidated.
Our Top SellersDole Fresh Flowers is the largest rose importer of Colombia’s flowers and the
only importer with guaranteed daily deliveries by air. Immediately after har-
vesting, DOLE flowers are flown to the new Miami facility where tempera-
tures are maintained within one-half degree of required levels in all warehouse
and production operations. Maintaining the cold chain enables Dole to deliver
the freshest and healthiest flowers to the market.

Dole Food Company, Inc. Annual Report 2001 23

Dole Food Company, Inc. Annual Report 2001 24
Miami Facility FactsMiami is the U.S. gateway for the floral industry, since the majority of flowers for
commercial use are grown in South America. Dole Fresh Flowers grows its product
on nearly 20 farms throughout Colombia, Ecuador and Mexico. Nearly three mil-
lion stems of flowers pass through Dole’s new Miami facility every day during the
holiday season.
Dole Food Company, Inc. Annual Report 2001 25
30,000 square feet ensures incoming product is
handled with speed. Over 37,000 square feet is
dedicated towards production and processing of
bouquets and arrangements. Additionally, 135,000
square feet of warehouse and shipping space
allows for the handling of large quantities of
simultaneous orders.
The sales and marketing offices are another highlight
of the building. A key feature of this area is four large
projection screens located at the front of a series of
tiered sales cubicles. The screens provide the work
environment with images of the division’s farms,
flowers and real-time sales volume and price infor-
mation. They are also utilized for training personnel
about new floral varieties.
While the flower industry is highly competitive in
nature, Dole continues to focus on those opera-
tional elements which differentiate it and thereby
offer it a sustainable competitive advantage. Oper-
ating the only chartered aircraft service from
South America enables Dole to maximize accurate
customer fulfillment. In addition, as the world’s
only ISO 14001 certified international grower,
Dole guarantees all flowers have been grown and
harvested using the most stringent environmental
standards. A continued focus on product and
packaging innovation is expected to strengthen
the company’s position in key segments such as
value-added bouquets and roses.
Dole Fresh Flowers is the largest producer of fresh
flowers in Latin American countries with over
ninety percent of production shipped into North
America. Additionally, its International Export
division ships product into the EU, Russia, Asia,
South America and the Caribbean. Producing qual-
ity products to meet the expectations of customers
around the world requires farming practices that
also make environmental sense. Contributing to
its efforts to reach sales and profit goals, Dole is
committed to making tremendous environmental
strides within the floral industry. The company has
implemented composting of organic wastes as well
as having developed significant new approaches to
conserving water and other natural resources. The
company minimizes the application of crop protec-
tion products by integrating cultural and biological
methods to controlling pest and plant disease into
its management systems.
We look forward to a turnaround in this business in
2002 through the expected gains in distribution effi-
ciency, the realization of an improved cost structure
from savings programs which have already been
implemented as well as from increased marketing
efforts focused on the division’s core competencies.
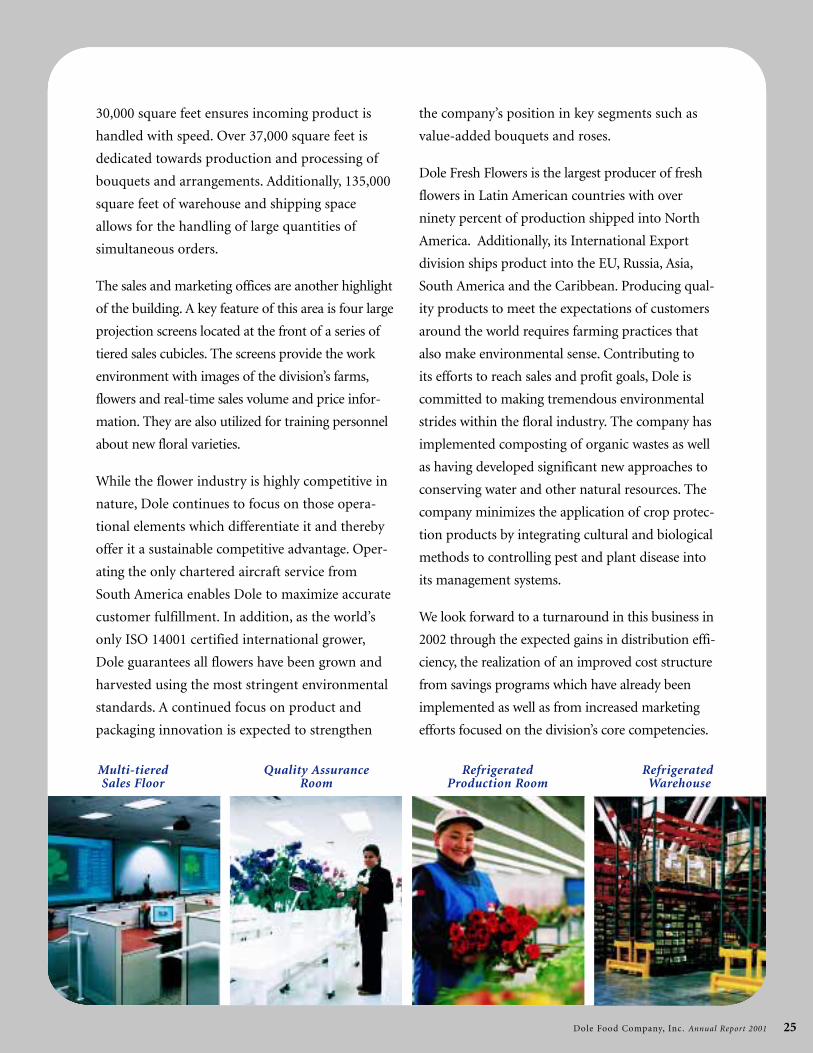
Multi-tiered Quality Assurance Refrigerated RefrigeratedSales Floor Room Production Room Warehouse
Dole Food Company, Inc. Annual Report 2001 26
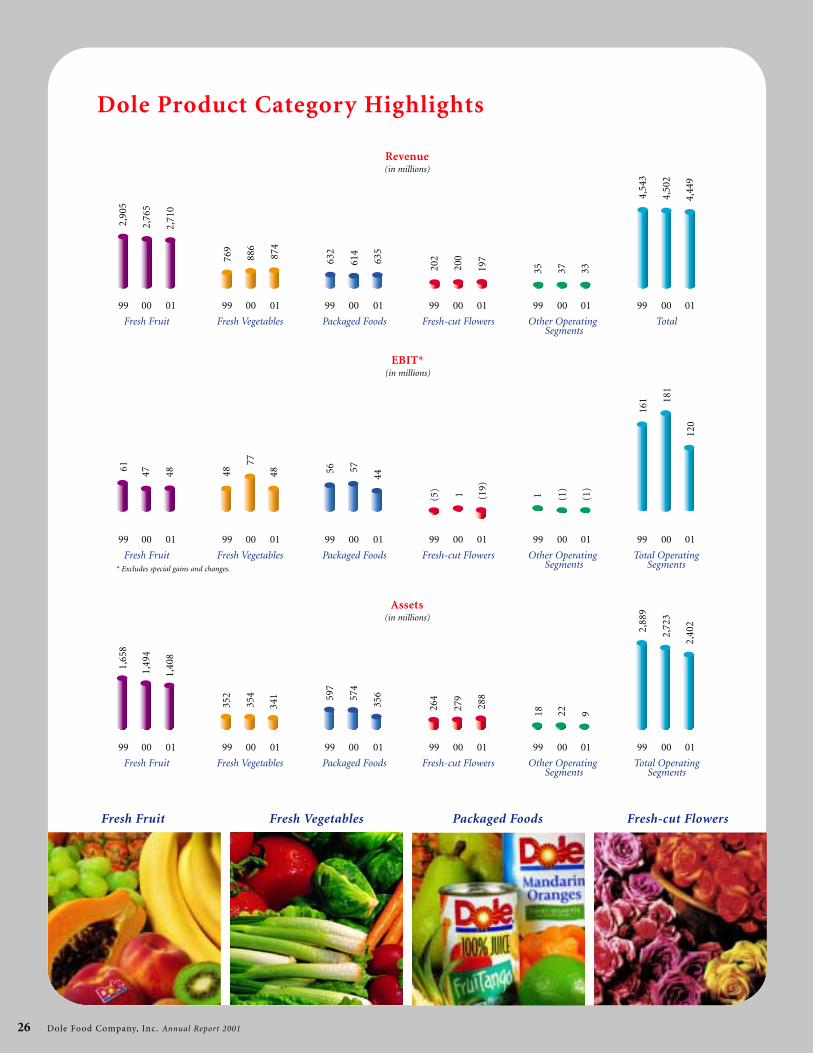
Fresh Fruit Fresh Vegetables Packaged Foods Fresh-cut Flowers
Other OperatingSegments
Total
99 00 01 99 00 01
Fresh Fruit
99 00 01
Fresh Vegetables
99 00 01
Packaged Foods
99 00 01
Fresh-cut Flowers
99 00 01
Other OperatingSegments
Total OperatingSegments
99 00 01 99 00 01
Fresh Fruit
99 00 01
Fresh Vegetables
99 00 01
Packaged Foods
99 00 01
Fresh-cut Flowers
99 00 01
Other OperatingSegments
Total OperatingSegments
99 00 01 99 00 01
Fresh Fruit
99 00 01
Fresh Vegetables
99 00 01
Packaged Foods
99 00 01
Fresh-cut Flowers
99 00 01
Dole Product Category Highlights2,
905
2,76
5
2,71
0
769
886
874
632
614
635
202
200
197
4,54
3
4,50
2
4,44
9
35 37 33
61 47 48 48
77
48 56 57
44
(5) 1 (19)
161 18
1
120
1,65
8
1,49
4
1,40
8
352
354
341 59
7
574
356
264
279
288
2,88
9
2,72
3
2,40
2
Revenue(in millions)
EBIT*(in millions)
Assets(in millions)
1 (1)
(1)
18 22 9
* Excludes special gains and changes.
Dole Food Company, Inc. Annual Report 2001 27
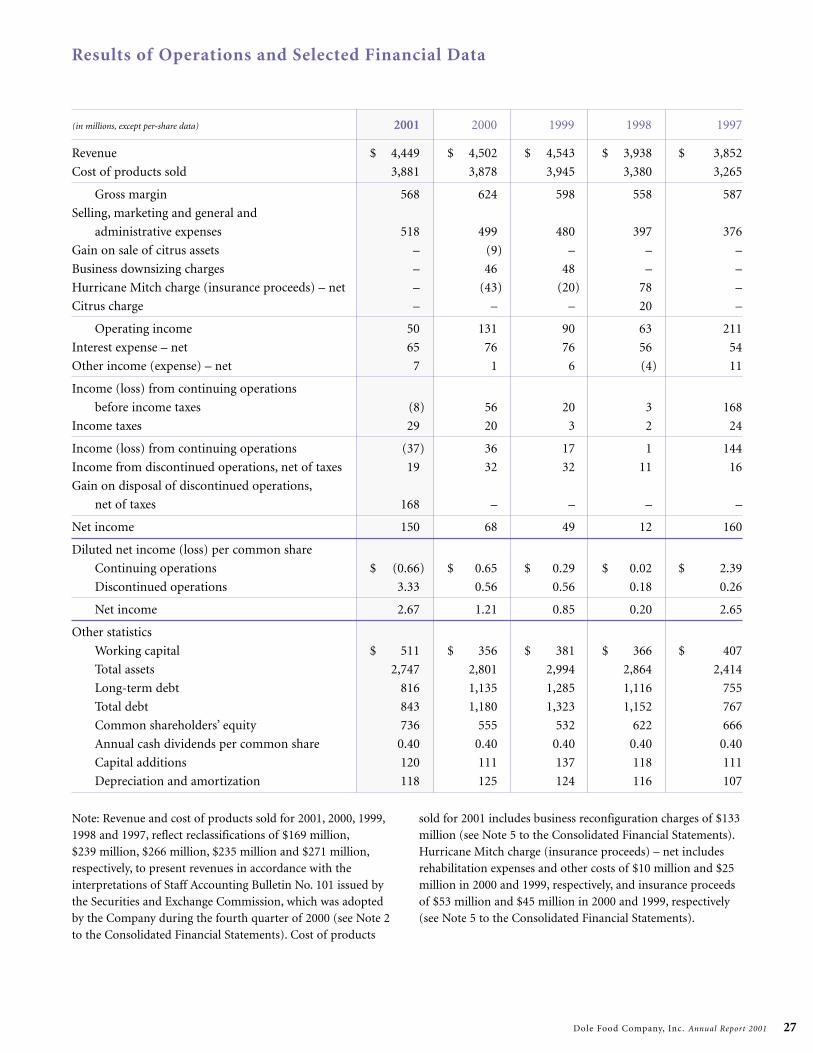
Results of Operations and Selected Financial Data
(in millions, except per-share data) 2001 2000 1999 1998 1997
Revenue $ 4,449 $ 4,502 $ 4,543 $ 3,938 $ 3,852
Cost of products sold 3,881 3,878 3,945 3,380 3,265
Gross margin 568 624 598 558 587
Selling, marketing and general and
administrative expenses 518 499 480 397 376
Gain on sale of citrus assets – (9) – – –
Business downsizing charges – 46 48 – –
Hurricane Mitch charge (insurance proceeds) – net – (43) (20) 78 –
Citrus charge – – – 20 –
Operating income 50 131 90 63 211
Interest expense – net 65 76 76 56 54
Other income (expense) – net 7 1 6 (4) 11
Income (loss) from continuing operations
before income taxes (8) 56 20 3 168
Income taxes 29 20 3 2 24
Income (loss) from continuing operations (37) 36 17 1 144
Income from discontinued operations, net of taxes 19 32 32 11 16
Gain on disposal of discontinued operations,
net of taxes 168 – – – –
Net income 150 68 49 12 160
Diluted net income (loss) per common share
Continuing operations $ (0.66) $ 0.65 $ 0.29 $ 0.02 $ 2.39
Discontinued operations 3.33 0.56 0.56 0.18 0.26
Net income 2.67 1.21 0.85 0.20 2.65
Other statistics
Working capital $ 511 $ 356 $ 381 $ 366 $ 407
Total assets 2,747 2,801 2,994 2,864 2,414
Long-term debt 816 1,135 1,285 1,116 755
Total debt 843 1,180 1,323 1,152 767
Common shareholders’ equity 736 555 532 622 666
Annual cash dividends per common share 0.40 0.40 0.40 0.40 0.40
Capital additions 120 111 137 118 111
Depreciation and amortization 118 125 124 116 107
Note: Revenue and cost of products sold for 2001, 2000, 1999,1998 and 1997, reflect reclassifications of $169 million,$239 million, $266 million, $235 million and $271 million,respectively, to present revenues in accordance with theinterpretations of Staff Accounting Bulletin No. 101 issued bythe Securities and Exchange Commission, which was adoptedby the Company during the fourth quarter of 2000 (see Note 2to the Consolidated Financial Statements). Cost of products
sold for 2001 includes business reconfiguration charges of $133million (see Note 5 to the Consolidated Financial Statements).Hurricane Mitch charge (insurance proceeds) – net includesrehabilitation expenses and other costs of $10 million and $25million in 2000 and 1999, respectively, and insurance proceedsof $53 million and $45 million in 2000 and 1999, respectively(see Note 5 to the Consolidated Financial Statements).
Dole Food Company, Inc. Annual Report 2001 28
Management’s Discussion and Analysis of Financial Condition and Results of Operations
Washington. Programs initiated during the third quarter of2001 constituted $105 million of these one-time expenses andincluded costs associated with the planned divestiture of theCompany’s Pascual Hermanos fresh vegetables business inSpain and certain other non-core businesses in Europe, as wellas the downsizing of banana and flower operations in LatinAmerica and banana production in the Philippines. A majorityof the costs associated with these programs consisted of assetimpairments necessary to write certain assets down to fairvalue, less costs to sell. Also included in the $133 million ofexpense, were $42 million of accrued costs for employee sever-ance, contract terminations and other costs associated withdivestiture, closure and other reconfiguration activities. A totalof 3,179 employees in the Company’s operations are being severed under these plans, of which 1,234 have been severed as of December 29, 2001. The Company anticipates the $133million of charges to result in approximately $42 million oftotal cash payments, of which $11 million were incurred in2001 with the remainder to be incurred primarily in 2002.The Company does not expect any further significant businessreconfiguration charges associated with these programs in the future.
While the most significant accomplishments relative to recon-figuration of its operations were made in 2001, the Companydid commence plans to reconfigure its operations in earlieryears. Due largely to continuing oversupply and other marketconditions primarily affecting the Company’s fresh fruit seg-ment, particularly its banana business, the Company imple-mented a plan during the latter part of 1999 to downsize certain of its global operations, and to initiate an early retire-ment program. In connection with its plan, the Companyrecorded a $48 million charge in the fourth quarter of 1999,which was reported on a separate line in the ConsolidatedStatements of Income. The $48 million charge included costs to reduce the Company’s productive capacity and distributioninfrastructure in its fresh fruit operations, primarily bananas.In Latin America, the Company ceased operations in Nicaraguaand Venezuela and terminated certain ship charters and growercontracts. In its European operations, the Company closed certain production and distribution sites and sales offices.In North America, the Company exited its citrus business inFlorida and its almond processing business in California.Costs to sever 1,483 employees were included in this plan, ofwhich all had been severed as of December 29, 2001. TheCompany’s early retirement program resulted in the termina-tion of 92 employees.
In the third quarter of 2000, the Company initiated a plan tocontinue the downsizing of its fresh fruit operations, includingthe complete shutdown of certain activities. In connectionwith its plan, the Company recorded a $46 million charge,which was reported on a separate line in the ConsolidatedStatements of Income. The $46 million charge included coststo further reduce the Company’s existing productive capacityin its banana operations in Latin America and Asia, as well ascosts to shutdown its melon and citrus farming activities in
Overview
During 2001, Dole Food Company, Inc. and its consolidatedsubsidiaries’ (“the Company”) results of operations and finan-cial condition were favorably impacted by the following factors:
• The implementation of Company-wide cost savings initiatives,
• The continued review of non-core and underperformingbusinesses and the initiation of plans for their divestiture,
• Improved conditions in the banana business.
These factors were partially offset by weak foreign currencyexchange rates, primarily the yen.
During the first quarter of 2001, the Company undertook anextensive cost savings initiative and engaged the BostonConsulting Group to assist in performing strategic and opera-tional reviews of its banana and fresh-cut flowers businessesand in implementing programs to enhance profitability andachieve consolidated savings from global strategic sourcing andlogistics. The Company completed this review in the fourthquarter of 2001 and expects these critical assessments to resultin cost savings and improved market focus, which shouldenhance profitability. The Company’s cost-cutting activitiesmainly included the elimination of shipping services, exitingmore costly fruit sourcing arrangements and the consolidationof selling and general and administrative functions.
The Company expects to realize $200 million of annualimprovements to operating results on a steady state basis by2003 as a result of these initiatives.
For 2001, the Company realized approximately $93 million of savings, before offsets, when compared to operating resultsfor 2000. Offsets included the impact of lower pricing forcommodity vegetables, reduced sales volumes for fresh-cutflowers, the effect of foreign currency exchange primarily fromthe yen, the absence of earnings from the Honduran beveragebusiness and consulting costs associated with the strategic andoperational reviews of the Company’s businesses. Of the $93million of savings, approximately $25 million was recognizedin pre-tax income, after offsets. For 2002, the Company expectsan additional $66 million in profit improvements, with ananticipated favorable impact of $30 million on pre-tax income.This amount, combined with $13 million of 2001 one-timeoffsets that will not be present in 2002, should result inapproximately $43 million of incremental improvement in pre-tax profit as a result of these programs. The remaining $41million of savings is expected to be realized in 2003.
The business reconfiguration programs resulted in the recog-nition of $133 million of one-time expenses for the year.Programs initiated during the second quarter of 2001 generated$28 million of these one-time expenses and included the shut-down and related asset sales of the Company’s Californiadeciduous and Pacific Northwest apples operations, includingpackinghouses, ranches and orchards in California and
Dole Food Company, Inc. Annual Report 2001 29
Honduras and the downsizing of its distribution network in Europe. In its Latin American banana operations, theCompany closed select production sites, severed some employeearrangements, terminated some contracts with independentgrowers and divested its controlling interest in a productionjoint venture in South America. In its Asian banana opera-tions, the Company exited production on select agriculturallands and terminated some employees and contracts withindependent growers. In its European operations, theCompany reduced its sales force and administrative staff, pri-marily in northern Europe. A total of 4,880 employees in theCompany’s operations are being severed under these plans,of which 4,871 have been severed as of December 29, 2001.
In November 2001, the Company disposed of its 97% of thecapital stock of a Honduran corporation principally engaged inthe beverage business in Honduras, Cerveceria Hondurena S.A.(“the Honduran beverage business”). The disposition wasaccomplished by means of a stock exchange transaction with asubsidiary of South African Breweries, plc. Subsequent to thestock exchange transaction, the Company received $537 millionof cash. The proceeds from the divestiture have been used pri-marily to pay down debt. The Honduran beverage businessresults have been reported as discontinued operations throughNovember 28, 2001, the date of the disposition.
In the latter part of 1999, the Company first began a review ofits non-core assets and under-performing businesses with theintention to sell or liquidate those that fell outside of theCompany’s future strategic direction or that did not meetinternal economic return criteria. This review led to the divestiture of certain businesses as follows:
In 2000, the Company sold the assets of its citrus operationslocated in California and Arizona for approximately $55 mil-lion. Production assets were transferred to the buyer in thethird quarter of 2000 for cash proceeds of $45 million, result-ing in a net gain of $8 million. The remaining $10 million ofproceeds were for secured grower contracts, approximately halfof which were transferred to the buyer in the fourth quarter of2000, resulting in a net gain of $1 million. The combined $9 million net gain has been reported on a separate line in theConsolidated Statements of Income. Title to the remaininggrower contracts was transferred at near book value in the first quarter of 2001.
The Company also sold its Florida citrus and California almondoperations in 2000 and is currently pursuing the sale of itsdeciduous fruit businesses located in North America. In total,these sales are expected to generate gross proceeds of approxi-mately $95 million.
Furthermore, the Company is pursuing the sale of its PascualHermanos fresh vegetables business in Spain and other non-core businesses in Europe. No final determination as to expect-ed proceeds has been made.
In 2001, the Company began to benefit from the downsizing ofits operations in prior years. The banana business improved
primarily as a result of the Company’s significant cost savingactivities, higher banana volumes and pricing in NorthAmerica, and favorable local pricing in Europe partially offsetby the decline in the euro against the U.S. dollar. Managementanticipates that the North American and European marketimprovements will stabilize in the near term.
The Company continued to be negatively impacted by unfavor-able declines in foreign currency exchange rates. In 2001,the yen continued to weaken against the U.S. dollar, decreasing13% on an average basis during the year compared to theaverage in 2000. The euro also steadily declined, stabilizing inthe latter part of the year compared to the average in 2000.The Company has significant Japanese sales denominated inyen as well as European sales denominated in euro or curren-cies with exchange rates pegged to the euro. Product andshipping costs associated with a portion of these sales are U.S. dollar-denominated. The decline in the yen and euro in2001 negatively impacted the Company’s revenues and earningsbefore interest and taxes (“EBIT”) by approximately $85million and $35 million, respectively.
European Union Quota: The European Union (“EU”) main-tains banana regulations that impose quotas and tariffs onbananas. In April 2001, the EU reached agreements with theUnited States and Ecuador to implement a tariff-only importsystem no later than January 1, 2006. In the interim periodbeginning July 1, 2001, European companies that operated andbought bananas and sold them into the EU market during theyears 1994-1996 are eligible for banana import licenses. TheCompany’s earnings have not been negatively impacted by thenew interim regime, and it believes the ongoing impact of thisregime will not be dilutive to its current earnings levels.
Financial Instruments: As of December 29, 2001, theCompany’s derivative instruments, both free-standing andembedded, as defined by Statement of Financial AccountingStandards No. 133 (“FAS 133”), “Accounting for DerivativeInstruments and Hedging Activities,” as amended by FASBStatement of Financial Accounting Standards No. 138,“Accounting for Certain Derivative Instruments and CertainHedging Activities – An amendment of FASB Statement No.133,” consisted of foreign currency exchange forwards andcertain minor warrants in privately held companies.
The Company entered into foreign currency exchange forwardcontracts to reduce its risk related to anticipated working capitalcollections and payments denominated in foreign currencies.These contracts are denominated in Japanese yen, Britishpounds, Swedish krona and the euro and are designated ashedges under FAS 133. The Company’s foreign currencyexchange forwards, in an aggregate outstanding notionalamount of $171 million, were designated and effective as hedgesof the changes in fair values of recorded assets or liabilities or offuture cash flows. The ineffective portion of changes in fair val-ues of hedge positions, which was included in operating incomefor 2001, was not material. Unrealized net gains related to cash
Dole Food Company, Inc. Annual Report 2001 30
flow hedges totaling $15 million were included as a componentof accumulated other comprehensive loss as of December 29,2001. Settlement of these contracts will occur in 2002.
The counterparties to the foreign currency exchange forwardcontracts consist of a number of major international financialinstitutions. The Company has established counterparty guide-lines and regularly monitors its positions and the financialstrength of these institutions. While counterparties to hedgingcontracts expose the Company to credit-related losses in theevent of a counterparty’s non-performance, the risk would belimited to the unrealized gains on such affected contracts. TheCompany does not anticipate any such losses.
In 2000, the Company received stock warrants in two privatelyheld companies through which the Company sells a portion ofits products. The Company can, at its option, purchase twomillion shares upon public registration of the two privatelyheld companies at a weighted-average price of $5.75 per share.The Company estimated that the fair value of these warrantswas not significant as of December 29, 2001.
In the normal course of business, the Company entered intovarious commodity purchase and sale contracts. These con-tracts qualify as a normal purchase and sale under FAS 133 and are excluded from mark-to-market accounting.
In 1998, the Company had contracted to purchase Germanmarks primarily at fixed exchange rates to facilitate paymentfor the purchase of two German-made refrigerated containervessels. In the fourth quarter of 1999, in conjunction with thetermination of the Company’s purchase obligation, it enteredinto an operating lease for the vessels. In the fourth quarter of 1999, these currency exchange contracts were terminatedresulting in a pre-tax charge to operating income of approxi-mately $2 million.
Foreign Currencies: The Company distributes its products inmore than 90 countries throughout the world. Its internationalsales are usually transacted in U.S. dollars and major Europeanand Asian currencies. Certain costs are incurred in currenciesdifferent from those received from the sale of products. Resultsof operations may be affected by fluctuations in currencyexchange rates in both sourcing and selling locations. However,prior to 2001, the Company has, with minor exceptions, nothedged these exposures.
During 2001, the yen as well as the euro and related Europeancurrencies continued to weaken against the U.S. dollar.Subsequent to year-end, the euro and related European curren-cies have stabilized somewhat against the U.S. dollar, while theyen has continued to weaken significantly. As of March 1, 2002,the spot exchange rate between the yen and the U.S. dollar hadfallen 10% versus the average exchange rate in effect during2001. The Company has approximately $500 million of annualsales denominated in yen. Additionally, in 2001, the Companyincurred $14 million of foreign currency translation losses,which were recognized as a component of accumulated other
comprehensive loss in shareholders’ equity and included in thecalculation of comprehensive income. The Company currentlyestimates that a 1% change in value of the yen-to-U.S. dollarand the euro-to-U.S. dollar exchange rates would each impactEBIT by approximately $2 million. The ultimate impact offuture changes to these and other currency exchange rates on2002 revenues, operating income, net income, equity and com-prehensive income is not determinable at this time.
Euro Conversion: On January 1, 2002, twelve participatingmembers of the EU converted to the euro as their commonlegal currency. Aside from certain minor conversion efforts in2001, the Company has not experienced any significant impactsupon conversion. The Company also does not anticipate anysignificant impacts due to price transparency or other long-term competitive implications.
Related Party Transactions: The Company’s policy permits it tohave arms-length transactions with related parties.
David H. Murdock, the Company’s Chairman and ChiefExecutive Officer, owns Castle & Cooke, Inc. (“Castle”), a realestate and resorts business, as well as a transportation equip-ment leasing company, a private dining club and a privatecountry club, which supply products and provide services tonumerous customers and patrons. During fiscal 2001, 2000 and 1999, the Company paid Mr. Murdock’s companies anaggregate of approximately $2 million in each year.
In 1995, Castle issued to the Company a promissory note in the principal amount of $10 million, which was repaid inDecember 2000. The $10 million note bore interest at the rate of 7% per annum, payable quarterly. Castle incurred and paid $0.7 million of interest expense in both 2000 and1999 pursuant to the terms of the $10 million note.
The Company and Castle each hold a 50 percent interest in anairplane, which was formerly owned solely by the Company.Under a co-ownership agreement, the Company and Castleagreed that each party would be responsible for the direct costsassociated with its use of the airplane, and that all indirect costswould be equally shared.
At December 29, 2001, the Company was under contractualobligation for the delivery of a replacement aircraft. TheCompany’s share of the total aircraft cost of approximately $45 million is $30 million. The remaining cost of the aircraft is an obligation of Castle.
Critical Accounting Policies and Estimates
The preparation of the Consolidated Financial Statementsrequires management to make estimates and assumptions thataffect reported amounts. The estimates and assumptions areevaluated on an on-going basis and are based on historicalexperience and on other factors that management believes arereasonable. Estimates and assumptions include, but are notlimited to, the areas of customer and grower receivables, inven-tories, assets held for sale, useful lives of property, plant and
Dole Food Company, Inc. Annual Report 2001 31
equipment, intangible assets, marketing programs, incometaxes, self-insurance reserves, retirement benefits, and commit-ments and contingencies.
The Company believes that the following represent the areaswhere more critical estimates and assumptions are used in thepreparation of the Consolidated Financial Statements:
Grower advances: The Company advances funds to third partygrowers primarily in Latin America and Asia for various farm-ing needs. Some of these advances are secured with propertyor other collateral owned by the growers. The Companyrecords an allowance for these grower receivables based on estimates of the growers’ ability to repay advances and the fairvalue of the collateral. The Company monitors these receivableson a regular basis. If the financial condition of the growers orthe fair value of the collateral were to deteriorate, additionalallowances may be required.
Long-lived asset impairments: The Company records impair-ment charges when the carrying amounts of long-lived assetsare determined not to be recoverable. Impairment is assessedand measured by comparing the carrying value of an asset toits fair value. Fair value is typically determined using an esti-mate of future cash flows expected to result from the use ofthe asset and its eventual disposition. Changes in commoditypricing, weather-related phenomena and other market condi-tions are events that have historically caused the Company toassess the carrying amount of its long-lived assets.
Marketing programs: The Company offers promotions such as coupons and other incentives to customers in the normalcourse of business. These promotional costs are accrued basedon management’s best estimate of the redemption rates ofthese incentives. Management is able to make a reasonable esti-mate of actual redemption rates based on historical experience.Should actual redemption rates exceed amounts estimated,additional accruals may be required.
New Accounting Pronouncements:
In 2001, the Company adopted Financial Accounting StandardsBoard (“FASB”) Statement of Financial Accounting StandardsNo. 133 (“FAS 133”), “Accounting for Derivative Instrumentsand Hedging Activities,” as amended by FASB Statement ofFinancial Accounting Standards No. 138, “Accounting forCertain Derivative Instruments and Certain Hedging Activities– An amendment of FASB Statement No. 133.” FAS 133requires that all derivative instruments (including certainderivative instruments embedded in other contracts) be report-ed at fair value with changes in fair value recognized in earn-ings or other comprehensive income. Recognition depends onwhether the derivative is designated and effective as part of ahedge transaction and on the type of hedge transaction (fairvalue or cash flow). Gains or losses on derivative instrumentsrecorded in other comprehensive income must be reclassifiedto income during the period in which earnings are affected by the underlying hedged item. The ineffective portion of all
hedges impacts earnings in the current period. As of December29, 2001, the Company’s derivative instruments, both free-standing and embedded, as defined by FAS 133, consisted offoreign currency exchange forwards and certain minor warrantsin privately held companies.
In May 2000, the Emerging Issues Task Force (“EITF”) of theFASB reached a consensus on Issue No. 00-14 (“EITF 00-14”),“Accounting for Certain Sales Incentives,” which requires thecosts of certain sales incentives, such as coupons, to be classifiedas a reduction of revenue rather than as marketing expense. InApril 2001, the EITF reached a consensus on Issue No. 00-25(“EITF 00-25”), “Accounting for Consideration from a Vendorto a Retailer in Connection with the Purchase or Promotion ofthe Vendor’s Products,” which requires the costs of certain ven-dor consideration, such as slotting fees and off-invoice arrange-ments, to be classified as a reduction of revenue rather than asmarketing expense. As required, the Company anticipatesadopting the provisions of EITF 00-14 and EITF 00-25 duringthe first quarter of 2002. The Company does not anticipate anychanges to the timing of cost recognition upon adoption ofeither EITF 00-14 or EITF 00-25. Therefore, the Companyexpects the impact of such adoption will be limited to reclassi-fications of costs previously included in selling, marketing andgeneral and administrative expenses, as a reduction of revenue.These reclassifications will have no impact on the Company’soperating income or net income either prospectively or as currently or previously reported.
In June 2001, the FASB adopted Statements of FinancialAccounting Standards No. 141 (“FAS 141”), “BusinessCombinations” and No. 142 (“FAS 142”), “Goodwill and OtherIntangible Assets.” These statements eliminate the pooling ofinterest method of accounting for business combinations as ofJune 30, 2001 and eliminate the amortization of goodwill forall fiscal years beginning after December 15, 2001. Goodwillwill be accounted for under an impairment-only method afterthis date. The Company has adopted FAS 141 and FAS 142 withrespect to new goodwill as of July 1, 2001 and is adopting FAS142 with respect to existing goodwill as of December 30, 2001,the first day of its 2002 fiscal year. The adoption of FAS 141 hasnot impacted the Company’s financial condition or results ofoperations. In accordance with FAS 142, existing goodwill wasamortized through fiscal 2001. Upon adoption of FAS 142,amortization will cease and the Company will perform a tran-sitional goodwill impairment test. The Company is currentlyassessing the impact of adopting FAS 142 with respect to exist-ing goodwill. At December 29, 2001, goodwill, net of accumu-lated amortization, of $133 million, $3 million and $120 mil-lion is associated with the fresh fruit, packaged foods and fresh-cut flowers segments, respectively. Goodwill amortizationexpense for 2001, 2000 and 1999 was $11 million, $12 millionand $14 million, respectively.
In August 2001, the FASB adopted Statement of FinancialAccounting Standards No. 144 (“FAS 144”), “Accounting forthe Impairment or Disposal of Long-Lived Assets.” This state-
Dole Food Company, Inc. Annual Report 2001 32
ment supersedes FASB Statement No. 121, “Accounting for theImpairment of Long-Lived Assets and for Long-Lived Assets to Be Disposed Of” and amends other guidance related to theaccounting and reporting of long-lived assets. The Company isadopting FAS 144 as of December 30, 2001, the first day of its2002 fiscal year. The Company is currently assessing the impactof adopting FAS 144 but does not believe such impact, if any,will be material to the Company’s financial condition or resultsof operations.
2001 Compared with 2000
Fresh Fruit: Fresh fruit revenues decreased 2% to $2.7 billionin 2001 from $2.8 billion in 2000. The decreases were primarilydue to the divestiture of certain businesses, the impact ofweaker foreign currency exchange rates and the planned reduc-tion of banana volumes to secondary markets in Europe. In thethird quarter of 2000, the Company sold assets comprising itsCalifornia and Arizona citrus business, and in the second quar-ter of 2001, the Company initiated the divestiture of assetscomprising its California deciduous and Pacific Northwestapples business. These divestitures accounted for approximately$120 million of the decrease in revenues in 2001 versus 2000.The impact of the weaker euro-to-U.S. dollar and yen-to-U.S.dollar exchange rates unfavorably impacted the Company’s yearover year total revenue (primarily in the fresh fruit segment) byapproximately $85 million as compared to 2000. These revenuedecreases were offset by higher banana volumes and pricing inNorth America and improved pricing in Europe. In addition,increased volumes and pricing in the Chilean fruit export business and higher volumes and stronger pricing for theCompany’s Dole Premium Select™ pineapple favorably impacted 2001 revenues.
EBIT in the fresh fruit segment increased 2% to $48 million in 2001 from $47 million in 2000. Fresh fruit EBIT increaseddue to fruit, shipping and selling and general and administra-tive cost savings as a result of cost-cutting initiatives. In addi-tion, EBIT improved due to increased volumes and pricing in the North America banana business, higher pricing in theEuropean banana business and higher volumes and strongpricing for the Company’s Dole Premium Select™ pineapple.These improvements were partially offset by weaker yen-to-U.S. dollar and euro-to-U.S. dollar exchange rates in 2001 ver-sus 2000. The weaker foreign currency exchange rates impactedthe Company’s year-over-year total EBIT, primarily in the freshfruit segment, by approximately $35 million as compared to2000. Furthermore, fresh fruit EBIT was unfavorably impacteddue to losses in the California deciduous and Northwest applesbusinesses, which the Company is exiting. Additionally, freshfruit EBIT in 2001 included $74 million of one-time expenseassociated with business reconfiguration programs initiatedduring the second and third quarters of 2001 as well as $5 mil-lion of one-time expense in the first quarter related to thedivestiture of the Company’s controlling interest in a bananaproduction joint venture in South America.
Fresh Vegetables: Fresh vegetables revenues decreased slightlyto $874 million in 2001 from $886 million in 2000. Thedecrease is due to price normalization in the Company’s com-modity vegetables business in 2001 from heightened pricinglevels in 2000. This decrease was offset by continued growth inthe Company’s North America fresh-cut salads business wherevolumes increased consistent with the product category.
EBIT in the fresh vegetables segment decreased 38% to $48 mil-lion in 2001 from $77 million in 2000. Fresh vegetables EBITdecreased due to $34 million of one-time expense associatedwith the Company’s reconfiguration program initiated duringthe third quarter of 2001 primarily to divest Pascual Hermanos,its fresh vegetables subsidiary located in Spain. EBIT improve-ment related to volume growth in the Company’s fresh-cut sal-ads business was offset by higher marketing expense in thatbusiness and the EBIT impact of price normalization in theCompany’s commodity vegetables business. The segment alsobenefited significantly from cost savings initiatives.
Packaged Foods: Packaged foods revenues increased 3% to$635 million in 2001 from $614 million in 2000. Revenuesincreased due to the launch of FRUIT-N-GEL BOWLS™ in2001 and the continued success of the Company’s FRUITBOWLS® products that were introduced in 2000. This increasewas partially offset by the Company’s sale of its Californiaalmond processing business in the third quarter of 2000,which had revenues of $23 million in 2000.
EBIT in the packaged foods segment decreased 23% to $44million in 2001 from $57 million in 2000. Packaged foods EBITdecreased due to $17 million of one-time expense associatedwith the Company’s reconfiguration programs initiated duringthe second and third quarters of 2001. The second quarterincluded $2 million related to one-time contract terminations.The third quarter included $15 million of one-time expenseassociated with the planned divestiture of a packaged foodsbusiness located in Europe. Higher earnings due to the growth of the Company’s FRUIT BOWLS® products combined withreduced sourcing costs were partially offset by marketingexpenses associated with the launch of the Company’s FRUIT-N-GEL BOWLS™.
Fresh-cut Flowers: Fresh-cut flowers revenues decreased 2% to $196 million in 2001 from $201 million in 2000. Revenuesdecreased due to unfavorable market conditions, primarily inthe Company’s wholesale business in the second half of 2001.This decrease was partially offset by higher Valentine’s Day and Mother’s Day sales in the first half of 2001.
EBIT in the fresh-cut flowers segment decreased to a loss of$19 million in 2001 from slightly above breakeven in 2000.Fresh-cut flowers EBIT includes $7 million of one-timeexpense associated with the Company’s reconfiguration pro-grams initiated during the third quarter of 2001 to reduceflower production operations in Latin America. Additionally, inthe third quarter of 2001, the Company recognized $3 millionof lease termination expense in connection with its move to a
Dole Food Company, Inc. Annual Report 2001 33
new consolidated distribution facility in Miami, Florida. Lossesin the second half of the year due to the per-unit margin impactsassociated with lower sales volume were partially offset byhigher earnings in the first half of 2001 due to higherValentine’s Day and Mother’s Day sales.
Other Income (Expense), Net: Other income generally consistsof minority interest expense and certain non-operating items.Other income in 2001 includes a non-operating gain of$8 million related to the sale of available-for-sale securities.This amount was reflected in corporate and other EBIT for segment disclosure purposes.
Interest Expense, Net: Interest expense, net of interest income,decreased to $65 million in 2001 from $76 million in 2000 dueto lower outstanding debt levels combined with lower interestrates throughout the year. The year 2000 also includes theinterest portion of a tax refund received from the InternalRevenue Service (“IRS”).
Income Taxes: In 2001, the Company recognized income taxexpense of $29 million on a pre-tax loss of $8 million mainlyresulting from $105 million of one-time reconfigurationexpenses recognized during the third quarter, of which $101million related to foreign tax jurisdictions for which theCompany has not provided future tax benefits. Future taxbenefits, if any, will be recognized upon realization. Consistentwith 2001, the Company currently anticipates its effective tax rate to be 32% in the near term, based on its expectedearnings mix.
2000 Compared with 1999
Fresh Fruit: Fresh fruit revenues decreased 5% to $2.8 billionin 2000 from $2.9 billion in 1999. The euro’s decline against the U.S. dollar since the comparable period of 1999 negativelyimpacted U.S. dollar equivalent revenues in the European mar-ket. Lower volumes sold in the European banana business dueto reduced sales to secondary markets in eastern Europe, as aresult of the Company’s planned exit from unprofitable mar-kets, also contributed to this decrease. This decrease in freshfruit revenues was partially offset by higher revenues in NorthAmerica and Asia as a result of increased volumes of bananasand pineapples sold in those markets.
EBIT in the fresh fruit segment decreased 22% to $47 millionin 2000 from $61 million in 1999. Fresh fruit EBIT declinedprimarily due to the impact of the euro’s decline against theU.S. dollar combined with the dramatic rise in fuel rates ascompared to 1999. In addition, marketing and selling expensesincreased in the Asian banana business in response to oversup-ply conditions in that market. Partially offsetting these decreas-es in EBIT were the positive impacts of cost-cutting activities in the Company’s Latin American-sourced banana business,lower volumes shipped to secondary (unprofitable) markets inEurope, higher banana volumes in North America and changesto recovery estimates of certain tax credits receivable due toincreased utilization. In addition, the Company’s California
citrus business, which was sold in the third quarter of 2000,contributed to improved fresh fruit EBIT, as that businessrecovered from the impacts in 1999 of a crop freeze at the endof 1998. In 1999, earnings in the North American-sourced freshfruit business were negatively impacted by one-time consolida-tion costs of $6 million.
Fresh Vegetables: Fresh vegetables revenues increased 15% to$886 million in 2000 from $769 million in 1999. Revenuesincreased in the Company’s North American fresh-cut saladsbusiness due to continued category and market share growthduring 2000. In addition, revenues increased in the Company’sNorth American commodity vegetables business due to overallstrong pricing, primarily in the second, third and fourth quar-ters, as a result of lower market supply.
EBIT in the fresh vegetables segment increased 60% to $77 million in 2000 from $48 million in 1999. This increase wasprimarily due to continued growth in the North Americanfresh-cut salads business and strong pricing in the NorthAmerican commodity vegetables business.
Packaged Foods: Packaged foods revenues decreased 3% to$614 million in 2000 from $632 million in 1999. Revenuesdecreased primarily due to the closure and sale of the Company’sCalifornia almond business and related processing plant locatedin Orland, California in the third quarter of 2000. This decreasewas partially offset by increased revenues in the Company’sprocessed pineapple business, as the continued success of itsnew FRUIT BOWLS® and FUN SHAPES® products in NorthAmerica compensated for lower pricing in traditional productssold in both North America and Asia.
EBIT in the packaged foods segment increased to $57 millionin 2000 from $56 million in 1999. Packaged foods EBITincreased largely due to the Company exiting its Californiaalmond business, which had incurred losses in 1999 due topoor market conditions. In the Company’s processed pineapplebusiness, higher earnings from new products were largely offsetby associated higher marketing and selling costs and by weakerpricing in traditional products.
Fresh-cut Flowers: Fresh-cut flowers revenues were relativelyunchanged at $201 million in 2000 as compared to $202 mil-lion in 1999. Lower pricing and volumes to wholesale cus-tomers offset improved demand from supermarket customers.
EBIT in the fresh-cut flowers segment improved to slightlyabove breakeven in 2000 from a loss of $5 million in 1999.Lower production costs were offset by higher shipping and airfreight rates, primarily driven by increased fuel prices.
Other Income (Expense), Net: Other income generally consistsof minority interest expense, certain gains and losses on thesales of property and non-operating items. In 1999, otherincome included a reduction of certain self-insurance loss estimates. This adjustment was reflected in corporate and otherEBIT for segment disclosure purposes.

Contractual Obligations and Commercial Commitments
The following tables summarize the Company’s contractual obligations and commitments at December 29, 2001:
Payments Due by Period
(in thousands) Total Less than 1 year 1-3 years 4-5 years After 5 years
Contractual ObligationsLong-term debt 1 $ 800,516 $ 7,392 $ 315,016 $ 301,823 $ 176,285Capital lease obligations 2 25,400 2,400 23,000 – –Operating leases 3 551,038 105,898 264,484 51,725 128,931Unconditional purchase obligations 3 151,393 151,393 – – –
Total contractual cash obligations $ 1,528,347 $ 267,083 $ 602,500 $ 353,548 $ 305,216
Amount of Commitment Expiration Per Period
Total Amounts (in thousands) Committed Less than 1 year 1-3 years 4-5 years Over 5 years
Commercial CommitmentsGuarantees4 $ 53,000 $ 31,000 $ 20,000 $ 1,000 $ 1,000
Total commercial commitments $ 53,000 $ 31,000 $ 20,000 $ 1,000 $ 1,000
1 See Note 8 to the Consolidated Financial Statements2 See Notes 7 and 8 to the Consolidated Financial Statements3 See Note 13 to the Consolidated Financial Statements4 See Note 12 to the Consolidated Financial Statements
Dole Food Company, Inc. Annual Report 2001 34
Interest Expense, Net: Interest expense, net of interest income,was $76 million in both 2000 and 1999. Interest expense washigher due to higher average debt levels in the first part of2000. This increase in interest expense was offset by an increasein interest income due to the interest portion of a tax refundreceived from the IRS in the third quarter of 2000.
Income Taxes: In 2000, the Company’s continuing operationseffective tax rate increased to 35% from 18% in 1999. Theincrease was primarily due to the tax impacts of its Hurricane
Mitch insurance proceeds, business downsizing charge and gainon the sale of citrus assets combined with changes in theCompany’s earnings mix.
In addition, the impact of discontinued operations contributedto a decrease in the effective tax rate for continuing operationsin 1999 and an increase in the effective tax rate for continuingoperations in 2000.
Income tax expense was partially offset by the principal portionof a tax refund in 2000.
The Company’s contractual obligations and commercial com-mitments are discussed in the Liquidity and Capital Resourcessection below and in the footnotes to the ConsolidatedFinancial Statements.
Liquidity and Capital Resources
Operating activities from continuing operations generated cash flow of $242 million in 2001 compared to $117 million in2000. The increase was primarily a result of higher operatingearnings and improved cash flows due to enhanced workingcapital management. In 2000, the Company collected on a $10million note receivable from Castle. Also in 2000, accountspayable and accrued liabilities declined as a result of higher lev-els of payments to growers and suppliers.
During the first quarter of 2001, the Company invested incertain available-for-sale securities with an aggregate cost of$26 million. These securities were sold in the second quarter of 2001 for $34 million, resulting in an $8 million non-operating gain.
Proceeds from the sale of assets of $35 million in 2001 primari-ly included sales in the Company’s California deciduous andPacific Northwest apples operations.
Capital expenditures from continuing operations for the acqui-sition and improvement of productive assets increased to $120million in 2001 from $111 million in 2000 and were funded bya combination of operating cash flow and new borrowings thathave been repaid as of December 29, 2001. Capital spendingfrom continuing operations in 2000 included approximately$11 million related to the replacement or capitalizable repair of agricultural infrastructure and other property damaged ordestroyed by Hurricane Mitch in the fourth quarter of 1998.The Company expects operating capital expenditures in 2002to be below 2001 levels before a one-time expenditure to reac-quire eight vessels.
The Company has operating lease agreements, mainly for ves-sels, containers, and office facilities with initial lease termsexpiring between 2002 and 2005. The leased assets are used inthe Company’s operations where leasing offers advantages ofoperating flexibility and is less expensive than alternate typesof funding. Payments on these leases are based on variableinterest rates, primarily the London Interbank Offered Rate(“LIBOR”). The Company currently estimates that a 100 basispoint change in LIBOR would impact its pre-tax income byapproximately $3 million. Lease payments are charged to opera-tions, primarily through cost of sales. The Company estimatesthe present value of the remaining lease payments associated
Dole Food Company, Inc. Annual Report 2001 35
with these leases is $199 million at December 29, 2001. TheCompany has purchase options associated with these leases atvarious dates from 2002 to 2005. The Company has providedresidual value guarantees for the assets under lease totaling$85 million. These obligations are not recorded as liabilities on the Company’s Consolidated Balance Sheets. If they wererecorded, the related leased properties would also be includedon the balance sheets as assets.
In March 2001, the Company elected to reacquire eight vesselsat the conclusion of their lease terms in March 2002 for $121million. This purchase will be funded by existing cash balances.
The Company renewed the provisions of certain containerleases in November 2001. As a result of these renewals, theCompany had containers under capital lease for $25 million at December 29, 2001. These leases have annual renewaloptions through March 2004.
At December 29, 2001, the Company was under contractualobligation for the delivery of a replacement aircraft. TheCompany’s share of the total aircraft cost of approximately $45 million is $30 million. The remaining cost of the aircraft is an obligation of Castle.
At the end of 2000, the Company’s net debt (total debt lesscash) totaled $1.2 billion. During 2001, net debt decreasedsignificantly, down approximately $670 million, to $482 million due to improved operating cash flows, enhancedworking capital management and proceeds from asset sales,primarily the Honduran beverage business. Shareholders’equity increased as a result of improved operating earnings,unrealized cash flow hedge gains, the gain on sale of theHonduran beverage business and related reclassification oftranslation losses partially offset by reconfiguration charges,increased additional minimum pension liability, dividendspaid and foreign exchange translation losses. As a result oflower net debt combined with higher shareholders’ equity,the Company’s net debt to net debt and equity percentageimproved significantly to 40% at the end of 2001 from 68% at the end of 2000. Management anticipates, as in prior years,net debt levels will increase during the first quarter of 2002 to fund seasonal working capital requirements and that thistrend will begin to reverse during the second quarter of 2002.
The Company has in place a $400 million, five-year revolvingcredit facility (“Long-term Facility”) which matures in 2003.At the Company’s option, borrowings under the Long-termFacility bear interest at certain percentages over the agent’s primerate or LIBOR. Provisions under the Long-term Facility requirethe Company to comply with certain financial covenants whichinclude a maximum permitted ratio of consolidated debt to networth and a minimum required fixed charge coverage ratio. As ofDecember 29, 2001, the Company was in compliance with thesecovenants. The Company may also borrow under uncommittedlines of credit at rates offered from time to time by various banksthat may not be lenders under the Long-term Facility. There wereno outstanding borrowings under the Long-term Facility oruncommitted lines of credit as of December 29, 2001.
In July 2000, the Company entered into a $250 million, 364-day revolving facility (“364-day Facility”). At the Company’soption, borrowings under the 364-day Facility bear interest atcertain percentages over the agent’s prime rate, LIBOR or theFederal Funds rate. In August 2001, the Company renewed its364-day Facility, reducing it from $250 million to $200 million.There were no outstanding borrowings under this facility as ofDecember 29, 2001.
In July 2000, the Company repaid its $225 million, 6.75%notes, which matured on July 15, 2000. As of January 1, 2000,these notes had been classified as long-term due to theCompany’s ability and intent as of that date to refinance thematurity using a long-term instrument. The Company financed$40 million of this maturity under its 364-day Facility, whichwas subsequently repaid. The remaining $185 million wasfinanced under the Company’s Long-term Facility which wasalso subsequently repaid.
As of December 29, 2001, the Company was guarantor of$53 million of indebtedness of certain key fruit suppliers andother entities integral to the Company’s operations under linesof credit generally secured by productive assets.
During 1999, the Company repurchased 3.5 million of its common shares for $92 million. These share repurchases werefunded by debt. No shares were repurchased in 2000 or 2001.Approximately 3.3 million shares remain authorized for repur-chase under the Company’s stock repurchase program.
The Company paid four regular quarterly dividends of 10 centsper share on its common stock totaling $22 million in 2001.In December 2001, the Company’s Board of Directors approveda 50% increase in the quarterly dividend to 15 cents per share,effective the first quarter of 2002.
The Company believes that its cash flow from operations aswell as its existing cash balances, revolving credit facilities andaccess to capital markets will enable it to meet its working capi-tal, capital expenditure, debt maturity, dividend payment andother funding requirements.
Market Risk
As a result of its global operating and financing activities, theCompany is exposed to certain market risks including changesin commodity pricing, fluctuations in interest rates and fluc-tuations in foreign currency exchange rates in both sourcingand selling locations. Commodity pricing exposures include the potential impacts of weather phenomena and their effecton industry volumes, prices, product quality and costs. TheCompany manages its exposure to commodity price risk pri-marily through its regular operating activities. The use of deriv-ative financial instruments has been limited to certain foreigncurrency forward contracts related to specific sales and firmpurchase commitments. The Company has not utilized finan-cial instruments for trading or other speculative purposes.
Dole Food Company, Inc. Annual Report 2001 36
Interest Rate Risk: As a result of its normal borrowing andleasing activities, the Company’s operating results are exposedto fluctuations in interest rates, which the Company managesprimarily through its regular financing activities. The Companygenerally maintains limited investments in cash equivalents andhas occasionally invested in marketable securities or debtinstruments with original maturities greater than 90 days.
The Company has short-term and long-term debt with bothfixed and variable interest rates. Short-term debt is primarilycomprised of unsecured notes payable to banks and bank lines of credit used to finance working capital requirements.In July 2000, the Company entered into a $250 million, 364-day revolving facility to provide the Company with additional liquidity to meet its short-term financing needs. At theCompany’s option, borrowings under the 364-day Facility bear interest at certain percentages over the agent’s prime rate, LIBOR or the Federal Funds rate. In August 2001, theCompany renewed its 364-day Facility, reducing it from $250 million to $200 million. There were no outstanding borrowings under this facility as of December 29, 2001.
Long-term debt represents publicly-held unsecured notes anddebentures, as well as certain notes payable to banks and uncom-mitted lines of credit, used to finance long-term investmentssuch as business acquisitions. In addition, the Company main-tains a $400 million, five-year revolving credit facility, whichmatures in 2003 and bears interest, at the Company’s option, atpercentages over the agent’s prime rate or LIBOR. There were nooutstanding borrowings under this facility as of December 29,2001. Generally, the Company’s short-term debt is at variableinterest rates, while its long-term debt is at fixed interest rates,except for borrowings under certain uncommitted lines of credit,which are at variable rates.
As of December 29, 2001, the Company had $789 million offixed-rate debt with a weighted-average interest rate of 7.05%and a fair value of $773 million. As of December 30, 2000, theCompany had $808 million of fixed-rate debt with a weighted-average interest rate of 7.06% and a fair value of $728 million.The Company currently estimates that a 100 basis point changein prevailing market interest rates would impact the fair valueof its fixed-rate debt by approximately $26 million.
As of December 29, 2001, the Company had $37 million ofvariable-rate debt with a weighted-average interest rate of3.50% and variable-rate operating leases, primarily for shipsand facilities, with a principal value of $317 million and aweighted-average interest rate of 3.46%. As of December 30,2000, the Company had $337 million of variable-rate debt witha weighted-average interest rate of 7.31% and variable-rateoperating leases with a principal value of $373 million and aweighted-average interest rate of 6.89%. Interest and operatinglease expenses under the majority of these arrangements arebased on LIBOR. The Company currently estimates that a 100basis point change in LIBOR would impact its related pre-taxincome by $4 million.
Foreign Currency Risk: The Company has production, pro-cessing, distribution and marketing operations worldwide.Its sales are transacted primarily in U.S. dollars and majorEuropean and Asian currencies. Product and operating costsare primarily U.S. dollar-based. Some costs are incurred in cur-rencies different from those that are received from the sale ofproducts. Results of operations may be affected by fluctuationsin foreign currency exchange rates in both sourcing and sellinglocations. However, prior to 2001, the Company has, withminor exceptions, not hedged these exposures. The Companycurrently estimates that a 1% change in value of the yen-to-U.S. dollar and the euro-to-U.S. dollar exchange rates wouldeach impact its EBIT by approximately $2 million.
As of December 29, 2001, the Company had entered into foreigncurrency exchange forward contracts to reduce its risk relatedto anticipated working capital collections and paymentsdenominated in foreign currencies. These contracts are denom-inated in Japanese yen, British pounds, Swedish krona and theeuro and are designated as hedges under FAS 133. The Company’sforeign currency exchange forwards, in an aggregate outstand-ing notional amount of $171 million, were designated andeffective as hedges of the changes in fair values of recordedassets or liabilities or of future cash flows. Settlement of thesecontracts will occur in 2002.
Some of the Company’s divisions operate in functional curren-cies other than the U.S. dollar. The net assets of these divisionsare exposed to foreign currency translation gains and losses,which are included as a component of accumulated other com-prehensive loss in shareholders’ equity. Such translation resultedin unrealized losses of $14 million in 2001 and $20 million in2000. The Company has historically not attempted to hedge thisequity risk.
This Annual Report contains forward-looking statements thatinvolve a number of risks and uncertainties. Forward lookingstatements, which are based on management’s assumptions and describe the Company’s future plans, strategies and expec-tations, are generally identifiable by the use of terms such as“anticipate,” “will,” “expect,” “believe,” “should” or similarexpressions. The potential risks and uncertainties that couldcause the Company’s actual results to differ materially fromthose expressed or implied herein include weather-related phenomena; market responses to industry volume pressures;product and raw materials supplies and pricing; electricalpower supply and pricing; changes in interest and currencyexchange rates; economic crises in developing countries;quotas, tariffs and other governmental actions; internationalconflict; and the ability of the Company and its European customers and suppliers to complete euro conversion efforts.
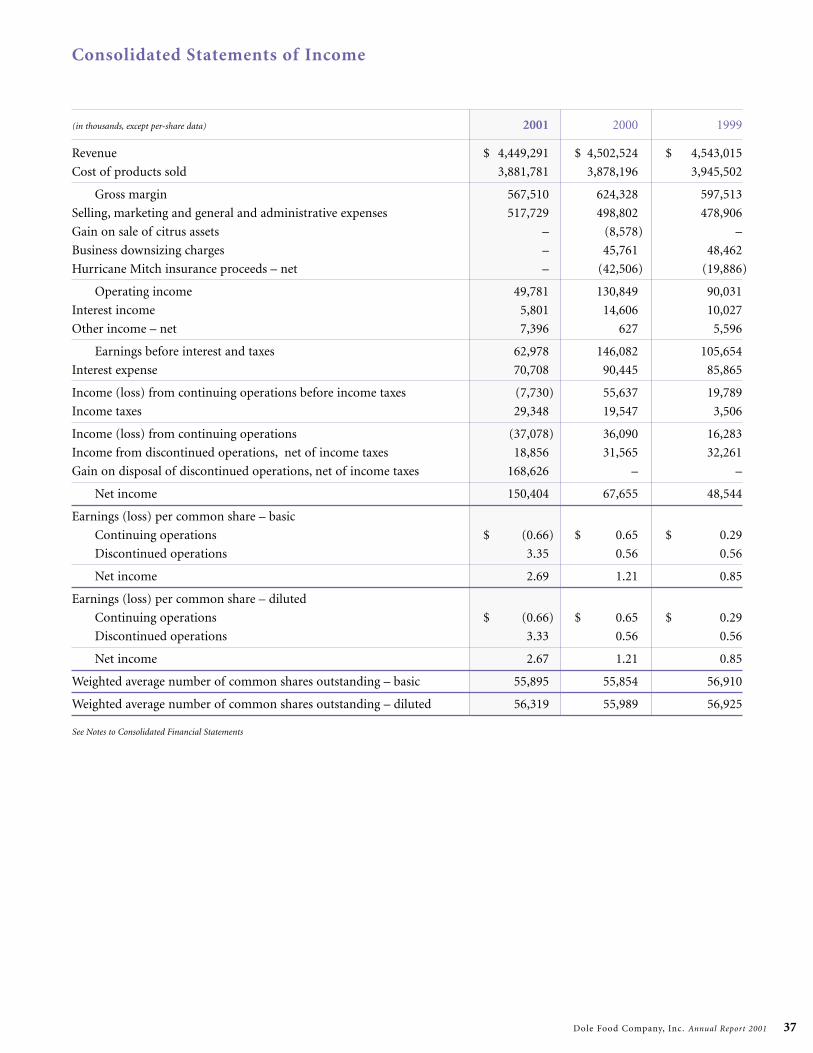
Dole Food Company, Inc. Annual Report 2001 37
Consolidated Statements of Income
(in thousands, except per-share data) 2001 2000 1999
Revenue $ 4,449,291 $ 4,502,524 $ 4,543,015
Cost of products sold 3,881,781 3,878,196 3,945,502
Gross margin 567,510 624,328 597,513
Selling, marketing and general and administrative expenses 517,729 498,802 478,906
Gain on sale of citrus assets – (8,578) –
Business downsizing charges – 45,761 48,462
Hurricane Mitch insurance proceeds – net – (42,506) (19,886)
Operating income 49,781 130,849 90,031
Interest income 5,801 14,606 10,027
Other income – net 7,396 627 5,596
Earnings before interest and taxes 62,978 146,082 105,654
Interest expense 70,708 90,445 85,865
Income (loss) from continuing operations before income taxes (7,730) 55,637 19,789
Income taxes 29,348 19,547 3,506
Income (loss) from continuing operations (37,078) 36,090 16,283
Income from discontinued operations, net of income taxes 18,856 31,565 32,261
Gain on disposal of discontinued operations, net of income taxes 168,626 – –
Net income 150,404 67,655 48,544
Earnings (loss) per common share – basic
Continuing operations $ (0.66) $ 0.65 $ 0.29
Discontinued operations 3.35 0.56 0.56
Net income 2.69 1.21 0.85
Earnings (loss) per common share – diluted
Continuing operations $ (0.66) $ 0.65 $ 0.29
Discontinued operations 3.33 0.56 0.56
Net income 2.67 1.21 0.85
Weighted average number of common shares outstanding – basic 55,895 55,854 56,910
Weighted average number of common shares outstanding – diluted 56,319 55,989 56,925
See Notes to Consolidated Financial Statements
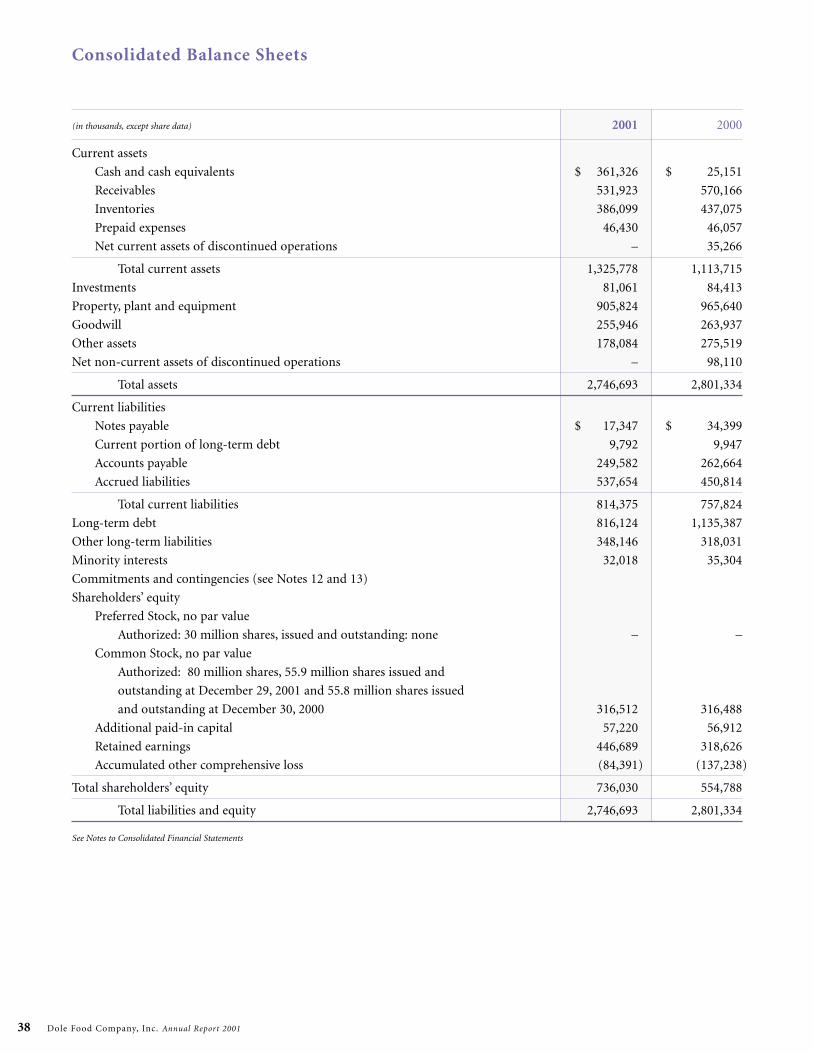
Dole Food Company, Inc. Annual Report 2001 38
Consolidated Balance Sheets
(in thousands, except share data) 2001 2000
Current assets
Cash and cash equivalents $ 361,326 $ 25,151
Receivables 531,923 570,166
Inventories 386,099 437,075
Prepaid expenses 46,430 46,057
Net current assets of discontinued operations – 35,266
Total current assets 1,325,778 1,113,715
Investments 81,061 84,413
Property, plant and equipment 905,824 965,640
Goodwill 255,946 263,937
Other assets 178,084 275,519
Net non-current assets of discontinued operations – 98,110
Total assets 2,746,693 2,801,334
Current liabilities
Notes payable $ 17,347 $ 34,399
Current portion of long-term debt 9,792 9,947
Accounts payable 249,582 262,664
Accrued liabilities 537,654 450,814
Total current liabilities 814,375 757,824
Long-term debt 816,124 1,135,387
Other long-term liabilities 348,146 318,031
Minority interests 32,018 35,304
Commitments and contingencies (see Notes 12 and 13)
Shareholders’ equity
Preferred Stock, no par value
Authorized: 30 million shares, issued and outstanding: none – –
Common Stock, no par value
Authorized: 80 million shares, 55.9 million shares issued and
outstanding at December 29, 2001 and 55.8 million shares issued
and outstanding at December 30, 2000 316,512 316,488
Additional paid-in capital 57,220 56,912
Retained earnings 446,689 318,626
Accumulated other comprehensive loss (84,391) (137,238)
Total shareholders’ equity 736,030 554,788
Total liabilities and equity 2,746,693 2,801,334
See Notes to Consolidated Financial Statements
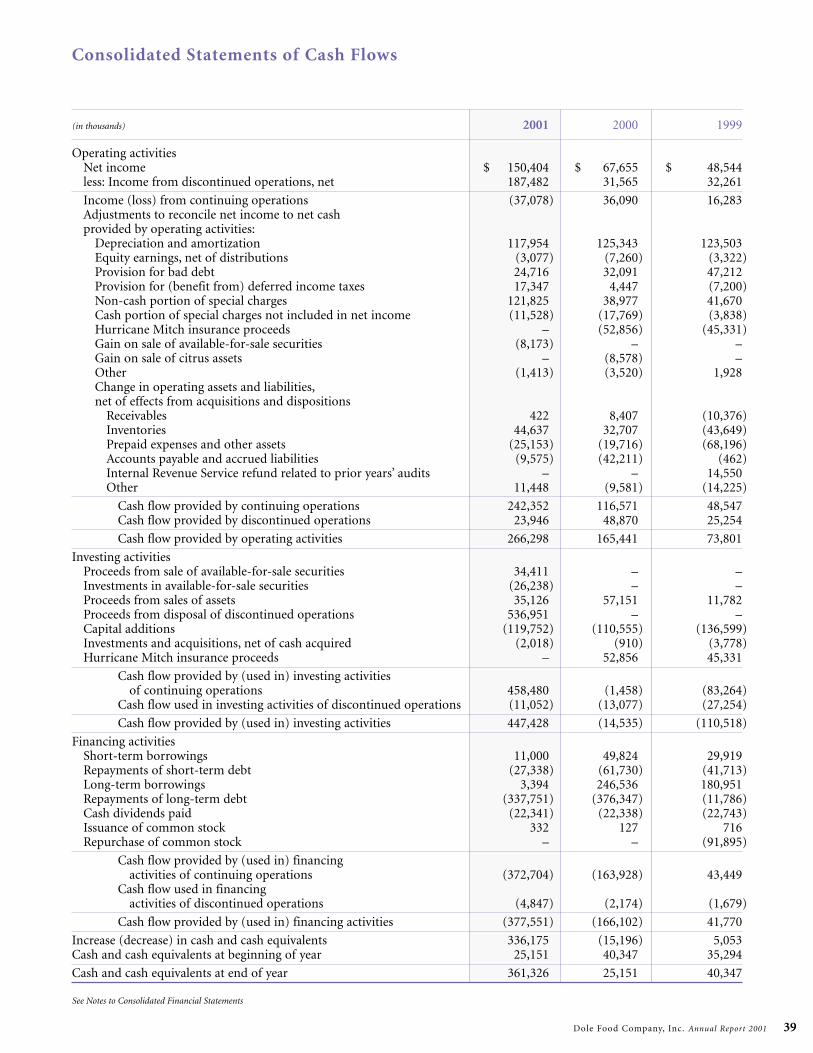
Dole Food Company, Inc. Annual Report 2001 39
Consolidated Statements of Cash Flows
(in thousands) 2001 2000 1999
Operating activitiesNet income $ 150,404 $ 67,655 $ 48,544less: Income from discontinued operations, net 187,482 31,565 32,261
Income (loss) from continuing operations (37,078) 36,090 16,283Adjustments to reconcile net income to net cash provided by operating activities:
Depreciation and amortization 117,954 125,343 123,503Equity earnings, net of distributions (3,077) (7,260) (3,322)Provision for bad debt 24,716 32,091 47,212Provision for (benefit from) deferred income taxes 17,347 4,447 (7,200)Non-cash portion of special charges 121,825 38,977 41,670Cash portion of special charges not included in net income (11,528) (17,769) (3,838)Hurricane Mitch insurance proceeds – (52,856) (45,331)Gain on sale of available-for-sale securities (8,173) – –Gain on sale of citrus assets – (8,578) –Other (1,413) (3,520) 1,928Change in operating assets and liabilities,net of effects from acquisitions and dispositions
Receivables 422 8,407 (10,376)Inventories 44,637 32,707 (43,649)Prepaid expenses and other assets (25,153) (19,716) (68,196)Accounts payable and accrued liabilities (9,575) (42,211) (462)Internal Revenue Service refund related to prior years’ audits – – 14,550Other 11,448 (9,581) (14,225)
Cash flow provided by continuing operations 242,352 116,571 48,547Cash flow provided by discontinued operations 23,946 48,870 25,254
Cash flow provided by operating activities 266,298 165,441 73,801
Investing activitiesProceeds from sale of available-for-sale securities 34,411 – –Investments in available-for-sale securities (26,238) – –Proceeds from sales of assets 35,126 57,151 11,782Proceeds from disposal of discontinued operations 536,951 – –Capital additions (119,752) (110,555) (136,599)Investments and acquisitions, net of cash acquired (2,018) (910) (3,778)Hurricane Mitch insurance proceeds – 52,856 45,331
Cash flow provided by (used in) investing activities of continuing operations 458,480 (1,458) (83,264)
Cash flow used in investing activities of discontinued operations (11,052) (13,077) (27,254)
Cash flow provided by (used in) investing activities 447,428 (14,535) (110,518)
Financing activitiesShort-term borrowings 11,000 49,824 29,919Repayments of short-term debt (27,338) (61,730) (41,713)Long-term borrowings 3,394 246,536 180,951Repayments of long-term debt (337,751) (376,347) (11,786)Cash dividends paid (22,341) (22,338) (22,743)Issuance of common stock 332 127 716Repurchase of common stock – – (91,895)
Cash flow provided by (used in) financing activities of continuing operations (372,704) (163,928) 43,449
Cash flow used in financing activities of discontinued operations (4,847) (2,174) (1,679)
Cash flow provided by (used in) financing activities (377,551) (166,102) 41,770
Increase (decrease) in cash and cash equivalents 336,175 (15,196) 5,053Cash and cash equivalents at beginning of year 25,151 40,347 35,294
Cash and cash equivalents at end of year 361,326 25,151 40,347
See Notes to Consolidated Financial Statements
Dole Food Company, Inc. Annual Report 2001 40
reclassification reduced the Company’s aggregate and segmentrevenues and cost of products sold in the following amounts:
(in thousands) 2000 1999
Fresh fruit $ 166,057 $ 194,936Fresh vegetables 72,357 71,208Fresh-cut flowers 345 278
238,759 266,422
The change in presentation had no impact on the Company’sreported gross margin, operating income or net income.
Agricultural Costs: Recurring agricultural costs for bananas,pineapples and flowers are charged to operations as incurred.Such recurring costs related to other crops are recognized whenthe crops are harvested and sold. Non-recurring agriculturalcosts, primarily comprised of soil and farm improvements andother long-term crop growing costs, are deferred and amor-tized over the estimated production period, currently from twoto seven years.
Shipping and Handling Costs: The Company follows theprovisions of Emerging Issues Task Force Issue No. 00-10,“Accounting for Shipping and Handling Fees and Costs.” Anyamounts billed to third party customers for shipping andhandling are included as a component of revenue. Shippingand handling costs incurred are included as a component ofcost of products sold and represent costs incurred by theCompany to ship product from the sourcing locations to theend consumer markets.
Marketing and Advertising Costs: Marketing costs are generallyexpensed as incurred. Advertising costs, which include mediaadvertising and production costs, are expensed in the period inwhich the advertising first takes place. Marketing and advertis-ing costs were $196 million, $189 million and $177 million in2001, 2000 and 1999, respectively.
Stock-Based Compensation: Statement of FinancialAccounting Standards No. 123 (“FAS 123”), “Accounting forStock-Based Compensation,” defines a fair value method ofaccounting for employee stock-based compensation cost butallows for the continuation of the intrinsic value method prescribed by Accounting Principles Board Opinion No. 25 (“APB 25”). As allowed by FAS 123, the Company has elected tocontinue to utilize the accounting method prescribed by APB25 and has adopted the disclosure requirements of FAS 123 (see Note 10).
Income Taxes: Deferred income taxes are recognized for thetax consequences of temporary differences by applying enactedstatutory tax rates to the differences between financial state-ment carrying amounts and the tax bases of assets and liabili-ties. Income taxes, which would be due upon the repatriationof foreign subsidiary earnings, have not been provided wherethe undistributed earnings are considered permanently invested.
Notes to Consolidated Financial Statements
Note 1 – Nature of Operations
Dole Food Company, Inc. and its consolidated subsidiaries(“the Company”) was incorporated under the laws of Hawaii in 1894 and was reincorporated under the laws of Delaware inJuly 2001.
The Company is engaged in the worldwide sourcing, process-ing, distributing and marketing of high-quality, branded foodproducts including fresh fruit and vegetables, as well as pack-aged foods. Additionally, the Company markets a full line ofpremium fresh-cut flowers.
Operations are conducted throughout North America, LatinAmerica, Europe (including eastern European countries), Asia(primarily in Japan and the Philippines) and Africa (primarilyin South Africa and western African countries).
The Company’s principal products are produced on bothCompany-owned and leased land and are also acquiredthrough associated producer and independent grower arrange-ments. The Company’s products are primarily packed andprocessed by the Company and sold to wholesale, retail andinstitutional customers and other food product and flowercompanies.
Note 2 – Summary of Significant Accounting Policies
Basis of Consolidation: The Company’s Consolidated FinancialStatements include the accounts of its majority-owned sub-sidiaries. Intercompany accounts and transactions have beeneliminated in consolidation. Amounts reflected on theCompany’s Consolidated Financial Statements have beenreclassified to reflect the effects of discontinued operations.Amounts in the footnotes have been restated to eliminate theeffect of discontinued operations (see Note 4).
Annual Closing Date: The Company’s fiscal year ends on theSaturday closest to December 31. Fiscal years 2001, 2000 and1999 ended on December 29, 2001, December 30, 2000 andJanuary 1, 2000, respectively, and included 52 weeks each.
Revenue Recognition: Revenue is recognized when producttitle and risk of loss transfer to the customer or when servicesare performed. During the fourth quarter of 2000, the Companyimplemented Securities and Exchange Commission (“SEC”)Staff Accounting Bulletin No. 101 (“SAB 101”), “RevenueRecognition in Financial Statements,” which provides interpre-tive guidance for rules regarding the recognition and presenta-tion of revenue. The Company’s implementation of SAB 101resulted in the reclassification, as a reduction of revenue, ofproduct sourcing costs associated with commission sales.Previous industry and Company practice for certain fresh fruit,fresh vegetables and fresh-cut flowers products was to presentsuch amounts as a component of cost of products sold. The
Dole Food Company, Inc. Annual Report 2001 41
121), “Accounting for the Impairment of Long-Lived Assetsand for Long-Lived Assets to be Disposed of.” If an evaluationof recoverability is required, the estimated undiscounted futurecash flows associated with the asset would be compared to theasset’s carrying amount. If this comparison indicates that thereis an impairment, the amount of the impairment is typicallycalculated by comparing the carrying value to discountedexpected future cash flows or comparable market values,depending on the nature of the asset. All long-lived assets, forwhich management has committed itself to a plan of disposal,are reported at the lower of carrying amount or fair value.
Goodwill: Goodwill represents the excess of cost over the fairvalue of net identifiable assets acquired, and is stated at costless accumulated amortization. Goodwill is amortized on astraight-line basis over the periods benefited, principally in therange of 10 to 40 years. At December 29, 2001, goodwill, net ofaccumulated amortization, of $133 million, $3 million and$120 million is associated with the fresh fruit, packaged foodsand fresh-cut flowers segments, respectively. Goodwill amorti-zation expense for 2001, 2000 and 1999 totaled $11 million,$12 million and $14 million, respectively.
In June 2001, the Financial Accounting Standards Board(“FASB”) adopted Statements of Financial AccountingStandards No. 141 (“FAS 141”), “Business Combinations” andNo. 142 (“FAS 142”), “Goodwill and Other Intangible Assets.”These statements eliminate the pooling of interest method ofaccounting for business combinations as of June 30, 2001 and eliminate the amortization of goodwill for all fiscal yearsbeginning after December 15, 2001. Goodwill will be account-ed for under an impairment-only method after this date. TheCompany has adopted FAS 141 and FAS 142 with respect tonew goodwill as of July 1, 2001 and is adopting FAS 142 withrespect to existing goodwill as of December 30, 2001, the firstday of its 2002 fiscal year. The adoption of FAS 141 has notimpacted the Company’s financial condition or results ofoperations. In accordance with FAS 142, existing goodwill wasamortized through fiscal 2001. Upon adoption of FAS 142,amortization will cease and the Company will perform a transitional goodwill impairment test.
Financial Instruments: The Company’s financial instrumentsare primarily composed of short-term trade and grower receiv-ables, notes receivable and notes payable, as well as long-termgrower receivables, notes receivable, notes payable and deben-tures. For short-term instruments, the historical carryingamount is a reasonable estimate of fair value. Fair values forlong-term financial instruments not readily marketable areestimated based upon discounted future cash flows at prevail-ing market interest rates. Based on these assumptions, manage-ment believes the fair market values of the Company’s financialinstruments are not materially different from their recordedamounts as of December 29, 2001.
Net Income per Common Share: Basic net income per commonshare is calculated using the weighted-average number of commonshares outstanding during the period without consideration ofthe dilutive effect of stock options. The basic weighted-averagenumber of common shares outstanding was 55.9 million forboth 2001 and 2000 and 56.9 million for 1999. Diluted netincome per common share is calculated using the weighted-average number of common shares outstanding during theperiod after consideration of the dilutive effect of stockoptions. The diluted weighted-average number of commonshares and equivalents outstanding was 56.3 million for 2001,56.0 million for 2000 and 56.9 million for 1999.
Comprehensive Income: Other comprehensive income is com-prised of changes to shareholders’ equity, other than contribu-tions from or distributions to shareholders, excluded from thedetermination of net income under accounting principles gen-erally accepted in the United States. The Company’s other com-prehensive income comprises unrealized foreign currencytranslation gains and losses, unrealized gains and losses on cashflow hedging instruments and additional minimum pensionliability. Comprehensive income is presented in the Company’schanges in shareholders’ equity (see Note 11).
Cash and Cash Equivalents: Cash and cash equivalents consistof cash on hand and highly liquid investments, primarilymoney market funds and time deposits, with original maturi-ties of three months or less.
Grower Advances: Grower advances consist of cash advances to growers and are stated at the gross advance amounts lessreserves for potential uncollectible balances. Such advances are generally secured by productive assets.
Inventories: Inventories are valued at the lower of cost or market.Cost is determined principally on a first-in, first-out basis andincludes materials, labor and overhead. Specific identificationand average cost methods are also used primarily for certainpacking materials and operating supplies.
Investments: Investments in affiliates and joint ventures withownership of 20% to 50% are generally recorded on the equitymethod. Other non-consolidated investments are accounted forusing the cost method.
Property, Plant and Equipment: Property, plant and equipmentare stated at cost, less accumulated depreciation. Depreciationis computed principally by the straight-line method over theestimated useful lives of these assets. Average useful lives forland improvements, building and building improvements andmachinery and equipment are 10 years, 20 years and 15 years,respectively. The Company reviews these assets, as well as cer-tain intangible assets including goodwill, for impairmentwhenever events or changes in circumstances indicate that thecarrying amount may not be recoverable in accordance withStatement of Financial Accounting Standards No. 121 (FAS
Prior to 2001, the Company has not attempted to hedgefluctuations resulting from foreign currency denominatedtransactions in both sourcing and selling locations. However,the Company enters into forward contracts related to specificforeign currency denominated purchase commitments andsales. Such contracts are designated as hedges and meet thecriteria for correlation and risk mitigation.
Effective December 31, 2000, the first day of its 2001 fiscal year,the Company adopted FASB Statement of Financial AccountingStandards No. 133 (“FAS 133”), “Accounting for DerivativeInstruments and Hedging Activities,” as amended by FASBStatement of Financial Accounting Standards No. 138,“Accounting for Certain Derivative Instruments and CertainHedging Activities – An amendment of FASB Statement No.133.” FAS 133 requires that all derivative instruments (includingcertain derivative instruments embedded in other contracts) bereported at fair value with changes in fair value recognized inearnings or other comprehensive income. Recognition dependson whether the derivative is designated and effective as part ofa hedge transaction and on the type of hedge transaction (fairvalue or cash flow). Gains or losses on derivative instrumentsrecorded in other comprehensive income must be reclassified toincome during the period in which earnings are affected by theunderlying hedged item. The ineffective portion of all hedgesimpacts earnings in the current period.
As of December 29, 2001, the Company’s derivative instru-ments, both free-standing and embedded, as defined by FAS133, consisted of foreign currency exchange forwards and certain minor warrants in privately held companies.
The Company entered into foreign currency exchange forwardcontracts to reduce its risk related to anticipated working capitalcollections and payments denominated in foreign currencies.These contracts are denominated in Japanese yen, Britishpounds, Swedish krona and the euro and are designated ashedges under FAS 133. The Company’s foreign currencyexchange forwards, in an aggregate outstanding notionalamount of $171 million, were designated and effective as hedgesof the changes in fair values of recorded assets or liabilities or offuture cash flows. The ineffective portion of changes in fair valuesof hedge positions, which was included in operating income for2001, was not material. Unrealized net gains related to cashflow hedges totaling $15 million were included as a componentof accumulated other comprehensive loss as of December 29,2001. Settlement of these contracts will occur in 2002.
In 2000, the Company received stock warrants in two privatelyheld companies through which the Company sells a portion ofits products. The Company can, at its option, purchase twomillion shares upon public registration of the two privatelyheld companies at a weighted-average price of $5.75 per share.The Company estimated that the fair value of these warrantswas not significant as of December 29, 2001.
In the normal course of business, the Company entered intovarious commodity purchase and sale contracts. These contractsqualify as a normal purchase and sale under FAS 133 and areexcluded from mark-to-market accounting.
In 1998, the Company had contracted to purchase Germanmarks primarily at fixed exchange rates to facilitate paymentfor the purchase of two German-made refrigerated containervessels. In the fourth quarter of 1999, in conjunction with thetermination of the Company’s purchase obligation, it enteredinto an operating lease for the vessels. In the fourth quarter of 1999, these currency exchange contracts were terminatedresulting in a pre-tax charge to operating income of approxi-mately $2 million.
Foreign Exchange: For subsidiaries with transactions denomi-nated in currencies other than their functional currency, netforeign exchange transaction gains or losses are included indetermining net income. These transactions resulted in netlosses of $3 million in 2001, $8 million in 2000 and $9 millionin 1999. Net foreign exchange gains or losses resulting from thetranslation of assets and liabilities of foreign subsidiaries whosefunctional currency is not the U.S. dollar are recognized as acomponent of accumulated other comprehensive loss in share-holders’ equity. The change in operating assets and liabilitiesshown in the Consolidated Statements of Cash Flows excludesthe effects of foreign currency translation. Such translationreduced assets and liabilities by $18 million and $4 million,respectively, during 2001, by $33 million and $13 million,respectively, during 2000 and by $33 million and $11 million,respectively, during 1999.
Use of Estimates: The preparation of financial statements inconformity with accounting principles generally accepted in theUnited States requires management to make estimates andassumptions that affect the reported amounts of assets and lia-bilities as well as the disclosures of contingent assets and liabilitiesas of the date of these financial statements. Management’s useof estimates also affects the reported amounts of revenues andexpenses during the reporting period. Actual results could dif-fer from these estimates.
Reclassifications: Certain prior year amounts have been reclas-sified to conform with the 2001 presentation. These reclassifi-cations had no impact on previously reported results of opera-tions or total shareholders’ equity.
Note 3 – Business Acquisitions
At the beginning of 1999, the Company acquired and investedin banana production and distribution operations in LatinAmerica and Asia. The cash purchase price of acquisitions and investments made by the Company totaled approximately$4 million in 1999, net of cash acquired. Each acquisition wasaccounted for as a purchase, and accordingly, the purchaseprice was allocated to the net assets acquired based upon theirestimated fair values as of the date of acquisition. This alloca-tion of purchase price resulted in goodwill of approximately
Dole Food Company, Inc. Annual Report 2001 42
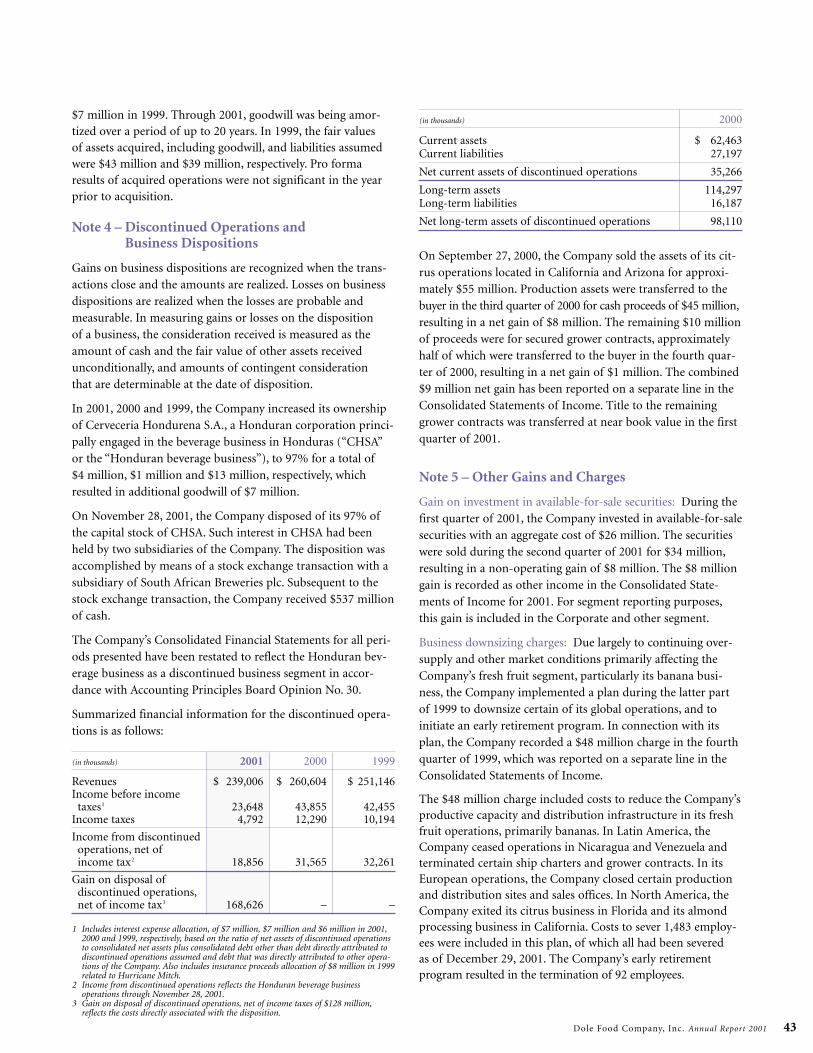
Dole Food Company, Inc. Annual Report 2001 43
$7 million in 1999. Through 2001, goodwill was being amor-tized over a period of up to 20 years. In 1999, the fair values of assets acquired, including goodwill, and liabilities assumedwere $43 million and $39 million, respectively. Pro formaresults of acquired operations were not significant in the yearprior to acquisition.
Note 4 – Discontinued Operations and Business Dispositions
Gains on business dispositions are recognized when the trans-actions close and the amounts are realized. Losses on businessdispositions are realized when the losses are probable andmeasurable. In measuring gains or losses on the disposition of a business, the consideration received is measured as theamount of cash and the fair value of other assets receivedunconditionally, and amounts of contingent consideration that are determinable at the date of disposition.
In 2001, 2000 and 1999, the Company increased its ownershipof Cerveceria Hondurena S.A., a Honduran corporation princi-pally engaged in the beverage business in Honduras (“CHSA”or the “Honduran beverage business”), to 97% for a total of$4 million, $1 million and $13 million, respectively, whichresulted in additional goodwill of $7 million.
On November 28, 2001, the Company disposed of its 97% ofthe capital stock of CHSA. Such interest in CHSA had beenheld by two subsidiaries of the Company. The disposition wasaccomplished by means of a stock exchange transaction with asubsidiary of South African Breweries plc. Subsequent to thestock exchange transaction, the Company received $537 millionof cash.
The Company’s Consolidated Financial Statements for all peri-ods presented have been restated to reflect the Honduran bev-erage business as a discontinued business segment in accor-dance with Accounting Principles Board Opinion No. 30.
Summarized financial information for the discontinued opera-tions is as follows:
(in thousands) 2001 2000 1999
Revenues $ 239,006 $ 260,604 $ 251,146Income before income
taxes1 23,648 43,855 42,455Income taxes 4,792 12,290 10,194
Income from discontinued operations, net ofincome tax2 18,856 31,565 32,261
Gain on disposal ofdiscontinued operations,net of income tax3 168,626 – –
1 Includes interest expense allocation, of $7 million, $7 million and $6 million in 2001,2000 and 1999, respectively, based on the ratio of net assets of discontinued operationsto consolidated net assets plus consolidated debt other than debt directly attributed todiscontinued operations assumed and debt that was directly attributed to other opera-tions of the Company. Also includes insurance proceeds allocation of $8 million in 1999related to Hurricane Mitch.
2 Income from discontinued operations reflects the Honduran beverage business operations through November 28, 2001.
3 Gain on disposal of discontinued operations, net of income taxes of $128 million,reflects the costs directly associated with the disposition.
(in thousands) 2000
Current assets $ 62,463Current liabilities 27,197
Net current assets of discontinued operations 35,266
Long-term assets 114,297Long-term liabilities 16,187
Net long-term assets of discontinued operations 98,110
On September 27, 2000, the Company sold the assets of its cit-rus operations located in California and Arizona for approxi-mately $55 million. Production assets were transferred to thebuyer in the third quarter of 2000 for cash proceeds of $45 million,resulting in a net gain of $8 million. The remaining $10 millionof proceeds were for secured grower contracts, approximatelyhalf of which were transferred to the buyer in the fourth quar-ter of 2000, resulting in a net gain of $1 million. The combined$9 million net gain has been reported on a separate line in theConsolidated Statements of Income. Title to the remaininggrower contracts was transferred at near book value in the firstquarter of 2001.
Note 5 – Other Gains and Charges
Gain on investment in available-for-sale securities: During thefirst quarter of 2001, the Company invested in available-for-salesecurities with an aggregate cost of $26 million. The securitieswere sold during the second quarter of 2001 for $34 million,resulting in a non-operating gain of $8 million. The $8 milliongain is recorded as other income in the Consolidated State-ments of Income for 2001. For segment reporting purposes,this gain is included in the Corporate and other segment.
Business downsizing charges: Due largely to continuing over-supply and other market conditions primarily affecting theCompany’s fresh fruit segment, particularly its banana busi-ness, the Company implemented a plan during the latter partof 1999 to downsize certain of its global operations, and to initiate an early retirement program. In connection with itsplan, the Company recorded a $48 million charge in the fourthquarter of 1999, which was reported on a separate line in theConsolidated Statements of Income.
The $48 million charge included costs to reduce the Company’sproductive capacity and distribution infrastructure in its freshfruit operations, primarily bananas. In Latin America, theCompany ceased operations in Nicaragua and Venezuela andterminated certain ship charters and grower contracts. In itsEuropean operations, the Company closed certain productionand distribution sites and sales offices. In North America, theCompany exited its citrus business in Florida and its almondprocessing business in California. Costs to sever 1,483 employ-ees were included in this plan, of which all had been severed as of December 29, 2001. The Company’s early retirement program resulted in the termination of 92 employees.
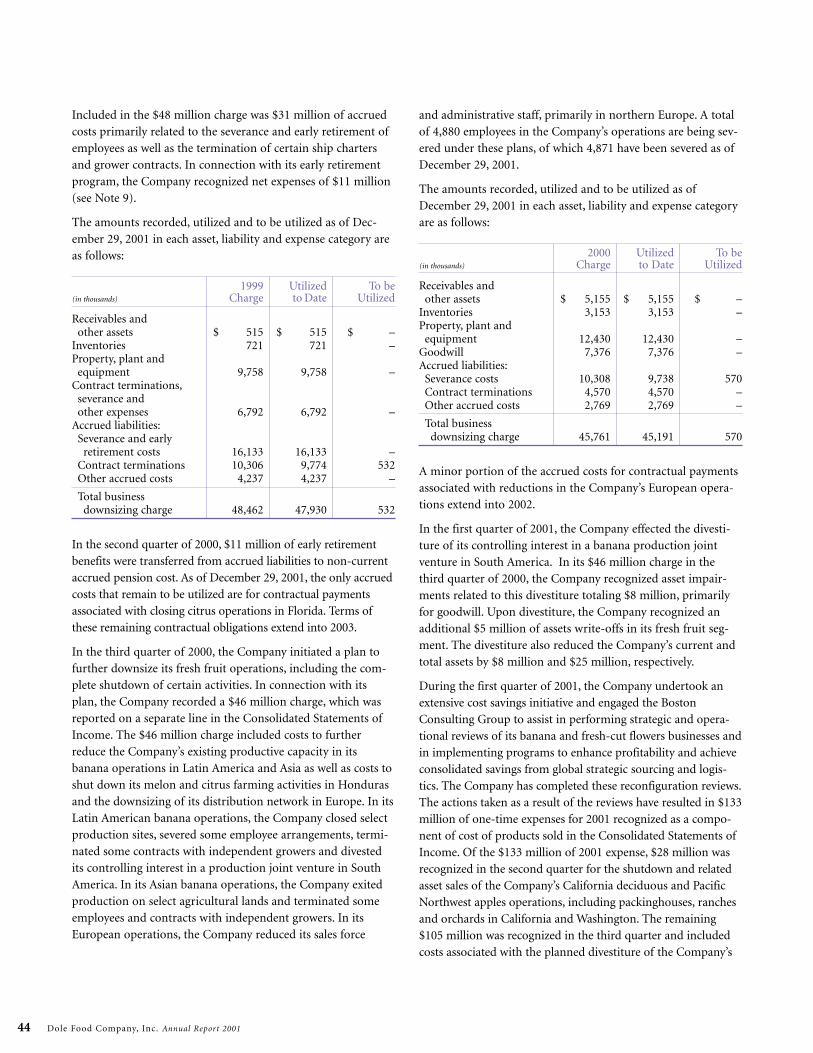
Included in the $48 million charge was $31 million of accruedcosts primarily related to the severance and early retirement ofemployees as well as the termination of certain ship chartersand grower contracts. In connection with its early retirementprogram, the Company recognized net expenses of $11 million(see Note 9).
The amounts recorded, utilized and to be utilized as of Dec-ember 29, 2001 in each asset, liability and expense category areas follows:
1999 Utilized To be(in thousands) Charge to Date Utilized
Receivables and other assets $ 515 $ 515 $ –
Inventories 721 721 –Property, plant and
equipment 9,758 9,758 –Contract terminations,
severance and other expenses 6,792 6,792 –
Accrued liabilities:Severance and early
retirement costs 16,133 16,133 –Contract terminations 10,306 9,774 532Other accrued costs 4,237 4,237 –
Total business downsizing charge $ 48,462 $ 47,930 $ 532
In the second quarter of 2000, $11 million of early retirementbenefits were transferred from accrued liabilities to non-currentaccrued pension cost. As of December 29, 2001, the only accruedcosts that remain to be utilized are for contractual paymentsassociated with closing citrus operations in Florida. Terms ofthese remaining contractual obligations extend into 2003.
In the third quarter of 2000, the Company initiated a plan tofurther downsize its fresh fruit operations, including the com-plete shutdown of certain activities. In connection with itsplan, the Company recorded a $46 million charge, which wasreported on a separate line in the Consolidated Statements ofIncome. The $46 million charge included costs to furtherreduce the Company’s existing productive capacity in itsbanana operations in Latin America and Asia as well as costs toshut down its melon and citrus farming activities in Hondurasand the downsizing of its distribution network in Europe. In itsLatin American banana operations, the Company closed selectproduction sites, severed some employee arrangements, termi-nated some contracts with independent growers and divestedits controlling interest in a production joint venture in SouthAmerica. In its Asian banana operations, the Company exitedproduction on select agricultural lands and terminated someemployees and contracts with independent growers. In itsEuropean operations, the Company reduced its sales force
and administrative staff, primarily in northern Europe. A totalof 4,880 employees in the Company’s operations are being sev-ered under these plans, of which 4,871 have been severed as ofDecember 29, 2001.
The amounts recorded, utilized and to be utilized as ofDecember 29, 2001 in each asset, liability and expense categoryare as follows:
2000 Utilized To be(in thousands) Charge to Date Utilized
Receivables and other assets $ 5,155 $ 5,155 $ –
Inventories 3,153 3,153 –Property, plant and
equipment 12,430 12,430 –Goodwill 7,376 7,376 –Accrued liabilities:
Severance costs 10,308 9,738 570Contract terminations 4,570 4,570 –Other accrued costs 2,769 2,769 –
Total business downsizing charge $ 45,761 $ 45,191 $ 570
A minor portion of the accrued costs for contractual paymentsassociated with reductions in the Company’s European opera-tions extend into 2002.
In the first quarter of 2001, the Company effected the divesti-ture of its controlling interest in a banana production jointventure in South America. In its $46 million charge in thethird quarter of 2000, the Company recognized asset impair-ments related to this divestiture totaling $8 million, primarilyfor goodwill. Upon divestiture, the Company recognized anadditional $5 million of assets write-offs in its fresh fruit seg-ment. The divestiture also reduced the Company’s current andtotal assets by $8 million and $25 million, respectively.
During the first quarter of 2001, the Company undertook anextensive cost savings initiative and engaged the BostonConsulting Group to assist in performing strategic and opera-tional reviews of its banana and fresh-cut flowers businesses andin implementing programs to enhance profitability and achieveconsolidated savings from global strategic sourcing and logis-tics. The Company has completed these reconfiguration reviews.The actions taken as a result of the reviews have resulted in $133million of one-time expenses for 2001 recognized as a compo-nent of cost of products sold in the Consolidated Statements ofIncome. Of the $133 million of 2001 expense, $28 million wasrecognized in the second quarter for the shutdown and relatedasset sales of the Company’s California deciduous and PacificNorthwest apples operations, including packinghouses, ranchesand orchards in California and Washington. The remaining$105 million was recognized in the third quarter and includedcosts associated with the planned divestiture of the Company’s
Dole Food Company, Inc. Annual Report 2001 44
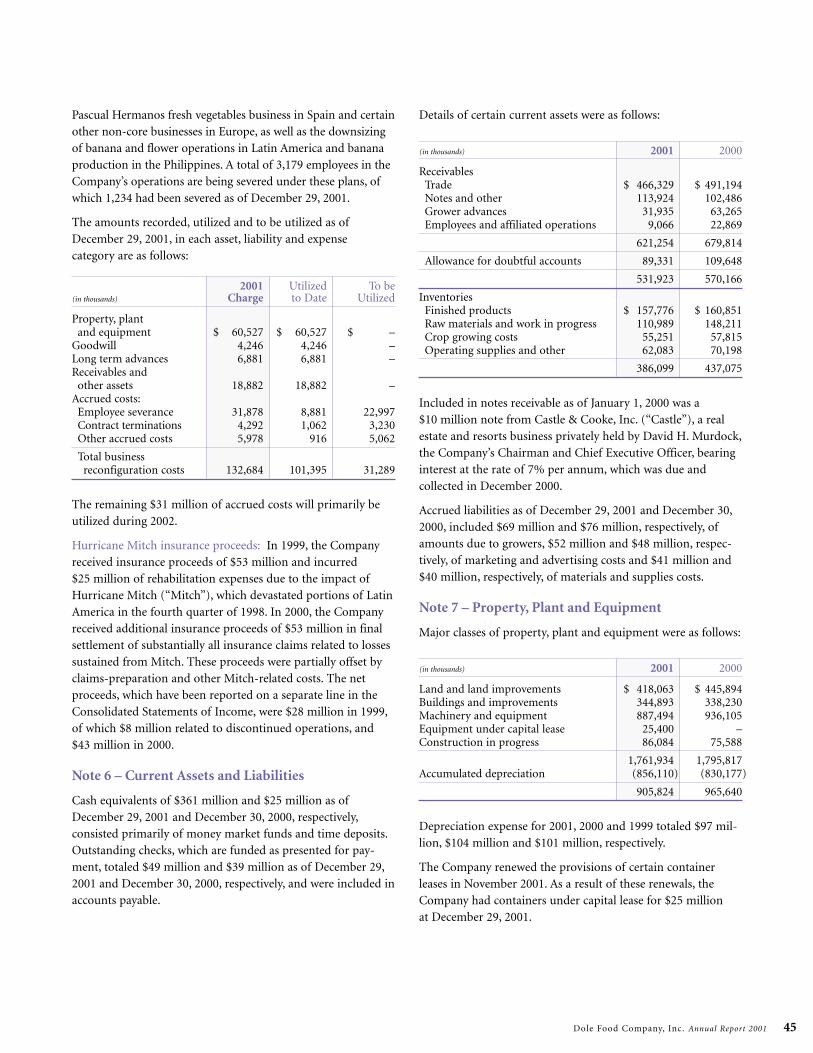
Dole Food Company, Inc. Annual Report 2001 45
Pascual Hermanos fresh vegetables business in Spain and certainother non-core businesses in Europe, as well as the downsizingof banana and flower operations in Latin America and bananaproduction in the Philippines. A total of 3,179 employees in theCompany’s operations are being severed under these plans, ofwhich 1,234 had been severed as of December 29, 2001.
The amounts recorded, utilized and to be utilized as ofDecember 29, 2001, in each asset, liability and expense category are as follows:
2001 Utilized To be(in thousands) Charge to Date Utilized
Property, plant and equipment $ 60,527 $ 60,527 $ –
Goodwill 4,246 4,246 –Long term advances 6,881 6,881 –Receivables and
other assets 18,882 18,882 –Accrued costs:
Employee severance 31,878 8,881 22,997Contract terminations 4,292 1,062 3,230Other accrued costs 5,978 916 5,062
Total business reconfiguration costs 132,684 $ 101,395 $ 31,289
The remaining $31 million of accrued costs will primarily beutilized during 2002.
Hurricane Mitch insurance proceeds: In 1999, the Companyreceived insurance proceeds of $53 million and incurred $25 million of rehabilitation expenses due to the impact ofHurricane Mitch (“Mitch”), which devastated portions of LatinAmerica in the fourth quarter of 1998. In 2000, the Companyreceived additional insurance proceeds of $53 million in finalsettlement of substantially all insurance claims related to lossessustained from Mitch. These proceeds were partially offset byclaims-preparation and other Mitch-related costs. The net proceeds, which have been reported on a separate line in theConsolidated Statements of Income, were $28 million in 1999,of which $8 million related to discontinued operations, and$43 million in 2000.
Note 6 – Current Assets and Liabilities
Cash equivalents of $361 million and $25 million as ofDecember 29, 2001 and December 30, 2000, respectively,consisted primarily of money market funds and time deposits.Outstanding checks, which are funded as presented for pay-ment, totaled $49 million and $39 million as of December 29,2001 and December 30, 2000, respectively, and were included inaccounts payable.
Details of certain current assets were as follows:
(in thousands) 2001 2000
ReceivablesTrade $ 466,329 $ 491,194Notes and other 113,924 102,486Grower advances 31,935 63,265Employees and affiliated operations 9,066 22,869
621,254 679,814
Allowance for doubtful accounts 89,331 109,648
531,923 570,166
InventoriesFinished products $ 157,776 $ 160,851Raw materials and work in progress 110,989 148,211Crop growing costs 55,251 57,815Operating supplies and other 62,083 70,198
386,099 437,075
Included in notes receivable as of January 1, 2000 was a $10 million note from Castle & Cooke, Inc. (“Castle”), a realestate and resorts business privately held by David H. Murdock,the Company’s Chairman and Chief Executive Officer, bearinginterest at the rate of 7% per annum, which was due andcollected in December 2000.
Accrued liabilities as of December 29, 2001 and December 30,2000, included $69 million and $76 million, respectively, ofamounts due to growers, $52 million and $48 million, respec-tively, of marketing and advertising costs and $41 million and$40 million, respectively, of materials and supplies costs.
Note 7 – Property, Plant and Equipment
Major classes of property, plant and equipment were as follows:
(in thousands) 2001 2000
Land and land improvements $ 418,063 $ 445,894Buildings and improvements 344,893 338,230Machinery and equipment 887,494 936,105Equipment under capital lease 25,400 –Construction in progress 86,084 75,588
1,761,934 1,795,817Accumulated depreciation (856,110) (830,177)
905,824 965,640
Depreciation expense for 2001, 2000 and 1999 totaled $97 mil-lion, $104 million and $101 million, respectively.
The Company renewed the provisions of certain container leases in November 2001. As a result of these renewals, theCompany had containers under capital lease for $25 million at December 29, 2001.
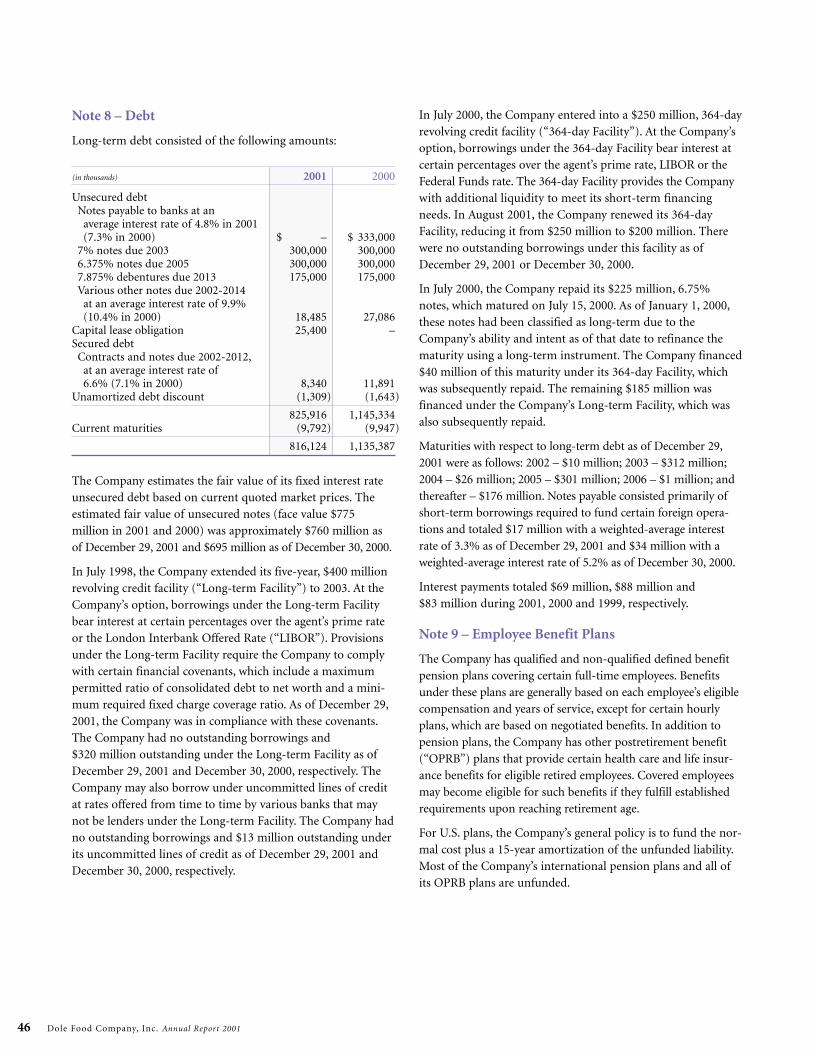
In July 2000, the Company entered into a $250 million, 364-dayrevolving credit facility (“364-day Facility”). At the Company’soption, borrowings under the 364-day Facility bear interest atcertain percentages over the agent’s prime rate, LIBOR or theFederal Funds rate. The 364-day Facility provides the Companywith additional liquidity to meet its short-term financingneeds. In August 2001, the Company renewed its 364-dayFacility, reducing it from $250 million to $200 million. Therewere no outstanding borrowings under this facility as ofDecember 29, 2001 or December 30, 2000.
In July 2000, the Company repaid its $225 million, 6.75%notes, which matured on July 15, 2000. As of January 1, 2000,these notes had been classified as long-term due to theCompany’s ability and intent as of that date to refinance thematurity using a long-term instrument. The Company financed$40 million of this maturity under its 364-day Facility, whichwas subsequently repaid. The remaining $185 million wasfinanced under the Company’s Long-term Facility, which wasalso subsequently repaid.
Maturities with respect to long-term debt as of December 29,2001 were as follows: 2002 – $10 million; 2003 – $312 million;2004 – $26 million; 2005 – $301 million; 2006 – $1 million; andthereafter – $176 million. Notes payable consisted primarily ofshort-term borrowings required to fund certain foreign opera-tions and totaled $17 million with a weighted-average interestrate of 3.3% as of December 29, 2001 and $34 million with aweighted-average interest rate of 5.2% as of December 30, 2000.
Interest payments totaled $69 million, $88 million and $83 million during 2001, 2000 and 1999, respectively.
Note 9 – Employee Benefit Plans
The Company has qualified and non-qualified defined benefitpension plans covering certain full-time employees. Benefitsunder these plans are generally based on each employee’s eligiblecompensation and years of service, except for certain hourlyplans, which are based on negotiated benefits. In addition topension plans, the Company has other postretirement benefit(“OPRB”) plans that provide certain health care and life insur-ance benefits for eligible retired employees. Covered employeesmay become eligible for such benefits if they fulfill establishedrequirements upon reaching retirement age.
For U.S. plans, the Company’s general policy is to fund the nor-mal cost plus a 15-year amortization of the unfunded liability.Most of the Company’s international pension plans and all ofits OPRB plans are unfunded.
Dole Food Company, Inc. Annual Report 2001 46
Note 8 – Debt
Long-term debt consisted of the following amounts:
(in thousands) 2001 2000
Unsecured debtNotes payable to banks at an
average interest rate of 4.8% in 2001 (7.3% in 2000) $ – $ 333,000
7% notes due 2003 300,000 300,0006.375% notes due 2005 300,000 300,0007.875% debentures due 2013 175,000 175,000Various other notes due 2002-2014
at an average interest rate of 9.9% (10.4% in 2000) 18,485 27,086
Capital lease obligation 25,400 –Secured debt
Contracts and notes due 2002-2012,at an average interest rate of6.6% (7.1% in 2000) 8,340 11,891
Unamortized debt discount (1,309) (1,643)
825,916 1,145,334Current maturities (9,792) (9,947)
816,124 1,135,387
The Company estimates the fair value of its fixed interest rateunsecured debt based on current quoted market prices. Theestimated fair value of unsecured notes (face value $775 million in 2001 and 2000) was approximately $760 million asof December 29, 2001 and $695 million as of December 30, 2000.
In July 1998, the Company extended its five-year, $400 millionrevolving credit facility (“Long-term Facility”) to 2003. At theCompany’s option, borrowings under the Long-term Facilitybear interest at certain percentages over the agent’s prime rateor the London Interbank Offered Rate (“LIBOR”). Provisionsunder the Long-term Facility require the Company to complywith certain financial covenants, which include a maximumpermitted ratio of consolidated debt to net worth and a mini-mum required fixed charge coverage ratio. As of December 29,2001, the Company was in compliance with these covenants.The Company had no outstanding borrowings and $320 million outstanding under the Long-term Facility as ofDecember 29, 2001 and December 30, 2000, respectively. TheCompany may also borrow under uncommitted lines of creditat rates offered from time to time by various banks that maynot be lenders under the Long-term Facility. The Company hadno outstanding borrowings and $13 million outstanding underits uncommitted lines of credit as of December 29, 2001 andDecember 30, 2000, respectively.
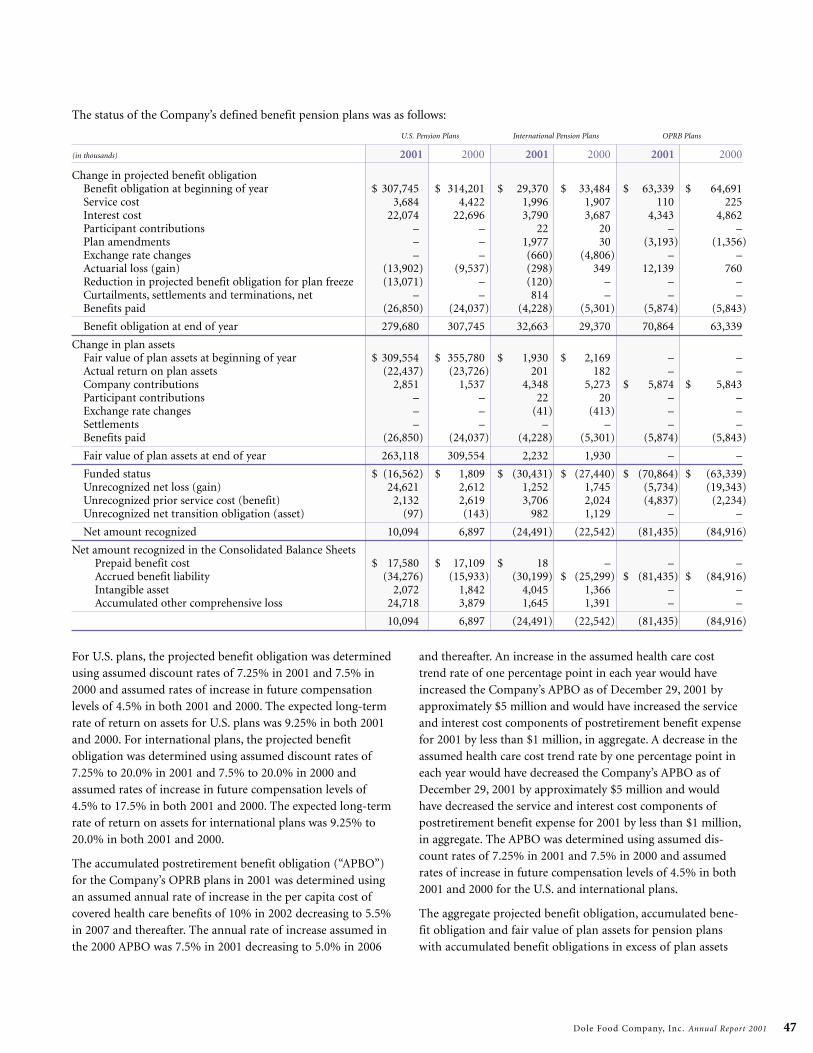
Dole Food Company, Inc. Annual Report 2001 47
The status of the Company’s defined benefit pension plans was as follows:
U.S. Pension Plans International Pension Plans OPRB Plans
(in thousands) 2001 2000 2001 2000 2001 2000
Change in projected benefit obligationBenefit obligation at beginning of year $ 307,745 $ 314,201 $ 29,370 $ 33,484 $ 63,339 $ 64,691Service cost 3,684 4,422 1,996 1,907 110 225Interest cost 22,074 22,696 3,790 3,687 4,343 4,862Participant contributions – – 22 20 – –Plan amendments – – 1,977 30 (3,193) (1,356)Exchange rate changes – – (660) (4,806) – –Actuarial loss (gain) (13,902) (9,537) (298) 349 12,139 760Reduction in projected benefit obligation for plan freeze (13,071) – (120) – – –Curtailments, settlements and terminations, net – – 814 – – –Benefits paid (26,850) (24,037) (4,228) (5,301) (5,874) (5,843)
Benefit obligation at end of year 279,680 307,745 32,663 29,370 70,864 63,339
Change in plan assetsFair value of plan assets at beginning of year $ 309,554 $ 355,780 $ 1,930 $ 2,169 – –Actual return on plan assets (22,437) (23,726) 201 182 – –Company contributions 2,851 1,537 4,348 5,273 $ 5,874 $ 5,843Participant contributions – – 22 20 – –Exchange rate changes – – (41) (413) – –Settlements – – – – – –Benefits paid (26,850) (24,037) (4,228) (5,301) (5,874) (5,843)
Fair value of plan assets at end of year 263,118 309,554 2,232 1,930 – –
Funded status $ (16,562) $ 1,809 $ (30,431) $ (27,440) $ (70,864) $ (63,339)Unrecognized net loss (gain) 24,621 2,612 1,252 1,745 (5,734) (19,343)Unrecognized prior service cost (benefit) 2,132 2,619 3,706 2,024 (4,837) (2,234)Unrecognized net transition obligation (asset) (97) (143) 982 1,129 – –
Net amount recognized 10,094 6,897 (24,491) (22,542) (81,435) (84,916)
Net amount recognized in the Consolidated Balance SheetsPrepaid benefit cost $ 17,580 $ 17,109 $ 18 – – –Accrued benefit liability (34,276) (15,933) (30,199) $ (25,299) $ (81,435) $ (84,916)Intangible asset 2,072 1,842 4,045 1,366 – –Accumulated other comprehensive loss 24,718 3,879 1,645 1,391 – –
10,094 6,897 (24,491) (22,542) (81,435) (84,916)
For U.S. plans, the projected benefit obligation was determinedusing assumed discount rates of 7.25% in 2001 and 7.5% in2000 and assumed rates of increase in future compensationlevels of 4.5% in both 2001 and 2000. The expected long-termrate of return on assets for U.S. plans was 9.25% in both 2001and 2000. For international plans, the projected benefitobligation was determined using assumed discount rates of7.25% to 20.0% in 2001 and 7.5% to 20.0% in 2000 andassumed rates of increase in future compensation levels of4.5% to 17.5% in both 2001 and 2000. The expected long-termrate of return on assets for international plans was 9.25% to20.0% in both 2001 and 2000.
The accumulated postretirement benefit obligation (“APBO”)for the Company’s OPRB plans in 2001 was determined usingan assumed annual rate of increase in the per capita cost ofcovered health care benefits of 10% in 2002 decreasing to 5.5%in 2007 and thereafter. The annual rate of increase assumed inthe 2000 APBO was 7.5% in 2001 decreasing to 5.0% in 2006
and thereafter. An increase in the assumed health care costtrend rate of one percentage point in each year would haveincreased the Company’s APBO as of December 29, 2001 byapproximately $5 million and would have increased the serviceand interest cost components of postretirement benefit expensefor 2001 by less than $1 million, in aggregate. A decrease in theassumed health care cost trend rate by one percentage point ineach year would have decreased the Company’s APBO as ofDecember 29, 2001 by approximately $5 million and wouldhave decreased the service and interest cost components ofpostretirement benefit expense for 2001 by less than $1 million,in aggregate. The APBO was determined using assumed dis-count rates of 7.25% in 2001 and 7.5% in 2000 and assumedrates of increase in future compensation levels of 4.5% in both2001 and 2000 for the U.S. and international plans.
The aggregate projected benefit obligation, accumulated bene-fit obligation and fair value of plan assets for pension planswith accumulated benefit obligations in excess of plan assets
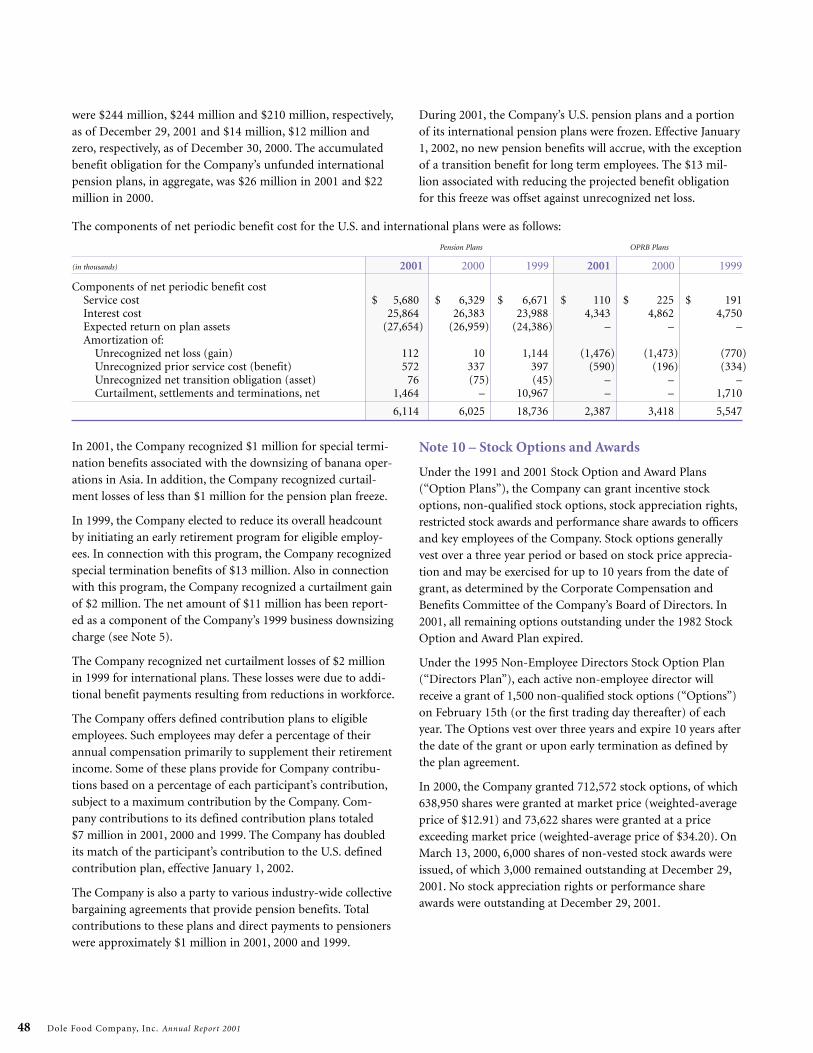
were $244 million, $244 million and $210 million, respectively,as of December 29, 2001 and $14 million, $12 million andzero, respectively, as of December 30, 2000. The accumulatedbenefit obligation for the Company’s unfunded internationalpension plans, in aggregate, was $26 million in 2001 and $22million in 2000.
Dole Food Company, Inc. Annual Report 2001 48
The components of net periodic benefit cost for the U.S. and international plans were as follows:
Pension Plans OPRB Plans
(in thousands) 2001 2000 1999 2001 2000 1999
Components of net periodic benefit costService cost $ 5,680 $ 6,329 $ 6,671 $ 110 $ 225 $ 191Interest cost 25,864 26,383 23,988 4,343 4,862 4,750Expected return on plan assets (27,654) (26,959) (24,386) – – –Amortization of:
Unrecognized net loss (gain) 112 10 1,144 (1,476) (1,473) (770)Unrecognized prior service cost (benefit) 572 337 397 (590) (196) (334)Unrecognized net transition obligation (asset) 76 (75) (45) – – –Curtailment, settlements and terminations, net 1,464 – 10,967 – – 1,710
6,114 6,025 18,736 2,387 3,418 5,547
During 2001, the Company’s U.S. pension plans and a portionof its international pension plans were frozen. Effective January1, 2002, no new pension benefits will accrue, with the exceptionof a transition benefit for long term employees. The $13 mil-lion associated with reducing the projected benefit obligationfor this freeze was offset against unrecognized net loss.
In 2001, the Company recognized $1 million for special termi-nation benefits associated with the downsizing of banana oper-ations in Asia. In addition, the Company recognized curtail-ment losses of less than $1 million for the pension plan freeze.
In 1999, the Company elected to reduce its overall headcountby initiating an early retirement program for eligible employ-ees. In connection with this program, the Company recognizedspecial termination benefits of $13 million. Also in connectionwith this program, the Company recognized a curtailment gainof $2 million. The net amount of $11 million has been report-ed as a component of the Company’s 1999 business downsizingcharge (see Note 5).
The Company recognized net curtailment losses of $2 millionin 1999 for international plans. These losses were due to addi-tional benefit payments resulting from reductions in workforce.
The Company offers defined contribution plans to eligibleemployees. Such employees may defer a percentage of theirannual compensation primarily to supplement their retirementincome. Some of these plans provide for Company contribu-tions based on a percentage of each participant’s contribution,subject to a maximum contribution by the Company. Com-pany contributions to its defined contribution plans totaled $7 million in 2001, 2000 and 1999. The Company has doubledits match of the participant’s contribution to the U.S. definedcontribution plan, effective January 1, 2002.
The Company is also a party to various industry-wide collectivebargaining agreements that provide pension benefits. Totalcontributions to these plans and direct payments to pensionerswere approximately $1 million in 2001, 2000 and 1999.
Note 10 – Stock Options and Awards
Under the 1991 and 2001 Stock Option and Award Plans (“Option Plans”), the Company can grant incentive stockoptions, non-qualified stock options, stock appreciation rights,restricted stock awards and performance share awards to officersand key employees of the Company. Stock options generallyvest over a three year period or based on stock price apprecia-tion and may be exercised for up to 10 years from the date ofgrant, as determined by the Corporate Compensation andBenefits Committee of the Company’s Board of Directors. In2001, all remaining options outstanding under the 1982 StockOption and Award Plan expired.
Under the 1995 Non-Employee Directors Stock Option Plan(“Directors Plan”), each active non-employee director willreceive a grant of 1,500 non-qualified stock options (“Options”)on February 15th (or the first trading day thereafter) of eachyear. The Options vest over three years and expire 10 years afterthe date of the grant or upon early termination as defined bythe plan agreement.
In 2000, the Company granted 712,572 stock options, of which638,950 shares were granted at market price (weighted-averageprice of $12.91) and 73,622 shares were granted at a priceexceeding market price (weighted-average price of $34.20). OnMarch 13, 2000, 6,000 shares of non-vested stock awards wereissued, of which 3,000 remained outstanding at December 29,2001. No stock appreciation rights or performance shareawards were outstanding at December 29, 2001.
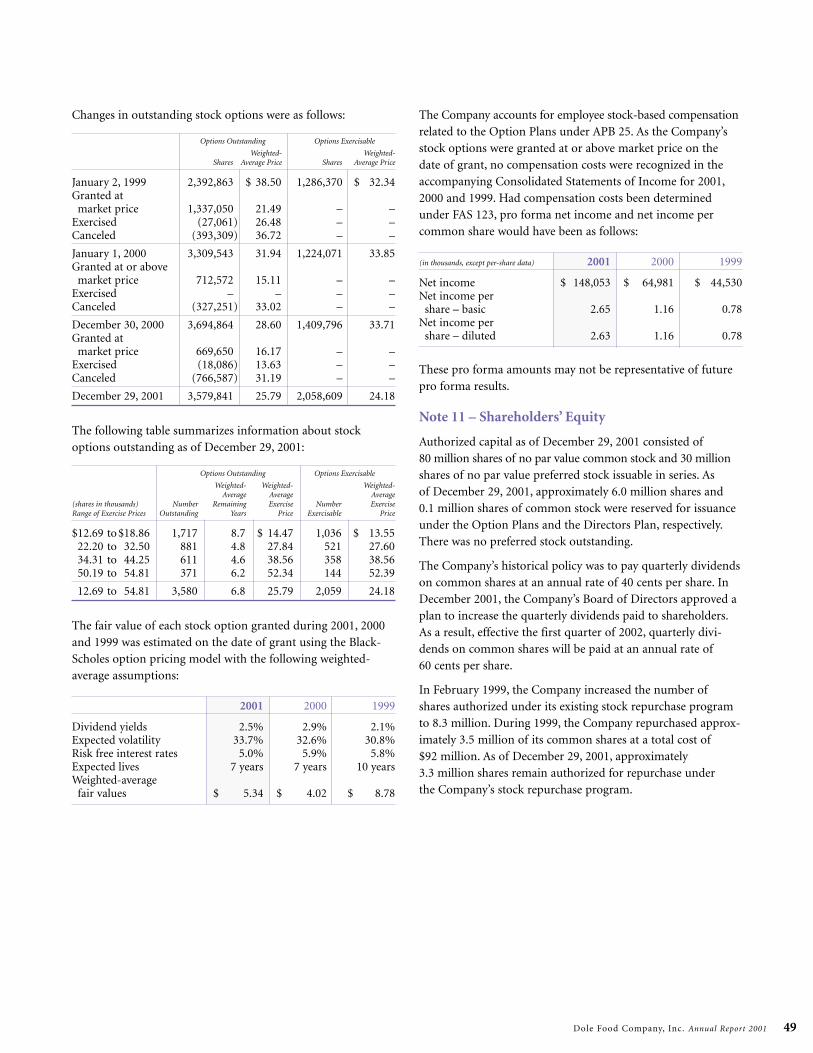
Dole Food Company, Inc. Annual Report 2001 49
Changes in outstanding stock options were as follows:
Options Outstanding Options Exercisable
Weighted- Weighted-Shares Average Price Shares Average Price
January 2, 1999 2,392,863 $ 38.50 1,286,370 $ 32.34Granted at
market price 1,337,050 21.49 – –Exercised (27,061) 26.48 – –Canceled (393,309) 36.72 – –
January 1, 2000 3,309,543 31.94 1,224,071 33.85Granted at or above
market price 712,572 15.11 – –Exercised – – – –Canceled (327,251) 33.02 – –
December 30, 2000 3,694,864 28.60 1,409,796 33.71Granted at
market price 669,650 16.17 – –Exercised (18,086) 13.63 – –Canceled (766,587) 31.19 – –
December 29, 2001 3,579,841 25.79 2,058,609 24.18
The following table summarizes information about stockoptions outstanding as of December 29, 2001:
Options Outstanding Options Exercisable
Weighted- Weighted- Weighted-Average Average Average
(shares in thousands) Number Remaining Exercise Number ExerciseRange of Exercise Prices Outstanding Years Price Exercisable Price
$12.69 to $18.86 1,717 8.7 $ 14.47 1,036 $ 13.5522.20 to 32.50 881 4.8 27.84 521 27.6034.31 to 44.25 611 4.6 38.56 358 38.5650.19 to 54.81 371 6.2 52.34 144 52.39
12.69 to 54.81 3,580 6.8 25.79 2,059 24.18
The fair value of each stock option granted during 2001, 2000and 1999 was estimated on the date of grant using the Black-Scholes option pricing model with the following weighted-average assumptions:
2001 2000 1999
Dividend yields 2.5% 2.9% 2.1%Expected volatility 33.7% 32.6% 30.8%Risk free interest rates 5.0% 5.9% 5.8%Expected lives 7 years 7 years 10 yearsWeighted-average
fair values $ 5.34 $ 4.02 $ 8.78
The Company accounts for employee stock-based compensationrelated to the Option Plans under APB 25. As the Company’sstock options were granted at or above market price on thedate of grant, no compensation costs were recognized in theaccompanying Consolidated Statements of Income for 2001,2000 and 1999. Had compensation costs been determinedunder FAS 123, pro forma net income and net income percommon share would have been as follows:
(in thousands, except per-share data) 2001 2000 1999
Net income $ 148,053 $ 64,981 $ 44,530Net income per
share – basic 2.65 1.16 0.78Net income per
share – diluted 2.63 1.16 0.78
These pro forma amounts may not be representative of futurepro forma results.
Note 11 – Shareholders’ Equity
Authorized capital as of December 29, 2001 consisted of80 million shares of no par value common stock and 30 millionshares of no par value preferred stock issuable in series. As of December 29, 2001, approximately 6.0 million shares and 0.1 million shares of common stock were reserved for issuanceunder the Option Plans and the Directors Plan, respectively.There was no preferred stock outstanding.
The Company’s historical policy was to pay quarterly dividendson common shares at an annual rate of 40 cents per share. InDecember 2001, the Company’s Board of Directors approved aplan to increase the quarterly dividends paid to shareholders.As a result, effective the first quarter of 2002, quarterly divi-dends on common shares will be paid at an annual rate of60 cents per share.
In February 1999, the Company increased the number ofshares authorized under its existing stock repurchase programto 8.3 million. During 1999, the Company repurchased approx-imately 3.5 million of its common shares at a total cost of$92 million. As of December 29, 2001, approximately 3.3 million shares remain authorized for repurchase under the Company’s stock repurchase program.
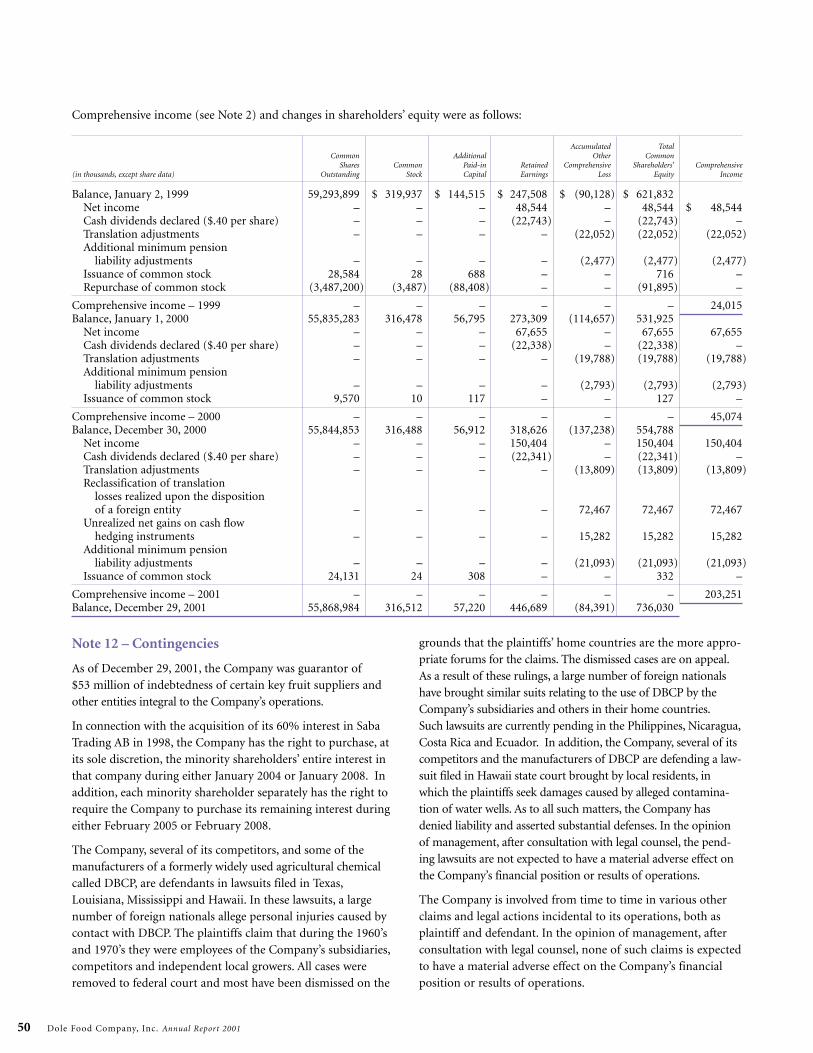
Comprehensive income (see Note 2) and changes in shareholders’ equity were as follows:
Accumulated TotalCommon Additional Other Common
Shares Common Paid-in Retained Comprehensive Shareholders’ Comprehensive(in thousands, except share data) Outstanding Stock Capital Earnings Loss Equity Income
Balance, January 2, 1999 59,293,899 $ 319,937 $ 144,515 $ 247,508 $ (90,128) $ 621,832Net income – – – 48,544 – 48,544 $ 48,544Cash dividends declared ($.40 per share) – – – (22,743) – (22,743) –Translation adjustments – – – – (22,052) (22,052) (22,052)Additional minimum pension
liability adjustments – – – – (2,477) (2,477) (2,477)Issuance of common stock 28,584 28 688 – – 716 –Repurchase of common stock (3,487,200) (3,487) (88,408) – – (91,895) –
Comprehensive income – 1999 – – – – – – 24,015Balance, January 1, 2000 55,835,283 316,478 56,795 273,309 (114,657) 531,925
Net income – – – 67,655 – 67,655 67,655Cash dividends declared ($.40 per share) – – – (22,338) – (22,338) –Translation adjustments – – – – (19,788) (19,788) (19,788)Additional minimum pension
liability adjustments – – – – (2,793) (2,793) (2,793)Issuance of common stock 9,570 10 117 – – 127 –
Comprehensive income – 2000 – – – – – – 45,074Balance, December 30, 2000 55,844,853 316,488 56,912 318,626 (137,238) 554,788
Net income – – – 150,404 – 150,404 150,404Cash dividends declared ($.40 per share) – – – (22,341) – (22,341) –Translation adjustments – – – – (13,809) (13,809) (13,809)Reclassification of translation
losses realized upon the disposition of a foreign entity – – – – 72,467 72,467 72,467
Unrealized net gains on cash flow hedging instruments – – – – 15,282 15,282 15,282
Additional minimum pension liability adjustments – – – – (21,093) (21,093) (21,093)
Issuance of common stock 24,131 24 308 – – 332 –
Comprehensive income – 2001 – – – – – – 203,251Balance, December 29, 2001 55,868,984 316,512 57,220 446,689 (84,391) 736,030
Dole Food Company, Inc. Annual Report 2001 50
Note 12 – Contingencies
As of December 29, 2001, the Company was guarantor of$53 million of indebtedness of certain key fruit suppliers andother entities integral to the Company’s operations.
In connection with the acquisition of its 60% interest in SabaTrading AB in 1998, the Company has the right to purchase, atits sole discretion, the minority shareholders’ entire interest inthat company during either January 2004 or January 2008. Inaddition, each minority shareholder separately has the right torequire the Company to purchase its remaining interest duringeither February 2005 or February 2008.
The Company, several of its competitors, and some of the manufacturers of a formerly widely used agricultural chemicalcalled DBCP, are defendants in lawsuits filed in Texas,Louisiana, Mississippi and Hawaii. In these lawsuits, a largenumber of foreign nationals allege personal injuries caused bycontact with DBCP. The plaintiffs claim that during the 1960’sand 1970’s they were employees of the Company’s subsidiaries,competitors and independent local growers. All cases wereremoved to federal court and most have been dismissed on the
grounds that the plaintiffs’ home countries are the more appro-priate forums for the claims. The dismissed cases are on appeal.As a result of these rulings, a large number of foreign nationalshave brought similar suits relating to the use of DBCP by theCompany’s subsidiaries and others in their home countries.Such lawsuits are currently pending in the Philippines, Nicaragua,Costa Rica and Ecuador. In addition, the Company, several of itscompetitors and the manufacturers of DBCP are defending a law-suit filed in Hawaii state court brought by local residents, inwhich the plaintiffs seek damages caused by alleged contamina-tion of water wells. As to all such matters, the Company hasdenied liability and asserted substantial defenses. In the opinionof management, after consultation with legal counsel, the pend-ing lawsuits are not expected to have a material adverse effect onthe Company’s financial position or results of operations.
The Company is involved from time to time in various otherclaims and legal actions incidental to its operations, both asplaintiff and defendant. In the opinion of management, afterconsultation with legal counsel, none of such claims is expectedto have a material adverse effect on the Company’s financialposition or results of operations.
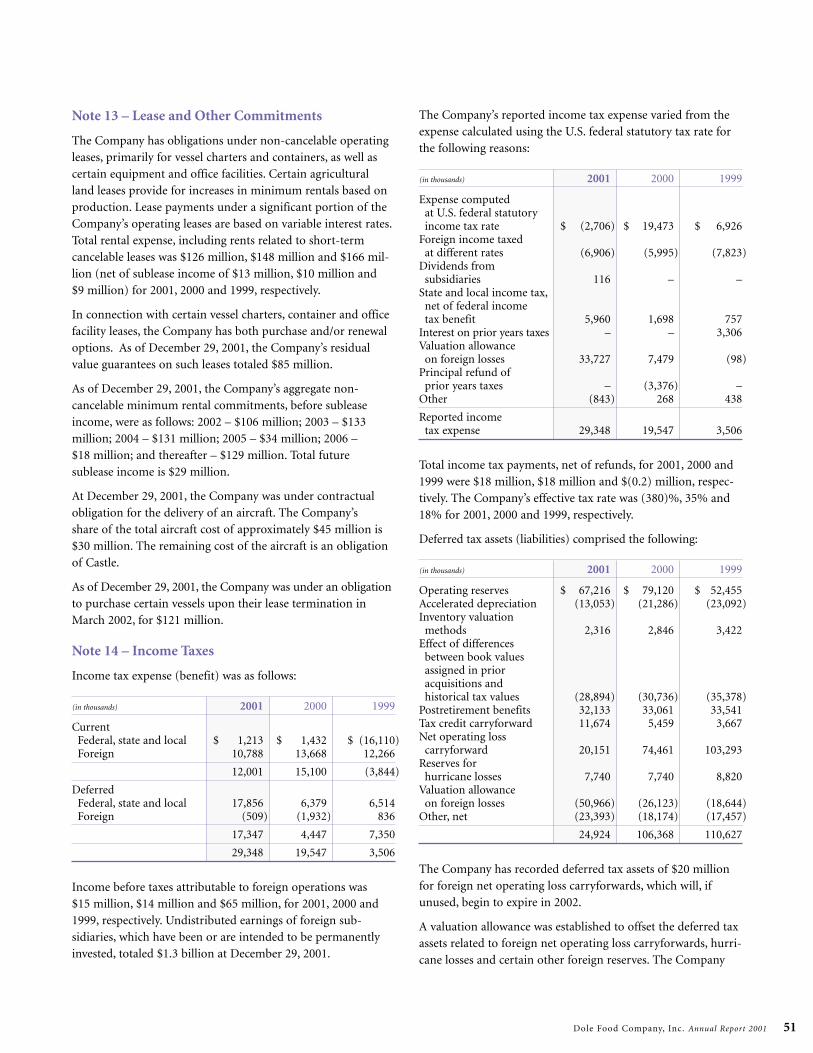
Dole Food Company, Inc. Annual Report 2001 51
Note 13 – Lease and Other Commitments
The Company has obligations under non-cancelable operatingleases, primarily for vessel charters and containers, as well ascertain equipment and office facilities. Certain agricultural land leases provide for increases in minimum rentals based onproduction. Lease payments under a significant portion of theCompany’s operating leases are based on variable interest rates.Total rental expense, including rents related to short-term cancelable leases was $126 million, $148 million and $166 mil-lion (net of sublease income of $13 million, $10 million and $9 million) for 2001, 2000 and 1999, respectively.
In connection with certain vessel charters, container and officefacility leases, the Company has both purchase and/or renewaloptions. As of December 29, 2001, the Company’s residualvalue guarantees on such leases totaled $85 million.
As of December 29, 2001, the Company’s aggregate non-cancelable minimum rental commitments, before subleaseincome, were as follows: 2002 – $106 million; 2003 – $133 million; 2004 – $131 million; 2005 – $34 million; 2006 – $18 million; and thereafter – $129 million. Total future sublease income is $29 million.
At December 29, 2001, the Company was under contractualobligation for the delivery of an aircraft. The Company’s share of the total aircraft cost of approximately $45 million is$30 million. The remaining cost of the aircraft is an obligationof Castle.
As of December 29, 2001, the Company was under an obligationto purchase certain vessels upon their lease termination inMarch 2002, for $121 million.
Note 14 – Income Taxes
Income tax expense (benefit) was as follows:
(in thousands) 2001 2000 1999
CurrentFederal, state and local $ 1,213 $ 1,432 $ (16,110)Foreign 10,788 13,668 12,266
12,001 15,100 (3,844)
DeferredFederal, state and local 17,856 6,379 6,514Foreign (509) (1,932) 836
17,347 4,447 7,350
29,348 19,547 3,506
Income before taxes attributable to foreign operations was $15 million, $14 million and $65 million, for 2001, 2000 and1999, respectively. Undistributed earnings of foreign sub-sidiaries, which have been or are intended to be permanentlyinvested, totaled $1.3 billion at December 29, 2001.
The Company’s reported income tax expense varied from theexpense calculated using the U.S. federal statutory tax rate forthe following reasons:
(in thousands) 2001 2000 1999
Expense computed at U.S. federal statutory income tax rate $ (2,706) $ 19,473 $ 6,926
Foreign income taxed at different rates (6,906) (5,995) (7,823)
Dividends from subsidiaries 116 – –
State and local income tax,net of federal income tax benefit 5,960 1,698 757
Interest on prior years taxes – – 3,306Valuation allowance
on foreign losses 33,727 7,479 (98)Principal refund of
prior years taxes – (3,376) –Other (843) 268 438
Reported income tax expense 29,348 19,547 3,506
Total income tax payments, net of refunds, for 2001, 2000 and1999 were $18 million, $18 million and $(0.2) million, respec-tively. The Company’s effective tax rate was (380)%, 35% and18% for 2001, 2000 and 1999, respectively.
Deferred tax assets (liabilities) comprised the following:
(in thousands) 2001 2000 1999
Operating reserves $ 67,216 $ 79,120 $ 52,455Accelerated depreciation (13,053) (21,286) (23,092)Inventory valuation
methods 2,316 2,846 3,422Effect of differences
between book values assigned in prior acquisitions and historical tax values (28,894) (30,736) (35,378)
Postretirement benefits 32,133 33,061 33,541Tax credit carryforward 11,674 5,459 3,667Net operating loss
carryforward 20,151 74,461 103,293Reserves for
hurricane losses 7,740 7,740 8,820Valuation allowance
on foreign losses (50,966) (26,123) (18,644)Other, net (23,393) (18,174) (17,457)
24,924 106,368 110,627
The Company has recorded deferred tax assets of $20 millionfor foreign net operating loss carryforwards, which will, ifunused, begin to expire in 2002.
A valuation allowance was established to offset the deferred taxassets related to foreign net operating loss carryforwards, hurri-cane losses and certain other foreign reserves. The Company
has deemed it more likely than not that future taxable incomein the relevant foreign taxing jurisdictions will not be sufficientto realize the related income tax benefits for these assets.
The tax credit carryforward amount of $12 million is primarilycomprised of foreign tax credits, which can be utilized toreduce regular tax liabilities, which will, if unused, begin toexpire in 2006.
Total deferred tax assets and deferred tax liabilities were as follows:
(in thousands) 2001 2000 1999
Deferred tax assets $ 172,147 $ 228,688 $ 234,522Deferred tax liabilities (147,223) (122,320) (123,895)
24,924 106,368 110,627
The Company had been contingently liable with respect to cer-tain tax credits sold to Norfolk Southern Railway (“Norfolk”)with recourse by Flexi-Van Leasing, Inc. (“Flexi-Van”), succes-sor corporation to Flexi-Van Corporation, the Company’s for-mer transportation equipment leasing business. Litigation withthe Internal Revenue Service involving these credits concludedin 1998. Flexi-Van and Norfolk have reached a final settlement.Norfolk has also released and discharged Flexi-Van and theCompany from any and all action related to this matter, effec-tive January 29, 2001.
The Company is subject to examination by taxing authorities inthe various jurisdictions in which it files tax returns. Mattersraised upon audit may involve substantial amounts and couldbe material if resolved unfavorably. However, as of December29, 2001, management considered it unlikely that the resolutionof any such matters would have a material adverse effect uponthe Company’s financial condition or results of operations.
Note 15 – Business Segments
The Company has four reportable segments: fresh fruit, freshvegetables, packaged foods, and fresh-cut flowers. The freshfruit segment contains several operating segments that produceand market fresh fruit to wholesale, retail and institutionalcustomers worldwide. The fresh vegetables segment containsthree operating segments that produce and market commodityand fresh-cut vegetables to wholesale, retail and institutionalcustomers primarily in North America, Europe and Asia. Boththe fresh fruit and fresh vegetable segments sell produce grownby a combination of Company-owned and independent farms.The packaged foods segment contains several operatingsegments that produce and market packaged foods includingfruit, juices and snack foods. The Company’s fresh-cut flowerssegment sources, imports and markets fresh-cut flowers grownin Colombia, Ecuador and Mexico primarily to wholesale
florists and supermarkets in the United States. These reportablesegments are managed separately due to differences in theirproducts, production processes, distribution channels, andcustomer bases.
Accounting policies of the four reportable segments, otheroperating segments, and corporate and other are the same asthose described in the summary of significant accounting poli-cies. Company management evaluates and monitors segmentperformance primarily through earnings before interest andtaxes (“EBIT”). The results of operations and financial positionof the four reportable segments, other operating segments, andcorporate and other were as follows:
(in thousands) 2001 2000 1999
RevenueFresh fruit $2,710,394 $2,764,731 $ 2,905,311Fresh vegetables 873,871 885,597 768,869Packaged foods 635,298 614,391 631,677Fresh-cut flowers 196,430 200,562 201,656Other operating segments 33,298 37,243 35,502
4,449,291 4,502,524 4,543,015
EBITFresh fruit $ 48,478 $ 47,297 $ 60,613Fresh vegetables 47,793 77,084 48,092Packaged foods 43,684 56,877 56,352Fresh-cut flowers (18,717) 293 (4,886)Other operating segments (837) (878) 678
Total operating segments 120,401 180,673 160,849Corporate and other (57,423) (39,914) (26,619)Special gains and charges – 5,323 (28,576)
62,978 146,082 105,654
AssetsFresh fruit $1,407,979 $1,494,214 $ 1,657,731Fresh vegetables 340,975 354,279 352,008Packaged foods 355,499 573,864 597,007Fresh-cut flowers 288,142 278,704 263,754Other operating segments 8,963 21,546 18,313
Total operating segments 2,401,558 2,722,607 2,888,813Corporate and other 345,135 78,727 105,678
2,746,693 2,801,334 2,994,491
Depreciation and Amortization
Fresh fruit $ 70,512 $ 77,281 $ 77,187Fresh vegetables 14,557 14,308 14,566Packaged foods 14,006 15,409 14,795Fresh-cut flowers 9,578 9,176 9,795Other operating segments 610 683 484Corporate and other 8,691 8,486 6,676
117,954 125,343 123,503
Capital AdditionsFresh fruit $ 58,853 $ 60,485 $ 87,991Fresh vegetables 16,770 13,012 17,544Packaged foods 10,011 15,766 13,241Fresh-cut flowers 31,297 15,864 5,514Other operating segments 217 1,589 836Corporate and other 2,604 3,839 11,473
119,752 110,555 136,599
Dole Food Company, Inc. Annual Report 2001 52
Dole Food Company, Inc. Annual Report 2001 53
Note: Corporate and other EBIT includes general and adminis-trative costs not allocated to operating segments. Corporateand other EBIT in 2001 included consulting fees related tostrategic and operational review activities, partially offset by a non-operating gain related to the sale of available-for-sale securities. Corporate and other EBIT in 2000 included theinterest portion of a refund received from the Internal RevenueService related to the settlement of disputed items from certainprior years’ audits partially offset by the write-off of certaininvestments and capitalized software costs. Corporate andother EBIT in 1999 included lower expense levels related tobonuses and self-insurance. See Note 5 for details related toother gains and charges.
The Company’s revenue from external customers and net prop-erty, plant and equipment by geographic area were as follows:
(in thousands) 2001 2000 1999
RevenueUnited States $2,180,414 $2,128,946 $ 1,946,001Japan 516,317 594,823 575,494Sweden 353,092 362,854 421,153Germany 311,629 307,571 369,319France 149,097 164,453 212,894Italy 101,010 90,051 105,494Other international 837,732 853,826 912,660
4,449,291 4,502,524 4,543,015
(in thousands) 2001 2000 1999
Property, plant and equipment – net
United States $ 327,252 $ 350,508 $ 390,651Costa Rica 78,549 91,861 97,714Philippines 76,978 70,775 75,224Oceangoing assets 76,597 62,261 71,710Ecuador 67,287 60,333 43,196Colombia 66,978 91,217 101,178Other international 212,183 238,685 251,562
905,824 965,640 1,031,235
Note 16 – Related Party Transactions
The Company’s policy permits it to have arms-length transac-tions with related parties.
David H. Murdock owns Castle as well as a transportationequipment leasing company, a private dining club and a privatecountry club, which supply products and provide services tonumerous customers and patrons. During fiscal 2001, 2000 and1999, the Company paid Mr. Murdock’s companies an aggre-gate of approximately $2 million in each year.
The Company and Castle each hold a 50 percent interest in anairplane, which was formerly owned solely by the Company.Under a co-ownership agreement, the Company and Castleagreed that each party would be responsible for the direct costsassociated with its use of the airplane, and that all indirect costswould be equally shared.
Note 17 – Quarterly Financial Information (Unaudited)
The following table presents summarized quarterly results:
First Second Third Fourth(in thousands, except per-share data) Quarter Quarter Quarter Quarter Year
2001Revenue $ 1,056,296 $ 1,163,453 $ 1,247,040 $ 982,502 $ 4,449,291Gross margin 168,059 184,763 74,826 139,862 567,510Net income (loss) from continuing operations 29,455 33,285 (103,902) 4,084 (37,078)Net income from discontinued operations 5,264 3,683 9,146 169,389 187,482
Net income (loss) 34,719 36,968 (94,756) 173,473 150,404
Net income (loss) per common share – dilutedContinuing operations $ 0.53 $ 0.59 $ (1.86) $ 0.07 $ (0.66)Discontinued operations 0.09 0.07 0.16 3.00 3.33
Net income (loss) per common share – diluted 0.62 0.66 (1.70) 3.07 2.67
2000Revenue $ 1,069,465 $ 1,173,868 $ 1,257,969 $ 1,001,222 $ 4,502,524Gross margin 170,972 188,705 146,395 118,256 624,328Net income (loss) from continuing operations 30,647 38,944 (16,123) (17,378) 36,090Net income from discontinued operations 5,791 6,141 8,773 10,860 31,565
Net income (loss) 36,438 45,085 (7,350) (6,518) 67,655
Net income (loss) per common share – dilutedContinuing operations $ 0.55 $ 0.70 $ (0.29) $ (0.31) $ 0.65Discontinued operations 0.10 0.11 0.16 0.19 0.56
Net income (loss) per common share – diluted 0.65 0.81 (0.13) (0.12) 1.21
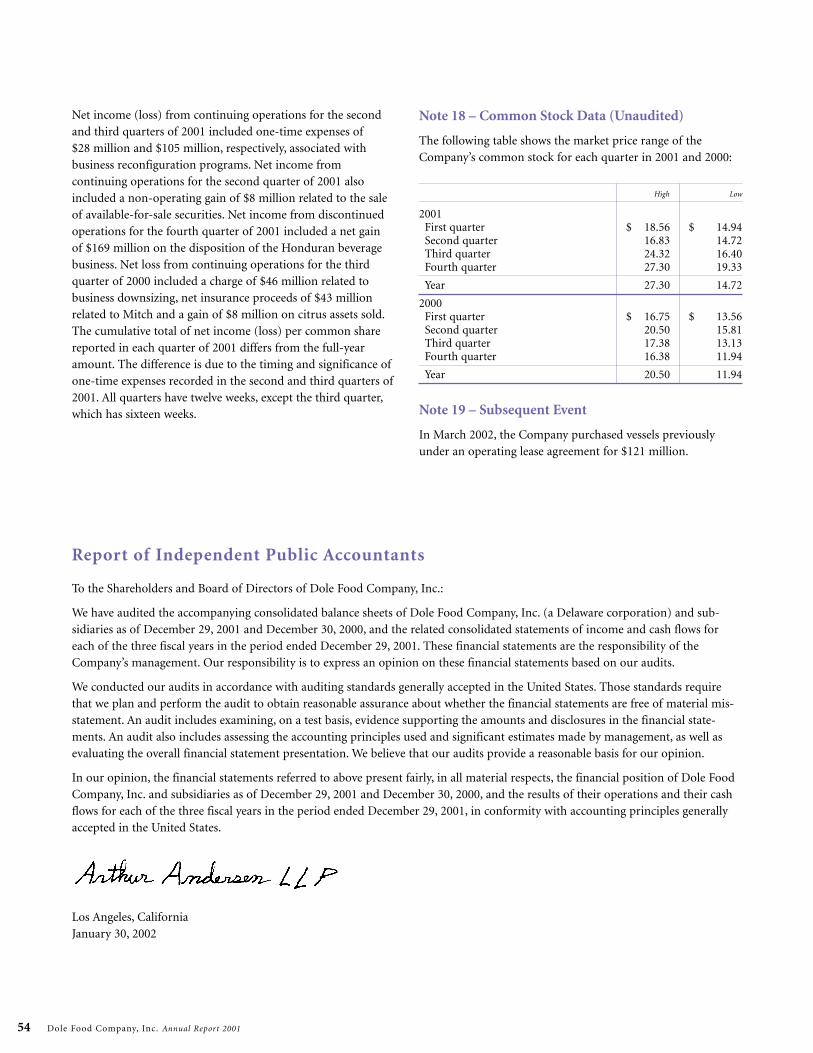
Net income (loss) from continuing operations for the secondand third quarters of 2001 included one-time expenses of$28 million and $105 million, respectively, associated withbusiness reconfiguration programs. Net income fromcontinuing operations for the second quarter of 2001 alsoincluded a non-operating gain of $8 million related to the saleof available-for-sale securities. Net income from discontinuedoperations for the fourth quarter of 2001 included a net gain of $169 million on the disposition of the Honduran beveragebusiness. Net loss from continuing operations for the thirdquarter of 2000 included a charge of $46 million related tobusiness downsizing, net insurance proceeds of $43 millionrelated to Mitch and a gain of $8 million on citrus assets sold.The cumulative total of net income (loss) per common sharereported in each quarter of 2001 differs from the full-yearamount. The difference is due to the timing and significance ofone-time expenses recorded in the second and third quarters of2001. All quarters have twelve weeks, except the third quarter,which has sixteen weeks.
Dole Food Company, Inc. Annual Report 2001 54
Note 18 – Common Stock Data (Unaudited)
The following table shows the market price range of theCompany’s common stock for each quarter in 2001 and 2000:
High Low
2001First quarter $ 18.56 $ 14.94Second quarter 16.83 14.72Third quarter 24.32 16.40Fourth quarter 27.30 19.33
Year 27.30 14.72
2000First quarter $ 16.75 $ 13.56Second quarter 20.50 15.81Third quarter 17.38 13.13Fourth quarter 16.38 11.94
Year 20.50 11.94
Note 19 – Subsequent Event
In March 2002, the Company purchased vessels previouslyunder an operating lease agreement for $121 million.
Report of Independent Public Accountants
To the Shareholders and Board of Directors of Dole Food Company, Inc.:
We have audited the accompanying consolidated balance sheets of Dole Food Company, Inc. (a Delaware corporation) and sub-sidiaries as of December 29, 2001 and December 30, 2000, and the related consolidated statements of income and cash flows foreach of the three fiscal years in the period ended December 29, 2001. These financial statements are the responsibility of theCompany’s management. Our responsibility is to express an opinion on these financial statements based on our audits.
We conducted our audits in accordance with auditing standards generally accepted in the United States. Those standards requirethat we plan and perform the audit to obtain reasonable assurance about whether the financial statements are free of material mis-statement. An audit includes examining, on a test basis, evidence supporting the amounts and disclosures in the financial state-ments. An audit also includes assessing the accounting principles used and significant estimates made by management, as well asevaluating the overall financial statement presentation. We believe that our audits provide a reasonable basis for our opinion.
In our opinion, the financial statements referred to above present fairly, in all material respects, the financial position of Dole FoodCompany, Inc. and subsidiaries as of December 29, 2001 and December 30, 2000, and the results of their operations and their cashflows for each of the three fiscal years in the period ended December 29, 2001, in conformity with accounting principles generallyaccepted in the United States.
Los Angeles, CaliforniaJanuary 30, 2002
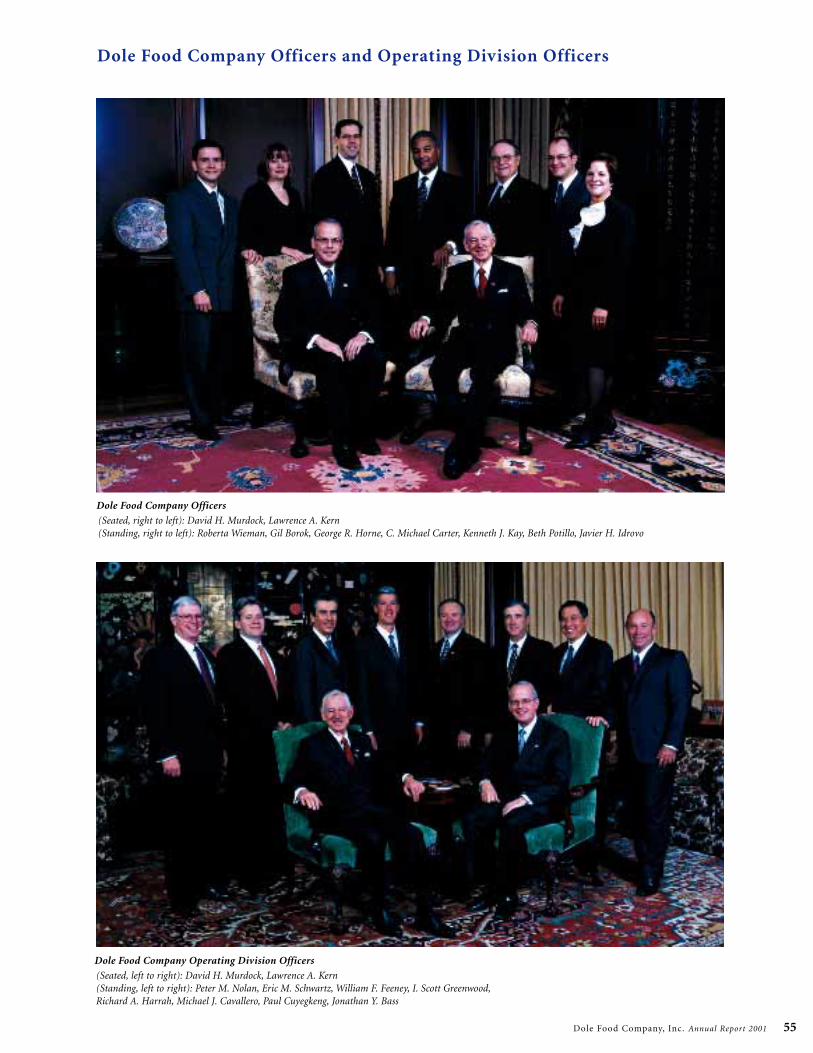
Dole Food Company, Inc. Annual Report 2001 55
Dole Food Company Officers
(Seated, right to left): David H. Murdock, Lawrence A. Kern (Standing, right to left): Roberta Wieman, Gil Borok, George R. Horne, C. Michael Carter, Kenneth J. Kay, Beth Potillo, Javier H. Idrovo
Dole Food Company Operating Division Officers
(Seated, left to right): David H. Murdock, Lawrence A. Kern(Standing, left to right): Peter M. Nolan, Eric M. Schwartz, William F. Feeney, I. Scott Greenwood,Richard A. Harrah, Michael J. Cavallero, Paul Cuyegkeng, Jonathan Y. Bass
Dole Food Company Officers and Operating Division Officers
Dole Food Company, Inc. Annual Report 2001 56
Directors and Officers
Directors
Mike Curb 1, 2, 4
Chairman
Curb Records, Inc.
David A. DeLorenzo
Former Vice Chairman,
President and Chief Operating Officer
Dole Food Company, Inc.
E. Rolland Dickson, M.D. 4
Director for Development
Mayo Foundation
Richard M. Ferry 1, 2, 3
Founder Chairman
Korn/Ferry International
(international executive search firm)
Lawrence M. Johnson 1,3
Chairman and CEO (retired)
Bank of Hawaii
Lawrence A. Kern
President and Chief Operating Officer
Dole Food Company, Inc.
Zoltan Merszei 3, 4
Former Chief Executive Officer,
President and Chairman
The Dow Chemical Company
David H. Murdock 2
Chairman of the Board and
Chief Executive Officer
Dole Food Company, Inc.
Officers
David H. Murdock
Chairman of the Board and
Chief Executive Officer
Lawrence A. Kern
President and Chief Operating Officer
Kenneth J. Kay
Vice President and
Chief Financial Officer
C. Michael Carter
Vice President, General Counsel and
Corporate Secretary
George R. Horne
Vice President – Administration
and Support Operations
Roberta Wieman
Vice President
Gil Borok
Vice President – Controller and
Chief Accounting Officer
Javier H. Idrovo
Vice President – Strategy
Beth Potillo
Treasurer
Operating Division Officers
Paul Cuyegkeng
President – Dole Asia
William F. Feeney
President – Dole Europe
Richard A. Harrah
President – Dole Latin America
Peter M. Nolan
President – Dole Worldwide
Packaged Foods
Eric M. Schwartz
President – Dole Worldwide
Fresh Vegetables
I. Scott Greenwood
President – Dole Fresh Flowers
Michael J. Cavallero
President – Dole North America
Tropical Fresh Fruit
Jonathan Y. Bass
Vice President and General Manager
Dole Chile
1 Nominating Committee
2 Executive and Finance Committee
3 Audit Committee
4 Corporate Compensation and Benefits Committee
Dole Food Company, Inc. Annual Report 2001 29
The Company
Founded in Hawaii in 1851, Dole Food Company, Inc. is the
largest producer and marketer of high-quality fresh fruit,
fresh vegetables and fresh-cut flowers, and markets a growing
line of packaged foods. The Company does business in more
than 90 countries and employs approximately 59,000 full-
time people.
Corporate Headquarters
One Dole Drive, Westlake Village, CA 91362
(818) 879-6600
Auditors
Arthur Andersen LLP
633 West Fifth Street
Los Angeles, CA 90071
Securities Transfer and Dividend Disbursement Agent
American Stock Transfer
& Trust Company
59 Maiden Lane
New York, NY 10007
(800) 937-5449
Internet address: www.amstock.com
Dividend Information
A cash dividend of $0.10 per common share was declared in
each quarter of 2001 for a total annual dividend of $0.40 per
share. Dole Food Company, Inc. does not have a dividend
reinvestment plan.
Investment Community Inquiries
Members of the investment community should direct
inquiries to:
Office of the Chief Financial Officer
Dole Food Company, Inc.
One Dole Drive
Westlake Village, CA 91362
(818) 879-6600
E-mail address:
Shareholder Inquiries
For a copy of the Annual Report on Form 10-K,
or for other information requests, shareholders
should contact:
Office of the Corporate Secretary
Dole Food Company, Inc.
One Dole Drive
Westlake Village, CA 91362
Telephone: (818) 879-6814
Facsimile: (818) 879-6613
E-mail address:
Dole’s Annual Report on Form 10-K
is available on the internet at http://www.dole.com
Stock Exchange
Dole Food Company, Inc.’s common stock (DOL)
is traded on The New York and Pacific Stock Exchanges.
Internet Addresses
http://www.dole.com
http://www.dole5aday.com
Company and Shareholder Information

Dole Food Company, Inc.www.Dole.com