doing business in the united states of america presented by valeria petaeva, commercial specialist,...
TRANSCRIPT

Doing Business in the United States of America
Presented by Valeria Petaeva, Commercial Specialist, CS Prague
Export Festival 2014June 19, 2014

Progress and Innovation Cannot Be Stopped!
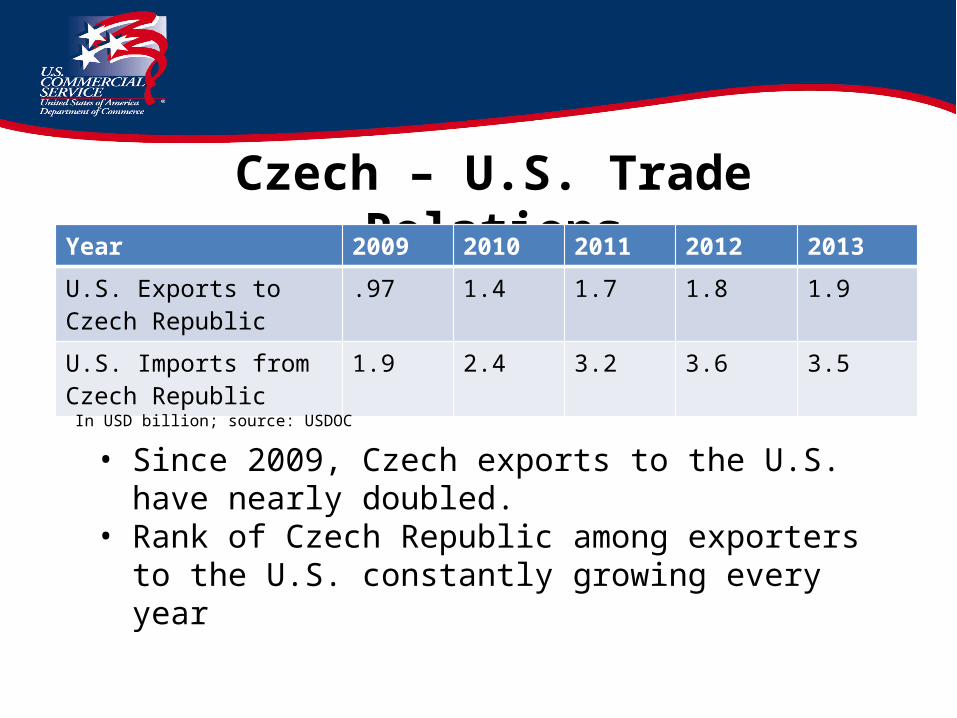
Czech – U.S. Trade RelationsYear 2009 2010 2011 2012 2013
U.S. Exports to Czech Republic
.97 1.4 1.7 1.8 1.9
U.S. Imports from Czech Republic
1.9 2.4 3.2 3.6 3.5
In USD billion; source: USDOC
• Since 2009, Czech exports to the U.S. have nearly doubled.
• Rank of Czech Republic among exporters to the U.S. constantly growing every year

U.S. Imports from Czech Republic 2013
Top 5 Products exported Czech Republic U.S. • Cars (10%)• Vehicle Parts (6.9%)• Computers (6.1%)• Video Displays (1.8%)• Rubber Tires (1.6%)

1. U.S. Commercial Service in Prague
Our Services:
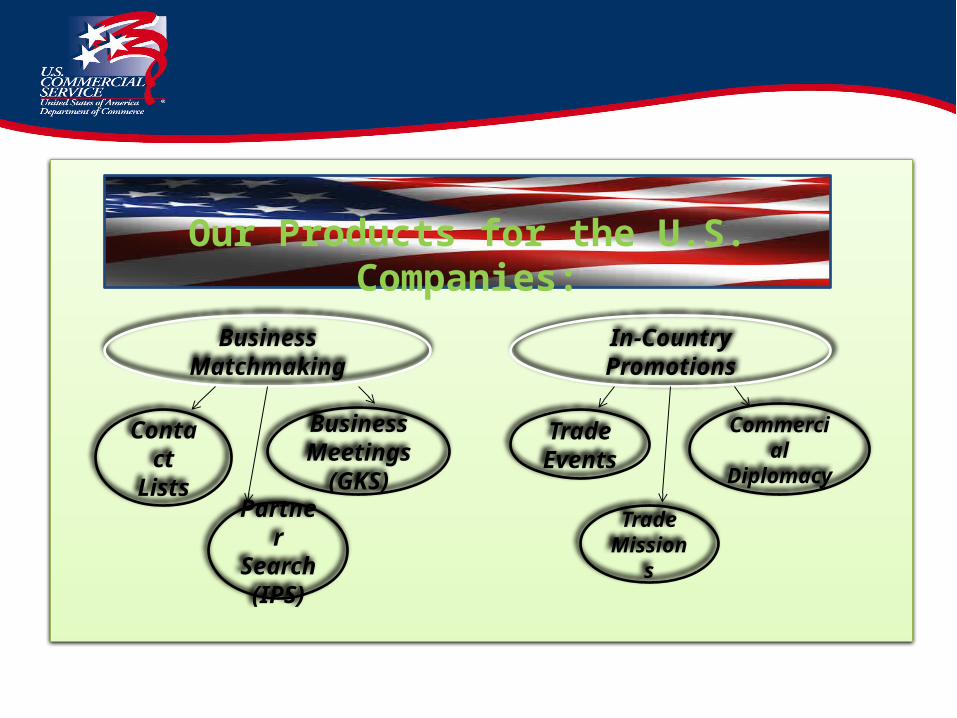
Our Products for the U.S. Companies:
Partner Search (IPS)
Business Meetings
(GKS)
Trade Events
Trade Missions
Contact Lists
Commercial Diplomacy
Business Matchmaking
In-Country Promotions

Our Services:
U.S. Trade Fairs -
International Buyer
Program
Our Products for the Czech Companies: U.S. partners search
Commercial News USA magazine
International Trade Fairs

International Buyer Program (IBP)Show Name Industry When? Where?
2015 International CES ICT January Las Vegas, NVNAHB International Builders' Show Design & Construction January Las Vegas, NVShooting Hunting & Outdoor Trade Show and Conference Defense & Security January Las Vegas, NV
International Production and Processing Expo Agribusiness January Atlanta, GADistribuTECH Conference and Exhibition Energy - Smart Grid February San Diego, CAWorld of Concrete Design & Construction February Las Vegas, NVProgressive Insurance Miami International Boat Show
Ground/Marine Transportation Equipment February Miami, FL
Natural Products Expo West/Engredea Healthcare/Consumer Goods March Anaheim, CAInternational Home + Housewares Show Consumer Goods March Chicago, ILNPE 2015 - The International Plastics Showcase Manufacturing - Plastics March Orlando, FLThe 2015 NAB Show ICT -Broadcasting April Las Vegas, NV2015 Offshore Technology Conference Energy - Oil and Gas May Houston, TXThe National Restaurant Association, Restaurant, Hotel-Motel Show (NRA Show) Agribusiness/Hospitality May Chicago, IL
WasteExpo 2015 Environmental Technologies June Las Vegas, NVInfoComm International 2015 ICT June Orlando, FLInternational Franchise Expo Franchising June New York, NYSummer Fancy Food Show Processed Foods June New York, NYAnnual Meeting and Clinical Laboratory Exposition of the American Association for Clinical Chemistry
Health and Medical July Atlanta, GA
Outdoor Retailer Summer Market Textiles and Apparel/Sporting goods August Salt Lake City, UT
WEFTEC 2015: Water Environment Federation Technical Exhibition and Conference Environmental Technologies September Chicago, IL
PACK EXPO Las Vegas Agribusiness September Las Vegas, NVASIS 2015 International 61st Annual Seminar & Exhibits Security September Anaheim, CA
Greater New York Dental Meeting Health and Medical November New York, NYPOWER-GEN International Energy December Las Vegas, NV
2. Foreign Direct Investment (FDI) SelectUSA

U.S. Open Investment Policy
“The United States reaffirms our open
investment policy, a commitment to treat all
investors in a fair and equitable manner under
the law.” - Statement by the President of the United States, June 20, 2011

About SelectUSASelectUSA’s mission is to promote and facilitate business investment in the United States. It is housed in the U.S. Department of Commerce and represented by the Commercial Service at U.S. Embassies and Consulates around the World.
SelectUSA is geographically neutral and represents the entire United States. It uphold the U.S. open investment policy and performs uniquely federal functions.
Our Clients: U.S. States, Regions, and Localities Companies (investors)
SelectUSA Report: Foreign Direct Investment in the United States: Released on December 31, the report studies FDI in the United States by geography, industry, and economic impact. http://selectusa.commerce.gov/fdi-report

Global FDI Trends
20 largest country recipients by FDI stock in 2012; Currency displayed at current market value.Source: UN Conference on Trade and Development
The United States remainsthe largest recipient of FDI
in the world.
Unite
d State
s
Hong K
ong SAR
Unite
d Kingdom
Fran
ce
Belg
ium
China
Germ
any
Braz
il
Singa
pore
Switz
erlan
d
Can
ada
Spain
Austr
alia
Neth
erlan
ds
Russi
an Fe
deration
Swed
en
Briti
sh Virg
in Islan
ds
Italy
Mex
ico
Irela
nd$0
$500,000
$1,000,000
$1,500,000
$2,000,000
$2,500,000
$3,000,000
$3,500,000
$4,000,000In USD
Millions
$3.9 Trillion
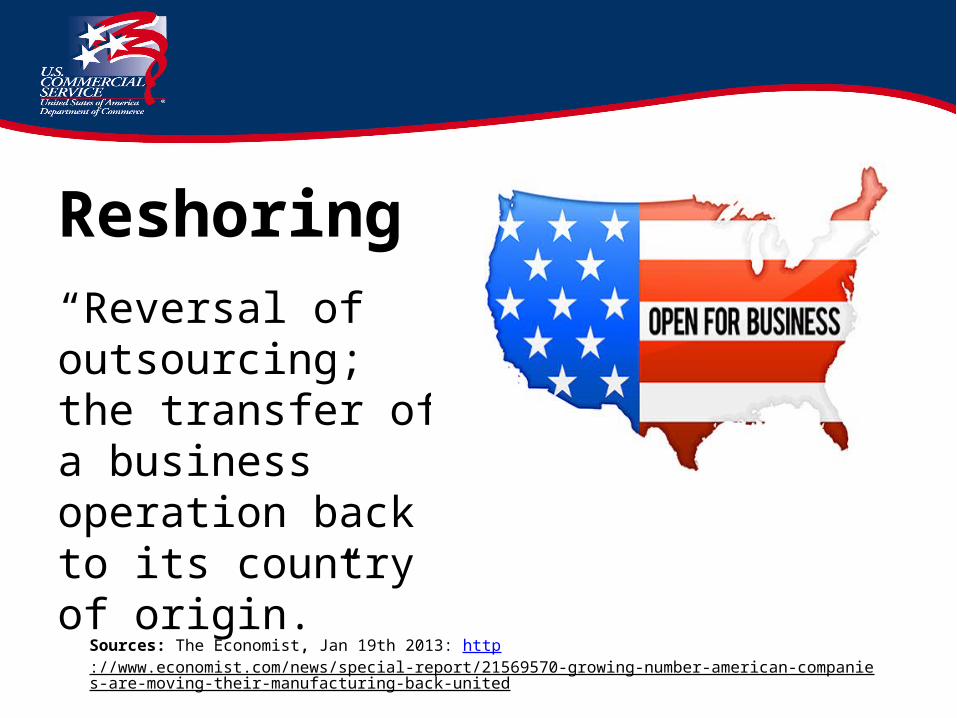
Reshoring
Reshoring“Reversal of outsourcing; the transfer of a business operation back to its country of origin.”
Sources: The Economist, Jan 19th 2013: http://www.economist.com/news/special-report/21569570-growing-number-american-companies-are-moving-their-manufacturing-back-united
Czech investors in the U.S.

3. U.S. Business Climate
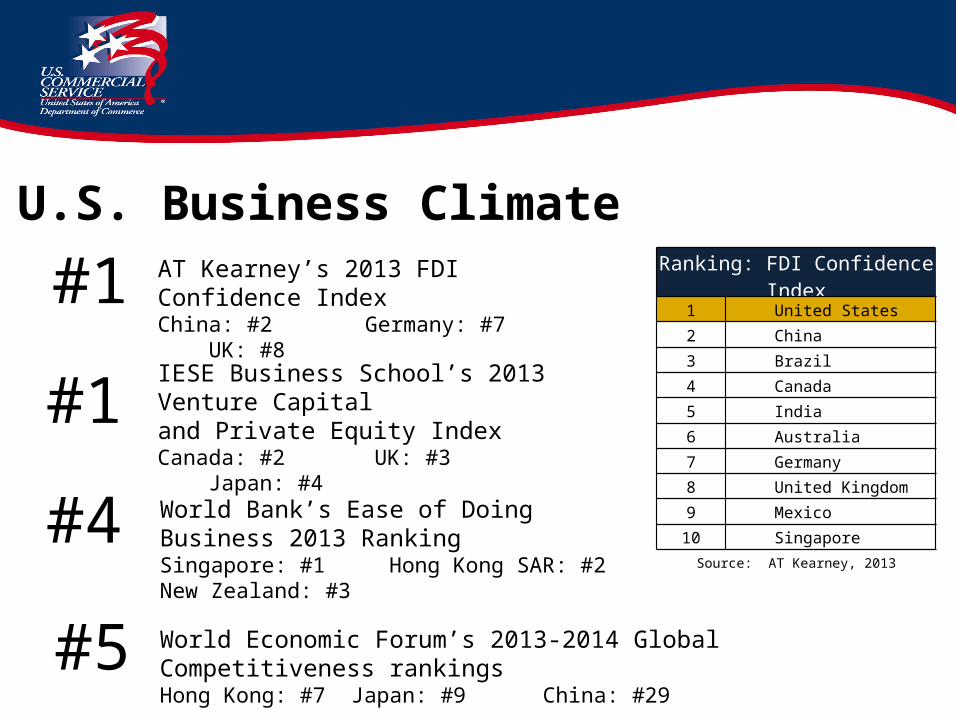
World Economic Forum’s 2013-2014 Global Competitiveness rankingsHong Kong: #7 Japan: #9 China: #29
AT Kearney’s 2013 FDI Confidence IndexChina: #2 Germany: #7 UK: #8#1
#5
#4
IESE Business School’s 2013 Venture Capital and Private Equity IndexCanada: #2 UK: #3 Japan: #4
World Bank’s Ease of Doing Business 2013 RankingSingapore: #1 Hong Kong SAR: #2 New Zealand: #3
#1
Ranking: FDI Confidence Index1 United States
2 China
3 Brazil
4 Canada
5 India
6 Australia
7 Germany
8 United Kingdom
9 Mexico
10 Singapore
Source: AT Kearney, 2013
U.S. Business Climate
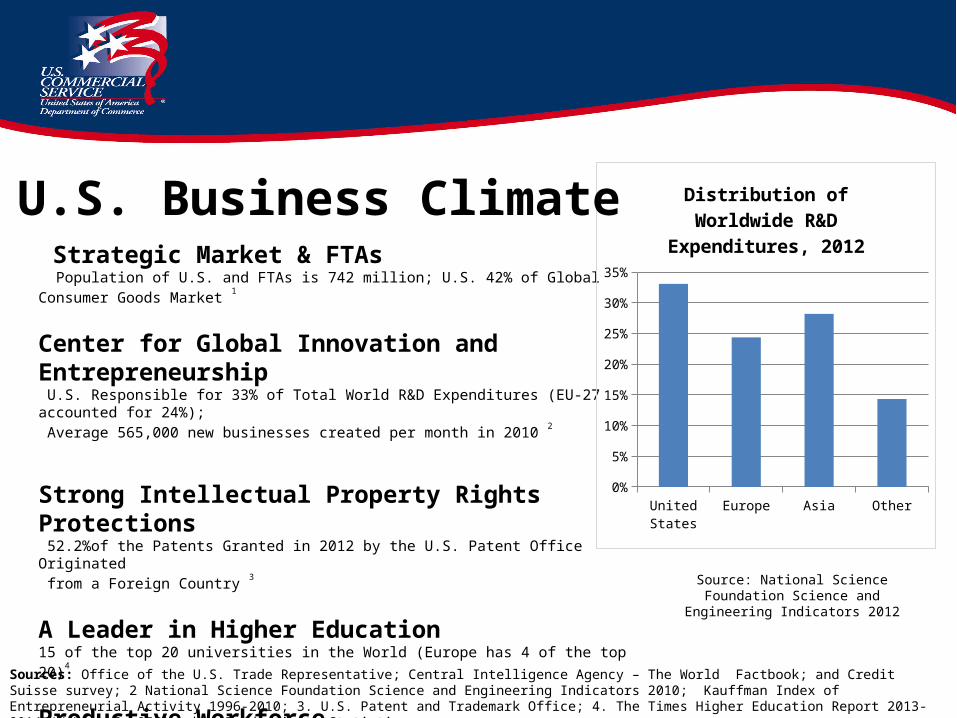
Sources: Office of the U.S. Trade Representative; Central Intelligence Agency – The World Factbook; and Credit Suisse survey; 2 National Science Foundation Science and Engineering Indicators 2010; Kauffman Index of Entrepreneurial Activity 1996-2010; 3. U.S. Patent and Trademark Office; 4. The Times Higher Education Report 2013-2014 (U.K.); 5. OECD Labor Productivity Statistics
Source: National Science Foundation Science and Engineering Indicators 2012
Strategic Market & FTAs Population of U.S. and FTAs is 742 million; U.S. 42% of Global Consumer Goods Market 1
Center for Global Innovation and Entrepreneurship U.S. Responsible for 33% of Total World R&D Expenditures (EU-27 accounted for 24%); Average 565,000 new businesses created per month in 2010 2
Strong Intellectual Property Rights Protections 52.2%of the Patents Granted in 2012 by the U.S. Patent Office Originated from a Foreign Country 3
A Leader in Higher Education15 of the top 20 universities in the World (Europe has 4 of the top 20)4
Productive Workforce U.S. labor productivity grew 1.5% between 2007 and 2012 (France: 0.2%, Germany: 0.3%, UK: -0.6%) 5
Open to People, Cultures, and Ideas
United States Europe Asia Other0%
5%
10%
15%
20%
25%
30%
35%
Distribution of Worldwide R&D Expenditures, 2012U.S. Business Climate
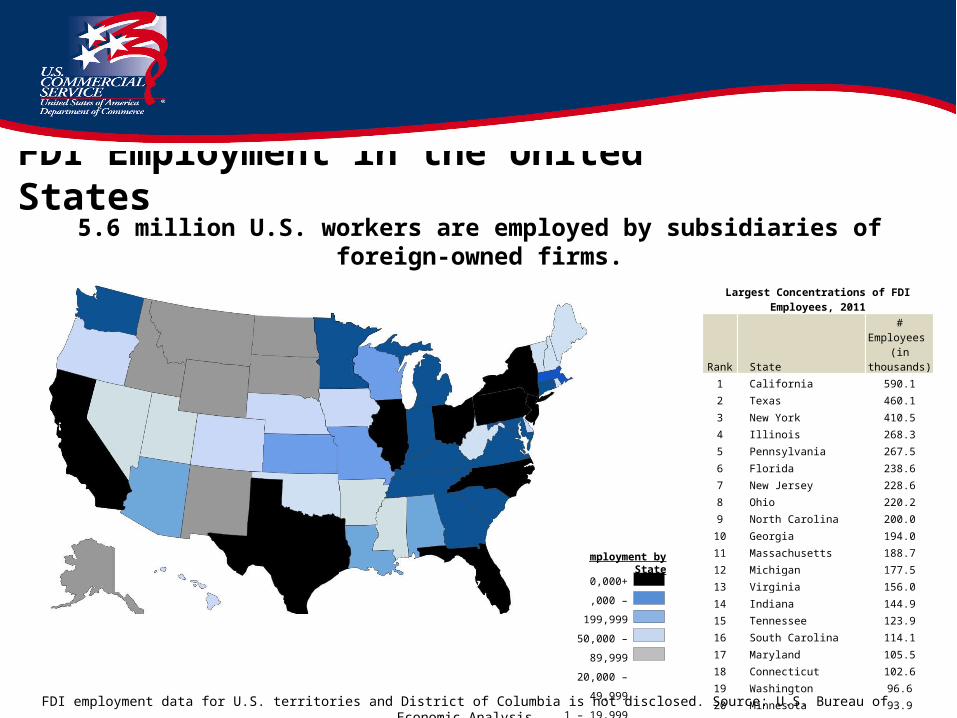
FDI Employment in the United States
Largest Concentrations of FDI Employees, 2011
Rank State# Employees (in thousands)
1 California 590.1
2 Texas 460.1
3 New York 410.5
4 Illinois 268.3
5 Pennsylvania 267.5
6 Florida 238.6
7 New Jersey 228.6
8 Ohio 220.2
9 North Carolina 200.0
10 Georgia 194.0
11 Massachusetts 188.7
12 Michigan 177.5
13 Virginia 156.0
14 Indiana 144.9
15 Tennessee 123.9
16 South Carolina 114.1
17 Maryland 105.5
18 Connecticut 102.6
19 Washington 96.6
20 Minnesota 93.9
FDI employment data for U.S. territories and District of Columbia is not disclosed. Source: U.S. Bureau of Economic Analysis
5.6 million U.S. workers are employed by subsidiaries of foreign-owned firms.
200,000+
90,000 – 199,999
50,000 – 89,999
20,000 – 49,999
1 – 19,999
# FDI Employment by State
Our Services:
Facts we should know about U.S. market:
• Regional approach*

Our Services:
Facts we should know about U.S. market:
State Industrial Hubs
California Silicon Valley, Startup companies, Agriculture, Energy
Texas Green energy, Oil and natural gas production, Aeronautics, Defense, Development of computer components and systems, software
Washington Biotech and aerospace (Boeing) Computer software development (Microsoft, Nintendo of America)Online retailers (Amazon.com, Expedia, Inc.)Electronics, biotechnology, aluminum production, lumber and wood products (Weyerhaeuser)
Florida Cosmetics , Fashion retail stores, Restaurant Chains, Health Sector (Health Management Associates, Blue Cross Blue Shield Association)
Our Services:
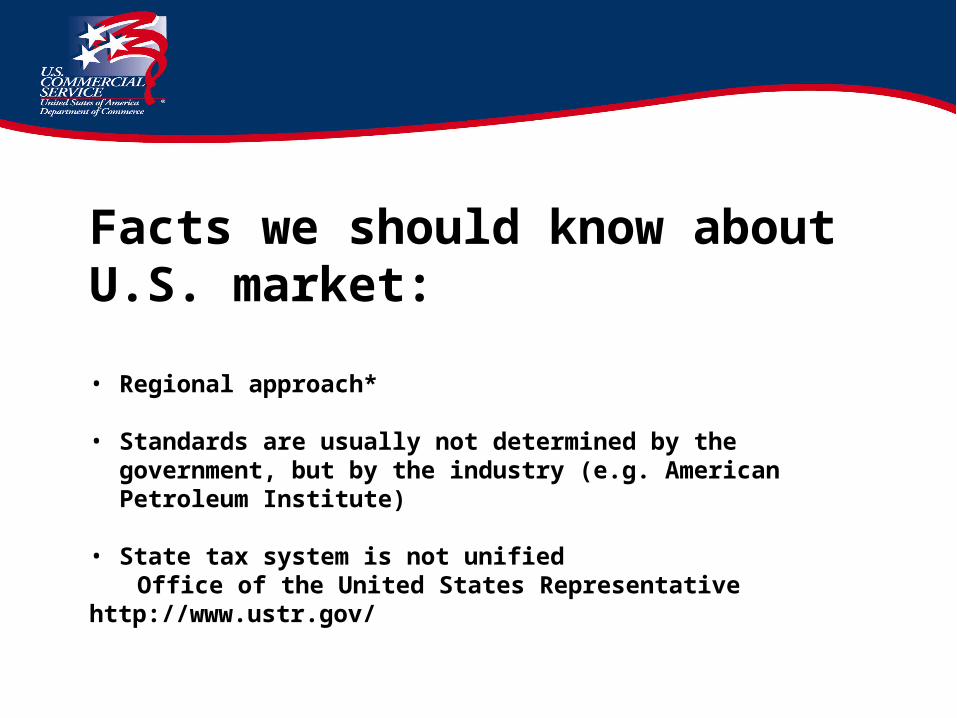
Facts we should know about U.S. market:
• Regional approach*
• Standards are usually not determined by the government, but by the industry (e.g. American Petroleum Institute)
• State tax system is not unified Office of the United States Representative http://www.ustr.gov/
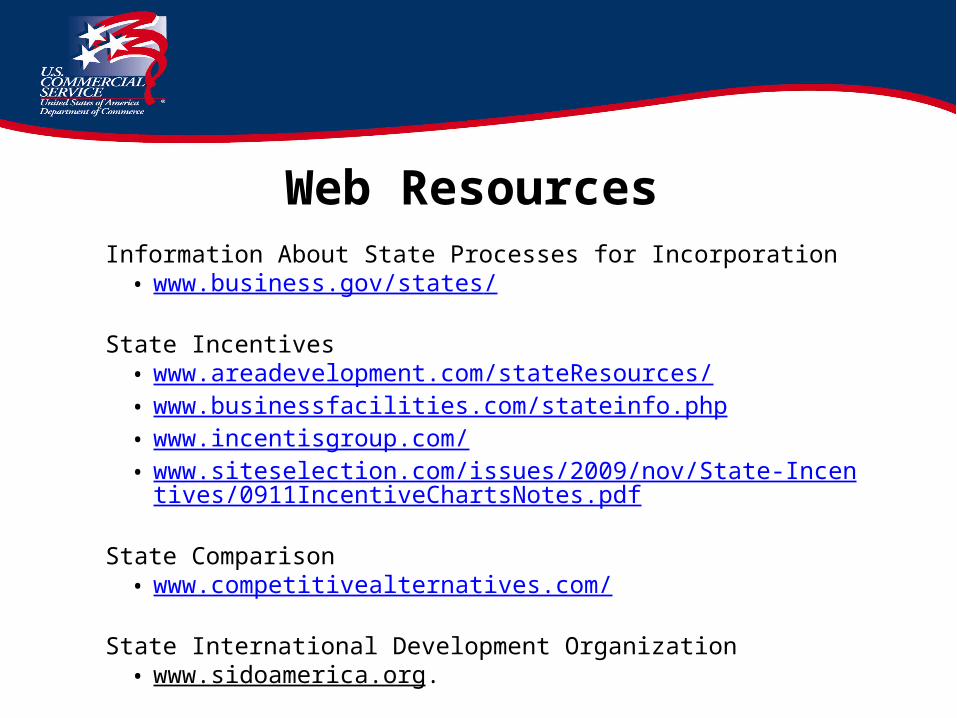
Information About State Processes for Incorporation• www.business.gov/states/
State Incentives • www.areadevelopment.com/stateResources/• www.businessfacilities.com/stateinfo.php• www.incentisgroup.com/• www.siteselection.com/issues/2009/nov/State-Incentives/0911Incentive
ChartsNotes.pdf
State Comparison • www.competitivealternatives.com/
State International Development Organization• www.sidoamerica.org.
Web Resources

Baker and McKenzie’s Legal Guide to Acquisitions and Doing Business in the United States http://digitalcommons.ilr.cornell.edu/cgi/viewcontent.cgi?article=1037&context=lawfirms
Deloitte’s International Business Guide to Investing in the United Stateswww.deloittetaxguides.com/report_dl.asp?mode=pdf&issue_id=241830609&rf=0
HLB International’s Guide to Doing Business in the USAwww.hlbi.com/index.php?option=com_content&view=article&id=37&Itemid=19
U.S. Imports from Czech Republichttp://atlas.media.mit.edu/profile/country/cze/
Web Resources

http://www.buyusa.gov/czechrepublic/
www.SelectUSA.gov
http://www.export.gov
Visit Us on the Web
Follow Us on
