doi:10.1068/p7064 recognizing degraded faces: the...
TRANSCRIPT

Perception, 2012, volume 41, pages 1497 – 1511
doi:10.1068/p7064
Recognizing degraded faces: The contribution of configural and featural cues
Sharon Gilad-Gutnick1,2, Galit Yovel1, Pawan Sinha2
1 The School of Psychological Sciences, Tel-Aviv University, Israel; e-mail: [email protected]; 2 Department of Brain and Cognitive Sciences, Massachusetts Institute of Technology, Cambridge, MA 02139, USA Received 2 July 2012, in revised form 17 October 2012
Abstract. Human face-recognition processes must maintain high levels of performance under different viewing conditions. An important dimension of variability is image resolution, which is affected by distance, refractive errors, and light levels. Here, we investigate how changes in resolution modulate the visual-system’s ability to detect featural versus configural changes in face images. It has been suggested that at lower spatial frequencies the visual system relies predominantly on configural information, yet, to our knowledge, no experiments have systematically examined this idea. We determined subjects’ relative sensitivities to configural and featural changes for systematically degraded images. We show that overall configuration and local features are processed equally well at the different resolution levels, supporting the idea of a holistic face-representation that encompasses both feature shape information and information about the distance between the features. These data have also enabled us to derive lower bounds for the resolution needed to effectively use each type of information. Our data are replicated with a completely different face stimulus set, but are not replicated when subjects were shown houses instead of faces. Overall, these results suggest that at lower spatial frequencies, facial representations embody both configural and featural attributes equally, and provide a platform for investigating the essence of holistic facial representations for low-resolution images.
Keywords: face recognition, features, configuration, spatial frequency, resolution
1 IntroductionOne of most salient aspects of the human visual system is its ability to recognize faces under conditions that drastically reduce image quality. Probing the limits of this ability can provide a valuable understanding of the cognitive processes by which the brain retrieves the identity of a face. Some of the most important and rigorously studied aspects of the face arise from the shape and spacing of the major internal features (eyes, nose, and mouth). While most studies have explored the relative roles of these cues under manipulations less likely to be found in natural settings (eg inversion and high spatial filtering), surprisingly few studies have quantified their contribution under situations that mimic frequently occurring real-world viewing. In this study we measure how performance in detecting internal feature shape and the distances between them is affected by resolution.
The emphasis this study places on investigating face recognition in low-resolution images stems directly from the fact that reducing the amount of information available in an image may provide insights about the critical attributes necessary for face recognition. More specifically, normal viewing conditions are rarely optimal: viewing distances might be large, the optics of the eyes might have refractive errors, and the transparency of the atmosphere might be compromised by haze or smoke. By explicitly focusing on conditions of low spatial frequency, the results of this study are likely to be more applicable to certain aspects of real-world viewing conditions, such as recognizing a face through a hazy lens or from a distance (Loftus and Harley 2005). Such knowledge is potentially significant for the design of artificial vision systems that have to operate under sub-optimal conditions. For instance, an airport face recognition system has to be robust against reductions in resolution

1498 S Gilad-Gutnick, G Yovel, P Sinha
caused by large viewing distances, poor lighting, or motion blur. Additionally, experiments with impoverished images allow us to implicitly characterize the performance of people with low vision. Such information is valuable for developing rehabilitation programs and devices.
A key question in face recognition research pertains to the roles of two sources of information that are available from the internal parts of the face. “Featural cues” (also sometimes referred to as “local cues”) are derived from isolated components of the face, such as the shape and size of the eyes, nose, or mouth; “configural cues” (or “second-order relations”) refer to the metric distances between these elements.(1) In past years, the most common view has been that information about spacing between the parts in a face is coded separately from local shape cues, as was suggested by their differential effect on performance under various spatial manipulations (Bruce et al 1991, 1994; Carey and Diamond 1977; Ellis et al 1979; Haig 1984). To test such assumptions, numerous studies have created two sets of faces that differ from one another, either only in the spacing of individual features or only in local information by changing the shape, color, or luminance of features (for review see McKone and Yovel 2009; Maurer et al 2002; Peterson and Rhodes 2006). Such manipulations have been measured under different viewing conditions, including facial inversion (see Maurer et al 2002 for review; Freire et al 2000; Le Grand et al 2001; McKone and Yovel 2009; Rhodes and Tremewan 1994; Sekuler et al 2004) and spatial-frequency filtering (Harmon and Julesz 1973; Morrone et al 1983; Ruiz-Soler and Beltran 2006). While the evidence is somewhat inconclusive, many studies of the face-inversion effect have shown reduced accuracy and increased reaction time for discriminating between faces that differ in their second-order relations more than faces that differ in local feature information (Bruce and Young 1998; Freire et al 2000; Le Grand et al 2001; Rhodes and Tremewan 1994). Taken together, these findings suggest that separate mechanisms may be involved in second-order relational versus featural processing of individual faces. These assumptions have become well-entrenched in face recognition research. However, a more recent line of research suggests that local feature information and the distances between features cannot be dissociated by the above manipulations, and that a face-specific holistic mechanism should, in principle, encompass both (Amishav and Kimchi 2010; Goffaux and Rossion 2006; McKone and Yovel 2009; also Farah et al 1998; Tanaka and Farah 1993). This idea has been well described in a comprehensive review by McKone and Yovel (2009). They demonstrated that manipulating feature shape without color results in equal inversion effects for feature and configuration changes. Similarly, Amishav and Kimchi (2010) showed that it is the integration of features and their configuration that is crucial for processing upright faces. However, one thing this ongoing discussion on the relative roles of features and their configurations is lacking is how processing these two sources of information may be modified by degraded conditions that are more typical of real viewing situations. In this study we investigate how processing of second-order relations and local feature shape in faces is influenced by different levels of image resolution.
It is known that making face images blurry makes them less recognizable (Loftus and Harley 2005). Additionally, it is widely believed that the processing of low-pass filtered upright faces is based primarily on configural cues, since local diffusive filtering is expected to degrade local featural details to a greater extent than larger scale configural information (Bachmann 1991; Bachmann et al 2004; Collishaw and Hole 2002; Costen et al 1994; (1) In face-recognition literature, the term “configural processing” suffers from ambiguity, as it is used to refer to either: (1) sensitivity to first-order relations, where a face is perceived as two eyes arranged above a nose which are above a mouth, (2) sensitivity to second-order relations, or the metric distances between the internal features (Carey and Diamond 1977), or (3) holistic processing, or the idea that a face is perceived as a Gestalt (Tanaka and Farah 1993). In this paper we always use the words “configural processing” to refer to (2). The words “holistic processing” are used to refer to (3).

Recognizing degraded faces 1499
Sergent 1986). However, there have been surprisingly few attempts to experimentally test this notion. In fact, the only studies that have directly compared the roles of configural and featural cues at different spatial frequencies have used low, medium, and high spatial frequencies (Boutet et al 2003; Flevaris et al 2008; Goffaux et al 2005; Goffaux and Rossion 2006), and have come up with contradictory results. Importantly, low-pass frequency filtering differs qualitatively from band-pass frequency filtering because, rather than preserving information from specific regions within the frequency domain (eg 5–8 cycles per face), blurring extends to include different levels of spatial frequency that fall below a particular cutoff (eg anything below 5 cycles per face) more consistent with the effect of natural viewing challenges, such as refractive errors or large viewing distances. A few other studies have looked at holistic processing as a function of low versus high spatial frequencies (Collishaw and Hole 2002; Goffaux 2009; Goffaux and Rossion 2006). Another study found that adults are able to recognize the identity of blurred faces with reasonable accuracy (Hayes 1988; Sergent 1986), but are severely impaired if the faces are simultaneously blurred and inverted—presumably because blurring removes featural information and inversion disrupts sensitivity to second-order relations (Collishaw and Hole 2000). However, to our knowledge, a systematic investigation of processing feature and configuration information for faces presented at different extents of low-pass filters has yet to be performed. If the results of such a study will point towards dissociation, this would suggest separable processing of these two information sources when viewed under degraded conditions. A lack of dissociation would suggest a holistic processing method that uses information from both local features and their mutual distances. With this as the motivating context, our objective here is to experimentally measure how the visual system’s relative sensitivity to local feature shape and distance information in a face changes for different degrees of low spatial frequencies.
1.1 ExperimentsThe overall experimental paradigm we have adopted is to assess participants’ ability to detect featural or configural transformations in face images as a function of image resolution. A trial involved presenting a pair of face images where the two members were either identical (‘same trials’) or differed configurally or featurally (‘different trials’). The observer’s task was to report whether the two images were identical or different. Comparing performance on featurally versus configurally different pairs provides us with a way for assessing the relative effectiveness of the two kinds of cues. Conducting such tests across a range of resolution levels yields information about how cue effectiveness varies as a function of the extent of low-pass filtering.
While the conceptual design of the experiment appears straightforward, actually implementing it presents a challenge. In order to determine whether a transformation (here low-pass filtering) differentially affects the two kinds of cues, it is imperative to construct a stimulus set such that performance across the two cues is balanced under normal conditions (no filtering). In other words, the stimulus set should consist of those images for which humans are equally good at detecting configural and featural changes under normal conditions. Without such controls, the results would be difficult to interpret. For instance, consider a stimulus set such that under normal conditions featural changes are detected much more robustly than configural changes. Suppose a given resolution level yields a disproportionately small decrease in feature performance, as opposed to configuration performance. The larger decline in configuration performance may be due to the visual system’s inability to perceive configural information at that given resolution level. Alternatively, the specific images used may have been quite difficult, even under normal conditions. Therefore, it is imperative to use a controlled set of stimuli for which subjects are equally good at detecting feature and configuration changes for high-resolution images. Any significant differences in detecting

1500 S Gilad-Gutnick, G Yovel, P Sinha
the two manipulation types in high-resolution images would introduce a confounding variable to how these changes are detected in low-resolution images. Importantly, having this equalized baseline performance allows these data to be compared to previous research, since numerous previous studies have similarly measured subjects’ ability to detect feature versus configuration changes that are equally discriminable under normal viewing conditions (Boutet et al 2003; Riesenhuber et al 2004).
In summary, to reliably infer that performance level is indicative of the measured variable, it is necessary to control for difficulty of those variables under normal conditions. Experiment 1a was devoted to the collection of a large, well-controlled stimulus set. Subsequently, experiment 1b used this set to systematically assess cue effectiveness as a function of image resolution. Finally, experiment 2 was designed with two goals in mind: (i) to assess if the results found in experiment 1b can be replicated with a novel and more naturalistic set of face images and (ii) to determine if our results are face-specific.
The goal of experiment 1a was to collect a large and well-controlled stimulus set to use in experiment 1b, consisting of high-resolution image pairs for which subjects perform equally well at detecting configural and featural changes.
2 Experiment 1a2.1 Methods2.1.1 Subjects. A total of thirty adults were randomly assigned to one of two mutually exclusive subject groups. Subjects had (self-reported) normal or corrected-to-normal vision.
2.1.2 Materials. 200 grayscale male and female frontal face images were used, as described below, to compile the pairs of faces. The faces were drawn from the MPIK database. To avoid easy cues of identification, the faces were cropped at the hairline, and did not have facial hair or spectacles. Using an image morphing program written in Matlab we made image manipulations which follow the procedure described in Riesenhuber et al (2004). Specifically, faces were size-normalized to measure 150 pixels in height (crown to chin). 100 of the images were arbitrarily assigned to be ‘source’ faces. Each source face was duplicated and prepared in 10 configural versions, and 10 featural versions, differing in the position (configural pairs) or shape (feature pairs) of the eyes and/or mouth regions. Generation of configuration and feature changes followed the same general procedure used in previous studies (Freire et al 2000; Le Grand et al 2001; Mondloch et al 2002). Configural changes involved spatial shifts of the eyes and/or mouth, such that the basic facial symmetry was preserved. The eyes (including the eyebrows) were displaced a maximum of two pixels along the x-axis (inward or outward) and/or two pixels along the y-axis (up or down). The mouth was displaced a maximum of two pixels along the y-axis (up or down). Both magnitude and direction of movement were randomly selected. Featural changes were accomplished by replacing the eyes and mouth of a source face with randomly selected ‘donor’ features (chosen from the remaining 100 images). Donor features used on a given source face were selected from two different faces (for instance, a source face would receive eyes from donor 1 and mouth from donor 2), and the combination was not repeated in the stimulus set. Source faces were matched with donor features of the same gender.
Each of the 20 created images for a given source face was then paired once with itself, and once with another image that had undergone similar manipulation. Each of the resulting pairs was thus a member in one of three stimulus categories: configurally different (40 face pairs); featurally different (40 face pairs); same trials (80 face pairs).
The above procedure was repeated for each of the 100 source faces, resulting in a total of 4000 unique pairs. We excluded faces with obvious image-manipulation artifacts. From the remaining, we generated a stimulus set comprising 2428 image pairs, with an equal number

Recognizing degraded faces 1501
of those pairs (607) belonging to each of the ‘different trials’ stimulus categories and 1214 pairs belonging to the ‘same trials’ category. Collecting such a large image-pair database ensured that the stimuli used in the experiment included all possible feature/configuration changes.
2.1.3 Procedure. Two subject groups underwent the same experiment, with the exception that the stimulus set presented to each group consisted of different images. This design allowed us to collect data corresponding to a large stimulus set while avoiding noise due to subject weariness. The resulting data consisted of 15 different responses for each of the 2428 image pairs.
Prior to beginning the experiment, both written and oral instructions were provided to the subjects. They were told that the goal of the experiment was to investigate how well they can distinguish between similar faces, and informed of the potential similarity of the two faces in any pair (like identical twins). It was specifically stressed that the task was not to decide if the two faces belong to the same person, but rather if the two facial images are identical. After a brief explanation of the experimental setup, subjects were instructed to judge whether two face pictures in an example pair were different or identical. By this example, the experimenter ensured that subjects fully understood the task.
Subjects were presented on average with 10 blocks, each with 100 image pairs. Order of presentation was randomly selected at the beginning of each experiment. In a given trial, a selected pair was presented as a sequence of two images using the following design: (a) fixation cross for 300 ms; (b) image 1 for 300 ms; (c) mask for 700 ms; (d) image 2 for 300 ms; (e) blank screen; (f ) subject responds same/different by pressing one of two labeled keys. The mask was a spatially scrambled collection of image fragments drawn from many face images. Images were displayed in the center of a 19 inch monitor, where the remainder of the screen stayed neutral gray throughout the experiment. The screen’s resolution was set to 1024 × 768 pixels, and color-depth was set to 24 bits. Face width subtended approximately 4 deg visual angle. Image selection, presentation, and the recording of subject input/behavior were controlled with a Matlab program.
2.2 Results and discussionPerformance across all pairs was used to select a set of 21 face pairs that yielded equal performance (~90%) on each of the pairs from each of the two ‘different trials’ stimulus categories and 42 face pairs from the ‘same trials’ stimulus category (appendix 1, figure A1). In addition to controlling for difficulty across the categories, the selected pairs consisted entirely of mutually exclusive source (‘outline’) faces, each of which was represented exactly once in each stimulus category. No given image repeated across categories. Appendix 1 contains detailed information about the stimulus pairs selected from experiment 1a to be used in experiment 1b. It is important to note that not all feature displacements are necessarily processed globally. For example, horizontal displacement of the eyes can potentially be processed locally without regard to the rest of the facial configuration. The distinction we want to draw is between the nature of the changes: Changes in feature positions represent changes in second-order configuration, while feature replacement represents a change in featural information. Furthermore, since the displacement of the eyes and/or mouth was chosen randomly for each of the final 607 configurally different pairs independently, there are very few pairs for which only horizontal eye displacements were made. Nevertheless, to be conservative in our interpretation, we refrain from claiming that such pairs were not actually differentiated based on the local horizontal eye displacements. Note that of the 21 configurally different pairs, only a single pair consisted of horizontal eye-displacement exclusively, while a range of other displacement combinations were represented in the remaining 20 image pairs.

1502 S Gilad-Gutnick, G Yovel, P Sinha
3 Experiment 1bIn experiment 1a we collected a well-controlled stimulus set for use in experiment 1b. The goal of experiment 1b was to measure subjects’ ability to detect configural changes on the one hand, and featural changes on the other, as a function of systematic variations in resolution. Compiling the data across all resolution levels allowed us to determine relative sensitivities for detecting changes in the two kinds of cues and to discern any performance changes across resolution for either kind of facial information separately.
3.1 Methods3.1.1 Subjects. Fifteen adults with self-reported normal or corrected-to-normal vision participated in experiment 1b. Subjects were naive as to the goals of the experiment. None had participated in experiment 1a.
3.1.2 Materials. The pairs yielded by experiment 1a were used to create 6 stimulus sets which differed in their resolution levels. Using Adobe Photoshop software, reductions in resolution were accomplished with a Gaussian filter (radii, in pixels, of the Gaussian filters used were: 0.0 = no blur, 1.0, 2.0, 3.0, 4.0, 5.0 = highest blur; values correspond to the following cutoff frequencies: full-resolution, 14, 7, 5, 3.5, and 2.75 cycles per face width, respectively). The resulting stimulus set comprised 504 face pairs [(42 ‘different’ source faces + 42 ‘same’ source faces) × 6 blur levels].
3.1.3 Procedure. The procedural design was largely similar to the one described in experiment 1a, with a few adjustments. The experiment consisted of 6 blocks corresponding to the 6 blur levels. Subjects began the discrimination task at blur 5.0, and proceeded to the no-blur condition in reverse order. Figure 1 shows example images for each of the 6 blur levels used.
3.2 Results and discussionOur goal was to assess the relative effectiveness of detecting configural and featural cue changes for a face-matching task at different resolutions. The data in figure 2 (top) express average d ′ scores as a function of resolution level, with stimulus categories as the parameters. d ′ scores were calculated for each subject using the following formula: d ′ = z(hit rate) – z(false alarm), where z() is the z-score. Hit-rates and false-alarm rates of 0 and 1 were adjusted using 1/n and (n–1)/n, respectively, where n = number of trials.
Figure 1. Example images of a given face at each of the 6 blur levels used, starting from the highest-blur condition (leftmost top image), and proceeding to the no-blur condition in raster order.

Recognizing degraded faces 1503
The implementation of experiment 1a appears to have been effective at balancing the perceptibility of configural and featural cues in the baseline high-resolution images. For the no-blur condition in experiment 1b, performance on the 2 manipulation types was equal as well as away from both ceiling and floor levels, making the comparisons at subsequent blur levels meaningful. It should be noted that, while it was appropriate to match difficulty in the no-blur condition (as we have done), this does not mean that featural information is just as well perceived under normal circumstances.
In contrast to existing views, we found that configuration and feature changes were detected equally well across the different blur levels (figure 2, top). A repeated-measures omnibus ANOVA with 2 within-subject factors (blur and condition) revealed a significant main effect of blur (F5, 70 = 62.991, p < 0.0001, p
2h = 0.818), no main effect of condition (F1, 14 = 3.305, p = 0.091, p
2h = 0.191), and a significant interaction (F5, 70 = 3.107, p < 0.05, p2h = 0.182). The results thus indicate that overall performance is highly affected by the
amount of blur applied to the image, and that this pattern may be affected by the type of manipulation (condition). To test the latter point, we performed 2-way paired t-tests at every blur level separately and found significant difference between the conditions only at blur levels 3 (t14 = 3.527, p < 0.01) and 5 (t14 = 5.618, p < 0.0001). Given that performance at blur level 5 is essentially tantamount to guessing, no further conclusions could be drawn from this difference (although it is important to note that at this blur level, subjects were also slightly slower on the configuration trials, suggesting a small speed–accuracy trade-off when subjects are largely guessing). On the other hand, the significant difference found at blur level 3 suggests that at this particular level configuration changes may have been detected slightly better than feature changes. However, since this is the only blur level at which a condition-based difference was found, and since this slight difference in performance was not replicated in experiment 2, we conclude that these findings are not sufficient to draw any meaningful conclusions about the differential use of configuration versus feature cues.
An ANOVA test does not take into account that the blur levels are ordered in any particular way. We therefore performed trend analysis to measure how blur level modifies performance. A polynomial contrast on blur level indicated significant differences in both the linear (F1, 14 = 148.943, p < 0.0001) and cubic components (F1, 14 = 10.787, p < 0.01), resulting in a classic learning-shaped curve in which subjects began with stable performance
2.5
2.0
1.5
1.0
0.5
0.0
–0.50 1 2 3 4 5
Blur level0 1 2 3 4 5
Blur level
d ′
configuration features same
Figure 2. [In color online, see http://dx.doi.org/10.1068/p7064] Subjects’ performance (n = 15) in experiment 1b. (a) Accuracy. d ′ for each manipulation type, with guessing rate equal to zero; (b) reaction time. Error bars show SEM.
(a) (b)
Rea
ctio
n tim
e/m
s
1.8
1.6
1.4
1.2
1.0
0.8
0.6
0.4
0.2
0.0

1504 S Gilad-Gutnick, G Yovel, P Sinha
(blurs 5 and 4), then show a rapid improvement (blurs 3 and 2—the linear affect) followed by performance leveling out (blurs 1 and 0). Contrasts between each pair of adjacent blur levels revealed a significant difference between every successive blur levels ( p < 0.01 for all) except in progressing from blur 1 to 0. As a final solution, we performed trend analysis on each condition separately, to determine if performance on each condition was affected similarly by blur level (ie if the trends are qualitatively similar to each other and to overall performance). Indeed, we found a combination of linear and cubic effects on both the configuration trials (linear: F1, 14 = 107.028, p < 0.0001; cubic: F1, 14 = 12.828, p < 0.01) and the feature trials (linear: F1, 14 = 154.899, p < 0.0001; cubic: F1, 14 = 5.748, p < 0.05).
Reaction time data are shown in the lower panel of figure 2. Analysis of reaction time data on all three experimental condition (features, configuration, and same trials) revealed a significant effect of blur level (F5, 70 = 9.408, p < 0.01, p
2h = 0.402) but no effect of manipulation type (F2, 28 = 1.15, p = 0.331, p
2h = 0.076) and no interaction (F10, 140 = 0.917, p = 0.4, p
2h = 0.061). Although we did find a general pattern of increased reaction time as a function of increased blur level, all Bonferroni pairwise comparisons were non-significant. In the current experiment, reaction time data may not be a reliable test of performance, because subjects were explicitly instructed to focus more on correct responses as opposed to responding quickly. Therefore, all subsequent discussion will focus on accuracy measures only.
4 Experiment 2Experiment 2 followed the same general procedure described in experiment 1b, with one important addition: performance in detecting configuration versus feature changes as a function of resolution level was measured for both face and house stimuli. The goal was twofold: (i) to replicate the above findings using a completely different set of more naturalistic face stimuli, and (ii) to measure if the closely linked performance found between detecting configuration and features changes at the different resolutions is specific to faces.
4.1 Methods4.1.1 Subjects. Fifteen adults with self-reported normal or corrected-to-normal vision participated in experiment 2. Subjects were naive as to the goals of the experiment. None had participated in experiments 1a or 1b.
4.1.2 Materials. The face and house stimulus sets used in the current experiment were generated with Photoshop and were identical to the stimuli used in a previous study (Yovel and Kanwisher 2004). For each stimulus class (faces and houses) 8 distinct images were compiled (4 with configuration changes and 4 with feature changes). Generation of the configuration and feature stimuli followed the procedure used by Le Grand et al (2001), with the important addition that the images were manipulated to yield an average performance of 80% correct on both manipulation types (features and configuration) and both stimulus classes (faces and houses). For the face images, a single male face devoid of facial hair or spectacles was cropped to include the hair region, and was then used to generate two sets of 4 faces each. In the configuration set, the eyes were displaced to be either closer together or farther apart and the mouth was displaced up toward the nose or down away from the nose. In the feature set, the eyes and mouth were replaced with similarly shaped eyes and mouth from a different face. For the house images, a single house, which included two upper windows, a lower left-side window and a lower right-side door was used to generate two sets of 4 houses each. In the configuration set, either the left-side windows and the right-side window and door were moved closer together or farther apart or the right and left upper windows were moved closer to or farther from the roof. In the features set, all three windows
Recognizing degraded faces 1505
and the door were replaced by windows and doors taken from different house images. Within these image sets, each image was then paired once with itself (same pairs) and once with each of the other images in the set (different pairs), yielding a total set of 20 configuration pairs, 20 different pairs, and 40 same pairs per task (faces and houses). Face/house width subtended approximately 4 deg visual angle. Refer to figure 1 in Yovel and Kanwisher (2004) for the images used in the current experiment (note that because permission from the owner of the face used in the current experiment could not be obtained, the referenced figure shows a face that was generated via the same procedure and yielded similar behavior results to the face images used in the current experiment).
For each stimulus class (faces and houses), the image pairs were used to create 6 stimulus sets which differed in their resolution levels. Using Adobe Photoshop software, reductions in resolution were accomplished via Gaussian filter (radii, in pixels, of the Gaussian filters used were: 0.0 = no blur; 1.0; 2.0; 3.0; 4.0; 5.0 = highest blur; values correspond to the following cutoff frequencies, respectively: faces: full-resolution, 14, 7, 5, 3.5, and 2.75 cycles per face width; and houses: full-resolution, 24, 12, 8, 6, 4.75 cycles per house width). Thus, for each stimulus class, the resulting set comprised 480 pairs [(40 ‘different’ + 40 ‘same’) × 6 blur levels].
4.1.3 Methods. The procedural design was identical to the one described in experiment 1b, with one addition. Each subject performed the task on both stimulus classes (faces and houses). The two tasks were presented one after the other, and their order was counterbalanced across subjects.
4.2 Results and discussionExperiment 2 had two goals: (i) to replicate face data from experiment 1b, and (ii) to investigate if the trends of data found in experiment 1b are specific to faces.
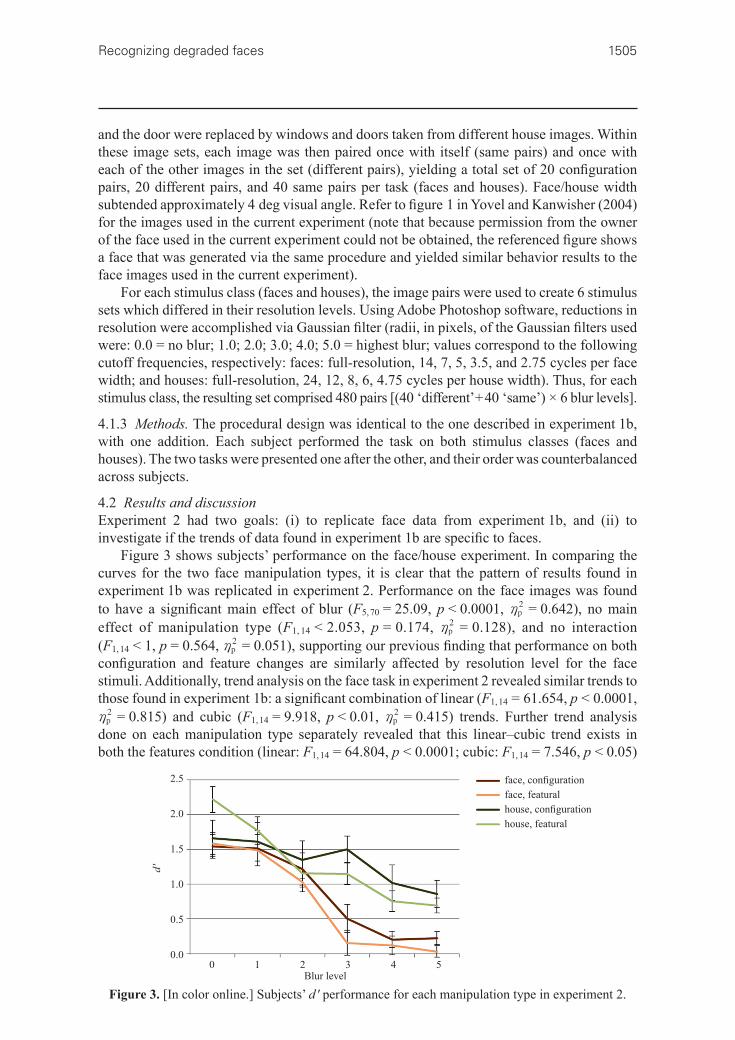
Figure 3 shows subjects’ performance on the face/house experiment. In comparing the curves for the two face manipulation types, it is clear that the pattern of results found in experiment 1b was replicated in experiment 2. Performance on the face images was found to have a significant main effect of blur (F5, 70 = 25.09, p < 0.0001, p
2h = 0.642), no main effect of manipulation type (F1, 14 < 2.053, p = 0.174, p
2h = 0.128), and no interaction (F1, 14 < 1, p = 0.564, p
2h = 0.051), supporting our previous finding that performance on both configuration and feature changes are similarly affected by resolution level for the face stimuli. Additionally, trend analysis on the face task in experiment 2 revealed similar trends to those found in experiment 1b: a significant combination of linear (F1, 14 = 61.654, p < 0.0001, p2h = 0.815) and cubic (F1, 14 = 9.918, p < 0.01, p
2h = 0.415) trends. Further trend analysis done on each manipulation type separately revealed that this linear–cubic trend exists in both the features condition (linear: F1, 14 = 64.804, p < 0.0001; cubic: F1, 14 = 7.546, p < 0.05)
Figure 3. [In color online.] Subjects’ d ′ performance for each manipulation type in experiment 2.
2.5
2.0
1.5
1.0
0.5
0.0
d ′
face, configurationface, featuralhouse, configurationhouse, featural
0 1 2 3 4 5Blur level

1506 S Gilad-Gutnick, G Yovel, P Sinha
and the configuration condition (linear: F1, 14 = 41.841, p < 0.0001; cubic: F1, 14 = 6.768, p < 0.05). The similarity in the results of the two experiments is especially striking, given that they were performed on completely different face sets. In fact, whereas the face set used in experiment 1b excluded external hair features, the set used in experiment 2 consisted of the entire face, making results on the latter particularly relevant for drawing conclusions about real-world viewing situations.
For experiment 2, a 2 stimulus-class × 2 manipulation-type × 6 blur repeated-measures omnibus ANOVA revealed a highly significant main effect of stimulus class (F1, 14 = 32.724, p < 0.0001, p
2h = 0.7) and blur (F5, 70 = 36.505, p < 0.0001, p2h = 0.723), but no effect of
manipulation type (F1, 14 < 1, p = 0.463, p2h = 0.039) and no significant 3-way interaction
(F5, 70 = 0.959, p = 0.436, p2h = 0.064). Note that the absence of a 3-way interaction does not
justify us doing further analysis to compare the two tasks, and we are thus unable to claim face-specificity of the effect found above. Thus, while visual examination of the data together with the main effect of manipulation type suggest that overall performance on houses may be less sensitive to resolution than overall performance on faces (Biederman and Kalocsai 1997), further experiments are needed in order to fully resolve possible domain differences in detecting feature and configuration changes as a function of resolution.
5 General discussionThe underlying motivation of this study was to assess how well-known face mechanisms are influenced by conditions of low resolution. It has been previously suggested that low spatial frequencies may provide a means of dissociating featural and configural cues in faces, because at these frequencies, the feature information should supposedly be obliterated and the image should carry information about coarser features. For example, Loftus and Harley’s (2005) “distance as filtering” hypothesis assumes that faces are more difficult to perceive at increasing distances because progressively lower image frequencies cause a loss in increasingly coarser facial details. Further, in the mid-eighties, Sergent (1986) argued that the gradual blurring of a photograph degrades features of the face more rapidly than its configural information. However, this idea was never tested directly. In this study we showed that, contrary to the above mentioned notion, when feature and configuration changes were matched for difficulty at the full resolution condition (experiment 1a), subjects exhibited comparable ability at detecting changes in these two cues across varying levels of low spatial frequency (experiment 1b). The decline in performance on both the configuration and feature conditions followed a similar linear–cubic learning-shaped curve as a function of decreasing image resolution. Our results appear robust, since they were replicated with a very different and more naturalistic face stimulus set (experiment 2).
Two cautionary notes are in order. First, since configuration changes in our experiment were defined as second-order displacement of the internal features, our results make no claim about processing local versus global information, but rather only make a distinction between processing feature shape versus distances between features. Second, given the non-significant 3-way interaction found in experiment 2 we were unable to draw any conclusions about the face specificity of the above effects.
Overall, our findings suggest that, for faces, both configuration and feature cues are equally encoded by the visual system at the different resolutions tested, and are consistent with theories of holistic face processing which encompass an integration of local feature shape information and their metric distances (Tanaka and Farah 1993; Young et al 1987; Yovel and Kanwisher 2004).
Despite the ecological significance of low spatial frequency conditions for face recognition, few studies have actually tested how the usage of information that arises from features and their positions, is modified as a function of spatial frequency filtering.

Recognizing degraded faces 1507
Of those that have, none has measured how their relative processing is affected by different low spatial frequencies. Instead, studies have used band-pass filtered faces or compared a single level of high-pass versus low-pass filtered images, and have yielded contradictory results. Goffaux et al (2005) found that detection of configuration changes is preserved more in low spatial frequencies, whereas detection of feature changes is preserved more in high spatial frequencies. In contrast, Boutet et al (2003) found that high/low spatial frequency manipulations had identical effects on subjects’ abilities to detect configuration and feature changes. While it has yet to be resolved whether the detection of feature and configuration changes can be dissociated for high and low spatial frequencies, it is important to note that, similar to our study, Boutet et al (2003) used stimuli that were equalized for performance in the full-resolution images. Therefore, his study on band-pass spatial frequency filtering, taken together with our results on low spatial frequency filtering, strongly suggest a lack of dissociation between processes responsible for feature and configuration change detection as a function of the image’s available spatial frequency, consistent with the idea that it is may actually be holistic face processing that is affected by such resolution changes.
Our results contribute to the growing pool of findings that demonstrate a link between feature and configuration processing under different manipulations (childhood development: McKone and Boyer 2006; inversion: McKone and Yovel 2009), and are in line with the idea of an integrative holistic face processing mechanism that encompasses information from both feature shape and the metric distances between individual features. Furthermore, our findings show that the above link is preserved for different levels of low spatial frequency, providing an implicit description of how holistic face processing may be affected by low resolution. Nevertheless, additional experiments are necessary to fully characterize such a process. Relevant to this, a few studies have directly investigated how holistic face processing is affected by the different spatial frequencies available in an image. Again, most studies have focused on comparing performance when information from high, medium, and low spatial frequencies is available. For example, Goffaux and Rossion (2006) used the whole–part advantage and composite-effect paradigms to demonstrate that holistic face mechanisms rely most dominantly on low rather than high spatial frequencies. In their study, the authors defined a cutoff frequency of 8 cycles per face for the low-pass filtered images, which approximately corresponds to blur levels 2 in our study. At these blur levels, we found that subjects’ performance on both features and configuration is still highly preserved. Our data are thus in agreement with Goffaux and Rossion’s (2006) findings, and provide a platform for understanding how holistic processing may behave under even lower spatial frequencies.
An interesting next step would be to directly measure how gradually increasing an image’s blur levels (such as the ones used in our study) affects holistic face processing. For example, if one was to find that holistic processing also shows a linear–cubic trend decline in performance as a function of increasing blur levels, this may, together with our data, suggest that feature shape and distances encompass a major part of what defines holistic processing. If, on the other hand, one finds a curve that declines more slowly than those demonstrated by our data, this may suggest an additional crucial aspect of holistic processing that is preserved at lower resolutions. For example, a recent study measured how holistic face processing is modified by viewing distance (McKone 2009). The author found an inverted U-shaped response curve as a function of viewing distance (measured as visual angle), and provided an important measure of how holistic processing changes for a manipulation that is relevant to real-world viewing conditions (in this case distance). The discrepancy in curves between this study and ours may therefore reflect additional aspects of holistic face processing that are preserved as a function of reduced resolution. However, it is possible that the two curves may also differ

1508 S Gilad-Gutnick, G Yovel, P Sinha
as a result of manipulation differences between the two studies. We used Gaussian blur in order to reduce resolution, whereas McKone used image size. While both manipulations reduce resolution, the former displays a large image with reduced resolution, whereas the latter displays the same coarse information over a smaller area and thus utilizes high spatial frequencies to convey image content. One way of resolving the origin of the discrepancy in results between the two studies would be to run a direct test of holistic face processing as a function of increased Gaussian blur.
Taken together, our results lead us to hypothesize that for many image resolutions of practical relevance, the distinction between configural and featural cues may eventually turn out to be an artificial one. Our results are consistent with a holistic processing model, as opposed to independent processing of isolated features on the one hand and their spatial relations on the other (Bruce and Young 1998; Riesenhuber et al 2004; Sekuler et al 2004), and emphasize the crucial need to investigate further aspects of face recognition under low-resolution conditions.ReferencesAmishav R, Kimchi R, 2010 “Perceptual integrality of componential and configural information in
faces” Psychonomic Bulletin & Review 17 743–748Bachmann T, 1991 “Identification of spatially quantized tachistoscopic images of faces: How many
pixels does it take to carry identity?” European Journal of Cognitive Psychology 3 85–103Bachmann T, Luiga I, Poder E, 2004 “Forward masking of faces by spatially quantized random and
structured masks: on the roles of wholistic configuration, local features, and spatial-frequency spectra in perceptual identification” Psychological Research 69 11–21
Biederman I, Kalocsai P, 1997 “Neurocomputational bases of object and face recognition” Philosophical Transactions of the Royal Society of London B 352 1203–1219
Boutet I, Collin C, Faubert J, 2003 “Configural face encoding and spatial frequency information” Perception & Psychophysics 65 1078–1093
Bruce V, Burton M A, Dench N, 1994 “What’s distinctive about a distinctive face?” Quarterly Journal of Experimental Psychology A 47 119–141
Bruce V, Doyle T, Dench N, Burton M, 1991 “Remembering facial configurations” Cognition 38 109–144
Bruce V, Young A, 1998 In the Eye of the Beholder—The Science of Face Perception (Oxford: Oxford University Press)
Carey S, Diamond R, 1977 “From piecemeal to configurational representation of faces” Science 195 312–314
Collishaw S M, Hole G J, 2000 “Featural and configurational processes in the recognition of faces of different familiarity” Perception 29 893–909
Collishaw S M, Hole G J, 2002 “Is there a linear or a nonlinear relationship between rotation and configural processing of faces?” Perception 31 287–296
Costen N P, Parker D M, Craw I, 1994 “Spatial content and spatial quantization effects in face recognition” Perception 23 129–146
Ellis H D, Shepherd J W, Davies G M, 1979 “Identification of familiar and unfamiliar faces from internal and external features: some implications for theories of face recognition” Perception 8 431–439
Farah M J, Wilson K D, Drain M, Tanaka J N, 1998 “What is ‘special’ about face perception?” Psychological Review 105 482–498
Flevaris A V, Robertson L C, Bentin S, 2008 “Using spatial frequency scales for processing face features and face configuration: an ERP analysis” Brain Research 1194 100–109
Freire A, Lee K, Symons L A, 2000 “The face-inversion effect as a deficit in encoding of configural information: Direct evidence” Perception 29 159–170
Goffaux V, 2009 “Spatial interactions in upright and inverted faces: re-exploration of spatial scale influence” Vision Research 49 774–781

Recognizing degraded faces 1509
Goffaux V, Hault B, Michel C, Vuong Q C, Rossion B, 2005 “The respective role of low and high spatial frequencies in supporting configural and featural processing of faces” Perception 34 77–86
Goffaux V, Rossion B, 2006 “Faces are ‘spatial’—holistic face perception is supported by low spatial frequencies” Journal of Experimental Psychology: Human Perception and Performance 32 1023–1039
Haig N D, 1984 “The effect of feature displacement on face recognition” Perception 13 505–512Harmon L D, Julesz B, 1973 “Masking in visual recognition: effects of two-dimensional filtered noise”
Science 180 1194–1197Hayes A, 1988 “Identification of two-tone images; some implications for high- and low-spatial-
frequency processes in human vision” Perception 17 429–436Le Grand R, Mondloch C J, Maurer D, Brent H P, 2001 “Neuroperception. Early visual experience and
face processing” Nature 410 890Loftus G R, Harley E M, 2005 “Why is it easier to identify someone close than far away?” Psychonomic
Bulletin & Review 12 43–65McKone E, 2009 “Holistic processing for faces operates over a wide range of sizes but is strongest
at identification rather than conversational distances” Vision Research 49 268–283McKone E, Boyer B L, 2006 “Sensitivity of 4-year-olds to featural and second-order relational changes
in face distinctiveness” Journal of Experimental Child Psychology 94 134–162McKone E, Yovel G, 2009 “Why does picture-plane inversion sometimes dissociate perception of
features and spacing in faces, and sometimes not? Toward a new theory of holistic processing” Psychonomic Bulletin & Review 16 778–797
Maurer D, Grand R L, Mondloch C J, 2002 “The many faces of configural processing” Trends in Cognitive Sciences 6 255–260
Mondloch C J, Le Grand R, Maurer D, 2002 “Configural face processing develops more slowly than featural face processing” Perception 31 553–566
Morrone M C, Burr D C, Ross J, 1983 “Added noise restores recognizability of coarse quantized images” Nature 305 226–228
Peterson M A, Rhodes G, 2006 Perception of Faces, Objects, and Scenes: Analytic and Holistic Processes (Oxford: Oxford University Press)
Rhodes G, Tremewan T, 1994 “Understanding face recognition: Caricature effects, inversion and the homogeneity problem” Visual Cognition 1 275–311
Riesenhuber M, Jarudi I, Gilad S, Sinha P, 2004 “Face processing in humans is compatible with a simple shape-based model of vision” Proceedings in Biological Sciences 271 Supplement 6, S448–S450
Ruiz-Soler M, Beltran F S, 2006 “Face perception: an integrative review of the role of spatial frequencies” Psychological Research 70 273–292
Sekuler A B, Gaspar C M, Gold J M, Bennett P J, 2004 “Inversion leads to quantitative, not qualitative, changes in face processing” Current Biology 14 391–396
Sergent J, 1986 “Microgenesis of face perception”, in Aspects of Face Processing Eds H D Ellis, M A Jeeves, F Newcombe, A Young (Dordrecht: Nijhoff ) pp 17–33
Tanaka J W, Farah M J, 1993 “Parts and wholes in face recognition” Quarterly Journal of Experimental Psychology A 46 225–245
Young A W, Hellawell D, Hay D C, 1987 “Configurational information in face perception” Perception 16 747–759
Yovel G, Kanwisher N, 2004 “Face perception: domain specific, not process specific” Neuron 44 889–898

1510 S Gilad-Gutnick, G Yovel, P Sinha
Appendix 1
Figure A1. Entire different-pair stimulus set used in experiment 1b for configuration changes (left) and feature changes (right). Performance on each pair in the set yielded +90% recognition.

Recognizing degraded faces 1511
Table A1. Displacement information about the 21 configurally different pairs presented in experiment 1b. Pixel displacement indicates the difference between the two images in the pair. Note that the number of pixels that the eyes were moved along the x-axis refers to the difference between a single eye (eg 3 pixel difference between the right eye in the first image and the right eye in the second image of a given pair).
Eyes /Pixels moved along x-axis
Eyes /Pixels moved along y-axis
Mouth /Pixels moved along y-axis
Total number of image pairs
0 0 4 10 3 3 10 4 3 21 1 3 11 1 4 21 2 3 12 1 3 22 2 3 22 2 4 23 0 3 33 0 4 14 0 0 14 0 4 2
© 2012 a Pion publication