doi: 10.1109/tip.2013.2287613 ieee
TRANSCRIPT

1
This material is published in the open archive of Mid Sweden University DIVA http://miun.diva-portal.org to ensure timely dissemination of scholarly and technical work. Copyright and all rights therein are retained by authors or by other copyright holders. All persons copying this information are expected to adhere to the terms and constraints invoked by each author's copyright. In most cases, these works may not be reposted without the explicit permission of the copyright holder. Schwarz, S.; Sjöström, M.; Olsson, R., “A Weighted Optimization Approach to Time-of-Flight Sensor Fusion,” IEEE Transactions on Image Processing, 23(1), 214-225, 2014. DOI: 10.1109/TIP.2013.2287613 © 2013 IEEE. Personal use of this material is permitted. However, permission to reprint/republish this material for advertising or promotional purposes or for creating new collective works for resale or redistribution to servers or lists, or to reuse any copyrighted component of this work in other works must be obtained from the IEEE.

TIP-10420-2013: SCHWARZ et al., ”A WEIGHTED OPTIMIZATION APPROACH TO TIME-OF-FLIGHT SENSOR FUSION” 1
A Weighted Optimization Approachto Time-of-Flight Sensor Fusion
Sebastian Schwarz, Graduate Student Member, IEEE, Marten Sjostrom, Member, IEEE,and Roger Olsson, Member, IEEE
Abstract—Acquiring scenery depth is a fundamental task in computer vision, with many applications in manufacturing, surveillance,or robotics relying on accurate scenery information. Time-of-Flight cameras can provide depth information in real-time and overcomeshort-comings of traditional stereo analysis. However, they provide limited spatial resolution and sophisticated upscaling algorithmsare sought after. In this paper, we present a sensor fusion approach to Time-of-Flight super resolution, based on the combination ofdepth and texture sources. Unlike other texture guided approaches, we interpret the depth upscaling process as a weighted energyoptimization problem. Three different weights are introduced, employing different available sensor data. The individual weights addressobject boundaries in depth, depth sensor noise and temporal consistency. Applied in consecutive order, they form three weightingstrategies for Time-of-Flight super resolution. Objective evaluations show advantages in depth accuracy and for depth image basedrendering compared to state-of-the-art depth upscaling. Subjective view synthesis evaluation shows a significant increase in viewerpreference by a factor of four in stereoscopic viewing conditions. To our knowledge, this is the first extensive subjective test performed onTime-of-Flight depth upscaling. Objective and subjective results proof the suitability of our approach to Time-of-Flight super resolutionapproach for depth scenery capture.
Index Terms—Sensor fusion, range data, time-of-flight sensors, depth map upscaling, three-dimensional video, stereo vision.
F
1 INTRODUCTION
MANY image processing applications in manufac-turing, security and surveillance, product quality
control, robotic navigation, and three-dimensional (3D)media entertainment rely on accurate scenery depthdata. Acquiring this depth information is a fundamentaltask in computer vision, yet complex and error-prone.Dedicated range sensors, such as the Time-of-Flight cam-era (ToF), can simplify the scene depth capture processand overcome short-comings of traditional solutions.
Stereo analysis is a common approach to scene depthextraction. Feature and area analysis between two cam-era views allows for the reconstruction of depth in-formation based on the camera geometry. However, ifparts of the scene are occluded in one view or areashave low or repetitive texture, stereo matching produceserroneous results [1]. Other depth capture solutions,such as structural lighting, e.g. the Microsoft Kinect,can provide reliable scene depth in such cases, but has
• Copyright (c) 2013 IEEE. Personal use of this material is permitted.However, permission to use this material for any other purposes must beobtained from the IEEE by sending a request to [email protected].
• The authors are with the Department of Information and CommunicationSystems, Mid Sweden University, Sundsvall, Sweden.E-mail: [sebastian.schwarz, marten.sjostrom, roger.olsson]@miun.se
• Supplementary material to this article is available at:https://www.miun.se/en/Research/Our-Research/Centers-and-Institutes/stc/Research-within-STC/Research-Groups/Realistic-3D/ToFdata
This work has been supported by grant 2009/0264 of the KK Foundation,Sweden, by grant 00156702 of the EU European Regional DevelopmentFund, Mellersta Norrland, Sweden, and by grant 00155148 of LansstyrelsenVasternorrland, Sweden.
a limited depth range and suffers from strong inaccu-racies at object boundaries [2]. Continuous-wave ToFcameras can overcome most of these shortcomings [3].They capture scene depth in real-time, independent fromtexture structure and occlusions. Admittedly, current ToFcameras can only deliver limited spatial resolution andcan suffer from sensor noise. Therefore sophisticateddepth upscaling algorithms are sought-after.
In 2007 Kopf et al. [4] showed that traditional im-age upscaling, e.g. value interpolation, yields limitedresults for depth upscaling. Better results are achievedby adding texture information to the upscaling process.They introduced the Joint Bilateral Upscaling (JBU) filter,combining a spatial filter on depth information with arange filter on texture information. JBU soon becamepopular for fusing data from sensors with different reso-lution, e.g. video and ToF, alongside an earlier proposalutilizing Markov Random Fields (MRF) by Diebel andThrun [5]. Combining low-resolution ToF cameras withhigh-resolution video cameras brings two advantages:Not only does the texture information improve the depthupscaling process, but it also provides auxiliary data infollow-up processing steps, e.g. texturizing reconstructedobjects or depth image based rendering (DIBR) for three-dimensional television (3DTV).
We recently proposed a new concept to ToF sen-sor fusion, interpreting the depth upscaling problemas an energy minimization problem [6]. Focused ontypical 3DTV capture scenarios, i.e. scene depth infor-mation accompanied by corresponding texture frames,we introduced the Edge Weighted Optimization Con-cept (EWOC). Low resolution ToF data is treated as
This is the author's version of an article that has been published in this journal. Changes were made to this version by the publisher prior to publication.The final version of record is available at http://dx.doi.org/10.1109/TIP.2013.2287613
Copyright (c) 2013 IEEE. Personal use is permitted. For any other purposes, permission must be obtained from the IEEE by emailing [email protected].

2 TIP-10420-2013: SCHWARZ et al., ”A WEIGHTED OPTIMIZATION APPROACH TO TIME-OF-FLIGHT SENSOR FUSION”
sparse representation of a full resolution depth map. Themissing depth values are then filled by employing errorenergy minimization, weighted by texture edges. Ourresults showed an increase in objective quality comparedto competing proposals. In this present paper, we extendEWOC with additional weights to address the specialcharacteristics of ToF cameras, introducing three weight-ing strategies for ToF super resolution (TSR). The firstadditional weight is based on the reliability of the depthreadings to reduce ToF sensor noise. With the secondweight we encourage temporal consistency to decreaseflickering in depth values, a possible source for eye-strain in 3DTV viewing scenarios. Objective evaluationstates an increase in depth accuracy compared to the pre-vious implementation. Extensive subjective evaluationin stereoscopic viewing conditions shows an increasedviewer preference by a factor of four over state-of-the-art depth upscaling.
The remainder of this paper is organized as follows: Atfirst we address the characteristics of ToF cameras in Sec.2 and related work on ToF depth upscaling in Sec. 3. Ourconcept for weighted Time-of-Flight super resolution ispresented in Sec. 4. Methodology and evaluation criteriaare addressed in Sec. 5, followed by our experimentalresults in Sec. 6. Finally, the paper is concluded in Sec.7.
2 THE TIME-OF-FLIGHT CAMERA
As the name suggests, a Time-of-Flight (ToF) camerameasures the travel time ttravel for a reflected light beamfrom the sender to an object and back to the receiver. ToFcameras are predestined for real-time scene depth cap-ture. They can deliver accurate depth maps at the pointof capture, without any time intensive stereo matchingin post production. Also, unlike stereo analysis, theydeliver reliable and accurate depth information in lowor repetitively texturized areas and do not suffer fromocclusions. Two different camera categories are distin-quished between, based on their depth sensor concept:
1) Pulse Runtime Sensors: A pulsed wave is sent outand a clock measures the time which has passeduntil the reflected signal is received again (Fig.1(a)). Such sensors deliver depth accuracy between10-20mm for distances of up to a few hundredmeters, but have low temporal resolution due tothe pulsed nature.
2) Continuous Wave Sensors: A cosine modulatedwave signal s(t) is sent out and the phase shiftΦ between s(t) and the reflected signal r(t) ismeasured (Fig. 1(b)). Such sensors have a depthaccuracy of around ten millimeters and a maximumdistance of about ten meters. They can capture inreal-time with sixty frames per second and more[7].
Due to their high temporal resolution, continuouswave ToF cameras are predestined for real-time scenedepth capture. A detailed description of the continuous
(a) Pulse Runtime (b) Continuous Wave
Fig. 1. Classification of different ToF systems.
wave concept can be found in [3]. For this article, it issufficient to be aware of some of the error sources.
2.1 Error Sources
ToF cameras are affected by several different noisesources, categorized into internal and external sources.Internal effects relate to the sending photodiodes andthe receiving charge-coupled device (CCD) sensors. Theyinclude thermal noise, quantization noise, reset noiseand photon shot noise. Most of these noise sources arealready addressed by the camera manufacturer withsignal processing and cooling, with the exception ofphoton shot noise [3]. Photon shot noise is inverselyproportional to the number of collected photons on thesensor and is the main reason for the limited spatialresolution of ToF cameras, since the single capturingpixel elements on the CCD must be of adequate sizeto collect a sufficient number of photons for a reliabledepth reading. Photon shot noise is theoretically Poissondistributed [8], but Frank et al. [9] showed that it can besufficiently approximated as a zero-mean Gaussian, withvariance σd, defined by the active brightness A.
σd =1
A2(1)
The active brightness A is the received optical powerof signal r(t) [3]. Eq. 1 is leading to the assumptionthat best results are achieved with the highest activebrightness. Unfortunately this is not completely true. Athigh active brightness levels, photo-generated electronsflood the capturing pixel element, causing erroneousdepth readings [8]. Therefore it is beneficial to adjustthe exposure time carefully for good active brightnesssaturation [10]. However, this might not be feasible inevery scenario, e.g. a moving camera or scene, andexternal effects might influence the saturation during thecapture process.
External effects are harder to generalize, since theydepend on the captured scenery. Dark or distant surfaceslead to low active brightness levels, equivalent to ahigh photon shot noise. Close or highly reflective objectslead to over saturated active brightness, resulting inerroneous depth values. Other problems arise from non-lambertian surfaces, where light reflection and scatteringleads to erroneous depth readings due to inadequateactive brightness saturation.
This is the author's version of an article that has been published in this journal. Changes were made to this version by the publisher prior to publication.The final version of record is available at http://dx.doi.org/10.1109/TIP.2013.2287613
Copyright (c) 2013 IEEE. Personal use is permitted. For any other purposes, permission must be obtained from the IEEE by emailing [email protected].

TIP-10420-2013: SCHWARZ et al., ”A WEIGHTED OPTIMIZATION APPROACH TO TIME-OF-FLIGHT SENSOR FUSION” 3
(a) Capture Setup
CI
a
CD
DL
D
P
b
dn
m
x
y
DL
(b) Projection
Fig. 2. Combined ToF and video capture setup (a) andprojective geometry (b).
2.2 ToF and Video Combination
Since a ToF camera produces only depth readings, it isoften combined with a video camera for (color) textureinformation. The texture information can be used forcolorizing reconstructed 3D object or as guidance infor-mation in a depth upscaling process. Such a combinationis shown in Fig. 2 (a), with a Basler acA1300-30gc ma-chine vision camera [11] on top of a Fotonic B70 ToFcamera [7]. Both cameras vary in extrinsic parameters,i.e. camera position and orientation, as well as intrinsicparameters, such as spatial resolution, focal length andpixel dimensions. In order to combine the two cameras, itis necessary to know the projective relationship betweenthe two cameras. This relationship is expressed in theprojection matrix P, a 3 × 4 full rank matrix containingthe rotation matrix R, translation vector t between thetwo cameras, and the intrinsic parameters of the videocamera in the calibration matrix KI ,
P = KI [R|t]. (2)
With the projection matrix P it is possible to fusethe two viewing angles into one, as shown in Fig. 2(b). The ToF camera at central point CD captures thedepth of 3D point a as depth value d = DL(m,n). Thisvalue is projected onto pixel position b. The sum of allprojected points results in the depth map D, as seen froma video camera at central point CI . Details are describedas follows.
For the mathematical context, images are representedas two-dimensional matrices of pixel values, e.g. I =I(x, y);x = 1, ..., X; y = 1, ..., Y with X and Y as themaximum indices. The combined video plus ToF capturesetup delivers a high resolution texture frame I and a lowresolution depth map DL = DL(m,n);m = 1, ...,M ;n =1, ..., N. The coordinates x,m and y, n are Euclideanpixel coordinates in 2D space with M < X and N < Y .The homogeneous pixel coordinates (m,n, 1)T can betranslated to world coordinates by means of the ToFcamera calibration matrix KD. Together with the depthvalue d = DL(m,n), the world coordinates of point a in
3D space are:
a = [m′, n′, d, 1]T = KD · [m,n, d, 1]T (3)
With the projection matrix P from Eq. 2, the depthvalue d is mapped on the corresponding pixel coordi-nates [x, y]T for point b:
d · b = d ·[xd,y
d, 1]T
= P · a (4)
Performing the projection for every known value inDL on an empty frame with an equal size as I gives thedepth map D = D(x, y);x = 1, ..., X; y = 1, ..., Y fromthe same viewing angle as the video camera. Since Dhas a sparse and irregular value distribution, some kindof filling algorithm is required.
D(x, y) =
DL(m,n), ∀ b from Eq. 4not defined, otherwise
(5)
In practice this process will not result in an exactalignment. Even with ideal camera calibration, the largeresolution difference between video and ToF camera,usually 8:1 or higher, will lead to mapping errors inthe depth map. However, this is not a problem sincewe use texture data as ground-truth to align the depthmap during the upscaling process.
3 RELATED WORK
The previous section explained how to project lowresolution ToF depth for spatial correspondences witha high resolution video frame. However, the resultingdepth map has a sparse value distribution and manyapplications require pixel dense depth values. Thereforeit is essential to have some means of filling in themissing values, i.e. depth map upscaling. Depth mapupscaling approaches can be classified into two majorgroups: Guided algorithms which apply additional in-formation, e.g. texture, and unguided algorithms basedon the depth map alone. However, unguided approachesare only suitable if there is no additional informationavailable to improve the depth upscaling results. Depthmaps are a gray scale representation of the acquiredscenery, describing the distance to the viewer in 8 Bitvalues. It has a piece-wise linear distribution with largegradually changing areas and sharp depth transitions atobject boundaries. Such transitions are very importantfor the visual perception of depth [12]. Texture fromcorresponding video frames can provide guidance topreserve these depth transitions in the upscaling process.Early research in this area includes the use of MarkovRandom Fields (MRF) to fuse high-resolution texturedata with low-resolution depth data [5], and joint fil-tering of depth and texture based on the bilateral filterpresented by Tomasi and Manduchi [13]. Joint bilateralfiltering gained a lot of attention with the introductionof joint bilateral upscaling (JBU) for depth maps by Kopfet al. in 2007.
This is the author's version of an article that has been published in this journal. Changes were made to this version by the publisher prior to publication.The final version of record is available at http://dx.doi.org/10.1109/TIP.2013.2287613
Copyright (c) 2013 IEEE. Personal use is permitted. For any other purposes, permission must be obtained from the IEEE by emailing [email protected].

4 TIP-10420-2013: SCHWARZ et al., ”A WEIGHTED OPTIMIZATION APPROACH TO TIME-OF-FLIGHT SENSOR FUSION”
The bilateral filter is an edge-preserving blurring filter,based on a nonlinear combination of the surroundingpixel values I(x, y) in an image I. The filter blendspixel values based on geometric distance (spatial) andphotometric similarity (range). The bilateral filter hasa symmetric spatial filter kernel h(·) and a symmetricrange filter kernel g(·). h : < → < uses the Euclideandistance and g : < → < the absolute value differencebetween two pixel values as input. It is not necessarythat the filter kernel inputs come from the same source.If the range kernel is applied to a second image, thisprocess is called a joint or cross bilateral filter. Thesecond image can be used as guidance for an upscalingprocess. Applying the spatial filter kernel h(·) on pixel
I ′(m,n) at position [m,n]T =[xγ ,
yγ
]Tof low resolution
source I′ and the range filter kernel g(·) on pixel I(x, y)of a full resolution guidance I, yields the joint bilateralupscaling result I(x, y):
I(x, y) =1
k
∑[x
′y′]∈Ω
I ′(x′, y′) · h
(∣∣∣∣∣∣∣∣∣∣[xγyγ
]−[x′
y′
]∣∣∣∣∣∣∣∣∣∣2
)
· g (|I(x, y)− I(γx′, γy′)|)
(6)
where γ is the upscaling factor between I′ and I, Ω isthe spatial support of the kernel, centered at (x, y)T , andk is the number of all pixels in Ω. Since I ′(m,n) takesonly integer coordinates, the guidance image I is onlysparsely sampled.
Kopf et al. demonstrated the benefit of JBU for upscal-ing low resolution depth maps with high resolution tex-ture guidance. Their results show high resolution depthmaps with accurate, sharp edges at object boundaries.However, solving the edge blurring problem with arange filter kernel introduced a new problem, namely,texture copying. Highly structured texture, especiallyletters, will be transferred into the depth map, sincethey are regarded as edges that should be preserved.This problem motivated several variations of JBU depthupscaling for video plus ToF combinations.
Yang et al. [14] presented their bilateral filtering espe-cially focused on 3D volume reconstruction. Chan et al.[15] suggested a noise-aware filter for depth upscaling(NAFDU), switching between bilateral and joint-bilateralfiltering, depending on a pre-filtered depth map. Gar-cia et al. [16] introduced the pixel weighted averagingstrategy (PWAS), extending the JBU depth upscalingprocess with a two-dimensional credibility map basedon the absolute gradient of the low resolution source.Kim et al. [17] attenuated the effects of texture copyingby assuming a piece-wise linear world geometry, andRiemens et al. [18] looked into real-time processing,presenting an incremental JBU approach.
Recent years have also shown variations of the MRFapproach, such as the use of dynamic MRFs for highaccuracy ToF depth [19], improved MRF data termconstruction [20], and added nonlocal means (NLM)
Edge Filter
Luminance Difference
Temporal Weights Optimization
Full Res Depth
Masking
Edge Weights
Error Weights
VideoFull Res Texture
Time-of-FlightLow Res Depth Active Brightness
Previous FrameUpscaled Depth
(t-1)Full Res Texture
(t-1)
Sparse Mapping
AI(t-1) I DL
WT
WE
WA
D(t-1)
D(t)
Fig. 3. Overview of the TSR algorithm for depth mapupscaling including the different weighting strategies.
filtering to preserve depth structure [21]. Other novelapproaches include an adopted NLM filter for range andcolor fusion [22], weighted mode filtering based on aglobal depth and texture histogram [23], and our recentlyproposed edge-weighted energy minimization for depthmap upscaling [6].
4 WEIGHTED OPTIMIZATION FOR TIME-OF-FLIGHT SUPER-RESOLUTION
The previous section showed that a lot of the work ontexture guided ToF depth map upscaling is based onimage filtering. In [6], we proposed a different view onthe problem of ToF Super-Resolution, the Edge WeightedOptimization Concept (EWOC). Low resolution ToFdepth is seen as a sparse representation of the targetresolution depth. Missing values are filled by diffusionin an optimization process weighted with edges from thehigh resolution video frame. Additionally, these edgesare validated with the low resolution depth to accentuatecorrelated data.
In this section, we revisit the original edge weight-ing concept and introduce two additional weights. Oneweight for sensor noise reduction, one for temporalconsistency in depth. The three weights can be appliedconsecutively and form our three strategies to Time-of-Flight Super-Resolution (TSR):
1) Upscale with edge weighting only for (S)ingle-weighted TSR, similar to EWOC.
2) Upscale with edge and error weighting for(D)ouble-weighted TSR.
3) Upscale with edge, error and temporal weightingfor (T)riple-weighted TSR.
Our ToF super-resolution approach and its interactionbetween the different weights is shown in Fig. 3. Thereexist three sets of input sources: The video source, theToF camera and the upscaling result of the previousframe. The low resolution depth map DL from the ToF
This is the author's version of an article that has been published in this journal. Changes were made to this version by the publisher prior to publication.The final version of record is available at http://dx.doi.org/10.1109/TIP.2013.2287613
Copyright (c) 2013 IEEE. Personal use is permitted. For any other purposes, permission must be obtained from the IEEE by emailing [email protected].

TIP-10420-2013: SCHWARZ et al., ”A WEIGHTED OPTIMIZATION APPROACH TO TIME-OF-FLIGHT SENSOR FUSION” 5
camera is mapped on a frame corresponding to thetexture resolution, using the value projection presentedin Sec. 2.2. The mapping results in a sparse depth map D.The texture frame I is filtered to identify edges, maskedwith low resolution depth information and used forthe edge weighting. Active brightness A from the ToFcamera is used for the error weighting. The temporalweighting utilizes upscaling results from the previousframe D(t − 1) together with the difference betweencurrent and previous texture frame. The weights areused in an optimization process to fill the missing valuesin D, giving a dense full resolution depth map. Thedifferent weights, their creation and the optimizationconcept are described in more detail below.
4.1 Edge WeightingAs mentioned before, depth maps consist of large uni-form areas with gradual depth changes, and sharp depthtransitions at object boundaries. These characteristics al-low for assuming spatial similarity between neighboringdepth pixels. This assumption can be expressed as thehorizontal error εh and the vertical error εv for a depthpixel D(x, y) at position (x, y)T and its spatial neighbors:
εh(x, y) = D (x, y)−D (x+ 1, y) (7)εv(x, y) = D (x, y)−D (x, y + 1) (8)
Of course, the similarity assumption alone would blurthe sharp depth transition at object borders. Thereforethe edge weighting function WE(x, y) is introduced,relaxing the spatial similarity constraints of Eq. 7 and8 at the object boundaries. The edge weighting allowsfor sharp depth transitions between objects by reducingthe requirement for the neighboring pixels to be similar.Describing the errors in terms of energy leads to thehorizontal and vertical error energies QH and QV , andthe overall spatial error energy QS :
QH =∑x
∑y
WE(x, y)ε2h(x, y) (9)
QV =∑x
∑y
WE(x, y)ε2v(x, y) (10)
QS = QH +QV (11)
The employed weighting function WE(x, y) is ob-tained by a combination of texture and depth infor-mation, based on two assumptions: First, since depthmaps describe the scene geometry for a video sequence,object boundaries should correspond to edges in thecorresponding video frame. Second, since a thoroughedge detection on a video frame will result in many moreedges than there are actual objects, edge informationfrom the low resolution ToF depth can be utilized tovalidate edges which comply with actual depth transi-tions. Based on these two assumptions, the edge weightWE(x, y) is gained as shown in Fig. 4: An edge filteron the resolution texture frame I yields the edge map
Edge Filter
EI
I(x,y)DL(m,n)
Edge Weight
WE
ED
Edge Masking
Edge Filter & Upscaling
Full Res TextureLow Res Depth
Fig. 4. Example for the edge weight generation.
EI . The low resolution depth map DL is also edgefiltered and the result is upscaled to the correspondingtexture frame to form the edge mask ED. The edge mapupscaling is performed in a nearest-neigbor fashion topreserve the binary values and widen the edge mask bythe upscaling factor. The wider edge mask is importantto compensate for minor texture-depth misalignments.Depending on the capturing setup, it might be necessaryto widen the mask further. Multiplying EI element-wise with ED masks out redundant edges in areas withuniform depth and gives the edge weighting functionWE(x, y).
WE(x, y) = 1− EI(x, y) · ED(x, y) (12)
This masking process is necessary, since the qualityof the upscaling results is highly dependent on cohesiveedges from texture. Missing or porous edges (Fig. 5(a))can lead to “depth leakage” where erroneous depthvalues spread into the wrong areas as shown in Fig. 5(b).However, thorough edge detection on a video frame willresult in many more edges than there are actual objectsFig. 5(c)) and will lead to an unwanted structurizationeffect in the upscaled depth map as shown in Fig.5(d). A higher threshold for the edge detector reducesthe amount of unnecessary edges. However it increasesthe risk of ”depth leakage”. Finding the correct edgethreshold for each sequence is difficult. Therefore it ismore practical to use a lower edge detector threshold,i.e. a higher sensitivity leading to more edges being de-tected, and validate the resulting edge map with actualtransitions in depth.
Different edge detectors, pre-processing steps andcolor spaces were investigated, including the possibilityof continuous edge weights [25]. However, continuousedge weights did not improve the depth upscaling pro-cess and a standard Canny edge detector [26] on thevideo luminance channel yields one of the best results.
This is the author's version of an article that has been published in this journal. Changes were made to this version by the publisher prior to publication.The final version of record is available at http://dx.doi.org/10.1109/TIP.2013.2287613
Copyright (c) 2013 IEEE. Personal use is permitted. For any other purposes, permission must be obtained from the IEEE by emailing [email protected].

6 TIP-10420-2013: SCHWARZ et al., ”A WEIGHTED OPTIMIZATION APPROACH TO TIME-OF-FLIGHT SENSOR FUSION”
(a) (b)
(c) (d)
Fig. 5. Details from test sequences ’Ballet’ and ’Break-dancing’ [24]: Missing edges (a) lead to depth leakageseen in (b). Too many edges (c) lead to depth structuriza-tion, seen in (d).
4.2 Error WeightingAs mentioned in Sec. 2.1, ToF cameras are subject tosensor noise inversely proportional to the received activebrightness A. Additionally, there are over saturationeffects leading to erroneous depth values [10]. UsuallyToF camera manufacturers provide an active brightnessvalue range, within which the depth readings are re-liable. In the case of the Fotonic B70 [7], the range isbetween α1 = 200 and α2 = 3000 of the 16 Bit activebrightness value range. Any depth values DL(m,n) out-side this range are considered unreliable and removedfrom the new depth map D′L.
D′L(m,n) =
DL(m,n), ∀ α1 < A(m,n) < α2
not defined, otherwise(13)
Within the value range, the reliability of each depthvalue is defined by the active brightness map A, pro-jected from the ToF camera plane, similar to Eq. 5.
A(x, y) =
A(m,n), ∀ b from Eq. 4not defined, otherwise
(14)
Assuming a higher active brightness is equal to ahigher reliability, the depth error weight is defined as
WA(x, y) = 1− A(x, y)
max(A), (15)
thus stating depth readings with a low active brightnessvalue as less reliable. Multiplied with the edge weightingfunction WE(x, y) from the previous section, pixels withlow active brightness values have a lower influence
on neighboring depth values. The new, error weightedspatial error energy Q′S is again the sum of the errorweighted horizontal and vertical error energies Q′H andQ′V
Q′H =∑x
∑y
WE(x, y)WA(x, y)ε2h(x, y) (16)
Q′V =∑x
∑y
WE(x, y)WA(x, y)ε2v(x, y) (17)
Q′S = QH +QV (18)
It is important to clarify that the active brightnessvalue restriction from Eq. 13 should be limited to allowas many valid depth readings as possible. Thereforethe active brightness levels should be carefully adjustedprior to capturing a scene. Restricting the active bright-ness range during the capture process helps then toreduce the influence of external error sources, such asnon-lambertian reflectance, as mentioned in Sec. 2.1.
4.3 Temporal WeightingSimilar to the spatial similarity defined in Eq. 7 and Eq.8, we can assume a temporal similarity between depthvalues for the same pixel at different time instances.Temporal inconsistency in depth maps leads to disturb-ing ”flickering artifacts” [27], [28] and visual discomfortfor 3D viewing [29]. A temporal similarity restrictioncan align depth variations in time and reduce flickeringartifacts. The temporal error εt between two depth valuesat the time instances t and t− 1 is expressed as
εt(x, y) = D (x, y, t)−D (x, y, t− 1) (19)
Again, some kind of weighting for temporal similarityis required to take moving objects or global motioninto account. This weight could, for example, be gener-ated from the optical flow [30] of the texture sequence.However, pixel-dense optical flow algorithms are verycomputational heavy. For the sake of simplicity, thecurrent temporal weighting defines temporal similarityas a function of luminance difference, though opticalflow could be very well considered in later stages. Basedon the luminance channel Y of the texture frame I, thetemporal weight WT (x, y) is expressed as
WT (x, y) = 1−∣∣ ∂∂tY (x, y)
∣∣max( ∂∂tY)
. (20)
Transfering the temporal error εt from Eq. 19 intoenergy terms and weighing it with the temporal weightWT (x, y) yields the temporal error energy QT
QT =∑x
∑y
WT (x, y)ε2t (x, y). (21)
The combined error energy Q generated from all avail-able weights yields
Q = c1Q′S + c2QT , (22)
This is the author's version of an article that has been published in this journal. Changes were made to this version by the publisher prior to publication.The final version of record is available at http://dx.doi.org/10.1109/TIP.2013.2287613
Copyright (c) 2013 IEEE. Personal use is permitted. For any other purposes, permission must be obtained from the IEEE by emailing [email protected].
TIP-10420-2013: SCHWARZ et al., ”A WEIGHTED OPTIMIZATION APPROACH TO TIME-OF-FLIGHT SENSOR FUSION” 7
where c1 and c2 are weighting parameters to controlthe effect of the spatial and temporal weighting. In thecurrent implementation, both energies were weightedequally at c1 = c2 = 0.5.
4.4 OptimizationThe three different error energies described in the pre-vious sections, form the three different weighting strate-gies of the proposed ToF super resolution approach:
1) S-TSR with error energy QS from Eq. 11.2) D-TSR with error energy Q′S from Eq. 18.3) T-TSR with error energy Q from Eq. 22.The original depth readings are fixed. S-TSR uses DL,
D- and T-TSR use D’L as given values in D. The remain-ing empty depth values in D are computed by diffusion,minimizing each energy term in a weighted non-linearleast squares fashion. For this implementation, we usea block-active solver [31], implemented in MATLAB byAdlers [32]. Although the different weights for edges,errors and temporal consistency are applied consecu-tively to form the three different weighting strategies,each individual strategy has its own error energy, basedon the original depth map, and does not rely on previousupscaling results.
5 TEST ARRANGEMENTS AND EVALUATION
The evaluation of the proposed approach for ToF superresolution is divided in four parts. In the first part,objective evaluations of S-TSR depth quality and pro-cessing time are shown to verify it as an improvementto previous proposals. The second part presents the ob-jective evaluation of D-TSR as proof of concept for activebrightness error weighting. In the third part we evaluatethe effects of temporal weighting. Finally, we performedan extensive subjective evaluation of all three weightingstrategies in stereoscopic 3D viewing conditions. Thetest arrangements, material generation and evaluationcriteria for all four parts are described in this section.
5.1 Objective S-TSR EvaluationThe first weighting strategy of the TSR approach waspublished and evaluated as EWOC in [6]. Our resultsshowed a reduction of 50% or more in the meansquare depth error for 8x upscaling, compared to theapproaches presented in [4], [5], [15] and [16]. This articleadds further, more recent depth upscaling approachesto our evaluation: The 3D cost volume joint bilateralfiltering (3D-JBU) presented in [14], and the weightedmode filtering (WMF) approach introduced in [23], in-cluding its multiscale color measure extension (MCM)to joint bilateral filtering introduced. The evaluation isbased on the Middlebury Stereo Vision data sets [1] toprovide ground-truth references. Simulated ToF data, i.e.downscaled depth maps, was generated from the givenreferences by a windowed averaging with downscalingfactor s = 8,
DL(m,n) =1
s2
s·m+s∑x=s·m
s·n+s∑y=s·n
D(x, y). (23)
The upscaling result was submitted to the automaticMiddlebury Stereo Evaluation, to assess the percentageof ”bad” pixels. A pixel is considered as ”bad” whenits disparity value is different from the reference pixeland a lower percentage of ”bad” pixels is considereda better result. The evaluation method considers theoverall percentage of bad pixels (all), as well as thepercentage of pixels in disoccluded areas (disc) only. Theaccuracy in disoccluded areas is interesting for stereomatching application, however it has no significant valuefor ToF upscaling based on downsampled references.In addition to the objective quality evaluation, Min etal. provided some example runtimes for different depthupscaling approaches [23], including JBU. Processingtime is based on many different factors and is usuallyhard to compare. With the given JBU references we cannormalize our own results to their evaluation and get anidea of the complexity of the different approaches.
5.2 Objective D-TSR EvaluationThe previous evaluation simulated the low resolutionToF depth maps by subsampling available high resolu-tion sources. The D-TSR weighting strategy introducesactive brightness, a specific ToF signal. Therefore theobjective D-TSR evaluation utilizes actual captured ToFdata.
We used the fixed ToF and video combination shownin 2(a). A Basler acA1300-30gc machine vision cameraon top of a Fotonic B70 ToF camera. The ToF camerahas a resolution of 160x120 pixels [7]. The machinevision camera is set to a 1280x960 pixels resolution andequipped with 3.5mm focal length lens to match the ToFcamera viewing angle [11]. Prior to capturing, the ToFcamera was kept running for approximately 20 minutesfor a stable working temperature of around 42 C.
The extrinsic and intrinsic parameters for both cam-eras were estimated with the camera calibration toolboxfor MATLAB available from [33], using a set of 40 cali-bration images. The estimated lens distortion coefficientswere used to correct lens distortions in the video andToF camera. With the estimated rotation matrix R andthe translation vector t between the two cameras andthe individual camera calibration matrices KI and KD,the ToF depth values are mapped on the correspondingpixel positions for the video camera view, following theprinciples explained in Sec. 2.2. The resulting sparsedepth map can then be filled using our TSR concept.
We assess the accuracy of the D-TSR result comparedto upscaling without active brightness weighting (S-TSR) in terms of distance and angular error betweentwo planes in 3D space. Fig. 6(a) shows our testingenvironment. We capture a flat surface with a gray andwhite checkerboard. The gray boxes reflect less light
This is the author's version of an article that has been published in this journal. Changes were made to this version by the publisher prior to publication.The final version of record is available at http://dx.doi.org/10.1109/TIP.2013.2287613
Copyright (c) 2013 IEEE. Personal use is permitted. For any other purposes, permission must be obtained from the IEEE by emailing [email protected].

8 TIP-10420-2013: SCHWARZ et al., ”A WEIGHTED OPTIMIZATION APPROACH TO TIME-OF-FLIGHT SENSOR FUSION”
than the white boxes and lead therefore to a loweractive brightness, equal to more depth sensor noise,as mentioned in Sec. 2.1. The effect of sensor noiseon the ToF depth readings is clearly visible. The lowactive brightness values in Fig. 6(b) translate to depthvariations on a flat surface in the upscaled depth maps inFig. 6(c) and (d). To evaluate the sensor noise error, we fittwo planes in 3D space. The white plane is defined by 3Dcoordinates captured from white boxes, the gray planeby 3D coordinates captured from gray boxes, shown inFig. 6(a). Four points are chosen from the upscaled depthmaps for each plane to fit the planes in a least squaresmanner. If the 3D coordinates are taken from differentupscaling strategies of the same depth map, as shownin Fig. 6(c) and (d), the difference between the fittedplanes in Fig. 6(e) and (f) gives a measurement for thedepth upscaling accuracy. We use the distance betweenthe fitted planes at the image center (x=640, y=320) andthe angle between the two planes as accuracy metrics.Since a flat surface is captured, lower distance and lowerangle differences are equal to higher depth accuracy.
The plane fitting procedure was performed on a set of20 test images, differing in camera distance and orien-tation. Each test image was captured with four differentToF exposure times (5ms, 10ms, 20ms and 40ms) to varythe influence of active brightness. Before capturing, itwas made sure that the active brightness values forall four exposure times lie within the value range ofα1 = 200 and α2 = 3000 mentioned in Sec. 4.2. Thelow resolution ToF depth maps were upscaled using S-TSR and D-TSR strategies to show the influence of errorweighting.
5.3 Objective T-TSR Evaluation
In preparation of the subjective tests, we performed aproof-of-concept evaluation for our temporal weightingimplementation. We used the test sequences ”Hall2”and ”Street” from Poznan University of Technology, twophotographic sequences with 1920x1088 pixel resolutionand estimated depth maps [34].These two sequencesrepresent a high (”Street”) and a low (”Hall2”) temporalactivity case. The provided depth map sequences weresubsampled by a factor of 8 to simulate a ToF to videoresolution ratio of 1:8. The low resolution depth mapswere upscaled with JBU, S-TSR and T-TSR to generate avirtual view using the ”View Synthesis Reference Soft-ware” (VSRS) [35] of the Moving Picture Expert Group(MPEG). For the case of ”Hall2” we upscaled depthmaps for the views 5 and 7 to synthesize view 6, for”Street” view 4 was generated from the views 3 and5. Since downsampled references were used, no errorweighting was applied for T-TSR, i.e. WA(x, y) = 1. Wealso evaluated three different weighting factors c2 forthe temporal error energy QT : c2 = 0.25; 0.5; 1 for Eq. 22with constant c2 = 0.5.
As evaluation metric, we chose the National Telecom-munications and Information Administration (NTIA)
(a) Texture with planes (b) Active brightness
(c) S-TSR depth (d) D-TSR depth
(e) S-TSR planes (f) D-TSR planes
Fig. 6. D-TSR objective evaluation: Captured texture(a) and active brightness (b). Depth upscaling results forS-TSR (c) and D-TSR (d) and the corresponding fittedplanes in 3D space (e,f). Please note the clearly visiblecheckerboard pattern if no error-weighting is applied (c).
General Model, also known as video quality metric(VQM) [36]. Standard image quality metrics, like thepeak signal-to-noise ratio (PSNR), are considered unreli-able [37] and do not include the temporal characteristicof video. VQM combines the perceptual effects of videoartefacts such as blurring, unnatural motion, flicker,noise, and block or color distortions into a single metric.Lately, VQM was evaluated based on the subjective testresults for the recent MPEG call for proposals (CfP) on3D Video Coding Technology [38] and showed good cor-relation with the subjective mean opinion scores (MOS)[39]. To avoid the influence of the DIBR algorithm on theevaluation, we assess the objective quality compared toview syntheses with the full resolution depth map, in-stead to the actual view from the virtual camera position.
5.4 Subjective EvaluationA major application for a video and ToF combination isthe capture of scene information for DIBR view synthesisin 3DTV systems. Reliable objective quality metrics forthis scenario are still under consideration [37]. Thereforewe performed an extensive subjective quality assessmentfor all three TSR weighting strategies compared to state-of-the-art depth map upscaling. In this context, quality
This is the author's version of an article that has been published in this journal. Changes were made to this version by the publisher prior to publication.The final version of record is available at http://dx.doi.org/10.1109/TIP.2013.2287613
Copyright (c) 2013 IEEE. Personal use is permitted. For any other purposes, permission must be obtained from the IEEE by emailing [email protected].

TIP-10420-2013: SCHWARZ et al., ”A WEIGHTED OPTIMIZATION APPROACH TO TIME-OF-FLIGHT SENSOR FUSION” 9
TABLE 1Middlebury evaluation for depth map upscaling by factor 8.
Algorithm Tsukuba Venus Teddy Conesall [%] time [s] all [%] time [s] all [%] time [s] all [%] time [s]
Bilinear upscaling 10.40 3.26 11.90 14.702D JBU [4] 9.04 0.61 2.04 0.94 14.00 0.95 14.70 0.952D JBU + MCM 9.71 0.23 2.01 0.33 16.10 0.34 16.70 0.343D JBU [14] 7.89 143.00 1.67 215.50 10.70 220.60 12.10 219.203D JBU + MCM 4.46 43.30 0.66 65.20 8.88 65.80 10.60 65.60WMF [23] 4.35 0.36 0.61 0.54 9.51 0.55 9.43 0.55S-TSR 3.29 0.30 0.42 0.63 6.08 0.57 4.81 0.63
is defined as the viewer’s preference of view synthesesbased on depth maps from different upscaling algo-rithms.
A key problem for the subjective evaluation of up-scaled ToF depth is the lack of reference, ruling out asubjective quality assessment using the double stimuluscontinuous quality scale (DSCQS) or double stimulusimpairment scale (DSIS). This motivated the choice ofa pair comparison (PC) scheme. The test participantswere presented two versions of a test sequence, A andB, and were asked to pick their preferred version. Thesequences in each pair comparison were presented twice:A-B-A-B-’vote’. Between each version was a 1s intervalwith 60% gray level, the voting interval was 6s long.
Four different test sources (SRC) were captured usingthe setup explained in the previous section, each 10s longat a frame rate of 25fps. Again, it was made sure that thestarting active brightness levels were within the valuerange of α1 = 200 and α2 = 3000. The four differentSRCs addressed the following user cases:• SRC 1: Video conferencing, little depth transition.• SRC 2: -”-, large depth transition (slow).• SRC 3: -”-, large depth transition (fast).• SRC 4: Global camera movement on a still scene.The captured low resolution depth was upscaled with
four algorithms, forming the separate error conditionor hypothetical reference circuits (HRC): JBU, as qualityreference, S-TSR, D-TSR and T-TSR. For each HRC theresulting depth map was used to synthesize virtualviews 50mm to the left and right of the captured centerview using MPEG VSRS [35], resulting in stereo viewpairs with 100mm baseline. This slightly wider baseline(typically value around 65mm) was chosen to accentuatethe impression of depth in the scenery.
The tests were performed in stereoscopic 3D viewingconditions on a DLP-projector (Acer H5360) in combina-tion with active shutter glasses (Nvidia 3D Vision). Thetesting environment followed the ITU recommendationsfor subjective quality assessment [40]. The test subjectswere placed at 4 meters viewing distance, equal to fourtimes the display height. The setup allowed two testsubjects simultaneously, with viewing angles between80-100.
The subjective evaluation was performed with 24 sub-jects, aged between 20 and 62. All subjects were screenedfor their ability to perceive stereo depth, as well as
color vision and visual acuity. Visual acuity, stereo andcolor vision were checked positively for all subjects. Theparticipants were distributed equally over four groups.Each group had a different randomized arrangement ofsequences to remove contextual effects and each arrange-ment started with four training sequences to train theviewers for the given task and accommodate to stereovision. The PC results were statistically analysed usingthe Bradley-Terry-Luce (BTL) model [41], a probabilitymodel for pair wise comparisons. The BTL model calcu-lates the probability that one HRC is preferred over otherHRCs. A higher BTL score relates to an higher probabil-ity that this HRC is preferred. The BTL probability scoresand confidence intervals for each HRC were calculatedusing a BTL MATLAB implementation [42].
6 RESULTS AND ANALYSIS
In this section we present and discuss the results for thefour different evaluation arrangements.
6.1 Objective S-TSR Results
The objective S-TSR evaluation addressed the distortionin depth introduced by the upscaling process. The resultsof the automatic Middlebury evaluation are shown inTab. 1. The top six rows are taken from Min et al.[23], where an identical evaluation was performed. Thebottom row shows our results. The S-TSR processingtime is normalized with respect to a JBU implementationon our system to allow a comparision between thedifferent approaches. The evaluation results clearly favorour approach in terms of objective quality, while theprocessing time is about equal to the best competingapproach (WMF). The only faster implementation (2DJBU + MCM) is between 2.5-5 times worse in objectivequality. Fig. 7 shows S-TSR upscaling results for theMiddlebury test set for visual comparison with theresults presented in [23]. Together with our previousassessment presented in [6], S-TSR has proven itself asone of the leading approaches to texture guided depthmap upscaling.
6.2 Objective D-TSR Results
Fig. 8 shows increased depth accuracy due to the errorweighting introduced in D-TSR, compared to S-TSR.
This is the author's version of an article that has been published in this journal. Changes were made to this version by the publisher prior to publication.The final version of record is available at http://dx.doi.org/10.1109/TIP.2013.2287613
Copyright (c) 2013 IEEE. Personal use is permitted. For any other purposes, permission must be obtained from the IEEE by emailing [email protected].

10 TIP-10420-2013: SCHWARZ et al., ”A WEIGHTED OPTIMIZATION APPROACH TO TIME-OF-FLIGHT SENSOR FUSION”
(a) Tsukuba (b) Venus
(c) Teddy (d) Cones
Fig. 7. S-TSR depth map upscaling results for the Mid-dlebury test set. Competing results are presented in [23].
0,1
0,15
0,2
0,25
error in de
grees
0
0,05
,
5ms 10ms 20ms 40ms
angular e
(a) Angular error
6
8
10
12
ror in [%] of
range
S‐TSRD‐TSR
0
2
4
5ms 10ms 20ms 40ms
distance er
value
(b) Distance error
Fig. 8. Angular and distance error with standard deviationfor S-TSR and D-TSR at different exposure times.
Both, the angular (a) and the distance error (b) betweenthe two planes for gray and white boxes are decreasedin terms of mean value and standard deviation. Theeffect of low active brightness values is shown in alarger error at faster exposure time, while at a slowerexposure time, active brightness over-saturation leadsto less depth accuracy. The increased error for D-TSRat 5ms and 40ms exposure time points to a possiblytoo loose active brightness value range. A more limitedrange would address this problem. However, the effectsof both error sources, active brightness over- and under-saturation, are significantly reduced with D-TSR errorweighting.
6.3 Objective T-TSR Results
Fig. 9 illustrates the effects of temporal weighting onlow and high temporal activity content, as well as theinfluence of different weights c2 for the temporal errorenergy QT . Again, it is clearly visible how our TSR ap-proaches outperform JBU. However, temporal weightingdoes barely affect low activity content, as shown for thetest sequence ”Hall2” in Fig. 9(a). High activity content
0,060
0,065
0,070
M score
JBU
S‐TSR
T‐TSR c2=0.25
T‐TSR c2=0.5
T‐TSR c2=1 0
0,050
0,055
1
VQM T‐TSR c2=1.0
(a) Hall2
0,16
0,18
0,20
M score
0,10
0,12
0,14
VQM
(b) Street
Fig. 9. VQM results for Poznan test sequences. Upscal-ing by factor 8 with JBU, S-TSR and T-TSR with varyingc2. Lower VQM score equal to better visual quality.
3
4
5
6
zed BTL score
0
1
2
JBU S‐TSR D‐TSR T‐TSR
norm
ali
(a)
1
1,5
2
2,5
zed BTL score
D‐TSR
T‐TSR
0
0,5
1
SRC 1 SRC 2 SRC 3 SRC 4
norm
ali
(b)
Fig. 11. BTL scores and 95% confidence intervals for thefour different HRCs. Normalized with respect to JBU (a).Comparison between D-TSR and T-TSR divided over thedifferent SRCs. Normalized with respect to D-TSR (b).
like ”Street” (b), benefits more from temporal weighting.Evaluating the interaction of temporal and spatial errorenergies in Eq. 22, we can assess that a 1:1 weightingwith c1 = c2 = 0.5 yields the best results for both cases.
6.4 Subjective Evaluation Results
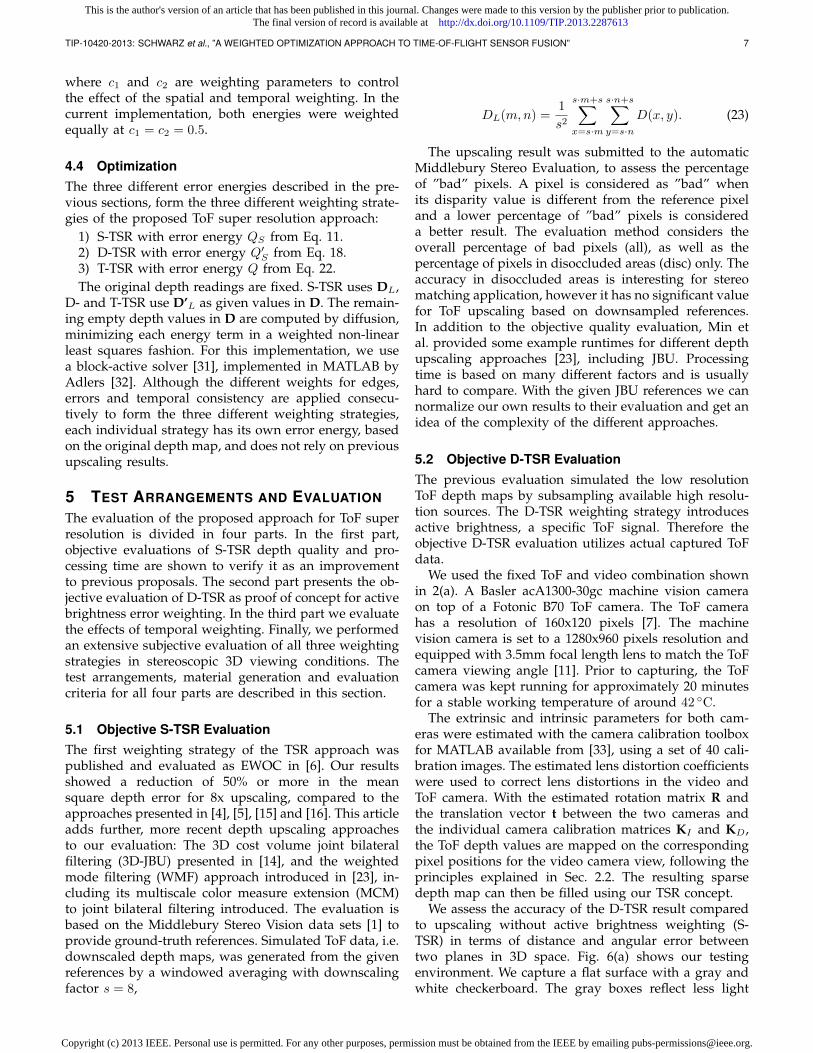
Fig. 10 gives examples of depth upscaling and viewsynthesis results for SRC 2. The top row shows depthmaps from different upscaling approaches. Here, theeffects of the error weighting are especially prominent.Depth readings with low active brightness (e.g. in theblack areas) are considered unreliable and are removedfrom the upscaling process, leading to the improvementsshown in Fig. 10(c) and (d). The middle row showsview synthesis examples, using the depth maps above.The bottom row shows details from these syntheses tohighlight the effects of the different depth upscalingstrategies. Here, the quality difference between JBU (i)and TSR based strategies (j-l) is clearly visible. However,this did not translated into our subjective evaluationresults, while the effect of error weighting is reflectedclearly in Fig. 11(a). On our website, we provide videosto follow the subjective evaluation alongside all neces-sary source material [43]. The videos show a clear effectof T-TSR on the depth map, however it is less visible inthe resulting view syntheses.
For the statistical evaluation of Fig. 11(a), it is impor-tant to mention that the calculated BTL model accountswell for the data, with a with a [χ2(3) = 1.33, p = 0.72]model fit. A BTL model should be rejected if the p value
This is the author's version of an article that has been published in this journal. Changes were made to this version by the publisher prior to publication.The final version of record is available at http://dx.doi.org/10.1109/TIP.2013.2287613
Copyright (c) 2013 IEEE. Personal use is permitted. For any other purposes, permission must be obtained from the IEEE by emailing [email protected].
TIP-10420-2013: SCHWARZ et al., ”A WEIGHTED OPTIMIZATION APPROACH TO TIME-OF-FLIGHT SENSOR FUSION” 11
(a) JBU depth (b) S-TSR depth (c) D-TSR depth (d) T-TSR depth
(e) JBU synthesis (f) S-TSR synthesis (g) D-TSR synthesis (h) T-TSR synthesis
(i) JBU synthesis details (j) S-TSR synthesis details (k) D-TSR synthesis details (l) T-TSR synthesis details
Fig. 10. Examples for the four HRCs. Depth upscaling results for SRC 2 (a-d), resulting synthesized right view (e-h),and synthesis distortion details in fore- and background (i-l).
is below 0.1 [42]. The subjective evaluation shows astrong significant preference of around 1:4 for D- andT-TSR. For both cases give a significant improvementin subjective quality. The preference scores for JBU andS-TSR are almost identical. We assume that the jumpin quality due to error weighting is so large, that anyminor quality differences are masked out by the HVS.This assumption also gives a possible explanation for thesimilarity between D- and T-TSR. To assess the influenceof temporal weighting further, Fig. 11(b) shows the BTLscores for a direct pair comparison between D- and T-TSR, divided in the four different SRCs. It is interestingto note that for SRC 3, a sequence with large and fastdepth transitions, temporal weighting in T-TSR givesan increase in viewer preference. This increase pointsin the same direction as the objective T-TSR evaluationin Fig. 9, with advantages of T-TSR for higher activitycontent. However, since this pair comparison is basedon a sub-set of the whole subjective evaluation, theconfidence intervals are rather large and no statisticalverified conclusion can be drawn.
7 CONCLUSIONS
In this paper we presented an approach to simplify scenedepth capture for applications relying on accurate depthdata, e.g. in manufacturing, quality control, roboticsand 3D media. Time-of-Flight cameras can overcomethe short-comings of traditional scene depth from stereoanalysis and their limited spatial resolution can be over-come with texture guided depth map upscaling.
Within this context, we proposed a sensor fusionapproach for ToF super resolution. Unlike competingproposals, we interpreted the ToF depth upscaling pro-cess as a weighted energy optimization problem. Threedifferent weighting functions were addressed: The firstweight was generated by a combination of low res-olution ToF depth and corresponding high resolutiontexture information from a video source, to ensure sharptransitions in depth at object boundaries. The secondweight was generated from the received ToF activebrightness signal, a measure for depth reading accuracy,to reduce the effects of ToF sensor noise. The last weightwas generated from the previous upscaling result ofa depth map sequence, to reduce temporal artifacts indepth. The weights can be applied in consecutive order,forming the three weighting strategies of our proposal:(S)ingle-, (D)ouble-, and (T)riple-weighted ToF superresolution (TSR).
The separate strategies of our approach were evalu-ated with special focus on 3D entertainment applica-tions. Objective results show advantages in terms ofdepth accuracy and view synthesis quality, comparedto state-of-the-art texture guided depth map upscaling.It was further shown that error-weighting, introducedin D-TSR, increases the depth accuracy compared to S-TSR. In addition to the objective evaluation, we assessedthe depth upscaling quality subjectively for DIBR viewsynthesis in stereoscopic viewing conditions. To ourknowledge, this was the first extensive subjective testperformed on texture guided ToF depth upscaling. Thetest was conducted with 24 test subjects and our results
This is the author's version of an article that has been published in this journal. Changes were made to this version by the publisher prior to publication.The final version of record is available at http://dx.doi.org/10.1109/TIP.2013.2287613
Copyright (c) 2013 IEEE. Personal use is permitted. For any other purposes, permission must be obtained from the IEEE by emailing [email protected].
12 TIP-10420-2013: SCHWARZ et al., ”A WEIGHTED OPTIMIZATION APPROACH TO TIME-OF-FLIGHT SENSOR FUSION”
showed a significantly increase in viewer preferenceof a factor of four due to error weighting. Additionaltemporal weighting did not lead to significant changes inviewer preference. Nonetheless, objective and subjectiveresults point at an advantage for high temporal activitycontent with fast depth transitions. However, at thispoint there is no statistical proof and this assumptionwill be addressed in future research.
Concerning the subjective quality assessment, it wouldbe very interesting to evaluate further parameters in thecontext of stereo vision. Some subjects reported severeeye strain and dizziness during the test, especially forthe two lower performing HRCs. Future research shouldinclude more criteria, such as visual comfort, depthexperience or naturalness, for a more holistic Quality ofExperience (QoE) evaluation. Other future topics includethe fusion of more than one video and ToF combinationwith additional depth map cross-verification.
REFERENCES
[1] D. Scharstein and R. Szeliski, “A taxonomy and evaluation ofdense two-frame stereo correspondence algorithms,” InternationalJournal of Computer Vision, vol. 47, no. 1-3, pp. 7–42, 2002.
[2] D. Herrera C., J. Kannala, and J. Heikkila, “Joint depth and colorcamera calibration with distortion correction,” Pattern Analysis andMachine Intelligence, IEEE Trans. on, vol. 34, pp. 2058–2064, 2012.
[3] R. Lange and P. Seitz, “Solid-state time-of-flight range camera,”Quantum Electronics, IEEE Journal of, vol. 37, no. 3, pp. 390–397,2001.
[4] J. Kopf, M. F. Cohen, D. Lischinski, and M. Uyttendaele, “Jointbilateral upsampling,” Graphics, ACM Trans. on, vol. 26, no. 3,2007.
[5] J. Diebel and S. Thrun, “An application of markov random fieldsto range sensing,” in Proceedings of Conference on Neural InformationProcessing Systems. Cambridge, MA, USA: MIT Press, 2005.
[6] S. Schwarz, M. Sjostrom, and R. Olsson, “Depth map upscalingthrough edge weighted optimization,” in Proceedings of the SPIE,vol 8290: Conference on 3D Image Processing and Applications, 2012.
[7] Fotonic, “B70 Time-of-Flight camera,” (04.05.2012). [Online].Available: http://www.fotonic.com/assets/documents/fotonicb70 highres.pdf
[8] B. Buttgen, T. Oggier, M. Lehmann, R. Kaufmann, and F. Lusten-berger, “CCD/CMOS lock-in pixel for range imaging : Challenges,limitations and state-of-the-art,” Measurement, vol. 103, 2005.
[9] M. Frank, M. Plaue, H. Rapp, U. Kothe, B. Jahne, and F. A.Hamprecht, “Theoretical and experimental error analysis ofcontinuous-wave time-of-flight range cameras,” Optical Engineer-ing, vol. 48, no. 1, 2009.
[10] S. May, B. Werner, H. Surmann, and K. Pervolz, “3d time-of-flightcameras for mobile robotics,” in Intelligent Robots and Systems, 2006IEEE/RSJ International Conference on, 2006.
[11] Basler, “aca1300-30gc industrial camera,” (04.05.2012). [On-line]. Available: http://www.baslerweb.com/products/ace.html?model=167
[12] P. Didyk, T. Ritschel, E. Eisemann, K. Myszkowski, and H.-P.Seidel, “A perceptual model for disparity,” Graphics, ACM Trans.on, vol. 30, no. 4, 2011.
[13] C. Tomasi and R. Manduchi, “Bilateral filtering for gray and colorimages,” in Computer Vision, 1998. 6th International Conference on,1998.
[14] Q. Yang, R. Yang, J. Davis, and D. Nister, “Spatial-depth superresolution for range images,” in Computer Vision and PatternRecognition, 2007. CVPR ’07. IEEE Conference on, 2007.
[15] D. Chan, H. Buisman, C. Theobalt, and S. Thrun, “A noiseawarefilter for real-time depth upsampling,” in Workshop on Multi-camera and Multi-modal Sensor Fusion, 2008.
[16] F. Garcia, B. Mirbach, B. Ottersten, F. Grandidier, and A. Cuesta,“Pixel weighted average strategy for depth sensor data fusion,”in IEEE 17th International Conference on Image Processing, 2010.
[17] C. Kim, H. Yu, and G. Yang, “Depth super resolution usingbilateral filter,” in Image and Signal Processing, 2011 4th InternationalCongress on, 2011.
[18] A. K. Riemens, O. P. Gangwal, B. Barenbrug, and R.-P. M. Berretty,“Multistep joint bilateral depth upsampling,” Visual Communica-tions and Image Processing 2009, vol. 7257, no. 1, p. 72570M, 2009.
[19] J. Lu, D. Min, R. Pahwa, and M. Do, “A revisit to MRF-baseddepth map super-resolution and enhancement,” in Acoustics,Speech and Signal Processing, 2011 IEEE International Conference on,2011.
[20] J. Zhu, L. Wang, J. Gao, and R. Yang, “Spatial-temporal fusion forhigh accuracy depth maps using dynamic mrfs,” Pattern Analysisand Machine Intelligence, IEEE Trans. on, vol. 32, pp. 899–909, 2010.
[21] J. Park, H. Kim, Y.-W. Tai, M. Brown, and I. Kweon, “High qualitydepth map upsampling for 3d-tof cameras,” in Computer Vision(ICCV), 2011 IEEE International Conference on, 2011.
[22] B. Huhle, T. Schairer, P. Jenke, and W. Straıer, “Fusion of rangeand color images for denoising and resolution enhancement witha non-local filter,” Comput. Vis. Image Underst., vol. 114, no. 12,pp. 1336–1345, Dec. 2010.
[23] D. Min, J. Lu, and M. Do, “Depth video enhancement based onweighted mode filtering,” Image Processing, IEEE Transactions on,vol. 21, no. 3, pp. 1176–1190, Mar. 2012.
[24] L. C. Zitnick, S. B. Kang, M. Uyttendaele, S. Winder, andR. Szeliski, “High-quality video view interpolation using a lay-ered representation,” Graphics, ACM Trans. on, vol. 23, no. 3, 2004.
[25] S. Schwarz, M. Sjostrom, and R. Olsson, “Improved edge detec-tion for EWOC depth upscaling,” in Systems, Signals and ImageProcessing, 2012 19th International Conference on, 2012.
[26] J. Canny, “A computational approach to edge detection,” PatternAnalysis and Machine Intelligence, IEEE Trans. on, vol. 8, pp. 679–698, 1986.
[27] E. Gelasca, T. Ebrahimi, M. Farias, M. Carli, and S. Mitra,“Annoyance of spatio-temporal artifacts in segmentation qualityassessment [video sequences],” in Image Processing, 2004. ICIP ’04.2004 International Conference on, 2004.
[28] W.-S. K., A. Ortega, P. L., D. Tain, and C. Gomila, “Depth mapdistortion analysis for view rendering and depth coding,” in ImageProcessing, 2009 16th IEEE International Conference on, 2009.
[29] M. Lambooij, M. Fortuin, I. Heynderickx, and W. IJsselsteijn,“Visual discomfort and visual fatigue of stereoscopic displays: Areview,” Journal of Imaging Science and Technology, vol. 53, no. 3,pp. 30 201–1–30 201–14, 2009.
[30] S. Baker, D. Scharstein, J. P. Lewis, S. Roth, M. J. Black, andR. Szeliski, “A database and evaluation methodology for opticalflow,” Int. J. Comput. Vision, vol. 92, no. 1, pp. 1–31, Mar. 2011.
[31] L. F. Portugal, J. J. Judice, and L. N. Vicente, “A comparisonof block pivoting and interior-point algorithms for linear leastsquares problems with nonnegative variables,” Mathematics ofComputation, vol. 63, pp. 625–643, 1994.
[32] M. Adlers, “Sparse least squares problems with box constraints,”Licentiat thesis, Department of Mathematics, Linkoping Univer-sity, Linkoping, Sweden, 1998.
[33] J.-Y. Bouguet, “Camera calibration toolbox for Matlab,”(09.07.2010). [Online]. Available: http://www.vision.caltech.edu/bouguetj/calib doc/
[34] M. Domanski, T. Grajek, K. Klimaszewski, M. Kurc,O. Stankiewicz, J. Stankowski, and K. Wegner, “Poznanmultiview video test sequences and camera parameters,”ISO/IEC JTC1/SC29/WG11 MPEG2009/M17050, Oct. 2009,Xian, China.
[35] “Report on experimental framework for 3D video coding,”ISO/IEC JTC1/SC29/WG11 MPEG2010/N11631, Oct. 2010,Guangzhou, China.
[36] ITU, “Objective perceptual video quality measurement techniquesfor standard definition digital broadcast television in the presenceof a full reference,” International Telecommunication Union, Tech.Rep. ITU-R BT.1683, 2004.
[37] E. Bosc, R. Pepion, P. Le Callet, M. Koppel, P. Ndjiki-Nya, M. Pres-sigout, and L. Morin, “Towards a new quality metric for 3-dsynthesized view assessment,” Selected Topics in Signal Processing,IEEE Journal of, vol. 5, no. 7, pp. 1332–1343, 2011.
[38] “Call for proposals on 3D video coding technology,” ISO/IECJTC1/SC29/WG11 MPEG2011/N12036, Mar. 2011, Geneva,Switzerland.
This is the author's version of an article that has been published in this journal. Changes were made to this version by the publisher prior to publication.The final version of record is available at http://dx.doi.org/10.1109/TIP.2013.2287613
Copyright (c) 2013 IEEE. Personal use is permitted. For any other purposes, permission must be obtained from the IEEE by emailing [email protected].

TIP-10420-2013: SCHWARZ et al., ”A WEIGHTED OPTIMIZATION APPROACH TO TIME-OF-FLIGHT SENSOR FUSION” 13
[39] P. Hanhart and T. Ebrahimi, “Quality assessment of a stereo pairfrom decoded and synthesized views using objective metrics,” in3DTV-Conference, 2012.
[40] ITU, “Methodology for the subjective assessment of the qualityof television pictures,” International Telecommunication Union,Tech. Rep. ITU-R BT.500-12, 2009.
[41] R. A. Bradley and M. E. Terry, “Rank analysis of incomplete blockdesigns: I. the method of paired comparisons,” Biometrika, vol. 39,no. 3/4, pp. 324–345, 1952.
[42] F. Wickelmaier and C. Schmid, “A Matlab function to estimatechoice model parameters from paired-comparison data,” BehaviorResearch Methods, Instruments, & Computers, vol. 36, pp. 29–40,2004.
[43] S. Schwarz, “Weighted optimization approach,”2013. [Online]. Available: https://www.miun.se/en/Research/Our-Research/Centers-and-Institutes/stc/Research-within-STC/Research-Groups/Realistic-3D/ToFdata
Sebastian Schwarz (SM’09, GSM’12) receivedthe Dipl.-Ing. degree in Media Technology fromthe Technical University of Ilmenau, Germany,in 2009, and the Licentiate degree from MidSweden University, Sweden, in 2012. He iscurrently pursuing the Ph.D. degree from theDepartment of Information and CommunicationSystems, Mid Sweden University. His main re-search interests are scene depth capture, Time-of-Flight cameras and texture guided depth mapupscaling.
Marten Sjostrom (GSM’92, M’01) receivedthe MSc in Electrical Engineering and AppliedPhysics from Linkoping University, Sweden, in1992, the Licentiate of Technology degree inSignal Processing from KTH, Stockholm, Swe-den, in 1998, and the Ph.D. degree in Modelingof Nonlinear Systems from EPFL, Lausanne,Switzerland, in 2001. He joined the Depart-ment of Information and Communication Sys-tems, Mid Sweden University in 2001; as of 2008he is Associate Professor. In the course of his
employment, he has been appointed Head of Division and Member ofDepartment board. He is the founder and leader of the research groupRealistic 3D. His current research interests are within system modelingand identification, as well as 2D and 3D image and video processing.
Roger Olsson (GSM’06, M’10) received theMSc in Electrical Engineering and PhD inTelecommunications from Mid Sweden Univer-sity (MIUN) in 1998 and 2010 respectively. Hejoined the Department of Information and Com-munication Systems at MIUN in 2000 as a lec-turer in signal processing and telecommunica-tions. He is a founding member of the researchgroup Realistic 3D at MIUN. His research in-terests include plenoptic computational imag-ing and modeling, processing of Time-of-Flight
depth data, and DIBR processing and distribution.
This is the author's version of an article that has been published in this journal. Changes were made to this version by the publisher prior to publication.The final version of record is available at http://dx.doi.org/10.1109/TIP.2013.2287613
Copyright (c) 2013 IEEE. Personal use is permitted. For any other purposes, permission must be obtained from the IEEE by emailing [email protected].