does weak rupee matter for india’s manufacturing … does weak rupee matter for india’s...
TRANSCRIPT

Does Weak Rupee Matter for India’s Manufacturing Exports?
N. R. Bhanumurthy and Chandan Sharma
Working Paper No. 2013-115
January 2013
National Institute of Public Finance and Policy
New Delhi
http://www.nipfp.org.in

2
Does Weak Rupee Matter for India’s
Manufacturing Exports?
N R Bhanumurthy*
and
Chandan Sharma**
Abstract
The role of weak exchange rate in stimulating exports is a foregone conclusion both at the theoretical as well as in empirical literature. This is more so in many of the emerging economies that are pursuing export-led growth strategy and led to currency intervention to contain any appreciation. In this context, this paper tries to empirically re-examine this issue in India as the recent trends does not suggest such relation between exports and exchange rate. The analysis is undertaken at two levels: at macro-aggregate level by using some time series models; and at the micro-firm level from the Indian manufacturing industries. At the macro level, by using both annual and monthly data, this study finds that exchange rate does not have theoretical (positive) relationship with exports. Rather it finds a negative relationship, which is unconventional. Further, it is also found that imports and the import tariffs playing a major role in boosting exports growth in India, thus indicating ‘import-led exports growth’ mechanism. Subsequently, the paper examines the relationship between exports, imports, exchange rate and productivity using a panel of firms from the Indian manufacturing industries. Results indicate that, although imports and exports are inter-linked, import intensity, rather than exchange rate, is a major factor in boosting exports as well as productivity. Hence, this paper argues against currency intervention to maintain weak exchange rate as a policy option for export promotion. Rather, as exchange rates have differential impacts, we argue for sectoral policies, instead of exchange rate intervention, for enhancing productivity and, hence, exports in manufacturing sector. JEL: F14, F31, D24 Key words: Exchange Rate Intervention, Export, Import, Productivity, India
* Professor, National Institute of Public Finance and Policy, New Delhi. E-mail for correspondence:
[email protected] **Assistant Professor, Indian Institute of Management, Lucknow, India, Email:
[email protected]. Earlier version of this paper was presented in an international conference on “Economic Growth, Trade, and Poverty” jointly organized by ISEC, Bangalore, and Sichuan Academy of Social Sciences (SASS), Chengdu, Sichuan, China during 6-7 December 2012 at ISEC, Bangalore and also at the 49
th Annual conference of the Indian Econometric Society, at Patna, December 2012.
We would like to thank Parmod Kumar and other conference participants for their valuable comments. However, any errors and omissions are authors’ alone.

3
Does Weak Rupee Matter for India’s
Manufacturing Exports?
Introduction
In the era of globalisation, most of the economies, particularly the newly emerging market economies, adopted an export-led growth strategy that was considered to be more efficient strategy in enhancing the growth potential of the domestic economy as well as improve productivity in non-exporting sectors through its spillover effects. This strategy, at least until the on-set of recent global crisis, appears to have lifted many economies from low growth regimes to reasonably high growth path. This is clearly visible in the countries such as China and India, which continued to be top two fastest growing countries in the world. Nevertheless, for a large number of countries that have attempted to follow similar policy, the results have not been very encouraging.
One important instrument that has been adopted to sustain the high export growth in the fastest growing economies is the exchange rate and its management. Based on the existing theoretical literature, it is generally assumed that exchange rate is one of the major determinants of exports. In particular, the traditional theories say that exchange rate depreciation would encourage exports and vice versa. However, studies which have tested the impact of currency intervention for trade benefits have found very mixed results (e.g., Bahmani-Oskooee, 1986; Felmingham,1988; Mahdavi and Sohrabian, 1993). Since the influential work of Bahmani-Oskooee and Ardalani (2006), there has been a strand of literature that contends that the traditional studies may suffer from the aggregation bias problem, because significant exchange rate impacts with some industries in a country could be more than offset by insignificant exchange rate effects with others, thereby resulting in an insignificant exchange rate impact overall and vice versa. The issue has motivated another strand of literature which mostly relies on a standard trade balance model in which the trade balance is specified as a function of exchange rate and other determinants. By modeling exports and imports together, however, this conventional approach is not able to directly detect which sector is relatively more sensitive towards the exchange rate interventions. As a result, therefore, there is a need to test the impact of exchange rate intervention on components of trade separately. Furthermore, in this context, to decode the underlying linkage, it is also important to know the interdependency of exports and imports. Because in several emerging economies exports are heavily dependent of imported inputs (see, Sharma, 2011).
The recent criticism on China’s exchange rate management is critically based on this understanding and there were extraordinary global pressures for the appreciation of Chinese Renminbi. Many countries (including India) devalued their currencies when they faced with external balance crisis while many have adopted the regimes (such as fixed, pegged, managed, etc.) that are less influenced by the short term market forces. However, the recent experiences in some countries doubt this perceived wisdom about the relationship between exchange rate and exports growth. This is more so in the post-global crisis period, which affected the emerging economies both through trade and

4
confidence channels, where the global trade has declined substantially while at the same time putting depreciating pressure on the currencies of fast growing economies. In this context what this paper tries is to re-examine this issue in the case of India and see whether conventional wisdom still hold good.
Another related issue is the link between overall growth and the growth of export and import. It is widely debated that growth in the economy can be due to a productivity improvement, which is led by export and import. Furthermore, it is also witnessed that export and import growth is due to productivity growth (e.g. Amiti and Konings, 2007; Kasahara and Rodrigue, 2008; Sharma and Mishra, 2011; Sharma, 2011). The recent evidence suggests that results are somewhat mixed. For example, Kwan et al., (1995) found that China’s growth is the “export-led” type while Boltho (1996) found that Japan’s economic growth was mainly due to the domestic forces rather than foreign demand. Thus, the important question is how can these two scenarios be distinguished?
Against this background, this study tries to examine the role of exchange rate on exports in three stages. First, using macro data we attempt to test the determinants of exports in India including imports and exchange rate. Second, we examine the inter-linkage between exporting and importing at firm-level. Finally we also attempt to test whether growth in India is export-led or import led at firm-level. Our analysis in this study to relook at this critical relationship is quite pertinent to have effective and well-informed exchange rate management policy. In the next section, we look at the recent trends in exchange rates and exports growth behaviour in India, which forms as main motivation for this work. Following this, in Section 3 we undertake simple empirical exercises based on the macro data. Section 4 attempts to provide a discussion on data and empirical issues related to firm-level data. Section 5 discusses empirical models and results for the firm-level analysis. Section 6 empirically tests the role of export and import in the productivity performance at firm-level. The final section concludes the findings of study and provides policy suggestions.
2. Recent trends in India
In the post-Crisis period, India’s external sector has seen substantial fluctuations. In particular, the exchange rate, which appreciated to below 40 Rupees per US dollar in 2007-2008, has depreciated to around 50 just after the crisis. However, this depreciation was largely ignored as during the same time there was substantial capital outflow. But the appreciation of Rupee in the middle of 2010, when the exports started showing some recovery signs has led to huge demand that such appreciation could restrain exports sector from recovery. There was substantial pressure on the central bank to intervene in the foreign exchange market to contain any further appreciation and help in boosting exports, which is a crucial driver of overall economic growth reforms in India
1. Although
this appreciation was short-lived and since middle of 2011 the Rupee depreciated sharply
1 See, Shankar Acharya’s columns appeared in April 10, April 24, and September 23, 2010 in
Business Standard. Also see, SS Tarapore on 21st May in Business Line titled “Why Rupee must
be contained”. Last para says “The RBI should seriously consider the carefully constructed advice, of Mr Shankar Acharya, Mr A.V. Rajwade, Mr R.H. Patil and Mr Ajit Ranade, to refrain from appreciating the rupee.” Counter view was published by us in Economic Times dated 6
th July with
the title “Tweaking forex rates to tame Re may be risky”.

5
and reached to a historically low of close to 57 in middle of July 2012. These trends are presented in graph below. A graphical look at the behaviour of exchange rate and (merchandise) exports growth since 2004 clearly question the conventional argument that weak exchange rate shall support exports growth. It may be noted from the figure that in each episode of exchange rate depreciation, the exports growth has declined while in the appreciating periods, the exports growth have indeed increased. In fact in the later period (since third quarter of 2011) sharp depreciation is accompanied by substantial reduction in exports growth (rather negative growth indicating decline in levels as well). The correlation coefficient between these two found to be -0.56 (with REER it is 0.62) and is significant and motivating us to deeply look into to the role of exchange rate in determining exports in India.
Figure 1: Trends in Exchange Rate and Exports Growth
Source: RBI
There are a number of studies that empirically estimated export functions by using theoretical variables such as exchange rate, external demand, productivity differentials, relative prices, as well as some qualitative variables such as distance, language, size, trade agreements, etc. Many studies have supported the view of positive impact of depreciating exchange rate on exports growth. However, this would depend on the commodity that one exports. Tharakan et al (2005) show that the determinants of exports of goods are different from exports of services. On the merchandise exports, a recent study by Veeramani (2008) supports the traditional understanding and show that exchange rate appreciation does have a negative impact on merchandise exports, although it did find that such effect diminishing since 2002. However, interestingly, the study does not find such relation when the commercial services are considered. Similarly, recent study by Ahmed (2009) show that in the case of China, the growth of both processed exports (that have high import content) as well as non-processed exports is
-40
-20
0
20
40
60
80
0
10
20
30
40
50
60
20
04
M4
20
04
M8
20
04
M1
2
20
05
M4
20
05
M8
20
05
M1
2
20
06
M4
20
06
M8
20
06
M1
2
20
07
M4
20
07
M8
20
07
M1
2
20
08
M4
20
08
M8
20
08
M1
2
20
09
M4
20
09
M8
20
09
M1
2
20
10
M4
20
10
M8
20
10
M1
2
20
11
M4
20
11
M8
20
11
M1
2
20
12
M4
exchange rate exports growth

6
dampened down due to recent real appreciation of renminbi2. On the contrary, some
studies on Singapore and UK reject the traditional view and show that exchange rate changes does not have much impact on the exports (particularly of the one’s that have high import content). However, on the services exports, they did find support of the traditional models
3. Some studies have shown that it is the volatility, rather than the
level, of exchange rate that have adverse impact on imports. This is consistent with the India’s central bank’s recent shift in policy to intervene in the foreign exchange market majorly to contain volatility in the exchange rate
4.
From the literature, one may conclude that the role of exchange rate in stimulating exports is ambiguous
5. The determinants of exports might depend on various
other aspects other than that suggested by the traditional models. They could depend on the import content, exchange rate volatility, trade policies, productivity levels, as well as competitiveness. Hence, it is necessary to understand the behaviour of exports while manipulating the exchange rates through intervention. In the next section we empirically examine the relationship between exchange rates and exports in the case of India.
3. Exchange Rate and Exports: a Macro Analysis
In this section we attempt to empirically examine the relationship between exchange rate and exports growth by using both annual as well as monthly data. We follow both simple regressions as well as causality-cointegration analysis depending on the time series properties of the series. As this exercise is largely an empirical one, various combinations are examined to understand the behavior of exports. Broad export function for this analysis is
As we understand from the two decades of economic reforms, apart from the multilateral and bilateral trade agreements, substantial policy changes in the external sector was undertaken in the way exchange rate was managed and bringing down sharply the import-weighted average tariff rates from 77 percent in 1991-92 to 9 percent by 2010-11. Both these changes were expected to have some impact on the surge in exports in India. The exchange rate policies have evolved from the pegged regime to managed regime and further the RBI in the recent period showed that it is more concerned about containing the volatility rather than the level of the exchange rate. Thus, off-late central bank intervention, which is been singled out as one major driver of foreign exchange market
6, appears to be limited only to contain volatility. In addition to these
variables, world GDP is a crucial variable for export demand and expected to have
2 Smith (2004) finds similar results in the case of New Zealand where export volumes of services
responding more to changes in exchange rates compared to export volumes in commodity producing sector. 3 See, Abeysinghe & Yeok (1998) for Singapore and Greenaway et a.l (2007) in the case of UK
firms . 4 See, Fang & Miller (2004)
5 Even in the case of India Mundle, et al. (2011) estimates an exports function with import tariffs
rather than exchange rate, as exchange rate found to be insignificant. 6 See Bhanumurthy (2006)

7
positive impact. Recent trends in global growth as well as India’s exports clearly show that they are strongly related with a correlation coefficient of 0.82. With this understanding, empirical analysis is carried out on the macro data.
Table 1: OLS Regressions (with exports growth as dependent variable)
Variables Model -1 Model-2 Model-3 Model-4 Model-5 Model-6
Constant 0.118 0.102 0.06 -4.57 1.02 -6.14
Nominal Exchange rate
-0.689* -0.22
REER 0.773* 1.02* 1.35*
Imports growth 0.26* 0.28*
Import Tariff -0.003* -0.006*
World Growth 2.271 1.871 1.97 3.56* 3.47* 0.93
0.61 0.37 0.48 0.68 0.68 0.69
DW statistics 1.56 1.26 1.72 1.56 1.56 2.26
Note: * indicates significance; annual data is from 1991-92 to 2010-11
Various combinations of export functions are estimated and some are presented in Table 1. Across the models, one clear result that is emerging is that depreciating exchange rate (both nominal and real) does not appear to support exports growth in India in the post-reform period. Rather, the results show a reverse relationship and in many cases highly significant as well. We also tried with imports and import tariffs where imports growth found to show positive impact on exports growth while import tariffs show a negative and significant impact on the exports growth. One obvious question from these results is whether exports growth in India is ‘import-led’? This needs some more robustness checks as they are clearly unconventional results. We estimate some Granger causality tests and find that there is no causation running from exchange rates to exports while there is a strong bi-directional causation between imports and exports. Further, similar analysis was carried out using monthly data from April 2004 to July 2012. Here we use an additional variable, namely exchange rate volatility, which is the standard deviation of daily nominal exchange rates, as this possess risk to the exports and export earnings. As the time series properties are mixed among these variables (stationary of different orders) ARDL models are estimated. Our result shows that there is a long-run relationship between exports, imports and exchange rate with an optimum lag structure of (2,0,1). The long run relationship is Export = 85.24+0.72*Imports-25.01*ER (1) (4.82) (-0.39)
= 0.912, D.W = 1.523 and the error correction equation is dexport = -0.46dexport1+0.19dimport-485.92dER-0.25ECM(-1) (2) (-3.07)* (2.18)* (-2.45)* (-1.7)*
= 0.893, D.W = 1.458 From the ECM equation, one may note that imports showing a positive and significant impact on exports while exchange rates having a negative sign and significant indicating that exchange rate depreciation does not support exports growth. We also

8
estimated various combinations of models and the results are at best support the view that exchange rates are not a significant driver of exports growth in India atleast in the post-reform period. However, imports consistently support exports in both the analysis. One hypothesis from this could be that imports in India are supporting the exports through improving domestic innovation and productivity and improving the export competitiveness (both in terms of price and product) in the international markets.
4. Firm-level Analysis: Data and Empirical Issues
After testing the determinants of exports at macro-level, in this section, we attempt to explore this issue further using firm level information in the selected industries of the Indian manufacturing sector. Specifically, we attempt to examine the inter-linkage between export, import and productivity of firms in the selected important industries. In this context, this section provides a discussion on data and other empirical issues.
4.1. The Data
The dataset contains yearly information on Indian manufacturing firms from 1994 to 2006, obtained from Prowess database
7. Our sample covers firms in four industries:
Cotton textile (93 firms), Electrical (83 firms), Pharmaceutical (87 firms) and Transport equipment (Automobile &Auto-ancillary) (94 firms). We select these industries on the basis of their importance in the economy and their size (we prefer industries which have large number of firms). We select the firms from these industries for our analysis on the basis of availability of data and firms with missing data of more than one year in the database are excluded from the study. The primary data series extracted from the company accounts are sales, wages & salaries expenses, gross value added, expenses incurred on raw materials, power, fuel and energy, and R&D activates. Since our focus in this study is on export and import of firms, we also take these series from the same database. Two capitals related data series namely gross fixed capital and investment are also taken from Prowess database. To obtain number of workers information of firms, we use Annual Survey of Industry (ASI) as well. Prowess database does not provide number of workers information, but it does provide data on salaries and wages. We obtain average wage rate (total emoluments/total man days) data of the industry from ASI database and each firms’ salaries and wages divided by the average wages rate, which gives number of workers information of firms. For capital, a real capital stock series is constructed using the perpetual inventory capital adjustment Method. We adhere to the construction process outlined by Levinsohn and Petrin (2007) since that is the methodology used in the TFP estimation process
8. Our data series are deflated with
7Prowess Database is online database provided by the Centre for Monitoring Indian Economy
(CMIE). The database covers financial data for over 10000 companies operating in India. Most of the companies covered in the Database are listed on stock exchanges, and the financial data includes most of the information that operating companies are required to disclose in their annual reports. The accepted disclosure norms under the Indian Companies Act, 1956, make compulsory for companies to report all heads of income and expenditure, which account for more than 1 percent of their turnover. 8Specifically, we compute it as ttt IKK 1)1(
9
appropriate deflators. Output related data are deflated by industry specific Wholesale Price indices (WPI). This deflator is obtained from Office of the Economic Adviser (OEA), the Ministry of Commerce & Industry of India (http://eaindustry.nic.in/), while raw materials series is deflated by the all commodities WPI, and the energy series is deflated using the Energy Price Index as provided by the OEA. The capital data is deflated by capital deflator, which is obtained from Handbook of Statistics on Indian Economy (RBI) (http://www.rbi.org.in).
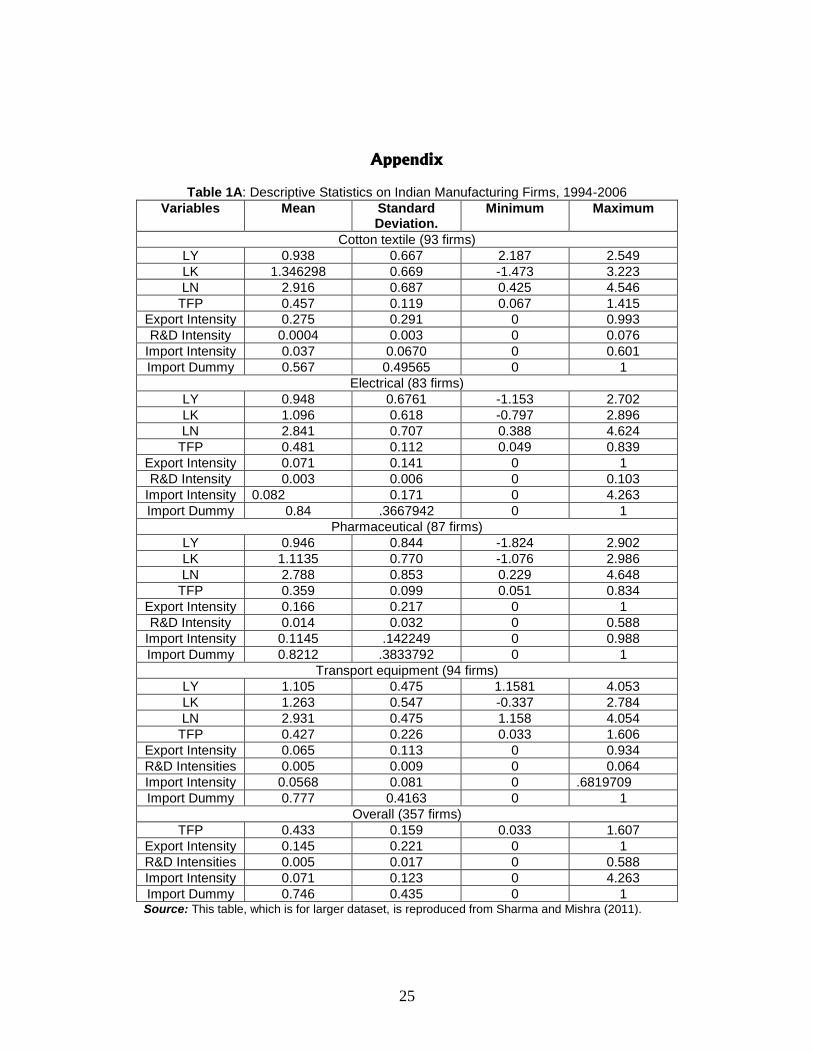
9 The descriptive statistics of above variables are presented in
Table 1A of Appendix.
4.2. TFP Estimation Results
To fulfill objectives of this section of the present study, firstly we need to estimate TFP of firms. This is done separately for all the four industries included in our sample. In estimating production function, use of ordinary least squares (OLS) may lead to serious problem of inputs correlating with error terms (see Griliches and Mareisse, 1995). As profit-maximising firms immediately adjust their inputs (in particular capital) each time they observe productivity shock, which makes input levels correlated with the same shocks. Since productivity shocks are unobserved, they enter in the error term of the regression. Hence, inputs turn out to be correlated with the error term of the regression, and thus OLS estimates of production functions are biased. Olley and Pakes (1996) and Levinsohn and Petrin (2003) have developed two similar semi-parametric estimation procedures to overcome this problem. Here Levinsohn and Petrin (2003) estimation technique has been used, which has been proved to be a superior method, to estimate the TFP of all the four industries separately. The Levinsohn and Petrin methodology explicitly recognises the endogeneity that occurs since firms observe its productivity. Specifically, we use value added method and deflated gross value added (LY) of firms is used as a measure of output. Further, in this process intermediate inputs (raw material and energy) are used as proxy to arrive at unbiased estimates. The estimated production function is reported in Sharma and Mishra (2011). On the basis of this, TFP of firms are predicated for further analysis purpose. The descriptive statistics of TFP are presented in Table 1A of Appendix.
5. Inter-linkage between Exports and Imports: Firm-level Evidence
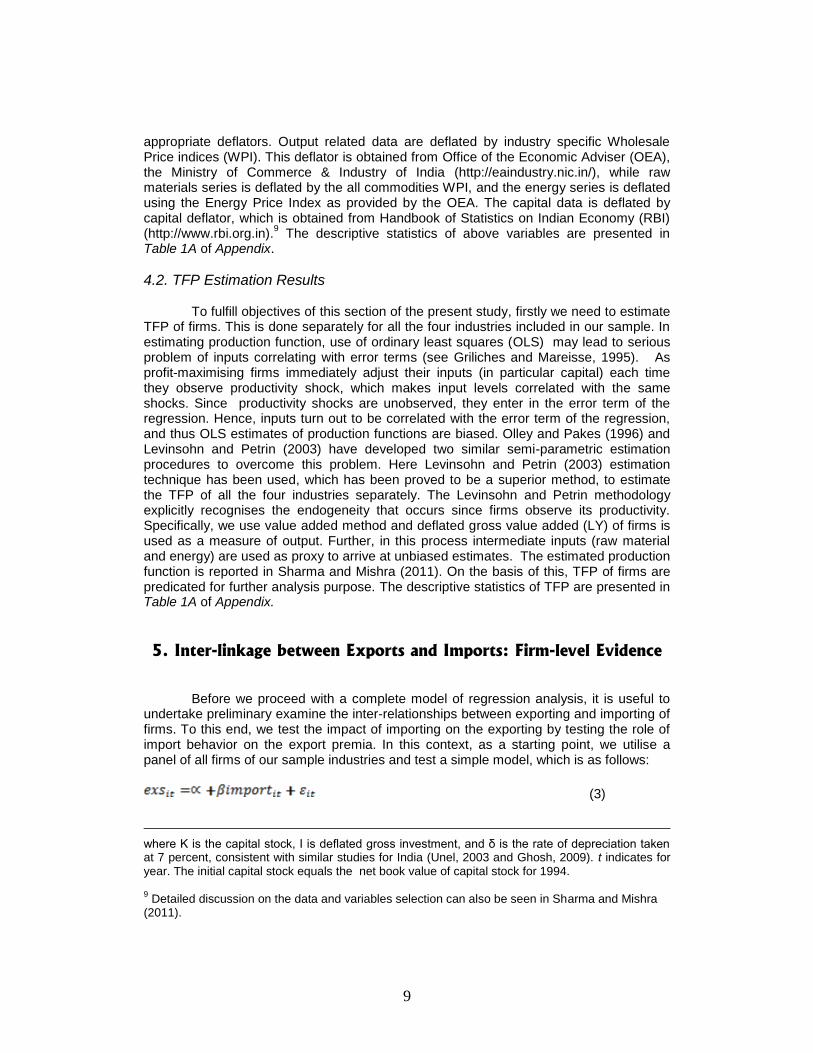
Before we proceed with a complete model of regression analysis, it is useful to undertake preliminary examine the inter-relationships between exporting and importing of firms. To this end, we test the impact of importing on the exporting by testing the role of import behavior on the export premia. In this context, as a starting point, we utilise a panel of all firms of our sample industries and test a simple model, which is as follows:
(3)
where K is the capital stock, I is deflated gross investment, and δ is the rate of depreciation taken at 7 percent, consistent with similar studies for India (Unel, 2003 and Ghosh, 2009). t indicates for year. The initial capital stock equals the net book value of capital stock for 1994. 9 Detailed discussion on the data and variables selection can also be seen in Sharma and Mishra
(2011).

10
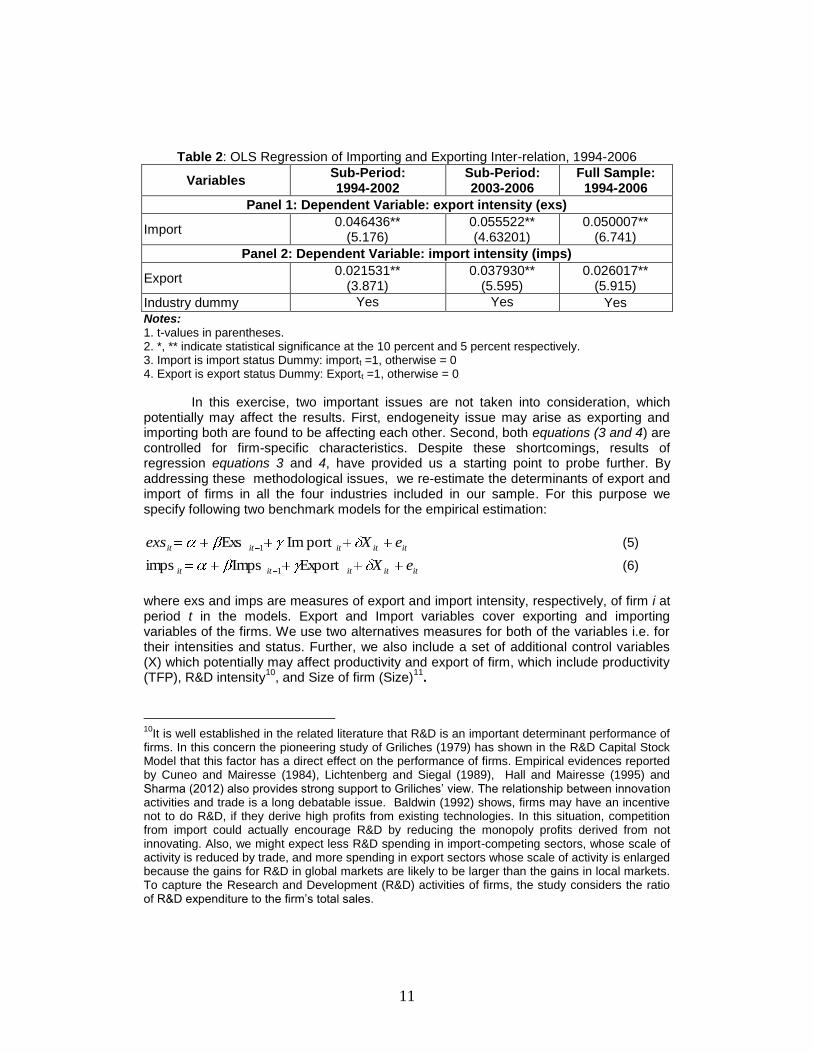
where exs is export premia measured by export intensity for firm i at year t. In the model, import is a dummy for current import status (importt =1 if the form importing, otherwise = 0). The coefficient β measures average percentage difference between importers and non-importers. We divide our sample in two sub-periods to test equation 1. The model is estimated by using OLS technique after controlling for industry effect. Results of the estimations are presented in panel 1 of Table 2. For the period 1994-2002, our results suggest that, on average, importers are around 4.6 percent better exporters. In the surge period (2003-2006) this difference has improved substantially and importers are around 5.5 percent exporting more than non-importers. For overall period, results point out for around 5 percent difference between importers and non-importers in favor of the previous. The estimated size of coefficients suggests that the impact of importing crucially determine the exporting for firms. More importantly, it also suggests that the level of impact has been growing in the industry as the magnitude of openness of the economy has been increasing. Our results at this stage clearly highlight the role of importing in firms’ exporting performance, which is in line with existing theory and previous empirical findings. Next, we intend to examine the inverse linkage i.e. impact of exporting behavior on firms’ import. For this purpose we estimate following model:
(4) where imps and export is import intensity and dummy for export status, respectively for firm i at period t. We expect coefficient β would measure average percentage difference between exporters and non-exporters in terms of import. As an exporter needs to sell the product in the competitive world market has to use high quality inputs in the production process, therefore, one can expect a positive and significant value of β. It is noteworthy that we control our estimation for industry specific effects. The results of estimation are presented in panel 2 of Table 2. First two columns of the panel report results for two sub-periods while in the last column of the panel presents results for overall period. Our results for the period 1994-2002, suggests that exporters are 2.1 percent import more than non-exporters, which has increased to 3.8 percent in the next period (2003-2006). For the overall period the difference between exporters and non-exporters in terms of import is around 2.6 percent. These results suggest that the linkage is strong and more importantly it has been growing over the period. Therefore, at this stage of our analysis clearly indicates that both export and import have significant role in each other success in the Indian manufacturing. Furthermore, results of the analysis also indicate that in the recent period the linkage between exporting and importing has increased further and more importantly, the direction of causation is flowing from both sides. This is inconsistent with our earlier results based on macro data.
11
Table 2: OLS Regression of Importing and Exporting Inter-relation, 1994-2006
Variables Sub-Period: 1994-2002
Sub-Period: 2003-2006
Full Sample: 1994-2006
Panel 1: Dependent Variable: export intensity (exs)
Import 0.046436**
(5.176) 0.055522** (4.63201)
0.050007** (6.741)
Panel 2: Dependent Variable: import intensity (imps)
Export 0.021531**
(3.871) 0.037930**
(5.595) 0.026017**
(5.915)
Industry dummy Yes Yes Yes
Notes: 1. t-values in parentheses. 2. *, ** indicate statistical significance at the 10 percent and 5 percent respectively. 3. Import is import status Dummy: importt =1, otherwise = 0 4. Export is export status Dummy: Exportt =1, otherwise = 0
In this exercise, two important issues are not taken into consideration, which potentially may affect the results. First, endogeneity issue may arise as exporting and importing both are found to be affecting each other. Second, both equations (3 and 4) are controlled for firm-specific characteristics. Despite these shortcomings, results of regression equations 3 and 4, have provided us a starting point to probe further. By addressing these methodological issues, we re-estimate the determinants of export and import of firms in all the four industries included in our sample. For this purpose we specify following two benchmark models for the empirical estimation:
ititititit eXexs portImExs 1 (5)
ititititit eXExportImpsimps 1 (6)
where exs and imps are measures of export and import intensity, respectively, of firm i at period t in the models. Export and Import variables cover exporting and importing variables of the firms. We use two alternatives measures for both of the variables i.e. for their intensities and status. Further, we also include a set of additional control variables (X) which potentially may affect productivity and export of firm, which include productivity (TFP), R&D intensity
10, and Size of firm (Size)
11.
10
It is well established in the related literature that R&D is an important determinant performance of firms. In this concern the pioneering study of Griliches (1979) has shown in the R&D Capital Stock Model that this factor has a direct effect on the performance of firms. Empirical evidences reported by Cuneo and Mairesse (1984), Lichtenberg and Siegal (1989), Hall and Mairesse (1995) and Sharma (2012) also provides strong support to Griliches’ view. The relationship between innovation activities and trade is a long debatable issue. Baldwin (1992) shows, firms may have an incentive not to do R&D, if they derive high profits from existing technologies. In this situation, competition from import could actually encourage R&D by reducing the monopoly profits derived from not innovating. Also, we might expect less R&D spending in import-competing sectors, whose scale of activity is reduced by trade, and more spending in export sectors whose scale of activity is enlarged because the gains for R&D in global markets are likely to be larger than the gains in local markets. To capture the Research and Development (R&D) activities of firms, the study considers the ratio of R&D expenditure to the firm’s total sales.
12
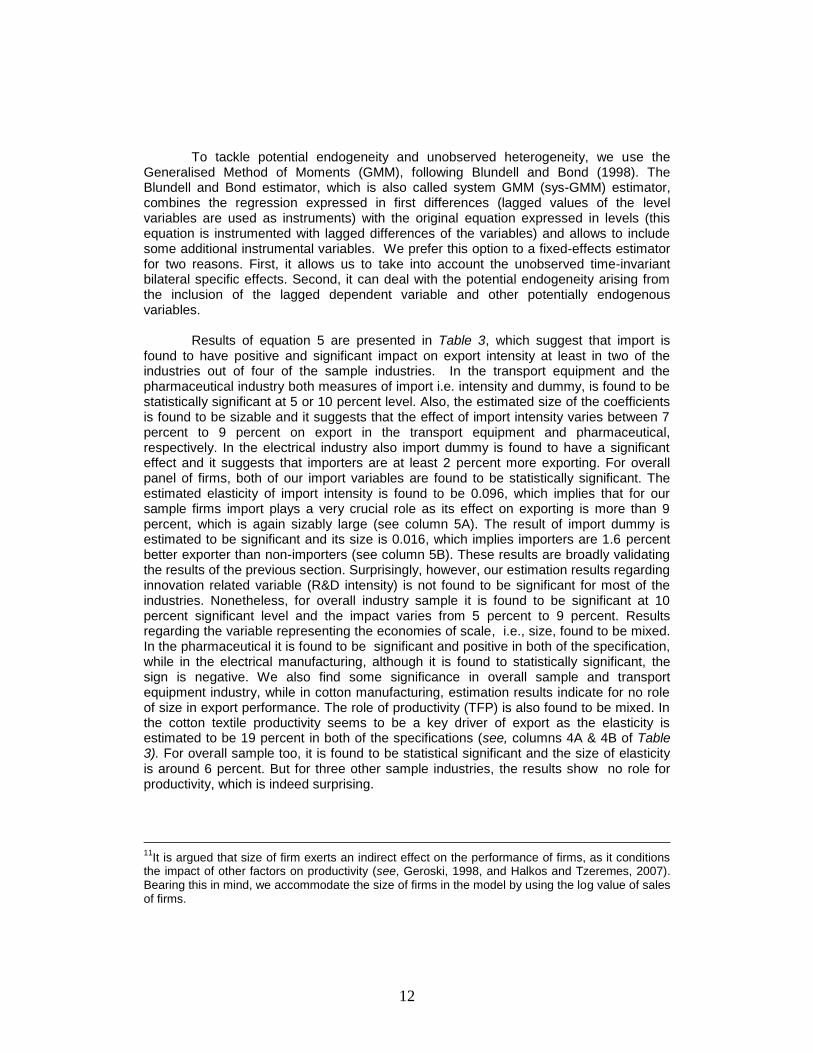
To tackle potential endogeneity and unobserved heterogeneity, we use the Generalised Method of Moments (GMM), following Blundell and Bond (1998). The Blundell and Bond estimator, which is also called system GMM (sys-GMM) estimator, combines the regression expressed in first differences (lagged values of the level variables are used as instruments) with the original equation expressed in levels (this equation is instrumented with lagged differences of the variables) and allows to include some additional instrumental variables. We prefer this option to a fixed-effects estimator for two reasons. First, it allows us to take into account the unobserved time-invariant bilateral specific effects. Second, it can deal with the potential endogeneity arising from the inclusion of the lagged dependent variable and other potentially endogenous variables. Results of equation 5 are presented in Table 3, which suggest that import is found to have positive and significant impact on export intensity at least in two of the industries out of four of the sample industries. In the transport equipment and the pharmaceutical industry both measures of import i.e. intensity and dummy, is found to be statistically significant at 5 or 10 percent level. Also, the estimated size of the coefficients is found to be sizable and it suggests that the effect of import intensity varies between 7 percent to 9 percent on export in the transport equipment and pharmaceutical, respectively. In the electrical industry also import dummy is found to have a significant effect and it suggests that importers are at least 2 percent more exporting. For overall panel of firms, both of our import variables are found to be statistically significant. The estimated elasticity of import intensity is found to be 0.096, which implies that for our sample firms import plays a very crucial role as its effect on exporting is more than 9 percent, which is again sizably large (see column 5A). The result of import dummy is estimated to be significant and its size is 0.016, which implies importers are 1.6 percent better exporter than non-importers (see column 5B). These results are broadly validating the results of the previous section. Surprisingly, however, our estimation results regarding innovation related variable (R&D intensity) is not found to be significant for most of the industries. Nonetheless, for overall industry sample it is found to be significant at 10 percent significant level and the impact varies from 5 percent to 9 percent. Results regarding the variable representing the economies of scale, i.e., size, found to be mixed. In the pharmaceutical it is found to be significant and positive in both of the specification, while in the electrical manufacturing, although it is found to statistically significant, the sign is negative. We also find some significance in overall sample and transport equipment industry, while in cotton manufacturing, estimation results indicate for no role of size in export performance. The role of productivity (TFP) is also found to be mixed. In the cotton textile productivity seems to be a key driver of export as the elasticity is estimated to be 19 percent in both of the specifications (see, columns 4A & 4B of Table 3). For overall sample too, it is found to be statistical significant and the size of elasticity is around 6 percent. But for three other sample industries, the results show no role for productivity, which is indeed surprising.
11
It is argued that size of firm exerts an indirect effect on the performance of firms, as it conditions the impact of other factors on productivity (see, Geroski, 1998, and Halkos and Tzeremes, 2007). Bearing this in mind, we accommodate the size of firms in the model by using the log value of sales of firms.

13
Next we intend to examine the effect in the different phase, i.e. 1994-2002 and 2003-2006, to identify that whether importing has played an important role in the recent surge in export.
12 To this end, we again estimate equations 5 and 6. Regression results
for these durations are reported in Table 4. For the period 1994-2002, our estimation suggests that the size of the import elasticity is 6.5 percent, which substantially increases to 21 percent in the recent period, 2003-2006.
Table 3: Sys-GMM Regression for Exporting of Firms: 1994-2006
Variables Transport Equipment Pharmaceutical Electrical Cotton Overall
1A 1B 2A 2B 3A 3B 4A 4B 5A 5B
Export intensity (exp) (-1)
0.2361** (8.03)
0.8249** (26.84)
0.4745** (12.11)
0.4719** (12.01)
0.5452* (16.79)
0.5447** (16.82)
0.7761** (17.03)
0.7734** (16.83)
0.7236** (27.35)
0.7248** (27.37)
TFP 0.02854 (1.09)
-0.04019 (-1.17)
0.05726 (0.79)
0.04418 (0.60)
0.0731 (1.36)
0.07197 (1.34)
0.19002** (3.42)
0.1871** (3.38)
0. 0605** (2.16)
0.0579** (2.06)
Import intensity
(imp)
0.0691** (2.82)
0.0898* (1.72)
0.0218 (0.62)
0.05397 (0.64)
0.0961**
(3.07)
Import Dummy
0.0166* (1.72)
0.0532**
(3.12)
0.0213** (1.97)
-0.0014 (-0.12)
0.0162**
(2.49)
Size (sf) 0.00781 (0.92)
0.0232** (2.13)
0.0871** (5.19)
0.0802** (4.72)
-0.026* (-1.67)
-0.0262* (-1.68)
-0.0027 (-0.12)
-0.0009 (-0.05)
0.0161* (1.73)
0.0134 (1.43)
R&D intensity
(rd)
0.26438 (0.96)
-0.4464 (-1.27)
-0.18169 (-0.69)
-0.24066 (-0.91)
1.0706 (1.59)
1.0506 (1.56)
0.79645 (0.50)
0.80323 (0.50)
0.0915* (1.74)
0.0460* (1.80)
Const -0.01389 (-0.71)
-0.02832 (-1.14)
-0.0913** (-2.91)
-0.109** (-3.38)
0.01639 (0.91)
0.00053 (0.03)
-0.01784 (0.35)
-.01613 (-0.32)
-0.0161 (-0.92)
-0.0163 (-0.92)
Notes: 1. Z-values in parentheses. 2. *, ** indicate statistical significance at the 10 percent and 5 percent, respectively. 3. All specifications pass the Sargan test for over-identifying restrictions. 4. The tests for serial correlation (no reported) are asymptotically distributed as standard normal variables(Arellano and Bond 1991, 2001).
However, we fail to find any significant difference between importers and non-importers when we regressed exporting to import dummy as estimated coefficients of this dummy is not found to be significant at any standard level of significant. Overall, we can sum up at this stage that importing is a crucial factor in exporting for the Indian manufacturing firms. Most of the attention in the literature is paid on the export-productivity-innovation linkage, and a general consensus is developed now that better productive and innovative firms enter in export market, consequently, productivity and innovation cause export
13. Our results indicate that it is not these factors which mainly
derive the export in the Indian case, instead importing which is the most crucial. These results make sense as exporting firms need high quality inputs to produce high quality outputs to compete in the export market. Moreover, this seems more plausible in the Indian case in which both productivity and innovation have not picked up substantially therefore importing is becoming sustenance for exporting firms. These results are close
12
For the sub-periods, we examine only overall panel as SYS-GMM does not produce robust results for small sample size. 13
See, for example Clerides et al., (1998), Bernard and Jensen (1995, 1999 and 2004a); Bernard and Wagner (1997) and Wagner (2002); Aw et al., (2000; Clerides et al., (1998), Mexico and Morocco and Girma et al., (2004).
14
to the views of endogenous growth school, which have emphasised the role of import as important channel for foreign technology and knowledge spillover in to the domestic economy (Grossman and Helpman, 1991; and Mazumdar, 2001). Our results are also broadly in agreement with empirical evidence of Lawrence and Weinstein (1999) and Thangavelu and Rajaguru (2004)
14, Kasahara and Rodrigue (2008), which have shown
the crucial role of importing in firms’ performance.
Table 4: Sys-GMM Regression for Exporting of Firms: (1994-2002 and 2003-2006)
Variables Overall
1994-2002 Overall
2003-2006
1A 1B 2A 2B
Export intensity (exp) (-1)
0.7156** (21.34)
0.7111** (21.10)
0.8091** (9.34)
0.80638** (9.17)
TFP 0.0814**
(2.50) 0.0796**
(2.45) 0.051475
(0.80) 0.048084
(0.74)
Import intensity (imp)
0.0651* (1.77)
0.2151** (3.26)
Import Dummy -0.0018
(-0.25)
0.01313 (0.80)
Size (sf) 0.0293**
(2.60) 0.0294**
(2.60) 0.0461**
(2.29) 0.0456**
(2.23)
R&D intensity (rd)
0.02545** (2.55)
0.02566** (2.56)
0.03698** (3.30)
0.03686** (3.26)
Const -0.0425**
(-2.05) -0.03506 (-1.67)
-0.1054** (-2.44)
-0.0973** (-2.21)
Notes: 1. Z-values in parentheses. 2. *, ** indicate statistical significance at the 10 percent and 5 percent, respectively. 3. All specifications pass the Sargan test for over-identifying restrictions. 4. The tests for serial correlation (no reported) are asymptotically distributed as standard normal variables (Arellano and Bond 1991, 2001).
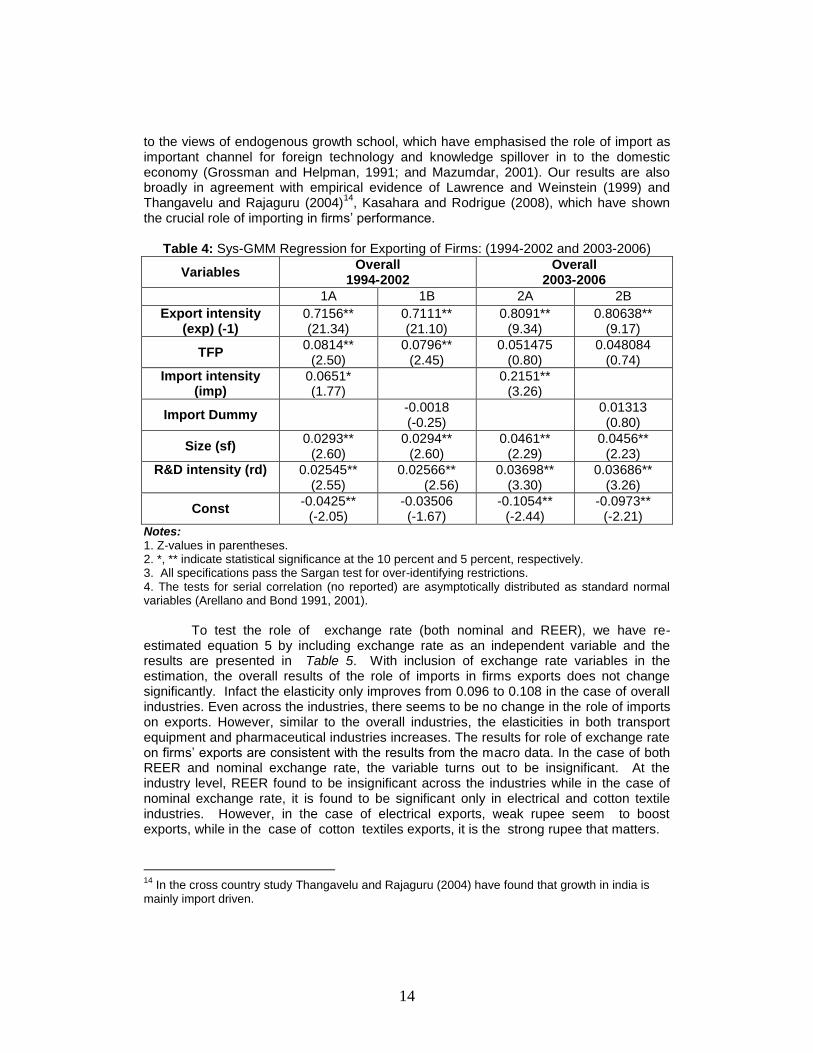
To test the role of exchange rate (both nominal and REER), we have re-
estimated equation 5 by including exchange rate as an independent variable and the results are presented in Table 5. With inclusion of exchange rate variables in the estimation, the overall results of the role of imports in firms exports does not change significantly. Infact the elasticity only improves from 0.096 to 0.108 in the case of overall industries. Even across the industries, there seems to be no change in the role of imports on exports. However, similar to the overall industries, the elasticities in both transport equipment and pharmaceutical industries increases. The results for role of exchange rate on firms’ exports are consistent with the results from the macro data. In the case of both REER and nominal exchange rate, the variable turns out to be insignificant. At the industry level, REER found to be insignificant across the industries while in the case of nominal exchange rate, it is found to be significant only in electrical and cotton textile industries. However, in the case of electrical exports, weak rupee seem to boost exports, while in the case of cotton textiles exports, it is the strong rupee that matters.
14
In the cross country study Thangavelu and Rajaguru (2004) have found that growth in india is mainly import driven.

15
Table 5: Sys-GMM Regression for Exporting of Firms with Exchange Rate: (1994-2006)
Variables Transport Equipment
Pharmaceutical Electrical Cotton Overall
1A 1B 2A 2B 3A 3B 4A 4B 5A 5B
Export intensity (exp) (-1)
0.7891** (25.44)
0.7897** (25.50)
0.4956** (13.10)
0.5011** (13.15)
0.533** (16.68)
0.548** (16.91)
0.784** (17.70)
0.7578 (17.58)
0.7321** (29.07)
0.7355** (29.19)
TFP -0.0601* (-1.75)
-0.0551 (-1.55)
0.05678 (0.76)
0.09487 (1.25)
0.07035 (1.30)
0.09445 (1.68)
0.198** (3.52)
0.1625** (2.87)
0.06656** (2.34)
0.0691** (2.35)
Import intensity
(imp)
0.2772** (5.08)
0.2801** (5.07)
0.1221** (2.30)
0.1482** (2.70)
0.02777 (0.80)
0.02672 (0.76)
0.0706 (0.83)
0.12985 (1.59)
0.1082** (3.44)
0.1081** (3.43)
Size (sf) 0.01878 (1.54)
0.01705 (1.43)
0.096** (5.61)
0.0798** (4.21)
-0.0277* (-1.79)
-0.0325** (-2.04)
0.0019 (0.09)
0.02711 (1.17)
0.02211** (2.35)
0.021** (2.08)
R&D intensity
(rd)
-0.3864 (-1.12)
-0.3952 (-1.14)
0.00494 (0.02)
0.06726 (0.26)
1.0167 (1.51)
1.1107 (1.64)
1.0051 (0.62)
1.1502 (0.72)
-0.29595 (-1.31)
-0.2948 (-1.31)
REER 0.04484 (0.25)
0.2334 (0.75)
-0.1025 (-0.53)
0.4118 (1.18)
0.07597 (0.55)
NEX 0.01552 (0.28)
0.16132 (1.58)
0.1439**
(2.25)
-0.286** (-2.89)
0.0209 (0.47)
Const -0.1002 (-0.28)
-0.0432 (-0.37)
-0.57826 (0.75)
-0.449** (-2.11)
0.2227 (0.58)
-0.294** (-2.04)
-0.8474 (-1.23)
0.54791 (2.64)
-0.18163 (-0.66)
-0.07581 (-0.80)
Sargan (P-value)
267.68 (0.00)
267.25 (0.00)
261.221 (0.00)
258.052 (0.00)
362.41 (0.00)
354.75 (0.00)
198.995 (0.00)
196.97 (0.00)
312.322 (0.00)
312.536 (0.00)
Notes:
1. Z-values in parentheses. 2. *, ** indicate statistical significance at the 10 percent and 5 percent, respectively. 3. The tests for serial correlation (no reported) are asymptotically distributed as standard normal variables (Arellano and Bond 1991, 2001). 4. REER is the real effective exchange rate (export weighted), NEX is nominal exchange rate
To test the effect of exporting on the importing of the firms, we estimate equation
6 and their results are reported in Table 6 for full sample period. Looking at industry wise results of the export intensity, we find that exporting is a main determinant of importing of firms. In the transport equipment and the electrical industry especially its impact is 23 percent and 32 percent, respectively, which is sizably large. This seems to be consistent as Indian automobile and auto-ancillary industry has been exporting in a big way in the recent period. However, still they lack domestically produced high technology inputs, for instance engine, which is required for improving export competitiveness. Even in other two industries the size of the estimated coefficients are significantly high. For overall sample the elasticity is found to be 0.08. Contrary to this finding, results of other export status dummy show that the elasticity is significant only in two industries, namely pharmaceutical and transport equipment. For overall sample also we find it statically significant. Incidentally, our results do not suggest any role of innovation in importing behavior. Productivity and size variables are found to be statistically significant only in the pharmaceutical industry, which is indeed a surprising result.

16
Table 6: Sys-GMM Regression for Importing of Firms: 1994-2006
Variables Transport Equipment
Transport Equipment
Pharmaceutical Pharma Ceutical
Electrical Electrical Cotton Cotton Overall Overall
1A 1B 2A 2B 3A 3B 4A 4B 5A 5B
Import intensity (imp) (-1)
0.46901** (13.82)
0.523425 (15.19)
0.04104 (1.04)
0.0780251** (1.96)
0.12288** (3.34)
0.19183 (5.33)
0.36323** (10.50)
0.41008** (12.16)
0.12675** (6.37)
.136081** (6.81)
Export intensity (exp)
0.23601** (8.03)
0.10271**
(3.32)
0.32384** (7.97)
0.07133**
(4.09)
0.08474** (4.47)
Export Dummy 0.024395**
(3.72)
0.072492** (6.15)
-0.00637 (-0.61)
.004456 (0.46)
.014194**
(3.07)
TFP 0.02854 (1.09)
.032603 (1.20)
0.11058** (2.00)
0.084392 (1.53)
-0.03272 (-0.52)
-.06532 (-1.03)
-0.00688 (-0.25)
-.00348 (-0.12)
-.00796 (-0.42)
-.003172 (-0.16)
Size (sf) 0.00781 (0.92)
.006797 (0.77)
0.02971** (2.16)
0.027719** (2.06)
0.00171 (-0.08)
.00168 (0.08)
0.01485 (-1.21)
-.00920 (-0.72)
-.02490** (-3.77)
-.02279** (-3.45)
R&D intensity (rd)
0.26438 (0.96)
.3719752 (1.30)
-0.26017 (-1.25)
-0.25750 (-1.25)
-0.820111 (-1.01)
-1.0335 (-1.27)
0.39426 (0.52)
.38323 (0.50)
-.03542 (-0.24)
-.04571 (-0.30)
Const -0.01389 (-0.71)
.020402 (-0.97)
0.187699** (7.59)
0.128658** (4.93)
0.064958** (3.18)
.09922** (4.54)
0.0356866 (1.43)
.03856** (1.50)
.09766** (8.49)
.089946** (7.56)
1. Z-values in parentheses. 2. *, ** indicate statistical significance at the 10 percent and 5 percent, respectively. 3. All specifications pass the Sargan test for over-identifying restrictions. 4. The tests for serial correlation (no reported) are asymptotically distributed as standard normal variables(Arellano and Bond 1991, 2001).
17
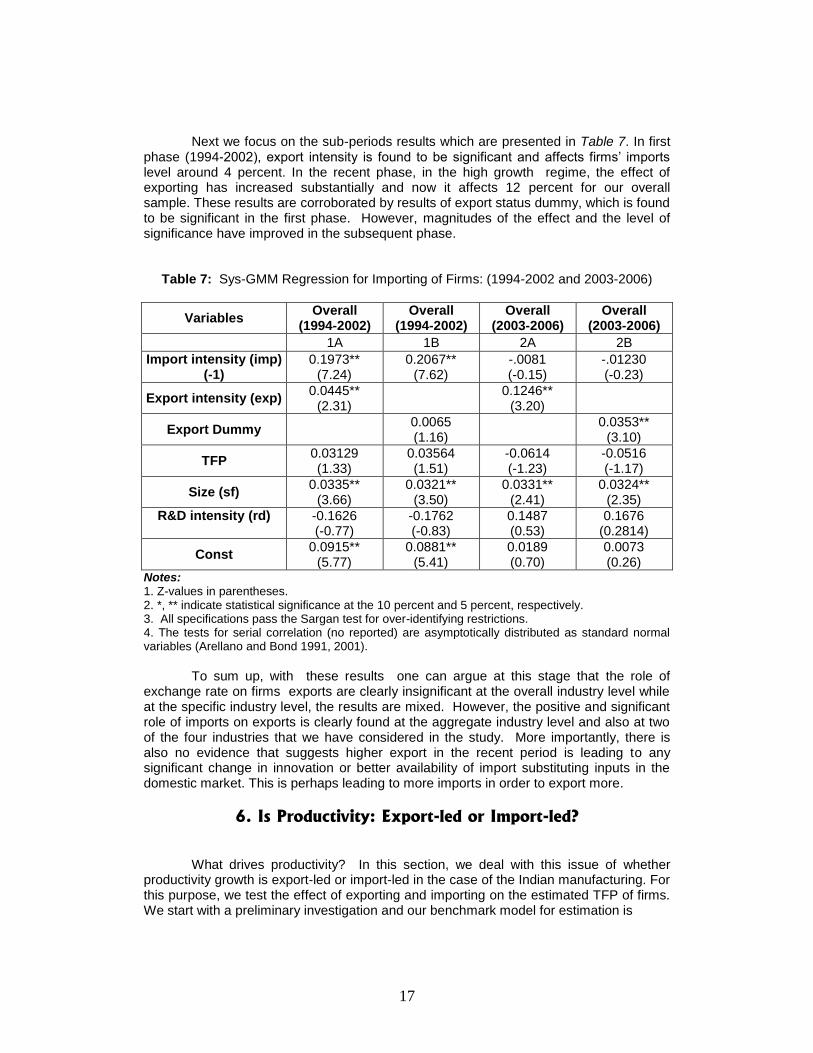
Next we focus on the sub-periods results which are presented in Table 7. In first phase (1994-2002), export intensity is found to be significant and affects firms’ imports level around 4 percent. In the recent phase, in the high growth regime, the effect of exporting has increased substantially and now it affects 12 percent for our overall sample. These results are corroborated by results of export status dummy, which is found to be significant in the first phase. However, magnitudes of the effect and the level of significance have improved in the subsequent phase.
Table 7: Sys-GMM Regression for Importing of Firms: (1994-2002 and 2003-2006)
Variables Overall
(1994-2002) Overall
(1994-2002) Overall
(2003-2006) Overall
(2003-2006)
1A 1B 2A 2B
Import intensity (imp) (-1)
0.1973** (7.24)
0.2067** (7.62)
-.0081 (-0.15)
-.01230 (-0.23)
Export intensity (exp) 0.0445**
(2.31)
0.1246** (3.20)
Export Dummy 0.0065 (1.16)
0.0353** (3.10)
TFP 0.03129 (1.33)
0.03564 (1.51)
-0.0614 (-1.23)
-0.0516 (-1.17)
Size (sf) 0.0335**
(3.66) 0.0321**
(3.50) 0.0331**
(2.41) 0.0324**
(2.35)
R&D intensity (rd)
-0.1626 (-0.77)
-0.1762 (-0.83)
0.1487 (0.53)
0.1676 (0.2814)
Const 0.0915**
(5.77) 0.0881**
(5.41) 0.0189 (0.70)
0.0073 (0.26)
Notes: 1. Z-values in parentheses. 2. *, ** indicate statistical significance at the 10 percent and 5 percent, respectively. 3. All specifications pass the Sargan test for over-identifying restrictions. 4. The tests for serial correlation (no reported) are asymptotically distributed as standard normal variables (Arellano and Bond 1991, 2001).
To sum up, with these results one can argue at this stage that the role of
exchange rate on firms exports are clearly insignificant at the overall industry level while at the specific industry level, the results are mixed. However, the positive and significant role of imports on exports is clearly found at the aggregate industry level and also at two of the four industries that we have considered in the study. More importantly, there is also no evidence that suggests higher export in the recent period is leading to any significant change in innovation or better availability of import substituting inputs in the domestic market. This is perhaps leading to more imports in order to export more.
6. Is Productivity: Export-led or Import-led?
What drives productivity? In this section, we deal with this issue of whether productivity growth is export-led or import-led in the case of the Indian manufacturing. For this purpose, we test the effect of exporting and importing on the estimated TFP of firms. We start with a preliminary investigation and our benchmark model for estimation is

18
(7) where tfp is estimated TFP of firm i at period t. X represents trade status i.e. exporting and importing. Results of the estimation are presented in Table 8. The model results reported in column 1 of the table includes only export dummy. The estimated coefficient suggests that the impact of exporting on TFP is 3.7 percent and it is statistically significant at the conventional level. Column 2 of Table 7 reports the test of import dummy on TFP. The size of the coefficient is found to be 0.05, i.e., the impact of 5 percent, which is a sizable and larger than that of export dummy. In column 3 of Table 7, we report estimation results of the model in which both export and import are included. The size of coefficient of import dummy is again found to be larger than that of export dummy. Finally, column 4 of the same table reports results of the model in which interaction term of export and import dummies are included. The size of the coefficient is found to be 0.051, which implies that firms that both export and import have 5.1 percent higher productivity. Overall, results at this stage indicate that both exporting and importing are significant determinants of firms’ productivity performance. Nonetheless, importing is evidently playing more vital role than exporting in the case of the Indian manufacturing.
Table 8: OLS regression of Import and Export on TFP: 1994-2006
1 2 3 4
Export dummy 0.0371** (6.43)
0.0251** (4.16)
Import dummy 0.0501** (8.56)
0.0435** (7.01)
Export*Import 0.0515** (10.13)
Industry-dummy
Yes Yes Yes Yes
Notes:
1. t-values in parentheses. 2. ** indicate statistical significance at 5 percent.
Now we move ahead to extend our analysis to investigate the role of exporting and importing on firms’ productivity. We examine the issue industry-wise and employ SYS-GMM technique for the estimation purpose. For this purpose, we construct a baseline equation, which is as follows:
itititititit eXtfptfp psImExs1 (8)
Where tfp, exs, imps and X are TFP, export intensity, import intensity and a vector of firm specific characteristics of firm i at period t. Consistent to previous specifications, we again consider two firm related variables for R&D activity and size along with our trade related variables. The results are presented in Table 9 (Industry-wise regression results are available in Sharma and Mishra (2011)).
Regarding the effect of export intensity, our results find weak significance only in the cotton textile industry at 10 percent level. The estimates of size of the coefficient for

19
this industry are found to be 0.06. Results also do not find any effect of export for other industries in our sample. Nonetheless, we find a significant effect of this variable for the panel of overall firms and its size of the elasticity is found to be 4.6 percent. Results for import are found to be encouraging and its impact is statistically significant in two of the industries. In the electrical manufacturing, the size of coefficient is found to sizably large (10 %), while in the pharmaceutical, the effect was quantified to be moderate (5.4%). For overall sample, the size of the coefficient is found to be 6.8 percent, which is notably larger than that of export. The results also indicate that size is crucial in all industries. We also find some favorable results for R&D variable, which suggests that at least in two industries it has a crucial role in determining the level of productivity.
Table 9: Impact of Exporting and Importing Intensity on TFP: 1994-2006
Variables Coefficients
TFP(-1) 0.8139** (37.34)
Export intensity (exp) 0.0468** (2.44)
Import intensity (imp) 0.0683** (2.47)
Size (sf) 0.0627** (9.04)
R&D intensity (rd) 0.05367** (2.77)
Const -.01179 (-0.82)
Notes:
1. Z-values in parentheses. 2. *, ** indicate statistical significance at the 10 percent and 5 percent, respectively. 3. All specifications pass the Sargan test for over-identifying restrictions. 4. The tests for serial correlation (no reported) are asymptotically distributed as standard normal variables (Arellano and Bond 1991, 2001).
Overall, the results of this section suggest that when it comes to TFP growth,
both exporting and importing have been particularly beneficial for Indian manufacturing in the reform period. However, importing clearly dominates exporting in terms of source of productivity gain. Our results also may lead us to serious question whether exports promotion and import substitution policies are rational in achieving higher productivity growth.
Our findings also support the argument of Rodrik (1999) that export fetishism is unwarranted. Furthermore, our results suggest a case for the role of imports in improving productivity and growth as greater imports of competing products spur innovation. Further, competitive pressures and potentially learning from foreign rivals are important conduits for growth. These channels are even more important as industries converge with the market leader. This suggests that further liberalisation policy of the government of India may result in future dynamic gains, which could also be a significant case for other emerging Asian countries.
7. Conclusion and Policy Suggestions
An attempt has been made to empirically examine the role of exchange rates in boosting exports in India. The analyses are carried out in two stages: based on macro

20
(annual and monthly) data and micro (firm) level data. With the help of macro data, the results contradict the traditional view that weak exchange rates could boost exports growth. Rather the results show that imports and import promotion policies (through reducing tariffs) found to have a strong positive impact on exports growth in India in the post-reform period. Further, the paper examines the relationship between export and import performance using a panel of firms from the Indian manufacturing industries for the period 1994–2006. For this purpose, a variety of analyses is carried out. Results of the analysis indicate that on average importers are estimated to be better exporters. Our results also indicate this difference between importers and non-importers has widened substantially over the period with importers are exporting higher than the non-importers. At the industry level, we find that the impact of imports on exports varies with the impact being positive in transport equipment and pharmaceutical industries while in cotton textile, the relation is weak and insignificant. This positive impact increases when we compared between two sub-periods. However, innovation does not show such impact across the industries. The role of productivity (TFP) on exports is found to be significant at overall industry while mixed at the specific industry level. When exchange rate is introduced, the results do not change much as real exchange rate found to be insignificant both at the overall industries and also across the industries. Our results also suggest that both imports and exports have a significant role in improving productivity in Indian industry with the impact of imports on productivity enhancement is higher than compared to the impact of exports.
Our results provide directions that suggest a strong inter-linkage between importing and exporting. More importantly, there is no evidence that suggests higher export in the recent period is leading to any significant change in innovation or better availability of import substituting inputs in the domestic market. This is perhaps an indication of increasing dependency of exporting on imported intermediate inputs. Our findings also indicate that export and import are driving the productivity growth of some of the industries. However, the role of import seems to be more prominent than export. Overall, we find imports are playing a major role in enhancing exports in India. But, this result is limited to merchandise exports only and it could be different in the case of services exports, which generally have less import content.
The findings of this study have some important policy implications. Macroeconomic policies to promote manufacturing exports need to have sector specific focus rather than suggesting outright foreign exchange market intervention to maintain weak exchange rate. Our analyses have clearly demonstrated that export is crucially dependent on imported inputs and direct impact of exchange rate movement on export performance is weak, therefore, using exchange rate intervention root for achieving export growth is not a suitable policy option for the Indian economy. Rather it might end up in showing unintended outcomes. Considering the decisive role of imports, exports and productivity performance of firms in India, the industrial and external sector policies should not excessively emphasise on export and hurt imports. Therefore, unlike in some Asian economies including China, one may conclude that overall macroeconomic policy in India ought to aim for broader economic and industrial performance rather than skewed to export-led growth strategy through exchange rate intervention.

21
References
Abeysinghe Tilak & Tan Lin Yeok, 1998. Exchange appreciation and export competitiveness: A case of Singapore, Applied Economics, .30;51-55.
Ahmed, Shaghil, 2009. Are Chinese Exports Sensitive to Changes in the Exchange
Rate?, No.987, International Finance Discussion Papers, Board of Governors of the Federal Reserve System.
Amiti, M., Konings, J., 2007. Trade liberalization, intermediate inputs and productivity:
Evidence from Indonesia, American Economic Review 97 (5); 1611-1638. Arellano, M. and Bond, S.R. 1991, “Some tests of specification for panel data: Monte
Carlo evidence and an application to employment equations”, Review of Economic Studies, 58; 277-97.
Aw, B., Chung, Y.S. and Roberts, M. 2000, “Productivity and turnover in the export
market: micro evidence from Taiwan and South Korea”, World Bank Economic Review, 14; 65-90.
Bahmani-Oskooee, M., 1986. Determinants of international trade flows: the case of
developing countries. Journal of Development Economics 20; 107-123. Bahmani-Oskooee, M., Ardalani, Z., 2006. Exchange rate sensitivity of U.S. trade flows:
evidence from industry data. Southern Economic Journal 72 (3); 542–559. Belongia, M, 1985, Estimating Exchange Rate Effects on Exports: A Cautionary Note,
Federal Reserve Bank of St Louis. Bernard, A.B. and Jensen, J.B. 1995, “Exporters, jobs and wages in US manufacturing
1976-1987”, Brookings Papers on Economic Activity: Microeconomics, 1995;67-119.
Bernard, A.B. and Jensen, J.B. 1999, “Exceptional exporter performance: cause, effect,
or both?”, Journal of International Economics, 47;1-25. Bernard, A.B. and Jensen, J.B. 2004, “Exporting and productivity in the USA”, Oxford
Review of Economic Policy, 20; 343-57. Bernard, A.B. and Wagner, J. 1997, “Exports and success in German manufacturing”,
Review of World Economics, 133; 134-57. Bhanumurthy, N R, 2006. Macroeconomic fundamentals and exchange rate dynamics in
India” Economic and Political Weekly, XLI(11) (March).

22
Boltho, A. 1996 Was Japanese Growth Export-Led?, Oxford Economic Papers, New Series, 48(3); 415-432.
Clerides, S., Lach, S. and Tybout, J. 1998, “Is learning-by-exporting important? Micro
dynamic evidence from Colombia, Mexico and Morocco”, Quarterly Journal of Economics, 113; 903-47.
Cuneo, P., and J. Mairesse 1984. Productivity and R&D at the firm level in French
manufacturing. In R&D, patents, and productivity, ed. Z. Griliches. University of Chicago Press.
Felmingham, B.S., 1988. Where is the Australian J-curve. Bulletin of Economic Research
40; 43-56. Geroski, P.A. 1998. An Applied econometrician’s view of large company performance.
Review of Industrial Organization 13; 271-94. Ghosh, S. 2009. Do productivity and ownership really matter for growth? Firm-level
evidence. Economic Modeling 26; 1403-13. Girma, S., Greenaway, D. and Kneller, R. 2004, “Does exporting lead to better
performance? A micro econometric analysis of matched firms”, Review of International Economics, 12; 855-66.
Greenaway David, R Kneller and X Zhang., 2007. Exchange rates and exports: Evidence
from manufacturing firms from the UK, Research Paper 2007/13, University of Nottingham.
Griliches, Z. 1979. Issues in assessing the contribution of R&D to productivity growth.
The Bell Journal of Economics 10; 92-116. Griliches, Z., and J. Mairesse 1995. Production functions: the search for identification.
NBER Working Paper No. 5067, Washington, DC. Grossman, G. and Helpman, E. 1991, Innovation and Growth in the Global Economy,
MIT Press, Cambridge, MA. Halkos, G.E., and N.G. Tzeremes. 2007. International competitiveness in the ICT
industry: Evaluating the performance of the Top 50 companies. Global Economic Review 36; 167-82.
Hall, B.H., and J. Mairesse. 1995. Exploring the relationship between R&D and
productivity in French manufacturing firms. Journal of Econometrics 65; 263-93. Kasahara, H., Rodrigue, J., 2008. Does the use of imported intermediates increase
productivity? plant-level evidence, Journal of Development Economics 87(1); 106-118.
Kwan, A., J. Cotsomitis, and B. Kwok 1996 “Exports, Economic Growth and Exogeniety: Taiwan 1953-88.” Applied Economics 28(3); 467- 471.
23
Lawrence, R. Z. and Weinstein, D. E., 1999. Trade and Growth: Import-Led or Export-Led? Evidence From Japan and Korea," NBER Working Papers 7264, National Bureau of Economic Research, Inc.
Levinsohn, J., and A. Petrin. 2003. Estimating production functions using inputs to control
for unobservables. Review of Economic Studies 70; 317-41. Lichtenberg, F.R., and D. Siegel. 1989. The impact of R&D investment on productivity:
New evidence using linked R&D-LR&D data. NBER Working Paper 2901, NBER, Cambridge, MA.
Mallick JK, 2005, India’s exports: Policy defeating exchange rate arithmetic, Economic
and Political Weekly, (December). Mazumdar, J., 2001. Imported machinery and growth in LDCs. Journal of Development
Economics. 65;209–224. Mahdavi, S., Sohrabian, A., 1993. The exchange value of the dollar and the US trade
balance: an empirical investigation based on cointegration and Granger causality tests. The Quarterly Review of Economics and Finance 33 (4); 343–358.
Mundle, Sudipto, N. R. Bhanumurthy and Surajit Das, 2011, Fiscal Consolidation with
High Growth: A Policy Simulation Model for India, Economic Modeling 28; 2657–2668.
Olley, G.S., and A. Pakes. 1996. The dynamics of productivity in the telecommunications
equipment industry. Econometrica 64; 1263–97. Sharma, C., 2011. "Imported intermediary inputs, R&D and Firm's Productivity: Evidence
from Indian Manufacturing," Proceedings of the German Development Economics Conference, Berlin 2011 74, VereinfürSocialpolitik, Research Committee Development Economics.
-----------, 2012. R&D and firm performance: evidence from the Indian pharmaceutical
industry, Journal of the Asia Pacific Economy, 17(2); 332-342. Sharma, C. and Mishra, R.K. 2011. "Does export and productivity growth linkage exist?
Evidence from the Indian manufacturing industry," International Review of Applied Economics, 25(6); 633-652.
Smith, Mark, 2004. Impact of exchange rate on export volumes, Reserve Bank of New
Zealand, Bulletin, 67(7) Thangavelu. S.M., Rajaguru. G. 2004. Is there an export or import-led productivity growth
in rapidly developing Asian countries? A multivariate VAR analysis. Applied Economics, 36;083-1093.
Tharakan, P. K. M. Ilke Van Beveren, and Tom Van Ourti, 2005. Determinants of India’s
software exports and goods exports, Review of Economic Studies, 87(4);776-780.

24
Unel, B. 2003.Productivity trends in India’s manufacturing sectors in the last two decades. IMF Working Papers 03/22, International Monetary Fund.
Veeramani, C, 2008. Impact of exchange rate appreciation on India’s exports, Economic
and Political Weekly, XLIII(22);10-14 (May).
25
Appendix
Table 1A: Descriptive Statistics on Indian Manufacturing Firms, 1994-2006
Variables Mean Standard Deviation.
Minimum Maximum
Cotton textile (93 firms)
LY 0.938 0.667 2.187 2.549
LK 1.346298 0.669 -1.473 3.223
LN 2.916 0.687 0.425 4.546
TFP 0.457 0.119 0.067 1.415
Export Intensity 0.275 0.291 0 0.993
R&D Intensity 0.0004 0.003 0 0.076
Import Intensity 0.037 0.0670 0 0.601
Import Dummy 0.567 0.49565 0 1
Electrical (83 firms)
LY 0.948 0.6761 -1.153 2.702
LK 1.096 0.618 -0.797 2.896
LN 2.841 0.707 0.388 4.624
TFP 0.481 0.112 0.049 0.839
Export Intensity 0.071 0.141 0 1
R&D Intensity 0.003 0.006 0 0.103
Import Intensity 0.082 0.171 0 4.263
Import Dummy 0.84 .3667942 0 1
Pharmaceutical (87 firms)
LY 0.946 0.844 -1.824 2.902
LK 1.1135 0.770 -1.076 2.986
LN 2.788 0.853 0.229 4.648
TFP 0.359 0.099 0.051 0.834
Export Intensity 0.166 0.217 0 1
R&D Intensity 0.014 0.032 0 0.588
Import Intensity 0.1145 .142249 0 0.988
Import Dummy 0.8212 .3833792 0 1
Transport equipment (94 firms)
LY 1.105 0.475 1.1581 4.053
LK 1.263 0.547 -0.337 2.784
LN 2.931 0.475 1.158 4.054
TFP 0.427 0.226 0.033 1.606
Export Intensity 0.065 0.113 0 0.934
R&D Intensities 0.005 0.009 0 0.064
Import Intensity 0.0568 0.081 0 .6819709
Import Dummy 0.777 0.4163 0 1
Overall (357 firms)
TFP 0.433 0.159 0.033 1.607
Export Intensity 0.145 0.221 0 1
R&D Intensities 0.005 0.017 0 0.588
Import Intensity 0.071 0.123 0 4.263
Import Dummy 0.746 0.435 0 1 Source: This table, which is for larger dataset, is reproduced from Sharma and Mishra (2011).