does time-on-task estimation matter? implications for the ... · does time-on-task matter?...
TRANSCRIPT

(2015).Doestime-on-taskmatter?Implicationsforthevalidityoflearninganalyticsfindings.JournalofLearningAnalytics,2(3),81–110.http://dx.doi.org/10.18608/jla.2015.23.6
ISSN1929-7750(online).TheJournalofLearningAnalyticsworksunderaCreativeCommonsLicense,Attribution-NonCommercial-NoDerivs3.0Unported(CCBY-NC-ND3.0) 81
Does Time-on-task Estimation Matter? Implications for the Validity of Learning Analytics Findings
VitomirKovanović
SchoolofInformatics,UniversityofEdinburgh,[email protected]
DraganGaševićMorayHouseSchoolofEducationandSchoolofInformatics,UniversityofEdinburgh,UK
ShaneDawsonTeachingInnovationUnit,UniversityofSouthAustralia,Australia
SrećkoJoksimovićMorayHouseSchoolofEducation,UniversityofEdinburgh,UK
RyanS.BakerTeachersCollege,ColumbiaUniversity,USA
MarekHatalaSchoolofInteractiveArtsandTechnology,SimonFraserUniversity,Canada
ABSTRACT:WithwidespreadadoptionofLearningManagementSystems(LMS)andotherlearningtechnology,largeamountsofdata—commonlyknownastracedata—arereadilyaccessibletoresearchers. Trace data has been extensively used to calculate time that students spend ondifferentlearningactivities—typicallyreferredtoastime-on-task.Thesemeasuresareusedtobuildpredictivemodelsofstudentlearninginordertounderstandandimprovelearningprocesses.Whiletime-on-taskmeasureshavebeenusedinLearningAnalyticsresearch,theconsequencesoftheirusearenotfullydescribedorexamined.Thispaperpresentsfindingsfromtwoexperimentsregarding different time-on-task estimationmethods and their influence on research findings.Basedonmodellingdifferentstudentperformancemeasureswithpopularstatisticalmethodsintwo datasets (one online, one blended), our findings indicate that time-on-task estimationmethodsplayan importantrole inshapingthefinalstudyresults,particularly inonlinesettingswheretheamountofinteractionwithLMSistypicallyhigher.Theprimarygoalofthispaperistoraiseawarenessandinitiatedebateontheimportantissueoftime-on-taskestimationwithinthebroader learning analytics community. Finally, the paper provides an overview of commonlyadoptedtime-on-taskestimationmethodsineducationalandrelatedresearchfields.Keywords: Time-on-task,measurement, learning analytics, higher education, LearningManagementSystem(LMS),Moodle
1 INTRODUCTION Amainpreconditionfortheadoptionoflearninganalyticsisthecollectionofrelevantdataaboutstudentlearning. One widely used type of data is trace data about student interactions within a LearningManagementSystem(LMS).Thesetracedatatypicallytaketheformofeventstreams,timedlistsofevents

(2015).Doestime-on-taskmatter?Implicationsforthevalidityoflearninganalyticsfindings.JournalofLearningAnalytics,2(3),81–110.http://dx.doi.org/10.18608/jla.2015.23.6
ISSN1929-7750(online).TheJournalofLearningAnalyticsworksunderaCreativeCommonsLicense,Attribution-NonCommercial-NoDerivs3.0Unported(CCBY-NC-ND3.0) 82
performed through system use, typically by either students (e.g., reading discussions, submittingassignments)or instructors(e.g.,uploadingstudentgrades).Onebenefitoftracedataisthat itcanbeeasily converted toaggregatenumericalcountdata showing frequenciesofdifferent actions for eachstudent.Countdata isuseful in theeducational contextas itenablesanoverviewof student learningactivities and provides the opportunity to develop a broad range of predictive models of studentperformanceandstudentmonitoringsystems.Inadditiontotheuseofcountdata,LMStracedatahasbeenextensivelyusedtoestimatestudents’actualtimespentonlineasaproxyofacademicactivityandlearning.Beginningwithearlystudiesoftraditionalclassroom learning in the 1970s, the amount of time students actually spent on learning has beenidentifiedasoneofthecentralconstructsaffectinglearningsuccess(Bloom,1974;Stallings,1980).Tothisday,oneoftheprimarywaysofimprovingstudentlearningistodeveloplearningactivitiesthatsupportlonger engagement periods with course content or peers (Stallings, 1980). Instead of using countmeasures,time-on-taskmeasuresprovideamore“accurate”estimateoftheamountofeffortstudentsspendlearning.Despitetime-on-taskbeingidentifiedasanimportantmeasureofstudentlearning,itsaccurateestimationis a non-trivial task (Karweit & Slavin, 1982). Given the typical client-server architecture of Webapplicationsandthefactthatmostlearningsystemsonlyrecordstreamsofimportantsystemevents,areconstructionoftimesspentondifferentlearningactivitiesisrequired.Typically,theestimationprocessinvolvesmeasuringtimedifferencesbetweensubsequenteventsintheeventstreamasthemorefine-grainedinformationisoftennotavailable.Thechallengewiththisapproachisthatbetweentwoevent-streamactivityrecordsstudentsoftenengageinsomeotheractivitiesnotrelatedtotheirlearning.Forexample,astudentmaybestudyingintheeveningandthencontinuetheirlearningsessionthefollowingmorning.Inthatcase,thetimespanbetweenthelastlearningactivityintheeveningandthefirstlearningactivity in the morning would be very long, and therefore affect the accuracy of naïve time-on-taskestimationmethodsthatdonottakeintotheaccountthesesituations.Whileitisanimportantpartofdatacollection,theestimationoftime-on-taskmeasuresisrarelydiscussedindetailwithinlearninganalyticsresearch.Typically,researchersadoptaheuristicapproach(e.g.,limitallactivitiesto10,30,or60minutes)(Ba-Omar,Petrounias,&Anwar,2007;Munk&Drlík,2011)anddonotaddresstheconsequencesofsuchadoptedheuristicsontheproducedstatisticalmodel.Inthispaper,wetrytoevaluatewhataretheconsequencesofthedifferentestimationheuristicsontheresultsofthefinalpredictivemodel.Moreprecisely,welookedathowdifferentstrategiesfortime-on-taskestimationaffecttheresultsofseveralmultiple linearregressionmodels in twoseparatedatasets fromfullyonlineandblended courses. In order to provide amore comprehensive analysis as an outcomemeasure in thepredictivemodels,weusedstudents’finalgrades,individualassignmentgrades,discussionparticipationgrades,andnumberofmessageswithhigher levelsofcognitivepresence—acentralcomponentofawidelyusedCommunityofInquirymodel(CoI)ofdistanceeducation(Garrison,Anderson,&Archer,1999,2001).Basedonthefindingsofthepresentstudy,weoffersomepracticalguidelinesforimprovingthe

(2015).Doestime-on-taskmatter?Implicationsforthevalidityoflearninganalyticsfindings.JournalofLearningAnalytics,2(3),81–110.http://dx.doi.org/10.18608/jla.2015.23.6
ISSN1929-7750(online).TheJournalofLearningAnalyticsworksunderaCreativeCommonsLicense,Attribution-NonCommercial-NoDerivs3.0Unported(CCBY-NC-ND3.0) 83
validityofresearchinlearninganalytics.Wealsosuggestgreaterattentiontothistopicinfuturelearninganalyticsresearch.2 BACKGROUND 2.1 Time-on-task in Educational Research 2.1.1 Originsoftime-on-taskineducationalresearchThereisalongtraditionfortheuseoftimeineducationresearch(Bloom,1974).In1963,Carrollproposedamodeloflearningwheretimewasacentralelement,andlearningwasdefinedasafunctionoftheeffortspentinrelationtotheeffortneeded.Carroll,however,madeadistinctionbetweenelapsedtimeandthetimestudentsactuallyspendonlearning(1963).Studentlearningdependsonhowthetimeisused,notthetotalamountoftimeallocated(Stallings,1980).Therehasbeenextensiveresearchinthe1970snotingthebenefitsofincreasedlearningtimeonoveralllearningquality(Karweit,1984;Karweit&Slavin,1982;Stallings,1980).Inthiscontext,anincreaseintime-on-taskwasconsideredoneofthekeyprinciplesofeffectiveeducation(Chickering&Gamson,1989).Amainchallengewithresearchontheeffectsoftimeonlearningisdifferentoperationalizationsofthetime-on-taskconstruct(Karweit&Slavin,1982).Someresearchers(e.g.,Helmke,Schneider,&Weinert,1986;Cohen,Manion,&Morrison,2007)usedtypicalobservationalmethodssuchasmonitoringstudentbehaviouratspecifiedtimeintervalsandcodingthatbehaviourusingapredefinedcodingscheme.Others(e.g.,Admiraal,Wubbels,&Pilot,1999)adoptedverydifferentandcrudernotionsoftime-on-task,suchasnumberoflecturesattended,numberofschooldaysinayear,orhoursinaschoolday.AspointedoutbyKarweitandSlavin (1982),differences indefinitionsofon-taskandoff-taskbehaviour,observationintervals,andsamplesizesledtoimportantinconsistenciesinthisresearchdomain.AccordingtoKarweit(1984), the interpretation of significant findings related to time-on-task measures requires carefulexaminationandcaution.2.1.2 Recentstudiesofstudenttime-on-taskDespitepriorwarningsbyKarweitandSlavin(1982)regardingtime-on-taskestimation,recentempiricalstudies (Calderwood, Ackerman,& Conklin, 2014; Judd, 2014; Rosen,Mark Carrier,& Cheever, 2013)continuetoillustratethecomplexitiesandpossibleinaccuracieslinkedtotimeestimationinthedigitalage.Giventheubiquitousaccesstotechnology,studentlearningactivitiesarecharacterizedbyhighlevelsof distraction andmulti-tasking, which are shown to have negative effects on student attention andlearning(Bowman,Waite,&Levine,2015).Forexample,Calderwoodetal.(2014)conductedalaboratorystudy with 58 participants that looked at their levels of distraction over a three-hour period of self-directed learning using various observational techniques (i.e., eye-tracking, surveillance camera, andvideorecorder).Thestrikingfindingisthateveninthe“sterile”andcontrolledlaboratoryenvironmentstudentsengaged,onaverage,in35distractions(ofsixsecondsormore)withatotaldistractiontimeof25minutes(Calderwoodetal.,2014).SimilarresultswerefoundbyJudd(2014),wholookedatthelevels

(2015).Doestime-on-taskmatter?Implicationsforthevalidityoflearninganalyticsfindings.JournalofLearningAnalytics,2(3),81–110.http://dx.doi.org/10.18608/jla.2015.23.6
ISSN1929-7750(online).TheJournalofLearningAnalyticsworksunderaCreativeCommonsLicense,Attribution-NonCommercial-NoDerivs3.0Unported(CCBY-NC-ND3.0) 84
of student multi-tasking while engaged in a learning activity. Using a specifically designed tracingapplicationinstalledonthecomputersof1,249participants,JuddnotedthatFacebookusersspentalmost10%of their study timeonFacebook rather thanstudying. Inaddition,99%of student studysessionsinvolved some form ofmulti-tasking. Finally, the Rosen et al. (2013) field observational study of 263participantslookedatstudents’learningbehaviourovera15-minutestudyperiodandfound,onaverage,thatstudentsspentonly10of15minutesengagedinlearningandwerecapableofmaintainingonlysixminutesofon-taskbehaviour.Theaboveresearchshedssomelightonthestudyhabitsoflearnersinthedigitalage.Whatever“correct”distractiontimesmaybe,itiscertainthattoday’sstudentsareengaginginmuchmoremulti-taskingandoff-taskbehavioursthataffecttheaccuracyofmeasuringstudenttime-on-task.Weshouldnotethatinthis context “off-task” shouldbeunderstoodas “off-system”meaning that students spendsome timeoutsidethesystem.Thisdoesnotnecessarilymeannotengaginginproductivelearningactivities(e.g.,reading a printed document or attending a study group meeting); however, given that time-on-taskestimates are used to understand learning activities and often to build predictivemodels of studentsuccessoridentifystudentsatrisk,thereisaneedtoprovidebetterestimatesofstudents’time-on-task.Inthiscontext,thereisafurtherimperativeforresearcherstoaccountfortheseoff-systemactivitiesandoff-taskdistractionswhendeterminingtime-on-taskestimationsthroughtracedata.Itisverylikelythatsimilarlevelsofdistractionarepresentinmanyofthedatasetsthatlearninganalyticsresearchersuseintheir studies. With this in mind, the goal of the present study is to examine what effects differenttechniquesforcalculatingtime-on-taskfromLMStracedatahaveontheresultsoffinallearninganalyticsmodels.2.1.3 Time-on-taskandlearningtechnologyThepreviouslydescribedobservationaltechniqueshavealsobeenusedinmanystudies(Baker,Corbett,Koedinger,&Wagner,2004;Smeets&Mooij,2000;Worthen,VanDusen,&Sailor,1994)forexaminationofstudentbehaviourandtime-on-taskanalysiswhenworkingwitheducationaltechnology.Forexample,researchinthedomainofIntelligentTutoringSystems(ITS)hassoughttoidentifyoff-taskbehaviouranditseffectsonlearning(Bakeretal.,2004;Baker,2007;Cetintas,Si,Xin,&Hord,2010;Cetintas,Si,Xin,Hord,&Zhang,2009;Pardos,Baker,SanPedro,Gowda,&Gowda,2013;Roberge,Rojas,&Baker,2012).Theadoptionofeducationaltechnologyhasenabledrelativelyeasycalculationofstudenttime-on-taskbasedonthetracedatacollectedbythesoftwaresystem.Whilethisapproachhasbeenadoptedinmanyresearchstudies(Grabe&Sigler,2002;Kraus,Reed,&Fitzgerald,2001),thedetailsoftheprocessarenotalwaysdescribed.Whilesomeofthesestudies(GrabeandSigler,2002)describedthechallengesthattheprocessoftime-on-taskestimationentails,mostofthestudiesdonot. Intheirstudy,GrabeandSigler(2002)usedseveralheuristicsfortime-on-taskestimation:1)alllearningactionslongerthan180secondswereestimatedtobe120secondslong,2)allmultiplechoiceansweringactionstobeatmaximum90seconds,and3)lastactionswithineachstudysessionwereestimatedat60seconds.

(2015).Doestime-on-taskmatter?Implicationsforthevalidityoflearninganalyticsfindings.JournalofLearningAnalytics,2(3),81–110.http://dx.doi.org/10.18608/jla.2015.23.6
ISSN1929-7750(online).TheJournalofLearningAnalyticsworksunderaCreativeCommonsLicense,Attribution-NonCommercial-NoDerivs3.0Unported(CCBY-NC-ND3.0) 85
MorerecentresearchintheITSfieldhasledtothedevelopmentofseveralmachinelearningsystemsforautomateddetectionofstudentoff-taskbehaviourbasedontracedata(Baker,2007;Cetintasetal.,2010;Cetintasetal.,2009).Thedevelopmentofsuchmodelswasmadepossibleduetotheavailabilityoffieldobservationaldata,therebyprovidinga“goldstandard”fortestingtheperformanceofdifferentmodels.Inhisstudy,Baker(2007)identifiedatimeof80secondstobethebestcut-offthresholdforidentificationofoff-taskbehaviour.Thebestperformingmodel foroff-taskbehaviourdetectionalsomadeuseofabroaderrangeoffeatures,withaparticularlyusefulfeaturebeingthestandardizeddifferenceindurationamongsubsequentactions(i.e.,veryfastactionfollowedbyaveryslowactionorviceversa).Thisresearchprovidesanempiricalanalysisofthedifferentapproachesfordetectionofoff-taskbehaviourandlaysthegroundworkforreproducibleandreplicableresearchintheITSfield.2.2 Web-Usage Mining 2.2.1 Process&heuristicsUseractivitiesareextensivelyanalyzedintheareaofWebUsageMining(WUM)(Cooley,Mobasher,&Srivastava,1997),whichis“theautomaticdiscoveryofuseraccesspatternsfromWebservers”(Cooleyetal.,1997,p.560).Datapre-processingisrecognizedasacrucialstepinWUManalysis(Cooleyetal.,1997;Hussain,Asghar,&Masood,2010;Munk&Drlík,2011;Munk,Kapusta,&Švec,2010)andisestimatedtotaketypicallybetween60%and80%ofthetotalanalysistime(Hussainetal.,2010;Marquardt,Becker,&Ruiz,2004).Typically,web-usagemining involvestheanalysisofclickstreamdatabeingrecordedasusersnavigatethrough different parts of aWeb-based system. According to Chitraa and Davamani (2010), the pre-processing in WUM consists of four separate phases: 1) Data cleaning, which involves removal ofirrelevant logrecords;2)User identification, typicallybasedontheir IPaddressesandWebuseragentresolution;3)Sessionidentification,withthegoalofsplittinguseraccessinformationintoseparatesystemvisits;and4)Pathcompletion,whichdealswithissuesofmissinginformationintheserveraccesslog(e.g.,duetocachingbyproxyservers).Ofdirectimportanceforthestudiespresentedinthispaperisthenotionofdifferentstrategiesforsessionidentification:
1. Time-oriented heuristics, which place an upper limit on the total session time (typically 30minutes),oranupperlimitonasingleWebpagetime(typically10minutes)(Cooley,Mobasher,&Srivastava, 1999;Mobasher,Cooley,&Srivastava, 1999). Earlyempirical studies found25.5minutestobeanaveragedurationofWebsession(Catledge&Pitkow,1995).
2. Navigation-oriented heuristics, which look atweb page connectivity to identify user sessions.WhenforthesameIPaddresstwoconsequentpagesintheaccesslogarenotdirectlylinked,thenthissignalsthestartofanewusersession.
AsindicatedbyChitraaandDavamani(2010),time-orientedheuristicsaresimple,butoftenunreliable,asusersmayundertakeparalleloff-taskactivities.Hence,itcanbeproblematictodefineusersessionsbased
(2015).Doestime-on-taskmatter?Implicationsforthevalidityoflearninganalyticsfindings.JournalofLearningAnalytics,2(3),81–110.http://dx.doi.org/10.18608/jla.2015.23.6
ISSN1929-7750(online).TheJournalofLearningAnalyticsworksunderaCreativeCommonsLicense,Attribution-NonCommercial-NoDerivs3.0Unported(CCBY-NC-ND3.0) 86
ontime.Munketal.(2010)adopted10-minutetimeoutintervalsforsessionidentificationandidentifiedpathcompletionpre-processingasanimportantstepforimprovingthequalityofextracteddata.Similarly,RajuandSatyanarayana(2008)proposedacompletepre-processingmethodologyandsuggestedtheuseof30-minutesessiontimeoutintervals.2.2.2 WebusageminingindistanceeducationWiththetransitiontoWeb-basedlearningtechnologiesandwiththebroaderadoptionofLMSsystems,severalresearchers(e.g.,Ba-Omaretal.,2007;Marquardtetal.,2004)haveadoptedtraditionalWUMtechniquestoanalyzelearningdata.It is importanttonotethatcertaincharacteristicsofLMSsystemsmaketheprocesssomewhatsimpler.Forexample,useridentificationistrivial,asalllearningplatformsrequireastudentlogin(Marquardtetal.,2004;Munk&Drlík,2011).Likewise,modernLMSsystems(e.g.,Moodle) store student activity information in their relational databases, and therefore typicalWUManalysisof LMSdatadoesnot require theanalysisofplainWebserver logs,whichsimplifies thedatacleaningprocess(Munk&Drlík,2011).Inthelearningcontexts,oneoftheearlieststudiesthataddressedstudenttime-on-taskisbyMarquardt,Becker,andRuiz(2004).Theirapproachisuniqueinofferingadifferentconceptualizationofusersession.Essentially,theauthorsusereferencesessionto indicateatypicalusersession,and learningsessiontoindicate a user session spanning multiple days and focusing on a particular learning activity. ForidentificationofreferencesessionsMarquardtetal.(2004)alsorecommendusingtimeoutintervals,buttheydonotprovidearecommendationonaparticulartimeoutvalue.ThisapproachisusedinmanyWUMstudiesoflearningtechnologies,suchasBa-Omaretal.(2007)andMunkandDrlík(2011)whoused30-and15-minutesessiontimeouts,respectively.InadditiontotheworkdrawingonresearchfromWebmining,therearealsomorerecentstudiesfromthe fieldsof learninganalytics (LA) andeducationaldatamining (EDM) that adoptnovel strategies toaddress the issues of time-on-task estimation. For example, the study by del Valle and Duffy (2009)reportedtheuseofa30-minutetimeoutintervaltodetecttheendofusersessions,andforeachsessionestimatedthedurationoflastactionasanaveragetimespentonagivenactionbyaparticularuser.DelValleandDuffy(2009)pointoutthattheestimationofstudenttime-on-taskbasedontracedataismadeunder the assumption that time between two logged events is spent on learning— and that similarassumptionsaremadeintheresearchofotherlearningmodalities.InasimilarmannerWise,Speer,Marbouti,andHsiao(2013)examinedthedistributionofactiondurationsanduseda60-minuteinactivityperiodasanindicatoroftheendofuseractivity.Thelastactionofeachsessionisestimatedbasedonthelengthoftheparticularmessageandtheaveragespeedatwhichtheuserwasconductingaparticularaction (i.e., reading,posting,oreditingamessage). In thecontextofminingtracedata fromcollaborative learningenvironments,Perera,Kay,Koprinska,Yacef,andZaiane(2009)usedatime-basedheuristictodefineactivitysessionsusinga7-hourinactivityperiod.

(2015).Doestime-on-taskmatter?Implicationsforthevalidityoflearninganalyticsfindings.JournalofLearningAnalytics,2(3),81–110.http://dx.doi.org/10.18608/jla.2015.23.6
ISSN1929-7750(online).TheJournalofLearningAnalyticsworksunderaCreativeCommonsLicense,Attribution-NonCommercial-NoDerivs3.0Unported(CCBY-NC-ND3.0) 87
TherearealsomanystudiesintheLAandEDMfieldsthatdonotdiscussandreportdetailsofhowtime-on-task measures were calculated (e.g., Lust, Elen, & Clarebout, 2013a, 2013b; Lust, Vandewaetere,Ceulemans, Elen,& Clarebout, 2011;Macfadyen&Dawson, 2010; Romero, Espejo, Zafra, Romero,&Ventura, 2013; Romero, Ventura, & García, 2008;Wise, Zhao, & Hausknecht, 2013). Typically, thosestudies make use of both count and time-on-task measures. As such, it would appear likely thatresearchersusedtimedifferencesfromtherawdataorsimpletime-basedheuristicssuchastheonesdescribedabove.Several researchershaveadopteduniquetechniques for time-on-taskestimation.Forexample,BrownandGreen(2009)calculatedtimespentreadingdiscussionsbyextractingtheaveragenumberofwordsperdiscussionandthenmultiplying itby180wordsperminute(whichwasobtainedempirically).Thechallengewiththisapproachisinitsinabilitytodetectshallowreadingandskimming(i.e.,readingthatisfaster than 6.5 words per second) (Hewitt, Brett, & Peters, 2007), as done in similar studies (Oztok,Zingaro,Brett,&Hewitt,2013;Wise,Speer,etal.,2013;Wise,Zhao,etal.2013b)thatestimatedtime-on-taskfromtrace-data.Somestudiesalsousedself-reporteddataontheamountoftimestudentsspentusing thesystem (e.g.,García-Martín&García-Sánchez,2013;Hsu&Ching,2013;Romero&Barbera,2011),andthisapproachraisesanadditionalsetofreliabilitychallenges(Winne&Jamieson-Noel,2002).Finally, in laboratorysettings,Guo,Wang,Moore,Liu,andChen(2009)andKolloffel,Eysink,andJong(2011) measured time-on-task as the difference between the start and the end of an experimentallearningactivity.3 RESEARCH QUESTIONS: EFFECTS OF TIME-ON-TASK MEASURING ON ANALYTICS RESULTS Althoughtime-on-taskmeasuresfromLMStracedatahavebeenusedextensively in learninganalyticsresearch,tothebestofourknowledgetherehavebeennostudiesthataddressthechallengesandissuesassociatedwiththeirestimationandthatinvestigatewhateffectstheadoptedestimationmethodshaveontheresultinganalyticalmodels.Theprimarygoalofthispaper istoraiseawareness inthe learninganalyticsresearchcommunityabouttheimportantimplicationsthatadoptedestimationmethodshave.Thus,themainresearchquestionforthisstudyisthis:
Whateffectsdodifferentmethodsforestimationoftimeon-task-measuresfromLMSdatahave on the results of analytical models? Are there differences in their statisticalsignificanceandoverallconclusionsthatcanbedrawnfromthem?
Inordertoprovideacomprehensiveoverviewoftheeffectthattime-on-taskestimationhasonstudyresults,itisequallyimportanttoacknowledgethespecificsofeachindividualcourse.Giventhatstudents’behaviour, conceptions of learning, and the use of learning systems are all highly dependent on theparticularcoursespecifics(e.g.,coursedesign,organization,subjectdomain)(Cho&Kim,2013;Gašević,Dawson,Rogers,&Gašević,2015;Trigwell,Prosser,&Waterhouse,1999),thesecondgoalofourstudyis

(2015).Doestime-on-taskmatter?Implicationsforthevalidityoflearninganalyticsfindings.JournalofLearningAnalytics,2(3),81–110.http://dx.doi.org/10.18608/jla.2015.23.6
ISSN1929-7750(online).TheJournalofLearningAnalyticsworksunderaCreativeCommonsLicense,Attribution-NonCommercial-NoDerivs3.0Unported(CCBY-NC-ND3.0) 88
to investigate how differences between the courses moderate the effects of different time-on-taskestimationmethods.Hence,oursecondresearchquestionisthis:
Aretheeffectsoftime-on-taskestimationconsistentacrossthecoursesfromdifferentsubjectdomainsandwithdifferentcourseorganizations?IsthereanassociationbetweenthelevelofLMSuseandtheeffectoftime-on-taskestimationstrategies?
Themajorityofstudiesincorporatingtime-on-taskestimationprovideinsufficientdetailsconcerningtheadoptedproceduresandmeasurementheuristics,whicharenecessarytoreplicatetheirresearchfindings.Astheadoptedtechniquesmayhavesignificanteffectsontheresultsofpublishedstudies,thelearninganalyticscommunityshouldbecautiousaboutinterpretinganyresultsthatinvolvetime-on-taskmeasuresfromLMSdata. 4 STUDY DATASETS 4.1 Online Course Dataset 4.1.1 CourseorganizationThefirstdatasetisfroma13-week-longmasters-levelfullyonlinecourseinsoftwareengineeringofferedat a Canadian public university. Given its postgraduate level, the course was research intensive andfocusedoncontemporarytrendsandchallengesintheareaofsoftwareengineering.Thecourseusedtheuniversity’sMoodleplatform(MoodleHQ,2014),whichhostedall resources,assignments,andonlinediscussionsforthecourse.ThisparticularcoursewasselectedbecauseitwasafullyonlinecoursewithstrongemphasisontheuseoftheLMSplatforminparticularassignments,resources,andforumMoodlecomponents—alsoknownasMoodlesystemmodules.Tofinishthecoursesuccessfullystudentswereexpectedtocompleteseveralactivitiesincludingfourtutor-markedassignments(TMAs):
• TMA1(15%ofthefinalgrade):Studentswererequestedto1)selectandreadonepeer-reviewedpaper,2)prepareavideopresentationforotherstudentsdescribingandanalyzingtheselectedpaper,and3)makeanewdiscussionthreadintheonlineforumswherestudentswoulddiscusseachother’spresentations.
• TMA2 (25%ofthefinalgrade):Studentswererequiredtowritea literaturereviewpaper(5–6pagesintheACMproceedingsformat)onaparticularsoftwareengineeringtopic.Themarkforthisassignmentwasdeterminedasfollows:1)80%basedontwodouble-blindpeerreviews(eachcontributing35%ofthepapergrade)andtheinstructorreview(contributing30%ofthepapergrade),and2)20%givenbytheinstructorbasedonthequalityofthepeer-reviewcomments.
• TMA3 (15%of the final grade): Studentswere requested todemonstrate critical thinking andsynthesisskillsbyansweringsixquestions(400–500wordseach)relatedtothecoursereadings.
• TMA4(30%ofthefinalgrade):Studentswererequiredtoworkingroupsof2–3onasoftwareengineering research project. The outcomewas a project report alongwith a set of softwareartefacts(e.g.,modelsandsourcecode)markedbytheinstructor.

(2015).Doestime-on-taskmatter?Implicationsforthevalidityoflearninganalyticsfindings.JournalofLearningAnalytics,2(3),81–110.http://dx.doi.org/10.18608/jla.2015.23.6
ISSN1929-7750(online).TheJournalofLearningAnalyticsworksunderaCreativeCommonsLicense,Attribution-NonCommercial-NoDerivs3.0Unported(CCBY-NC-ND3.0) 89
• CourseParticipation(15%ofthefinalgrade):Studentswereexpectedtoparticipateproductivelyinonlinediscussionsforthedurationofthecourse.
The data was obtained from Moodle’s PostgreSQL database and consisted of 167,000 log recordsproducedby81studentswhocompletedthecourse,whichwasofferedsixtimes:Winter2008(N=15),Fall2008(N=22),Summer2009(N=10),Fall2009(N=7),Winter2010(N=14),andWinter2011(N=13).Duringthecourse,studentsproduced1,747discussionmessagesthatwerealsousedasanadditionaldatasetforthisstudy.Table1showsthedetaileddescriptionofeachcourseofferingusedinthisstudy.4.1.2 Extractionofcountandtime-on-taskmeasuresFromthecollectedtracedata,weextractedfivecountmeasures,showninTable2,andcorrespondingtime-on-task measures using different estimation strategies, which will be covered in detail in theMethodologysection.Theextractedmeasurescorrespondtotheactivities inwhichthestudentswereexpectedtoengage.ThecountmeasureswereeasilyextractedfromMoodletracedata,asthenumberoftimeseachactionisrecordedforeverystudent.Similarly,time-on-taskmeasureswereextractedasthetotalamountoftimeeachstudentspentonaparticulartypeofactivity.4.1.3 ExtractionofperformancemeasuresIn addition to countmeasures,weextracteda setof four academicperformancemeasures:1) TMA2grade,2)TMA3grade,3)courseparticipationgrade,and4)finalcoursepercentgrade.WedecidedtouseTMA2,TMA3,andcourseparticipationgradessincetheystipulatedahighuseoftheLMSsystem,whiletheothertwoassignments(TMA1andTMA4)expectedmore“offline”workfromthestudents.Finally,giventhatmanystudiesexaminedtherelationshipbetweenfinalcoursegradesandstudentuseofLMSs,weincludedfinalcoursegradeasanadditional“high-level”measureofacademicperformance.
Table1:Onlinecoursedataset:Courseofferingstatistics
Students Actions Messages Actions/Student Messages/Student
Winter2008 15 33,976 212 2,265 14.1
Fall2008 22 49,928 633 2,269 28.8
Summer2009 10 21,059 243 2,106 24.3
Fall2009 7 11,346 63 1,621 9.0
Winter2010 14 31,169 359 2,226 25.6
Winter2011 13 19,783 237 1,522 18.2
Average(SD) 13.5(5.1) 27,877(13,561) 291.2(192.4) 2,002(340) 20.0(7.6)
Total 81 167,261 1,747

(2015).Doestime-on-taskmatter?Implicationsforthevalidityoflearninganalyticsfindings.JournalofLearningAnalytics,2(3),81–110.http://dx.doi.org/10.18608/jla.2015.23.6
ISSN1929-7750(online).TheJournalofLearningAnalyticsworksunderaCreativeCommonsLicense,Attribution-NonCommercial-NoDerivs3.0Unported(CCBY-NC-ND3.0) 90
Table2:Onlinecoursedataset:Extractedmeasures CountMeasures
# Module Name Description1 Assignment AsignmentViewCount Numberofassignmentviews.2 Forum ResourceViewCount Numberofresourcesviews.3 Forum DiscussionViewCount Numberofcoursediscussionviews.4 Forum AddPostCount Numberofpostedmessages.5 Forum UpdatePostCount Numberofpostupdates. Time-on-TaskMeasures
# Module Name Description1 Assignment AsignmentViewTime Timespentoncourseassignments.2 Forum ResourceViewTime Timespentreadingcourseresources.3 Forum DiscussionViewTime Timespentviewingcoursediscussions.4 Forum AddPostTime Timespentpostingdiscussionmessages.5 Forum UpdatePostTime Timespentupdatingdiscussionmessages. PerformanceMeasures
# Name Description1 TMA2Grade Gradeforliteraturereviewpaper.2 TMA3Grade Gradeforjournalpapersreadings.3 ParticipationGrade Gradeforparticipationincoursediscussions.4 FinalGrade Finalgradeinthecourse.5 CoIHigh Integrationandresolutionmessagecount.Inordertoprovideamorecomprehensiveexperimentalsettingthatincludesseveraltypesofdependentmeasures, we used an additional set of measures based on the popular Community of Inquiry (CoI)framework(Garrisonetal.,1999).WeselectedtheCoImodelbecauseitwasthebasisforthedesignofthetargetcourse(cf.Gašević,Adesope,Joksimović,&Kovanović,2015).Furthermore,theCoIframeworkisoneofthemostwellresearchedandvalidatedmodelsofdistanceeducation(cf.Swan&Ice,2010)thatdefines important dimensions of online learning and offers a coding instrument for measurement(Garrisonetal.,1999)ofthesedimensions.Inthepresentstudy,wefocusedonthecognitivepresenceconstruct,whichdescribesstudents’developmentofcriticalanddeepthinkingskillsasconsistingoffourphases:1)Triggeringevent,2)Exploration,3)Integration,and4)Resolution.Earlyresearch(Garrisonetal.,2001)hasindicatedthatamajorityofstudentsdonoteasilynorreadilyprogresstothelaterstagesofcognitivepresence.Withtheintentionofexaminingassociationbetweendifferenttime-on-taskmeasuresanddevelopmentofcognitivepresence,weextractedoneadditionalperformancemeasure,CoIHigh,namely,thenumberofmessages in integrationandresolutionphases.WecodeddiscussionmessagesusingtheCoIcodingschemeforcognitivepresencedescribedbyGarrisonetal.(2001).Eachmessagewascoded by two human coders who achieved an excellent inter-rater agreement (Cohen’s kappa=.97),disagreeingononly32messages.TheresultsofthecodingprocessareshowninTable3.

(2015).Doestime-on-taskmatter?Implicationsforthevalidityoflearninganalyticsfindings.JournalofLearningAnalytics,2(3),81–110.http://dx.doi.org/10.18608/jla.2015.23.6
ISSN1929-7750(online).TheJournalofLearningAnalyticsworksunderaCreativeCommonsLicense,Attribution-NonCommercial-NoDerivs3.0Unported(CCBY-NC-ND3.0) 91
Table3:Messagecodingresults
ID Phase Messages (%)
0 Other 140 8.01%
1 TriggeringEvent 308 17.63%
2 Exploration 684 39.17%
3 Integration 508 29.08%
4 Resolution 107 6.12%
AllPhases 1,747 100% 4.2 Blended Courses Dataset 4.2.1 CoursesorganizationIn order to examine the effects of diverse course organizations on the use of different time-on-taskestimationstrategies,weusedalargedatasetfromaSpring2012offeringofninefirst-yearcoursesatalargeAustralian public university. All nine courseswere part of the university-wide student retentionprojectcalledEnhancingStudentAcademicPotential(ESAP).Theprojectwasorganizedandcoordinatedbytheuniversity’scentrallearningandteachingunittoprovidesupportforfirst-yearstudentsidentifiedashavinglearningbehavioursthattendedtoleadtosuboptimalacademicsuccess.ParticipationinESAPwasbasedona consistent low retention in theprogramand course success in thepast five years. Inaddition,allESAPcourseswererequiredtohavemorethan150studentsenrolled.Beforethestartofthecourses,allstudentswereinformedaboutcompliancewiththeuniversity’sethicsandprivacyregulationsand that the LMS data would be collected and used for improving the quality of the courses andunderstandingofstudentlearningbehaviours.Allninecourseswereofferedusingablended learningapproach inwhich face-to-face instructionwasaccompaniedbyanonlinecomponentprovidedbytheuniversity’scentralMoodleLMSplatform(e.g.,assignments, resources, quizzes, chat, student discussions). The nine courses of the ESAP initiativeincludedinthisstudywerefromawiderangeofdisciplines.Thoseincludetwocoursesfrombiology(BIOL1 and BIOL 2), and one course from accounting (ACCT), communications (COMM), computer science(COMP),economics(ECON),graphicsdesign(GRAP),marketing(MARK),andmathematics(MATH).Thegeneralinformationaboutthesizeofeachcourse’sdataisshowninTable4.Intotal,thedatasetconsistedofslightlymorethan4,000studentsthatgenerated4.6millionactionrecordsandabout3,000discussionmessages.Onaverage,eachcoursehad449students (SD=243)anda littleover250,000relevantLMStracerecords.4.2.2 Extractionofcount,time-on-task,andperformancemeasuresAswithafullyonlinedataset,thedataforeachcourseincludedonlystudentsthatcompletedthecourseandincludedonlytheonesthatwererelevantfromthestandpointofcourseorganization.Aseachcourse

(2015).Doestime-on-taskmatter?Implicationsforthevalidityoflearninganalyticsfindings.JournalofLearningAnalytics,2(3),81–110.http://dx.doi.org/10.18608/jla.2015.23.6
ISSN1929-7750(online).TheJournalofLearningAnalyticsworksunderaCreativeCommonsLicense,Attribution-NonCommercial-NoDerivs3.0Unported(CCBY-NC-ND3.0) 92
haddifferentorganizationanddifferentexpectationsforLMSuse,weincludedonlythedataalignedwithcourseorganization.TheusagesummaryfordifferentMoodlemodules(e.g.,discussions,assignments,quizzes,chat) ineachcourse isshownonTable5.Aswecansee,mostcoursesadoptedassignments,forums,resources,andturnitinmodules,whileasmallernumberofcoursesusedothermodules.Weextracted tracedata for activities that studentswereexpected touseby coursedesignandwererelatedtolearning,similarlytothefirstdataset.AsmostMoodlemoduleshaveactionsnotcorrespondingtolearningactivities(e.g.,listingalldiscussionsorlistingallassignments),fromeachofthemoduleswefocusedonlyonactionsrelatedtostudentlearning.Finally,forcertainactions—suchasforumsearch—thereisnomeaningfulnotionoftime,sointhosecasesweextractedonlycountmeasures.Thecompletelist of extracted measures is shown in Table 6. We extracted six measures that do not have acorresponding time measure, and 13 measures that had meaningful corresponding time-on-taskmeasures.Asmeasuresrelatedtothenumberofdiscussionmessageedits (i.e.,UpdatePostCount and UpdatePostTime)wereclosetozeroinallninecourses,weremovedthosemeasuresfromourfurtheranalysis.AdetailedoverviewofextractedcountmeasuresforeachcourseisgiveninTable7.Aswecansee,coursesdifferedintheirvolumeofactivity,andmostlymadeuseofallactivitiesdefinedbythecoursedesign.TheonlynotableexceptionswereCOMPandGRAPcoursesthatdidnotmakeuseofonlinediscussions,eventhoughtheyweremadeavailable—butnotdirectlyscaffolded—bythecoursedesign.In contrast to the firstdataset, inwhichweextractedavarietyofoutcomemeasures, for the secondanalysiswefocusedonlyonasingleoutcomemeasure,acoursefinalpercentagegrade.Giventhateachcoursehasaspecificgradingstructureandlistofassignments,inordertoexaminetheeffectofcourseorganizationwe focused on the outcomemeasure common to all courses— course final grade. Thisenabledustoseethedifferencesinresultsofregressionanalysesbetweencoursesacrossdifferenttime-on-taskestimationapproaches.

(2015).Doestime-on-taskmatter?Implicationsforthevalidityoflearninganalyticsfindings.JournalofLearningAnalytics,2(3),81–110.http://dx.doi.org/10.18608/jla.2015.23.6
ISSN1929-7750(online).TheJournalofLearningAnalyticsworksunderaCreativeCommonsLicense,Attribution-NonCommercial-NoDerivs3.0Unported(CCBY-NC-ND3.0) 93
Table4:Blendedcoursesdataset:CoursestatisticsCourse Students Actions Messages Actions/Students Messages/Students
ACCT 734 327,423 515 446 0.70
BIOL1 216 221,102 206 1,024 0.95
BIOL2 648 595,730 1024 919 1.58
COMM 494 210,085 509 425 1.03
COMP 236 100,638 0 426 0.00
ECON 646 409,116 416 633 0.64
GRAP 172 14,746 0 86 0.00
MARK 712 327,144 407 459 0.57
MATH 191 119,997 56 628 0.29
Average(SD) 449(243) 258,442(172,570) 348(329) 561(282) 0.64(0.51)
Total 4,049 4,651,962 3,133
Table5:Blendedcoursesdataset:Coursemoduleusages ACCTBIOL1BIOL2COMMCOMPECONGRAPMARKMATH
Assignment X X X X X X X
Book X X X
Chat X
CourseLogins X X X X X X X X X
Feedback X
Forum X X X X X X X X X
Gallery X
Map X
Quiz X X X X
Resource X X X X X X X X X
Turnitin X X X X X X
VirtualClassroom X

(2015).Doestime-on-taskmatter?Implicationsforthevalidityoflearninganalyticsfindings.JournalofLearningAnalytics,2(3),81–110.http://dx.doi.org/10.18608/jla.2015.23.6
ISSN1929-7750(online).TheJournalofLearningAnalyticsworksunderaCreativeCommonsLicense,Attribution-NonCommercial-NoDerivs3.0Unported(CCBY-NC-ND3.0) 88
Table6:Blendedcoursesdataset:Extractedmeasures Count-onlyMeasures(nocorrespondingtime-on-taskmeasure)
# Module Name Description1 Assignments AssignmentUploadCount Numberofassignmentuploads.2 Book BookPrintCount Numberofbookprintings.3 Course CourseViewCount Numberofcoursehomepageviews.4 Feedback FeedbackCount Numberoffeedbackssubmitted.5 Forum ForumSearchCount Numberofforumsearches.6 Turnitin TurnitinSubmissionCount Numberofturnitinsubmissions. CountMeasures(withcorrespondingtime-on-taskmeasure)
# Module Name Description1 Assignments AssignmentViewCount Numberofassignmentviews.2 Book BookViewCount Numberofbookviews.3 Chat ChatViewCount Numberofchatviews.4 Chat ChatTalkCount Numberofchatmessages.5 Forum ViewDiscussionCount Numberofforumdiscussionviews.6 Forum AddPostCount Numberofforummessageswritten.7 Gallery GalleryViewCount Numberofgalleryviews.8 Map MapViewCount Numberofgeomapviews.9 Quiz QuizViewCount Numberofquizviews.10 Quiz QuizAttemptCount Numberofquizattempts.11 Quiz QuizReviewCount Numberofquizreviews.12 Resources ResourceViewCount Numberofcourseresourceviews.13 Virtualclassroom AdobeConnectViewCount Numberofvirtualclassroomviews. Time-on-TaskMeasures(withcorrespondingcountmeasures)
# Module Name Description1 Assignments AssignmentViewTime Timespentviewingassignments2 Book BookViewTime Timespentviewingcoursebooks.3 Chat ChatViewTime Timespentviewingchatrecords.4 Chat ChatTalkTime Timespententeringchatmessages.5 Forum ViewDiscussionTime Timespentviewingdiscussions.6 Forum AddPostTime Timespentwritingforummessages.7 Gallery GalleryViewTime Timespentviewingcoursegalleries.8 Map MapViewTime Timespentviewinggeomaps.9 Quiz QuizViewTime Timespentviewingcoursequizzes.10 Quiz QuizAttemptTime Timespentdoingcoursequizzes.11 Quiz QuizReviewTime Timespentreviewingquizresults.12 Resources ResourceViewTime Timespentviewingresources.13 Virtualclassroom AdobeConnectViewTime Timespentinvirtualclassroom. PerformanceMeasures
# Name Description1 FinalGrade Finalpercentgradeinthecourse.

(2015).Doestime-on-taskmatter?Implicationsforthevalidityoflearninganalyticsfindings.JournalofLearningAnalytics,2(3),81–110.http://dx.doi.org/10.18608/jla.2015.23.6
ISSN1929-7750(online).TheJournalofLearningAnalyticsworksunderaCreativeCommonsLicense,Attribution-NonCommercial-NoDerivs3.0Unported(CCBY-NC-ND3.0) 89
Table7:Blendedcoursesdataset:Courseactionscounts ACCT BIOL1 BIOL2 COMM COMP ECON GRAP MARK MATH
StudentCount 734 216 648 494 236 646 172 712 191
Avg.Grade 72.7(140.2)
60.4(68.1)
74.5(123.4)
85.5(163.3)
82(137)
73.2(134.1)
64.7(73.1)
74.4(122.2)
69.2(119.7)
Assign.UploadCount 2(2.8)
0(0) 7.4
(5.1)2.8
(2.5)7
(4.5) 5.1(2.4)
2.4(3.7)
Assign.ViewCount 6.7(8.6)
21.4(11.5) 27.3
(19)11.7(8.1)
30.1(18.2) 23.5
(14.4)23.9
(13.5)
BookViewCount 4.8(6.8) 5.2
(8) 2.1(2.1)
BookPrintCount 0(0.1) 0.1
(0.8) 0.1(0.3)
ChatTalkCount 0.2(2.6)
ChatViewCount 0.4(1.1)
CourseViewCount 58.5(63)
125(76.2)
135.4(114.9)
60.8(49)
71.7(49.2)
84.5(70.6)
11.2(9.2)
59(46.2)
98.7(62.4)
FeedbackCount 0.7(0.8)
ForumSearchCount 0.7(4.9)
0.1(0.6)
0.1(0.4)
0.1(0.9)
0(0)
0.1(1.3)
0(0)
0.1(0.6)
0.1(0.6)
ViewDisc.Count 27.9(62.6)
37.4(36.3)
36.8(77.3)
43.4(61.5)
0(0)
30(42)
0(0)
22(33.9)
11.5(14.1)
AddPostCount 0.3(2.5)
0.6(2.5)
1.1(4.2)
0.6(2)
0(0)
0.4(1.3)
0(0)
0.3(1.6)
0.1(0.6)
GalleryViewCount 0.9(1.6)
MapViewCount 0.4(1.2)
QuizViewCount 29.7(15.6)
51.3(59.9) 3.1
(6.7)6.8
(12.3)
QuizAttemptCount 8.1(2.2)
30.7(36.6) 0.7
(1.6)3.2(6)
QuizReviewCount 19.4(51.5)
30.5(37.2) 1.8
(5.7)3.5
(8.9)
Res.ViewCount 45.9(62.7)
71.6(41.9)
137.8(91)
23.2(14.6)
0.6(0.8)
60.2(101.9)
11.1(10.5)
54.8(40.3)
92.3(63.6)
TurnitinSub.Count 0.9(1) 3.4
(1.9)2.2
(1.4)3.2
(1.7) 2.5(1.1)
1(1.6)
AdobeCon.ViewCount 12.4(24.7)

(2015).Doestime-on-taskmatter?Implicationsforthevalidityoflearninganalyticsfindings.JournalofLearningAnalytics,2(3),81–110.http://dx.doi.org/10.18608/jla.2015.23.6
ISSN1929-7750(online).TheJournalofLearningAnalyticsworksunderaCreativeCommonsLicense,Attribution-NonCommercial-NoDerivs3.0Unported(CCBY-NC-ND3.0) 90
5 METHODOLOGY 5.1 Extraction of Time-on-task Measures 5.1.1 Time-on-taskextractionprocedureInordertocalculatetime-on-taskmeasuresweprocessedtracedataavailableintheMoodleplatform.Table8showsatypicalsectionoftheloggeddata.Moodleitselfdoesnotrecordthedurationofeachindividualaction,butratherstoresonlytimestampsofimportant“events”completedbythestudentsorthe system. Thus, in order to calculate the time spent on different activities, a difference betweensubsequent log records ismeasured. For example, to calculate time spent viewing discussion D1,wecalculatedthedifferencebetweenitsstarttimeandthestarttimeofthefollowingactivityinthelog(T2–T1).Thisisthesimplest,moststraightforwardwayofdeterminingtime-on-taskcalculations.As someof the loggedactionshaveuniqueproperties, they require special attention. For example, acertainnumberofloggedactivitiesareinstantaneousandcannotbeattributedtoameaningfuldurationof time(e.g.,markingdiscussionas read,orperformingasearch indiscussionboards).Thus, thetimeperiodsbetween theseactions and subsequent actions shouldbeadded to time-on-taskestimatesofprecedingactionsintheactionlog.Forexample,inTable8,timespentviewingdiscussionD2should—besidesperiodT2–T3—alsoincludeperiodT3–T4astheusercontinuedtoreadthesamediscussionaftermarkingitasread.Thus,thetotaltime-on-taskforviewingdiscussionD2shouldbecalculatedasT4–T2.Table8:Typicaltracedata.Bluecursiveindicatesactionswithoverestimatedtime-on-task,whilered
boldfaceindicatesactionsthatrequirespecialnon-standardcalculationoftime-on-taskTime User Action Duration… … … …T0 UserU UserLogin 0sT1 UserU StartViewingDiscussionD1 T2–T1T2 UserU StartViewingDiscussionD2 T4–T2T3 UserU MarkDiscussionD2asRead T4–T3T4 UserU StartViewingDiscussionD3 0sT5 UserU SubmitNewMessageM1 T5–T4T6 UserU StartViewingDiscussionD4 T7–t6… … prolongedtimeperiod …T7 UserU StartViewingAssignmentTMA1 T8–T7T8 UserU StartViewingResourceR1 T9–T8… … prolongedtimeperiod …T9 UserU UserLogin T10–T9T10 UserU StartViewingResourceR2 T11–T10T11 UserU StartViewingDiscussionD5 T12–T11T12 UserU UserLogin T13–T12… … … …

(2015).Doestime-on-taskmatter?Implicationsforthevalidityoflearninganalyticsfindings.JournalofLearningAnalytics,2(3),81–110.http://dx.doi.org/10.18608/jla.2015.23.6
ISSN1929-7750(online).TheJournalofLearningAnalyticsworksunderaCreativeCommonsLicense,Attribution-NonCommercial-NoDerivs3.0Unported(CCBY-NC-ND3.0) 91
It isalsoimportanttonotethatMoodlerecordscertainactionsattheirend,ratherthantheirstart. Inthese instances, a “backward” time-on-task estimation is required. This is best illustrated through anexamplefromTable8wherestudentUstartsviewingdiscussionD3attimeT4.Afterawhile,thestudentclicksthe“PostReply”buttontoposthisresponsetothediscussion.Apop-updialogforwritinganewmessageappearsandthestudentstartstypinghisresponse.However,Moodledoesnotrecordthestartofthemessagewriting.Itisonlyafterthestudentpressesthe“Submit”button,thatanactionisloggedbythesystem(timeT5).Thus,thetimespentwritingthemessageshouldbecalculated“backwards,”asT5–T4.Giventhattheexactmomentwhenthestudentstartedwritinghisresponseisnotrecorded,itisalsonotpossibletotellhowmuchtimethestudentactuallyspentwritingtheresponseandhowmuchonreadingthediscussionprior towriting theresponse.Thus, timespentreadingdiscussionsprecedingareplybyastudentcouldnotbepreciselydeterminedfromthecurrentformatofMoodlelogs.Thisisaparticular challengeof theMoodleplatform that shouldbe consideredwhen calculating time-on-taskestimatesfromMoodletracedata.5.1.2 Twochallengesoftime-on-taskestimationAnimportantcharacteristicofMoodlerelatestothewayinwhichusersessionsarehandled.Typically,astudentsessionispreservedaslongasthestudent’sbrowserwindowisopen.Thus,ifthestudentstopsusing the system and engages in an alternate activity, it would be impossible to detect the off-taskbehaviourbasedonMoodlelogsalone.Atypicalsolutionfordealingwithsuchcasesistousesomeformoftime-basedheuristic—asdescribed inSection2—andplaceamaximumvalueonthedurationofactivities(usually10–15minutesoronehour).Thus,durationsofactivitieslongerthanthethresholdarereplacedwiththemaximumallowedduration.IntheexampleinTable8,thetimespentviewingdiscussionD4 isexceptionally long,whichsuggests the likelihoodofa longoff-taskactivity.Accounting for theseunusuallylongactivitiesiswhatwerefertoasthe“outlierdetection”problem.Finally,ifastudentclosesherbrowserwindow,thenthenexttimeshewantstousethesystemsheisrequiredtologinbeforeshecandoanythingelse.Thus,insomecases,anactionisfollowedbyaloginaction,inwhichcaseweknowtherewascertainlysomeoff-taskbehaviour.Thetwosimplestrategiesforaddressingthisissueare1)toignorethatanactionisfollowedbyaloginaction,ifthetotaldurationoftheactionislessthanagiventhreshold,and2)toestimatethedurationfromtheremainingrecordsofthegivenactionbyaparticularuser(asdonebydelValleandDuffy,2009).IntheexampleinTable8,wecanseethatthetimespentviewingresourcesR1anddiscussionsD5arecertainlyoverestimated,astheymustcontainsomeamountoftimespentoutsideofthesystem.Werefertothisproblemasthe“last-actionestimation”problem.These twoproblems—outlierdetectionand last-actionestimation—combinedwith the specificsofMoodle action tracing strategy make time-on-task estimation extremely challenging and require thedevelopmentofdifferentapproachesfortime-on-taskestimation.

(2015).Doestime-on-taskmatter?Implicationsforthevalidityoflearninganalyticsfindings.JournalofLearningAnalytics,2(3),81–110.http://dx.doi.org/10.18608/jla.2015.23.6
ISSN1929-7750(online).TheJournalofLearningAnalyticsworksunderaCreativeCommonsLicense,Attribution-NonCommercial-NoDerivs3.0Unported(CCBY-NC-ND3.0) 92
5.2 Experimental Procedure Giventhepreviouslydescribeddetailsoftime-on-taskestimationanditstwomainchallenges(i.e.,“outlierdetection”and“lastactionestimation”),weconductedanexperimentusing15differentstrategiesfortime-on-taskestimation(Table9).Weselectedtheseparticularstrategies inordertoprovideasmanydifferenttime-on-taskestimationstrategiesaspossible.Forsomeofthestrategies,wefoundevidenceintheexistingliterature(Ba-Omaretal.,2007;Grabe&Sigler,2002;Munk&Drlík,2011;delValle&Duffy,2009;Wise,Zhao,etal.,2013),whileothersareincludedinordertoprovideacomprehensiveevaluationofpossibletime-on-taskestimationmethods. Thefirstsixstrategiescompletelyignoreoutlierdetectionandsimplyusetheactualvaluesfromtheactionlogs(thisisdenotedbyx:intheirname).However,theydifferinhowtheyprocessthelastactionofeachsession. The first strategy (x:x) completely ignores time-on-task estimation challenges and simplycalculatesthedurationofactionsbysubtractingactualvaluesfromtheactionlog(i.e.,naïveapproach).Thesecondstrategyx:evissimilar,exceptthatthedurationofthelastactionofeachsessionisestimatedasameanvalueofthelogsforthesameaction(e.g.,discussionview)ofaparticularuser.Ontheotherhand,thethirdstrategyx:rmestimatesthedurationoflastactionsineverysessionasbeing0seconds.Giventhattime-on-taskestimatesaretypicallyusedtocalculatecumulativetimespentoneachindividualaction, this strategyeffectively removesa given record from the total sum (as it is estimatedbeing0secondslong).Strategiesx:l60,x:l30andx:l10ontheotherhandinsteadofestimatingorremovingthelastaction,putanuppervalueforthedurationat60,30and10minutes,respectively.
Table9:Differenttime-on-taskextractionstrategies# Name Description Group1: Nooutliersprocessing,differentprocessingoflastactions1 x:x Nooutliersandlastactionprocessing.2 x:ev Nooutliersprocessing,estimationoflastactionduration.3 x:rm Nooutliersprocessing,removaloflastaction.4 x:l60 Nooutliersprocessing,60minlastactiondurationlimit.5 x:l30 Nooutliersprocessing,30minlastactiondurationlimit.6 x:l10 Nooutliersprocessing,10minlastactiondurationlimit. Group2: Thresholdingoutliersandlastactions7 l60 60mindurationlimit.8 l30 30mindurationlimit.9 l10 10mindurationlimit. Group3: Thresholdingoutliersandestimatinglastactions10 l60:ev 60mindurationlimit,lastactionsestimated.11 l30:ev 30mindurationlimit,lastactionsestimated.12 l10:ev 10mindurationlimit,lastactionsestimated. Group4: Estimatingoutliersandlastactions13 +60ev Estimatelastactionsandactionslongerthan60min.14 +30ev Estimatelastactionsandactionslongerthan30min.15 +10ev Estimatelastactionsandactionslongerthan10min.

(2015).Doestime-on-taskmatter?Implicationsforthevalidityoflearninganalyticsfindings.JournalofLearningAnalytics,2(3),81–110.http://dx.doi.org/10.18608/jla.2015.23.6
ISSN1929-7750(online).TheJournalofLearningAnalyticsworksunderaCreativeCommonsLicense,Attribution-NonCommercial-NoDerivs3.0Unported(CCBY-NC-ND3.0) 93
Thesecondgroup(l60,l30,andl10)areverysimplestrategiesthatputanupperlimitonthedurationofanyaction.Ifanactionisshorter,anactualtimeisused;otherwise,theactionisreplacedwithaparticularthresholdvalue.Thechallengeofthisgroupofstrategiesisthatitishardtopickathresholdvaluethatwouldremoveasmuchoftheoff-taskbehaviouraspossible,whilenotaffectinggenuinelylongactions.Thethirdsetofstrategies(l60:ev,l30:ev,andl10:ev)alsoplaceanupperestimateonthedurationofallactions,exceptthosefollowedbyaloginaction(i.e.,sessions’lastactions).Theactionsfollowedbyaloginactionareestimatedtobetheaveragedurationofagivenaction,calculatedseparatelyforeachstudent.Therationaleascribedhereisthatifastudentperformedaparticularactionmanytimeswhereitwasnotfollowed by a login action, then those records could be used to estimate reasonably accurately thedurationsforthosecaseswhereanactionwasfollowedbyalogin.Finally,strategies inthe lastgroup(+60ev,+30ev,and+10ev)arethemostflexible,andtheyestimatedurationsofallactionsaboveaparticularthresholdasanaveragevalueforagivenaction(foraparticularuser).Therationaleisthatmostactionsareveryshort,andthusactionswithextensivelylongtimesmostlikely involve some off-task behaviour, which warrants estimation of their durations based on theremainingrecords,whicharemorelikelytobegenuine.5.3 Statistical Analysis Inordertoexaminethelevelofeffectdifferenttime-on-taskestimationprocedureshaveontheresultsofdifferentanalyticalmodels,weconducteda seriesofmultiple linear regressionanalyses.Thereareseveralreasonsforselectingmultipleregressionmodels.First,differentformsofgenerallinearmodels—includingmultiple linear regression—arewidelyused indiverse researchareas (Hastie, Tibshirani,&Friedman,2013),includinglearninganalyticsandEDM(Romero&Ventura,2010).Inaddition,multiplelinearregression isoneofthesimplestandmostrobustmodels (Hastieetal.,2013)and isoneofthemethods that shouldbe the least susceptible to changes in time-on-taskmeasures. Finally, given thatstandardizedregressioncoefficientsareeasytointerpretanddirectlycomparable,wecaneasilycompareseveraltime-on-taskextractionprocedures.6 RESULTS: ONLINE COURSE DATASET 6.1 Overview A series ofmultiple regression analyseswere undertaken for each of the five performancemeasuresacrossall15time-on-taskextractionstrategies.Figure1showsobtainedR2valueswhileTable11showsthedetailedregressionresults.Foralldependentvariables, time-on-taskmeasuresobtainedhigherR2valuesthatcountmeasures,whichisexpectedgiventhattheybettercapturestudentengagement.Whatismoreinterestingisthatthedifferencesbetweenestimationstrategiesarequitesubstantial.Table10showsthesummaryofthedifferencesbetweenthe“worst”and“best”performingstrategies.Onaverage,thedifference inR2was0.15,whichcorrespondsto15%ofthevariancebeingexplainedsolelybythe

(2015).Doestime-on-taskmatter?Implicationsforthevalidityoflearninganalyticsfindings.JournalofLearningAnalytics,2(3),81–110.http://dx.doi.org/10.18608/jla.2015.23.6
ISSN1929-7750(online).TheJournalofLearningAnalyticsworksunderaCreativeCommonsLicense,Attribution-NonCommercial-NoDerivs3.0Unported(CCBY-NC-ND3.0) 94
adoption of a particular time-on-task estimation strategy. The differences were the smallest for theCoIHighmeasure(R2differenceof0.07)andlargestfortheFinalGrademeasure(R2differenceof0.23).Table10:SummaryofdifferencesinR2scoresbetweendifferenttime-on-taskestimationstrategies
R2
PerformanceMeasure Min Max Range Mean SDTMA2Grade 0.08 0.26 0.18 0.14 0.04TMA3Grade 0.04 0.17 0.12 0.09 0.04ParticipationGrade 0.23 0.37 0.13 0.3 0.04FinalGrade 0.06 0.28 0.23 0.16 0.05CoIHigh 0.21 0.28 0.07 0.26 0.02
Figure1:VariationinR2scoresacrossdifferenttime-on-taskextractionstrategiesforfive
performancemeasures.
(2015).Doestime-on-taskmatter?Implicationsforthevalidityoflearninganalyticsfindings.JournalofLearningAnalytics,2(3),81–110.http://dx.doi.org/10.18608/jla.2015.23.6
ISSN1929-7750(online).TheJournalofLearningAnalyticsworksunderaCreativeCommonsLicense,Attribution-NonCommercial-NoDerivs3.0Unported(CCBY-NC-ND3.0) 95
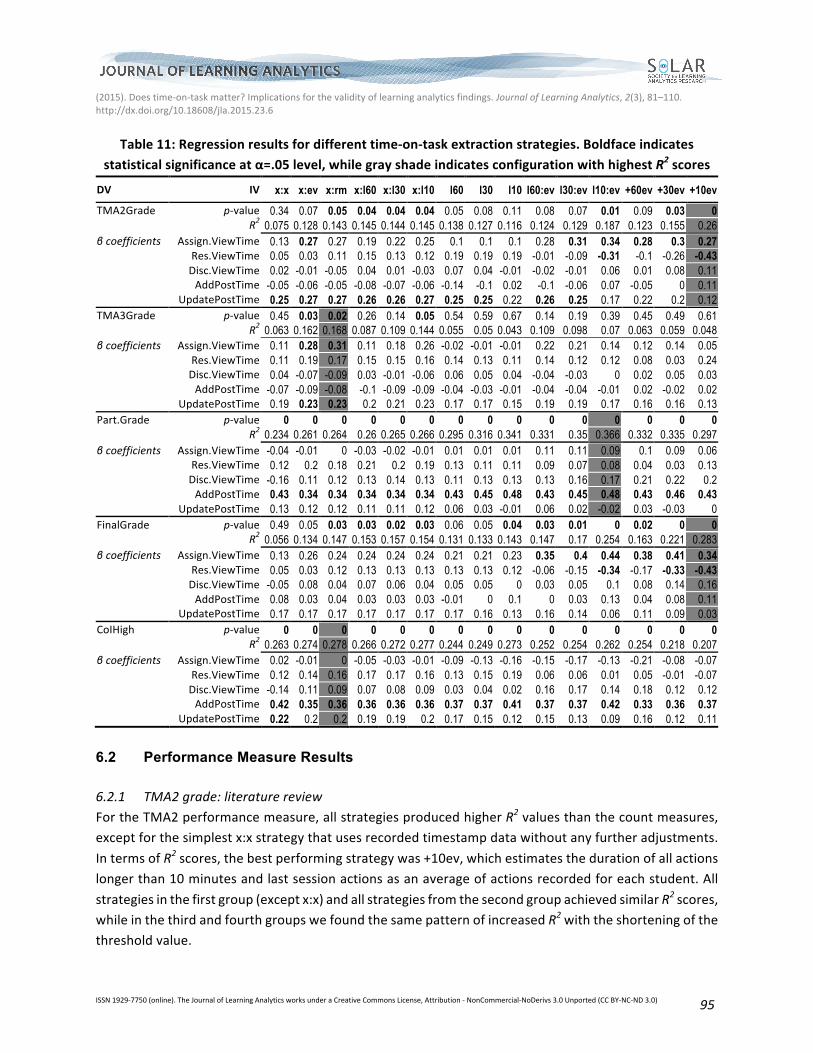
Table11:Regressionresultsfordifferenttime-on-taskextractionstrategies.Boldfaceindicatesstatisticalsignificanceatα=.05level,whilegrayshadeindicatesconfigurationwithhighestR2scores
DV IV x:x x:ev x:rm x:l60 x:l30 x:l10 l60 l30 l10 l60:ev l30:ev l10:ev +60ev +30ev +10ev TMA2Grade p-value 0.34 0.07 0.05 0.04 0.04 0.04 0.05 0.08 0.11 0.08 0.07 0.01 0.09 0.03 0 R2 0.075 0.128 0.143 0.145 0.144 0.145 0.138 0.127 0.116 0.124 0.129 0.187 0.123 0.155 0.26 βcoefficients Assign.ViewTime 0.13 0.27 0.27 0.19 0.22 0.25 0.1 0.1 0.1 0.28 0.31 0.34 0.28 0.3 0.27 Res.ViewTime 0.05 0.03 0.11 0.15 0.13 0.12 0.19 0.19 0.19 -0.01 -0.09 -0.31 -0.1 -0.26 -0.43 Disc.ViewTime 0.02 -0.01 -0.05 0.04 0.01 -0.03 0.07 0.04 -0.01 -0.02 -0.01 0.06 0.01 0.08 0.11 AddPostTime -0.05 -0.06 -0.05 -0.08 -0.07 -0.06 -0.14 -0.1 0.02 -0.1 -0.06 0.07 -0.05 0 0.11 UpdatePostTime 0.25 0.27 0.27 0.26 0.26 0.27 0.25 0.25 0.22 0.26 0.25 0.17 0.22 0.2 0.12 TMA3Grade p-value 0.45 0.03 0.02 0.26 0.14 0.05 0.54 0.59 0.67 0.14 0.19 0.39 0.45 0.49 0.61 R2 0.063 0.162 0.168 0.087 0.109 0.144 0.055 0.05 0.043 0.109 0.098 0.07 0.063 0.059 0.048 βcoefficients Assign.ViewTime 0.11 0.28 0.31 0.11 0.18 0.26 -0.02 -0.01 -0.01 0.22 0.21 0.14 0.12 0.14 0.05 Res.ViewTime 0.11 0.19 0.17 0.15 0.15 0.16 0.14 0.13 0.11 0.14 0.12 0.12 0.08 0.03 0.24 Disc.ViewTime 0.04 -0.07 -0.09 0.03 -0.01 -0.06 0.06 0.05 0.04 -0.04 -0.03 0 0.02 0.05 0.03 AddPostTime -0.07 -0.09 -0.08 -0.1 -0.09 -0.09 -0.04 -0.03 -0.01 -0.04 -0.04 -0.01 0.02 -0.02 0.02 UpdatePostTime 0.19 0.23 0.23 0.2 0.21 0.23 0.17 0.17 0.15 0.19 0.19 0.17 0.16 0.16 0.13 Part.Grade p-value 0 0 0 0 0 0 0 0 0 0 0 0 0 0 0 R2 0.234 0.261 0.264 0.26 0.265 0.266 0.295 0.316 0.341 0.331 0.35 0.366 0.332 0.335 0.297 βcoefficients Assign.ViewTime -0.04 -0.01 0 -0.03 -0.02 -0.01 0.01 0.01 0.01 0.11 0.11 0.09 0.1 0.09 0.06 Res.ViewTime 0.12 0.2 0.18 0.21 0.2 0.19 0.13 0.11 0.11 0.09 0.07 0.08 0.04 0.03 0.13 Disc.ViewTime -0.16 0.11 0.12 0.13 0.14 0.13 0.11 0.13 0.13 0.13 0.16 0.17 0.21 0.22 0.2 AddPostTime 0.43 0.34 0.34 0.34 0.34 0.34 0.43 0.45 0.48 0.43 0.45 0.48 0.43 0.46 0.43 UpdatePostTime 0.13 0.12 0.12 0.11 0.11 0.12 0.06 0.03 -0.01 0.06 0.02 -0.02 0.03 -0.03 0 FinalGrade p-value 0.49 0.05 0.03 0.03 0.02 0.03 0.06 0.05 0.04 0.03 0.01 0 0.02 0 0 R2 0.056 0.134 0.147 0.153 0.157 0.154 0.131 0.133 0.143 0.147 0.17 0.254 0.163 0.221 0.283 βcoefficients Assign.ViewTime 0.13 0.26 0.24 0.24 0.24 0.24 0.21 0.21 0.23 0.35 0.4 0.44 0.38 0.41 0.34 Res.ViewTime 0.05 0.03 0.12 0.13 0.13 0.13 0.13 0.13 0.12 -0.06 -0.15 -0.34 -0.17 -0.33 -0.43 Disc.ViewTime -0.05 0.08 0.04 0.07 0.06 0.04 0.05 0.05 0 0.03 0.05 0.1 0.08 0.14 0.16 AddPostTime 0.08 0.03 0.04 0.03 0.03 0.03 -0.01 0 0.1 0 0.03 0.13 0.04 0.08 0.11 UpdatePostTime 0.17 0.17 0.17 0.17 0.17 0.17 0.17 0.16 0.13 0.16 0.14 0.06 0.11 0.09 0.03 CoIHigh p-value 0 0 0 0 0 0 0 0 0 0 0 0 0 0 0 R2 0.263 0.274 0.278 0.266 0.272 0.277 0.244 0.249 0.273 0.252 0.254 0.262 0.254 0.218 0.207 βcoefficients Assign.ViewTime 0.02 -0.01 0 -0.05 -0.03 -0.01 -0.09 -0.13 -0.16 -0.15 -0.17 -0.13 -0.21 -0.08 -0.07 Res.ViewTime 0.12 0.14 0.16 0.17 0.17 0.16 0.13 0.15 0.19 0.06 0.06 0.01 0.05 -0.01 -0.07 Disc.ViewTime -0.14 0.11 0.09 0.07 0.08 0.09 0.03 0.04 0.02 0.16 0.17 0.14 0.18 0.12 0.12 AddPostTime 0.42 0.35 0.36 0.36 0.36 0.36 0.37 0.37 0.41 0.37 0.37 0.42 0.33 0.36 0.37 UpdatePostTime 0.22 0.2 0.2 0.19 0.19 0.2 0.17 0.15 0.12 0.15 0.13 0.09 0.16 0.12 0.11 6.2 Performance Measure Results 6.2.1 TMA2grade:literaturereviewFortheTMA2performancemeasure,allstrategiesproducedhigherR2valuesthanthecountmeasures,exceptforthesimplestx:xstrategythatusesrecordedtimestampdatawithoutanyfurtheradjustments.IntermsofR2scores,thebestperformingstrategywas+10ev,whichestimatesthedurationofallactionslongerthan10minutesandlastsessionactionsasanaverageofactionsrecordedforeachstudent.Allstrategiesinthefirstgroup(exceptx:x)andallstrategiesfromthesecondgroupachievedsimilarR2scores,whileinthethirdandfourthgroupswefoundthesamepatternofincreasedR2withtheshorteningofthethresholdvalue.

(2015).Doestime-on-taskmatter?Implicationsforthevalidityoflearninganalyticsfindings.JournalofLearningAnalytics,2(3),81–110.http://dx.doi.org/10.18608/jla.2015.23.6
ISSN1929-7750(online).TheJournalofLearningAnalyticsworksunderaCreativeCommonsLicense,Attribution-NonCommercial-NoDerivs3.0Unported(CCBY-NC-ND3.0) 96
Theresultsoftheregressionanalysis(Table11)indicatethatallmodels,exceptthex:xmodel,wereeithersignificant,ormarginallynon-significant.Still,intermsoftheβcoefficients,therearelargedifferences.Forexample,thecoefficientfortimespentupdatingmessageswassignificantinmostofthemodelsfromthefirstthreegroups,whilenon-significant inthemodels inthefourthgroup.Thecoefficientfortimespentonassignmentsshowedtheexactopposite trend.Finally, thecoefficient for timespentviewingresourceswassignificantonlyintwomodels—includingtheonewiththehighestobtainedR2value,inwhichtheβcoefficientvaluewasthelargest(-0.43).6.2.2 TMA3grade:journalreadingsFortheTMA3performancemeasure,all time-on-taskestimationstrategiesgaveabetterperformancethanthecorrespondingcountmeasures.Thebestperformingstrategywasthex:rmstrategy,whichusesrecordedtimestampdatawithoutanyfurtheradjustment,exceptfortheremovalofthe lastactionofeachsession.Ingeneral,thestrategiesfromthefirstandthirdgroupachievedbetterperformancethanthestrategiesinthesecondandfourthgroup.However,onlythreeregressionmodelsfromthefirstgroupweresignificant(Table11).Inoneofthem(x:l10),noneoftheβcoefficientsweresignificant,whileintheother twomodels (x:ev and x:rm) the coefficients for the time spent updatingmessages and viewingassignmentsweresignificant,withsignificantlyhighervaluesthaninanyothermodel.6.2.3 CourseparticipationgradeFortheParticipationGradeperformancemeasure,allstrategiesinthefirstgroupobtainedR2scoreslowerthanthecountmeasures,whileotherstrategiesobtainedverysimilarR2valuesascountmeasures.ThehighestR2scorewasobtainedforthel10:evstrategy,whichlimitsthedurationofallactionsto10minutes,whilelastsessionactionswereestimatedbasedonotherrecordsofthesameactionforeachstudent.Whileallregressionmodelsachievedsignificance(Table11),therewasalargedifferencebetweentheirR2values,withthedifferenceof0.13betweenthehighestandlowestscoringestimationstrategies.Onlytheregressioncoefficientforthetimespentwritingmessageswassignificantinallconfigurationswithitsvaluerangingfrom0.34to0.48.6.2.4 FinalpercentagegradeForthecoursefinalpercentgrade,mosttime-on-taskestimationstrategieshadscoressimilartothecountmeasures. Only the simplest x:x strategy performed significantly worse, while l10, +30ev, and +10evstrategiesperformedconsiderablybetter than the countmeasures. Similar to theTMA2performancemeasure,thehighestR2scoreswereobtainedwiththe+10evstrategy.ThedetailedregressionresultsshowninTable11indicatethatfourmodelsfromthefirstgroupandonemodelfromthesecondgroupweresignificant,butwithoutsignificantβcoefficients.Ontheotherhand,allmodelsfromthethirdandfourthgroupsweresignificant,andallofthemhadsignificantregressioncoefficientsforthetimespentviewingassignments.Thehighestscoringmodel(+10ev)hadanR2valueof

(2015).Doestime-on-taskmatter?Implicationsforthevalidityoflearninganalyticsfindings.JournalofLearningAnalytics,2(3),81–110.http://dx.doi.org/10.18608/jla.2015.23.6
ISSN1929-7750(online).TheJournalofLearningAnalyticsworksunderaCreativeCommonsLicense,Attribution-NonCommercial-NoDerivs3.0Unported(CCBY-NC-ND3.0) 97
0.28andsignificantregressioncoefficientsforthetimespentviewingresources(0.–43)andassignments(0.34).6.2.5 HigherlevelsofcognitivepresenceWhilethepredictionofthecountofmessageswithhigherlevelsofcognitivepresencebasedontime-on-taskestimateswasbetter inallbuttwoconfigurations, thedifferenceswerenot large.Theregressionmodelsforallconfigurationswerehighlysignificant,andallofthemhadasignificantregressioncoefficientonlyforthetimespentpostingnewmessages(Table11).WiththeR2valueof0.28,thehighestperformingconfigurationwasx:rm—thesameconfigurationthatbestpredictedTMA2grades.7 RESULTS: BLENDED DATASET Similartotheanalysisofafullyonlinedataset,weconductedaseriesofmultiplelinearregressionanalysesbetweenmeasuresofLMSuseandfinalpercentgradeforeachof theninecourses fromtheblendeddataset.Figure2showstheobtainedR2values,whileamoredetailedviewisgiveninTable12.Inallbutonecourse(BIOL1)thebestobtainedR2valueswereachievedbytheuseoftime-on-taskmeasures.Insixcourses,thebestperformingstrategywasfromthefirstgroup(Nooutlierprocessing), intwocourses,from the second group of strategies (Duration limit), and in one instance (BIOL 1) count measuresoutperformedalltime-on-taskestimationstrategies.Regardingtheroleoftime-on-taskestimationstrategiesonthevariationsinR2scores,weobservedmoremodesteffects.WhileintheanalysesperformedontheonlinedatasettheaveragerangeofR2was0.15,intheanalysesperformedontheblendeddataset,weobtainedanaveragerangeof0.05fortheR2values,indicatingthat5%ofthevariabilityintheR2scoreswasaccountedforsolelybyatime-on-taskestimationstrategy.AsshowninFigure2,inthecaseofthecommunication(COMM),computerscience(COMP),andeconomics(ECON)courses,theadoptedtime-on-taskestimationstrategyhadalmostzeroimpactontheobtainedR2 values, and similarly, in the accounting (ACCT) and graphics (GRAP) coursesmost of thestrategieshadverysimilarR2values.Thelargesteffectwasobservedforthetwobiologycoursesandforthemathematics course. Interestingly, in caseof the first biology (BIOL1) and themarketing (MARK)courses, count measures outperformed most time-on-task estimation strategies with only the l:10strategyperformingequallyaswellasthecountmeasures.Thebiggestbenefitfromtheuseoftime-on-taskmeasureswasachievedforthesecondbiology(BIOL2)andthemathematics(MATH)courses.Withthe biology 2 course, the best performing strategies were from the first two groups, while for themathematicscourse,thelasttwogroupsofstrategiesperformedbest.Acloserlookatthedetailsoftheregressionanalysesoftheblendeddataset(Table13)providesmoreinsightintotheobservedvariationsinR2scores.InthecasesoftheACCT,COMM,COMP,ECON,MARK,andMATHcourses,thelargeststandardizedregressioncoefficientswererelatedtotwocountmeasures:thenumberofTurnitinsubmissions(TurnitinSubmissionCountLog)andthenumberofassignmentuploads(AssignmentUploadCount).Thehighpredictivepowerofthetwoabovementionedcountmeasureswere

(2015).Doestime-on-taskmatter?Implicationsforthevalidityoflearninganalyticsfindings.JournalofLearningAnalytics,2(3),81–110.http://dx.doi.org/10.18608/jla.2015.23.6
ISSN1929-7750(online).TheJournalofLearningAnalyticsworksunderaCreativeCommonsLicense,Attribution-NonCommercial-NoDerivs3.0Unported(CCBY-NC-ND3.0) 98
previouslyreportedbyseveralresearchersintheiranalysisofthesamedataset(Cho&Kim,2013;Gašević,Dawson, Rogers,&Gašević, 2015; Trigwell et al., 1999).Given that the used countmeasures did notchangebecauseoftheadoptedtime-on-taskestimationstrategiesandgiventhattheyaccountedformostof thevariability, theeffectwasvery limited.Thus, theuseofcountmeasuresalongside time-on-taskmeasures limited the effect that different estimation strategies couldhaveon the results of the finalregressionanalyses.The variations of individual regression coefficients and their significance across different time-on-taskestimationstrategiesshowsimilarvariationsobservedasintheanalysesperformedonthefullyonlinedataset. In all of the courses, the particular regression coefficients — and more importantly theirsignificance—changedwiththetime-on-taskestimationstrategyused.Whiletheuseofcountmeasureslimitedtheeffectoftheadoptedtime-on-taskestimationstrategyontheoverallpredictivepowerofthemodel,thelatterhadaroleinshapingthesignificancelevelsofdifferentindividualpredictors—includingthecountmeasures.Table12:SummaryofdifferencesinR2scoresbetweendifferenttime-on-taskestimationstrategies
R2
Course Min Max Range Mean SDACCT 0.16 0.2 0.04 0.17 0.01BIOL1 0.12 0.22 0.09 0.17 0.02BIOL2 0.15 0.26 0.11 0.21 0.04COMM 0.58 0.6 0.02 0.59 0COMP 0.53 0.54 0.01 0.54 0ECON 0.38 0.4 0.02 0.39 0GRAP -0.01 0.05 0.06 0.01 0.03MARK 0.34 0.38 0.03 0.36 0.01MATH 0.21 0.26 0.06 0.23 0.02

(2015).Doestime-on-taskmatter?Implicationsforthevalidityoflearninganalyticsfindings.JournalofLearningAnalytics,2(3),81–110.http://dx.doi.org/10.18608/jla.2015.23.6
ISSN1929-7750(online).TheJournalofLearningAnalyticsworksunderaCreativeCommonsLicense,Attribution-NonCommercial-NoDerivs3.0Unported(CCBY-NC-ND3.0) 99
Figure2:VariationinR2scoresacrossdifferenttime-on-taskextractionstrategiesforfinalpercentage
gradeinallnineblendedcourses.

(2015).Doestime-on-taskmatter?Implicationsforthevalidityoflearninganalyticsfindings.JournalofLearningAnalytics,2(3),81–110.http://dx.doi.org/10.18608/jla.2015.23.6
ISSN1929-7750(online).TheJournalofLearningAnalyticsworksunderaCreativeCommonsLicense,Attribution-NonCommercial-NoDerivs3.0Unported(CCBY-NC-ND3.0) 100
Table13:Regressionresultsfordifferenttime-on-taskextractionstrategies.Boldfaceindicatesstatisticalsignificanceatα=.05level,whilegrayshadeindicatesconfigurationwithhighestR2scores
DV IV x:x x:ev x:rm x:l60 x:l30 x:l10 l60 l30 l10 l60:ev l30:ev l10:ev +60ev +30ev +10ev ACCTFinalGrade p-value 0 0 0 0 0 0 0 0 0 0 0 0 0 0 0 adj.R2 0.199 0.158 0.16 0.16 0.16 0.16 0.172 0.17 0.168 0.17 0.17 0.17 0.168 0.163 0.156 βcoefficients Assign.Upl.Count -0.21 -0.21 -0.19 -0.19 -0.19 -0.19 -0.17 -0.16 -0.16 -0.21 -0.21 -0.21 -0.2 -0.21 -0.21 BookPrintCount 0.03 0.03 0.03 0.03 0.03 0.03 0.04 0.04 0.03 0.03 0.03 0.03 0.03 0.03 0.03 CourseViewCount 0.16 0.19 0.17 0.17 0.17 0.17 0.18 0.2 0.2 0.24 0.24 0.24 0.18 0.17 0.18 ForumSearchCount 0.02 0.01 0.01 0.01 0.01 0.01 0.02 0.02 0.02 0 0 0 0.01 0.01 0.02 Turn.Su.CountLog 0.5 0.49 0.47 0.47 0.47 0.47 0.47 0.47 0.47 0.48 0.48 0.48 0.47 0.47 0.48 Assign.ViewTime -0.07 0.05 0 0 0 0 -0.05 -0.06 -0.06 0.05 0.05 0.05 0.01 0.01 -0.01 BookViewTime -0.11 0 -0.08 -0.08 -0.08 -0.08 -0.12 -0.11 -0.1 0.02 0.02 0.02 0.01 0.01 -0.02 ViewDisc.Time 0.03 0.03 -0.01 -0.01 -0.01 -0.01 0.01 0.01 0.01 0.04 0.04 0.04 0.08 0.06 0.03 AddPostTime 0 0 0.02 0.02 0.02 0.02 -0.06 -0.07 -0.07 -0.08 -0.08 -0.08 0.02 0.03 0.02 GalleryViewTime -0.01 0.02 0.02 0.02 0.02 0.02 0.02 0.01 -0.01 0.02 0.02 0.02 0.04 0.03 0.01 Res.ViewTime 0.16 -0.04 0.04 0.04 0.04 0.04 0.11 0.1 0.1 -0.09 -0.09 -0.09 -0.09 -0.08 0 BIOL1FinalGrade p-value 0 0 0 0 0 0 0 0 0 0 0 0 0 0 0 adj.R2 0.154 0.179 0.173 0.174 0.173 0.173 0.165 0.193 0.215 0.144 0.166 0.187 0.14 0.123 0.161 βcoefficients CourseViewCount 0.37 0.18 0.15 0.15 0.15 0.15 0.24 0.23 0.21 0.39 0.39 0.39 0.4 0.38 0.35 ForumSearchCount 0.01 0 0.01 0.01 0.01 0.01 0.03 0.03 0.02 0.03 0.03 0.01 0.03 0.02 0.02 Assign.ViewTime 0 -0.02 0.02 0.02 0.02 0.02 -0.08 -0.08 -0.03 -0.07 -0.04 -0.02 -0.07 -0.06 -0.16 ViewDisc.Time 0.15 0.14 0.16 0.16 0.16 0.16 0.23 0.24 0.26 0.01 0 0.01 -0.06 -0.01 -0.07 AddPostTime 0.03 0.06 0.05 0.05 0.05 0.05 -0.05 -0.07 -0.09 0.02 0 -0.02 0.02 0.05 0.05 QuizViewTime 0 0.03 0.03 0.03 0.03 0.03 -0.17 -0.25 -0.25 -0.2 -0.26 -0.24 -0.14 0.02 -0.1 QuizAttemptTime 0.06 -0.06 -0.04 -0.04 -0.04 -0.04 0.16 0.29 0.35 0.13 0.27 0.34 0.09 -0.01 0.04 QuizReviewTime 0.03 0.09 0.08 0.08 0.08 0.08 0.04 0.05 0.05 0.05 0.04 0.04 0.02 -0.03 -0.02 Res.ViewTime 0.11 0.23 0.21 0.21 0.21 0.21 0.12 0.11 0.07 0.07 0.05 0.02 0.03 0.03 0.08 BIOL2FinalGrade p-value 0 0 0 0 0 0 0 0 0 0 0 0 0 0 0 adj.R2 0.206 0.229 0.26 0.26 0.26 0.26 0.242 0.236 0.236 0.174 0.168 0.163 0.162 0.157 0.154 βcoefficients BookPrintCount -0.01 0 0 0 0 0 -0.01 -0.01 -0.01 0 0 0 0 0 0 CourseViewCount 0.28 0.05 0.02 0.02 0.02 0.02 0.01 0.01 -0.01 0.29 0.31 0.31 0.27 0.28 0.27 FeedbackCount 0.17 0.17 0.17 0.17 0.17 0.17 0.16 0.16 0.16 0.2 0.21 0.21 0.18 0.19 0.18 ForumSearchCount -0.06 -0.06 -0.04 -0.04 -0.04 -0.04 -0.04 -0.04 -0.04 -0.04 -0.05 -0.05 -0.07 -0.07 -0.08 BookViewTime 0.02 0.04 -0.07 -0.07 -0.07 -0.07 -0.04 -0.03 -0.02 0.04 0.04 0.04 0.04 0.04 0.04 ViewDisc.Time -0.08 -0.05 -0.1 -0.1 -0.1 -0.1 -0.07 -0.04 0 0.03 0.03 0.03 0.03 0.03 0.01 AddPostTime 0.04 0.02 0.04 0.04 0.04 0.04 -0.01 -0.03 -0.04 -0.11 -0.11 -0.11 0.01 -0.01 0.02 MapViewTime 0.02 0.04 0.02 0.02 0.02 0.02 -0.04 -0.04 -0.06 0.04 0.04 0.04 0.03 0.03 0.03 QuizViewTime 0.11 0.09 0.07 0.07 0.07 0.07 0.05 0.05 0.12 0.06 0.06 0.05 0.05 0.05 0.06 QuizAttemptTime 0 0.07 0.17 0.17 0.17 0.17 0.13 0.14 0.08 0.02 0.01 0 0.02 0.02 0.02 QuizReviewTime 0.07 0.05 -0.04 -0.04 -0.04 -0.04 X X X 0.13 0.1 0.06 0.1 0.07 0.04 Res.ViewTime 0.19 0.32 0.35 0.35 0.35 0.35 0.35 0.33 0.33 -0.07 -0.08 -0.08 -0.08 -0.08 -0.08 AdobeCo.ViewTime 0.02 0 -0.01 -0.01 -0.01 -0.01 0.03 0.02 0.01 0.02 0.02 0.02 0.02 0.03 0 COMMFinalGrade p-value 0 0 0 0 0 0 0 0 0 0 0 0 0 0 0 adj.R2 0.595 0.59 0.585 0.585 0.585 0.585 0.593 0.592 0.589 0.586 0.586 0.586 0.582 0.583 0.58 βcoefficients Assign.Upl.Count -0.53 -0.58 -0.58 -0.58 -0.58 -0.58 -0.58 -0.58 -0.58 -0.57 -0.57 -0.57 -0.57 -0.56 -0.56 CourseViewCount 0.08 0.05 0.06 0.06 0.06 0.06 0.02 0.03 0.04 0.09 0.09 0.09 0.12 0.12 0.12 ForumSearchCount -0.01 -0.01 -0.02 -0.02 -0.02 -0.02 -0.01 -0.01 -0.01 0 0 0 -0.01 0 -0.01 Turn.Su.CountLog 1.05 1.12 1.12 1.12 1.12 1.12 1.1 1.1 1.1 1.14 1.14 1.14 1.14 1.13 1.11 Assign.ViewTime 0.09 0.1 0.09 0.09 0.09 0.09 0.11 0.11 0.09 0.02 0.02 0.02 0.02 -0.01 0.03 ViewDisc.Time 0.12 0.03 0.03 0.03 0.03 0.03 0.07 0.06 0.05 0.02 0.02 0.02 0.01 0.01 0.02 AddPostTime -0.02 -0.01 -0.01 -0.01 -0.01 -0.01 0.05 0.05 0.05 0.06 0.06 0.06 -0.02 -0.02 -0.01 Res.ViewTime 0.01 0.05 -0.02 -0.02 -0.02 -0.02 -0.04 -0.04 -0.04 0.06 0.06 0.06 0.06 0.06 0.01

(2015).Doestime-on-taskmatter?Implicationsforthevalidityoflearninganalyticsfindings.JournalofLearningAnalytics,2(3),81–110.http://dx.doi.org/10.18608/jla.2015.23.6
ISSN1929-7750(online).TheJournalofLearningAnalyticsworksunderaCreativeCommonsLicense,Attribution-NonCommercial-NoDerivs3.0Unported(CCBY-NC-ND3.0) 101
DV IV x:x x:ev x:rm x:l60 x:l30 x:l10 l60 l30 l10 l60:ev l30:ev l10:ev +60ev +30ev +10ev COMPFinalGrade p-value 0 0 0 0 0 0 0 0 0 0 0 0 0 0 0 adj.R2 0.541 0.536 0.537 0.537 0.537 0.537 0.544 0.544 0.543 0.533 0.533 0.533 0.533 0.533 0.535 βcoefficients Assign.Upl.Count -0.45 -0.47 -0.47 -0.47 -0.47 -0.47 -0.44 -0.43 -0.43 -0.46 -0.46 -0.46 -0.47 -0.46 -0.46 CourseViewCount 0.13 0.12 0.13 0.13 0.13 0.13 0.14 0.14 0.14 0.13 0.13 0.13 0.13 0.13 0.13 Turn.Su.CountLog 1.03 1.04 1.03 1.03 1.03 1.03 1.04 1.04 1.04 1.04 1.04 1.04 1.04 1.03 1.03 Assign.ViewTime -0.03 0.02 0.02 0.02 0.02 0.02 -0.04 -0.04 -0.04 0.02 0.02 0.02 0.03 0 0.01 QuizViewTime -0.1 -0.04 -0.05 -0.05 -0.05 -0.05 -0.17 -0.2 -0.2 -0.03 -0.03 -0.03 -0.03 -0.03 -0.05 QuizAttemptTime 0.01 0.01 -0.02 -0.02 -0.02 -0.02 0.1 0.12 0.1 0.02 0.01 0.02 0.01 0.01 0.02 QuizReviewTime 0.01 -0.05 -0.04 -0.04 -0.04 -0.04 0.04 0.06 0.07 -0.01 0 0 -0.01 -0.02 -0.04 Res.ViewTime 0.04 0 0.02 0.02 0.02 0.02 0.02 0.02 0.02 0 0 0 0.01 0.01 0 ECONFinalGrade p-value 0 0 0 0 0 0 0 0 0 0 0 0 0 0 0 adj.R2 0.396 0.386 0.386 0.386 0.386 0.386 0.384 0.385 0.386 0.38 0.38 0.381 0.388 0.385 0.388 βcoefficients Assign.Upl.Count -0.43 -0.45 -0.45 -0.45 -0.45 -0.45 -0.44 -0.43 -0.42 -0.45 -0.45 -0.45 -0.44 -0.44 -0.45 BookPrintCount 0 0 0 0 0 0 0 0 0 0 0 0 0 0 0 CourseViewCount 0.14 0.08 0.05 0.05 0.05 0.05 0.08 0.1 0.11 0.13 0.13 0.12 0.17 0.17 0.16 ForumSearchCount 0.03 0.02 0.02 0.02 0.02 0.02 0.02 0.02 0.02 0.02 0.02 0.02 0.02 0.02 0.02 Turn.Su.CountLog 0.86 0.87 0.88 0.88 0.88 0.88 0.88 0.89 0.88 0.87 0.87 0.87 0.84 0.85 0.86 Assign.ViewTime 0.01 0 -0.01 -0.01 -0.01 -0.01 -0.07 -0.09 -0.11 -0.01 -0.01 -0.01 -0.06 -0.06 -0.05 BookViewTime 0 -0.01 -0.02 -0.02 -0.02 -0.02 0.03 0.03 0.02 -0.01 -0.01 -0.01 -0.02 -0.01 0.03 ViewDisc.Time 0.06 0.02 0.04 0.04 0.04 0.04 0.02 0.01 0 0 0 0 0 0.01 0.02 AddPostTime 0.03 0.03 0.03 0.03 0.03 0.03 0.03 0.04 0.04 0.04 0.04 0.04 0.03 0.02 0.05 QuizViewTime -0.02 0 0.05 0.05 0.05 0.05 0 -0.01 0.01 -0.03 -0.03 -0.03 -0.04 -0.04 -0.07 QuizAttemptTime -0.01 -0.01 0.05 0.05 0.05 0.05 0.13 0.14 0.13 -0.02 -0.02 -0.02 -0.02 -0.02 -0.01 QuizReviewTime 0.04 0.05 -0.01 -0.01 -0.01 -0.01 -0.1 -0.1 -0.11 0.04 0.04 0.04 0.05 0.06 0.06 Res.ViewTime 0.12 0.12 0.09 0.09 0.09 0.09 0.08 0.07 0.09 0.04 0.04 0.06 -0.06 -0.01 -0.02 GRAPFinalGrade p-value 0.56 0.64 0 0 0 0 0.62 0.64 0.61 0.64 0.64 0.64 0.42 0.35 0.32 adj.R2-0.005 -0.006 0.054 0.054 0.054 0.054 -0.006 -0.006 -0.006 -0.006 -0.006 -0.006 -0.002 0.001 0.002 βcoefficients CourseViewCount 0.07 0.07 0.18 0.18 0.18 0.18 0.09 0.07 0.05 0.07 0.07 0.07 0.08 0.08 0.09 Res.ViewTime 0.04 -0.01 -0.27 -0.27 -0.27 -0.27 -0.03 0.01 0.03 0 0 0 0.07 0.08 0.09 MARKFinalGrade p-value 0 0 0 0 0 0 0 0 0 0 0 0 0 0 0 adj.R2 0.366 0.349 0.361 0.361 0.361 0.361 0.376 0.376 0.378 0.347 0.347 0.347 0.353 0.35 0.345 βcoefficients Assign.Upl.Count -0.45 -0.48 -0.46 -0.46 -0.46 -0.46 -0.45 -0.44 -0.44 -0.47 -0.47 -0.47 -0.46 -0.46 -0.47 CourseViewCount 0.14 0.15 0.15 0.14 0.15 0.15 0.2 0.23 0.26 0.18 0.18 0.18 0.16 0.16 0.16 ForumSearchCount 0.04 0.04 0.04 0.04 0.04 0.04 0.04 0.04 0.04 0.04 0.04 0.04 0.04 0.04 0.04 Turn.Su.CountLog 0.88 0.89 0.88 0.88 0.88 0.88 0.87 0.88 0.88 0.87 0.87 0.87 0.87 0.87 0.88 Assign.ViewTime -0.08 0.02 -0.01 0 -0.01 -0.01 -0.04 -0.06 -0.08 0.01 0.01 0.01 0.06 0.01 -0.01 ChatViewTime 0 0 0 0 0 0 -0.03 -0.02 -0.01 0 0 0 0 0 0 ChatTalkTime -0.04 -0.03 -0.02 -0.02 -0.02 -0.02 0.01 0.01 0.01 -0.02 -0.02 -0.02 -0.07 -0.07 -0.03 ViewDisc.Time 0.03 -0.04 -0.08 -0.08 -0.08 -0.08 -0.18 -0.19 -0.21 -0.02 -0.02 -0.02 -0.03 -0.03 0.01 AddPostTime -0.05 -0.04 -0.03 -0.03 -0.03 -0.03 0.01 0 0 -0.06 -0.07 -0.07 -0.03 -0.04 -0.04 Res.ViewTime 0.11 0.06 0.13 0.13 0.13 0.13 0.17 0.15 0.14 -0.03 -0.03 -0.03 -0.02 -0.03 -0.01 MATHFinalGrade p-value 0 0 0 0 0 0 0 0 0 0 0 0 0 0 0 adj.R2 0.206 0.262 0.21 0.211 0.211 0.21 0.231 0.226 0.221 0.257 0.257 0.256 0.24 0.252 0.243 βcoefficients Assign.Upl.Count -0.46 -0.45 -0.45 -0.45 -0.45 -0.45 -0.45 -0.45 -0.46 -0.49 -0.48 -0.49 -0.45 -0.42 -0.41 CourseViewCount 0.33 0.2 0.22 0.22 0.22 0.22 0.06 0.1 0.14 0.25 0.26 0.27 0.36 0.34 0.32 ForumSearchCount 0.01 0.01 0.01 0.01 0.01 0.01 0 0 -0.01 -0.02 -0.02 -0.02 0 0.01 0.01 Turn.Su.CountLog 0.64 0.65 0.63 0.63 0.63 0.63 0.58 0.59 0.6 0.66 0.66 0.66 0.65 0.61 0.6 Assign.ViewTime -0.05 -0.11 -0.01 -0.01 -0.01 -0.01 0.1 0.09 0.06 -0.11 -0.11 -0.11 X -0.02 -0.03 ViewDisc.Time 0.08 0.19 0.08 0.09 0.09 0.08 0.1 0.1 0.1 0.17 0.17 0.17 0.14 0.14 0.04 AddPostTime -0.06 -0.05 -0.05 -0.05 -0.05 -0.05 0.09 0.1 0.1 0.12 0.12 0.12 -0.06 -0.06 -0.06 Res.ViewTime 0.02 0.18 0.13 0.13 0.13 0.13 0.16 0.13 0.1 0.08 0.08 0.06 -0.11 -0.18 -0.19
Table13(continued):Regressionresultsfordifferenttime-on-taskextractionstrategies.Boldfaceindicatesstatisticalsignificanceatα=.05level,whilegrayshadeindicatesconfigurationwithhighestR2scores

(2015).Doestime-on-taskmatter?Implicationsforthevalidityoflearninganalyticsfindings.JournalofLearningAnalytics,2(3),81–110.http://dx.doi.org/10.18608/jla.2015.23.6
ISSN1929-7750(online).TheJournalofLearningAnalyticsworksunderaCreativeCommonsLicense,Attribution-NonCommercial-NoDerivs3.0Unported(CCBY-NC-ND3.0) 102
8 DISCUSSION 8.1 Discussion of the Results with the Online Course Dataset From the results of multiple regression models, investigating the effect of different time-on-taskestimation strategies on five different performance measures, we can confirm that the choice of aparticulartime-on-taskestimationstrategyplaysanimportantroleintheoverallmodelfitandsubsequentmodel interpretation.TheaverageR2rangeof0.15impliesthatalargeproportionofvariabilitycanbeexplainedsolelybytheadoptedestimationstrategy.Evenmoreimportantly,thesignificanceoftheoverallmodel,itsβcoefficients,andtheirstatisticalsignificancewerenotconsistentforthreeofthefivemodels(i.e.,TMA2grade,TMA3grade,andfinalgrade)indicatingtheimportantroleoftheadoptedtime-on-taskestimation strategy on the analysis results and conclusions that can be drawn from these results.However,wecannotsaywhetherthehigherscoringmodelsareoverfittingthedata(i.e.,typeIerror),orthatthelowerscoringmodelsdonotproperlyfitthedata(i.e.,typeIIerror).Theanswertothisquestiondependsontheavailabilityoffieldobservationaldataandthisisasuggesteddirectionforfuturework.Thecomparisonof thedifferentestimationstrategiesacrossthefiveperformancemeasures indicatedthatnota singlemeasurewasaclear“winner.”Simplyput, the resultsdidnot revealameasure thatoutperformedallotherstrategiesforalldependentvariables.Differentstrategiesprovidedthebestfitforthefiveselectedperformancemeasures.Interestingly,thefirstgroupofstrategies,whichgenerallyallowsforamuch longerdurationofactionthanotherstrategies,performedworsethancountmeasuresforpredictingcourseparticipationgrade,andbetterforpredictingtheTMA2grade,TMA3grade,andthenumberofmessageswithhigherlevelsofcognitivepresence(CoIHigh).Astheparticipationgradewasnot given based on the total time spent on discussions, but rather based on students’ observablebehaviour(i.e.,activeengagementviamessageposting),thecountmeasuresprovidedabetterfittothedata,especiallywhencomparedtothefirstgroupofstrategiesthatignoredtheissuesofstudentoff-taskbehaviour.Formeasuresmorerelatedtothequalityofstudentoutput—suchastheTMA2grade,theTMA3grade, and thenumberofmessageswithhigher levels of cognitivepresence— theestimationstrategiesinthefirstgroupprovidedabetterfitforthedata,astheyinherentlybettercapturedthetotalamountofeffortthatstudentsinvested.Ifwemovethediscussionfromindividualstrategiestogroupsofstrategies,wecanseethattheonlygroupthatconsistentlyoutperformedthecountmeasureswasthethirdgroupofstrategies.Thethirdgroupputaparticularupperlimitonthedurationofallactionsandestimatedthedurationsoflastsessionactionsbased on other recordings of the action in question for each student.However,more research usingobservationaldataisrequiredtoanswerconclusivelywhetherthoseestimationstrategiesareindeedthemostaccurateones.

(2015).Doestime-on-taskmatter?Implicationsforthevalidityoflearninganalyticsfindings.JournalofLearningAnalytics,2(3),81–110.http://dx.doi.org/10.18608/jla.2015.23.6
ISSN1929-7750(online).TheJournalofLearningAnalyticsworksunderaCreativeCommonsLicense,Attribution-NonCommercial-NoDerivs3.0Unported(CCBY-NC-ND3.0) 103
8.2 Discussion of the Results with the Blended Courses Dataset Oneofthegoalsoftheanalysesperformedwiththeblendeddatasetwastoexaminefurtheronalargerdatasettheobservedeffectofdifferenttime-on-taskestimationstrategies.Theresultsofthesecondsetofthemultipleregressionanalysesprovidedafurtherconfirmationthattime-on-taskestimationstrategyplaysanimportantroleinshapingthefinalresultsofstatisticalanalyses.TheoverallR2values,alongsideindividual regression coefficients and their statistical significance, were varied considerably acrossdifferent time-on-task estimation strategies. However, in contrast to the first experiment where theaveragevariationinR2was0.15,theaveragevariationofR2valuesintherangeof0.05fortheblendeddataset implies that inclusion of count measures can lower the effect of the adopted time-on-taskestimation strategy on the overall predictive power of the statistical model. These results were notcompletelyunexpected,asinclusionofcountoranyothermeasureslowerstherelativecontributionoftime-on-taskmeasurestotheoverallmodelfit,whichinturnproduceslessvariationacrossdifferenttime-on-taskestimationstrategies.Thisisparticularlyevidentinmodelswherecertaincountmeasures—suchasthenumberofturnitinsubmissions—haveastrongpredictivepowerthemselvesandthusremovetheoverallsignificanceofextractedtime-on-taskmeasures.Thecomparisonofdifferenttime-on-taskestimationstrategiesacrossdifferentcourses intheblendeddataset — similarly to the results from the online dataset — reveals that not a single time-on-taskestimationstrategywastheclearwinner.Inmanycourses(i.e.,ACCT,BIOL2,COMM,ECON,GRAPH,andMATH),thefirstgroupofstrategiesthatenabledlongeractiondurationsprovidedabetterfitthanthoseoftime-on-taskestimation.Whileinothercourses(i.e.,COMPandMARK),thesecondgroupofstrategiesprovidedbetterresults.Interestingly,thelasttwogroupsofestimationstrategies—thosethatprovidedthe best fit in three out of the five cases in the analyses of the online dataset—were not the bestperforming in any course.Only in the caseof themathematics course, the third and fourth groupofstrategies provided similar results as the best performing x:rm strategy from the first group. Theinvestigation about the underlying reasons for the observed differences between the findings of theanalysesofbothdatasetsprovideanimportantdirectionforfurtherresearch.8.3 General Discussion Comparingtheresultsoftheanalysesofthetwodatasets(Figure1andFigure2)indicatesthatonlycountmeasuresprovidedareasonablygoodfitfortheblendeddataset.Fortheonlinedataset,theestimationofalltheperformancemeasures—exceptparticipationgrade—benefitedsubstantiallyfromusingtime-on-taskmeasures,almostregardlessoftheadoptedestimationstrategy.Intheanalysesoftheblendeddataset, however, the countmeasuresprovidedabetter fit thanmostof the time-on-taskmeasures.Giventhatthecourseintheonlinedatasetwasafullyonlinedistanceeducationcourseandthatallninecoursesintheblendeddatasetwereblendedcourses,therelativeamountofactivityperstudentismuchhigherinthefullyonlinecourse.Thefullyonlinecoursehadamuchhighervolumeofstudentactivitythantheblendedcourses,asseeninthecomparisonofthevaluesshowninTable1andTable4.Onaverage,

(2015).Doestime-on-taskmatter?Implicationsforthevalidityoflearninganalyticsfindings.JournalofLearningAnalytics,2(3),81–110.http://dx.doi.org/10.18608/jla.2015.23.6
ISSN1929-7750(online).TheJournalofLearningAnalyticsworksunderaCreativeCommonsLicense,Attribution-NonCommercial-NoDerivs3.0Unported(CCBY-NC-ND3.0) 104
each session of the fully online course had about four times more actions and over 20 times moremessagesthaneachoftheblendedcoursesintheseconddataset.Giventhiscleardifferenceinthetwodatasets, it isverylikelythattheimportanceoftime-on-taskestimationismorecriticalforfullyonlinecourses that depend almost entirely on online learning systems for any form of interaction betweenstudents,instructors,andcontent.Althoughthisseemslikely,itwarrantsfurtherinvestigationandwouldbeoneofthedirectionsforfurtherresearch.8.4 Implications for the Learning Analytics Community Severalpracticalimplicationsarisefromtheresultsofthepresentstudy.Aboveallistheneedformorecautionwhenusingtime-on-taskmeasuresforbuildinglearninganalyticsmodels.Giventhatdetailsoftime-on-taskestimationcanpotentiallyimpactreportedresearchfindings,appropriatelyaddressingtime-on-task estimation becomes a critical part of standard research practice in the learning analyticscommunity. This is particularly true in cases where time-on-task measures are not accompanied byadditionalmeasuressuchascountsofrelevantactivities.Anotherimportantimplicationofthispaperisthatperhapstheroleoftime-on-taskinlearninganalyticsresearchshouldbereconsidered.Withallthechallengesinaccurateestimationoftime-on-task,giventheoff-taskbehaviours,andwithoutamethodologicallyclearestimationstrategy,perhapsusingtime-on-taskmeasuresshouldbereconsideredandcountsmeasuresbemorepromoted.Thisisparticularlytruegiventheneedformorereplicationstudiesinthelearninganalyticsfieldandforclear,sound,easilyreported,replicabledata-analysisstrategies.Evidenceofthebenefitsoftime-on-taskmeasuresonthefinalmodelperformanceexists,butthequestioniswhetherthosebenefitsoutweighthemethodologicalandpracticaldisadvantagesassociatedwiththeiruse.AsKarweit(1984)urgededucationalresearchersofthe1980stopayattentiontothechallengesoftime-on-taskestimationintraditionalclassrooms,sotoodowewanttodrawtheattentionofthepresentdayglobal learninganalytics community to the same issue.Given thatmodern technologyprovidesmanyopportunitiesformulti-taskinganddistractions(e.g.,Calderwoodetal.,2014;Judd,2014;Rosenetal.,2013),westronglyarguethattime-on-taskestimation,itsissues,limits,andreliabilitychallengeswarrantfurtherconsideration.8.5 Limitations Theprimarylimitationofthisstudyisrelatedtoourinabilitytogeneralizefromthepresentedresultsanddecisivelypointtotheoverall“best”methodfortime-on-taskestimation.Theperformanceofdifferentestimationstrategiesdependsontheparticularcharacteristicsofthetargetcourse.Giventhatwedonothaveobservationalfielddatathatwouldprovideaccuratemeasuresforstudents’actualtime-on-task,itis currently not possible to give conclusive recommendations for selectionof time-on-task estimationstrategies. Furthermore, the present study examined only the effects of time-on-task measuring

(2015).Doestime-on-taskmatter?Implicationsforthevalidityoflearninganalyticsfindings.JournalofLearningAnalytics,2(3),81–110.http://dx.doi.org/10.18608/jla.2015.23.6
ISSN1929-7750(online).TheJournalofLearningAnalyticsworksunderaCreativeCommonsLicense,Attribution-NonCommercial-NoDerivs3.0Unported(CCBY-NC-ND3.0) 105
proceduresononeparticularstatisticalmodel(i.e.,multiplelinearregression),anditislikelythatthisalsoplaysaroleinshapingtheresultsofthepresentstudy.8.6 Future Work Whilethisstudyprovidesinsightsintotheeffectsofdifferenttime-on-taskestimationmethodsontheresultsofseveralanalyticalmodels,therearesomepotentialareasfor improvementandfuturework.First,similartotheworkdonebyBaker(2007),Cetintasetal.(2009),Cetintasetal.(2010),Roberge,Rojas,andBaker(2012),andJudd(2014),itwouldbeveryhelpfultogather“goldstandard”data—accurateempiricaldataaboutstudenttime-on-task—thatcouldbeusedto1)definebestpracticesintime-on-taskestimation,and2)developautomated tools for time-on-taskextractionanddetectionofoff-taskbehaviour.Second,thecurrentstudyonly investigatedtheeffectsofdifferenttime-on-taskestimationstrategiesontheresultsofmultipleregressionmodels.Itwouldbeinterestingtoseetheeffectsonothertypesofmodels;forexample,classificationsystemsforautomatedstudentgrading.Third,theanalysisoftheobserveddifferencesbetweenonlineandblendedcoursesisimportanttoexaminetowhatextenttheparticularformofdeliverymoderatestheeffectsoftime-on-taskestimation.Finally,itthespiritofopenand reproducible research, it would be very useful — from a practical perspective — to develop astandardizedplugin for theextractionof tracedata frompopular LMSsystems (e.g.,Moodle,WebCT,Sakai,Canvas)thatcouldprovidefastandeasy-to-useaccesstotime-on-taskandcountmeasures.9 CONCLUSIONS Inthispaper,wepresentedastudythatlookedatthedifferentapproachesforestimatingstudents’time-on-taskbehaviourbasedonLMStracedata.Weexamined15differenttime-on-taskestimationstrategiesand investigated the consequences of adopting various estimation approaches on the results of fivelearninganalyticsmodelsofstudentperformance.Wealsocomparedtime-on-taskandcountmeasuresintermsofhowwelltheyexplainthestudentdifferencesinthefiveperformancemeasures.Ourresultsindicatethat,forthemostpart,time-on-taskestimatesoutperformcountdata.However,theadoptionofaparticulartime-on-taskestimationstrategycanhaveasignificanteffectontheoverallfitofthemodel,its significance, and eventually on the interpretation of research findings.With the rising amount ofstudentdistractionbydigitaltechnology,researchersshouldbeawareoftherolethatnoiseintheLMStracedatacanplayondevelopedanalytics.Thereareseveralimportantconsequencesofthepresentedstudy.First,thelearninganalyticscommunityshouldrecognizetheimportanceoftime-on-taskestimationandtheroleitplaysinthequalityofanalyticalmodels and their interpretation. Second, with the goal of providing better groundwork for open,replicable,andreproducible research,published literatureshouldaddress the time-on-taskestimationprocessinsufficientdetail.Finally,withthegoalofprovidingasetofstandardsandcommonpracticesforconductinglearninganalyticsresearch,thispapercallsforfurtherinvestigationoftheissuesrelatedtostudenttime-on-taskestimation.

(2015).Doestime-on-taskmatter?Implicationsforthevalidityoflearninganalyticsfindings.JournalofLearningAnalytics,2(3),81–110.http://dx.doi.org/10.18608/jla.2015.23.6
ISSN1929-7750(online).TheJournalofLearningAnalyticsworksunderaCreativeCommonsLicense,Attribution-NonCommercial-NoDerivs3.0Unported(CCBY-NC-ND3.0) 106
REFERENCES Admiraal,W.,Wubbels, T., & Pilot, A. (1999). College teaching in legal education: Teachingmethod,
students’time-on-task,andachievement.ResearchinHigherEducation,40(6),687–704.http://dx.doi.org/10.1023/A:1018712914619
Baker,R.S.,Corbett,A.T.,Koedinger,K.R.,&Wagner,A.Z.(2004).Off-taskbehaviorinthecognitivetutorclassroom:Whenstudents“gamethesystem.”ProceedingsoftheSIGCHIConferenceonHumanFactorsinComputingSystems(CHI’04),383–390.http://dx.doi.org/10.1145/985692.985741
Baker,R.S.J.d. (2007).Modelingandunderstandingstudents’off-taskbehavior in intelligenttutoringsystems.ProceedingsoftheSIGCHIConferenceonHumanFactorsinComputingSystems(CHI’07),1059–1068.http://dx.doi.org/10.1145/1240624.1240785
Ba-Omar,H.,Petrounias,I.,&Anwar,F.(2007).Aframeworkforusingwebusageminingtopersonalisee-learning.Proceedingsofthe7thIEEEInternationalConferenceonAdvancedLearningTechnologies(ICALT’07),937–938.http://dx.doi.org/10.1109/ICALT.2007.13
Bloom,B.S.(1974).Timeandlearning.AmericanPsychologist,29(9),682–688.http://dx.doi.org/10.1037/h0037632
Bowman,L.L.,Waite,B.M.,&Levine,L.E.(2015).Multitaskingandattention.InL.D.Rosen,N.A.Cheever,&L.M.Carrier(Eds.),TheWileyHandbookofPsychology,Technology,andSociety(pp.388–403).JohnWiley&Sons,Ltd.http://dx.doi.org/10.1002/9781118771952.ch22
Brown,A.H.,&Green,T.(2009).Timestudentsspendreadingthreadeddiscussionsinonlinegraduatecoursesrequiringasynchronousparticipation.TheInternationalReviewofResearchinOpenandDistanceLearning,10(6),51–64.Retrievedfromhttp://www.irrodl.org/index.php/irrodl/article/view/760/1432
Calderwood, C., Ackerman, P. L., & Conklin, E. M. (2014).What else do college students “do” whilestudying?Aninvestigationofmultitasking.Computers&Education,75,19–29.http://dx.doi.org/10.1016/j.compedu.2014.02.004
Carroll,J.(1963).Amodelofschoollearning.TeachersCollegeRecord,64(8),723–733.Catledge, L. D., & Pitkow, J. E. (1995). Characterizing browsing strategies in the world-wide web.
Proceedings of the 3rd International World-Wide Web Conference: Technology, Tools andApplications(WWW3),1065–1073.http://dx.doi.org/10.1016/0169-7552(95)00043-7
Cetintas,S.,Si,L.,Xin,Y.P.,&Hord,C. (2010).Automaticdetectionofoff-taskbehaviors in intelligenttutoringsystemswithmachinelearningtechniques.IEEETransactionsonLearningTechnologies,3(3),228–236.http://dx.doi.org/10.1109/TLT.2009.44
Cetintas,S.,Si,L.,Xin,Y.P.,Hord,C.,&Zhang,D.(2009).Learningtoidentifystudents’off-taskbehaviorin intelligent tutoring systems. InV.Dimitrova,R.Mizoguchi,B.duBoulay,A.Graesser (Eds.),Buildinglearningsystemsthatcare:Proceedingsofthe14thInternationalConferenceonArtificialIntelligenceinEducation(AIED’09),(pp.701–703).Amsterdam,theNetherlands:IOSPress.
Chickering,A.W.,&Gamson,Z.F.(1989).Sevenprinciplesforgoodpracticeinundergraduateeducation.BiochemicalEducation,17(3),140–141.http://dx.doi.org/10.1016/0307-4412(89)90094-0

(2015).Doestime-on-taskmatter?Implicationsforthevalidityoflearninganalyticsfindings.JournalofLearningAnalytics,2(3),81–110.http://dx.doi.org/10.18608/jla.2015.23.6
ISSN1929-7750(online).TheJournalofLearningAnalyticsworksunderaCreativeCommonsLicense,Attribution-NonCommercial-NoDerivs3.0Unported(CCBY-NC-ND3.0) 107
Chitraa, V., & Davamani, A. S. (2010). A survey on preprocessing methods for web usage data.InternationalJournalofComputerScienceandInformationSecurity,7(3),78–83.
Cho,M.H.,&Kim,B. J. (2013). Students’ self-regulation for interactionwithothers inonline learningenvironments.TheInternetandHigherEducation,17,69–75.http://dx.doi.org/10.1016/j.iheduc.2012.11.001
Cohen,L.,Manion,L.,&Morrison,K.(2007).Researchmethodsineducation(6thedition).London/NewYork:Routledge.
Cooley,R.,Mobasher,B.,&Srivastava,J.(1997).Webmining:Informationandpatterndiscoveryontheworld wide web. Proceedings of the 9th IEEE International Conference on Tools with ArtificialIntelligence(ICTAI’97),558–567.http://dx.doi.org/10.1109/TAI.1997.632303
Cooley,R.,Mobasher,B.,&Srivastava,J.(1999).Datapreparationforminingworldwidewebbrowsingpatterns.KnowledgeandInformationSystems,1(1),5–32.http://dx.doi.org/10.1007/BF03325089
del Valle, R., & Duffy, T. M. (2009). Online learning: Learner characteristics and their approaches tomanaginglearning.InstructionalScience,37(2),129–149.http://dx.doi.org/10.1007/s11251-007-9039-0
García-Martín, J., &García-Sánchez, J.-N. (2013). Patterns ofWeb 2.0 tool use among young Spanishpeople.Computers&Education,67,105–120.http://dx.doi.org/10.1016/j.compedu.2013.03.003
Garrison,D.R.,Anderson,T.,&Archer,W.(1999).Criticalinquiryinatext-basedenvironment:Computerconferencinginhighereducation.TheInternetandHigherEducation,2(2–3),87–105.http://dx.doi.org/10.1016/S1096-7516(00)00016-6
Garrison,D.R.,Anderson,T.,&Archer,W. (2001).Critical thinking,cognitivepresence,andcomputerconferencing in distance education. American Journal of Distance Education, 15(1), 7–23.http://dx.doi.org/10.1080/08923640109527071
Gašević, D., Adesope, O., Joksimović, S., & Kovanović, V. (2015). Externally-facilitated regulationscaffolding and role assignment to develop cognitive presence in asynchronous onlinediscussions.TheInternetandHigherEducation,24,53–65.http://dx.doi.org/10.1016/j.iheduc.2014.09.006
Gašević,D.,Dawson,S.,Rogers,T.,&Gasevic,D.(2016).Learninganalyticsshouldnotpromoteonesizefitsall:Theeffectsof instructionalconditions inpredictingacademicsuccess.The InternetandHigherEducation,28,68–84.http://dx.doi.org/10.1016/j.iheduc.2015.10.002
Grabe,M.,&Sigler,E.(2002).Studyingonline:Evaluationofanonlinestudyenvironment.Computers&Education,38(4),375–383.http://dx.doi.org/10.1016/S0360-1315(02)00020-9
Guo, Y., Wang, J., Moore, J., Liu, M., & Chen, H.-L. (2009). A case study of usability testing on anasynchronous e-learning platform. Proceedings of the 2009 Joint Conferences on PervasiveComputing(JCPC),693–698.http://dx.doi.org/10.1109/JCPC.2009.5420093
Hastie,T.J.,Tibshirani,R.J.,&Friedman,J.H.(2013).Theelementsofstatisticallearning:Datamining,inference,andprediction.NewYork:Springer.

(2015).Doestime-on-taskmatter?Implicationsforthevalidityoflearninganalyticsfindings.JournalofLearningAnalytics,2(3),81–110.http://dx.doi.org/10.18608/jla.2015.23.6
ISSN1929-7750(online).TheJournalofLearningAnalyticsworksunderaCreativeCommonsLicense,Attribution-NonCommercial-NoDerivs3.0Unported(CCBY-NC-ND3.0) 108
Helmke, A., Schneider, W., & Weinert, F. E. (1986). Quality of instruction and classroom learningoutcomes: The German contribution to the IEA classroom environment study. Teaching andTeacherEducation,2(1),1–18.http://dx.doi.org/10.1016/0742-051X(86)90002-8
Hewitt,J.,Brett,C.,&Peters,V.(2007).Scanrate:Anewmetricfortheanalysisofreadingbehaviorsinasynchronous computer conferencing environments.American Journal of Distance Education,21(4),215–231.http://dx.doi.org/10.1080/08923640701595373
Hsu,Y.-C.,&Ching,Y.-H.(2013).Mobileappdesignforteachingandlearning:Educators’experiencesinanonlinegraduatecourse.TheInternationalReviewofResearchinOpenandDistanceLearning,14(4).Retrievedfromhttp://www.irrodl.org/index.php/irrodl/article/view/1542
Hussain,T.,Asghar,S.,&Masood,N.(2010).Webusagemining:Asurveyonpreprocessingofweblogfile.Proceedings of the 2010 International Conference on Information and Emerging Technologies(ICIET2010),1–6.http://dx.doi.org/10.1109/ICIET.2010.5625730
Judd,T.(2014).Makingsenseofmultitasking:TheroleofFacebook.Computers&Education,70,194–202.http://dx.doi.org/10.1016/j.compedu.2013.08.013
Karweit,N.(1984).Time-on-taskreconsidered:Synthesisofresearchontimeandlearning.EducationalLeadership,41(8),32–35.
Karweit,N.,& Slavin, R. E. (1982). Time-on-task: Issuesof timing, sampling, anddefinition. Journal ofEducationalPsychology,74(6),844–851.http://dx.doi.org/10.1037/0022-0663.74.6.844
Kolloffel, B., Eysink, T. H. S., & de Jong, T. (2011). Comparing the effects of representational tools incollaborative and individual inquiry learning. International Journal of Computer-SupportedCollaborativeLearning,6(2),223–251.http://dx.doi.org/10.1007/s11412-011-9110-3
Kraus,L.A.,Reed,W.M.,&Fitzgerald,G.E.(2001).Theeffectsoflearningstyleandhypermediapriorexperience on behavioral disorders knowledge and time on task: A case-based hypermediaenvironment.ComputersinHumanBehavior,17(1),125–140.http://dx.doi.org/10.1016/S0747-5632(00)00030-3
Lust, G., Elen, J., & Clarebout, G. (2013a). Regulation of tool-use within a blended course: Studentdifferencesandperformanceeffects.Computers&Education,60(1),385–395.http://dx.doi.org/10.1016/j.compedu.2012.09.001
Lust,G.,Elen,J.,&Clarebout,G.(2013b).Students’tool-usewithinawebenhancedcourse:Explanatorymechanisms of students’ tool-use pattern. Computers in Human Behavior, 29(5), 2013–2021.http://dx.doi.org/10.1016/j.chb.2013.03.014
Lust, G., Vandewaetere, M., Ceulemans, E., Elen, J., & Clarebout, G. (2011). Tool-use in a blendedundergraduate course: In search of user profiles. Computers & Education, 57(3), 2135–2144.http://dx.doi.org/10.1016/j.compedu.2011.05.010
Macfadyen, L. P., & Dawson, S. (2010). Mining LMS data to develop an “early warning system” foreducators:Aproofofconcept.Computers&Education,54(2),588–599.http://dx.doi.org/10.1016/j.compedu.2009.09.008
Marquardt, C.G., Becker, K.,&Ruiz,D.D. (2004). A pre-processing tool forwebusagemining in thedistance education domain. Proceedings of the International Database Engineering andApplicationsSymposium(IDEAS’04),78–87.http://dx.doi.org/10.1109/IDEAS.2004.2

(2015).Doestime-on-taskmatter?Implicationsforthevalidityoflearninganalyticsfindings.JournalofLearningAnalytics,2(3),81–110.http://dx.doi.org/10.18608/jla.2015.23.6
ISSN1929-7750(online).TheJournalofLearningAnalyticsworksunderaCreativeCommonsLicense,Attribution-NonCommercial-NoDerivs3.0Unported(CCBY-NC-ND3.0) 109
Mobasher, B., Cooley, R., & Srivastava, J. (1999). Creating adaptive web sites through usage-basedclusteringofURLs.InP.Scheuermann(Ed.),Proceedingsofthe1999WorkshoponKnowledgeandDataEngineeringExchange(KDEX’99),(pp.19–25).LosAlamitos:IEEEComputerSociety.
MoodleHQ.(2014).[ComputerSoftware].Retrievedfromhttps://moodle.org/Munk,M.,&Drlík,M.(2011).Impactofdifferentpre-processingtasksoneffectiveidentificationofusers’
behavioralpatternsinweb-basededucationalsystem.ProcediaComputerScience,4,1640–1649.http://dx.doi.org/10.1016/j.procs.2011.04.177
Munk,M.,Kapusta,J.,&Švec,P.(2010).Datapreprocessingevaluationforweblogmining:Reconstructionofactivitiesofawebvisitor.ProcediaComputerScience,1(1),2273–2280.http://dx.doi.org/10.1016/j.procs.2010.04.255
Oztok,M.,Zingaro,D.,Brett,C.,&Hewitt,J.(2013).Exploringasynchronousandsynchronoustooluseinonlinecourses.Computers&Education,60(1),87–94.http://dx.doi.org/10.1016/j.compedu.2012.08.007
Pardos,Z.A.,Baker,R.S.J.D.,SanPedro,M.O.C.Z.,Gowda,S.M.,&Gowda,S.M.(2013).Affectivestatesandstatetests:Investigatinghowaffectthroughouttheschoolyearpredictsendofyearlearning outcomes.Proceedings of the 3rd International Conference on Learning Analytics andKnowledge(LAK’13),117–124.http://dx.doi.org/10.1145/2460296.2460320
Perera,D.,Kay,J.,Koprinska,I.,Yacef,K.,&Zaiane,O.R.(2009).Clusteringandsequentialpatternminingforonlinecollaborative learning. IEEETransactionsonKnowledgeandDataEngineering,21(6),759–772.http://dx.doi.org/10.1109/TKDE.2008.138
Raju, G. T., & Satyanarayana, P. S. (2008). Knowledge discovery from web usage data: Completepreprocessingmethodology. International Journal of Computer Science and Network Security,8(1),179–186.
Roberge,D.,Rojas,A.,&Baker,R.(2012).Doesthelengthoftimeoff-taskmatter?Proceedingsofthe2ndInternationalConferenceonLearningAnalyticsandKnowledge(LAK’12),234–237.http://dx.doi.org/10.1145/2330601.2330657
Romero,C.,Espejo,P.G.,Zafra,A.,Romero,J.R.,&Ventura,S.(2013).WebusageminingforpredictingfinalmarksofstudentsthatuseMoodlecourses.ComputerApplicationsinEngineeringEducation,21(1),135–146.http://dx.doi.org/10.1002/cae.20456
Romero, C., & Ventura, S. (2010). Educational data mining: A review of the state of the art. IEEETransactionsonSystems,Man,andCybernetics,PartC:ApplicationsandReviews,40(6),601–618.http://dx.doi.org/10.1109/TSMCC.2010.2053532
Romero,C.,Ventura,S.,&García,E.(2008).Dataminingincoursemanagementsystems:Moodlecasestudyandtutorial.Computers&Education,51(1),368–384.http://dx.doi.org/10.1016/j.compedu.2007.05.016
Romero,M.,&Barbera,E.(2011).Qualityoflearners’timeandlearningperformancebeyondquantitativetime-on-task. InternationalReviewofResearchinOpenandDistanceLearning,12(5),125–137.Retrievedfromhttp://www.irrodl.org/index.php/irrodl/article/view/999/1870

(2015).Doestime-on-taskmatter?Implicationsforthevalidityoflearninganalyticsfindings.JournalofLearningAnalytics,2(3),81–110.http://dx.doi.org/10.18608/jla.2015.23.6
ISSN1929-7750(online).TheJournalofLearningAnalyticsworksunderaCreativeCommonsLicense,Attribution-NonCommercial-NoDerivs3.0Unported(CCBY-NC-ND3.0) 110
Rosen,L.D.,MarkCarrier,L.,&Cheever,N.A.(2013).Facebookandtextingmademedoit:Media-inducedtask-switchingwhilestudying.ComputersinHumanBehavior,29(3),948–958.http://dx.doi.org/10.1016/j.chb.2012.12.001
Smeets,E.,&Mooij,T.(2000).Timeontask,interaction,andinformationhandlinginmultimedialearningenvironments.JournalofEducationalComputingResearch,21(4),487–502.http://dx.doi.org/10.2190/3KE4-P9E7-L9X8-EMC1
Stallings, J. (1980). Allocated academic learning time revisited, or beyond time on task. EducationalResearcher,9(11),11–16.http://dx.doi.org/10.3102/0013189X009011011
Swan,K.,&Ice,P.(2010).Thecommunityofinquiryframeworktenyearslater:Introductiontothespecialissue.TheInternetandHigherEducation,13(1–2),1–4.http://dx.doi.org/10.1016/j.iheduc.2009.11.003
Trigwell,K.,Prosser,M.,&Waterhouse,F.(1999).Relationsbetweenteachers’approachestoteachingandstudents’approachestolearning.HigherEducation,37(1),57–70.http://dx.doi.org/10.1023/A:1003548313194
Winne,P.H.,&Jamieson-Noel,D.(2002).Exploringstudents’calibrationofself-reportsaboutstudytacticsandachievement.ContemporaryEducationalPsychology,27(4),551–572.http://dx.doi.org/10.1016/S0361-476X(02)00006-1
Wise,A.F.,Speer,J.,Marbouti,F.,&Hsiao,Y.-T.(2013).Broadeningthenotionofparticipationinonlinediscussions:Examiningpatternsinlearners’onlinelisteningbehaviors.InstructionalScience,41(2),323–343.http://dx.doi.org/10.1007/s11251-012-9230-9
Wise,A.F.,Zhao,Y.,&Hausknecht,S.N.(2013).Learninganalyticsforonlinediscussions:Apedagogicalmodel for intervention with embedded and extracted analytics. Proceedings of the 3rdInternationalConferenceonLearningAnalyticsandKnowledge(LAK’13),48–56.http://dx.doi.org/10.1145/2460296.2460308
Worthen,B.R.,VanDusen,L.M.,&Sailor,P.J.(1994).Acomparativestudyoftheimpactofintegratedlearningsystemsonstudents’time-on-task.InternationalJournalofEducationalResearch,21(1),25–37.http://dx.doi.org/10.1016/0883-0355(94)90021-3