does technological diversification promote … · 2016-11-19 · does technological diversification...
TRANSCRIPT
DOES TECHNOLOGICAL DIVERSIFICATION PROMOTE INNOVATION? AN
EMPIRICAL ANALYSIS FOR EUROPEAN FIRMS.
By
Maria Garcia-Vega*
Universidad Complutense
Abstract
This paper analyses the impact of technological diversity on innovative activity at the
firm level. The empirical study on a panel of European R&D active companies shows
that both R&D intensity and patents increase with the degree of technological
diversification of the firm. Possible explanations are that, on the one hand, a firm that
diversifies its technology can receive more spillovers from other (related) technological
fields. On the other hand, diversification can reduce the risk from the technological
investments and it creates incentives to spend more on R&D. The paper provides
empirical evidence relevant to the diversity-specialization innovation debate.
JEL classification: D21, O31, O32
Keywords: technological diversification, innovation, R&D
* Address: Departamento de Fundamentos del Analisis Economico I. Facultad de Ciencias Economicas y
Empresariales. Universidad Complutense de Madrid. Campus de Somosaguas 28223 Madrid (Spain) E-
mail: [email protected] Phone: + 34-913942510 Fax: +34 913942561
1
1. Introduction
A company in an imperfectly competitive market has incentives to constantly
improve the quality of its products in order to avoid vulnerability to potential
competitors. Such a quality improvement can require some diversification of its
technological base, that is, firms need to “span their innovative activities over more than
one technology” (Breschi et al., 2003). What are the consequences of a more diversified
research portfolio for the firm’s degree of innovation? As Breschi et al. (2003) point out,
there are two possible hypotheses on the effects of technological diversification.
Companies that focus their R&D in a small number of technological fields can profit
from the specialization of their research activities. Specialization can enhance the
economies of scale associated with the learning process, facilitate the transfer of
knowledge between the core technologies of the firm, and benefit from the technological
“comparative advantages” of the firm. Consequently, under these assumptions, it might
be expected that more technologically specialized firms are more innovative than more
diversified ones. However, although a certain degree of specialization is required in
order to achieve the necessary expertise to improve the state-of-the-art of the complex
techniques in the research process, firms that are more technologically diversified can
have certain advantages in competitive markets. First of all, they can obtain a higher
cross-fertilization between different, although related technologies (Granstrand, 1998,
Suzuki and Kodama 2004), and also they can attain gains from unrelated technologies
that take place in the firm. Nelson (1959) considered that firms that diversify their
2
technological base are likely to benefit from new technological possibilities. Since many
innovations are designed to solve unrelated problems, companies that are more
diversified profit more from their own research activities, because they capture more of
the social benefits of their innovations. Secondly, investments in R&D are used as
competitive “weapons” (Baumol, 2002) and they entail some risks for the company.
Scherer (1999) reports that on average, approximately only half of the technological
projects that a firm undertakes are successful1. Additionally, the growing competition
(especially in highly innovative markets), technological change, and the rate of imitation
are sources of economic depreciation or obsolescence for the firm’s technology (“creative
destruction”, Schumpeter, 1942). In this situation, technologically diversified firms may
invest more in R&D, because the diversification in their research portfolio tends to
reduce the risks inherent in the R&D projects. When a large company diversifies its
areas of research, it can be reducing the variance associated with the returns these
investments. Therefore risk averse managers can be more willing to invest a higher
proportion of the firm’s wealth in risky innovative research projects (Nelson, 1959,
Tirole, 1988, Scherer, 1999). Thirdly, technological diversification can prevent a
negative lock-in effect in one particular technology, and it can sustain the evolution and
business renovation of the firm2.
This article updates earlier work on the relationship between diversification and
innovation (Scherer, 1984, Audretsch and Feldman 1999). Most of the empirical
research that relates diversification and innovation at the firm level is based on product
1 These data come from a series of studies conducted by Mansfield et al. (1977). 2 For further discussion and case studies see Suzuki and Kodama (2004).
3
diversification measures. These studies have shown some correlation between product
diversification and different measures of innovation, such as R&D intensity (Grabowski,
1968, and Teece, 1980), number of technical workers (Gort, 1962), or number of patents
(Scherer, 1984). Veugelers (1997) examines the impact of external sourcing strategies on
own in-house R&D expenditures using the product diversification of the firm as one of
the explanatory variables. However, product diversification is not necessarily a good
measure of the firm's technological diversification, and thus it presents some problems3.
Furthermore, firms' technological diversification is typically higher than their product
diversification (Gambardella and Torrisi, 1998). As Heeley and Matusik (2004) argue
technical and product market knowledge are very different since “they are originated in
different stages of the value chain”, and there can be different motives behind these
decisions. Product diversification can be determined by the optimal decision of the
managers in the search to maximize the value of the firm. Decreasing returns to scale
associated with production can create incentives to explore new productive opportunities
and lead to an expansion into different and more attractive industries. If firms closer to
decreasing returns to scale in production (therefore less productive, less profitable, and
with less available cash flows to invest in R&D activities) are more likely to diversify its
production, it might be expected a negative relation between product diversification and
innovation (Gomes and Livdan, ?). However, this negative relationship can be reduced if
the product diversification takes place among related business that share common assets,
3 Two products that are classified in a different industry category can share the same scientific or technological base. In this case, the positive relation between innovation and product diversification would indicate that there is a spillover effect among similar technological activities. Alternatively, two different products can be based on different scientific or technological bases. Using product diversification measures, it is not possible to distinguish between these two cases. Moreover, products that are included in the same industry category can have a different scientific or technology base.
4

since the fixed costs of entry are smaller, and firms can take advantages of synergies such
that … Technological diversification can be motivated by the firm necessity to improve
the quality of its products or reduce cost in one market, and it is also most likely that the
firm can profit more from different research projects than from different products. The
empirical research seems to support this hypothesis. The findings of Gambardella and
Torrisi (1998) suggest that best performing companies are focused on their core business,
but have a wide spectrum of technological capabilities, which possibly allows them to
create more complex and developed products, and Granstrand et al. (1997) find that firms
often acquire a wide variety of technologies to compete in a narrow range of products.
The empirical literature has recently paid more attention to the extent and
persistence of firm technological diversification4. Pavitt et al. (1989) identify
technological trajectories of innovating UK firms and report an increase of technological
diversification in corporations. However, Cantwell and Vertova (2004) find the opposite
tendency at the country level. These authors analyse whether the pattern of technological
diversification of the countries has been stable over time, providing evidence that
countries have tended to narrow the different fields of their research activities possibly
for the location of multinationals that supports the concentration of the countries’
technological processes. Most of the empirical literature indicates that the firms’
diversification patterns have moved into related technological areas (Piscitello, 2000, and
Breschi et al., 2003). Very few empirical studies have assessed the importance of the
firm’s technological diversity to promote innovation. Heeley and Matusik (2004) analyse
4 For discussion on the recent literature of technological diversification see Cantwell et al. (2004) and Fai (2003), and for a discussion of diversification dynamics and strategies in technology-base firms see Granstrand (1999).
5

whether firms with broad technological portfolio and narrow market diversification
strategies are more innovative.
This paper contributes a microeconometric analysis of the effects of technological
diversification on innovation. This is done by examining R&D, patents, and the
technological position of a panel of EU firms from 1995 to 2000. The number of patents
the firm applies for, and its R&D intensity are used to measure its innovation. For each
firm a patent portfolio-based index (Jaffe, 1986) is calculated. Diversification is
measured by one minus a Herfindahl index of concentration of this portfolio. After
controlling for size, other characteristics of the firm, and the possible bias of the
Herfindahl index (making different groups depending on the firm’s number of patents,
and using an adjusted Herfindahl index 9Hall, 2002a), the results suggest that
technologically diversified firms invest a higher proportion of their sales in R&D, and
that an increase in the diversification of the firm's technological portfolio affects
positively the firm’s number of patents. These results do not imply that larger firms are
more technologically diversified and therefore more innovative (the empirical results of
this article indicate indeed that small firms are more R&D intensive). Although it has not
been assessed in the paper, possibly a certain minimum size threshold is necessary for a
firm to be able to diversify its technological portfolio. It can be more likely that “small’
firms are more likely to diversify than “large” firms. However, the results imply that the
size effect does not account for all the effect of technological diversification on
innovation.
6
The rest of the paper is organized as follows. Section 2 describes the data used.
Section 3 details the hypothesis and econometric specification. Section 4 offers the main
estimation results relating diversity, R&D, and innovation, and finally, Section 5
concludes this paper.
2. On data
This investigation uses data on 544 firms for 15 EU countries for the period from
1995 to 2000. For each firm are included yearly data on R&D expenditures, sales,
liabilities, equity, and the main SIC industry classification for the whole period at the 4th
digit level of disaggregation. All financial data are real annual figures deflated to the
base year 1995 using country's GDP deflators. Financial data come from the Worldscope
Global database, and GDP deflators from the OECD database.
The firm selection has been based on the availability of R&D expenditures for
those firms in the database. Only EU firms that report R&D in at least three years have
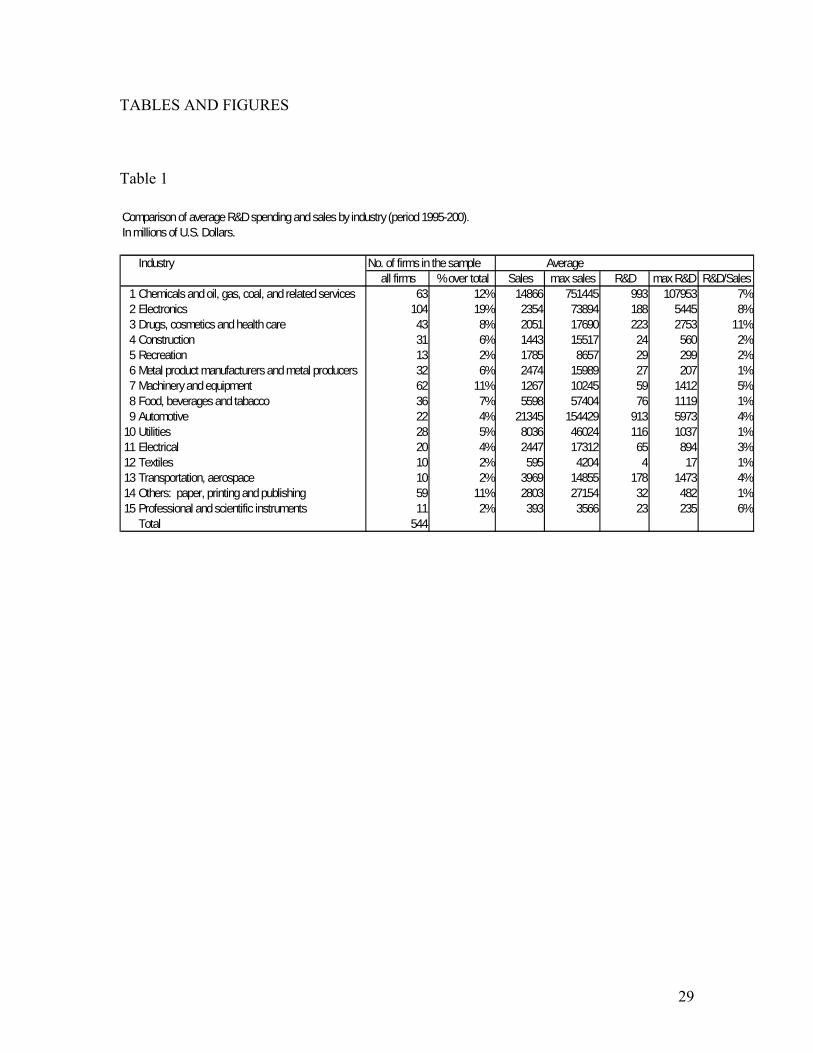
been included. Tables 1 to 3 report some summary statistics for the firms in the sample,
broken down into 15 industry categories and into countries. The sample is biased
towards large firms. Approximately half of the firms are British, followed by firms from
Germany and France. The most representative sector in the sample is electronics, and the
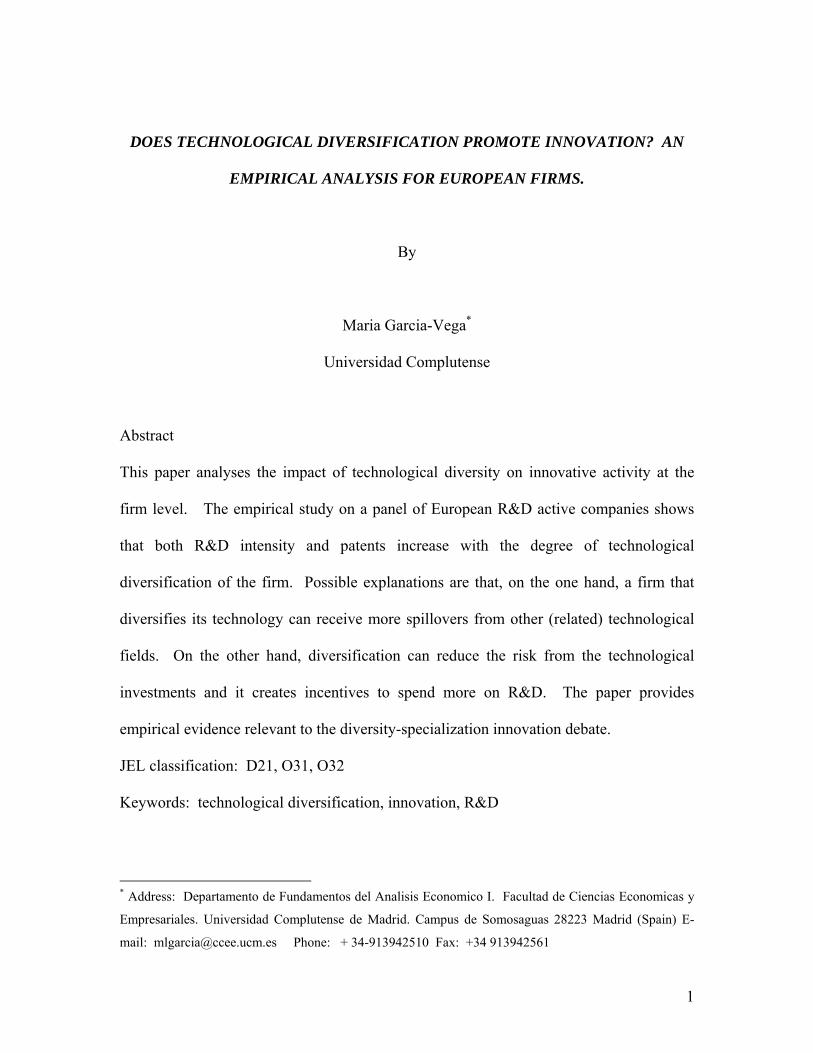
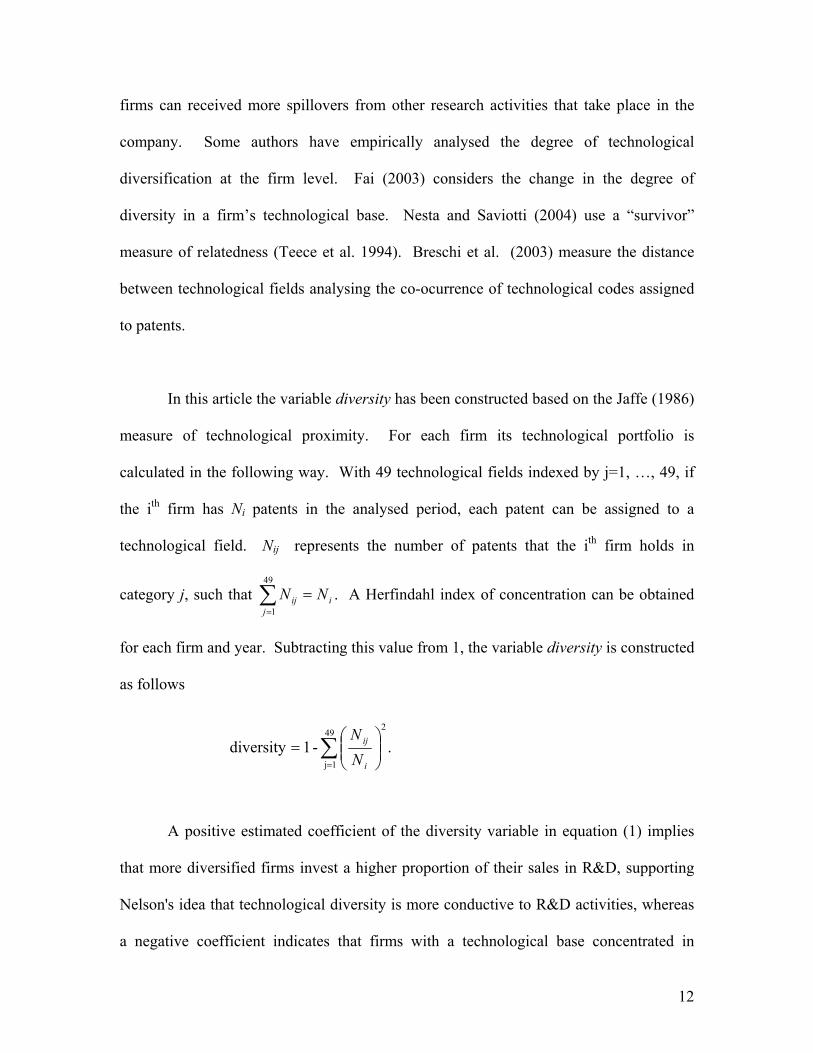
rest of the firms are fairly distributed across the other sectors. Figure 1 plots log R&D
versus log Sales. This illustration summarizes the basic relationship between R&D and
firm size in the data, showing that R&D and sales are highly correlated (in the sample,
7
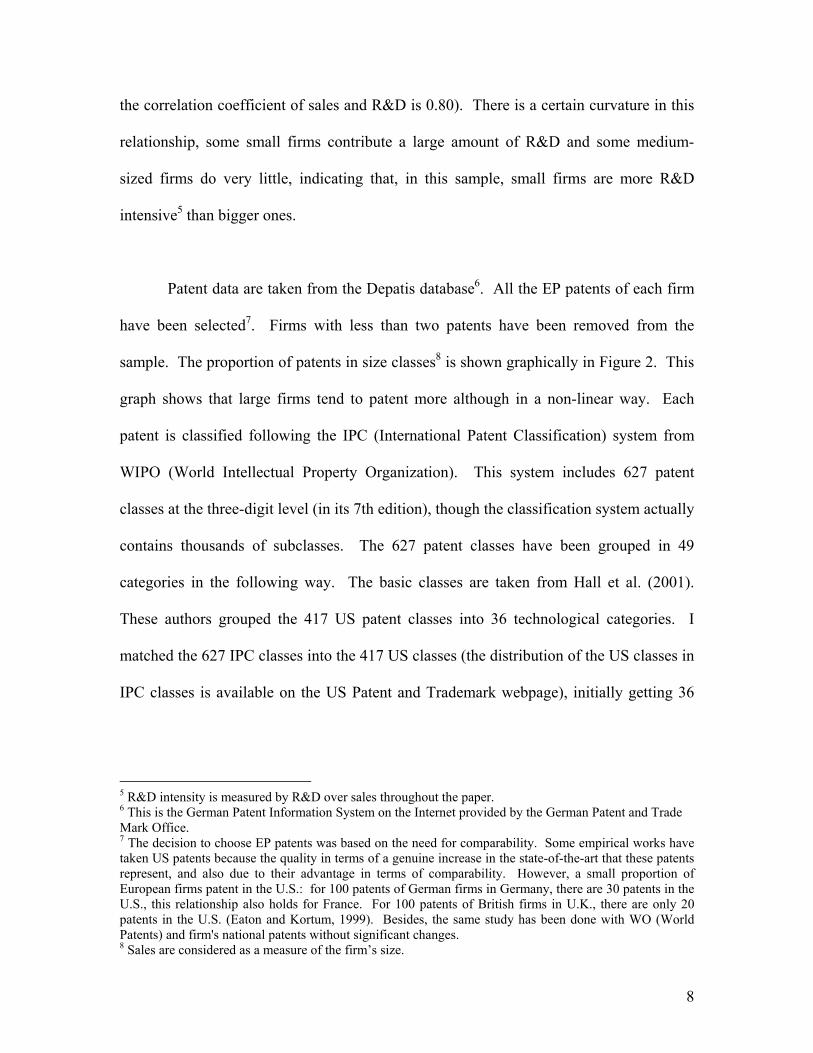
the correlation coefficient of sales and R&D is 0.80). There is a certain curvature in this
relationship, some small firms contribute a large amount of R&D and some medium-
sized firms do very little, indicating that, in this sample, small firms are more R&D
intensive5 than bigger ones.
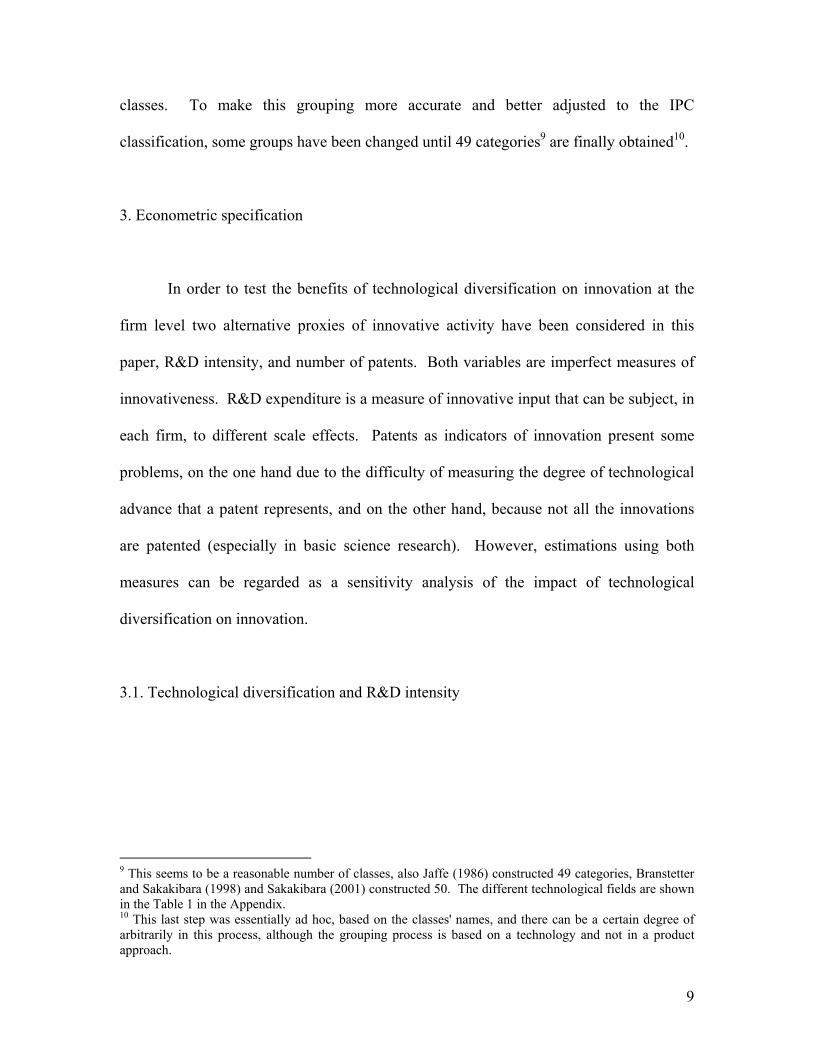
Patent data are taken from the Depatis database6. All the EP patents of each firm
have been selected7. Firms with less than two patents have been removed from the
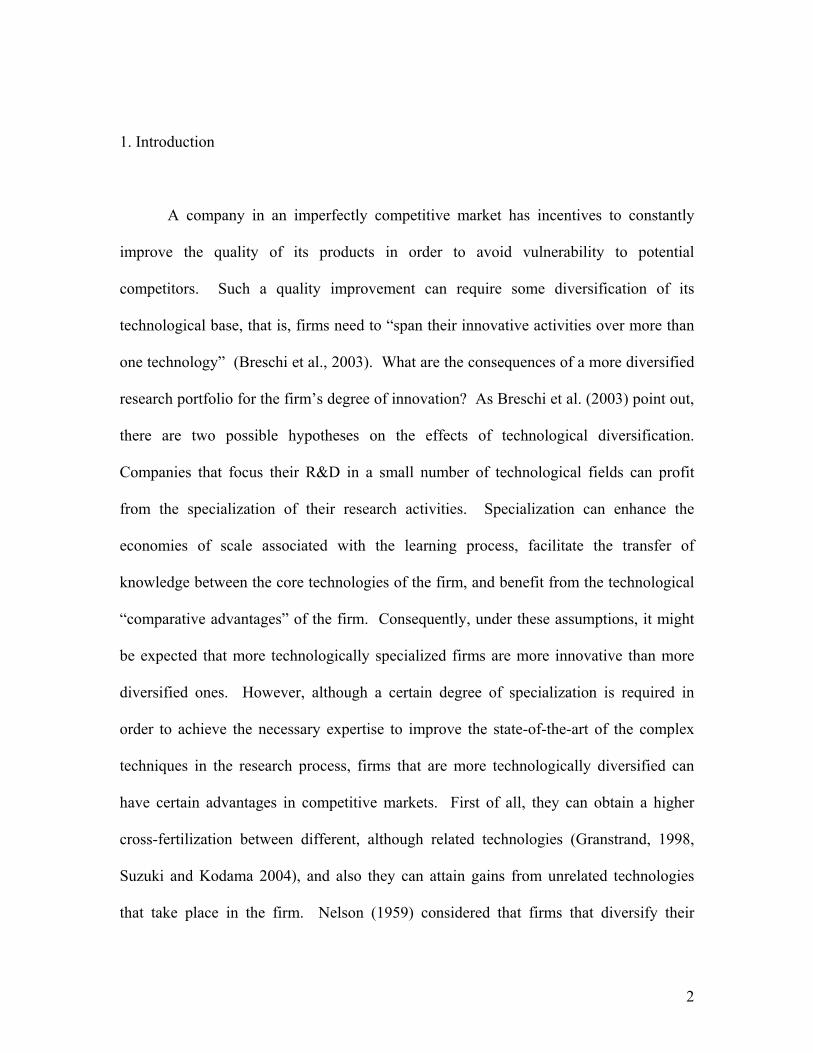
sample. The proportion of patents in size classes8 is shown graphically in Figure 2. This
graph shows that large firms tend to patent more although in a non-linear way. Each
patent is classified following the IPC (International Patent Classification) system from
WIPO (World Intellectual Property Organization). This system includes 627 patent
classes at the three-digit level (in its 7th edition), though the classification system actually
contains thousands of subclasses. The 627 patent classes have been grouped in 49
categories in the following way. The basic classes are taken from Hall et al. (2001).
These authors grouped the 417 US patent classes into 36 technological categories. I
matched the 627 IPC classes into the 417 US classes (the distribution of the US classes in
IPC classes is available on the US Patent and Trademark webpage), initially getting 36
5 R&D intensity is measured by R&D over sales throughout the paper. 6 This is the German Patent Information System on the Internet provided by the German Patent and Trade Mark Office. 7 The decision to choose EP patents was based on the need for comparability. Some empirical works have taken US patents because the quality in terms of a genuine increase in the state-of-the-art that these patents represent, and also due to their advantage in terms of comparability. However, a small proportion of European firms patent in the U.S.: for 100 patents of German firms in Germany, there are 30 patents in the U.S., this relationship also holds for France. For 100 patents of British firms in U.K., there are only 20 patents in the U.S. (Eaton and Kortum, 1999). Besides, the same study has been done with WO (World Patents) and firm's national patents without significant changes. 8 Sales are considered as a measure of the firm’s size.
8
classes. To make this grouping more accurate and better adjusted to the IPC
classification, some groups have been changed until 49 categories9 are finally obtained10.
3. Econometric specification
In order to test the benefits of technological diversification on innovation at the
firm level two alternative proxies of innovative activity have been considered in this
paper, R&D intensity, and number of patents. Both variables are imperfect measures of
innovativeness. R&D expenditure is a measure of innovative input that can be subject, in
each firm, to different scale effects. Patents as indicators of innovation present some
problems, on the one hand due to the difficulty of measuring the degree of technological
advance that a patent represents, and on the other hand, because not all the innovations
are patented (especially in basic science research). However, estimations using both
measures can be regarded as a sensitivity analysis of the impact of technological
diversification on innovation.
3.1. Technological diversification and R&D intensity
9 This seems to be a reasonable number of classes, also Jaffe (1986) constructed 49 categories, Branstetter and Sakakibara (1998) and Sakakibara (2001) constructed 50. The different technological fields are shown in the Table 1 in the Appendix. 10 This last step was essentially ad hoc, based on the classes' names, and there can be a certain degree of arbitrarily in this process, although the grouping process is based on a technology and not in a product approach.
9

To evaluate the relationship between technological diversification and R&D
intensity, equation (1) provides information about some of the determinants of the firm's
R&D intensity.
+++= )(sales log sales log )/salesD&(R log 2it2it1itit ββα
. diversity sconstraint financial itiit4it3 εδββ ++++ (1)
The variable R&Dit is firm i's R&D expenditures in year t, α is the constant term,
salesit is firm i's sales in year t, financial constraintsit is a measure of the external
financial dependence of the firm, diversityit is the technological diversity of the firm, and
δi are a set of industry and country dummies11 used to correct for industry and country
fixed effects. This inclusion of industry dummies allows taking into account whether the
effect of the independent variables is high relative to the sector.
The variable financial constraintsit tries to capture the influence of imperfections
in capital markets to restrain R&D expenditures and growth (Rajan et al., 1998).
Constraints in external financial funds can reduce the firms’ investments. This factor can
be especially important for R&D12 investments for several reasons, for example high
risks associated with R&D, lack of collateral, and problems for financial institutions to
monitor R&D returns due to asymmetric information between investor and inventor.
11 This equation is not meant to be a realistic model of firm-level R&D spending. It does not mean that firms optimise R&D on the basis of their sales. Firm sales are included as a control for size. This is a standard specification in the R&D literature. 12 For a discussion see Hall (1992, 2002b).
10
Several authors (Bond et al., 1999, Hall, 1992, Mulkay et al., 2001, …) have empirically
studied the extent of financial constraints on R&D investments.
To measure financial constraints, three proxies have been used in this paper: total
debt over total debt plus equity (denoted by debt1), total current liabilities over total
current assets (denoted by debt2), and cash flows13. A positive coefficient of debt1
implies that firms with less debt invest more in R&D activities. The variable debt2
indicates the firm's capacity to pay its short-term debts (that is the inverse of the liquidity
ratio). Consequently, a negative estimated coefficient reflects that firms with a higher
proportion of current assets (with more capacity to pay their debts) invest more in R&D.
Also the effect of the cash flow on R&D expenditures has been analysed. Leland and
Pyle (1977), Bhattacharya and Ritter (1985) among others, suggest that R&D can be
constrained by cash flow, due to a moral hazard problem in transferring information
about risky projects from the firm to the investors. Hall (1992) and Mulkay et al. (2001)
find a positive relationship between cash flow and R&D expenditures for a panel of
firms. In order to control for this issue, two different measures of cash flow have been
incorporated in the estimation: logarithm of cash flow (denoted by cash1), and logarithm
of operating cash flow (denoted by cash2)
The key variable for this analysis is diversity. This variable tries to capture the
degree of diversification in the distribution of the firm’s technological portfolio.
Technological diversification can affect firm innovativeness, on the one hand, due to a
risk reduction in firm research activities. On the other hand, technologically diversified 13 Fazzari et al. (1988) pioneered this method.
11
firms can received more spillovers from other research activities that take place in the
company. Some authors have empirically analysed the degree of technological
diversification at the firm level. Fai (2003) considers the change in the degree of
diversity in a firm’s technological base. Nesta and Saviotti (2004) use a “survivor”
measure of relatedness (Teece et al. 1994). Breschi et al. (2003) measure the distance
between technological fields analysing the co-ocurrence of technological codes assigned
to patents.
In this article the variable diversity has been constructed based on the Jaffe (1986)
measure of technological proximity. For each firm its technological portfolio is
calculated in the following way. With 49 technological fields indexed by j=1, …, 49, if
the ith firm has Ni patents in the analysed period, each patent can be assigned to a
technological field. Nij represents the number of patents that the ith firm holds in
category j, such that . A Herfindahl index of concentration can be obtained
for each firm and year. Subtracting this value from 1, the variable diversity is constructed
as follows
ij
ij NN =∑=
49
1
∑=
⎟⎟⎠
⎞⎜⎜⎝
⎛=
49
1j
2
.-1diversityi
ij
NN
A positive estimated coefficient of the diversity variable in equation (1) implies
that more diversified firms invest a higher proportion of their sales in R&D, supporting
Nelson's idea that technological diversity is more conductive to R&D activities, whereas
a negative coefficient indicates that firms with a technological base concentrated in
12

similar activities invest more in R&D, or in other words, that more technologically
specialized firms are more R&D intensive.
3.2. Technological diversification and patents.
A possible proxy for innovation is the number of patents that the firm applies for.
The basic specification to explain the relationship between technological diversity and
innovation can be expressed through the following equation
. diversityK)log(Sales)D&log(Rpatents '
it4it3it2it1'
it iti εδθθθθα ++++++= (2)
In (2), the variable patentsit is the number of patents of the ith firm in period t.
R&Dit is the R&D expenditure of the ith firm in period t, the variable Salesit is controlling
by the firm’s size. Arguably, small firms can be less diversified than large firms.
Consequently, technological diversification can be positively associated with size, and
therefore the variable diversity can be capturing the influence of size on patent activity,
instead of the effect of the distribution of the firm’s technologies on innovation.
Incorporating this variable in the regressions allows us to distinguish between the size
effect, and the technological diversification effect on innovation. The term Kit represents
the (external) spillover term (in logarithms) among the firms in the sample. It is
constructed as in Jaffe (1989), including for each firm an available “pool” of outside
R&D. This indicator measures the influence of external stock of R&D on the firm’s
incentive to innovate. This variable is defined as, lil
li DRP &.Ki ∑≠
= The spillover (Kit)
13

that the ith firm receives is the weighted average of all other firms' R&D spending
(R&Dl). The weights (Pli) are constructed using the proximity of the firms in their
technology space
( )( )( ) ,
.F F.F F
.F FP 2/1'
ll'ii
'li
li =
where Fi =(Ni1, …, Nij, …, Nik) is the technological space of a firm, and Nij is the number
of patents that the ith firm holds in the technological category j. This vector is constructed
using the distribution of the firm's patents in the different technological areas (as in the
previous sections, 49 areas have been considered).
In equation (2) α’ is the constant term, δi is a set of country and sector dummies,
and ε’ is the error term. The variable diversity is measured as in equation (1). A positive
coefficient of the diversity variable indicates that the greater the degree of diversification
is within the firm, the higher will be its patenting activity.
A problem with equation (2) that I want to point out is that, when the number of
patents increases and its distribution does not change, the diversification index remains
constant (in this case, the variable diversity would be independent of the number of
patents). However, the diversity variable can be reflecting the fact that a firm has few
patents, just because firms with less than 49 patents (the total number of groups) do not
have the same chances to diversify (in the index) as firms with more than 49 patents
(clearly a firm with one patent will have diversification zero, and for a firm with two
14

patents, the highest value that the diversification index can take is 0.5). Therefore, the
diversification index can be biased downwards for those firms with few patents. That
poses a serious problem in the estimation of equation (2). To control for this fact, two
different approaches have been taken:
First of all, equation (2) has been estimated separately for firms with different
numbers of patents. Three different ways to group firms have been considered: firms
with less than 10 patents and firms with more than 10 patents14, firms with less than 20
patents and firms with more than 20 patents, and finally, firms with less than 10 patents,
firms that have between 10 and 20 patents, and firms with more than 20 patents, are
estimated separately. Taking firms that have the same possibilities to diversify, the
dependence of the diversity variable on the number of patents is reduced. Additionally,
the comparison of the results allows us to obtain some insight into the stability and
robustness of the results.
Second, I use a non-biased diversity estimator. Hall (2002a) proposed the
following variation of the Herfindahl index for citations based on patent counts,
⎟⎟⎠
⎞⎜⎜⎝
⎛−⎟
⎟
⎠
⎞
⎜⎜
⎝
⎛⎟⎟⎠
⎞⎜⎜⎝
⎛= ∑
= 1-1diversity adjusted
49
1j
2
i
i
i
ij
NN
NN
.
14 Ten seems a reasonable number of patents because the most diversified firm appears in 10 different groups.
15

This estimator gives a higher value to the diversity index for those firms with
fewer patents, and consequently, corrects the possible bias of the diversity index.
However, in some cases the diversification index can be reflecting the real technological
diversification of a firm with few patents. In this case, the results obtained with the
adjusted diversification index will be biased downwards. Hence, the adjusted diversity
index can be considered as a lower bound of the effect of the degree of diversification on
innovation.
4. The results.
4.1 Technological diversification and R&D intensity
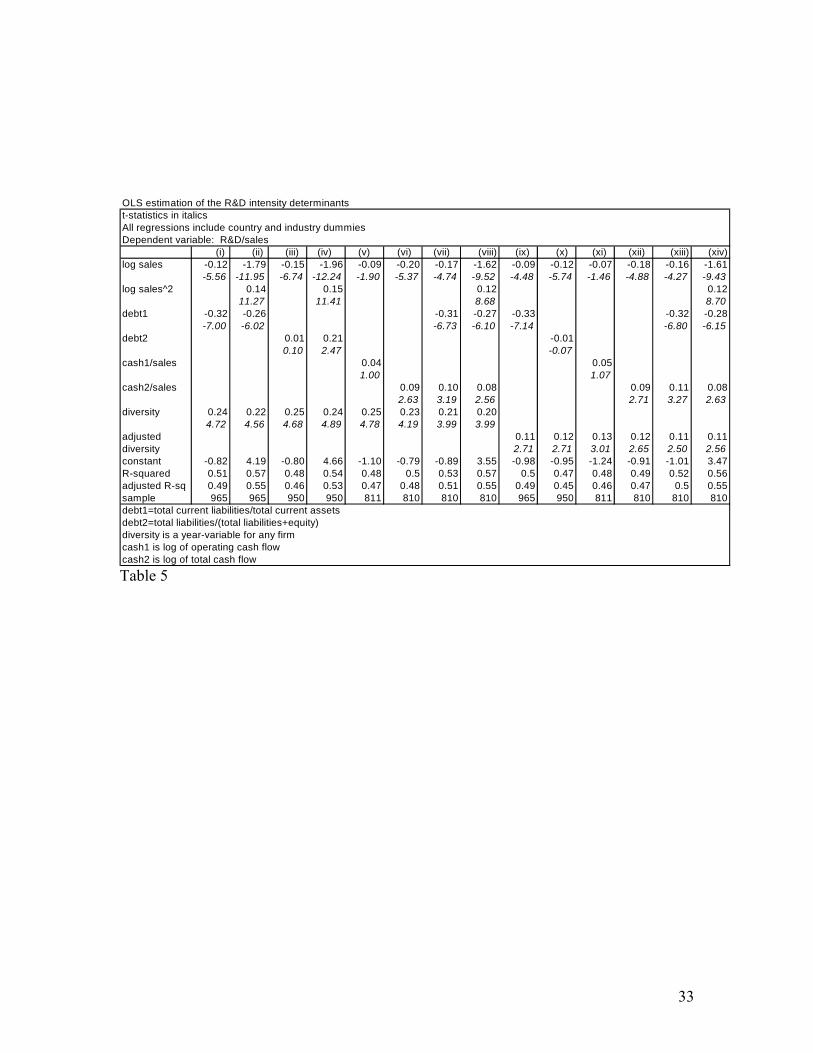
Table (5) shows the estimations of the relationship between technological
diversification and R&D intensity as expressed in equation (1). The numbers in italics
are the t-statistics and all regressions include country and industry dummies. Columns (i)
to (viii) show the effect of technological diversity on R&D intensity when different
measures of financial constraints are used. In column (i), the variable total current
liabilities/total current assets is the considered measure of financial constraints. This
variable affects negatively the R&D intensity, as expected. Column (ii) includes the
variable sales2 to account for possible non-linearities between size and R&D intensity. In
columns (iii) and (iv), the effect of total liabilities/(total liabilities+equity) is estimated.
The estimated coefficient is significant and positive when sales2 is included in the
regression (column (iv)). As an alternative specification, the next columns, (v) to (viii),
16

show the positive effect of cash flow on R&D intensity. The results are supportive of the
hypothesis that there can exist financial constraints that affect negatively the degree of
R&D intensity in the firm. In all the cases (in columns (i) to (viii)), an increase of the
firm's technological diversity leads to an increase in the firm's R&D intensity. Columns
(ix) to (xiv) report the impact of technological diversity when the variable adjusted
diversity is used as an explanatory variable, in order to control for a possible bias in the
variable diversity. The results are again consistent with previous estimations, and
indicate a lower bound of the effects of technological diversification on R&D.
An econometric issue such as endogeneity can arise; technological diversity can
be an endogenous variable since it can depend on the amount of R&D invested. To
control for this possible problem, Table 6 explores the use of instrumental variables in the
regression. I use instrumental variables instead of panel data techniques because of the
short time frame. The variable diversity is lagged one period, and also the variable
diversityc is used. This new measure of diversification (diversityc) assigns a unique
value of diversity for each firm using all the patents of the firm, or in other words, it is
the average technological diversification for each firm in the period 1995-2000. The
estimated value for the technological diversity is slightly higher than in Table 5, and in all
cases positive and significant. These results support the idea that technologically
diversified firms are more innovative in terms of its R&D intensity.
4.2. Technological diversification and patents
17
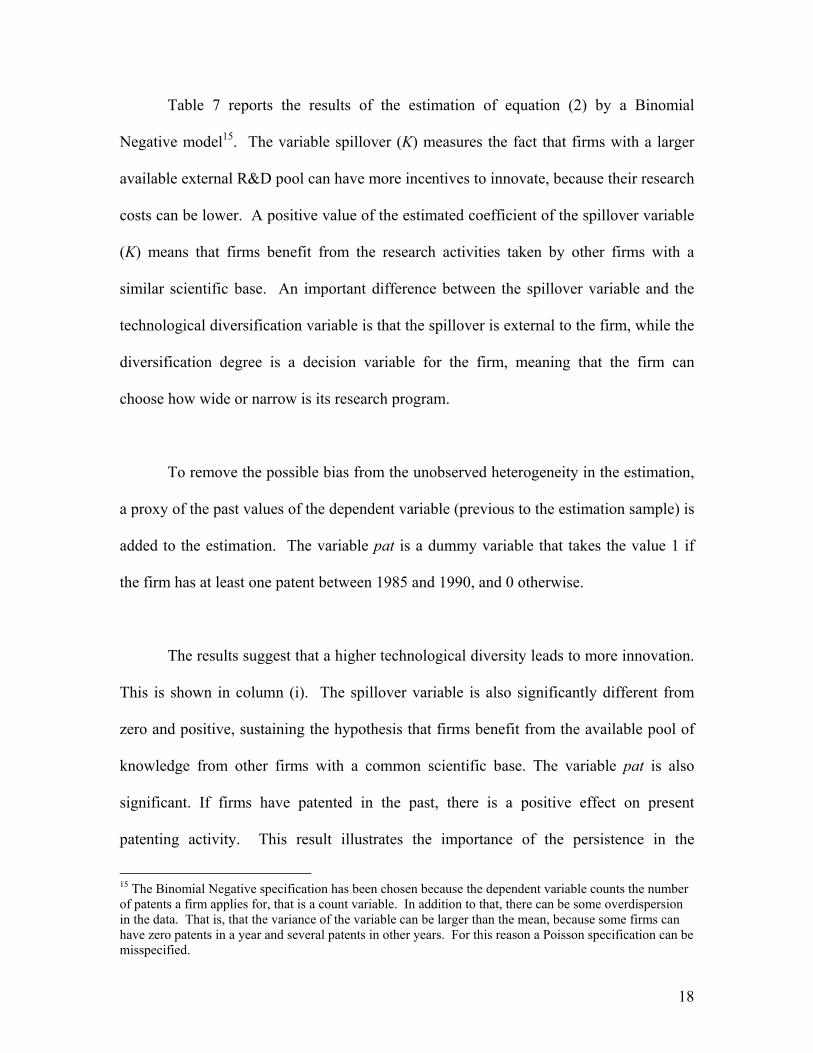
Table 7 reports the results of the estimation of equation (2) by a Binomial
Negative model15. The variable spillover (K) measures the fact that firms with a larger
available external R&D pool can have more incentives to innovate, because their research
costs can be lower. A positive value of the estimated coefficient of the spillover variable
(K) means that firms benefit from the research activities taken by other firms with a
similar scientific base. An important difference between the spillover variable and the
technological diversification variable is that the spillover is external to the firm, while the
diversification degree is a decision variable for the firm, meaning that the firm can
choose how wide or narrow is its research program.
To remove the possible bias from the unobserved heterogeneity in the estimation,
a proxy of the past values of the dependent variable (previous to the estimation sample) is
added to the estimation. The variable pat is a dummy variable that takes the value 1 if
the firm has at least one patent between 1985 and 1990, and 0 otherwise.
The results suggest that a higher technological diversity leads to more innovation.
This is shown in column (i). The spillover variable is also significantly different from
zero and positive, sustaining the hypothesis that firms benefit from the available pool of
knowledge from other firms with a common scientific base. The variable pat is also
significant. If firms have patented in the past, there is a positive effect on present
patenting activity. This result illustrates the importance of the persistence in the
15 The Binomial Negative specification has been chosen because the dependent variable counts the number of patents a firm applies for, that is a count variable. In addition to that, there can be some overdispersion in the data. That is, that the variance of the variable can be larger than the mean, because some firms can have zero patents in a year and several patents in other years. For this reason a Poisson specification can be misspecified.
18
patenting activity of the firms. Columns (ii) to (vi) of Table 7 show the same estimation
specification when the sample is split into different groups. For firms with more than
twenty patents, the diversification effect is considerably smaller, although it increases for
firms with less than twenty patents. Finally, for firms that have between ten and twenty
patents, the diversity impact is negligible. This result is probably caused by the small
sample size of this estimation (only 103 observations).
In order to control for the possible bias of the diversity variable, the same
estimations have been calculated using a variation of the Herfindahl index as proposed by
Hall (2002a). The adjusted diversity variable has a significant, although smaller effect on
innovation than in the previous estimations (columns (vii) to (xii) in Table 7). This is due
to the fact that this index gives more weight to the firms with fewer patents (those more
likely to be more technologically concentrated). These results can be regarded as a lower
bound of the technological diversity effect on innovation and show the positive
relationship between technological diversity and number of patents.
The spillover effect (K) is more important for firms with a large number of
patents. For firms with more than twenty patents, columns (iv) and (x), an increase in the
available external knowledge pool by 10 percent enhance their patent activity by at least
4 percent. Firms benefit from the knowledge generated in other companies with a similar
research menu, and at the same time, they are more innovative the wider their
technological portfolio is.
19

If firms wrongly report their R&D expenditures, the regressor would be subject to
measurement error. In addition to that, as it has been shown in the previous estimations,
technological diversity affects the number of patents indirectly through R&D. For these
reasons, equation (2) is estimated using the variables sales and debt instead of R&D as
explanatory variables. The main results are shown in columns (i) and (ii) of Table 8.
The estimated coefficient of the diversity variable is very similar to the one obtained in
previous estimations. Finally, columns (iii) and (iv) in Table 8 present the estimations
incorporating the variable sales as a control for firm’s size. (although this relationship
has been indirectly controlled by the variable R&D). As expected, there is a reduction of
the estimated coefficients associated with the variables sales and R&D due to the
correlation between these variables. The influence of both diversity and adjusted
diversity on innovation decreases slightly with respect to previous estimations, although it
remains significant, corroborating the direct relationship between patents and
technological diversification. The reported findings in Table 8 remain very similar in
terms of size and statistical significance to the previous ones.
5. Conclusions
More competition, more openness, and other factors that lead to an increase in the
range of the firm's technological areas can reduce the variance of the firm’s research
portfolio. An increase in the firm’s technological diversification can promote the cross-
fertilization between different technological areas, and reduce the lock-in low profitable
20

technologies. These are possible different channels through which the firm’s
technological diversification can create incentives to enhance innovation, and to raise the
firm’s investments in R&D.
This investigation examines empirically the effects of the technological diversity
of firms on R&D intensity and number of patents. An econometric analysis based on
panel data of 544 European firms from 1995 to 2000 indicates a positive relationship
between technological diversity and innovation at the firm level. Although the results are
based on a small sample of European firms, they support the hypothesis that
technological diversification promotes innovation. The findings also show that small
firms are more R&D intensive, although in a non-linear way, and illustrate the
importance of the persistence the patent activity to promote innovation. Additionally,
this article has tested the hypothesis that financial constraints are important for R&D
investments. All the results are consistent with previous studies in the literature that
assert the fact that firms prefer to use their internal funds to finance R&D investments,
possibly due to asymmetric information, and moral hazard problems between financial
institutions and inventors. Concerning the effect of external spillovers, the results
suggest that firms with a larger available R&D pool have more patents, and that a certain
absorptive capacity is necessary to benefit from the research activities of other firms.
The empirical analysis of this article has certain limitations. Patents and R&D
expenditures are both imperfect measures of innovativeness at the firm level. Therefore
the results and implications have to be taken cautiously. Moreover, it has left aside one
21
important aspect of the characteristics of the technological diversification. The
technology diversification measure that has been used throughout this paper does not
distinguish between diversification in knowledge-related areas (Breschi et al., 2003) or
unrelated areas, and consequently, it is not able to differentiate between these two cases.
More work is needed to empirically identify the links between diversification and
innovation. One possible channel that can have influence on innovation is risk-sharing.
Risk-adverse managers can be willing to assume more risks16 when the returns of the
technological projects are uncorrelated. Possibly, different risk attitudes caused by
diverse economic environments (such that differences in risky borrowing regulations,
bankruptcy exemptions across countries or regions) have important implications for the
conduct of R&D investments. Additionally, managers of large and established
companies can have different degrees of risk aversion than entrepreneurs of small or
start-up firms.
One conclusion of this article involves with the proposition that big companies
can damage the public interest, however they can be better qualified to innovate17. This
study has emphasised the importance of technological diversification to promote
innovation, rather than the importance of the size of the firm. Although there seems to be
a minimum threshold for firms to diversify their research menu, there is no evidence for a
linear relationship between size and technological diversification. More research, both
empirical and theoretical, is necessary to examine the different determinants of
16 Therefore they may be also more willing to invest more resources in high-innovative R&D. 17 Baumol (2002) among others.
22

technological diversification in static and dynamic frameworks, and its precise
relationship with firm size and other firm characteristics, as well as its impact on firm
performance in the marketplace.
ACKNOWLEDGEMENTS
I thank William Baumol, Jose A. Herce, Helena Huergo, participants in the VIII Jornadas
de Economia Internacional (Castilla La Mancha University), 5th ZEW Summer
Workshop (Mannheim), and seminars at University Carlos III (Madrid) and University
Complutense (Madrid) for helpful discussions and comments on an earlier draft. I want
to thank Jordi Casals for the use of the database at the IESE, and constructive comments
of three anonymous referees. All errors are mine.
23
BIBLIOGRAPHY
Audretsch, D. and Feldman M., 1999. Innovation in cities: Science-based diversity,
specialization and localized competition. European Economic Review 43, 409-
429.
Bhattacharya, S and Ritter J., 1985. Innovation and communication: Signalling with
partial disclosure. Review of Economic Studies, 50, 331-346
Baumol, W., 2002. The free-market innovation machine: Analyzing the growth miracle
of capitalism. Princeton University Press
Bond, S., Harhoff, D., and Van Reenen, J., 1999. Investment, R&D, and financial
constraints in Britain and Germany. London, Institute of Fiscal Studies Working
Paper No. 99/5.
Branstetter, L. and Sakakibara M., 1998. Japanese research consortia: a
microeconometric analysis of industrial policy. Journal of Industrial Economics.
Volume XLVI, No. 2, 207-233.
Breschi, S., Lissoni, F., and Malerba, F., 2003. Knowledge-relatedness in firm
technological diversification. Research Policy, 32, 69-87.
Cantwell, J., Gambardella, A. and Granstrand, O. 2004. The Economics and
Management of Technological Diversification. Routledge: London and New
York.
Cantwell, J. and Vertova, G., 2004. Historical evolution of technological diversification.
Research Policy, 33, 511-529.
Eaton, J. and Kortum S., 1999. International patenting and technology diffusion: Theory
and measurement. International Economic Review, 40: 537-570
24
Fai, F., 2003. Corporate technological competence and the evolution of technological
diversification. Cheltenham, UK and Northampton, Mass. USA: Edward Elgar.
Fai, F., and von Tunzelmann, G., 2001. Scale and scope in technology: large firms
1930/90. Economics of Innovation and New Technology, 10(4): 255-288.
Fazzari, S., Hubbard, R., and Petersen, B., 1988. Financing constraints and corporate
investment. Brookings Papers on Economic Activity, 1, 141-205.
Gambardella, A. and Torrisi, S., 1998. Does technological convergence imply
convergence in Markets? Evidence from the electronics industry. Research
Policy, 27, 445-464
Gort, M, 1962. Diversification and integration in American industry. Princeton, N.J.:
Princeton University Press
Grabowski, H., 1968. The determinants of industrial research and development: A study
of chemical, drug, and petroleum industries. Journal of Political Economy, 76,
292-306
Granstrand, O., 1999. The economics and management of intellectual property. Towards
Intellectual capitalism. Cheltenham UK and Northampton, MA: Edward Elgar.
Granstrand, O., 1998. Towards a theory of the technology-based firm. Research Policy
25 (5), 467-491.
Granstrand, O., Patel, P. and Pavitt K., 1997. Multitechnology corporations: Why they
have “distributed” rather than “distinctive core” competencies. California
Management Review, 39, 4, pp. 8-25
Hall, B., 1992. Research and development at the firm level: Does the source of
financing matter?, NBER Working Paper 4096.
25

Hall, B., Mairesse, J., Branstetter, L, and Crepon, B., 1999. Does cash flow cause
investment and R&D: An exploration using panel data for French, Japanese, and
United States firms in the Scientific sector, in D. Audretsch and A. Thurik (eds),
Innovation, Industry Evolution and Employment, Cambridge, Cambridge
University Press.
Hall, B. H., A. B. Jaffe, and Tratjenberg M., 2001. The NBER Patent Citation Data File:
Lessons, Insights and Methodological Tools. NBER Working Paper 8498.
Hall, B., 2002a. A Note on the Bias in the Herfindahl Based on Count Data. in Jaffe, A.
and M. Trajtenberg (eds.), Patents, Citations, and Innovation, MIT Press.
Hall, B., 2002b. The financing of research and development. Oxford Review of
Economic Policy, 18, no. 1, 35-51.
Heeley, M. and Matusik, S. 2004. Corporate scope and knowledge creation. The effect
of technological diversity on firm platform and incremental inventive output.
Mineo.
IPC classification (7th edition) at: http://www.wipo.int/classifications/fulltext/new\_ipc
Jaffe, A., 1986. Technological opportunity and spillovers of R&D: evidence from firm's
patents, profits and market value. American Economic Review, 76, No. 5. 986-
1001
Leland, H. and Pyle, D., 1997. Informal asymmetries, financial structure, and financial
intermediation. Journal of finance, 32, 371-87
Mansfield, E. and Wagner, S., 1977. The production and application of new industrial
technology. New York. Norton.
26
Mulkay, B., Hall, B. and Mairesse, J., 2001. Firm level investment and R&D in France
and the United States: A comparison. NBER Working Paper 8038.
Nelson, R., 1959. The simple economics of basic scientific research. Journal of Political
Economy, 67: 297-306.
Nesta, L. and Saviotti, P., 2004. Coherence of the knowledge base and firm innovative
performance: Evidence from the US. Pharmaceutical industry. SPRU Working
Paper 113.
Pavitt, K., Robson, M., Townsend, J., 1989. Accumulation, diversification and
organisation of technological activities in UK companies, 1945-1983. In M.
Dodgson (Ed.) Technology Strategy and the Firm: Management and Public
Policy. Harlow: Longman
Piscitello, L., 2000. Relatedness and coherence in technological and product
diversification of the world’s largest firms. Structural Change and Economic
Dynamics, 11, 295-288.
Rajan, R., Servaes, H. and Zingales, L., 1998. The cost of diversity: the diversification
discount and inefficient investment. NBER Working Paper 6368
Sakakibara, M., 2001. The diversity of R&D consortia and firm behaviour: evidence
from Japanese data. The Journal of Industrial Economics Vol. XLIX, No. 2, 181-
196.
Scherer, F., 1984. Corporative size, diversification, innovative activity. In Innovation
and growth. Cambridge MA, MIT Press
Scherer, F., 1999. New perspectives on economics growth and technological innovation.
Brookings Institution Press, Washington D.C.
27
Schumpeter, J., 1942. Capitalism, socialism, and democracy. New York, Harper &
Row.
Suzuki J. and Kodama, F., 2004. Technological diversity of persistent innovators in
Japan. Two case studies of large Japanese firms. Research Policy, 33, 531-549.
Teece, D., 1980. Economies of Scope and the Scope of the Enterprise. Journal of
Economic Behaviour and Organization, 1:3, 223-247
Teece, D., Rumelt, G., Dosi, G. and Winter, W., 1994. Understanding corporate
coherence: Theory and evidence. Journal of Economic Behaviour and
Organization, 22 1-30.
US to IPC concordance at: http://www.uspto.gov/go/classification
Tirole, J., 1988. The theory of industrial organization. Cambridge, MIT Press.
Veugelers, R., 1997. Internal R&D expenditures and external technology sourcing.
Research Policy, 26, 303-315.
World Intellectual Property Organization (WIPO) at: http://www.wipo.int
Zander, I., 1997. Technological diversification in the multinational corporation-
historical evolution and future prospects. Research Policy, 26, 209-227.
28
TABLES AND FIGURES
Table 1
Comparison of average R&D spending and sales by industry (period 1995-200).In millions of U.S. Dollars.
Industry No. of firms in the sample Averageall firms % over total Sales max sales R&D max R&D R&D/Sales
1 Chemicals and oil, gas, coal, and related services 63 12% 14866 751445 993 107953 7%2 Electronics 104 19% 2354 73894 188 5445 8%3 Drugs, cosmetics and health care 43 8% 2051 17690 223 2753 11%4 Construction 31 6% 1443 15517 24 560 2%5 Recreation 13 2% 1785 8657 29 299 2%6 Metal product manufacturers and metal producers 32 6% 2474 15989 27 207 1%7 Machinery and equipment 62 11% 1267 10245 59 1412 5%8 Food, beverages and tabacco 36 7% 5598 57404 76 1119 1%9 Automotive 22 4% 21345 154429 913 5973 4%
10 Utilities 28 5% 8036 46024 116 1037 1%11 Electrical 20 4% 2447 17312 65 894 3%12 Textiles 10 2% 595 4204 4 17 1%13 Transportation, aerospace 10 2% 3969 14855 178 1473 4%14 Others: paper, printing and publishing 59 11% 2803 27154 32 482 1%15 Professional and scientific instruments 11 2% 393 3566 23 235 6%
Total 544
29

Table 2
Comparison of average R&D spending and sales by country.
No. of firms Sales R&D R&D/SalesFrance 56 11840 1108 5%Germany 70 10653 504 6%Greece 13 167 2 2%Italy 23 8133 175 4%Spain 2 206 8 4%Sweden 27 3966 214 7%UK 253 2400 48 4%Lux 1 943 0 0%Netherlands 23 10814 257 7%Finland 39 2008 57 3%Austria 10 1551 21 2%Belgium 6 3267 133 3%Denmark 10 870 62 7%Ireland 11 1261 18 3%Average 4148 186
30

Table 3
Comparison of average R&D spending and sales by industry, for firms that patent (period 1995-2000).In millions of U.S. Dollars.
Industry No. of firms Sales R&D R&D/Sales
1 Chemicals and oil, gas, coal, and related services 47 17170 1307 8%2 Electronics 65 1984 174 9%3 Drugs, cosmetics and health care 35 2508 273 11%4 Construction 22 1617 31 2%5 Recreation 7 1753 40 2%6 Metal product manufacturers, and metal producers 19 3102 37 1%7 Machinery and equipment 51 1260 69 6%8 Food, beverages and tabacco 21 8318 126 2%9 Automotive 19 23722 1012 4%
10 Utilities 16 11152 167 2%11 Electrical 17 2764 75 3%12 Textiles 5 724 4 1%13 Transportation, aerospace 7 4903 242 5%14 Others: paper, printing, and publishing 42 3284 41 1%15 Professional and scientific instruments 8 419 23 6%
Total 381
31
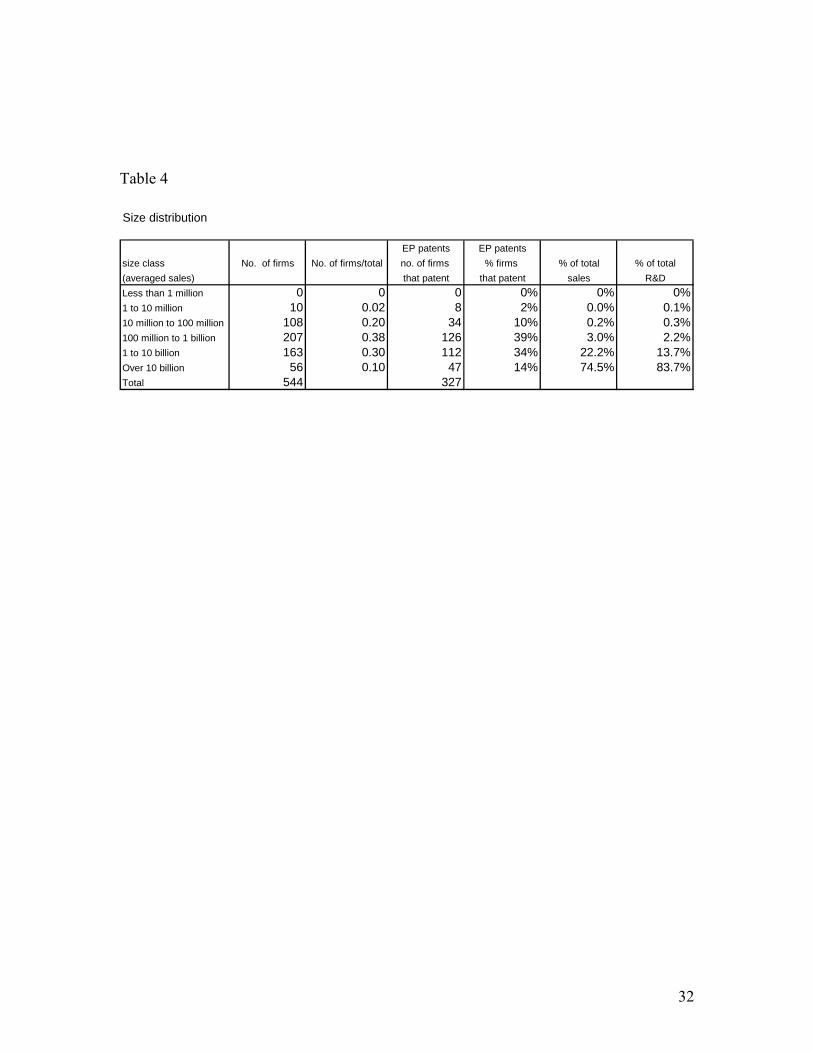
Table 4
Size distribution
EP patents EP patentssize class No. of firms No. of firms/total no. of firms % firms % of total % of total(averaged sales) that patent that patent sales R&DLess than 1 million 0 0 0 0% 0%1 to 10 million 10 0.02 8 2% 0.0% 0.1%10 million to 100 million 108 0.20 34 10% 0.2% 0.3%100 million to 1 billion 207 0.38 126 39% 3.0% 2.2%1 to 10 billion 163 0.30 112 34% 22.2% 13.7%Over 10 billion 56 0.10 47 14% 74.5% 83.7%Total 544 327
0%
32
OLS estimation of the R&D intensity determinantst-statistics in italicsAll regressions include country and industry dummiesDependent variable: R&D/sales
(i) (ii) (iii) (iv) (v) (vi) (vii) (viii) (ix) (x) (xi) (xii) (xiii) (xiv)log sales -0.12 -1.79 -0.15 -1.96 -0.09 -0.20 -0.17 -1.62 -0.09 -0.12 -0.07 -0.18 -0.16 -1.61
-5.56 -11.95 -6.74 -12.24 -1.90 -5.37 -4.74 -9.52 -4.48 -5.74 -1.46 -4.88 -4.27 -9.43log sales^2 0.14 0.15 0.12 0.12
11.27 11.41 8.68 8.70debt1 -0.32 -0.26 -0.31 -0.27 -0.33 -0.32 -0.28
-7.00 -6.02 -6.73 -6.10 -7.14 -6.80 -6.15debt2 0.01 0.21 -0.01
0.10 2.47 -0.07 cash1/sales 0.04 0.05
1.00 1.07 cash2/sales 0.09 0.10 0.08 0.09 0.11 0.08
2.63 3.19 2.56 2.71 3.27 2.63diversity 0.24 0.22 0.25 0.24 0.25 0.23 0.21 0.20
4.72 4.56 4.68 4.89 4.78 4.19 3.99 3.99 adjusted 0.11 0.12 0.13 0.12 0.11 0.11diversity 2.71 2.71 3.01 2.65 2.50 2.56constant -0.82 4.19 -0.80 4.66 -1.10 -0.79 -0.89 3.55 -0.98 -0.95 -1.24 -0.91 -1.01 3.47R-squared 0.51 0.57 0.48 0.54 0.48 0.5 0.53 0.57 0.5 0.47 0.48 0.49 0.52 0.56adjusted R-sq 0.49 0.55 0.46 0.53 0.47 0.48 0.51 0.55 0.49 0.45 0.46 0.47 0.5 0.55sample 965 965 950 950 811 810 810 810 965 950 811 810 810 810debt1=total current liabilities/total current assetsdebt2=total liabilities/(total liabilities+equity)diversity is a year-variable for any firmcash1 is log of operating cash flowcash2 is log of total cash flow
Table 5
33
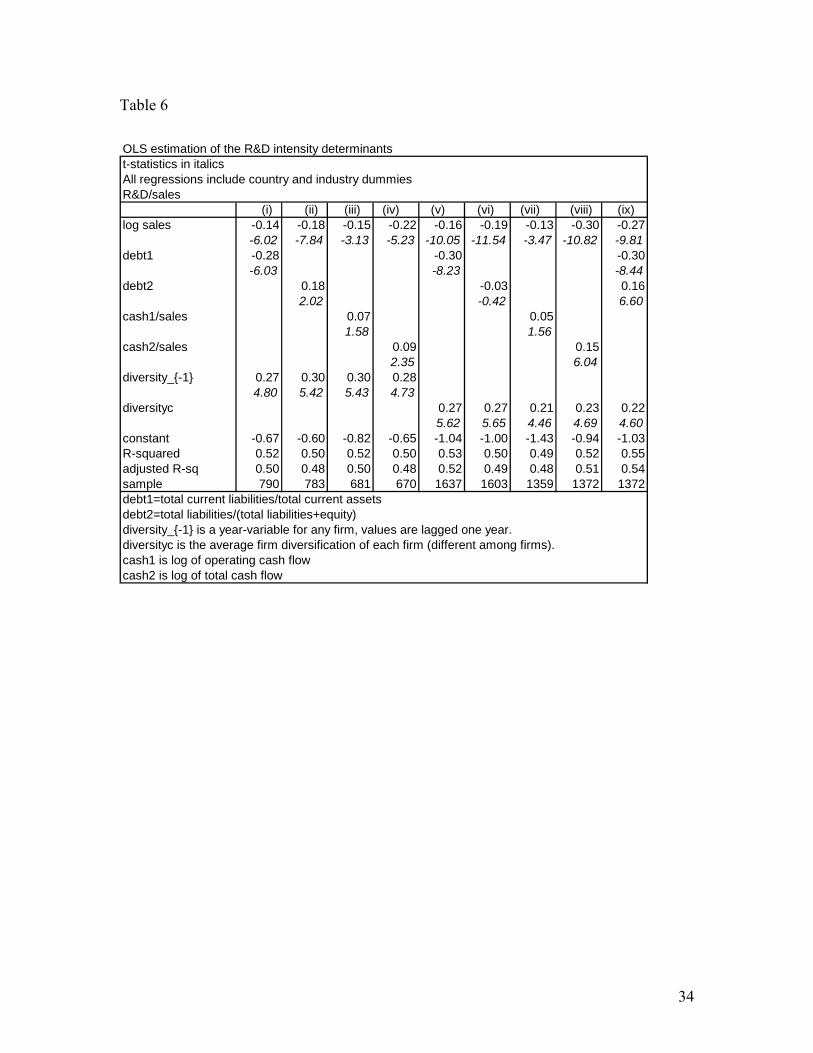
Table 6
OLS estimation of the R&D intensity determinantst-statistics in italicsAll regressions include country and industry dummiesR&D/sales
(i) (ii) (iii) (iv) (v) (vi) (vii) (viii) (ix) log sales -0.14 -0.18 -0.15 -0.22 -0.16 -0.19 -0.13 -0.30 -0.27
-6.02 -7.84 -3.13 -5.23 -10.05 -11.54 -3.47 -10.82 -9.81debt1 -0.28 -0.30 -0.30
-6.03 -8.23 -8.44debt2 0.18 -0.03 0.16
2.02 -0.42 6.60cash1/sales 0.07 0.05
1.58 1.56cash2/sales 0.09 0.15
2.35 6.04diversity_{-1} 0.27 0.30 0.30 0.28
4.80 5.42 5.43 4.73diversityc 0.27 0.27 0.21 0.23 0.22 5.62 5.65 4.46 4.69 4.60constant -0.67 -0.60 -0.82 -0.65 -1.04 -1.00 -1.43 -0.94 -1.03R-squared 0.52 0.50 0.52 0.50 0.53 0.50 0.49 0.52 0.55adjusted R-sq 0.50 0.48 0.50 0.48 0.52 0.49 0.48 0.51 0.54sample 790 783 681 670 1637 1603 1359 1372 1372debt1=total current liabilities/total current assetsdebt2=total liabilities/(total liabilities+equity)diversity_{-1} is a year-variable for any firm, values are lagged one year.diversityc is the average firm diversification of each firm (different among firms).cash1 is log of operating cash flowcash2 is log of total cash flow
34
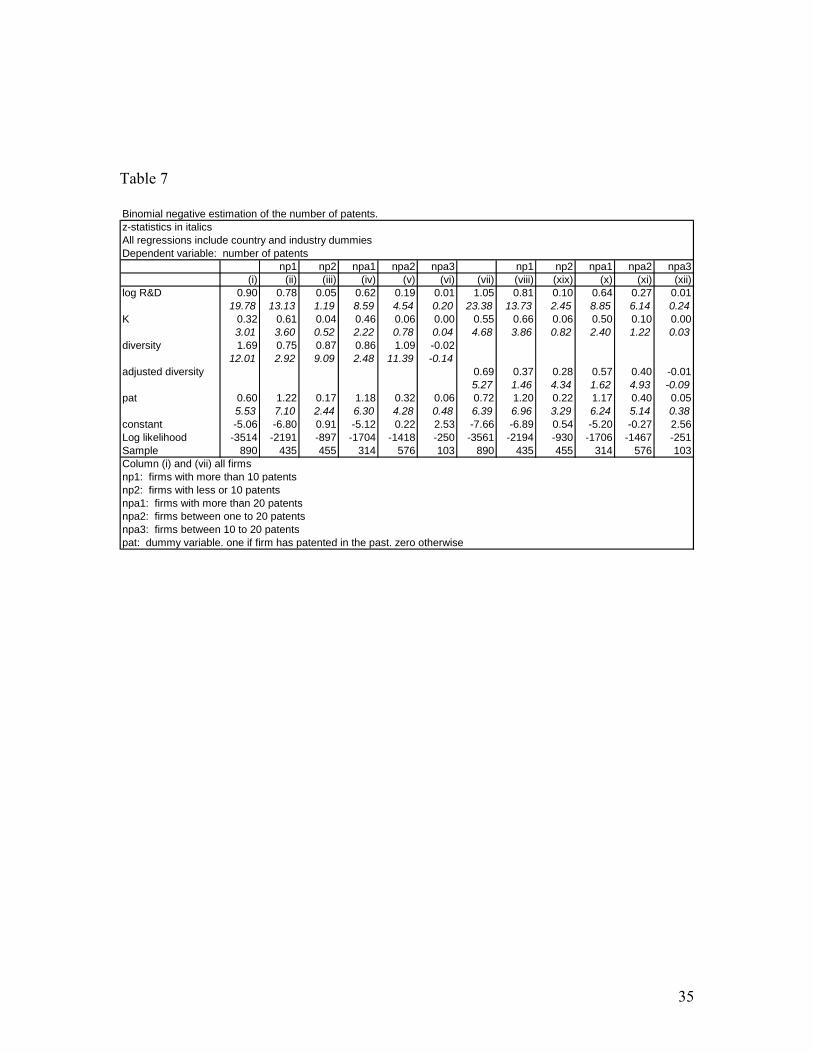
Table 7
Binomial negative estimation of the number of patents. z-statistics in italicsAll regressions include country and industry dummies Dependent variable: number of patents
np1 np2 npa1 npa2 npa3 np1 np2 npa1 npa2 npa3 (i) (ii) (iii) (iv) (v) (vi) (vii) (viii) (xix) (x) (xi) (xii)
log R&D 0.90 0.78 0.05 0.62 0.19 0.01 1.05 0.81 0.10 0.64 0.27 0.0119.78 13.13 1.19 8.59 4.54 0.20 23.38 13.73 2.45 8.85 6.14 0.24
K 0.32 0.61 0.04 0.46 0.06 0.00 0.55 0.66 0.06 0.50 0.10 0.003.01 3.60 0.52 2.22 0.78 0.04 4.68 3.86 0.82 2.40 1.22 0.03
diversity 1.69 0.75 0.87 0.86 1.09 -0.0212.01 2.92 9.09 2.48 11.39 -0.14
adjusted diversity 0.69 0.37 0.28 0.57 0.40 -0.01 5.27 1.46 4.34 1.62 4.93 -0.09
pat 0.60 1.22 0.17 1.18 0.32 0.06 0.72 1.20 0.22 1.17 0.40 0.055.53 7.10 2.44 6.30 4.28 0.48 6.39 6.96 3.29 6.24 5.14 0.38
constant -5.06 -6.80 0.91 -5.12 0.22 2.53 -7.66 -6.89 0.54 -5.20 -0.27 2.56Log likelihood -3514 -2191 -897 -1704 -1418 -250 -3561 -2194 -930 -1706 -1467 -251Sample 890 435 455 314 576 103 890 435 455 314 576 103Column (i) and (vii) all firms np1: firms with more than 10 patents np2: firms with less or 10 patents npa1: firms with more than 20 patents npa2: firms between one to 20 patents npa3: firms between 10 to 20 patents pat: dummy variable. one if firm has patented in the past. zero otherwise
35
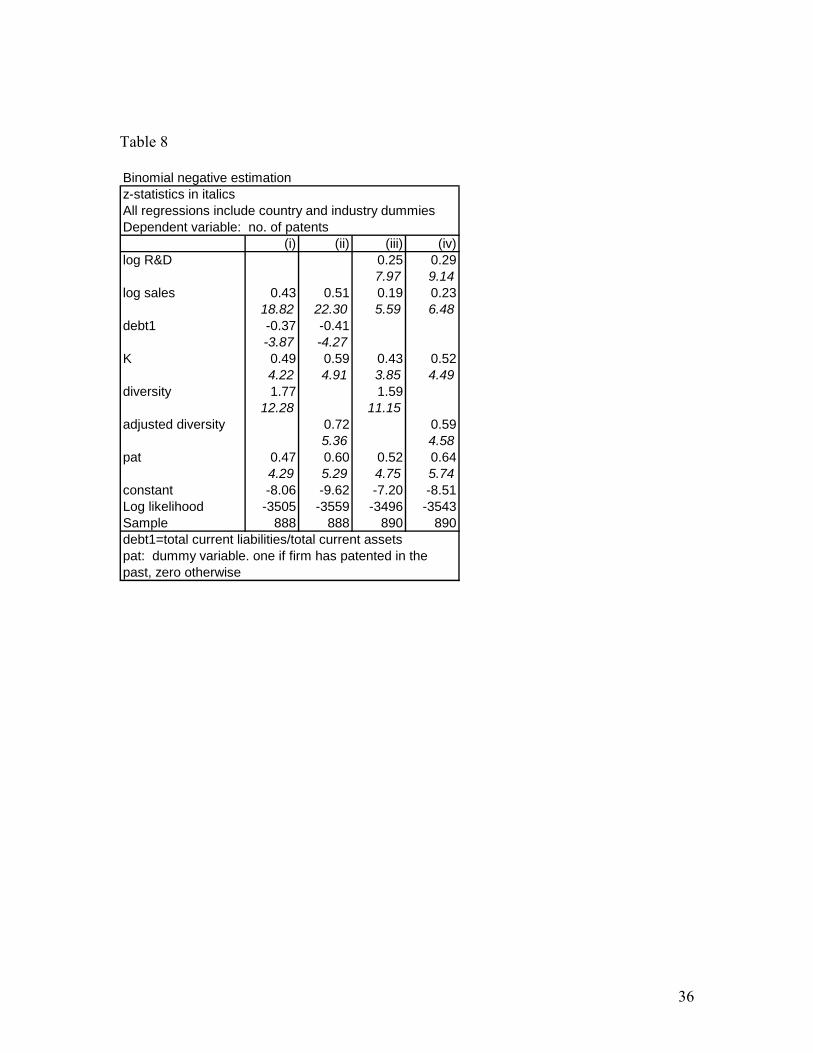
Table 8
Binomial negative estimation z-statistics in italicsAll regressions include country and industry dummiesDependent variable: no. of patents
(i) (ii) (iii) (iv) log R&D 0.25 0.29
7.97 9.14log sales 0.43 0.51 0.19 0.23 18.82 22.30 5.59 6.48debt1 -0.37 -0.41
-3.87 -4.27K 0.49 0.59 0.43 0.52
4.22 4.91 3.85 4.49diversity 1.77 1.59
12.28 11.15 adjusted diversity 0.72 0.59
5.36 4.58pat 0.47 0.60 0.52 0.64
4.29 5.29 4.75 5.74constant -8.06 -9.62 -7.20 -8.51Log likelihood -3505 -3559 -3496 -3543Sample 888 888 890 890debt1=total current liabilities/total current assetspat: dummy variable. one if firm has patented in the past, zero otherwise
36
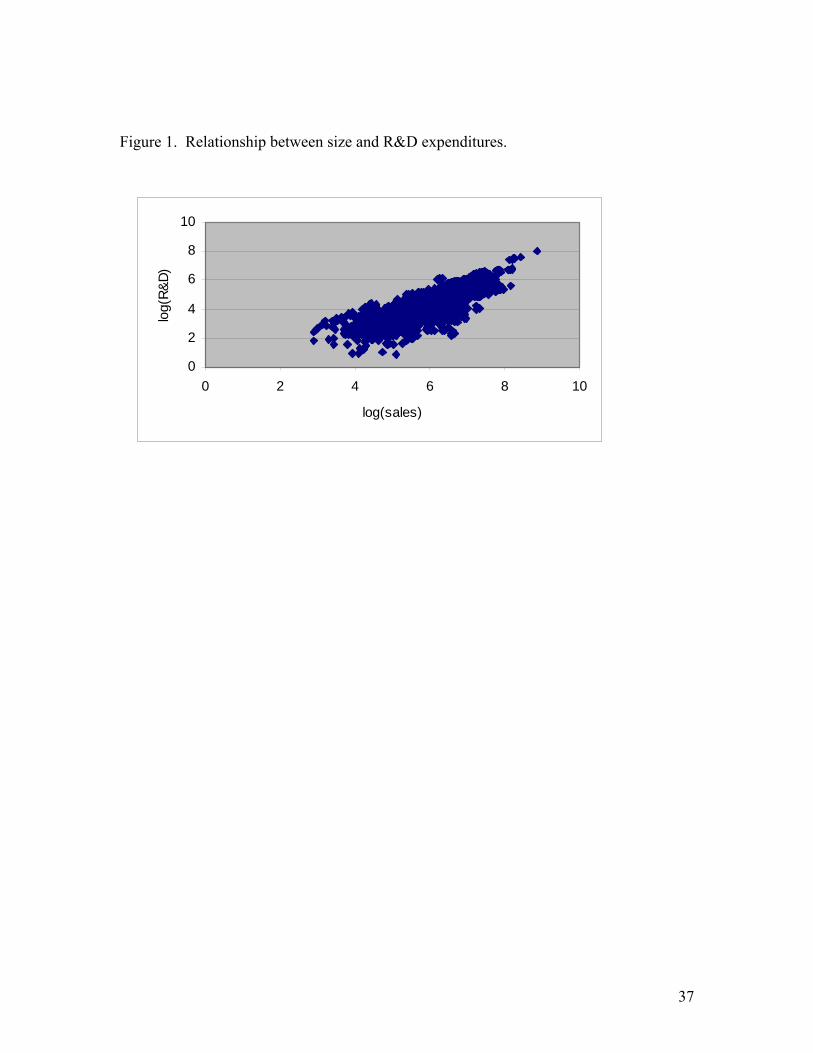
Figure 1. Relationship between size and R&D expenditures.
0
2
4
6
8
10
0 2 4 6 8 1
log(sales)
log(
R&D)
0
37

38
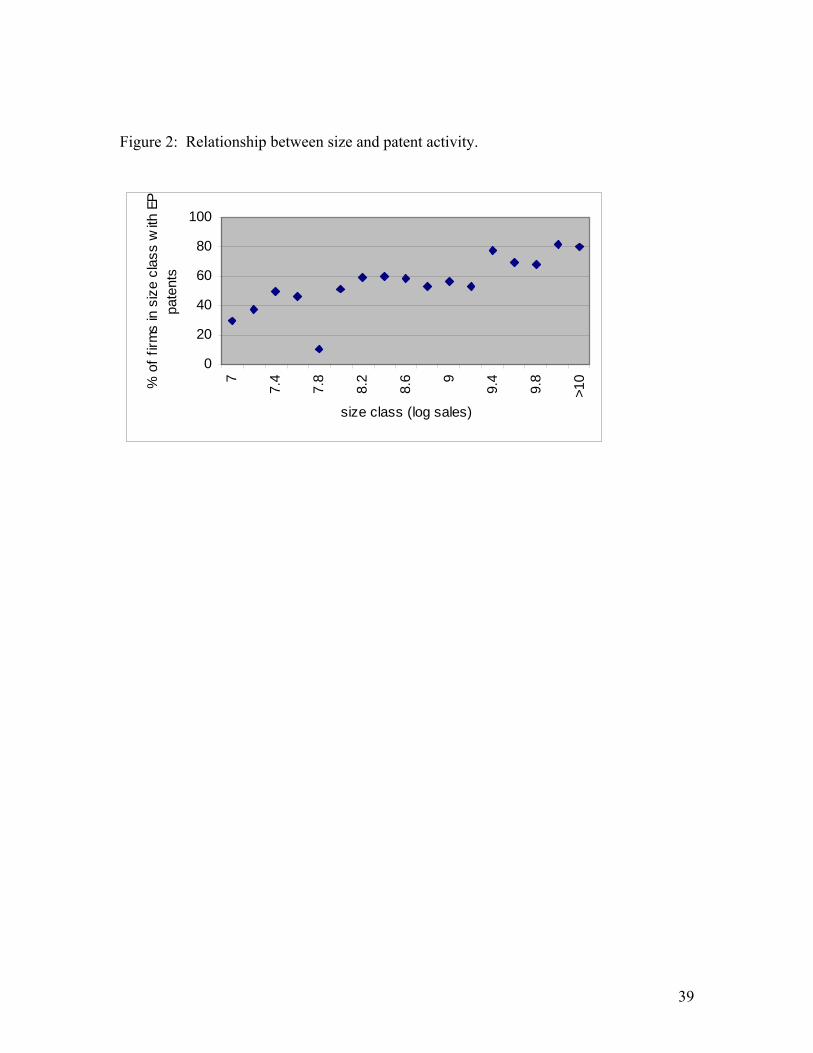
Figure 2: Relationship between size and patent activity.
0
20
40
60
80
1007
7.4
7.8
8.2
8.6 9
9.4
9.8
>10
size class (log sales)
% o
f firm
s in
siz
e cl
ass
with
EP
pate
nts
39

APPENDIX
Table A.1.
Technological fields1 Coating (chemicals) 26 Motors, Engines and Parts 2 Gas 27 Optics 3 Organic compounds 28 Transportation 4 Resins 29 Cycles 5 Explosives and matches 30 Working plastic and non-metalic articles6 Glass, mineral or slag wool 31 Weapons (mechanical) 7 General chemical 32 Checking-devices 8 Agriculture (chemicals) 33 Husbandry Agriculture9 Food (chemicals) 34 Food
10 Metallurgy 35 Amusement Devices 11 Communications 36 Textile Appareil 12 Computer Hardware and Software 37 Earth Working and Wells 13 Drugs and Perfumes 38 Furniture, House Fixtures 14 Surgery and Medical Instruments 39 Heating, ventilation and refrigeration 15 Biotechnology 40 Constructions of roads railways and bridges 16 Electrical devices 41 Receptacles Luggages 17 Electrical Lighting 42 Printing and books decoratives arts 18 Measuring and Testing 43 Saddlery upholstery 19 Nuclear and X-Rays 44 Measuring and testing 20 Power Systems 45 Music 21 Semi conductor Devices 46 Treatement of water and solid waste 23 Materials Processing and Handling 47 Cleaning 24 Abrading 48 Performing operations 25 Metal Working 49 Others
40