does student loan debt deter higher education .... callender and mason.pdf · does student loan...
TRANSCRIPT
Does student loan debt deter Higher Education participation? New evidence from England
Claire Callender and Geoff Mason
LLAKES Research Paper 58
Centre for Learning and Life Chances in Knowledge Economies and Societies LLAKES is an ESRC-funded Research Centre - grant reference ES/J019135/1. To request printed copies of this paper or other LLAKES Research Papers, please contact the LLAKES Centre - [email protected]. To view this and other LLAKES Research Papers online, please visit www.llakes.ac.uk. This is a pre-publication version of: Callender, C. and Mason, G. (2017) “Does student loan debt deter Higher Education participation? New evidence from England”, Annals of American Political and Social Science, 671 (1): 20-48, DOI: 10.1177/0002716217696041
This paper may be cited or briefly quoted in line with the usual academic conventions, and for personal use. However, this paper must not be published elsewhere (such as mailing lists, bulletin boards etc.) without the authors’ explicit permission. If you copy this paper, you must: • include this copyright note.• not use the paper for commercial purposes or gain in any way.• observe the conventions of academic citation in a version of the following: Callender, C. and Mason, G. (2017) Does student loan debt deter Higher Education participation? New evidence from England, published by the Centre for Learning and Life Chances in Knowledge Economies and Societies at: http://www.llakes.ac.uk
Does student loan debt deter higher
education participation? New evidence
from England1
Claire Callender* and Geoff Mason**
*Professor of Higher Education Policy, Birkbeck and UCL Institute of Education, London
26 Russell Square, London WC1B 5DQ +44 7984 419747, [email protected]
** Visiting Professor, Centre for Research on Learning and Life Chances (LLAKES), UCL Institute
of Education, London
Centre for Learning and Life Chances in Knowledge Economies and Societies (LLAKES)

1
List of Contents
Abstract ................................................................................................................................................ 2
Introduction .......................................................................................................................................... 3
The shifting higher education landscape .............................................................................................. 4
Student funding policy changes 2002-2015 ..................................................................................... 4
Higher education participation in England and student funding ...................................................... 6
Student attitudes to debt and higher education participation: Theory, empirical evidence and
hypotheses ............................................................................................................................................ 7
Debt aversion: Conceptual and measurement issues ........................................................................ 7
Prospective students’ attitudes toward debt ..................................................................................... 9
Conceptual framework and hypotheses ............................................................................................. 11
Research methods .............................................................................................................................. 12
Index of social advantage ............................................................................................................... 14
Debt averse attitudes ...................................................................................................................... 15
Data analysis................................................................................................................................... 16
Findings .............................................................................................................................................. 17
Changes in student attitudes to debt ............................................................................................... 17
Debt aversion and social class ........................................................................................................ 19
Higher education participation and social class ............................................................................. 22
Discussion and conclusions ............................................................................................................... 27
APPENDIX A: STATISTICAL TABLES ........................................................................................ 31
References .......................................................................................................................................... 34
Endnotes ............................................................................................................................................. 39
List of Tables
Table 1: Student samples by type of educational institution, 17-21 year olds in England, 2002
and 2015 ............................................................................................................................................. 14
Table 2: Social advantage index by social class and type of educational institution (population-
weighted) ............................................................................................................................................ 15
Table 3: Extent of agreement with statements regarding debt, 17-21 year old students in
England, 2002 and 2015 (population-weighted) ................................................................................ 16
Table 4: Extent of agreement with statements regarding student loan debt, 17-21 year old students
in England, 2002 and 2015 (population-weighted) ............................................................................ 18
Table 5: OLS estimates of debt aversion: 17-21 year old students in England, 2002 and 2015 ....... 20
2
Table 6: Probit estimates of higher education participation: 17-21 year old students in
England, 2002 and 2015 - Marginal effects (evaluated at sample means) – Using occupation-
based indicator of social class ............................................................................................................ 24
Table 7: Probit estimates of higher education participation: 17-21 year old students in England,
2002 and 2015 - Marginal effects (evaluated at sample means) – Using index of social
disadvantage ....................................................................................................................................... 25
Table A1: National profiles of students aged 17-21 studying for university entry-level
qualifications, England, analysed by type of educational institution and type of qualification,
2002 and 2015 .................................................................................................................................... 31
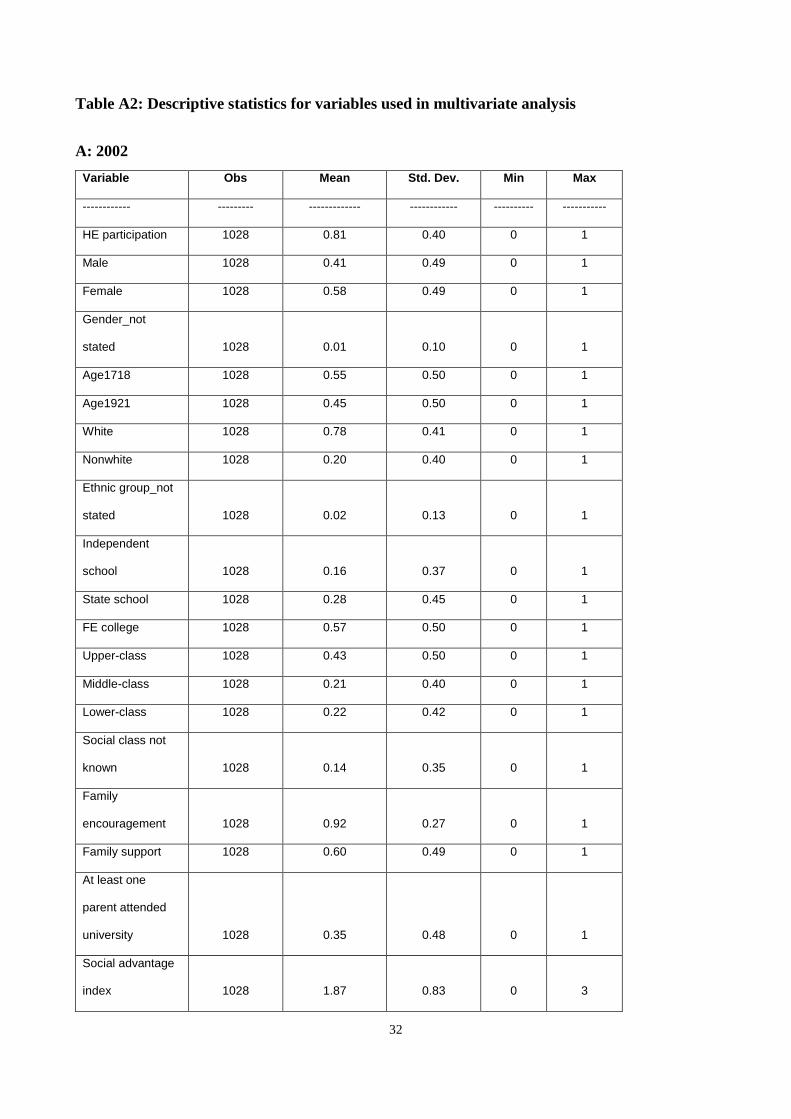
Table A2: Descriptive statistics for variables used in multivariate analysis ...................................... 32
A: 2002 ........................................................................................................................................... 32
B: 2015 ........................................................................................................................................... 33
Abstract
Research among prospective UK undergraduates in 2002 found that some students, especially from
low social classes, were deterred from applying to university because of fear of debt. This paper
investigates whether this is still the case today in England despite the changing higher education
landscape since 2002. The paper describes findings from a 2015 survey of prospective
undergraduates and compares them with those from the 2002 study. We find that students’ attitudes
to taking on student loan debt are more favorable in 2015 than in 2002. Debt averse attitudes
remain much stronger among lower-class students than among upper-class students, and more so
than in 2002. However, lower-class students did not have stronger debt averse attitudes than
middle-class students. Debt averse attitudes seem more likely to deter planned higher education
participation among lower-class students in 2015 than in 2002.
Key words
Student debt, debt aversion, loan aversion, higher education, student funding
3
Introduction
Research conducted in 2002 among prospective UK undergraduates found that some students,
especially from low social classes, were deterred from applying to university because of their fear
of debt (Callender and Jackson 2005). This paper investigates whether this is still the case in
England. The paper compares findings from a 2015 survey of prospective undergraduates with
those from the 2002 study. The paper considers whether prospective students’ attitudes toward
student loan debt have changed since 2002, in the light of radical higher education (HE) funding
policy reforms and changing political and ideological contexts, and how students’ attitudes may
contribute to differences across social classes in their intention to participate in higher education.
This paper focuses exclusively on potential full-time undergraduates attending ‘public’ universities
in England and the policies affecting them.2 The lessons learned may be more far-reaching, with
likely relevance for countries with cost-sharing policies such as the United States where student
loan take-up and debt have risen and income-driven repayment plans have emerged on the policy
agenda (College Board 2015, Carey 2015). This research is also significant because prospective
higher education students’ attitudes towards student loan debt are not well understood while
existing research is limited. For instance, many UK and US studies on loan aversion are conducted
among current students (e.g. Bachan 2014; Burdman 2005; Goldrick-Rab and Kelchen 2015;
Harrison et al 2015a; 2015b) so can tell us nothing about how student debt influences prospective
students’ decisions regarding higher education. The most comprehensive UK studies exploring
prospective students’ attitudes towards debt and higher education participation are based on data
which are at least a decade old (Davies and Lea 1995; Callender and Jackson 2005; Bates et al
2009). Since these studies were undertaken student funding policies have changed dramatically and
debt has risen sharply bringing into question the findings’ relevance for today’s students and public
policy. Now most students in England have to borrow if they want to enter higher education.
Moreover, this paper exploits a unique dataset derived from a survey of prospective students in
2002 and another in 2015, allowing us to examine changes in students’ attitudes to debt over time
and the role played by these policy reforms and shifting political and ideological contexts. This is
central for understanding the continuing socio-economic inequalities in access to higher education.
4
The shifting higher education landscape
This section discusses the shifting higher education policy landscape including changes in student
funding between 2002 and 2015 and implications for student debt.
Student funding policy changes 2002-2015
The evolution of higher education funding systems, in England and elsewhere, is dominated by
prevailing political and ideological currents, rather than purely economic and pragmatic
considerations. Recently England, like many countries, has moved from a system where the costs of
funding higher education are shouldered primarily by taxpayers, through government subsidies, to
one where students pay a larger share. This cost-sharing approach, a global phenomenon, seeks to
increase the total resources available to higher education, especially from non-governmental or
private sources (McMahon 2009; Johnstone and Marcucci 2010).3
A series of cost-sharing policies occurred between 2002 and 2015 in England. First, there were
large tuition fee increases. The government-set cap on tuition fees rose from £1,000 ($1,296)4 a
year in 1998 to £3,000 ($3,890) in 2006/7, and to £9,000 ($11,664) in 2012/13 (current prices). By
2016, all universities, except one, charged £9,000 for all their courses. Only Further Education (FE)
colleges charged less (OFFA 2015). Any competitive advantage of charging lower tuition fees was
outweighed by the benefits of higher tuition income.
Second, in 2006/7, government-subsidised income-contingent student loans were extended to cover
all students’ tuition fees – making tuition rises more politically and socially acceptable. Graduates
start repaying these loans once their income reaches a specified threshold, currently £21,000.5
Graduates pay nine percent of earnings above this threshold until they have repaid their loan, with
any outstanding debt forgiven after 30 years. Repayments are taken directly from the graduate’s
salary through the tax system. In 2006/07, the interest paid was equal to inflation (RPI) or, the Bank
of England base rate plus 1 percent, whichever was lower (in effect, a zero or negative real interest
rate). In 2012/13, a real interest rate was charged, between inflation and inflation plus 3 percent,
with a sliding scale dependent on a graduate’s annual earnings, making the costs of borrowing more
expensive but reducing government costs.
Third, means-tested government grants for low-income students’ living costs were replaced with
enhancements to pre-existing government-financed maintenance loans, available to all students and
with the same repayment terms and conditions as tuition loans. Since 2002 these grants have been
5
reduced in value, frozen and eroded by inflation, restricted in eligibility, and between 1998 and
2004 abolished completely.
These policy developments have been informed by a strengthening of the cost sharing ideology of
‘who benefits pays,’ and a quest for the greater marketization of higher education with tuition fees
and loans playing central roles (Callender and Scott 2013). Higher tuition fees and loans are
justified, following human capital theory, by a view of higher education participation as a private
investment for private returns – benefiting the individual more than society. Tuition fee increases
and loans have been portrayed by successive governments as ‘fair’ (DfEE 1998; DfES 2003, 83;
DBIS 2011, 17) because graduates usually benefit from better paid employment (NCIHE 1997, 288;
DfES 2003, 2). The 2011 White Paper informing the £9,000 tuition fees increase asserted
‘...graduates…earn more than non-graduates… So it is fairer to finance the system by expecting
graduates to pay, if and when they are in better paid jobs’ (DBIS 2011, 17). The Paper also argued
that income-contingent tuition loans make higher education affordable and free at the point of entry,
while credit and liquidity constraints are removed (DBIS 2011, 16). The costs of borrowing are
depicted as reasonable, and loan repayments ‘more affordable for everyone’ (DBIS 2011, 24), while
extra support is available for the poorest students - allegedly safeguarding widening participation
(DfES 2003, 2; DBIS 2011, 24). These messages were promoted to potential higher education
students when tuition fees were increased in 2006/7 and 2012/13. Students may have internalized
this policy discourse of a positive graduate salary premium and the ‘risk-free’ nature of income-
contingent loan repayments.
Following these policy changes students became heavily reliant on loans to fund their higher
education studies. By 2013/14, 92 percent of students had taken out a loan for tuition and 89 percent
for maintenance (SLC 2015), suggesting that most cannot afford to study unless they are willing to
borrow. Between 2002 and 2015, tuition fees rose by 553 percent after allowing for consumer price
inflation during this period. Average student loan debt (both tuition and maintenance) on graduation
rose from £8,666 ($11,180) (2002 prices) (Callender and Wilkinson 2003) to £44,035 ($57,211)
(2014 prices) (Crawford and Jin 2014, 2), representing an increase of 260 percent after allowing for
inflation. Under current arrangements, it will take graduates about 28 years to clear these debts,
while the majority will never repay their loans in full (Crawford and Jin 2014).
6
Higher education participation in England and student funding
These policy changes occurred alongside a government commitment to higher education expansion,
with a stated desire to widen access. Despite these increases in tuition fees and prospective debt
burdens, higher education participation rates for 17 to 20 year olds in England began rising
gradually from 2007, reaching 38 percent in 2010. A sudden jump to 42 percent occurred in 2011,
as applicants tried to avoid the planned tuition fee increase in 2012, followed by a sharp drop to 36
percent in 2012/13, and then a climb back to 41 percent in 2014/15 (DfE 2016).
There are considerable socio-economic differences in these participation rates. Rates for low-
income students have increased recently, albeit from a low base. Data on university acceptances
indicate that 18 year olds from disadvantaged areas are 65 percent more likely to enter higher
education in 2015 than in 2006. But, they remain two and half times less likely to enter higher
education than their more advantaged peers, and eight and a half times less likely to enroll in the
most selective universities (UCAS 2015, 92; 99). This growth in enrollments is consistent with
recent improvements, also from a low base, in national examination attainment of low-income
students at aged 16 (SMCPC 2015), confirming the important contribution of prior educational
achievement to explaining higher education participation patterns.
Higher education participation rates also are lower for men than women (37 percent compared with
46 percent in 2013/14, (DfE 2016), and among White students than minority ethnic groups. In 2015,
higher education entry rates ranged from 28 percent for Whites to 37 percent for Blacks and 41
percent for Asians, rising to 58 percent for Chinese students (UCAS 2015, 12).
Research confirms that money matters for higher education access and lower-income students are
more price-sensitive (Leslie and Brinkman 1987; Heller 1997). Tuition fee rises tend to depress
higher education participation, especially among disadvantaged groups, but the type and mix of aid
is important (for a review of the literature see Baum et al. 2008; London Economics 2010; Long
2008; Dynarski and Scott-Clayton 2013). However, research findings are contradictory with some
evidence that neither tuition increases nor the introduction of income-contingent loans affect
enrollments, especially among students from disadvantaged backgrounds with appropriate
university-entry qualifications (Hemelt and Marcotte 2011; Cardak and Ryan 2009).
In England, the introduction of £1,000 tuition fees and the replacement of student grants with loans
for maintenance in 1998 had no effect on young people’s participation (HEFCE 2005). Dearden et
al. (2010) show “upfront tuition fees in 1998 had a small negative impact on participation among
7
high income groups” but the rise in tuition fees to £3,000 in 2006 had “no impact on participation,
largely because tuition fees were accompanied by large increases in loans and grants” (2).
Crawford and Dearden (2010) find that some English students, especially those from higher socio-
economic backgrounds and with higher grades, started university a year earlier (2005/06) than they
might otherwise have done (2006/07) to avoid having to pay higher tuition fees. However, overall,
there was no evidence that the 2006/07 finance reforms led to a sustained fall in higher education
participation.
No similar analysis has yet been undertaken exploring the consequences of the tuition fee rise to
£9,000 in 2012/13. Chowdry et al (2012) warn that debt aversion might affect participation,
especially among students from the poorest backgrounds.
Student attitudes to debt and higher education participation: Theory, empirical evidence and
hypotheses
This section examines how extant research conceptualizes and measures student debt aversion and
explores student attitudes to debt. It then provides a conceptual framework for analyzing these
attitudes and posits three hypotheses to be tested.
Debt aversion: Conceptual and measurement issues
Debt aversion (sometimes called loan aversion) is a reluctance to incur debt and refers to the
psychological costs associated with carrying debt, in addition to any explicit costs and risks
associated with taking out loans (Baum and Schwartz 2013). Debt aversion can be distinguished
from risk aversion which covers a wide range of life-contexts (e.g., personal safety, health and
career progress) and is not confined to financial choices such as borrowing (Dohmen et al. 2011).
Debt aversion in relation to higher education has been defined as “an unwillingness to take a loan to
pay for college, even when that loan would likely offer a positive long-term return” (Cunningham
and Santiago 2008, 10). Baum and Schwartz (2013, 16) suggest that the prospect of being left with
unmanageable debt “might deter people from making investments they would judge wise if the
downside were simply wasted expenditures as opposed to debt” (Baum and Schwartz 2013, 16).
Palameta and Voyer (2010) define loan averse students as those willing to invest in higher
education but unwilling to take on loans to do so. In England, current students’ high dependence on
loans and the absence of alternative funding sources (apart from family), an unwillingness to
borrow, in effect, excludes most students from participating in HE.
8
Definitions and measurement of student debt aversion, and especially its relationship to higher
education participation vary between studies - producing different results which are not necessarily
directly comparable (Boatman et al 2016). Here we focus primarily on studies of prospective
students. Studies that measure debt aversion through monitoring prospective students’ actual
borrowing and enrollment behaviour are rare. In Field’s (2009) randomised controlled experiments,
law school applicants at New York University were offered either upfront loans that could be
forgiven or tuition subsidies that could later turn into loans. Both aid programs were designed to be
financially equivalent. Applicants offered tuition subsidies were more likely to enroll than those
offered upfront loans (42% compared with 32%). This finding was taken as confirming debt
aversion in high stakes decisions deriving from both social norms regarding indebtedness and
psychological burdens associated with debt.
A series of studies use survey respondents’ preferences for cash, grants, or grants plus loans in
hypothetical financial aid packages to measure debt aversion. In Johnson and Montmarquette’s
(2011) laboratory experiments in Canada, high school students were asked to make a number of
binary choices between cash and various forms of loans and grant. As an incentive to choose their
preferred option, one choice was honored. Just over 12 percent (152 of 1,248) of participants were
defined as debt averse because they always chose a grant over cash and never chose a loan over
cash. These respondents were “…insensitive to price and completely sensitive to subsidy type”
(Johnson and Montmarquette, 2011, 39). Palameta and Voyer (2010, 60), using a similar approach,
defined loan aversion as when their Canadian high school students likely to enroll in college only
take a grant and never a combination of grants and loans. They find that between 5 and 20 percent
of their sample is loan averse, a pattern linked to “relatively low numeracy, a tendency to discount
future benefits, and doubt about the returns to PSE (post-secondary education), especially
university.” Caetano et al, (2011) measure the existence of debt aversion in Latin America using a
World Bank survey, where participants were presented with choices that were financially
equivalent. A greater preference for the “human capital contract” option compared to “loans” was
taken as confirming debt aversion and the importance of language in the labelling of financial aid.
Labelling a contract as a “loan” decreases its probability of being chosen over a contract by more
than 8 per cent.
Some studies measure debt aversion as rejection of loans offered (Goldrick-Rab and Kelchen 2015)
or borrowing low amounts (Burdman 2005). Such behaviour may be due to debt aversion or
because students do not need the money, or require small amounts, to pursue their studies.
9
Another method for measuring debt aversion is through assessing attitudes to debt, usually via
student surveys. In some studies, a single question is asked (Bachan 2014; Oosterbeek and Van den
Broek 2009). In others, an attitude scale is created to gain a more nuanced understanding of the
structure of student debt attitudes. Noteworthy is Davies and Lea’s (1995) UK study, one of the first
to use this approach. Their unidimensional Attitudes to Debt scale was constructed to run from pro-
debt to anti-debt. Their scale consisted of 14 items, administered in a five-point Likert format,
covering general philosophical/moral and day-to-day attitudes toward debt. They subsequently
developed their longitudinal method to include prospective students and find attitudes change with
the experience of debt. Prospective higher education students are less debt tolerant than current
students and graduates (Lea et al. 2001), a finding echoed by Haultain et al. (2010).
Callender and Jackson (2005) use a reduced version of this scale and, in a move away from a
unidimensional concept, also measure the “cost/benefit balance of going to university.” They
identify both moralistic attitudes critical of debt and positive attitudes that recognise the value of
debt in supporting investment in higher education. They show that debt averse attitudes deterred
disadvantaged prospective students from applying to university.
Haultain et al. (2010) detect low levels of internal reliability for Davies and Lea’s scale in other UK
and New Zealand studies, suggesting that this is because “students’ attitudes to debt may not, in fact
be unidimensional, and are not ordered on one tolerant versus intolerant of debt continuum” (323).
They find that attitudes toward debt among prospective and current tertiary students in New
Zealand are best described by two uncorrelated dimensions, “fear of debt” and “debt utility,” and
conclude that the average student is fearful of debt but realizes it is useful.
The current study builds on these well-established methods for measuring debt aversion through
student attitudes, and specifically on Callender and Jackson (2005), using a more refined attitude
scale. We then examine the relationship between debt averse attitudes and students’ higher
education intentions.
Prospective students’ attitudes toward debt
Callender and Jackson (2005) find that ethnic minority, first-generation and lower-class students
appeared particularly wary about taking on debt to pay for higher education study. Haultain et al.
(2010) reveal that “fear of debt” is associated with parents not having attended university and
attending schools in lower-income catchment areas.
10
Bates et al.’s (2009) analysis of two large-scale longitudinal studies of 16 and 17 year olds in
England finds that one third of those who want to apply to higher education have concerns over the
associated debt burden that make them question their decision to apply. Those with the greatest debt
aversion are among those least likely to apply to higher education. Attitudes toward debt vary, with
those from low-income and disadvantaged backgrounds, black and minority ethnic groups, and
young women being the most debt averse. These debt averse, but academically qualified, students
are the most likely to feel that that owing money is wrong, borrowing money is not a normal part of
today’s lifestyle, debt can be very difficult to get out of, and student loans are not a cheap way to
borrow money.
Burdman’s (2005) qualitative study confirms that U.S. students from low-income families avoid
borrowing often because of concerns about their ability to repay, negatively affecting their higher
education decisions. She argues that, for many students, debt aversion frequently begins with their
parents. Similarly, Perna (2008) shows that potential US higher education students’ willingness to
borrow varies depending on their financial resources and is influenced by their families and high
schools. Low-income students’ unwillingness to borrow limits their higher education opportunities
and willingness to enroll in universities compared with community colleges. Both Perna (2008) and
Burdman (2005) also highlight the role of low-income parents in discouraging loan take-up, unlike
more wealthy parents.
By contrast, Wilkins et al.’s (2013) study of English high school students, just before the 2012/13
reforms, uncovers “an increasing anxiety about financial issues” (136) but no evidence that low-
income students are more likely to be deterred from higher education entry because of the costs and
debts involved. They reason that higher education entry is gradually becoming the norm for
students from various social backgrounds, so “students from working class backgrounds may feel
compelled not to lose out and therefore opt to enrol” (Wilkins et al 2013, 12). Esson and Ertl
(2016) observe variations in attitudes toward debt, tuition fees, and plans to enter higher education
by the type of high school attended but conclude that, for the majority, tuition debt was not “a major
factor in the decision whether or not to enter higher education” (8). This is because prospective
students consider a higher education degree vital to securing employment in a competitive labour
market while income-contingent loans mean the government and not the student is liable for any
financial losses.
11
Conceptual framework and hypotheses
In common with Perna’s (2006) conceptual framework for understanding potential higher education
students’ enrollment decisions, we assume that students’ decisions and attitudes towards debt and
higher education are shaped by four nested contextual layers: the student and family context; the
school and community context; the higher education context; and the broader social, economic and
policy context. Although school staff and careers advisors were excluded from our study, we draw
on students’ responses to questions about the extent of encouragement from teachers and school
friends to enter higher education. “Differences in students’ perceptions of loans reflect differences
in the messages students receive about loans from their parents, school counselors and teachers, and
the broader state policy context” (Perna 2008, 601).
Following Callender and Jackson (2005; 2008), we submit that, when students decide to enter
higher education, they assess the expected costs and benefits of investing in higher education,
consistent with human capital theory. This assessment, including the risks, is in very broad terms,
rather than rigid cost/benefit analysis. As Brynin (2013, 285) argues:
It is unlikely that many young people calculate the economic value of education
relative to an expected career. They are likely instead to have a notion of a
‘good’ job, which would partially be based on some (often vague) idea of
expected pay, but also on the job’s prestige and the skills it requires.
In summary, we propose, like Perna (2006), that students’ subjective understanding and perceptions
of these costs and benefits, their views about their academic and financial resources, and their
higher education choices are shaped by their socio-economic backgrounds and other resources they
derive from their cultural and social capital. In addition, we consider the political and ideological
backdrop and policy rhetoric and suggest students are likely to absorb these in their decision-
making. Policies are more than a statement, but an “authoritative allocation of values” (Kogan
1975, 55), which do not “float free of their social context” (Ball, 1990, 3).
Using this contextual framework, we propose three hypotheses to test using data from our 2002 and
2015 surveys of prospective undergraduates. First, in the light of continued growth in higher
education participation in England at a time of rising tuition fees and increases in student borrowing
following policy changes and its pervasive rhetoric, we posit that:
Hypothesis 1: Young people’s attitudes toward taking out student loan debt were more favourable in
2015 than in 2002.
12
Next, motivated by the cross-national evidence on debt aversion, social class and higher education
participation discussed above, we submit two further hypotheses to empirical scrutiny.
Hypothesis 2: Where debt averse attitudes exist, they are stronger among lower-class students than
among students from other social classes in 2015, as in 2002.
Hypothesis 3: All else being equal, debt averse attitudes contribute to lower rates of planned higher
education participation by lower-class students compared to students from other social classes in
2015, as in 2002.
Research methods
To investigate key issues concerning student loan debt, we draw on two nationally representative
surveys of students in England who were studying toward higher education entry-level
qualifications such as A levels or vocational qualifications at Level 3 on the UK Regulated
Qualifications Framework.6 The first survey was carried out in 2002 and the second in 2015.
Several questions in the 2015 survey were identical to those asked in the 2002 survey. In both years
the samples comprised students in their final year of studying toward higher education entry-level
qualifications in:
government-funded high schools;
independent (private fee-paying) high schools; and
further education colleges.
There are some differences in the ways the samples were constructed and the survey questionnaires
were distributed. In 2002, the survey was conducted on a random sample of high schools and
colleges and data were collected using in-class self-completion questionnaires, handed out to
students by teachers. In 2015, a sampling frame of potential individual respondents was built using
student contact details drawn from two national databases that had become accessible since 2002:
the National Pupil Database and Individual Learner Records held by the Department for Education.
Questionnaires were sent to most students through a mix of postal and email methods. Since the
National Pupil Database does not contain contact details for independent school students, a sample
of these students was obtained through direct approaches to independent schools, with teachers
given a choice of handing out paper questionnaires to students or providing them with the
information required to complete questionnaires on-line.7
Although the 2002 survey covered the whole of the UK and included a proportion of students aged
22 and older, the 2015 survey was confined to England and largely to students age 17 to 21.8

13
Accordingly, in this paper comparisons between the two samples are confined to 17 to 21 year old
students in England. About 7 to 8 percent of these students in each year did not reply fully to survey
questions concerning attitudes toward debt and these cases were omitted from our analysis.9 This
process yields final samples of 1,028 students in 2002 and 1,427 students in 2015 (Table 1). Some
60 percent of respondents in 2002 and 62 percent in 2015 were female, reflecting the higher female
higher education participation rate over the last 20 years noted above. The proportion of 18 to19
year olds was 81 percent in 2002 and 87 percent in 2015. Using an indicator of social class based on
the occupations and economic activities of the primary income earners in student households,
upper-class students accounted for a higher share of sampled students in 2002 (41 percent) than in
2015 (32 percent) while the reverse was true for middle- and lower-class students.10 The proportion
of sampled students who had definitely decided to apply for higher education courses was slightly
higher in 2015 (81 per cent) than in 2002 (78 percent).
In terms of sample composition by educational institution attended, the unweighted share of further
education students in 2015 was considerably smaller than in 2002, contributing to a larger
unweighted share of government-funded high school students in 2015. This was partly due to a shift
from further education colleges to government-funded schools in recent years among students
taking higher education entry-level qualifications and partly due to a lower response rate by further
education students. To derive nationally representative estimates of student attitudes toward debt
and other variables, sample data are weighted to national profiles of students by type of institution
attended and qualification aim. These weights were developed using Labour Force Survey11 data for
2002 and 2015 as well as official statistics on young people’s participation in education, training,
and employment in England. (See Appendix Table A1 for further details.)
Because of the relatively small (unweighted) share of further education students in 2015 compared
to 2002, we test the sensitivity of our main findings to compositional differences between the two
samples by estimating equivalent results for high school students only (excluding further education
students) as well as for all students and by comparing unweighted with weighted estimates. Our
main findings prove to be robust to the outcomes of these sensitivity tests. Full details are available
from the authors on request.
14
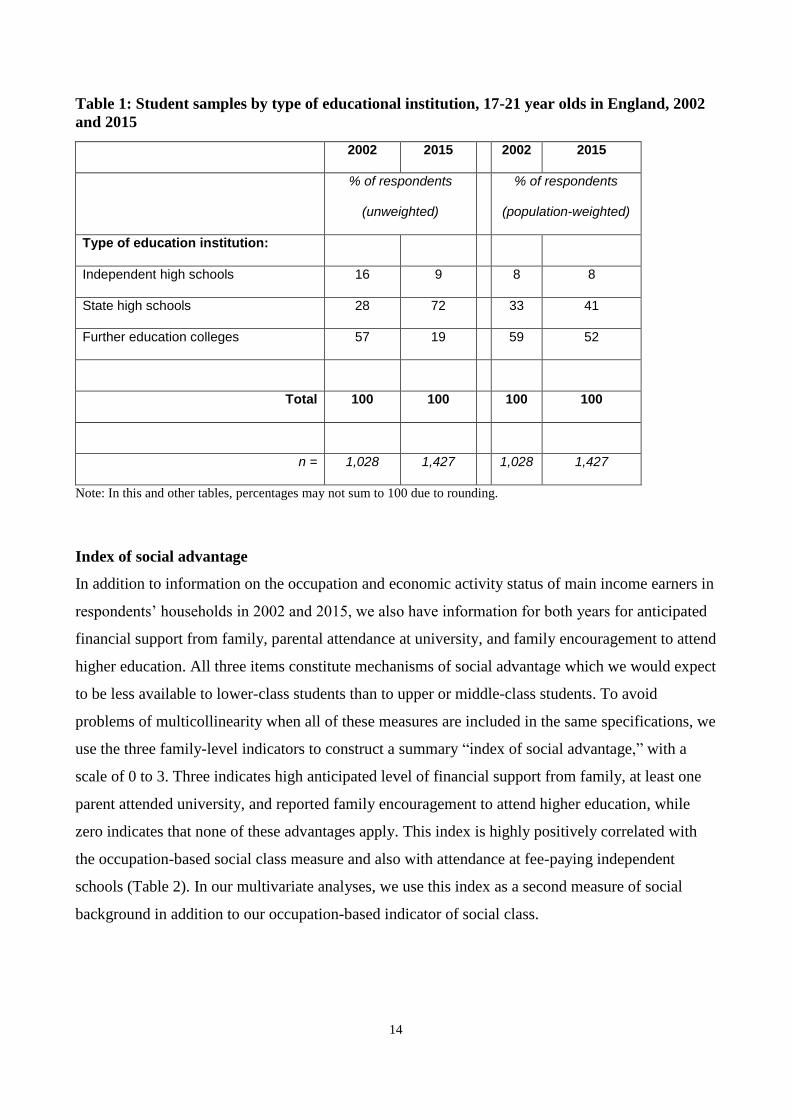
Table 1: Student samples by type of educational institution, 17-21 year olds in England, 2002
and 2015
2002 2015 2002 2015
% of respondents
(unweighted)
% of respondents
(population-weighted)
Type of education institution:
Independent high schools 16 9 8 8
State high schools 28 72 33 41
Further education colleges 57 19 59 52
Total 100 100 100 100
n = 1,028 1,427 1,028 1,427
Note: In this and other tables, percentages may not sum to 100 due to rounding.
Index of social advantage
In addition to information on the occupation and economic activity status of main income earners in
respondents’ households in 2002 and 2015, we also have information for both years for anticipated
financial support from family, parental attendance at university, and family encouragement to attend
higher education. All three items constitute mechanisms of social advantage which we would expect
to be less available to lower-class students than to upper or middle-class students. To avoid
problems of multicollinearity when all of these measures are included in the same specifications, we
use the three family-level indicators to construct a summary “index of social advantage,” with a
scale of 0 to 3. Three indicates high anticipated level of financial support from family, at least one
parent attended university, and reported family encouragement to attend higher education, while
zero indicates that none of these advantages apply. This index is highly positively correlated with
the occupation-based social class measure and also with attendance at fee-paying independent
schools (Table 2). In our multivariate analyses, we use this index as a second measure of social
background in addition to our occupation-based indicator of social class.

15
Table 2: Social advantage index by social class and type of educational institution (population-
weighted)
2002 2015
Mean Std. error Mean Std. error
Upper-class 2.15 0.04 1.90 0.03
Middle-class 1.66 0.05 1.63 0.04
Lower-class 1.48 0.05 1.27 0.03
Independent high schools 2.38 0.05 2.27 0.06
State high schools 1.91 0.04 1.60 0.02
Further education colleges 1.69 0.03 1.48 0.04
Note: All differences in mean scores between social class and type of educational institution are statistically significant
at the 1% level.
Debt averse attitudes
To assess students’ attitudes toward debt, both surveys asked a series of questions about the extent
to which respondents agreed with various statements about debt.
Generally more students in both years agreed with statements that are favourable to debt (e.g. “debt
is a normal part of today’s lifestyle, “it is OK to be in debt if you can pay it off”) than with the
criticisms of debt (i.e., “there is no excuse for borrowing money,” “owing money is basically
wrong”). Half of 2002 respondents and just over 70 percent of 2015 respondents agreed with the
fourth statement “you should always save up first before buying something” (Table 3).
Factor analysis of the responses to these five statements produced two factors with eigenvalues
greater than unity for each year. One, based on the first two statements, can be interpreted as a
summary measure of attitudes favourable to debt. The second (based on statements 3-5) can be
interpreted as a summary measure of the extent of debt averse attitudes among students. The latter
measure explained 57-58 percent of the total variation in the responses to statements 3-5 in each
year. These factor scores, with mean zero and standard deviation one, are entered as measures of
debt averse attitudes in 2002 and 2015 in the multivariate analysis. 12

16
Table 3: Extent of agreement with statements regarding debt, 17-21 year old students in
England, 2002 and 2015 (population-weighted)
Strongly
agree Agree
Neither
agree
nor
disagree Disagree
Strongly
disagree Total n=
% of respondents (population-weighted)
1. ‘Debt is a normal part of
today’s lifestyle 2002 11 42 29 13 5 100 1028
2015 7 45 26 14 8 100 1427
2. ‘It is OK to be in debt if
you can pay it off’ 2002 9 57 22 9 3 100 1028
2015 5 42 24 21 7 100 1427
3. ‘There is no excuse for
borrowing money’ 2002 3 6 27 39 26 100 1028
2015 3 7 28 41 20 100 1427
4. ‘You should always save
up first before buying
something’ 2002 10 40 30 17 4 100 1028
2015 21 50 18 9 1 100 1427
5. ‘Owing money is
basically wrong’ 2002 5 12 35 34 15 100 1028
2015 3 12 33 37 15 100 1427
Data analysis
Hypothesis 1 is tested by comparing 2002 and 2015 responses to relevant survey questions on
student attitudes to taking out loan debt to pay for university education. To test Hypothesis 2, we
regress our summary measure of debt averse attitudes for each year on measures of social class with
controls for other relevant individual characteristics:
(1) DAit = α + j
βjXjit + εit

17
Here DAi is the debt averse attitudes score for student i and Xji is a vector of j dummy variables
denoting social class, gender, age, ethnicity, and type of educational institution attended. For 2015,
we also control for prior educational attainment on the General Certificate of Secondary Education
national examination that English students typically take at age 16. No equivalent data are available
for 2002. Descriptive statistics for these and other variables used in multivariate analysis are shown
in Appendix Table A2.
To test Hypothesis 3, we conduct multivariate analyses of higher education participation in 2015
and 2002, modelling the probabilities that individuals plan to undertake higher education as follows:
(2) 1Pr ii XFHE
where
intentionsuch no is thereif 0
education higher in eparticipat tointends individual theif 1iHE
F(.) is the cumulative distribution function of the standard normal distribution and Xi is a vector of
individual-level and school-related characteristics that are expected to influence the probability of
participating in higher education. These variables are gender, age, ethnicity and social class; the
degree of encouragement to enter higher education provided by friends and teachers; and, for 2015,
prior educational attainment at GCSE level.
Findings
Changes in student attitudes to debt
To test Hypothesis 1, that young people’s attitudes to taking out student loan debt were more
favourable in 2015 than in 2002, we first examine the extent of student agreement with the
statement that “borrowing money to pay for a university education is a good investment.” As Table
4 shows, the proportion of respondents agreeing with this statement rose from 52 percent in 2002 to
74 percent in 2015. Mean response scores calculated on a 1-5 scale show a statistically significant
increase from 3.35 in 2002 to 3.98 in 2015 (p<0.001). As a check on the sensitivity of these
findings to the inclusion of further education students who were relatively under-sampled in 2015
compared to 2002, we carried out similar estimates for high school students only. These estimates
show a similar pattern of change between 2002 and 2015 as for the full samples including further
education students. (Results for this and all other sensitivity tests are available from the authors on
request).
18
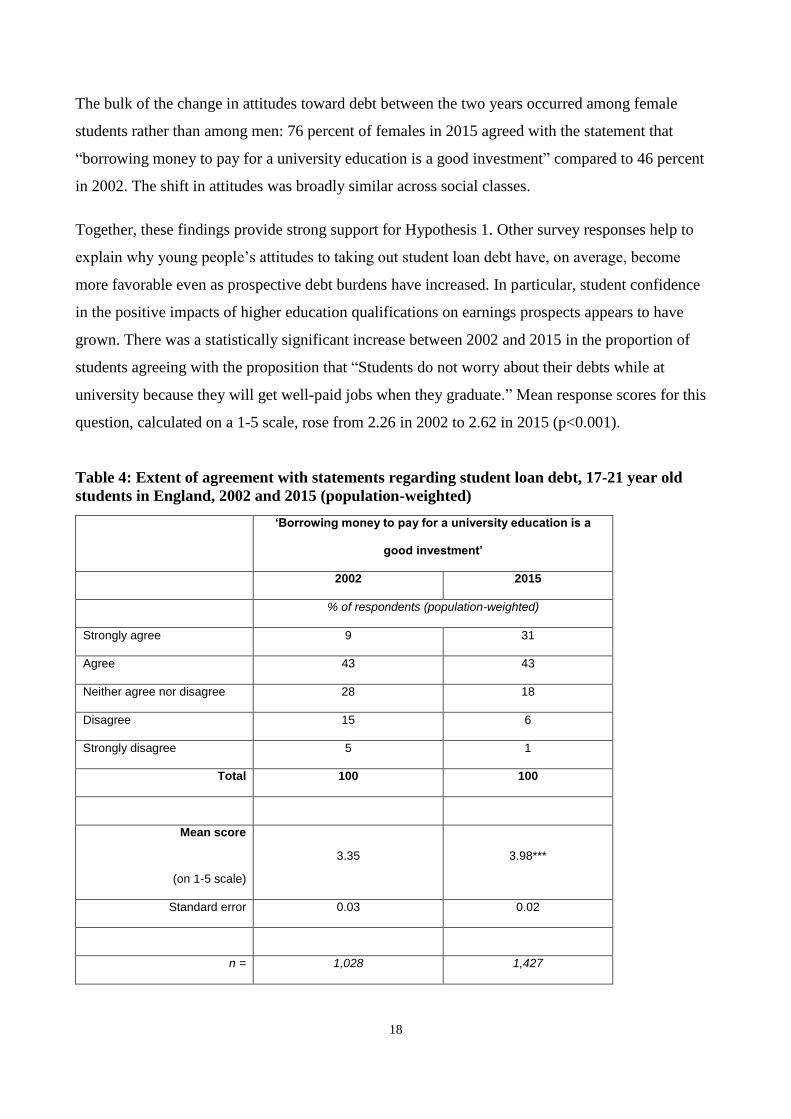
The bulk of the change in attitudes toward debt between the two years occurred among female
students rather than among men: 76 percent of females in 2015 agreed with the statement that
“borrowing money to pay for a university education is a good investment” compared to 46 percent
in 2002. The shift in attitudes was broadly similar across social classes.
Together, these findings provide strong support for Hypothesis 1. Other survey responses help to
explain why young people’s attitudes to taking out student loan debt have, on average, become
more favorable even as prospective debt burdens have increased. In particular, student confidence
in the positive impacts of higher education qualifications on earnings prospects appears to have
grown. There was a statistically significant increase between 2002 and 2015 in the proportion of
students agreeing with the proposition that “Students do not worry about their debts while at
university because they will get well-paid jobs when they graduate.” Mean response scores for this
question, calculated on a 1-5 scale, rose from 2.26 in 2002 to 2.62 in 2015 (p<0.001).
Table 4: Extent of agreement with statements regarding student loan debt, 17-21 year old
students in England, 2002 and 2015 (population-weighted)
‘Borrowing money to pay for a university education is a
good investment’
2002 2015
% of respondents (population-weighted)
Strongly agree 9 31
Agree 43 43
Neither agree nor disagree 28 18
Disagree 15 6
Strongly disagree 5 1
Total 100 100
Mean score
(on 1-5 scale)
3.35 3.98***
Standard error 0.03 0.02
n = 1,028 1,427

19
'Students do not worry about their debts while at university
because they will get well-paid jobs when they graduate'
2002 2015
% of respondents (population-weighted)
Strongly agree 1 3
Agree 7 18
Neither agree nor disagree 28 30
Disagree 45 36
Strongly disagree 19 13
Total 100 100
Mean score
(on 1-5 scale) 2.26 2.62***
(Standard error) 0.03 0.03
n = 1028 1427
*** Difference between 2015 and 2002 mean scores is statistically significant at the 1% level.
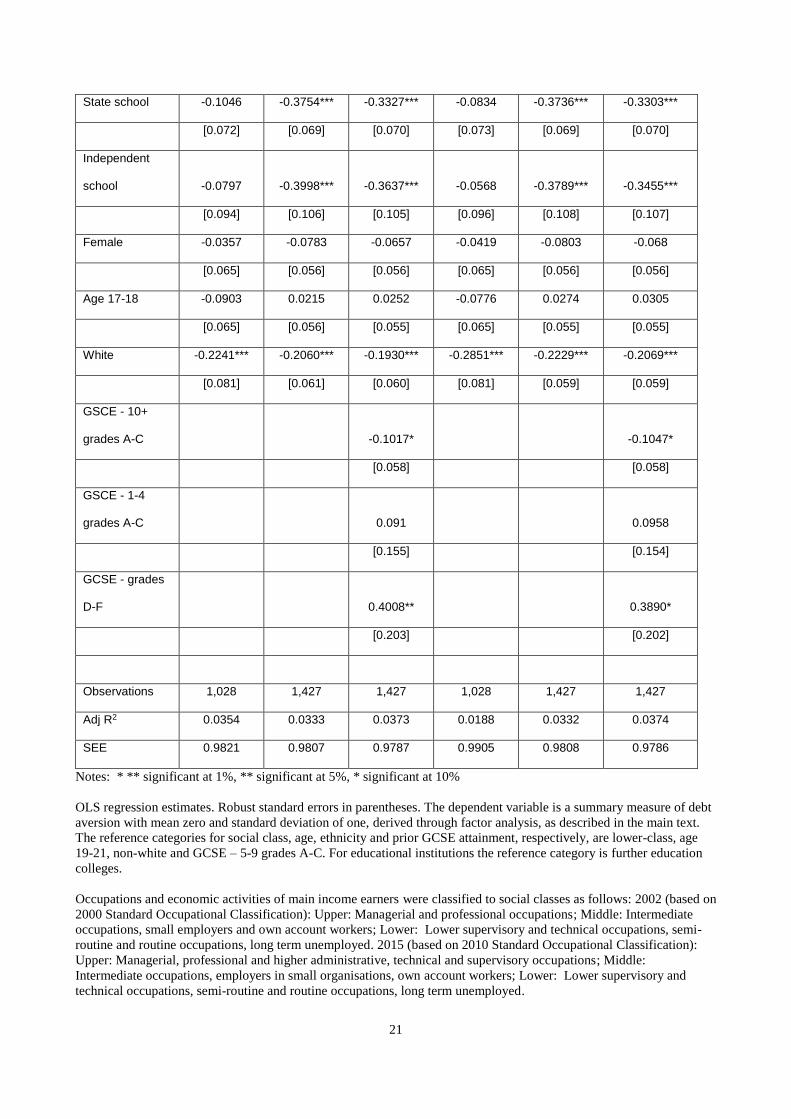
Debt aversion and social class
Hypothesis 2 posits that, where debt averse attitudes exist, they are stronger among lower-class
students than among students from other social classes. To test this hypothesis, we estimate
Equation 1 using the summary measure of debt averse attitudes as the dependent variable. Table 5
shows that upper-class students were significantly less likely to hold debt averse attitudes in 2015
than were lower-class students, the reference category for both the upper and middle-class variables
(Column 2). Comparison with the equivalent upper-class coefficient for 2002 suggests that the gap
in mean debt averse attitude scores between upper and lower-class students widened sharply since
2002 for 17-21 year old students in England. Indeed, the upper-class coefficient for 2002 is lower
than for 2015 and is not statistically significant due to a relatively high standard error (Column 1).13
The second indicator of social background, the index of social advantage, is significantly negatively
related to debt aversion in both 2002 and 2015 (Columns 4-5).

20
Apart from lower-social class status, other variables that contribute to students holding debt averse
attitudes are attendance at further education colleges in 2015 (as compared to attendance at
independent and government-funded high schools) and being non-white in both years. All findings
for 2015 are robust to controlling for prior attainment at GCSE level (Columns 3 and 6).
Focussing specifically on differences between middle- and lower-class students, in 2002 the
coefficient on middle-class is positive compared to lower-class students while in 2015 it is negative
(Columns 1 and 2). Due to wide dispersion of debt averse attitude scores for middle-class students
in both years (reflected in the relatively high standard errors attached to the middle-class
coefficients), we cannot attribute statistical significance to differences between middle and lower-
class students in either year.
Overall, the findings in relation to social class and the index of social advantage provide partial
support for Hypothesis 2. Lower-class students are more likely to display debt averse attitudes than
upper-class students in 2015 and this disparity appears to have grown since 2002. However, there is
no clear evidence of lower-class students being more debt-averse than middle-class students in
either year.
These findings are generally robust to sensitivity tests confining estimation to school-based students
(excluding further education college students) and re-estimating Equation 1 using weighted least
squares. Results are available from the authors on request.
Table 5: OLS estimates of debt aversion: 17-21 year old students in England, 2002 and 2015
(1) (2) (3) (4) (5) (6)
Independent
Variable 2002 2015 2015 2002 2015 2015
Upper-class -0.0894 -0.1601** -0.1375*
[0.082] [0.070] [0.070]
Middle-class 0.111 -0.1221 -0.1188
[0.099] [0.076] [0.076]
Social
advantage -0.0957** -0.0684* -0.0596*
[0.040] [0.035] [0.035]
21
State school -0.1046 -0.3754*** -0.3327*** -0.0834 -0.3736*** -0.3303***
[0.072] [0.069] [0.070] [0.073] [0.069] [0.070]
Independent
school -0.0797 -0.3998*** -0.3637*** -0.0568 -0.3789*** -0.3455***
[0.094] [0.106] [0.105] [0.096] [0.108] [0.107]
Female -0.0357 -0.0783 -0.0657 -0.0419 -0.0803 -0.068
[0.065] [0.056] [0.056] [0.065] [0.056] [0.056]
Age 17-18 -0.0903 0.0215 0.0252 -0.0776 0.0274 0.0305
[0.065] [0.056] [0.055] [0.065] [0.055] [0.055]
White -0.2241*** -0.2060*** -0.1930*** -0.2851*** -0.2229*** -0.2069***
[0.081] [0.061] [0.060] [0.081] [0.059] [0.059]
GSCE - 10+
grades A-C -0.1017* -0.1047*
[0.058] [0.058]
GSCE - 1-4
grades A-C 0.091 0.0958
[0.155] [0.154]
GCSE - grades
D-F 0.4008** 0.3890*
[0.203] [0.202]
Observations 1,028 1,427 1,427 1,028 1,427 1,427
Adj R2 0.0354 0.0333 0.0373 0.0188 0.0332 0.0374
SEE 0.9821 0.9807 0.9787 0.9905 0.9808 0.9786
Notes: * ** significant at 1%, ** significant at 5%, * significant at 10%
OLS regression estimates. Robust standard errors in parentheses. The dependent variable is a summary measure of debt
aversion with mean zero and standard deviation of one, derived through factor analysis, as described in the main text.
The reference categories for social class, age, ethnicity and prior GCSE attainment, respectively, are lower-class, age
19-21, non-white and GCSE – 5-9 grades A-C. For educational institutions the reference category is further education
colleges.
Occupations and economic activities of main income earners were classified to social classes as follows: 2002 (based on
2000 Standard Occupational Classification): Upper: Managerial and professional occupations; Middle: Intermediate
occupations, small employers and own account workers; Lower: Lower supervisory and technical occupations, semi-
routine and routine occupations, long term unemployed. 2015 (based on 2010 Standard Occupational Classification):
Upper: Managerial, professional and higher administrative, technical and supervisory occupations; Middle:
Intermediate occupations, employers in small organisations, own account workers; Lower: Lower supervisory and
technical occupations, semi-routine and routine occupations, long term unemployed.

22
Higher education participation and social class
Having established that debt averse attitudes tend to be stronger among lower-class than upper-class
students, we now examine evidence relating to Hypothesis 3. This hypothesis posits that, all else
being equal, debt averse attitudes still contribute to lower rates of planned higher education
participation by lower-class students compared to students from other social classes.
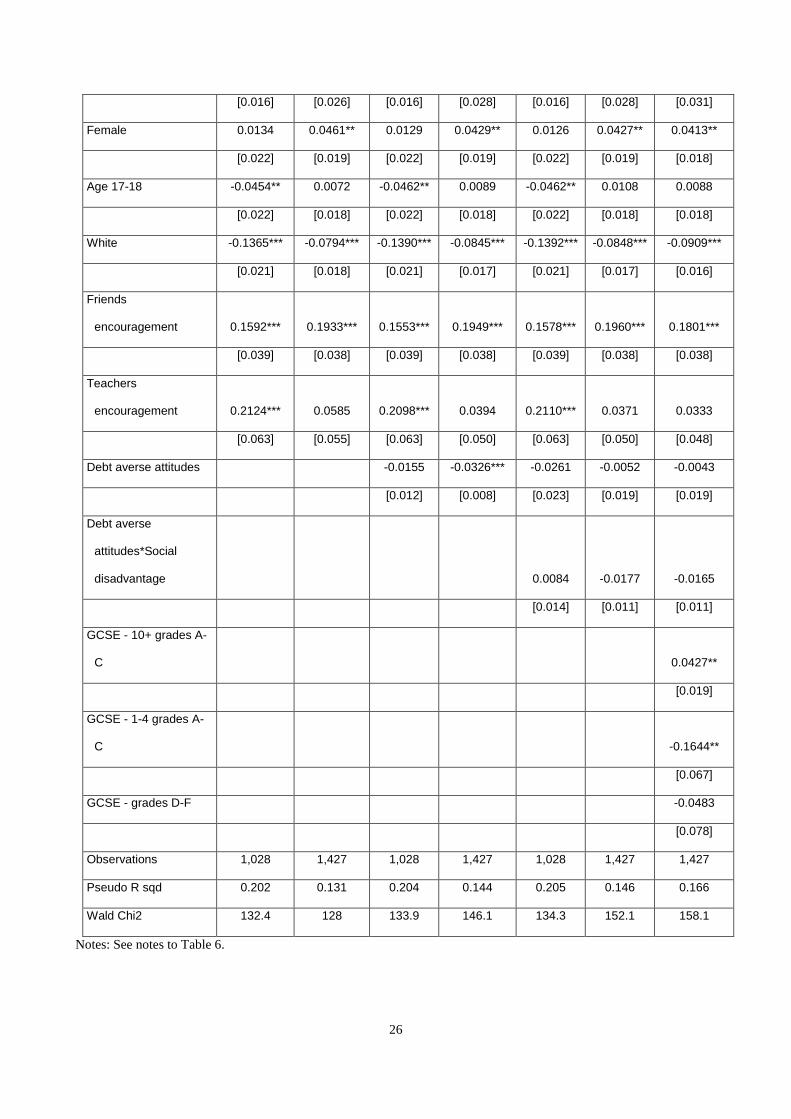
Table 6 reports probit estimates for Equation 2, modelling the probability of individual students
planning to participate in higher education in 2002 and 2015, using the indicator of social class. The
estimated probability of upper-class students planning to participate in higher education in 2015 is
5.9 percentage points higher than for lower-class students after controlling for various individual
and school-related characteristics (Column 2), slightly lower than the estimated 7.5 percentage
points differential in 2002 (Column 1). The estimated probability of middle-class students planning
to enter higher education is not significantly higher than for lower-class students in either year.
These patterns of class difference remain when we enter our measure of debt averse attitudes as an
additional regressor (Columns 3 and 4). In both years, debt averse attitudes are negatively related to
planned higher education participation, significantly so in 2015 but not in 2002. 14
Several control variables are positively associated with anticipated higher education participation in
both years: attendance at government-funded and independent schools (compared to further
education colleges), being from non-white ethnic backgrounds, and having received encouragement
at school from friends to apply for higher education studies (Columns 1-7). Encouragement from
teachers played a significant role in both years but apparently made a smaller contribution in 2015
compared to 2002. The reasons for this change are unclear but may suggest that higher education
participation is now taken for granted in schools. Attending government-funded high schools
appears to have a smaller positive effect on plans for higher education participation than attending
independent schools in 2002 but 13 years later this differential appears to have disappeared.
We test Hypothesis 3 by entering two additional variables denoting interactions between debt
averse attitudes and, respectively, upper- and middle-class status (Columns 5 and 6). The coefficient
for the debt averse attitudes variable refers to the association between debt averse attitudes and
planned higher education participation by students in the lower-class reference category. For 2015,
we observe a significant negative link between debt averse attitudes and lower-class status but the
coefficient on the same variable in 2002 is not statistically significant. The finding for 2015 is
robust to controlling for prior attainment at GCSE level (Column 7).
23
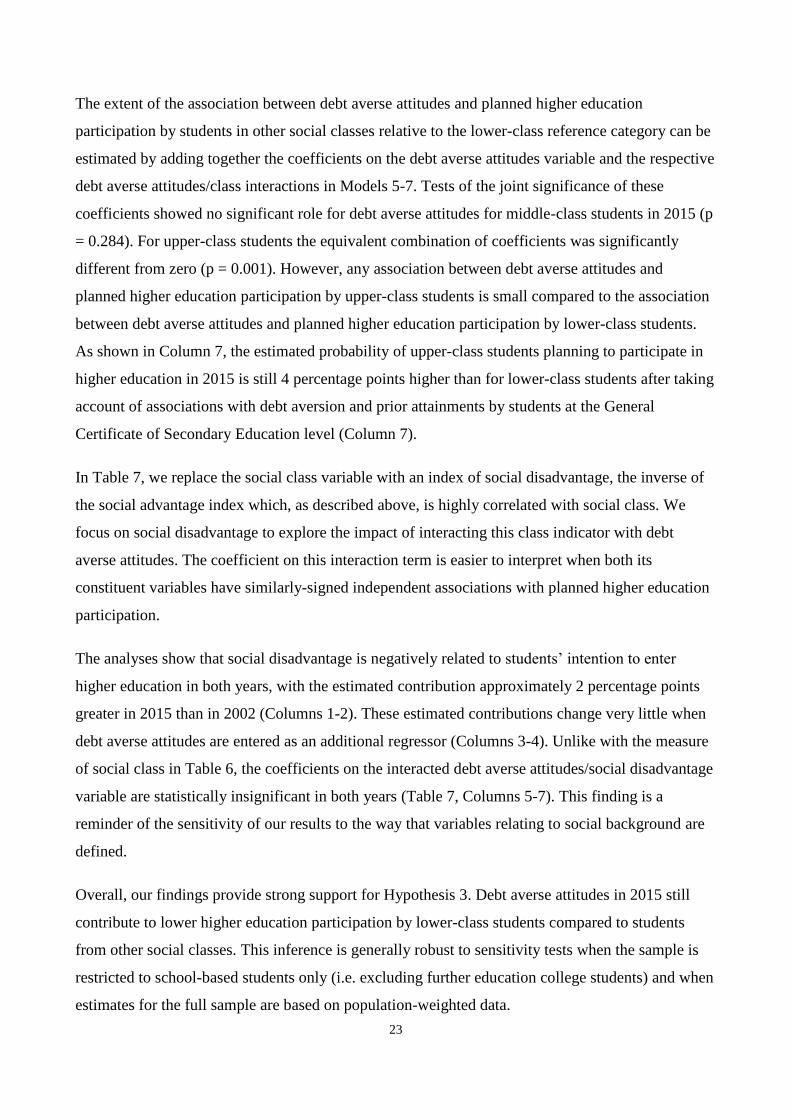
The extent of the association between debt averse attitudes and planned higher education
participation by students in other social classes relative to the lower-class reference category can be
estimated by adding together the coefficients on the debt averse attitudes variable and the respective
debt averse attitudes/class interactions in Models 5-7. Tests of the joint significance of these
coefficients showed no significant role for debt averse attitudes for middle-class students in 2015 (p
= 0.284). For upper-class students the equivalent combination of coefficients was significantly
different from zero (p = 0.001). However, any association between debt averse attitudes and
planned higher education participation by upper-class students is small compared to the association
between debt averse attitudes and planned higher education participation by lower-class students.
As shown in Column 7, the estimated probability of upper-class students planning to participate in
higher education in 2015 is still 4 percentage points higher than for lower-class students after taking
account of associations with debt aversion and prior attainments by students at the General
Certificate of Secondary Education level (Column 7).
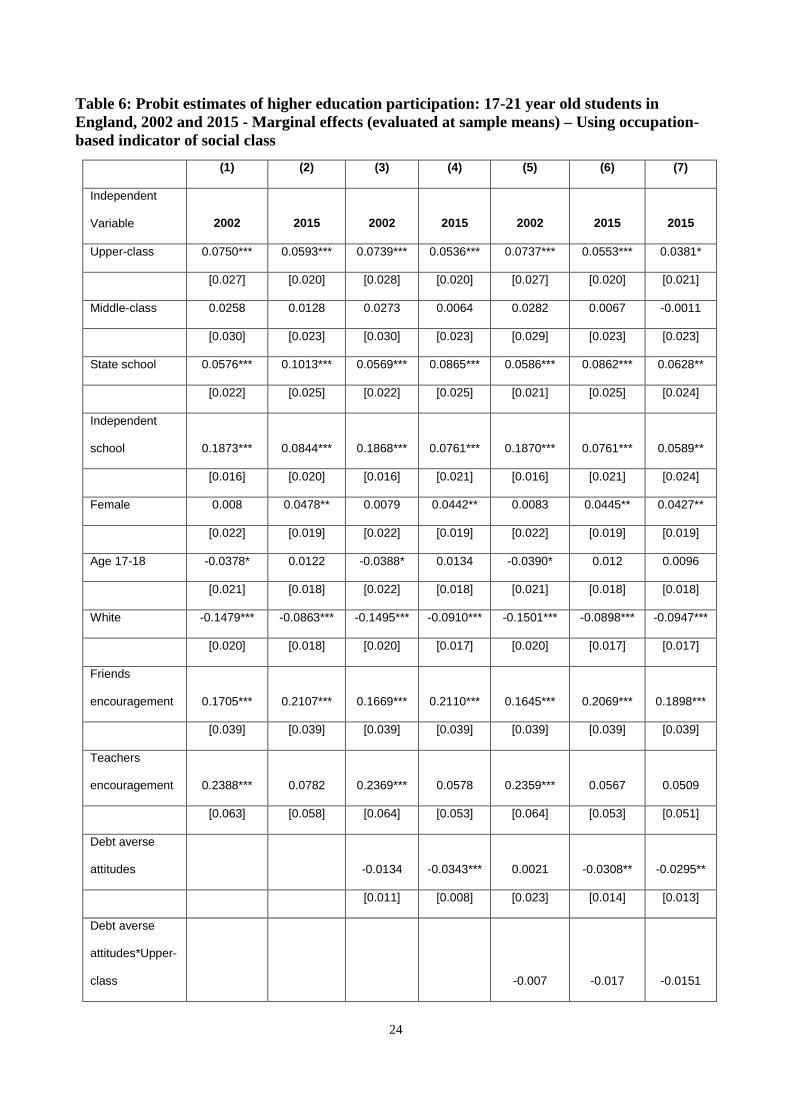
In Table 7, we replace the social class variable with an index of social disadvantage, the inverse of
the social advantage index which, as described above, is highly correlated with social class. We
focus on social disadvantage to explore the impact of interacting this class indicator with debt
averse attitudes. The coefficient on this interaction term is easier to interpret when both its
constituent variables have similarly-signed independent associations with planned higher education
participation.
The analyses show that social disadvantage is negatively related to students’ intention to enter
higher education in both years, with the estimated contribution approximately 2 percentage points
greater in 2015 than in 2002 (Columns 1-2). These estimated contributions change very little when
debt averse attitudes are entered as an additional regressor (Columns 3-4). Unlike with the measure
of social class in Table 6, the coefficients on the interacted debt averse attitudes/social disadvantage
variable are statistically insignificant in both years (Table 7, Columns 5-7). This finding is a
reminder of the sensitivity of our results to the way that variables relating to social background are
defined.
Overall, our findings provide strong support for Hypothesis 3. Debt averse attitudes in 2015 still
contribute to lower higher education participation by lower-class students compared to students
from other social classes. This inference is generally robust to sensitivity tests when the sample is
restricted to school-based students only (i.e. excluding further education college students) and when
estimates for the full sample are based on population-weighted data.
24
Table 6: Probit estimates of higher education participation: 17-21 year old students in
England, 2002 and 2015 - Marginal effects (evaluated at sample means) – Using occupation-
based indicator of social class
(1) (2) (3) (4) (5) (6) (7)
Independent
Variable 2002 2015 2002 2015 2002 2015 2015
Upper-class 0.0750*** 0.0593*** 0.0739*** 0.0536*** 0.0737*** 0.0553*** 0.0381*
[0.027] [0.020] [0.028] [0.020] [0.027] [0.020] [0.021]
Middle-class 0.0258 0.0128 0.0273 0.0064 0.0282 0.0067 -0.0011
[0.030] [0.023] [0.030] [0.023] [0.029] [0.023] [0.023]
State school 0.0576*** 0.1013*** 0.0569*** 0.0865*** 0.0586*** 0.0862*** 0.0628**
[0.022] [0.025] [0.022] [0.025] [0.021] [0.025] [0.024]
Independent
school 0.1873*** 0.0844*** 0.1868*** 0.0761*** 0.1870*** 0.0761*** 0.0589**
[0.016] [0.020] [0.016] [0.021] [0.016] [0.021] [0.024]
Female 0.008 0.0478** 0.0079 0.0442** 0.0083 0.0445** 0.0427**
[0.022] [0.019] [0.022] [0.019] [0.022] [0.019] [0.019]
Age 17-18 -0.0378* 0.0122 -0.0388* 0.0134 -0.0390* 0.012 0.0096
[0.021] [0.018] [0.022] [0.018] [0.021] [0.018] [0.018]
White -0.1479*** -0.0863*** -0.1495*** -0.0910*** -0.1501*** -0.0898*** -0.0947***
[0.020] [0.018] [0.020] [0.017] [0.020] [0.017] [0.017]
Friends
encouragement 0.1705*** 0.2107*** 0.1669*** 0.2110*** 0.1645*** 0.2069*** 0.1898***
[0.039] [0.039] [0.039] [0.039] [0.039] [0.039] [0.039]
Teachers
encouragement 0.2388*** 0.0782 0.2369*** 0.0578 0.2359*** 0.0567 0.0509
[0.063] [0.058] [0.064] [0.053] [0.064] [0.053] [0.051]
Debt averse
attitudes -0.0134 -0.0343*** 0.0021 -0.0308** -0.0295**
[0.011] [0.008] [0.023] [0.014] [0.013]
Debt averse
attitudes*Upper-
class -0.007 -0.017 -0.0151

25
[0.030] [0.020] [0.020]
Debt averse
attitudes*Middle-
class -0.0295 0.0126 0.0127
[0.033] [0.022] [0.021]
GCSE - 10+
grades A-C 0.0466**
[0.020]
GCSE – 1-4
grades A-C -0.1813***
[0.068]
GCSE - grades
D-F -0.0196
[0.068]
Observations 1,028 1,427 1,028 1,427 1,028 1,427 1,427
Pseudo R2 0.203 0.111 0.204 0.125 0.206 0.126 0.149
Wald Chi2 143.1 118.8 143.9 141.8 154.3 144.8 152.7
Notes: *** significant at 1%, ** significant at 5%, * significant at 10%
Probit estimates. Robust standard errors in parentheses. The dependent variable = 1 if respondents definitely intend to
apply for higher education studies, = 0 otherwise. Marginal effects are evaluated at the mean values of other
independent variables. The reference categories for social class, age, ethnicity and prior GCSE attainment, respectively,
are lower-class, age 19-21, non-white and GCSE – 5-9 grades A-C. For educational institutions the reference category
is FE colleges. For definitions of GCSE and social classes, see notes to Table 5.
Table 7: Probit estimates of higher education participation: 17-21 year old students in
England, 2002 and 2015 - Marginal effects (evaluated at sample means) – Using index of social
disadvantage
(1) (2) (3) (4) (5) (6) (7)
Independent Variable 2002 2015 2002 2015 2002 2015 2015
Social disadvantage -0.0489*** -0.0660*** -0.0475*** -0.0632*** -0.0479*** -0.0622*** -0.0552***
[0.014] [0.012] [0.014] [0.011] [0.014] [0.012] [0.011]
State school 0.0523** 0.0955*** 0.0517** 0.0818*** 0.0518** 0.0819*** 0.0599**
[0.022] [0.025] [0.022] [0.024] [0.022] [0.025] [0.024]
Independent school 0.1853*** 0.0567** 0.1846*** 0.0472* 0.1841*** 0.0465* 0.0293
26
[0.016] [0.026] [0.016] [0.028] [0.016] [0.028] [0.031]
Female 0.0134 0.0461** 0.0129 0.0429** 0.0126 0.0427** 0.0413**
[0.022] [0.019] [0.022] [0.019] [0.022] [0.019] [0.018]
Age 17-18 -0.0454** 0.0072 -0.0462** 0.0089 -0.0462** 0.0108 0.0088
[0.022] [0.018] [0.022] [0.018] [0.022] [0.018] [0.018]
White -0.1365*** -0.0794*** -0.1390*** -0.0845*** -0.1392*** -0.0848*** -0.0909***
[0.021] [0.018] [0.021] [0.017] [0.021] [0.017] [0.016]
Friends
encouragement 0.1592*** 0.1933*** 0.1553*** 0.1949*** 0.1578*** 0.1960*** 0.1801***
[0.039] [0.038] [0.039] [0.038] [0.039] [0.038] [0.038]
Teachers
encouragement 0.2124*** 0.0585 0.2098*** 0.0394 0.2110*** 0.0371 0.0333
[0.063] [0.055] [0.063] [0.050] [0.063] [0.050] [0.048]
Debt averse attitudes -0.0155 -0.0326*** -0.0261 -0.0052 -0.0043
[0.012] [0.008] [0.023] [0.019] [0.019]
Debt averse
attitudes*Social
disadvantage 0.0084 -0.0177 -0.0165
[0.014] [0.011] [0.011]
GCSE - 10+ grades A-
C 0.0427**
[0.019]
GCSE - 1-4 grades A-
C -0.1644**
[0.067]
GCSE - grades D-F -0.0483
[0.078]
Observations 1,028 1,427 1,028 1,427 1,028 1,427 1,427
Pseudo R sqd 0.202 0.131 0.204 0.144 0.205 0.146 0.166
Wald Chi2 132.4 128 133.9 146.1 134.3 152.1 158.1
Notes: See notes to Table 6.

27
Discussion and conclusions
Higher education participation in England has continued to rise in recent years across all social
classes, despite large hikes in tuition fees repaid via government subsidised income-contingent
loans, massive increases in student loan debt, and restrictions on maintenance grants. Nonetheless,
concerns remain that lower-class students who achieve suitable qualifications to enter higher
education may be deterred from participation by the level of debt required.
Drawing on surveys in 2002 and 2015 of high school and further education college students, we
tested three hypotheses:
H1: Young people’s attitudes to taking out student loan debt were more favourable in 2015 than in
2002.
H2: Where debt averse attitudes exist, they are stronger among lower-class students than among
students from other social classes in 2015, as in 2002.
H3: All else being equal, debt averse attitudes contribute to lower rates of planned higher education
participation by lower-class students compared to students from other social classes in 2015, as in
2002.
We find clear evidence to support the first hypothesis. In 2015, 74 percent of students agreed with a
statement that “borrowing money to pay for a university education is a good investment” compared
with 52 percent in 2002. This change partly reflects growth in the proportion of students who agree
with the statement, “Students do not worry about their debts while at university because they will
get well-paid jobs when they graduate.” There is also a widespread understanding that future loan
repayments will be income-contingent.
Nonetheless, a sizeable minority of students have debt averse attitudes. We find partial evidence for
the second hypothesis, with lower-class students exhibiting more debt averse attitudes than upper-
class students in 2015, and much more averse attitudes than lower-class students in 2002. Middle-
class students in 2015 are not more debt averse than lower-class students.
We find strong support for the third hypothesis. Lower-class students are still far more likely than
students from other social classes to be deterred from planning to enter higher education because of
fear of debt. This applies both to the comparison between lower- and upper-class students and
between lower- and middle-class students even though levels of debt aversion are similar among
28
middle-class and lower-class students. Debt aversion seems more likely to deter anticipated higher
education participation among lower-class students in 2015 than in 2002.
In 2015, upper class students are four percentage points more likely than lower-class students to
anticipate going to university, even after controlling for debt averse attitudes, prior academic
attainment and numerous other variables. However, intent to participate is not statistically different
for lower- and middle-class students after controlling for other variables.
The gap between upper- and middle-class planned participation cannot be attributed to debt
aversion among middle-class students, even though their debt aversion levels are similar to lower-
class students. Many factors shape students’ higher education enrolment decisions. Our index of
social advantage, which captures anticipated financial support from family, parental attendance at
university, and family encouragement to attend higher education, is significantly and positively
related to planned higher education participation. The high degree of correlation between this social
advantage index and social class confirms that such economic and cultural capital is available most
of all to upper-class students. Further research would be useful to learn more about how these, and
other unevenly distributed family-level influences, contribute to student attitudes to debt and
willingness to incur the heavy debts now associated with higher education studies in England.
Prospective students’ more relaxed attitude to student loan debt in 2015 is unsurprising. The large
tuition fee increases mean very few students have a choice but to take out a loan if they want to go
to university. They recognize that higher education is essential for a well-paid job. As higher
education participation moves from mass to universal (Trow 1973), young people have few
alternative options but to enroll in higher education. By contrast, in 2002, loans were restricted to
living costs and students could find ways of minimising these costs, thereby reducing their reliance
on loans (Callender and Jackson 2008). Reflecting the ubiquitous policy rhetoric since 2006, and as
Essen and Ertl (2016) have shown, higher education has been “sold” successfully to prospective
students as a “good investment” with a high graduate earnings premium. Income-contingent loans
were promoted as “risk free” because of the expected financial returns to higher education and
because the government, not students, bears any financial penalties associated with low graduate
earnings.
This analysis shows that, with tuition fees and growth in student loan debt between 2002 and 2015,
debt averse attitudes increased among lower-class prospective students, the gap in attitudes between
lower- and upper-class students widened, and fear of debt negatively contributed to lower-class

29
students’ anticipated higher education participation relative to other social classes. These changes
occurred over a period when real household median disposable incomes grew by just three percent
to £28,092 ($36,416), and median full-time gross earnings were unchanged at £27,600 ($35,797)
(ONS 2015; 2016). Most potential students are now being asked to borrow about one and a half
times their family’s annual income.
The similar levels of debt aversion among middle- and lower-class prospective students in 2015,
unlike in 2002, also may reflect changes in student funding. These middle-income groups have been
particularly “squeezed” by restrictions on grant eligibility, limited access to institutional aid, and
parents with no spare disposable income to make up for these losses, making their children
increasingly reliant on loans.
The growth of social class differences in debt aversion and planned higher education participation
may be related to the increasing dispersion of graduate earnings over time (Green and Zhu 2010).
Graduates are much more likely to be employed and earn considerably more than non-graduates.
But graduates from wealthier backgrounds earn significantly more than graduates from poorer
backgrounds even after completing the same degrees from the same universities and graduate
earnings vary depending on the university attended (Britton et al, 2015a). Arguably, there are now
even greater risks and uncertainty concerning the returns of higher education for students not
attending the “best” universities and from the highest social classes.
A key limitation of our study is its focus on prospective students’ intentions about entering higher
education. The analyses do not show the impact of debt on prospective students’ actual behavior,
choices, and decision making. The relationship between attitudes toward debt and actual debt is
unclear. We cannot assume that attitudes towards debt affect borrowing behavior. Both cognitive
dissonance theory (Festinger 1962) and self-perception theory (Bem 1972) suggest that, if people
must acquire debt, they will adjust their attitudes so that they accept debt. Debates about the
relationship between attitudes and behaviour have a long history in social science. The potentially
powerful impact of perceptions of actuality on behaviour is well established (Kettley et al 2008).
Nor can we assume from this cross-sectional study any causal inferences or that debt averse
attitudes result in non-participation. This conclusion would require a longitudinal study tracking
students from high school into higher education or alternative paths. This is one area for future
research. Another is overcoming other methodological constraints in demonstrating causal links and
the need for studies that include randomized controls and/or exploit quasi-experimental situations.
30
Our exploration of prospective students’ higher education intentions and attitudes toward debt from
cross-sectional surveys, which no other study has attempted, demonstrates changes over time and
provides useful insights for policy. It contributes to the large extant literature on the determinants
of, and socio-economic differences in, higher education participation. This study is a useful
reminder to policymakers, higher education institutions, and researchers that academic attainment
alone cannot explain these variations. Student debt aversion also plays a role, challenging the
mindset that the problem of unequal higher education participation lies primarily within the
secondary schooling system. Although higher education participation rates have continued to grow
in England, despite rises in tuition and student loan debt, policymakers and some researchers, also
need to recognize that such changes can influence higher education enrolments, especially among
underrepresented groups. Indeed, England’s student funding system, predicated on the
accumulation of student loan debt, potentially undermines widening participation policies rather
than broadening and equalizing higher education participation. Income-contingent loans are not
necessarily a protection against this, or student loan debt aversion.
Yet, in September 2016, maintenance grants for low-income students were abolished again and
replaced with larger loans, leading to further rises in debt for the poorest 40 percent of students
from an estimated £40,500 ($52,383) to £53,000 ($68,55) (Britton et al. 2015b). In September 2017,
the tuition cap will be increased to £9,250 while the repayment threshold on loans is to be frozen
retrospectively. Debt will be highest among those from the lowest-income families. Will yet more
prospective low-income students be deterred from entering higher education and have limited
higher education opportunities because of fear of debt?

31
APPENDIX A: STATISTICAL TABLES
Table A1: National profiles of students aged 17-21 studying for university entry-level
qualifications, England, analysed by type of educational institution and type of qualification,
2002 and 2015
Educational Institution 2002 2015
% of total students
studying for
university entry-level
qualifications
State schools-A/AS levels 32 34
Independent schools-A/AS levels 8 8
Further education sector-A/AS levels 35 21
Further education sector-Vocational Level 3 24 30
State schools-Vocational Level 3 2 7
Total 100 100
Sources:
2002: Derived from Callender (2003, Annex 1); Callender and Jackson (2005) who made use of data supplied for
England by the Learning and Skills Council (private communication) and DfES Statistical First Release 16/2002; and
analysis of Labour Force Survey data for 2002 (Spring quarter).
2015: Derived from https://www.gov.uk/government/publications/participation-in-education-training-and-employment-
by-16-to-18-year-olds-in-england-end-2012 (extrapolated to 2015); and analysis of Labour Force Survey data for 2015
(Spring quarter).
32
Table A2: Descriptive statistics for variables used in multivariate analysis
A: 2002
Variable Obs Mean Std. Dev. Min Max
------------ --------- ------------- ------------ ---------- -----------
HE participation 1028 0.81 0.40 0 1
Male 1028 0.41 0.49 0 1
Female 1028 0.58 0.49 0 1
Gender_not
stated 1028 0.01 0.10 0 1
Age1718 1028 0.55 0.50 0 1
Age1921 1028 0.45 0.50 0 1
White 1028 0.78 0.41 0 1
Nonwhite 1028 0.20 0.40 0 1
Ethnic group_not
stated 1028 0.02 0.13 0 1
Independent
school 1028 0.16 0.37 0 1
State school 1028 0.28 0.45 0 1
FE college 1028 0.57 0.50 0 1
Upper-class 1028 0.43 0.50 0 1
Middle-class 1028 0.21 0.40 0 1
Lower-class 1028 0.22 0.42 0 1
Social class not
known 1028 0.14 0.35 0 1
Family
encouragement 1028 0.92 0.27 0 1
Family support 1028 0.60 0.49 0 1
At least one
parent attended
university 1028 0.35 0.48 0 1
Social advantage
index 1028 1.87 0.83 0 3
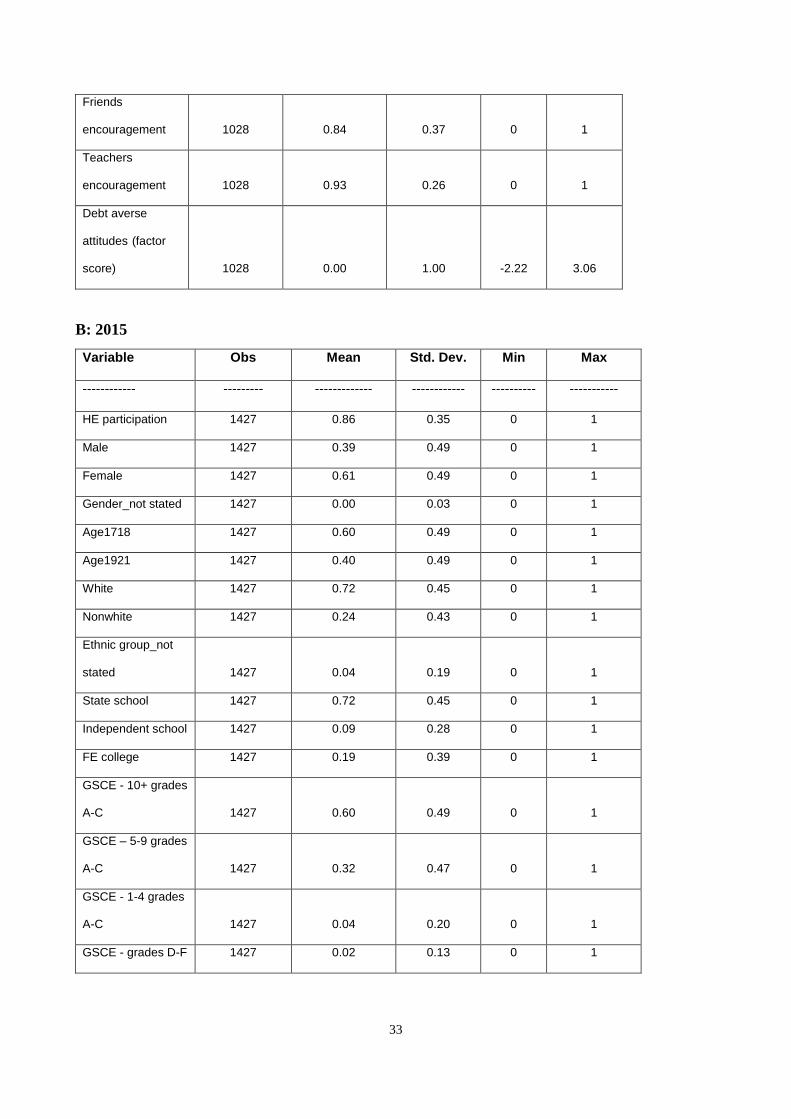
33
Friends
encouragement 1028 0.84 0.37 0 1
Teachers
encouragement 1028 0.93 0.26 0 1
Debt averse
attitudes (factor
score) 1028 0.00 1.00 -2.22 3.06
B: 2015
Variable Obs Mean Std. Dev. Min Max
------------ --------- ------------- ------------ ---------- -----------
HE participation 1427 0.86 0.35 0 1
Male 1427 0.39 0.49 0 1
Female 1427 0.61 0.49 0 1
Gender_not stated 1427 0.00 0.03 0 1
Age1718 1427 0.60 0.49 0 1
Age1921 1427 0.40 0.49 0 1
White 1427 0.72 0.45 0 1
Nonwhite 1427 0.24 0.43 0 1
Ethnic group_not
stated 1427 0.04 0.19 0 1
State school 1427 0.72 0.45 0 1
Independent school 1427 0.09 0.28 0 1
FE college 1427 0.19 0.39 0 1
GSCE - 10+ grades
A-C 1427 0.60 0.49 0 1
GSCE – 5-9 grades
A-C 1427 0.32 0.47 0 1
GSCE - 1-4 grades
A-C 1427 0.04 0.20 0 1
GSCE - grades D-F 1427 0.02 0.13 0 1
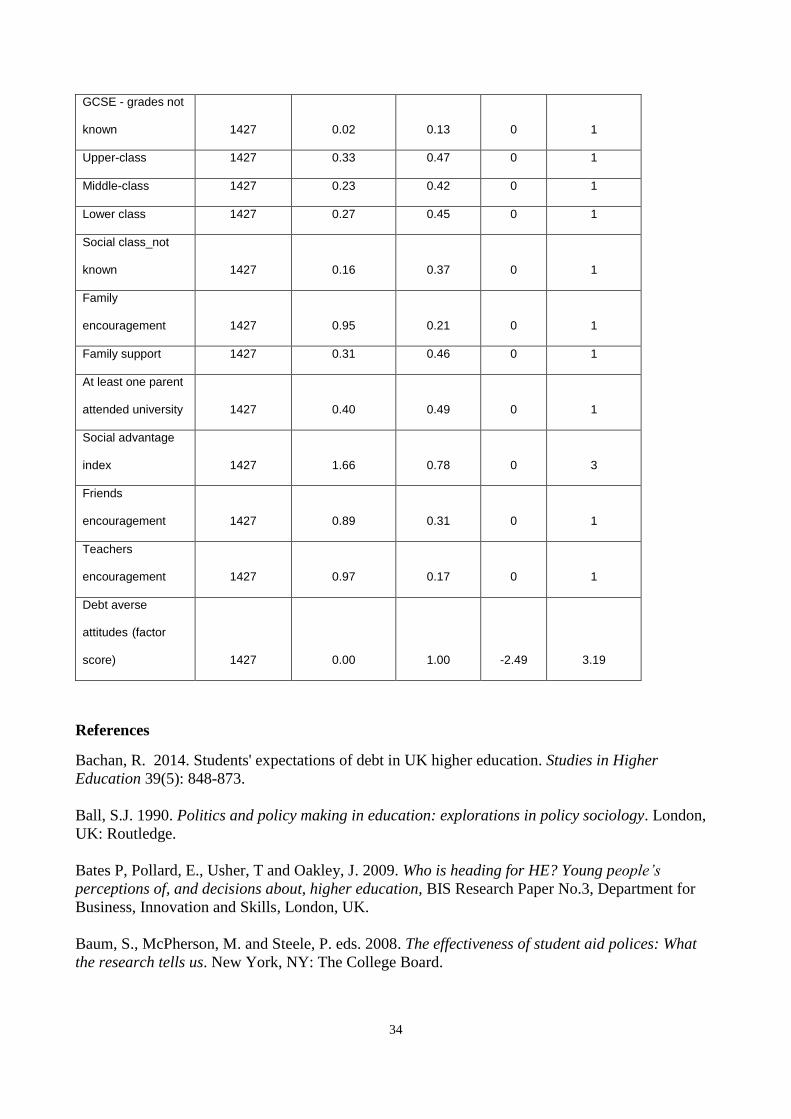
34
GCSE - grades not
known 1427 0.02 0.13 0 1
Upper-class 1427 0.33 0.47 0 1
Middle-class 1427 0.23 0.42 0 1
Lower class 1427 0.27 0.45 0 1
Social class_not
known 1427 0.16 0.37 0 1
Family
encouragement 1427 0.95 0.21 0 1
Family support 1427 0.31 0.46 0 1
At least one parent
attended university 1427 0.40 0.49 0 1
Social advantage
index 1427 1.66 0.78 0 3
Friends
encouragement 1427 0.89 0.31 0 1
Teachers
encouragement 1427 0.97 0.17 0 1
Debt averse
attitudes (factor
score) 1427 0.00 1.00 -2.49 3.19
References
Bachan, R. 2014. Students' expectations of debt in UK higher education. Studies in Higher
Education 39(5): 848-873.
Ball, S.J. 1990. Politics and policy making in education: explorations in policy sociology. London,
UK: Routledge.
Bates P, Pollard, E., Usher, T and Oakley, J. 2009. Who is heading for HE? Young people’s
perceptions of, and decisions about, higher education, BIS Research Paper No.3, Department for
Business, Innovation and Skills, London, UK.
Baum, S., McPherson, M. and Steele, P. eds. 2008. The effectiveness of student aid polices: What
the research tells us. New York, NY: The College Board.
35
Baum, S and Schwartz, S. 2013. Student aid, student behavior, and educational attainment, George
Washington University, Washington, D.C.
Bem, D. J. 1972. Self perception theory. Advances in experimental social psychology 6:1–62
Boatman, A., Evans, B., and Soliz, A. 2016. Understanding loan aversion in education: evidence
from high school seniors, community college students, and adults, CEPA Working Paper No.16-15.
Stanford Center for Education Policy Analysis, Stanford, CA.
Britton, J., Dearden, L., Shephard, N. Vignoles, A. 2015a. How English-domiciled graduate
earnings vary with gender, institution attended, subject and socio-economic background. IFS
Working Paper W16/06. Institute for Fiscal Studies, London, UK.
Britton, J., Crawford, C., and Dearden, L. 2015b. Analysis of the higher education funding reforms
announced in Summer Budget 2015. IFS Briefing Note BN174. Institute for Fiscal Studies, London,
UK.
Brynin, M. 2013. Individual choice and risk: The case of higher education. Sociology, 47: 284–300.
Burdman, P. 2005. The student debt dilemma: Debt aversion as a barrier to college access,
University of California, Center for Studies in Higher Education, Berkeley, CA.
Caetano, G., H. Patrinos, and M. Palacios. 2011. Measuring aversion to debt: an experiment among
student loan candidates. Policy Research Working Paper 5737. World Bank, Washington, D.C.
Callender, C. (forthcoming) Cost-sharing and student support in P. Scott, J. Gallacher, and G. Parry
(eds) (forthcoming) New landscapes and languages in higher education, Oxford: Oxford University
Press.
Callender, C. and Jackson, J. 2008. Does fear of debt constrain choice of university and subject of
study? Studies in Higher Education 33 (4):405–429.
Callender, C. and Jackson, J. 2005. Does fear of debt deter students from higher education? Journal
of Social Policy 34 (4):509-540.
Callender, C. and Scott, P. eds. 2013. Browne and Beyond: Modernizing English Higher Education,
London: Institute of Education Press
Callender, C. and Wilkinson D. 2003. 2002/03 Student income and expenditure survey: students’
income, expenditure and debt and changes since 1998. Research Report No. 487. Department for
Education and Skills, Nottingham, UK.
Carey, K. 24 Jan 2015. A quiet revolution in helping lift the burden of student debt. New York
Times.
Cardak, B. and Ryan, C. 2009. Participation in higher education in Australia: equity and access.
Economic Record 85(271):433-448.
Chowdry, H., Dearden, L., Goodman, A. and Jin, W. 2012. The distributional impact of the 2012–
13 higher education funding reforms in England. Fiscal Studies, 33: 211–36.

36
College Board. 2015. Trends in student aid 2015. Available from
https://trends.collegeboard.org/sites/default/files/trends-student-aid-web-final-508-2.pdf (Accessed
7/4/2016)
Crawford, C. and Dearden, L. 2010. The impact of the 2006-07 higher education finance reforms
on higher education participation. BIS Research Paper number 12, Department for Business,
Innovation and Skills, London, UK.
Crawford, C and Jin, W. 2014. Payback time? Student debt and loan repayments IFS Report R93.
Institute for Fiscal Studies, London, UK.
Cunningham, A. and Santiago, D. (2008). Student aversion to borrowing: Who borrows and who
doesn’t. Washington DC: Institute for Higher Education Policy.
Davies, E., and Lea, S. E.G. 1995. Student Attitudes to Student Debt. Journal of Economic
Psychology 16 (4): 663–79
Dearden ,L., Fitzsimons,E., Wyness, G. 2010. The impact of higher education finance on university
participation in the UK, BIS Research Paper 11, Department for Business Innovation and Skills,
London, UK.
Department for Business, Innovation and Skills (DBIS). 2011. Higher education: Students at the
heart of the system, Cm 8122, London: Stationery Office.
Department for Education (DfE). 2016. Participation rates in higher education: Academic years
2006/2007 – 2014/2015 (Provisional). SSFR 45/2016. Available from
https://www.gov.uk/government (Accessed 9/28/2016)
Department of Education for Education and Employment (DfEE). 1998. Blunkett welcomes
Teaching and Higher Education Act. DfEE, Press Release 17 July.
Department for Education and Skills (DfES). 2003. The Future of Higher Education. Department
for Education and Skills, Cm 5735, London: DfES.
Dohmen, T., Falk, A., Huffman, D., Sunde, U., Schupp, J., and Gert G. Wagner. 2011. Individual
Risk Attitudes: Measurement, Determinants, and Behavioral Consequences. Journal of the
European Economic Association 9 (3): 522–50.
Dynarski, S. and Scott-Clayton, J. 2013. Financial aid policy: Lessons from research. Future of
Children, 23(1).
Esson, J. and Ertl, H. 2016. No point worrying? Potential undergraduates, study-related debt, and
the financial allure of higher education. Studies in Higher Education 41(7):1265-1280.
Festinger, L. 1962. A Theory of Cognitive Dissonance, London: Tavistock
Field, E. 2009. Educational debt burden and career choice: Evidence from a financial aid
experiment at NYU Law School. American Economic Journal: Applied Economics 1(1):1-21.
37
Goldrick-Rab, S. and Kelchen, R. 2015. Making Sense of Loan Aversion: Evidence From
Wisconsin.’ In Student Loans and the Dynamics of Debt, eds. B. Hershbein and K. Hollenbeck .
Kalamazoo, MI: W.E. Upjohn Institute for Employment Research, 317-378.
Green, F., and Zhu, Y. 2010. Overqualification, job dissatisfaction, and increasing dispersion in the
returns to graduate education. Oxford Economic Papers 62 (4):740-763.
Harrison, N., Agnew, S., Serido, J. 2015a. Attitudes to debt among indebted undergraduates: A
cross-national exploratory factor analysis. Journal of Economic Psychology 46: 62–73.
Harrison, N., Chudry, F., Waller, R., & Hatt, S. 2015b. Towards a typology of debt attitudes among
contemporary young UK undergraduates. Journal of Further and Higher Education 39(1): 85-107.
Haultain, S., Kemp, S., and Chernyshenko, O. 2010. The structure of attitudes to student debt.
Journal of Economic Psychology 31 (3):322–30.
Heller, D. 1997. Student price response in higher education: An update to Leslie and Brinkman.
Journal of Higher Education 68 (6):624–59.
HEFCE (Higher Education Funding Council for England). 2005. Young participation in higher
education. Higher Education Funding Council for England, Bristol, UK.
Hemelt, S. and Marcotte, D. 2011. The impact of tuition increases on enrollment at public colleges
and universities, Educational Evaluation and Policy Analysis 33(4): 435-457.
Johnson, C. and Montmarquette, C. 2011. Loan aversion among Canadian high school students.
Scientific Series. CIRANO. Available from http://www.cirano.qc.ca/pdf/publication/2011s-67.pdf
(Accessed 7/20/2016)
Johnstone, D.B., and Marcucci, P. 2010. Financing higher education worldwide: Who pays? who
should pay? Baltimore: Johns Hopkins University Press.
Kettley, N., Whitehead, J. M., and Raffan, J. 2008. Worried women, complacent men? Gendered
responses to differential student funding in higher education. Oxford Review of Education 34
(1):111–129.
Kogan, M. 1975. Educational policy-making: a study of interest groups and parliament. London:
George Allen and Unwin.
Lea, S., Webley, P., and Bellamy, G. 2001. Student debt: expecting it, spending it and regretting it.
In The causes and consequences of undergraduate borrowing in the UK, eds. A. Scott, A. Lewis,
and S. Lea, 49-58. Bristol: Policy Press.
Leslie, L., and Brinkman, P. 1987. Student price response in higher education: The student demand
studies. Journal of Higher Education 58 (20):181–204.
London Economics. 2010. Review of student support arrangements in other countries, BIS
Research Paper No 10, Departments for Business, Innovation and Skills, London, UK.
38
Long, B. 2008. What is known about the impact of financial aid? Implications for policy. National
Center for Postsecondary Research Working Paper, New York, NY. Available from
http://www.postsecondaryresearch.org/i/a/document/6963_LongFinAid.pdf (Accessed 20/08/2010)
McMahon, W. 2009. Higher learning, greater good: The private and social benefits of higher
education. Baltimore: Johns Hopkins University Press.
National Committee into Higher Education (NCIHE). 1997. Higher Education in the Learning
Society, Main Report, HMSO London, UK.
Office for Fair Access (OFFA) 2015. Access agreements for 2016-17: key statistics and analysis.
Available from https://www.offa.org.uk (Accessed 7/11/2016)
Office for National Statistics (ONS). 2016. Household disposable income and inequality: financial
year ending 2015. Available from http://www.ons.gov.uk (Accessed 7/11/2016)
Office for National Statistics (ONS). 2015. Annual Survey of Hours and Earnings: 2015
Provisional Results. Available from http://www.ons.gov.uk (Accessed 7/11/2016)
Oosterbeek, H., and van den Broek, A. 2009. An empirical analysis of borrowing behaviour of
higher education students in the Netherlands. Economics of Education Review 28 (2):170–77.
Palameta, B. and Voyer, J.P. 2010. Willingness to pay for postsecondary education among under-
represented groups. Higher Education Quality Council of Ontario, Toronto, Canada.
Perna, L. 2008 Understanding high school students’ willingness to borrow to pay college prices.
Research in Higher Education 49:589–606.
Perna, L. 2006. Studying college choice: A proposed conceptual model. In Higher education:
Handbook of theory and research, ed. J. C. Smart, XXI: 99–157. Dordrecht, Netherlands: Springer.
SMCPC. 2015. Bridging the Social Divide. Social Mobility and Child Poverty Commission,
London, UK.
Student Loans Company (SLC). 2015. Student support for higher education in England 2015:
2014/15 payments, 2015/6 awards, SLC SFR 05/2015. Available from http://www.slc.co.uk
(Accessed 7/4/2016).
Trow, M. 1973. Problems in the transition from elite to mass higher education. Carnegie
Commission of Higher Education, Berkley, CA.
UCAS. 2015. End of Cycle Report 2015 Available from https://www.ucas.com (Accessed
7/4/2016)
Wilkins, S., Shams, F., and Huisman, J. 2013. The decision-making and changing behavioural
dynamics of potential higher education students: the impacts of increasing tuition fees in England.
Educational Studies 39(2):125-141.
39
Endnotes
1 The research for this paper has been supported by the Economic and Social Research Council
(grant reference ES/J019135/1ESRC) via the Centre for Research on Learning and Life Chances
(LLAKES), UCL Institute of Education, London. We are grateful to the ESRC and LLAKES for
their financial support, to Julia Griggs and Klaudia Lubian (at the National Centre for Social
Research, London) who administered the survey and advised on its design, and to the students who
participated in the survey. We also thank Francis Green, John Thompson, LLAKES seminar
participants, and especially Laura Perna and Nick Hillman, for helpful comments on previous
versions of this paper. Responsibility for remaining errors is ours alone.
2 Higher education policy within the UK is devolved and funding policies have diverged, leading to
English students having the highest debt levels. The reforms discussed relate only to English
domiciled students studying full time at public universities. The financial support available to full-
and part-time students differs. The vast majority of English higher education institutions are public
with only a few private universities. Unlike the US, in England a student loans private market
hardly exists. Discussion about loans in this paper refers exclusively to government-funded loans,
which are administered and distributed by the government-owned Student Loans Company.
3 For an exploration of the global rise of cost sharing see Callender (forthcoming).
4 Exchange rate £1=$1.29, August 8, 2016.
5 In 2010, the government promised that, from April 2017, this threshold would rise annually with
average earnings. In October 2015, after our 2015 survey was completed, the government withdrew
this promise.
6 A-Levels are a national General Certificate of Education qualification usually taken in the final
two years of secondary schooling (years 12 and 13) and are traditionally a prerequisite for
university entry. For details of the classification of qualifications on this framework in the UK, see:
https://www.gov.uk/what-different-qualification-levels-mean/compare-different-qualification-
levels.
7 Further details of response rates and cognitive testing in the process of questionnaire development
are available from the authors on request.
8 The main reason for focussing on England alone was that diverged UK student funding policies
have contributed to higher levels of student debt in England. The upper age limit in 2015 was
dictated by the fact that ILR records only contained linked data for students up to age 21.
9 Missing values were disproportionately concentrated among non-white students in 2002 and
female students in 2015. Only 7-8 percent of cases were missing values. When these cases are
included in analyses that do not include measures of debt attitudes, there is very little difference in
the patterns of inference relating to non-white students in 2002 and female students in 2015 from
estimates that exclude these cases. Results available from authors on request.
40
10 For definitions of social classes, see notes to Table 5.
11 The Labour Force Survey (LFS) is a quarterly survey of the employment circumstances of the
UK population and is the largest household survey in the UK.
12 Factor test scores for summary measure of debt averse attitudes: 2002: Cronbach’s alpha measure
of internal reliability: 0.633; Kaiser-Meyer-Olkin measure of sampling adequacy: 0.649; Bartlett’s
test of sphericity: p<0.001; 2015: Cronbach: 0.631; Kaiser-Meyer-Olkin: 0.621; Bartlett: p<0.001.
13 This finding shows the sensitivity of our results to both the geographical coverage and the age-
range of the sample. In earlier analysis of the 2002 sample (which covered the whole UK and not
just England) and included a proportion of students aged 22 and older as well as 17-21 year olds,
Callender and Jackson (2005, Table 3) found that upper-class students were significantly less likely
than lower-class students to be debt averse. When we apply the same specifications shown in Table
5, Columns 1 and 3, to the full 2002 sample used by Callender and Jackson (2005), we obtain
similarly clear evidence that upper class students are significantly less likely than lower-class
students to be debt averse. Analyses available from authors on request.
14 When we apply the same specifications shown in Table 6 to the UK-wide 2002 sample of
students (including some aged 22 and older) that was used by Callender and Jackson (2005), we
find a significant negative association between debt averse attitudes and planned higher education
participation in that year (and particularly planned higher education participation by lower-class
students). Results available from authors on request.

For more information, please contact [email protected]
LLAKES Centre
UCL Institute of EducationUniversity College London
20 Bedford WayLondon WC1H 0AL
U.K.