does sensationalism affect executive compensation ... · evidence from pay ratio disclosure reform...
TRANSCRIPT

Does Sensationalism Affect Executive Compensation? Evidence from Pay Ratio Disclosure
Reform
Abstract
Beginning in 2018, publicly-traded U.S. firms were required to report the ratio of the chief
executive officer’s (CEO) compensation to that of the median employee’s compensation in the
annual proxy statement. Our study examines the effect of the mandated pay ratio disclosure on
executive compensation. We find that pay ratio disclosure leads to declines in both total
compensation and pay-for-performance sensitivity for CEOs relative to chief financial officers
(CFOs). Our effects are strongest for firms that are more sensitive to political pressure. Taken
together, our paper provides the first evidence that pay ratio disclosure achieves regulators’ goal
of curtailing CEO compensation but also leads to an unintended decline in pay-for-performance
sensitivity.
JEL Classification: G34, G38, M12, M52
Keywords: CEO compensation; pay ratio; disclosure; corporate governance; pay-for-
performance

1
1. Introduction
A rise in executive compensation over the past several decades has attracted intense
criticism from the media and public. In response, regulators imposed a wide range of regulatory
policies on executive compensation in recent decades, including changes in taxation, accounting
rules, and disclosure requirements (Murphy and Jensen, 2018). As part of this effort, the U.S.
Securities and Exchange Commission (SEC) on August 5, 2015 adopted a rule mandating that
publicly-traded companies disclose the ratio of the total compensation of the chief executive
officer (CEO) to the total compensation of the median employee in their annual proxy statements.
As evidenced by an extensive two-year comment period that provided an unprecedented
number of comment letters (SEC, 2015), the pay ratio rule triggered controversy as to whether
government intervention into executive compensation is necessary while raising questions
regarding the usefulness of the disclosure. These issues stem from the structure of the pay ratio
disclosure mandate, which reveals no new information on an executive’s compensation package
with which to evaluate the executive’s performance by providing only median employee
compensation as a new disclosure. In this paper, we empirically examine the effect of the pay ratio
disclosure mandate on both the level and mix of CEO compensation packages.
Broadly, existing literature on the economic consequences of mandatory executive
compensation disclosure can be distilled into two contradictory views. On the one hand, the
optimal contracting hypothesis adopts the view that compensation is determined by market forces
such that high levels of executive compensation arise as compensating differentials due to the
increased scrutiny and demands for performance placed on managers. This view suggests that
mandated compensation disclosure will lead to deviations from efficient contracting, with the
2
potential for increased executive compensation and decreased pay-for-performance sensitivity
(Jensen and Murphy, 1990; Hermalin and Weisbach, 2012).
In contrast, the underlying premise of the SEC’s mandate is that market forces alone cannot
restrain an entrenched manager’s rent-seeking behavior, as evidenced by excessive CEO
compensation. This premise is broadly consistent with the managerial power hypothesis that
maintains that the mandatory disclosure of compensation information should lead to reduced
executive compensation and increased pay-for-performance sensitivity as a result of increased
transparency and public awareness of executive compensation. This transparency renders boards
more reluctant to adopt suboptimal compensation policies that are now publicly-visible (e.g., Lo,
2003; Bebchuk and Fried, 2004; Park et al., 2001) and/or provides directors with greater
information to more effectively participate in the contracting process (Lo, 2003).
Empirically, it is difficult to assess the effect of mandated disclosure on CEO compensation
because any such effect is likely to be confounded by contemporaneous changes in the real
economy. Moreover, regulatory changes generally affect all firms in the economy simultaneously,
making it challenging to identify proper treatment and control groups (Edmans, Gabaix, and Jenter,
2017). To overcome this empirical challenge, we exploit the fact that unlike previous regulatory
changes that mandate more extensive disclosure regarding the features of executive compensation,
the pay ratio rule requires the disclosure of only median employee pay as part of the CEO pay ratio.
As a result, we employ a difference-in-differences design using chief financial officers (CFOs) as
a natural control group for CEO compensation. Using a balanced sample of matched CEO-CFO
pairs from 2013 to 2018 to avoid a sample period subject to changes in executive compensation
packages brought on by say-on-pay regulations, we regress total compensation and pay-for-
performance sensitivity on a CEO indicator, a post-disclosure indicator, and its interaction. We

3
also control for firm and executive characteristics known to influence executive compensation
packages (e.g., investment opportunities, recent stock market performance, CEO age) and include
year-fixed effects to mitigate the influence of compensation trends and firm- or industry-fixed
effects to mitigate the effects of unobservable and time-invariant differences across firms. As a
result, our difference-in-differences test attempts to isolate the effect of the CEO pay ratio on the
executives referenced in the mandated disclosure. Including CFO observations for the sample of
affected firms as a natural control mitigates concerns that existing economic conditions and
competing regulatory changes confound our results.
We begin our analysis of the consequences of pay ratio reform by examining the
fundamental policy question of whether the pay ratio disclosure curtails CEO compensation. We
find that, relative to CFOs, CEOs experienced a decline in executive compensation following the
pay ratio implementation. In terms of economic significance, CEO compensation declines by three
percent relative to CFO compensation (approximately $200,000 for the average CEO) following
pay ratio disclosure. To some extent, this is consistent with advocates’ expressed intentions for the
pay ratio reform. In a letter to the SEC intended to speed its implementation, proponents of the act
argued that “pay ratio disclosure helps investors evaluate the relative value a CEO creates, which
facilitates better checks and balances against insiders paying themselves runaway compensation”
(Menendez, 2017).
Next, to assess the economic effects of pay ratio reform from a shareholder wealth
maximization perspective, we explore how pay ratio reform affects pay-for-performance
sensitivity using a similar research design to examine whether pay ratio regulation differentially
affects CEO and CFO compensation packages. To measure pay-for-performance sensitivity, we
utilize option delta, which captures the sensitivity of an executive’s wealth to a one percent change

4
in stock price (Core and Guay, 2002). To the extent that the perceived pressure induces boards to
enhance incentive alignment, we should find an increase in delta. This argument is consistent with
mandated disclosure improving contracting frictions through mitigating captured boards via
providing investors access to better information (Lo, 2003). However, Jensen and Murphy (1990)
note that political pressure can result in additional scrutiny of board members, who may be risk-
averse in offering an incentive-laden compensation contract.
Consistent with concern over potential political pressure, our second main finding is that
the pay ratio implementation causes a decline in pay-for-performance sensitivity for CEOs relative
to CFOs. We find that CEO delta decreases by 7% to 12% following the implementation of the
pay-ratio, suggesting that boards are reducing the level of incentive-based pay for CEOs post-
reform. Because the pay ratio disclosure provides no new information on either CEO or CFO
compensation but rather discloses the median employee’s total compensation as additional
information, the heterogeneous results between CEO and CFO are not driven by informational
differences in their compensation disclosure. Notably, our collective results do not perfectly align
with the optimal contracting or the managerial power hypotheses, as we observe a decline in both
executive compensation and a decline in pay-performance sensitivity.
One plausible alternative explanation for our results is that there is a contemporaneous time
trend over our sample period, where boards increasingly provide differential pay packages to
CEOs and CFOs. In contrast to a time trend explaining our results, we find that the relative decline
in CEO compensation and pay-performance appears isolated to the pay ratio implementation year.
Empirical analyses further confirm that the level and performance sensitivity of CEO and CFO
compensation exhibit parallel trends during the pre-disclosure period.
5
We next conduct tests to determine the portion of compensation and subset of executives
that are more sensitive to the implementation of pay ratio reform. Core, Guay, and Larcker (2008)
argue that press coverage of executive compensation tends to be more negative (i.e.,
sensationalistic) for the non-cash based portions of executive compensation. Decomposing
executive compensation into its cash and non-cash components, we find that the proportion of
executive compensation paid in cash relative to total compensation is larger for CEOs following
the implementation of pay ratio reform. Relatedly, Murphy and Jensen (2018) posit that the pay
ratio disclosure was designed to arouse political pressure. To test the political pressure hypothesis,
we split our sample based on empirical proxies for sensitivity to populist political pressures, such
as firm size and media coverage (Watts and Zimmerman 1983; Jensen and Murphy 1990). We find
that CEOs leading larger firms, firms with more employees, and firms with more media coverage
exhibit stronger declines in total compensation and pay-for-performance relative to CFOs
following the pay ratio reform. Using information from the pay ratio disclosure, we find evidence
that our results are concentrated in firms with below-median employee compensation, which are
likely more susceptible to populist political pressure. Taken together, our findings suggest that
political pressure curtails CEO compensation, but at the same time distorts optimal compensation
contracts by reducing pay-for-performance sensitivity.
Our study contributes to the literature in several ways. First, previous studies on the relation
between disclosure and CEO compensation argue and find that mandated disclosure is associated
with increases in executive compensation (e.g., Murphy, 2012; Hermalin and Weisbach, 2012;
Park, Nelson, and Huson, 2001; Lu and Shi, 2018; Gipper, 2016). Existing studies attribute rises
in compensation to mandated disclosures that either make CEOs more aware of outside options,
and/or bind board members to paying out incentive compensation by publicly revealing their
6
compensation strategy. Unique to the pay ratio disclosure mandate, there is no new information
available on an executive’s compensation by which to evaluate the executive’s performance; only
the median employee compensation is a new disclosure. Consistent with the pay ratio disclosure
mandate primarily inciting sensationalism by the financial press rather than enhancing
transparency regarding the CEO’s pay package, pay ratio disclosures are associated with both a
drop in the level of CEO compensation and a decline in pay-for-performance relative to CFOs.
Second, our difference-in-differences design using CEO-CFO pairs allows us to plausibly
isolate the effect of the CEO pay ratio disclosure from contemporaneous rule changes and a general
time-trend. Often, simultaneous changes to tax and financial reporting regulations render causal
inferences difficult in compensation studies. For instance, enhanced compensation disclosure in
the 1990s was coupled with changes in tax deductibility of non-performance-related compensation
(e.g., Perry and Zenner, 2001). Similarly, recent changes in compensation disclosure as a result of
the JOBS Act were simultaneously introduced with several major changes to financial reporting
and governance mandates, including say-on-pay (e.g., Gipper, 2016; Dambra, Field, and Gustafson,
2015). Using a difference-in-differences design in a plausibly exogenous setting, our study
provides for a stronger causal link between mandated disclosure and CEO compensation.
Finally, our findings are policy-relevant because, along with Balsam and Liang (2019), we
provide the first evidence on the economic consequences to mandating pay ratio disclosure.1 Our
evidence suggests that pay ratio disclosure allows outside pressure from “uninvited guests”
(Murphy and Jensen, 2018) to influence compensation contracts and causes declines in both total
compensation and pay-for-performance sensitivity. Although there is room for debate on whether
1 In a contemporaneous working paper, Balsam and Liang (2019) document a decline in CEO compensation
following pay ratio reform. Our paper differs in that we (1) examine pay-for-performance sensitivity and (2) provide
analyses investigating the role of political pressure.

7
a decline in total executive compensation is value-enhancing for shareholders, reduced
performance sensitivity suggests a deviation from optimal contracting. Thus, we urge policy-
makers to carefully evaluate the economic effects of intervening into executive compensation and
grant some validity to the U.S. Treasury Department’s recent call to repeal pay ratio disclosure
(Ackerman and Rubin, 2017).
2. Background, Literature, and Hypotheses
2.1. Pay Ratio Background and Description
In response to populist criticisms by the media and general public of excessive levels of
executive compensation when compared to rank-and-file employees, Congress passed Section 953
(b) of the Dodd-Frank Act (hereafter pay ratio disclosure) on July 21, 2010 and directed the SEC
to amend Item 402 of Regulation S-K, which details reporting requirements on executive
compensation. Under the pay ratio disclosure reform, publicly-traded companies are required to
disclose (1) the median annual compensation of all employees (excluding the CEO), (2) the annual
total CEO compensation, and (3) the ratio between these two numbers (SEC, 2015).
The enactment of pay ratio disclosure was highly controversial as the SEC received more
than 287,400 comment letters over the rule (SEC, 2015). Proponents, mostly consisting of pension
funds, unions, and shareholder activists, assert that the new disclosure requirement would help
inform shareholder decisions (e.g., say-on-pay voting) on CEO pay, root out ineffective pay
practices that led to the financial crisis, and eventually reduce the income inequality in the U.S. In
contrast, critics raise questions about the effectiveness of pay ratio disclosure. They contend that
the disclosure would not be comparable across different companies, which substantially limits its
informational value (Murphy, 2012). Other commenters point out that the pay ratio disclosure
would incur high computational costs, especially for multinational companies (SEC, 2015).

8
After an extensive comment period, the SEC adopted the final rule to implement the pay
ratio disclosure in August 2015. The final rule dictates that public companies should disclose all
requirements described above for fiscal periods beginning on or after January 1, 2017. 2 On
February 6, 2017, the acting Chairman of SEC, Michael Piwowar, directed staff to reconsider the
implementation of pay ratio disclosure based on any comment submitted within the next 45 days
(SEC, 2017). This evoked strong opposition from unions, pension funds, and shareholder activists,
and the SEC subsequently canceled its plan for delaying the implementation of pay ratio disclosure.
Appendix A provides an example pay ratio disclosure for Fleetcor Technologies, Inc. Firms
must report the CEO’s pay consistent with that disclosed in a summary compensation table in an
annual proxy statement, which includes total salary, bonus, equity awards, pension changes, and
perquisites. The denominator of the pay ratio reports a firm’s median employee compensation.
According to the rule, median employees can be determined using either the full population of
employees or statistical sampling of employees using the same compensation calculations that
apply to the CEO’s compensation (SEC, 2015). The median employee needs to be identified once
every three years. Fleetcor Technologies reports a pay ratio of 1,517:1, based on the total
compensation of its CEO ($52,643,810) and median employee ($34,700). In contrast to previous
compensation disclosure regulation, the CEO pay ratio does not provide any additional information
on the CEO’s pay. Instead, it merely provides a benchmark salary for a rank-and-file employee.
2.2 Predictions
2.2.1. CEO total compensation in response to compensation disclosure regulation
2 The rule does not apply to smaller reporting companies, emerging growth companies, foreign private issuers,
MJDS filers, or registered investment companies (SEC 2015-160).
9
Broadly, the literature on CEO compensation can be distilled into two competing
explanations based on a classic agency problem: the “managerial power hypothesis” and the
“optimal contracting hypothesis.”3
According to the optimal contracting hypothesis, the current level of CEO compensation
is the equilibrium price in the CEO labor market. From this point of view, government intervention
into compensation contracts, including expanded disclosure requirements, should prove
detrimental for efficiency, with the potential to generate unintended consequences (Murphy and
Jensen, 2018). Consistent with this argument, Hermalin and Weisbach (2012) argue that an
exogenously imposed increase in disclosure should lead to higher CEO compensation as a
compensating differential, as increased transparency and monitoring adversely affect managers.
Consistent with this argument, recent studies provide empirical evidence that improved
compensation disclosure is associated with an unintended rise in CEO pay (Park, Nelson, and
Huson, 2001; Balsam et al., 2016; Lu and Shi, 2018; Gipper, 2016). Similarly, Murphy (2012)
argues that companies tend to circumvent regulations on executive pay in ways that generate
unexpected consequences including increased CEO pay. Iliev and Vitanova (2019) investigate the
effect of say-on-pay votes, an alternative compensation provision in the Dodd-Frank Act, on CEO
compensation and document that the say-on-pay governance mandate is associated with a rise in
CEO compensation.
In contrast, the managerial power hypothesis maintains that suboptimal compensation
contracts are widespread because inefficient corporate governance fails to suppress an entrenched
manager’s rent seeking behaviors (Bebchuk and Fried, 2004). As a consequence, the managerial
power hypothesis takes a positive view on mandatory compensation disclosure since the increased
3 Refer to Frydman and Jenter (2010), Murphy (2012), and Edmans et al. (2017) for a more detailed discussion.
10
transparency allows shareholders to better monitor captured boards and entrenched managers,
thereby aiding in identifying and extinguishing rent-seeking executive compensation contracts.
Consistent with this argument, Lo (2003) shows empirically that firms that lobbied against the
1992 revision of compensation disclosure rules in the U.S. experienced more positive abnormal
returns during key events that increased the probability of rule adoptions. His finding implies that
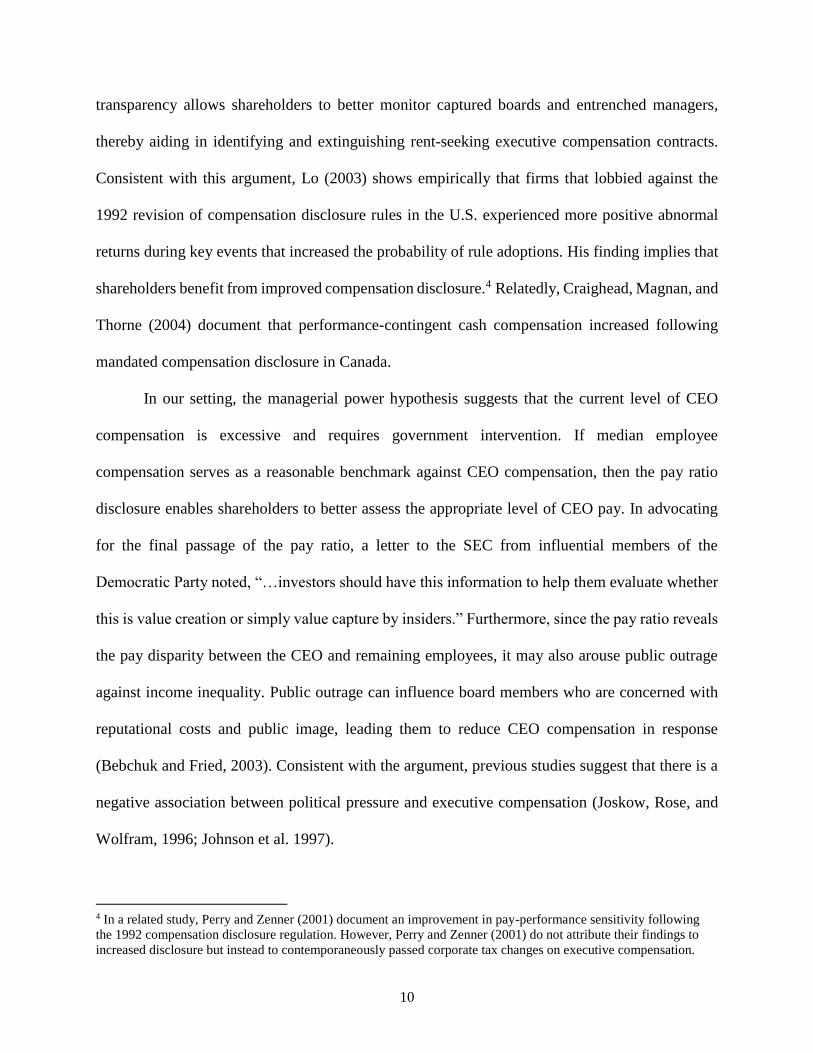
shareholders benefit from improved compensation disclosure.4 Relatedly, Craighead, Magnan, and
Thorne (2004) document that performance-contingent cash compensation increased following
mandated compensation disclosure in Canada.
In our setting, the managerial power hypothesis suggests that the current level of CEO
compensation is excessive and requires government intervention. If median employee
compensation serves as a reasonable benchmark against CEO compensation, then the pay ratio
disclosure enables shareholders to better assess the appropriate level of CEO pay. In advocating
for the final passage of the pay ratio, a letter to the SEC from influential members of the
Democratic Party noted, “…investors should have this information to help them evaluate whether
this is value creation or simply value capture by insiders.” Furthermore, since the pay ratio reveals
the pay disparity between the CEO and remaining employees, it may also arouse public outrage
against income inequality. Public outrage can influence board members who are concerned with
reputational costs and public image, leading them to reduce CEO compensation in response
(Bebchuk and Fried, 2003). Consistent with the argument, previous studies suggest that there is a
negative association between political pressure and executive compensation (Joskow, Rose, and
Wolfram, 1996; Johnson et al. 1997).
4 In a related study, Perry and Zenner (2001) document an improvement in pay-performance sensitivity following
the 1992 compensation disclosure regulation. However, Perry and Zenner (2001) do not attribute their findings to
increased disclosure but instead to contemporaneously passed corporate tax changes on executive compensation.
11
Since the pay ratio disclosure provides no new information on a CEO’s compensation, we
may also observe a null effect. For the pay ratio disclosure to have any impact, boards must expect
investors to respond to the newly required disclosure. Hirschleifer and Teoh (2003) argue that the
presentation of already available compensation information, such as option compensation expense,
can influence the responsiveness of investors to such disclosures.
In light of these competing arguments, the effect of pay ratio disclosure on the CEO
compensation level is an empirical question. Therefore, we test the following two-tailed null
hypothesis:
H1: Pay ratio disclosure does not affect the level of CEO compensation.
2.2.2. Pay-for-performance sensitivity
Consistent with agency-based arguments for efficient contracting in the level of CEO
compensation, previous literature argues that outside pressure similar to that of the pay ratio
disclosure may serve to weaken the association between executive pay and performance. Jensen
and Murphy (1990) note that compensation packages are heavily influenced by the political
process and sensationalism from the media, which places additional pressure on boards.5 They
note that risk-averse board members subject to such outside pressure from “uninvited guests” may
resist providing innovative contracts. The issue of external pressure on boards is likely to be
pronounced in the pay ratio setting, as the unique feature of the pay ratio disclosure is that it is
designed to reveal within-firm income inequality. To the extent that the pay ratio reform
emphasizes within-firm income inequality, we may observe a drop in pay-performance in
executive compensation following the disclosure mandate as a response to external pressure to
limit inequality.
5 In line with this argument, the recently proposed Accountable Capitalism Act would force corporations to focus on
goals beyond maximizing shareholder value by considering the interests of all company stakeholders (Warren 2018).

12
Despite these arguments, empirical evidence presented by existing studies largely suggests
that mandated executive compensation disclosure is associated with increased pay-for-
performance sensitivity. As executive compensation disclosure improves shareholder monitoring
and increases public awareness of executive compensation, boards become more reluctant to adopt
suboptimal compensation packages (Bebchuk and Fried, 2004). Consistent with the argument,
Park, Nelson, and Huson (2001) find that mandated compensation disclosure in Canada led to
more market-based compensation. Vafeas and Afxentiou (1998) find that the 1992 SEC regulation
on compensation disclosure was followed by an increase in pay-for-performance sensitivity.
Moreover, since the pay ratio reveals the gap between CEO and employee compensation, boards
may face increasing pressure from shareholders and the general public to justify high CEO
compensation and within-firm pay disparity. Consequently, boards have incentives to provide
evidence that executive pay is strongly associated with firm performance to satisfy shareholders
(Park, Nelson, and Huson, 2001).
Given these competing predictions, ex-ante it is unclear how pay ratio affects pay-for-
performance sensitivity. Accordingly, we again do not make a directional prediction and test the
following hypothesis:
H2: The pay ratio disclosure does not effect the pay-for-performance sensitivity of CEO
compensation.
2.2.3. CEO compensation and external pressure
Although many studies approach executive compensation from an agency perspective,
another branch of the literature suggests that the level and structure of executive compensation
will be influenced by external pressure (Jensen and Murphy, 1990; Murphy, 2012; Bebchuk and
Fried, 2003). Jensen and Murphy (1990) suggest that political pressure on executive compensation

13
could deteriorate efficient compensation arrangements by either truncating the upper tails of
executives’ earnings or reducing board members’ willingness to provide innovative incentive
contracts. On the contrary, Bebchuk and Fried (2003) maintain that public outrage can suppress
excessive executive compensation and improve pay-for-performance sensitivity. Based on the
notion, several studies examine the association between external pressure and CEO compensation.
For instance, Johnson, Porter, and Shackell (1997) find that negative media coverage of firm’s
compensation policy leads to a smaller increase in total compensation and a larger increase in the
sensitivity of compensation to firm performance. Huang et al. (2017) show that firms with high
unionization rates tend to pay their CEOs less, and CEO pay tends to be substantially reduced
before a union contract negotiation.
In the context of the pay ratio disclosure, pressure by external parties should drive cross-
sectional variation in the extent to which the pay ratio disclosure forces firms to alter the level of
CEO compensation and/or the pay-for-performance of the CEO’s compensation package. In line
with this idea, we examine whether the effects on the level of CEO compensation and pay-for-
performance are more pronounced for firms with greater scope for external pressure, either due to
their visibility or due to the presence of key stakeholder groups.
3. Data and Empirical Strategy
3.1. Data
We examine whether and how pay ratio disclosures affect executive compensation. To do
this, we examine executive compensation and pay-performance sensitivity for firms with fiscal
year-ends between December 31, 2013 and November 30, 2018. We begin our sample in 2013
following previous studies that suggest that say-on-pay votes alter the level and composition of
executive compensation (Larcker, McCall, and Ormazabal, 2015; Balsam et al., 2016; Iliev and

14
Vitanova, 2019). Our sample ends in November 2018 so that we observe one post-pay ratio
disclosure for each firm in our sample (comprising firms with fiscal years ending between
December 31, 2017 and November 30, 2018).
Our initial sample comprises 1,718 firms with data available on the Execucomp database
and 16,342 executive-years (covering CEOs and CFOs) for the period 2013-2018. We exclude
firms that lack executive compensation details and executives that serve a dual role. After matching
remaining CEOs and CFOs within the same firm, the sample consists of 1,613 firms and 12,984
executive-years (6,492 matched pairs) over our sample period. We require each executive-year to
have financial statement data from Compustat and stock return data from CRSP. We also exclude
foreign private issuers, smaller reporting companies, emerging growth companies, and firms that
do not disclose pay ratios. This process yields 11,854 executive-years (5,927 matched pairs).
Finally, we limit the sample to a balanced panel in which each firm (matched pair) is observed
every year during the sample period to isolate the effects of the pay ratio disclosure from
corresponding changes in the sample of firms and/or executives. Our final sample comprises of
561 firms and 5,610 executive years (2,805 matched pairs).
Table 1 presents summary statistics for all variables used in our main analysis. As expected,
CEOs have higher mean levels of total compensation and delta than their CFO counterparts. The
average CEO (CFO) earned total compensation of $6.7 million ($2.5 million). For a 1% increase
in stock price, the average CEO (CFO) earned an additional $551,400 ($109,170) in total wealth.
Table 2 reports Pearson correlations among CEO and CFO compensation variables.
Notably, there is a strong positive correlation (0.853) between CEO and CFO total compensation,
which is higher than the correlation (0.514) between CEO and director compensation documented
by Brick et al. (2006). Similarly, CEO delta is also strongly correlated with CFO delta (0.591).

15
The stronger correlation between CEO and CFO compensation variables than correlations between
the CEO and other executives/directors lends additional validity to our use of CEO and CFO as
treatment-control pairs in our difference-in-differences design.
3.2 Empirical Strategy
3.2.1. Control group
Factors such as firm characteristics and potentially contemporaneous legislative changes
unrelated to SEC rules make it difficult to isolate the effect of a single disclosure change on
executive compensation. For instance, the 1993 SEC Compensation Disclosure rules and IRS rules
on the tax deductibility of non-incentive compensation under Section 162(m) were enacted
simultaneously (Perry and Zenner, 2001). The ability of newly public firms to be exempt from
detailed executive compensation and disclosure analysis coincided with a similar exemption from
say-on-pay votes (e.g., Gipper, 2016; Dambra and Gustafson, 2019). Moreover, identifying a
suitable control group poses an empirical challenge since regulatory disclosure changes often
affect all firms simultaneously.
To address this empirical issue, we utilize a difference-in-differences design using CFOs
as a control group. A difference-in-differences design allows us to take advantage of a plausibly
exogenous change in mandated disclosure to separate the effect of pay ratio disclosure on executive
compensation from contemporaneous economic conditions. The pay ratio is also well-suited for
such an empirical design as there is no new additional information disclosed on an executive’s
compensation, as median employee pay is the only novel piece of information required.
3.2.2. Empirical Design
We estimate the following regression to test our hypotheses:
[Compensation Outcome]it = β0+β1CEOi+β2CEOi×Postt+ ∑βi Controls +εit (1)

16
We use two measures of Compensation Outcome as dependent variables in Eq. (1) in our
main analyses. To examine the effect of pay ratio disclosures on the level of CEO compensation,
our first dependent variable is Total Compensation. The pay ratio rule requires firms to compute
median employee pay in the same way that the CEO’s total compensation is calculated for the
summary compensation table in the proxy statement. We use the TOTAL_ALT1 field from
Execucomp to measure total executive compensation.6 To examine the effect on pay-performance
sensitivity, we define delta as the sensitivity of an executive’s wealth to a one percent change in
stock price (Core and Guay, 2002; Coles et al., 2006). Delta is calculated based on the Black-
Scholes (1973) option-pricing model modified by Merton (1973).7 Because prior literature shows
that the compensation distribution is skewed (e.g., Frydman and Jenter, 2010), we take the natural
logarithm of our compensation variables: Ln(Total Compensation and Ln(Delta).
CEO is an indicator variable set to one (zero) when the executive is a CEO (CFO). Post is
an indicator variable set to one when a firm’s fiscal year ends on or after December 31, 2017 to
capture the first fiscal period in which pay ratio disclosures are required in proxy statements, and
to zero otherwise. Our coefficient of interest is β2, the interaction of CEO and Post. This interaction
isolates the differential effect of pay ratio disclosure on CEOs relative to CFOs. The CEO indicator
controls for overall compensation differences between CEOs and CFOs and year-fixed effects
capture time-series variation in executive compensation packages.
Following previous studies on executive compensation (e.g. Kuhnen and Niessen, 2012;
Iliev and Vitanova, 2019), we also control for economic determinants of executive compensation,
6 TOTAL_ALT1 uses the grant date fair value of equity-based compensation regardless of whether equity-based
compensation vests, while TOTAL_SEC (total compensation as reported in SEC filings) includes the estimated fair
value of only equity-based compensation that vests (Hopkins and Lazonick, 2016). We use TOTAL_ALT1 instead
of TOTAL_SEC in order to isolate the compensation changes induced by the pay ratio disclosure. 7 See Coles et al. (2006) and Coles et al. (2013) for additional details on the computation of delta.

17
including firm size (Size), book-to-market ratio (BTM), financial leverage (Leverage), return on
assets (ROA), stock returns (Stock return), and stock return volatility (Volatility). We also control
for executive characteristics including employment tenure (Tenure), executive age (Age),
percentage of shares owned (Ownership), and firms where CEOs also serve as chair of the board
(CEO duality), since these factors, along with other firm characteristics, affect firms’ monitoring
needs and directors’ job difficulty (Brick et al., 2006). 8 Along with year-fixed effects, our
empirical specifications alternate between industry- (2-digit SIC) and firm-fixed effects to control
for time-invariant unobservable factors across industries or across firms that may affect executive
compensation. Finally, we winsorize all continuous variables at the top and bottom percentiles
separately by year to limit the effects of potential outlying observations.
4. Main results
4.1. Executive compensation surrounding the pay ratio disclosure
As an initial step in investigating the effect of pay ratio disclosure on CEO compensation,
we first compare the time-series variation of CEO and CFO compensation during the sample
period. Figure 2, Panel A confirms the strong upward trend in the mean value of both CEO and
CFO Ln(Total Compensation) during our sample period. The co-movement of CFO and CEO
compensation levels in the pre-disclosure period provides evidence that CFOs serve as a
reasonable control group in our study. Our identification strategy focuses on the trajectory of CEO
compensation relative to that of CFO compensation following pay ratio reform. As compared to
CFO compensation, the mean natural logarithm of CEO compensation exhibits a smaller upward
trajectory after the pay ratio reform. Figure 2, Panel B compares time trends of mean Ln(Delta)
during our sample period. As is the case with total compensation, CEO and CFO delta move in
8 Refer to Appendix B for details on how variables are constructed and data sources.

18
similar directions during the pre-disclosure period, exhibiting parallel trends. However, following
pay ratio reform, CEO delta declines whereas CFO delta increases. These results provide
preliminary evidence in favor of significant effects of the pay ratio reform. Our subsequent
empirical and cross-sectional analyses attempt to better isolate the effect of the CEO pay ratio on
executive compensation.
4.2. Main analysis
4.2.1. Total Compensation Analysis
Table 3 reports results of estimating Eq. (1). The dependent variable is the natural log of
inflation-adjusted executive compensation (TOTAL_ALT1) from Execucomp, Ln(Compensation).
Our independent variable of interest is the interaction of CEOi × Postit, which takes the value of
one for CEOs during the post-disclosure period and zero otherwise. All regressions include year-
fixed and either industry- or firm-fixed effects. We cluster standard errors by firm.
Consistent with the time-series pattern in Figure 2, Table 3 shows that the pay gap between
CEOs and CFOs declines following pay ratio reform. Model (1) provides a difference-in-
differences estimate without control variables. In model (1), the coefficient on CEOi × Postit is
negative and statistically significant. Our results are virtually unchanged when we include firm
and executive characteristics as controls in model (2). In models (3) and (4), we find similar
statistical evidence of a relative decline in compensation for CEOs when we include firm-fixed
effects. The coefficient of CEOi × Postit in model (3) of Table 3 is -0.031 and statistically
significant (two-tailed p-value < 0.10). In terms of economic significance, annual CEO
compensation drops by 3.1% relative to CFO compensation when firms begin providing pay ratio
disclosures.
19
This result lies in contrast to most theoretical and empirical findings of previous studies,
which indicate that exogenously imposed disclosure requirements are often followed by an
unexpected increase in executive compensation (e.g., Hermalin and Weisbach, 2012; Murphy,
2012; Park, Nelson, and Huson, 2001; Balsam et al., 2016; Lu and Shi, 2018; Gipper, 2016). As a
result, our evidence in Table 3 is most consistent with pay ratio reform reducing managerial power.
Hermalin and Weisbach (2012) argue that disclosure reform induced by public pressure could
reduce CEO compensation if their bargaining power is minimal. This decline in compensation is
also consistent with concerns in Murphy and Jensen (2018) that the pay ratio disclosure provides
a mechanism through which “uninvited guests” can shame boards into lowering CEO pay.
4.2.2. Pay-for-Performance Sensitivity Analysis
After observing a decline in total compensation, we next examine whether the pay ratio
disclosure differentially impacts CEO pay-for-performance sensitivity. On the one hand, the new
disclosure could increase shareholder awareness of executive compensation packages, thereby
pressuring boards to better align CEO compensation with performance (Bebchuk and Fried, 2004).
On the other hand, Jensen and Murphy (1990) argue that compensation disclosure can be costly to
board monitoring. These authors note that media criticism and potential shareholder litigation
against highly-compensated managers can lead to suboptimal contracting. These contracting costs
can lead risk-averse board members to resist incentive-laden contracts.
Table 4 reports the results of testing the effect of pay ratio reform on pay-for performance
sensitivity (H2). Here our dependent variable is the natural logarithm of inflation-adjusted delta,
Ln(Delta). As is the case with the level of compensation, Table 4’s regression results corroborate
the time-series patterns observed in Figure 3. In model (1), we document a statistically significant
12.4% decrease in CEOs delta relative to CFOs following the implementation of the pay ratio
20
reform (two-tailed p-value < 0.01). Results are consistent with this relative decline in CEO delta
when we include firm and executive characteristics as controls in model (2) and firm-fixed effects
in models (3) and (4), though they result in reduced statistical significance. Across the columns,
our results suggest that CEO pay-performance sensitivity decreases by approximately 6.8% to 12.4%
relative to CFOs in the pay ratio regime.
Consistent with Jensen and Murphy (1990), the regression results show that the pay ratio
disclosure is followed by a reduction in pay-performance sensitivity, consistent with reduced
incentive alignment between boards and managers. This result implies that our findings for shifts
in CEO compensation cannot be fully explained by either the managerial power hypothesis or the
optimal contracting hypothesis (Frydman and Jenter, 2010). Consistent with our evidence, Murphy
(2012) argues that the effect of government intervention into compensation contracts often
generates unintended consequences that cannot be explained by classic compensation theories.
In particular, Murphy and Jensen (2018) argue that the pay ratio disclosure does not provide
useful information, and its sole purpose is to shame boards into lowering CEO compensation.
Several comment letters received by the SEC similarly question the informational value of the
disclosure (SEC, 2015). Jensen and Murphy (1990) suggest that the determination of executive
compensation tends to be a political process rather than optimal contracting in the public disclosure
regime since executive compensation is subject to political pressure from third parties such as the
general public, employees, and the media. If the pay ratio disclosure serves as a means to direct
political pressure towards executive compensation contracts, then the simultaneous decline in CEO
compensation and performance sensitivity could be interpreted as a deviation from optimal
contracting caused by increased political pressure. We empirically examine this conjecture in the
next section.

21
5. Political pressure on CEO compensation
In this section, we explore whether our results can be interpreted in light of Jensen and
Murphy’s (1990) political pressure argument. To do so, we first decompose total compensation
into its cash and non-cash components, under the premise that non-cash components of
compensation receive more negative populist criticism from the media and regulators. We then
attempt to isolate our treatment sample into those boards that are more sensitive to political
pressure.
5.1 Decomposing Total Compensation
We split executive compensation into its cash (salary and bonus) and non-cash-based
components (e.g., options, equity, pension, and perquisites). We separate our compensation into
cash and non-cash components for several reasons. First, non-cash compensation receives more
populist criticism than cash compensation because it can be sensationalized as gratuitous by the
media following large ex post payouts in periods of rising equity values (i.e., Core, Guay, and
Larcker 2008). Second, non-cash compensation is not always available to rank-and-file employees,
allowing for arguments of pay inequalities (e.g., Warren, 2018). Finally, the disclosure of
perquisites, pensions, and deferred compensation in proxy statements are difficult to value and
often incomplete, leading to claims that such pay packages are “stealth” compensation and/or rent
extraction by CEOs (Bebchuk and Fried 2008; Kalyta and Magnan 2008).
Table 5 examines the change in compensation composition, using the ratio of cash-based
to total compensation as the dependent variable. In model (1), we observe that the proportion of
cash-based compensation increases for CEOs relative to CFOs following pay ratio reform. In terms
of economic significance, the proportion of cash-based compensation increases by 0.8% for CEOs
relative to CFOs in the pay ratio regime. These findings are robust to the inclusion of controls in
22
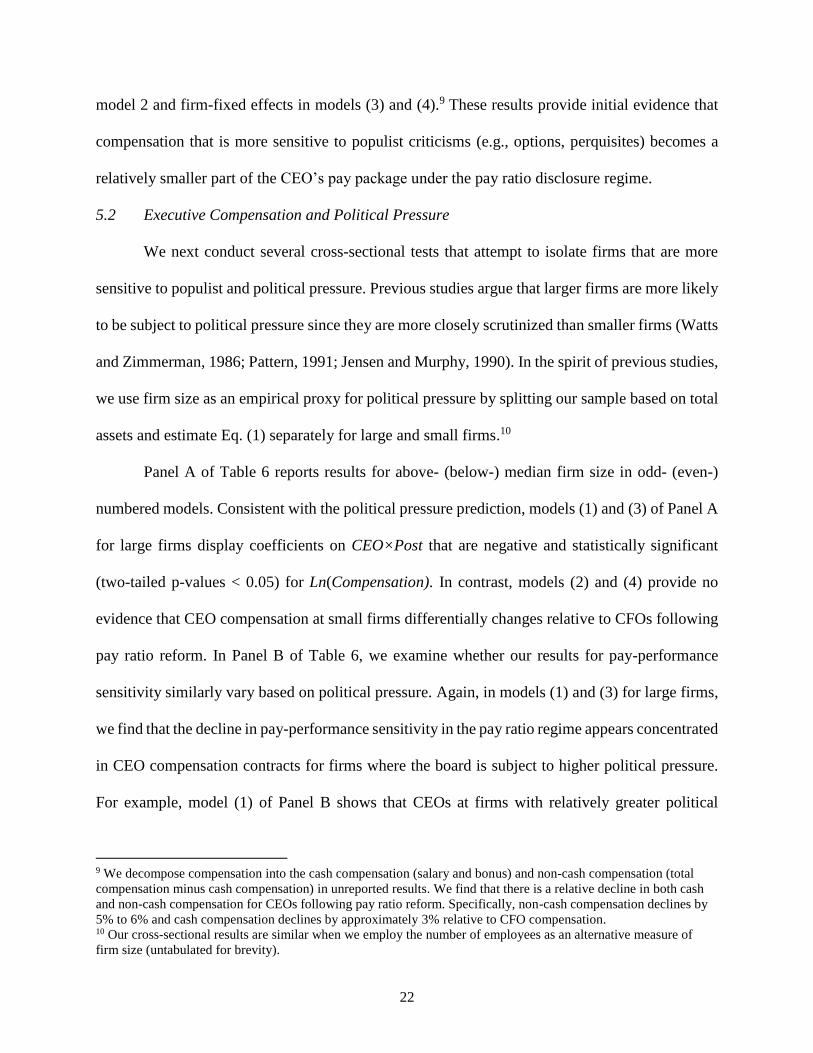
model 2 and firm-fixed effects in models (3) and (4).9 These results provide initial evidence that
compensation that is more sensitive to populist criticisms (e.g., options, perquisites) becomes a
relatively smaller part of the CEO’s pay package under the pay ratio disclosure regime.
5.2 Executive Compensation and Political Pressure
We next conduct several cross-sectional tests that attempt to isolate firms that are more
sensitive to populist and political pressure. Previous studies argue that larger firms are more likely
to be subject to political pressure since they are more closely scrutinized than smaller firms (Watts
and Zimmerman, 1986; Pattern, 1991; Jensen and Murphy, 1990). In the spirit of previous studies,
we use firm size as an empirical proxy for political pressure by splitting our sample based on total
assets and estimate Eq. (1) separately for large and small firms.10
Panel A of Table 6 reports results for above- (below-) median firm size in odd- (even-)
numbered models. Consistent with the political pressure prediction, models (1) and (3) of Panel A
for large firms display coefficients on CEO×Post that are negative and statistically significant
(two-tailed p-values < 0.05) for Ln(Compensation). In contrast, models (2) and (4) provide no
evidence that CEO compensation at small firms differentially changes relative to CFOs following
pay ratio reform. In Panel B of Table 6, we examine whether our results for pay-performance
sensitivity similarly vary based on political pressure. Again, in models (1) and (3) for large firms,
we find that the decline in pay-performance sensitivity in the pay ratio regime appears concentrated
in CEO compensation contracts for firms where the board is subject to higher political pressure.
For example, model (1) of Panel B shows that CEOs at firms with relatively greater political
9 We decompose compensation into the cash compensation (salary and bonus) and non-cash compensation (total
compensation minus cash compensation) in unreported results. We find that there is a relative decline in both cash
and non-cash compensation for CEOs following pay ratio reform. Specifically, non-cash compensation declines by
5% to 6% and cash compensation declines by approximately 3% relative to CFO compensation. 10 Our cross-sectional results are similar when we employ the number of employees as an alternative measure of
firm size (untabulated for brevity).

23
pressure experience a 14.8% decline in delta relative to CFOs (two-tailed p-value < 0.01). Similar
to Panel A, low-political pressure CEOs at smaller firms appear not to be differentially affected by
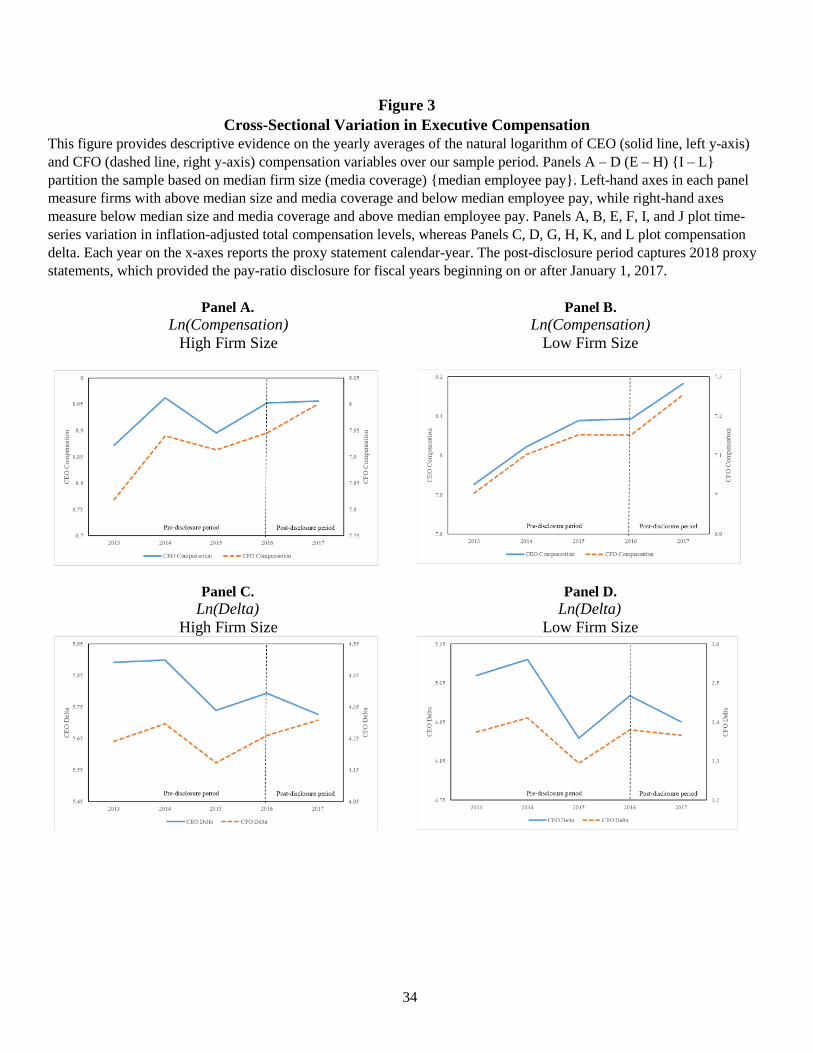
the pay-ratio reform in models (2) and (4). In Figure 3, we examine the time-series trends of
executive compensation and pay-performance sensitivity over our sample period. Similar to Figure
2, Figure 3 shows that CEO and CFO executive compensation characteristics co-move in the pre-
disclosure period for larger and smaller firms. However, in the post-disclosure period we find that
CEO pay levels off for total compensation (Panel A) and pay-performance sensitivity declines
(Panel C) for only the subsample of larger firms. Total compensation and delta continue to move
in the same direction for smaller firm CEOs and CFOs following pay ratio reform in Panels B and
D. Collectively; our results indicate boards facing increased political pressure are more likely to
reduce executive compensation and pay-performance sensitivity following the pay ratio disclosure.
Previous studies suggest that the media pursues sensational coverage when reporting on
CEO compensation (Core, Guay, and Larcker 2008). Jensen and Murphy (1990) argue that media
criticism constrains boards’ ability to provide innovative incentive contracts and offer “high
payoffs” to managers. In this light, we partition our firms based on the extent of media coverage
using data from Ravenpack. Models (1) and (3) of Table 7 isolate firms with above median media
coverage, whereas models (2) and (4) report results for firms with lower media coverage. We again
find that firms with relatively greater political pressure are more responsive to pay ratio reform.
Results in Panel A (Panel B) of Table 7 suggest that CEO compensation (delta) declines by 5.9%
to 5.7% (16.5% to 16.6%) relative to CFO compensation (delta) for firms with higher media
coverage. In contrast, we observe no statistically significant coefficients on CEO×Post for our low
media coverage firms in Panels A and B. Time-series analysis in Panels E – H in Figure 3 confirm
that the differential response to pay ratio reform for CEO and CFO pay packages appears isolated

24
to firms receiving higher media coverage. High media coverage firm CEOs experience a decrease
in total compensation and pay-performance sensitivity in the pay ratio regime, whereas CFOs
experience an increase.
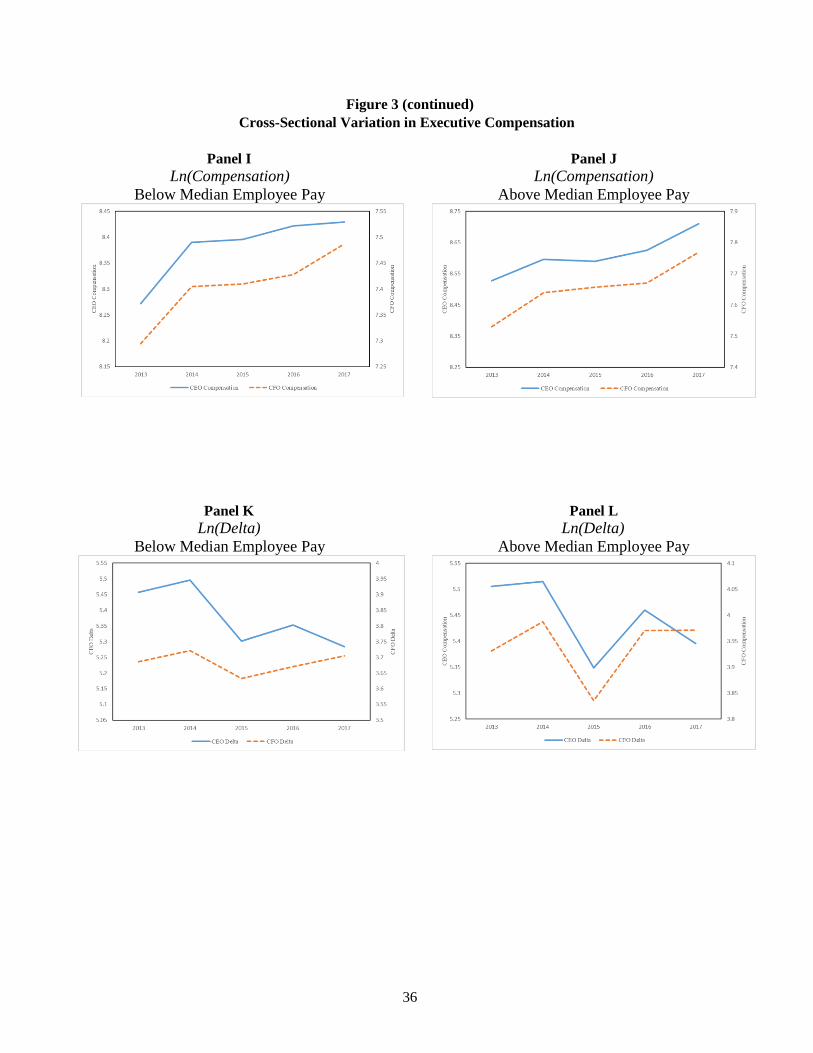
In our final cross-sectional test, we examine whether the board’s response to pay ratio
reform could be differentially influenced by the level of rank-and-file employee pay within a firm.
Jensen and Murphy (1990) argue that employee reactions to executive compensation disclosures
can constrain boards’ contracting decisions. More recently, Senator Warren, a leading proponent
for pay ratio disclosure, recently proposed legislation mandating labor representation on the board
of directors (Warren 2018). We posit that firms with lower-paid median employees are more likely
to be susceptible to populist political pressure. To examine this, we hand-collect the median
employee wage from the denominator of the CEO pay ratio from each firm’s most recent proxy
statement (see Appendix B). We then split our sample into those firms with above- and below-
median employee median pay. In models (2) and (4) of Panel A of Table 8, we observe that boards
with below-median employee wages are more likely to decrease CEO compensation relative to
CFO compensation following pay ratio reform. In contrast, models (1) and (3) of Panel A display
no statistically significant relative difference in CEO pay following pay ratio reform for firms with
above-median employee pay. Using pay-performance sensitivity, Panel B provides some evidence
in favor of an effect for CEO delta concentrated in below-median employee compensation firms
(two-tailed p-value < 0.10). Similar to our regression results in Table 8, time-series plots in Panels
I and J of Figure 3 confirm a differential response to pay ratio reform for CEOs, but only for firms
reporting below-median employee wages.
Overall, our results show that negative associations between the pay ratio disclosure and
total compensation and pay-for-performance sensitivity are concentrated in firms exposed to
25
higher political pressure. While the decline in CEO compensation may have accomplished a
particular objective by a subset of regulators, a decline in pay-for-performance sensitivity suggests
a deviation from optimal contracting and a deterioration in shareholder-manager alignment.
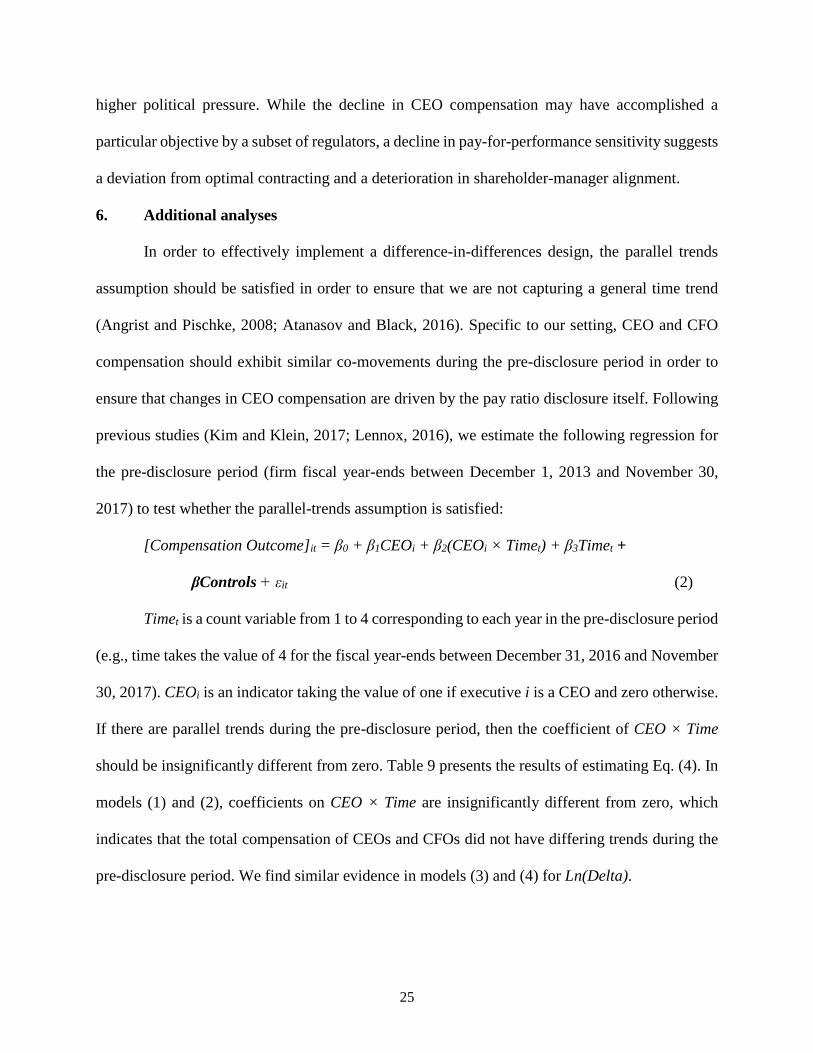
6. Additional analyses
In order to effectively implement a difference-in-differences design, the parallel trends
assumption should be satisfied in order to ensure that we are not capturing a general time trend
(Angrist and Pischke, 2008; Atanasov and Black, 2016). Specific to our setting, CEO and CFO
compensation should exhibit similar co-movements during the pre-disclosure period in order to
ensure that changes in CEO compensation are driven by the pay ratio disclosure itself. Following
previous studies (Kim and Klein, 2017; Lennox, 2016), we estimate the following regression for
the pre-disclosure period (firm fiscal year-ends between December 1, 2013 and November 30,
2017) to test whether the parallel-trends assumption is satisfied:
[Compensation Outcome]it = β0 + β1CEOi + β2(CEOi × Timet) + β3Timet +
βControls + εit (2)
Timet is a count variable from 1 to 4 corresponding to each year in the pre-disclosure period
(e.g., time takes the value of 4 for the fiscal year-ends between December 31, 2016 and November
30, 2017). CEOi is an indicator taking the value of one if executive i is a CEO and zero otherwise.
If there are parallel trends during the pre-disclosure period, then the coefficient of CEO × Time
should be insignificantly different from zero. Table 9 presents the results of estimating Eq. (4). In
models (1) and (2), coefficients on CEO × Time are insignificantly different from zero, which
indicates that the total compensation of CEOs and CFOs did not have differing trends during the
pre-disclosure period. We find similar evidence in models (3) and (4) for Ln(Delta).

26
7. Conclusion
As growth in executive compensation outpaced that of rank-and-file employees over recent
decades, the media and regulatory scrutiny of executive pay packages intensified. This scrutiny
culminated in the requirement that firms provide a comparison of a CEO’s total compensation to
their median employee’s total compensation. Advocates for the pay ratio regulation opined that
executives are earning “runaway” compensation relative to the average worker and that this ratio
improves compensation transparency. Opponents of the requirement lamented that this disclosure
generates sensationalism and does not enhance shareholders’ information sets.
Our research setting is unique in that the pay ratio provides no new information on a CEO’s
compensation; rather it discloses the total compensation of the median employee as a comparison
figure in a firm’s annual proxy statement. Using CFO compensation packages as a control group,
we find CEO total compensation is relatively lower following pay ratio reform. This is consistent
with managerial power being subverted by outside forces, or “uninvited guests” participating in
the executive compensation process (Murphy, 2013). Further, we find evidence that pay-for-
performance sensitivity declines for CEOs after the pay ratio reform, leading to a weaker link
between stock performance and executive compensation. These effects are stronger for larger firms
and firms with greater media coverage. In summary, our results provide preliminary evidence that
pay ratio reform appears to distort incentive alignment for CEOs. Future research is needed to
provide conclusive evidence on whether pay ratio reform optimizes executive compensation
contracts and is ultimately value enhancing to shareholders.
27
References
Ackerman, A., Rubin, G., 2017. Trump administration calls for scrapping CEO Pay Rule, The Wall
Street Journal, 2017, October 6
Angrist, D., Pischke, J., 2008. Mostly harmless econometrics: an empiricist’s companion. Princeton
University Press.
Atanasov, V., Black, B., 2016. Shock-based causal inference in corporate finance and accounting
research. Critical Finance Review 5, 207-304.
Balsam, S., Boone, J., Liu, H., Yin, J., 2016. The impact of say-on-pay on executive compensation.
Journal of Accounting and Public Policy 35, 162-191.
Balsam, S., Gordon, E., Li, X., 2016. Mandatory disclosure reform, monitoring, and executive
compensation. Available at SSRN.
Banning, K., Chiles, T., 2007. Trade-Offs in the labor union-CEO compensation relationship.
Journal of Labor Research 28, 347–357
Bebchuk, L., Fried, J., 2004. Pay without performance: the unfulfilled promise of executive
compensation. Harvard University Press, Cambridge.
Bebchuk, L., Spamann, H., 2009. Regulating bankers' pay. Harvard Law School John M. Olin Center
for Law, Economics and Business Discussion Paper Series, 634-679.
Blinder, A., 2009, Crazy Compensation and the Crisis, Wall Street Journal Commentary, May 28,
2009
Brick, I., Palmon O., Wald, J., 2006. CEO compensation, director compensation, and firm
performance: evidence of cronyism? Journal of Corporate Finance 12, 403–423.
Bronars, S., and D. Deere., 1991. The threat of unionization, the use of debt, and the preservation of
shareholder wealth. Quarterly Journal of Economics 106, 231–254.
Cadman, B., Carrizosa, R., Peng, X., 2018. Compensation disclosures and corporate governance
through shareholder voting. Available at SSRN.
Camelia, K., Niessen, A., 2012. Public opinion and executive compensation. Management Science
58, 1249-1272.
Chhaochharia, V., Grinstein, Y., 2009. CEO Compensation and board structure. The Journal of
Finance 64, 231-261.
Coles, J., Daniel, N., Naveen, L., 2006. Managerial incentives and risk-taking. Journal of Financial
Economics 79, 431–468.
Core, J., Guay, W., 2002. Estimating the value of employee stock option portfolios and their
sensitivities to price and volatility. Journal of Accounting Research 40, 613-630.
Core, J., Guay, W., Larcker, F., 2008. The power of the pen and executive compensation. Journal of
Financial Economics 88, 1-25.
Core, J., Holthausen, R., Larcker, D., 1999. Corporate governance, chief executive officer
compensation, and firm performance. Journal of Financial Economics 51, 371-406.
Correa, R., Lel, U., 2016. Say on pay laws, executive compensation, pay slice and firm valuation
around the world. Journal of Financial Economics 122, 500-520.
28
Craighead, J., Magnan, M., Thorne, L., 2004. The impact of mandated disclosure on performance-
based CEO compensation. Contemporary Accounting Research 21, 369-398.
Coles, J., Daniel, N. and Naveen, L., 2013. Calculation of compensation incentives and firm-related
wealth using Execucomp: data, program, and explanation. Available at SSRN.
Dambra, M., Field, L., Gustafson, M., 2015. The JOBS Act and IPO volume: Evidence that
disclosure costs affect that IPO decision. Journal of Financial Economics 116, 121-143.
Dambra, M., Gustafson, M., 2019. Do the Burdens to Being Public Affect the Investment and
Innovation of Newly Public Firms? Management Science (Forthcoming).
Edmans, A., Gabaix, X., Jenter, D., 2017. Executive compensation: a survey of theory and evidence.
CESifo Working Paper, No. 6585, Available at SSRN.
Faleye, O., Reis, E. and Venkateswaran. A. 2013. The determinants and effects of CEO-employee
pay ratios. Journal of Banking and Finance 37, 3258–3272
Frydman, C., Jenter, D., 2010. CEO compensation. Annual Review of Financial Economics 2, 75-
102.
Gabaix, X., Landier, A., 2008. Why has CEO pay increased so much? The Quarterly Journal of
Economics 123, 49–100.
Gipper, B., 2016. The economic effects of mandating expanded compensation disclosures. Available
at SSRN.
Guay, W., 1999. The sensitivity of CEO wealth to equity risk: an analysis of the magnitude and
determinants. Journal of Financial Economics 53, 43–71.
Hermalin, B., Weisbach, M., 2012. Information disclosure and corporate governance. The Journal of
Finance 67, 195-233.
Hermalin, B., Weisbach, M., 2017. Assessing managerial ability: implications for corporate
governance. Economic Policy Review 9.
Himmelberg, C., Hubbard, R., 2000. Incentive pay and the market for CEOs: an analysis of pay-for-
performance sensitivity. Available at SSRN.
Hopkins, W., Lazonick, W., 2016. The mismeasure of Mammon: uses and abuses of executive pay
data. Available at SSRN.
Huang, Q., Jiang, F., Lie, E., Que, T., 2017. The effect of labor unions on CEO Compensation.
Journal of Financial and Quantitative Analysis 52, 553-582.
Iliev, P., Vitanova, S., 2019. The effect of the Say-on-Pay in the U.S. Management Science
(Forthcoming).
Jensen, M., Murphy, K., 1990. Performance pay and top-management incentives. Journal of Political
Economy 98, 225-264.
Johnson, M., Porter, S., Shackell, M., 1997. Stakeholder pressure and the structure of executive
compensation. Available at SSRN.
Joskow, P., Rose, N., Wolfram, C., 1996. Political constraints on executive compensation:
Evidence from the electric utility industry. Rand Journal of Economics 27, 165-182
29
Kim, S., Klein, A., 2017. Did the 1999 NYSE and NASDAQ listing standard changes on audit
committee composition benefit investors? The Accounting Review 92, 187-212.
Kuhnen, C., Niessen, A., 2012. Public opinion and executive compensation. Management Science
58, 1249-1272
Larcker, D., McCall, A., Ormazabal, G., 2015. Outsourcing shareholder voting to proxy advisory
firms. The Journal of Law and Economics 58, 173-204.
Lennox, C. 2016. Did the PCAOB’s restrictions on auditors’ tax services improve audit quality? The
Accounting Review 91, 1493– 1512
Lo, K., 2003. Economic consequences of regulated changes in disclosure: the case of executive
compensation. Journal of Accounting and Economics 35, 285-314.
Lu, J., Shi, Z., 2018. Does improved disclosure lead to higher executive compensation? Evidence
from the conversion to IFRS and the dual-class share system in China. Journal of Corporate
Finance 48, 244-260.
Matsa, D., 2010. Capital structure as a strategic variable: evidence from collective bargaining.
Journal of Finance 65, 1197–1232.
Murphy, K., 2012. The politics of pay: A legislative history of executive compensation. In Research
Handbook on Executive Pay, edited by J. Hill, and R. Thomas. Cheltenham, U.K.: Edward
Elgar Publishers.
Murphy, Kevin J., 2013. Executive compensation: where we are, and how we got there. Handbook of
the Economics of Finance 2, 211-356.
Murphy, K., Jensen, M., 2018. The Politics of Pay: The unintended consequences of regulating
executive compensation. USC Law Legal Studies Paper No. 18-8. Available at SSRN.
Park, Y., Nelson, T., Huson, M., 2001. Executive pay and the disclosure environment: Canadian
evidence. Journal of Financial Research 24, 347-365.
Perry, T., Zenner, M., 2001. Pay for performance? Government regulation and the structure of
compensation contracts. Journal of Financial Economics 62, 453-488.
SEC, 2015, Pay ratio disclosure: Release Nos. 33-9877, Available at
https://www.sec.gov/rules/final/2015/33-9877.pdf.
SEC, 2017, Reconsideration of pay ratio rule implementation, Available at
http://www.sec.gov/news/statement/reconsideration-of-pay-ratio-rule-implementation.html.
Vafeas, N., Afxentious, Z., 1998. The association between the SEC’s 1992 compensation disclosure
rule and executive compensation policy changes. Journal of Accounting and Public Policy
17, 27-54.
Warren, E. 2018. Companies Shouldn’t be Accountable Only to Shareholders. The Wall Street
Journal, 2018, August 14.
Watts, R., Zimmerman, J., 1986. Positive accounting theory. Prentice-Hall Inc.

30
Appendix A
Pay Ratio Example
This appendix provides an example pay ratio disclosure from Fleetcor Technologies, Inc. in its
prospectus statement (DEF 14A) issued April 27, 2018. The quantitative portion of the pay ratio
disclosure is bolded below for expositional purposes.
2017 CEO PAY RATIO
As required by item 402(u) of Regulation S-K, the compensation, nominating, and corporate
governance committee reviewed a comparison of our CEO’s annual total compensation in fiscal year
2017 to that of all other Company employees for the same period. We identified our median
employee by annualizing December 2017 pay for all individuals, excluding our CEO, who were
employed by us on December 31, 2017 whether on a full-time, part-time, or seasonal basis, and
calculating total employee compensation using the same methodology we use for our named
executive officers in the 2017 Summary Compensation Table above. We did not make any cost-of-
living adjustments when identifying our median employee. We applied a foreign currency to U.S.
dollar exchange rate to the compensation paid in foreign currency.
The annual total compensation for fiscal year 2017 for our CEO was $52,643,810 as noted in
the table above, and for our median employee it was approximately $34,700. The resulting ratio
of our CEO’s pay to the pay of our median employee for fiscal year 2017 is 1,517 to 1. This pay
ratio is a reasonable estimate calculated in good faith, in a manner consistent with Item 402(u) of
Regulation S-K, based on our payroll and employment records and the methodology described
above. The Securities and Exchange Commission (“SEC”) rules for identifying the “median
employee” and calculating the pay ratio based on that employee’s annual total compensation allow
companies to adopt a variety of methodologies, to apply certain exclusions, and to make reasonable
estimates and assumptions that reflect their compensation practices. As such, the pay ratios reported
by other companies may not be comparable to the pay ratio set forth above, as other companies may
have different employment and compensation practices and may utilize different methodologies,
exclusions, estimates and assumptions in calculating their own pay ratios.

31
Appendix B
Variable Definitions and Data Sources
Variable Definition Source
Treat An indicator variable set equal to one (zero) when the executive
is a CEO (CFO).
Execucomp
Post An indicator variable equal to one when the firm fiscal year ends
on or after December 31, 2017, and equal to zero otherwise.
Total Compensation Natural logarithm of executive compensation (Total_alt1),
where executive compensation is reported in constant dollars
adjusted for inflation.
Execucomp
Delta
Natural logarithm of the dollar sensitivity of executive wealth to
a one percent change in stock price (Core and Guay, 2002; Coles
et al., 2006) measured in constant dollars adjusted for inflation.
Execucomp
Size Natural logarithm of the book value of total assets at the
beginning of the fiscal year.
Compustat
BTM Ratio of book value of total assets to market value of total assets
at the beginning of the fiscal year.
Compustat
Leverage Ratio of market value of total debt to market value of total assets
at the beginning of the fiscal year.
Compustat
Stock Return Annualized market-adjusted monthly stock returns from the
prior year. Market-adjusted stock returns are computed by the
difference between stock returns and value-weighted returns.
CRSP
ROA Income before extraordinary items scaled by book value of total
assets from the prior year.
Compustat
Volatility Standard deviation of five annual observations of Stock Return
from the prior year.
CRSP
CEO duality Indicator variable set equal to one if the CEO serves as a board
chairperson at the beginning of the year, and to zero otherwise.
Execucomp
Tenure The number of years the executive has held the position as of the
beginning of the fiscal year.
Execucomp
Age Executive age as of the beginning of the fiscal year. Execucomp
Ownership
Percentage of total shares owned by the executive at the
beginning of the fiscal year.
Execucomp
Time A count variable ranging from 1 to 5 corresponding to each year
in the pre-disclosure period for fiscal years ending December 31
through November 30 (e.g., Time takes the value of 5 for the
fiscal year ends between December 31, 2016 and November 30,
2017).
Media Coverage The count of full media articles appearing during the 12-month
fiscal period across all sources tracked by Ravenpack.
Ravenpack
Median Employee Pay Denominator of the mandated pay ratio disclosure. Proxy
statements
Cash Compensation (%) Ratio of inflation-adjusted cash compensation (the sum of salary
and bonus) to total compensation.
Execucomp

32
Figure 1
Timeline for pre- and post-disclosure windows

33
Figure 2
Time Series Variation in Executive Compensation
This figure provides descriptive evidence on the yearly averages for the natural logarithm of CEO (solid
line, left y-axis) and CFO (dashed line, right y-axis) compensation variables over our sample period.
Panel A (Panel B) displays the yearly averages for the inflation-adjusted compensation levels (delta).
Each year on the x-axis reports the proxy statement calendar-year. The post-disclosure period captures
2018 proxy statements, which provided the pay ratio disclosure for fiscal years beginning on or after
January 1, 2017.
Panel A. Ln(Compensation)
Panel B. Ln(Delta)
34
Figure 3
Cross-Sectional Variation in Executive Compensation
This figure provides descriptive evidence on the yearly averages of the natural logarithm of CEO (solid line, left y-axis)
and CFO (dashed line, right y-axis) compensation variables over our sample period. Panels A – D (E – H) {I – L}
partition the sample based on median firm size (media coverage) {median employee pay}. Left-hand axes in each panel
measure firms with above median size and media coverage and below median employee pay, while right-hand axes
measure below median size and media coverage and above median employee pay. Panels A, B, E, F, I, and J plot time-
series variation in inflation-adjusted total compensation levels, whereas Panels C, D, G, H, K, and L plot compensation
delta. Each year on the x-axes reports the proxy statement calendar-year. The post-disclosure period captures 2018 proxy
statements, which provided the pay-ratio disclosure for fiscal years beginning on or after January 1, 2017.
Panel A.
Ln(Compensation)
High Firm Size
Panel B.
Ln(Compensation)
Low Firm Size
Panel C.
Ln(Delta)
High Firm Size
Panel D.
Ln(Delta)
Low Firm Size

35
Figure 3 (continued)
Cross-Sectional Variation in Executive Compensation
Panel E
Ln(Compensation)
High Media Coverage
Panel F
Ln(Compensation)
Low Media Coverage
Panel G
Ln(Delta)
High Media Coverage
Panel H
Ln(Delta)
Low Media Coverage
36
Figure 3 (continued)
Cross-Sectional Variation in Executive Compensation
Panel I
Ln(Compensation)
Below Median Employee Pay
Panel J
Ln(Compensation)
Above Median Employee Pay
Panel K
Ln(Delta)
Below Median Employee Pay
Panel L
Ln(Delta)
Above Median Employee Pay

37
Table 1
Summary statistics
Table 1 reports the summary statistics of variables used in the main analysis. The sample comprises of 10,804 executive-
year observations. Total compensation and delta are reported in thousands of dollars. Refer to Appendix B for details on
variable measurement and data sources.
Mean Median Std. Dev
CEO Total Compensation 6,669.72 5,149.65 5,230.92
CEO Ln(Total Compensation) 8.50 8.55 0.83
CEO Delta 551.40 218.37 944.20
CEO Ln(Delta) 5.41 5.39 1.39
CFO Total Compensation 2,487.30 1,808.30 2,296.37
CFO Ln(Total Compensation) 7.53 7.50 0.75
CFO Delta 109.17 45.35 345.52
CFO Ln(Delta) 3.81 3.84 1.29
Size 8.30 8.25 1.71
BTM 0.79 0.70 0.44
Leverage 0.27 0.20 0.27
ROA 0.05 0.05 0.07
Stock Return 0.05 0.03 0.27
Volatility 0.33 0.28 0.23
CEO duality 0.52 1.00 0.50
Tenure 8.00 7.00 5.15
Age 54.34 54.00 6.64
Ownership (%) 0.62 0.12 1.78
Media Coverage 207.98 161.00 176.42
Median Employee Pay 114,223.56 62,294.00 55,791.15

38
Table 2
Pearson correlations
Table 2 provides Pearson correlations between CEO and CFO compensation variables. The sample consists
of 5,610 executive-year observations over our 2013-2018 sample period. All correlations in the table are
statistically significant at a 1% level (p-values unreported for brevity). Refer to Appendix B for details on
variable measurement and data sources.
CEO
Compensation CEO Delta
CFO
Compensation CFO Delta
CEO Compensation 1.000
CEO Delta 0.454 1.000
CFO Compensation 0.853 0.431 1.000
CFO Delta 0.501 0.591 0.603 1.000

39
Table 3
Total compensation Table 3 reports the results of difference-in-differences models that estimate changes in executive
compensation around pay ratio disclosure reform. The dependent variable is the natural logarithm of
inflation-adjusted executive compensation, Ln(Compensation). CEO is an indicator variable equal to 1 (0)
if the executive is a CEO (CFO). Post is an indicator variable equal to one when a firm’s fiscal year ends
on or after December 31, 2017, and equal to zero otherwise. Refer to Appendix B for details on variable
measurement and data sources. In models (1) and (2), we control for year- and Fama-French 48 industry-
fixed effects. In models (3) and (4), we control for year- and firm-fixed effects. Standard errors are clustered
at the firm level. t-statistics are in parentheses below each coefficient. *, **, and *** indicate significance
at the 10%, 5%, and 1% levels, respectively.
(1) (2) (3) (4)
CEO 0.973***
(66.12)
0.962***
(53.34)
0.973***
(62.97)
0.923***
(55.10)
CEO × Post -0.031*
(-1.95)
-0.034**
(-2.08)
-0.031*
(-1.86)
-0.029*
(-1.74)
Size
0.375***
(32.87)
0.110**
(2.12)
BTM
-0.122
(-1.63)
-0.201***
(-3.64)
Leverage
-0.041
(-0.55)
-0.058
(-1.45)
Tenure
0.007**
(2.48)
0.011***
(4.87)
Age
0.001
(0.45)
0.003
(1.46)
Ownership
-0.021*
(-1.83)
-0.004
(-0.35)
ROA
0.498
(1.62)
0.019
(0.11)
Stock Return
0.160***
(4.82)
0.119***
(4.56)
Volatility
0.088
(1.39)
-0.051
(-1.13)
CEO duality
0.008
(0.27)
-0.023
(-0.96)
Constant 7.420***
(241.91)
4.305***
(26.40)
7.419***
(550.10)
6.514***
(15.33)
Industry FEs Yes Yes No No
Firm FEs No No Yes Yes
Year FEs Yes Yes Yes Yes
Adj. R-squared 0.358 0.717 0.856 0.860
Observations 5,610 5,610 5,610 5,610

40
Table 4
Pay-for-performance sensitivity
Table 4 reports the results of difference-in-differences models that estimate changes in pay-for-performance
sensitivity around pay ratio disclosure reform. The dependent variable is the natural logarithm of inflation-
adjusted pay-for-performance sensitivity, Ln(Delta). CEO is an indicator variable equal to 1 (0) if the
executive is a CEO (CFO). Post is an indicator variable equal to one when a firm’s fiscal year ends on or
after December 31, 2017, and equal to zero otherwise. Refer to Appendix B for details on variable
measurement and data sources. In models (1) and (2), we control for year- and Fama-French 48 industry-
fixed effects. In models (3) and (4), we control for year- and firm-fixed effects. Standard errors are clustered
at the firm level. t-statistics are in parentheses below each coefficient. *, **, and *** indicate significance
at the 10%, 5%, and 1% levels, respectively.
(1) (2) (3) (4)
CEO 1.625***
(36.87)
1.131***
(28.65)
1.625***
(35.11)
1.098***
(29.02)
CEO × Post -0.124***
(-2.90)
-0.068*
(-1.84)
-0.124***
(-2.76)
-0.068*
(-1.77)
Size
0.458***
(22.76)
0.138*
(1.91)
BTM
-0.544***
(-3.79)
-0.398***
(-3.27)
Leverage
-0.214
(-1.58)
-0.121
(-1.57)
Tenure
0.068***
(12.27)
0.076***
(14.15)
Age
0.001
(0.31)
0.006
(1.31)
Ownership
0.252***
(17.78)
0.237***
(12.23)
ROA
1.978***
(3.60)
0.611**
(2.00)
Stock Return
0.321***
(5.30)
0.228***
(4.28)
Volatility
-0.090
(-0.78)
-0.034
(-0.35)
CEO duality
0.102*
(1.83)
-0.024
(-0.49)
Constant 3.833***
(75.53)
0.008
(0.03)
3.833***
(114.19)
2.336***
(3.72)
Industry FEs Yes Yes No No
Firm FEs No No Yes Yes
Year FEs Yes Yes Yes Yes
Adj. R-squared 0.320 0.634 0.726 0.803
Observations 5,610 5,610 5,610 5,610

41
Table 5
Cash vs. Non-cash compensation Table 5 reports the results of difference-in-differences models that estimate changes in compensation
structure around pay ratio disclosure reform. The dependent variable is the ratio between inflation-adjusted
cash compensation (the sum of salary and bonus) and total compensation. CEO is an indicator variable
equal to 1 (0) if the executive is a CEO (CFO). Post is an indicator variable equal to one when a firm’s
fiscal year ends on or after December 31, 2017, and equal to zero otherwise. Refer to Appendix B for details
on variable measurement and data sources. In models (1) and (2), we control for year- and Fama-French 48
industry-fixed effects. In models (3) and (4), we control for year- and firm-fixed effects. Standard errors
are clustered at the firm level. t-statistics are in parentheses below each coefficient. *, **, and *** indicate
significance at the 10%, 5%, and 1% levels, respectively.
(1) (2) (3) (4)
CEO -0.084***
(-26.92)
-0.099***
(-16.84)
-0.084***
(-25.64)
-0.080***
(-21.14)
CEO × Post 0.008*
(1.92)
0.010**
(2.40)
0.008*
(1.83)
0.008*
(1.77)
Size
-0.053***
(-16.06)
-0.018
(-1.41)
BTM
0.037*
(1.85)
0.035*
(1.75)
Leverage
0.015
(0.64)
0.024*
(1.69)
Tenure
-0.000
(-0.47)
-0.001**
(-2.02)
Age
0.002**
(2.52)
0.000
(0.28)
Ownership
0.009***
(2.71)
-0.001
(-0.45)
ROA
-0.073
(-0.95)
-0.048
(-0.97)
Stock Return
-0.043***
(-4.50)
-0.034***
(-3.76)
Volatility
0.014
(0.73)
0.006
(0.42)
CEO duality
0.011
(1.16)
0.014
(1.49)
Constant 0.331***
(42.86)
0.639***
(14.09)
0.331***
(75.13)
0.434***
(4.22)
Industry FEs Yes Yes No No
Firm FEs No No Yes Yes
Year FEs Yes Yes Yes Yes
Adj. R-squared 0.127 0.335 0.698 0.702
Observations 5,610 5,610 5,610 5,610
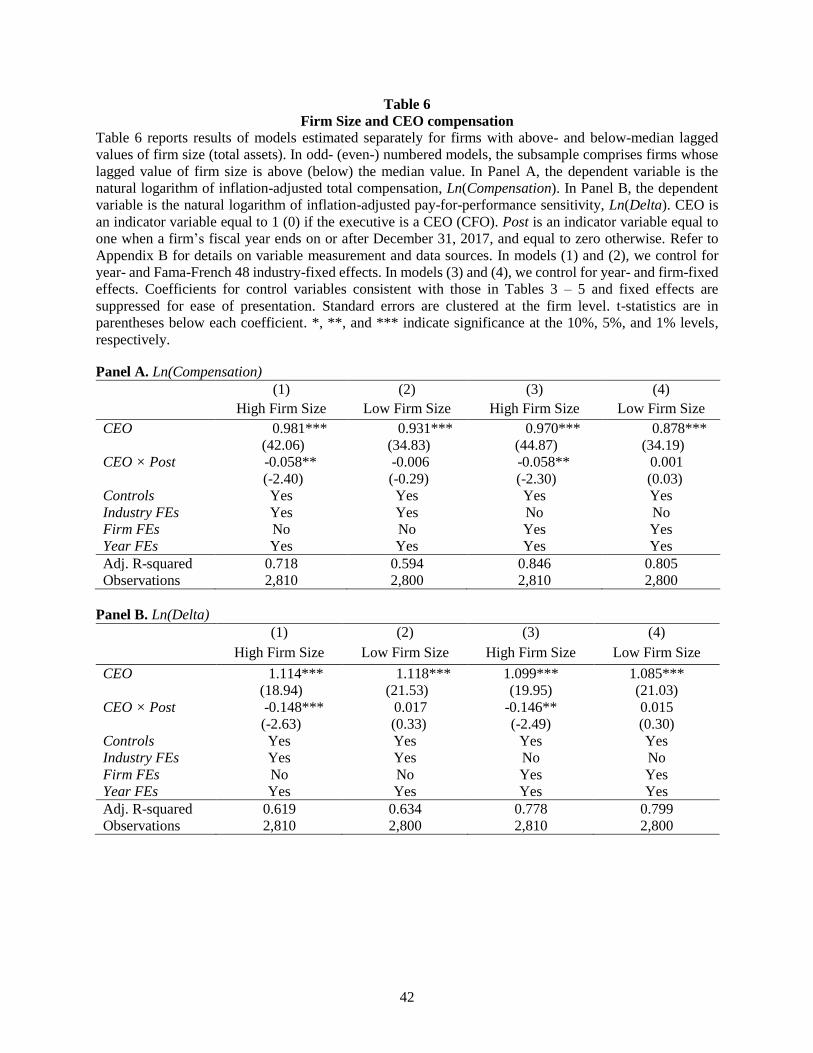
42
Table 6
Firm Size and CEO compensation
Table 6 reports results of models estimated separately for firms with above- and below-median lagged
values of firm size (total assets). In odd- (even-) numbered models, the subsample comprises firms whose
lagged value of firm size is above (below) the median value. In Panel A, the dependent variable is the
natural logarithm of inflation-adjusted total compensation, Ln(Compensation). In Panel B, the dependent
variable is the natural logarithm of inflation-adjusted pay-for-performance sensitivity, Ln(Delta). CEO is
an indicator variable equal to 1 (0) if the executive is a CEO (CFO). Post is an indicator variable equal to
one when a firm’s fiscal year ends on or after December 31, 2017, and equal to zero otherwise. Refer to
Appendix B for details on variable measurement and data sources. In models (1) and (2), we control for
year- and Fama-French 48 industry-fixed effects. In models (3) and (4), we control for year- and firm-fixed
effects. Coefficients for control variables consistent with those in Tables 3 – 5 and fixed effects are
suppressed for ease of presentation. Standard errors are clustered at the firm level. t-statistics are in
parentheses below each coefficient. *, **, and *** indicate significance at the 10%, 5%, and 1% levels,
respectively.
Panel A. Ln(Compensation)
(1) (2) (3) (4)
High Firm Size Low Firm Size High Firm Size Low Firm Size
CEO 0.981***
(42.06)
0.931***
(34.83)
0.970***
(44.87)
0.878***
(34.19)
CEO × Post -0.058**
(-2.40)
-0.006
(-0.29)
-0.058**
(-2.30)
0.001
(0.03)
Controls Yes Yes Yes Yes
Industry FEs Yes Yes No No
Firm FEs No No Yes Yes
Year FEs Yes Yes Yes Yes
Adj. R-squared 0.718 0.594 0.846 0.805
Observations 2,810 2,800 2,810 2,800
Panel B. Ln(Delta)
(1) (2) (3) (4)
High Firm Size Low Firm Size High Firm Size Low Firm Size
CEO 1.114***
(18.94)
1.118***
(21.53)
1.099***
(19.95)
1.085***
(21.03)
CEO × Post -0.148***
(-2.63)
0.017
(0.33)
-0.146**
(-2.49)
0.015
(0.30)
Controls Yes Yes Yes Yes
Industry FEs Yes Yes No No
Firm FEs No No Yes Yes
Year FEs Yes Yes Yes Yes
Adj. R-squared 0.619 0.634 0.778 0.799
Observations 2,810 2,800 2,810 2,800
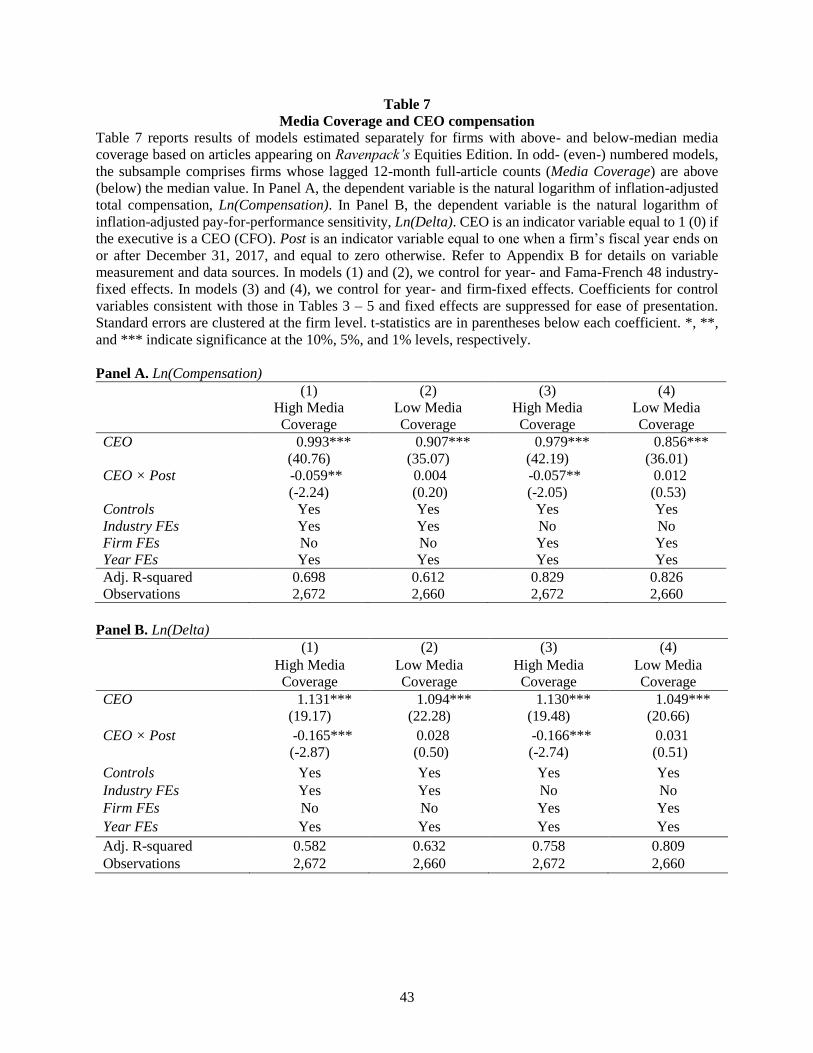
43
Table 7
Media Coverage and CEO compensation
Table 7 reports results of models estimated separately for firms with above- and below-median media
coverage based on articles appearing on Ravenpack’s Equities Edition. In odd- (even-) numbered models,
the subsample comprises firms whose lagged 12-month full-article counts (Media Coverage) are above
(below) the median value. In Panel A, the dependent variable is the natural logarithm of inflation-adjusted
total compensation, Ln(Compensation). In Panel B, the dependent variable is the natural logarithm of
inflation-adjusted pay-for-performance sensitivity, Ln(Delta). CEO is an indicator variable equal to 1 (0) if
the executive is a CEO (CFO). Post is an indicator variable equal to one when a firm’s fiscal year ends on
or after December 31, 2017, and equal to zero otherwise. Refer to Appendix B for details on variable
measurement and data sources. In models (1) and (2), we control for year- and Fama-French 48 industry-
fixed effects. In models (3) and (4), we control for year- and firm-fixed effects. Coefficients for control
variables consistent with those in Tables 3 – 5 and fixed effects are suppressed for ease of presentation.
Standard errors are clustered at the firm level. t-statistics are in parentheses below each coefficient. *, **,
and *** indicate significance at the 10%, 5%, and 1% levels, respectively.
Panel A. Ln(Compensation)
(1) (2) (3) (4)
High Media
Coverage
Low Media
Coverage
High Media
Coverage
Low Media
Coverage
CEO 0.993***
(40.76)
0.907***
(35.07)
0.979***
(42.19)
0.856***
(36.01)
CEO × Post -0.059**
(-2.24)
0.004
(0.20)
-0.057**
(-2.05)
0.012
(0.53)
Controls Yes Yes Yes Yes
Industry FEs Yes Yes No No
Firm FEs No No Yes Yes
Year FEs Yes Yes Yes Yes
Adj. R-squared 0.698 0.612 0.829 0.826
Observations 2,672 2,660 2,672 2,660
Panel B. Ln(Delta)
(1) (2) (3) (4)
High Media
Coverage
Low Media
Coverage
High Media
Coverage
Low Media
Coverage
CEO 1.131***
(19.17)
1.094***
(22.28)
1.130***
(19.48)
1.049***
(20.66)
CEO × Post -0.165***
(-2.87)
0.028
(0.50)
-0.166***
(-2.74)
0.031
(0.51)
Controls Yes Yes Yes Yes
Industry FEs Yes Yes No No
Firm FEs No No Yes Yes
Year FEs Yes Yes Yes Yes
Adj. R-squared 0.582 0.632 0.758 0.809
Observations 2,672 2,660 2,672 2,660
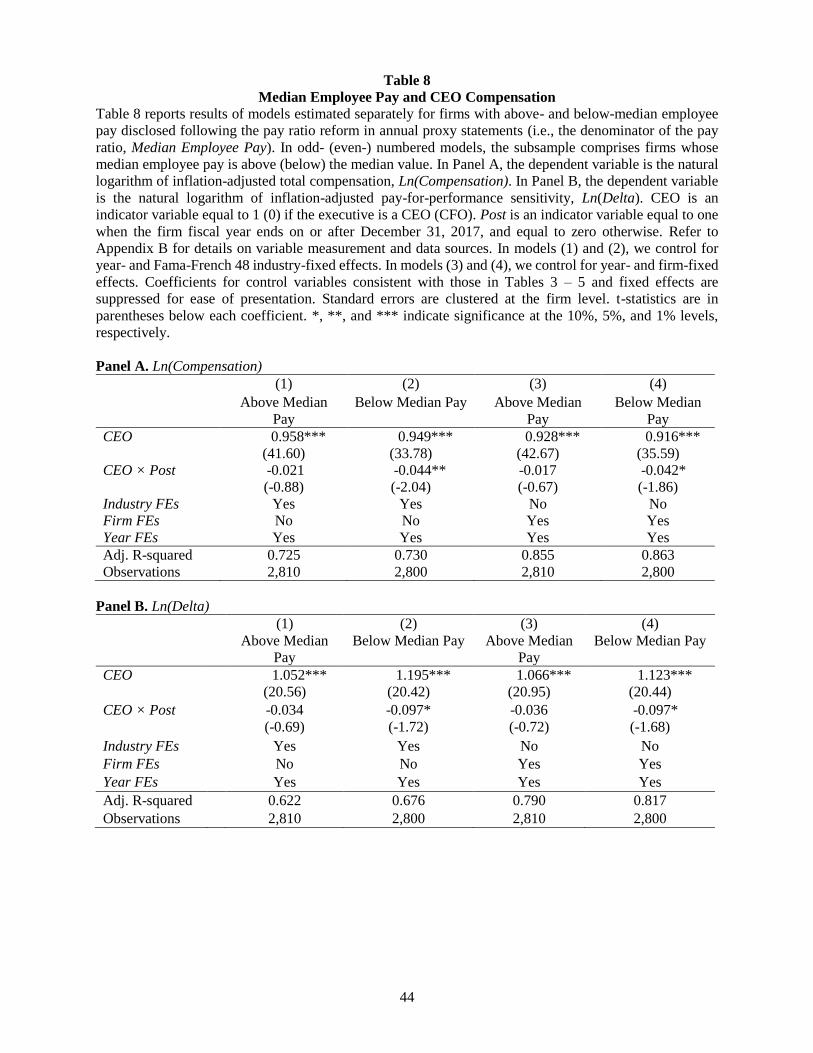
44
Table 8
Median Employee Pay and CEO Compensation
Table 8 reports results of models estimated separately for firms with above- and below-median employee
pay disclosed following the pay ratio reform in annual proxy statements (i.e., the denominator of the pay
ratio, Median Employee Pay). In odd- (even-) numbered models, the subsample comprises firms whose
median employee pay is above (below) the median value. In Panel A, the dependent variable is the natural
logarithm of inflation-adjusted total compensation, Ln(Compensation). In Panel B, the dependent variable
is the natural logarithm of inflation-adjusted pay-for-performance sensitivity, Ln(Delta). CEO is an
indicator variable equal to 1 (0) if the executive is a CEO (CFO). Post is an indicator variable equal to one
when the firm fiscal year ends on or after December 31, 2017, and equal to zero otherwise. Refer to
Appendix B for details on variable measurement and data sources. In models (1) and (2), we control for
year- and Fama-French 48 industry-fixed effects. In models (3) and (4), we control for year- and firm-fixed
effects. Coefficients for control variables consistent with those in Tables 3 – 5 and fixed effects are
suppressed for ease of presentation. Standard errors are clustered at the firm level. t-statistics are in
parentheses below each coefficient. *, **, and *** indicate significance at the 10%, 5%, and 1% levels,
respectively.
Panel A. Ln(Compensation)
(1) (2) (3) (4)
Above Median
Pay
Below Median Pay Above Median
Pay
Below Median
Pay
CEO 0.958***
(41.60)
0.949***
(33.78)
0.928***
(42.67)
0.916***
(35.59)
CEO × Post -0.021
(-0.88)
-0.044**
(-2.04)
-0.017
(-0.67)
-0.042*
(-1.86)
Industry FEs Yes Yes No No
Firm FEs No No Yes Yes
Year FEs Yes Yes Yes Yes
Adj. R-squared 0.725 0.730 0.855 0.863
Observations 2,810 2,800 2,810 2,800
Panel B. Ln(Delta)
(1) (2) (3) (4)
Above Median
Pay
Below Median Pay Above Median
Pay
Below Median Pay
CEO 1.052***
(20.56)
1.195***
(20.42)
1.066***
(20.95)
1.123***
(20.44)
CEO × Post -0.034
(-0.69)
-0.097*
(-1.72)
-0.036
(-0.72)
-0.097*
(-1.68)
Industry FEs Yes Yes No No
Firm FEs No No Yes Yes
Year FEs Yes Yes Yes Yes
Adj. R-squared 0.622 0.676 0.790 0.817
Observations 2,810 2,800 2,810 2,800
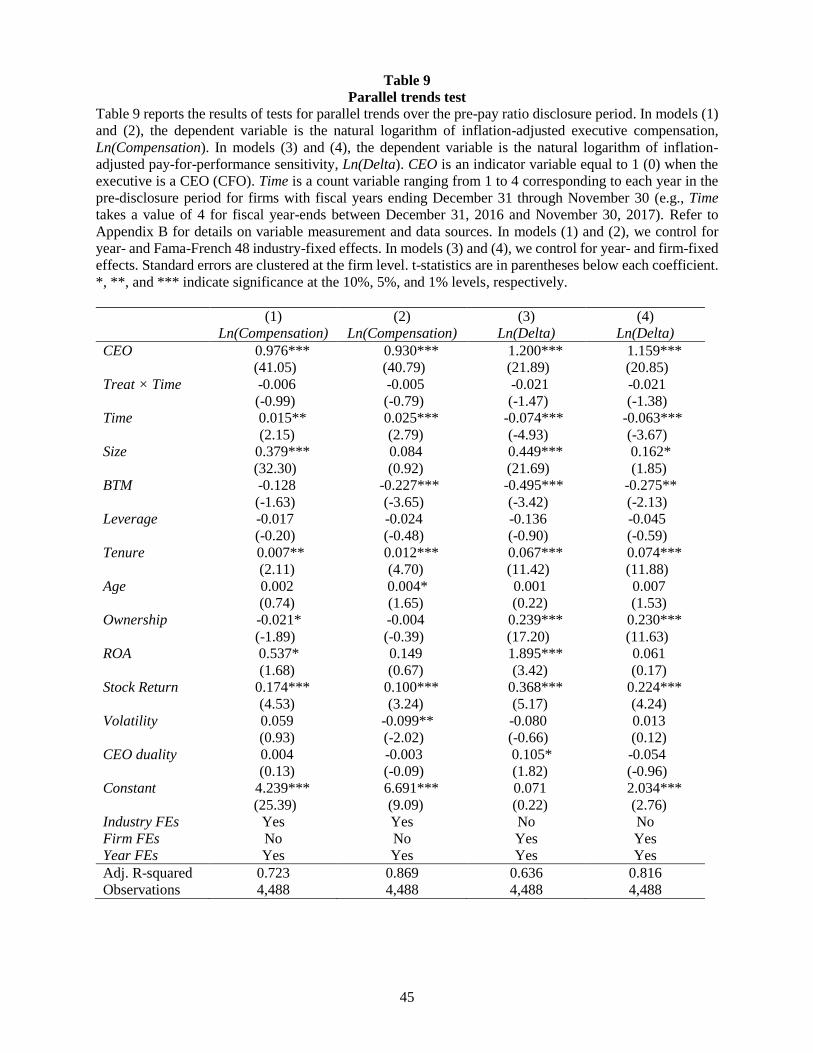
45
Table 9
Parallel trends test
Table 9 reports the results of tests for parallel trends over the pre-pay ratio disclosure period. In models (1)
and (2), the dependent variable is the natural logarithm of inflation-adjusted executive compensation,
Ln(Compensation). In models (3) and (4), the dependent variable is the natural logarithm of inflation-
adjusted pay-for-performance sensitivity, Ln(Delta). CEO is an indicator variable equal to 1 (0) when the
executive is a CEO (CFO). Time is a count variable ranging from 1 to 4 corresponding to each year in the
pre-disclosure period for firms with fiscal years ending December 31 through November 30 (e.g., Time
takes a value of 4 for fiscal year-ends between December 31, 2016 and November 30, 2017). Refer to
Appendix B for details on variable measurement and data sources. In models (1) and (2), we control for
year- and Fama-French 48 industry-fixed effects. In models (3) and (4), we control for year- and firm-fixed
effects. Standard errors are clustered at the firm level. t-statistics are in parentheses below each coefficient.
*, **, and *** indicate significance at the 10%, 5%, and 1% levels, respectively.
(1) (2) (3) (4)
Ln(Compensation) Ln(Compensation) Ln(Delta) Ln(Delta)
CEO 0.976***
(41.05)
0.930***
(40.79)
1.200***
(21.89)
1.159***
(20.85)
Treat × Time -0.006
(-0.99)
-0.005
(-0.79)
-0.021
(-1.47)
-0.021
(-1.38)
Time 0.015**
(2.15)
0.025***
(2.79)
-0.074***
(-4.93)
-0.063***
(-3.67)
Size 0.379***
(32.30)
0.084
(0.92)
0.449***
(21.69)
0.162*
(1.85)
BTM -0.128
(-1.63)
-0.227***
(-3.65)
-0.495***
(-3.42)
-0.275**
(-2.13)
Leverage -0.017
(-0.20)
-0.024
(-0.48)
-0.136
(-0.90)
-0.045
(-0.59)
Tenure 0.007**
(2.11)
0.012***
(4.70)
0.067***
(11.42)
0.074***
(11.88)
Age 0.002
(0.74)
0.004*
(1.65)
0.001
(0.22)
0.007
(1.53)
Ownership -0.021*
(-1.89)
-0.004
(-0.39)
0.239***
(17.20)
0.230***
(11.63)
ROA 0.537*
(1.68)
0.149
(0.67)
1.895***
(3.42)
0.061
(0.17)
Stock Return 0.174***
(4.53)
0.100***
(3.24)
0.368***
(5.17)
0.224***
(4.24)
Volatility 0.059
(0.93)
-0.099**
(-2.02)
-0.080
(-0.66)
0.013
(0.12)
CEO duality 0.004
(0.13)
-0.003
(-0.09)
0.105*
(1.82)
-0.054
(-0.96)
Constant 4.239***
(25.39)
6.691***
(9.09)
0.071
(0.22)
2.034***
(2.76)
Industry FEs Yes Yes No No
Firm FEs No No Yes Yes
Year FEs Yes Yes Yes Yes
Adj. R-squared 0.723 0.869 0.636 0.816
Observations 4,488 4,488 4,488 4,488