does schooling improve cognitive functioning at … · does schooling improve cognitive functioning...
TRANSCRIPT

Does schooling improve cognitive functioning at older ages?
Nicole Schneeweis, Vegard Skirbekk and Rudolf Winter-Ebmer
Working Paper Series 09-2012
Does schooling improve cognitive
functioning at older ages?
Nicole Schneeweis, Vegard Skirbekk
and Rudolf Winter-Ebmer∗
October 22, 2012
Abstract
We study the relationship between education and cognitive functioning atolder ages by exploiting compulsory schooling reforms, implemented in six Eu-ropean countries during the 1950s and 1960s. Using data of individuals aged50+ from the Survey of Health, Aging and Retirement in Europe (SHARE),we assess the causal effect of education on old-age memory, fluency, numeracy,orientation and dementia. We find a positive impact of schooling on memory.One year of education increases the delayed memory score by about 0.3, whichamounts to 16% of the standard deviation. Furthermore, for women, we findthat more education reduces the risk of dementia.
JEL Classification: I21, J14Keywords: Compulsory schooling, Instrumental Variables, Education, Cogni-tive functioning, Memory, Aging, Dementia
∗Schneeweis: Johannes Kepler University Linz, Department of Economics, Altenbergerstr. 69, 4040,[email protected]. Skirbekk: IIASA, Schlossplatz 1, 2361 Laxenburg, Austria, [email protected]: Johannes Kepler University Linz, Department of Economics, Altenbergerstr. 69, 4040,[email protected], also affiliated with IHS, IZA and CEPR. We would like to thank Rene Boheim, TarynGalloway, Bill Butz and Eric Bonsang for useful comments. We thank the Austrian FWF for funding of the ”AustrianCenter for Labor Economics and the Welfare State”. The SHARE data collection has been primarily funded by theEU through the 5th, 6th and 7th framework programme, and the U.S. National Institute of Aging (NIA) and othernational Funds, eg. the Austrian Ministries of Science and Social Affairs. We acknowledge support by a StartingGrant of the European Research Council, Grant Agreement 241003-COHORT. The usual disclaimer applies.
1 Introduction
Population ageing in Europe could pose challenges to the sustainability of national
social security and health systems. The burden of the demographic change is likely
to be determined by age-specific physical health and mental functioning which de-
termines economic activity and dependency status, rather than the demographic
age structure per se (Sanderson and Scherbov, 2005; Skirbekk et al., 2012). Cogni-
tive performance is of growing importance for work productivity and it is likely to
affect whether pension reforms aimed to raise the retirement age will be effective
(OECD, 2006; Warr, 1994). Mental functioning is also important for elderly’s activ-
ity levels and well-being (Engelhardt et al., 2010; Lindenberger and Ghisletta, 2009;
Maurer, 2011; Schmidt and Hunter, 2004). Increases in the share of seniors could
worsen average cognition levels and lead to an increase in the incidence of demen-
tia (Brookmeyer et al., 2007; Mura et al., 2010; Salthouse, 2010), unless cognitive
performance among later born cohorts increases sufficiently to offset the negative
effects of population ageing on cognitive abilities (Nisbett et al., 2012).
Finding ways to improve cognition for new generations of seniors is of central im-
portance to ageing economies. The current study addresses to which extent school-
ing improves cognitive performance among seniors. It is doubtful whether simple
correlations between schooling and cognitive performance can recover causal effects
because - as cognitive functioning of individuals is highly correlated across time -
they may pick up a reverse causation from high cognitive performance in childhood
on school attainment. Therefore, we use compulsory schooling reforms implemented
in six European countries in the 1950s-1960s as natural experiments to identify the
causal impact of schooling on cognitive outcomes at older ages. We use data of in-
dividuals born between 1939-1956 who participated in the Survey of Health, Aging
and Retirement in Europe (SHARE), a longitudinal survey focusing on living condi-
tions of individuals aged 50+ in several European countries. Instrumental-Variable
1

regressions are used to identify the impact of schooling on old-age memory, verbal
fluency, numeracy, orientation and dementia.
This paper proceeds as follows. Section 2 gives a literature review on the re-
lationship between education and cognitive functioning. The econometric model
is presented in section 3 and section 4 describes the data. Section 5 presents the
baseline results, discusses heterogeneities in the effect of schooling on old-age cogni-
tion, comprises a sensitivity analysis and discusses possible channels through which
schooling might influence cognitive function. Section 6 concludes.
2 Education and Cognitive Functioning
Education has been found to be positively associated with outcomes at older ages,
particularly cognition (Richards and Hatch, 2011; Yount, 2008). Although it is well
documented that more education is related to better cognition, causal effects are
difficult to identify as education is influenced by many unobserved characteristics
that influence cognitive outcomes, such as ability, cognitive performance in childhood
or the socio-economic characteristics of the home environment (Neisser et al., 1997;
Nisbett, 2009).
Longitudinal studies, controlling for initial ability, show that education and mental
activity in youth and adult life are related to a greater cognitive performance (Deary
et al., 2004; Husen and Tuijnman, 1991; Whalley and Deary, 2001). Studies of
monozygotic twins, in which within-pair variation in education is investigated to
find the causal effect of schooling on cognition suggest a positive relationship as well
(Haworth et al., 2008).
Education can affect cognition through several pathways, including lifestyle choices,
health behaviors, social interactions, labor-force participation, types of occupation
and brain development (Cagney and Lauderdale, 2002; Nisbett et al., 2012; Schooler
et al., 1999). Studies have shown that the improvements in mental performance fol-
2

lowing training are also related to changes in brain structures, affecting synaptic
density, hippocampal volumes and cortical thickness (Katzman, 1993; Martensson
et al., 2012).
The education-cognition relationship has also been studied by exploiting natural
experiments, such as extensions in mandatory years of education. Variation in indi-
vidual years of education is used that is not related to innate ability but prescribed
by the law. Brinch and Galloway (2012) investigated the lengthening of compulsory
schooling from 7 to 9 years, which was gradually implemented in Norwegian munic-
ipalities between 1955-1972. The authors conclude that the effect of one additional
lower secondary school year is a rise in IQ for these young men by 3.7 points, which
is similar in magnitude to results from several other studies (Cascio and Lewis, 2006;
Falch and Massih, 2011).
Using similar methodologies, two studies exist that focus on the effects of school-
ing on cognitive outcomes at older ages, i.e. many years after school completion.
Glymour et al. (2008) exploit state compulsory schooling laws in the United States
between 1907 and 1961. The mandatory schooling laws in the United States had
only little effect on completed education; one additional year of compulsory schooling
increased actual years of education only by around 0.04 years. However, Separate-
Sample Instrumental-Variables estimates show significant effects of education on
memory scores but not on mental status.
Banks and Mazzonna (2012) investigate the reform of compulsory schooling in
England in 1947, where the minimum school-leaving age was raised from 14 to 15.
Based on the analysis of data on English seniors from the English Longitudinal
Study on Ageing (ELSA), the authors find that education increases old-age memory
scores for males and females and executive functioning for English males.
We conduct an analysis using data of European seniors from the Survey of Health,
Aging and Retirement in Europe (SHARE). We exploit compulsory schooling re-
forms in the 1950s-1960s in Austria, the Czech Republic, Denmark, France, Ger-
3

many and Italy. The multi-country set-up and the gradual implementation of the
lengthening of mandatory schooling in the different countries allows us to control
for cohort-fixed effects in the empirical specification. This is important, since the
level of compulsory schooling is assigned to individuals based on birth years and age-
groups differ in their cognitive performance. Furthermore, while the other studies
focus on a limited set of outcome variables, our study is more comprehensive since
we investigate immediate and delayed memory, verbal fluency and numeracy on the
one hand and variables capturing basic cognitive function, such as orientation to
date and the chronic condition dementia, on the other hand.
3 Empirical Strategy
To identify the causal effect of education on cognitive outcomes many years after
school completion, we use the exogenous variation in individual years of schooling
induced by compulsory schooling reforms in 6 European countries (Austria, the
Czech Republic, Denmark, France, Germany and Italy). Within each country, we
relate the variation in cognitive outcomes of different cohorts to their education
level, which differs because individuals experienced different lengths of compulsory
schooling. Our Instrumental Variable is the number of compulsory schooling years
given by law, which varies over cohorts within each country and across countries for
any given cohort. The variation over cohorts and countries allows us to control for
country-fixed effects as well as cohort-fixed effects. Country-fixed effects estimations
filter out unobserved characteristics that are shared by all individuals in a given
country. Similarly, cohort-fixed effects capture effects on cognition that are shared
by all individuals born in given year or similarly have the same age at the time of
the interviews. Furthermore, within each country we capture trends over cohorts or
age-effects in cognition with country-specific linear trends.
4

We estimate the following two equations
Yick = β0 + β1Eduick + β2Xick + β3Countryc + β4Cohortk + β5CTrend ck + εick (1)
Eduick = α0 + α1Compck + α2Xick + α3Countryc + α4Cohortk + α5CTrend ck + νick (2)
where Yick is the dependent variable capturing cognitive achievement of individual i
in country c of birth cohort k. Edu ick is the number of years the individual spent in
education and Xick is a vector of control variables. Countryc and Cohortk refer to
country and cohort-fixed effects and CTrend ck capture country-specific linear trends
in birth cohorts.1
Since εick might be correlated with education, we estimate equation (1) by Two
Stage Least Squares (2SLS), instrumenting individual years of education with Compck,
the compulsory years of schooling in the respective country and cohort. Equation
(2) is the first stage equation and shows the impact of compulsory schooling on
individual years of education.
As discussed above, in Equation 1, we control for unobservable characteristics
affecting cognition that differ between countries (country-fixed effects) and among
different birth cohorts over all countries (cohort-fixed effects). Within each country
we control for cohort (or age) trends in cognitive performance since trends in cogni-
tion might differ between the different countries. These trends are country-specific
and should account for societal changes that either evolve slowly over time (like
reading habits or changes in health systems) or change at once (like the introduc-
tion of TV in a country) but exert an influence on all persons regardless of their
cohort and age.
An Instrumental-Variables strategy is internally valid if the instrument is ran-
domly assigned, i.e. individuals before and after the reforms do not differ, and if the
1The vector Xick includes a female dummy variable, an indicator variable of whether a person isborn abroad, indicators for the interview year and some control variables for the quality of the in-terview session (interviewers perception of whether something may have impaired the respondents’performance on the tests and whether another person was present during the interview).
5

exclusion restriction is fulfilled, i.e. the instrument influences cognitive outcomes
only via the impact on years of education (Angrist et al., 1996). We are confident
that compulsory schooling satisfies these conditions, in particular in combination
with the fixed-effects approach.
However, the identifying assumptions become more plausible when the width of
the window around the pivotal cohort, i.e. the first cohort affected by the new level
of compulsory schooling, is small. This means the comparison between individuals
assigned to the new mandatory schooling obligations and individuals not assigned to
the new regulations is local. Smaller windows have the advantage that comparisons
are more likely valid and the disadvantage that sample sizes get smaller. Therefore,
we estimate our model with different samples based on different widths of windows
around the pivotal cohort (10 years prior and 10 years after the pivotal cohort, ±7
years as well as ±5 years).
Concerning the external validity of our estimates, we again refer to Angrist et al.
(1996) and interpret our estimates as Local Average Treatment Effects, i.e. the
effect of years of education on cognitive outcomes for those individuals who were
actually influenced and changed their behavior due to the compulsory schooling
reforms. Those individuals with a strong preference for higher education might not
have been influenced by these reforms. Therefore, our estimates might not apply
to the whole population but to those individuals at the bottom of the education
distribution.
Table 1 lists the countries and reforms we consider in this paper, presenting the
time of the reform, the changes in years of mandatory schooling prescribed by law,
the implied changes in the mean school-leaving ages as well as the pivotal cohort, i.e.
the first cohort potentially affected by the reforms. For a short description of each
reform and the explanation of the choice of the pivotal cohorts see the Appendix.
Several studies have investigated mandatory schooling reforms in Europe. Brunello
et al. (2009) investigated compulsory schooling reforms in 12 European countries and
6

Table 1: Compulsory Schooling Reforms
Mandatory years School- PivotalCountry Reform of schooling leaving age cohort
Austria 1962/66 8 to 9 14 to 15 1951Czech Republic 1960 8 to 9 14 to 15 1947Denmark 1958 4 to 7 11 to 14 1947France 1959/67 8 to 10 14 to 16 1953Germany:Northrhine-Westphalia 1967 8 to 9 14 to 15 1953Hesse 1967 8 to 9 14 to 15 1953Rhineland-Palatinate 1967 8 to 9 14 to 15 1953Baden-Wuerttemberg 1967 8 to 9 14 to 15 1953
Italy 1963 5 to 8 11 to 14 1949
found that education increases wages and reduces wage inequality. Furthermore,
Fort et al. (2011) used the reforms to investigate the relationship between educa-
tion and fertility decisions and Brunello et al. (2011) and Brunello et al. (2012,
forthcoming) study the effects of education on health and the body mass index.
4 Data
We pool data of individuals participating either in the first, in the second or in both
waves of the Survey of Health, Ageing and Retirement in Europe (SHARE). We
primarily use cognitive tests obtained in wave 1 (interviews in 2004/05) to avoid
distortions by any retest effects. A retest effect represents a test bias that results
from having done the same or a similar test in a previous wave of the survey. This
includes the recognition of test questions, a shorter ”warm-up” phase, the familiarity
with the test situation, fewer procedural errors and less nervousness during the
testing (Salthouse, 2010; Thorvaldsson et al., 2006). Only for information about
dementia, which is not based on testing but a chronic disease that has to be diagnosed
by a doctor and thus not susceptible to a retest bias, we are using wave 2.2 For those
2Dementia was not asked in wave 1 of SHARE.
7

respondents with missing cognitive tests in the first wave, we use data from wave 2
(the interview in 2006/07). We also include records of individuals only interviewed
in the first wave or the second wave. The longitudinal individuals represent roughly
39% of our sample, while around 18% participated only in the first wave and dropped
out afterwards and around 43% joined the survey at the time of the second wave.3
We use only records of individuals aged 45 or above who were born in the country
of residence or migrated before the age of five to ensure that they went to school in
the host country at least at the early stages of their school career, i.e. when they
were eligible for the changes induced by the compulsory schooling reforms.4 We
select a baseline sample of individuals born between 1939 and 1956, just a few years
around the pivotal cohorts. We exclude records with missing information on our
key variable, the number of years of education. This information is missing or can
not be calculated from the educational attainment categories for 141 out of 9,820
individuals. From our baseline data-set of 9,679 respondents, we gradually reduce
the samples around the reforms in each country to individuals born up to 10 years
before and after (Sample 10), 7 years before and after (Sample 7) as well as 5 years
before and after each pivotal reform cohort (Sample 5). The final samples consist of
8,994, 7,023 and 5,387 respondents, respectively.
We measure educational attainment with individual years of education. While the
second wave of SHARE provides information on the number of years spent in full
time education, in the first wave the respondents were asked about their educational
degrees. Thus, we use the second wave information on years of schooling for all
individuals that participated in the second wave. For those individuals who only
participated in the first wave, we calculate their years of education using country-
specific conversion tables provided by SHARE.
3Sample attrition between the two waves of SHARE is no problem in our study because allindividuals that appear at least once in the survey are included in our sample.
4While the survey was targeted at individuals aged 50+ only, cohabiting partners in the samehousehold were interviewed even if they were younger at the time of the interview.
8
Tab
le2:
Des
crip
tive
Sta
tist
ics
ofB
asel
ine
Sam
ple
Yea
rsof
Edu
cati
onM
emor
yN
umer
acy
/O
rien
tati
on/
Dem
enti
aC
ount
ryFe
mal
eA
gein
divi
dual
com
puls
ory
imm
edia
tede
laye
dF
luen
cyG
ood
num
erac
yG
ood
orie
ntat
ion
Obs
Aus
tria
0.56
58.2
810
.76
8.21
5.55
3.99
23.2
33.
82/
0.71
3.87
/0.
890.
0027
1,03
3C
zech
Rep
ublic
0.56
58.8
811
.96
8.58
5.35
3.64
20.3
93.
67/
0.62
3.83
/0.
880.
0039
1,80
3D
enm
ark
0.52
57.2
812
.04
5.79
5.91
4.69
23.6
93.
72/
0.57
3.88
/0.
900.
0031
1,84
4Fr
ance
0.54
56.9
712
.04
8.45
5.17
3.73
22.2
03.
45/
0.53
3.81
/0.
890.
0034
1,92
4G
erm
any
0.53
57.6
213
.46
8.16
5.91
4.29
23.5
14.
00/
0.76
3.89
/0.
920.
0017
920
Ital
y0.
5558
.25
8.78
6.08
4.79
3.30
16.1
13.
15/
0.32
3.88
/0.
900.
0017
2,15
5
All
0.54
57.8
711
.37.
395.
373.
8821
.02
3.57
/0.
553.
86/
0.89
0.00
299,
679
Notes:
Sam
ple
incl
ud
esin
div
idu
als
born
1939-1
956,
part
icip
ati
ng
inth
efi
rst/
seco
nd
wave
of
SH
AR
E,
who
rep
ort
edth
eir
yea
rsof
edu
cati
on,
wh
ow
ere
45+
at
the
tim
eof
the
inte
rvie
w,
who
wer
eb
orn
inth
eco
untr
yor
mig
rate
db
efore
age
5.
Gen
der
,age
an
dyea
rsof
edu
cati
on
are
availab
lefo
rall
9,6
79
resp
on
den
ts.
Th
em
emory
score
sare
mis
sing
for
aro
un
d1.3
%of
the
sam
ple
,flu
ency
ism
issi
ng
for
1.8
%,
num
eracy
for
0.7
%,
ori
enta
tion
for
0.4
%and
dem
enti
aw
as
only
ask
edin
the
seco
nd
wave
of
SH
AR
E,
an
dis
on
lyavailab
lefo
r7,9
44
out
of
7,9
60
resp
ond
ents
.
9

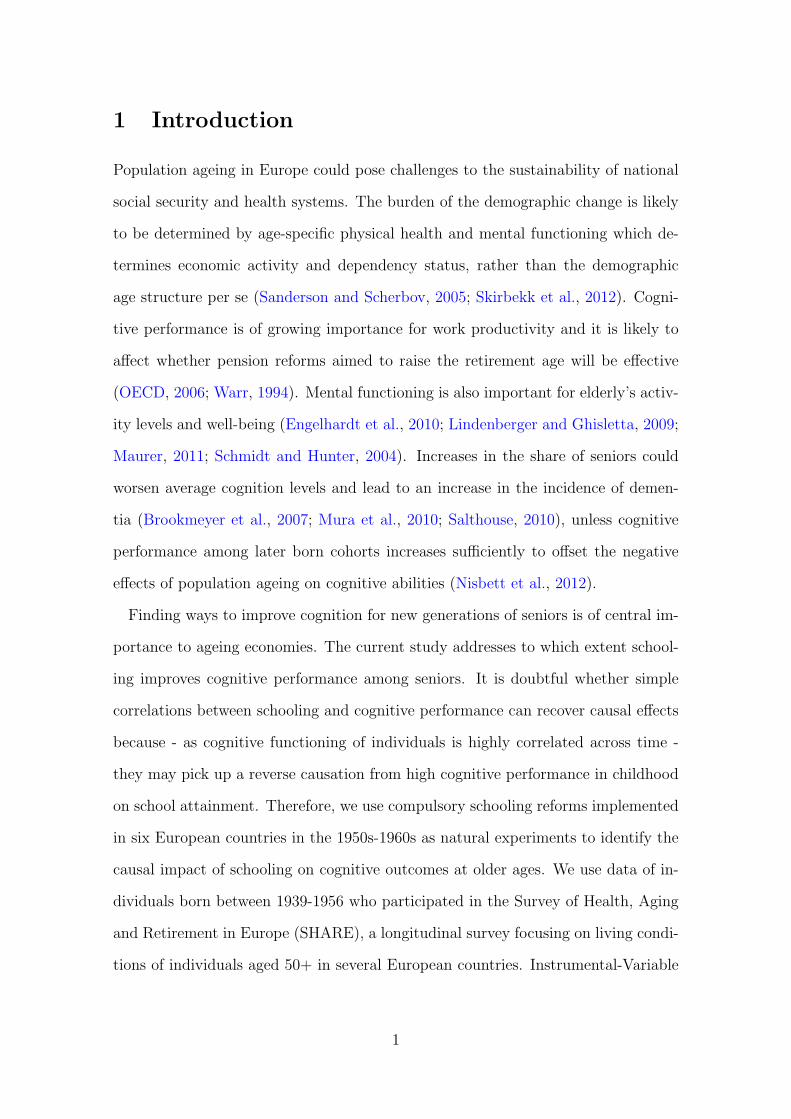
Table 2 reports descriptive statistics on key variables in the sample used for the
baseline estimations, the sample consisting of birth cohorts born 1939-1956. A bit
more than half of the sample is female and the mean age is around 58 years. On
average, the individuals completed 11 years of education, ranging from around 9 in
Italy to around 13 in the four German states listed in Table 1.
We measure various domains of cognitive functioning, such as memory, fluency,
numeracy, orientation to date as well as the medical condition of dementia. Our
measures of cognitive functioning are based on the following tests:
Memory (immediate and delayed): The interviewer reads a list of 10 words. Im-
mediate memory measures how many of these 10 words the respondent is able to
recall directly after the interviewer read the words. Delayed memory measures the
ability of the respondent to recall the same words after a time period of around 5-10
minutes (after several other interview questions). On average, the individuals in our
sample are able to recall around 5 words immediately and 4 words after a certain
time period.
Fluency: The verbal fluency score is the sum of animal names the respondent is
able to state within the time of one minute. The mean value is around 21.
Numeracy: This score ranges from one to five (high score) and is based on the
ability of the respondent to answer basic as well as more advanced mathematical
questions from daily life, ranging from estimating simple mathematical relations to
compound interest calculations. The average numeracy score is around 3.6.
Orientation to date: This variable ranges from zero to four and measures if a
person is able to remember the correct date consisting of day of the month, month,
year and day of the week. 3.9 is the average score in our sample.
Dementia is based on the outcome of the following question: Has a doctor ever
told you that you had/currently have Alzheimer’s disease, dementia, organic brain
syndrome, senility or any other serious memory impairment? Around 0.3% of all
individuals in our sample suffer from such a chronic disease.
10

Figure 1 shows the distribution of our measures of cognitive functioning. Both
memory scores and verbal fluency follow approximately normal distributions around
their means. Numeracy and orientation have larger densities at the upper tail of
the distributions, with 55% achieving either the highest or the second-highest value
of numeracy and 89% showing a perfect orientation to date. In our empirical spec-
ifications, we treat immediate memory, delayed memory and fluency as continuous
variables but condense the information for numeracy and orientation into binary in-
dicators. “Good numeracy”is defined to be one for individuals who achieve numeracy
scores of four and five and “Good orientation” is defined to be one for individuals
scoring four on the orientation variable. Table 2 also reports mean values of these
binary indicators.
Figure 1: Measures of Cognitive Functioning
0.0
5.1
.15
.2.2
5D
ensi
ty
0 2 4 6 8 10Memory (immediate)
0.0
5.1
.15
.2.2
5D
ensi
ty
0 2 4 6 8 10Memory (delayed)
0.0
2.0
4.0
6D
ensi
ty
0 25 50 75 100Fluency
0.1
.2.3
.4D
ensi
ty
1 2 3 4 5Numeracy
0.2
.4.6
.81
Den
sity
0 1 2 3 4Orientation to date
11

5 Results
In this section, we discuss the results of our baseline estimates and analyze whether
the effects are heterogenous with respect to gender and family background. We give
a sensitivity analysis and discuss possible channels through which education might
influence cognitive decline.
5.1 Main results
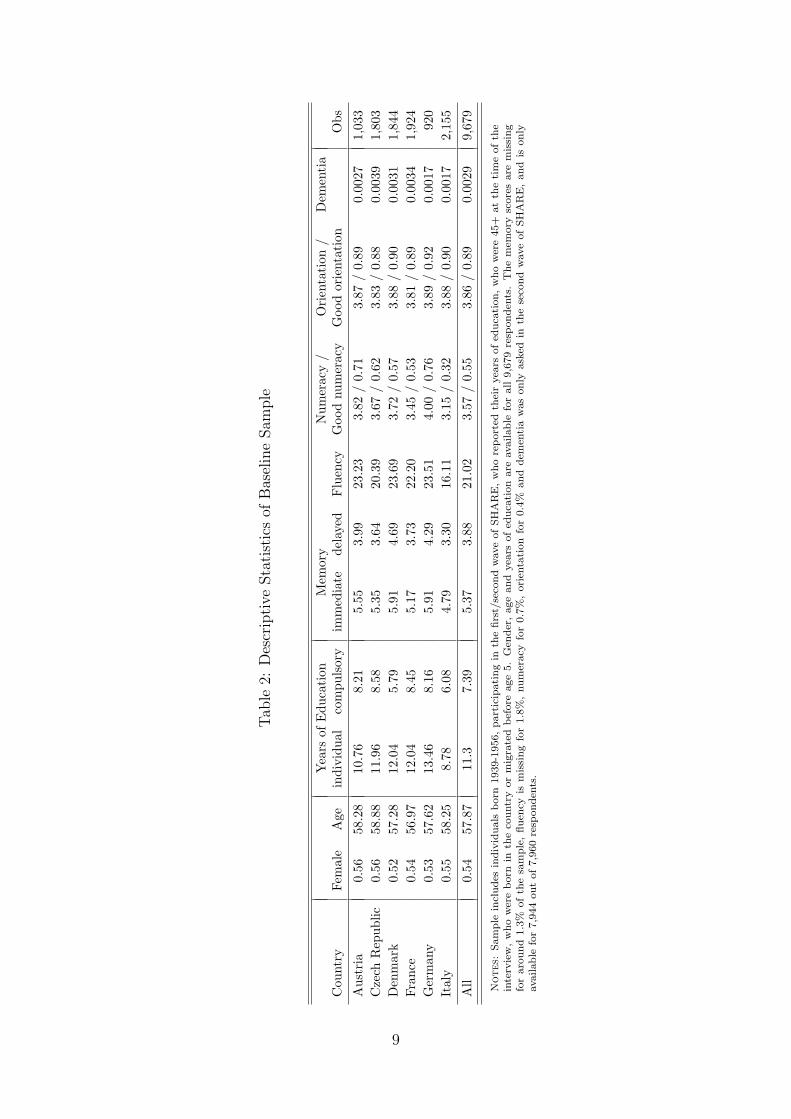
We start by looking at the effects of compulsory schooling on actual years of ed-
ucation (first stage). The first stage is shown graphically in Figure 2. The graph
shows mean years of education of cohorts just before and after the different reforms.
In this graph all countries are normalized by the time of the reform which is set at
time zero. The graph shows a jump in the mean years of education at the time of
the reforms, suggesting that the reforms had a substantial impact. This is corrobo-
rated by the results of the first stage regressions in Table 3: increasing compulsory
education by one year leads to one third of an actual additional year of schooling on
average. This is a sizeable effect; typically only individuals at the lower end of the
educational distribution react to compulsory schooling reforms.5
5The first stage coefficients are similar in magnitudes to those obtained in other studies inves-tigating compulsory schooling laws in various European countries, such as Brunello et al. (2009),Brunello et al. (2011); Fort et al. (2011), Brunello et al. (2012, forthcoming).
12
Table 3: First Stage Regressions
Years of educationBaseline Sample 10 Sample 7 Sample 5
Compulsory schooling 0.329 0.329 0.326 0.338(0.052)*** (0.052)*** (0.058)*** (0.072)***
F-Statistics 40.70 40.36 31.38 22.30Observations 9,679 8,994 7,023 5,387
Notes: Each coefficient represents a separate linear regression. Country-fixed effects, cohort-fixedeffects, country-specific linear trends in birth cohorts, indicators for interview year, foreign born,female and indicators for the interviewers perception on whether something may have impaired therespondents performance on the tests and whether another person was present during the intervieware included in all regressions. Heteroscedasticity and cluster-robust standard errors in parentheses(clusters are country-cohorts). ***, ** and * indicate statistical significance at the 1-percent, 5-percent and 10-percent level.
Figure 2: First Stage
910
11
12
13
14
Mean y
ears
of educa
tion b
y co
hort
-7 -6 -5 -4 -3 -2 -1 0 1 2 3 4 5 6Cohort relative to pivotal cohort
Table 4 shows our main results, starting with Ordinary Least Squares (OLS)
estimates in Panel A, Reduced Form effects (the effect of compulsory schooling on
our outcome variables, also called Intention-To-Treat effects) in Panel B and Two
Stage Least Squares (2SLS) results in Panel C.
Almost all OLS estimates show a clear positive association between education
and cognitive functioning at older ages. Due to potential omitted interfering vari-
ables, these associations cannot be taken as causal effects. We proceed with our
2SLS estimates which present causal effects of education on cognitive functioning
13

for those individuals who increased their educational attainment due to the compul-
sory schooling reforms in the various countries.
There is a clear and robust causal effect of education on immediate memory and
even more so on delayed memory. These effects are (with one exception) robust and
statistically significant across our different specifications; the smaller the sample we
have chosen around the pivotal cohort, the larger the quantitative effect. Using the
sample with 5 years before and after the reform, we find that one additional year of
schooling increases immediate memory by 0.26 words (out of ten possible) and by
0.37 words in the case of delayed memory. These effects amount to around 15%/19%
of the standard deviation in the immediate/delayed memory scores in the sample.
There are no causal effects of education on fluency and numeracy; no statistically
significant coefficients are obtained. One potential reason why we find gains in
memory function but not in the fluency could be that the fluency test is based on
naming animals, a measure which could be less affected by extensions to secondary
school levels, as this may be focused more in lower levels of instruction, such as
kindergarten or primary school. Further, the lengthening of schooling could reduce
the probability of working with animals (e.g. in agricultural occupations) or residing
in rural areas with more animals around, thus reducing the knowledge of animals.
On the other hand, the test could measure executive functioning or the ability to
organize ones thoughts which may improve ones ability to reply to the question in
an organized manner (eg. first naming livestock, then birds, thereafter wildlife).
However, our results are in line with Banks and Mazzonna (2012), who studied the
compulsory schooling reform in England and found significant effects of education
on memory but generally no effects for executive functioning, except for males with
low education.
Gains to immediate and delayed recall may result from the fact that schooling
is universally aimed at improving these skills, as learning how to remember new
material is universally essential for schooling success. Education is likely to aim
14

Table 4: Baseline Results
Memory Good GoodImmediate Delayed Fluency Numeracy Orientation Dementia
A: OLSBaseline 0.116 0.120 0.521 0.034 0.005 -0.00014
(0.005)*** (0.006)*** (0.025)*** (0.001)*** (0.001)*** (0.00016)Observations 9,556 9,563 9,505 9,608 9,643 7,944B: Reduced FormsBaseline 0.033 0.048 -0.041 0.005 0.004 -0.00163
(0.029) (0.028)* (0.099) (0.006) (0.004) (0.00085)*Observations 9,556 9,563 9,505 9,608 9,643 7,944Sample 10 0.041 0.053 0.009 0.004 0.004 -0.00149
(0.028) (0.028)* (0.097) (0.006) (0.004) (0.00088)*Observations 8,875 8,882 8,827 8,927 8,960 7,435Sample 7 0.066 0.092 -0.061 0.004 0.009 -0.00066
(0.033)** (0.030)*** (0.091) (0.009) (0.004)* (0.00090)Observations 6,924 6,931 6,891 6,971 6,997 5,779Sample 5 0.089 0.125 -0.113 -0.004 0.003 -0.00097
(0.034)** (0.035)*** (0.121) (0.008) (0.005) (0.00092)Observations 5,308 5,314 5,283 5,343 5,366 4,370C: 2SLSBaseline 0.098 0.143 -0.121 0.015 0.012 -0.00413
(0.076) (0.075)* (0.296) (0.017) (0.011) (0.00207)**Observations 9,556 9,563 9,505 9,608 9,643 7,944Sample 10 0.122 0.157 0.027 0.011 0.013 -0.00359
(0.072)* (0.073)** (0.284) (0.018) (0.011) (0.00201)*Observations 8,875 8,882 8,827 8,927 8,960 7,435Sample 7 0.203 0.281 -0.185 0.014 0.026 -0.00161
(0.077)*** (0.072)*** (0.289) (0.024) (0.012)** (0.00208)Observations 6,924 6,931 6,891 6,971 6,997 5,779Sample 5 0.264 0.373 -0.331 -0.011 0.010 -0.00217
(0.072)*** (0.083)*** (0.389) (0.027) (0.012) (0.00198)Observations 5,308 5,314 5,283 5,343 5,366 4,370
Notes: Each coefficient represents a separate linear regression. Panel A gives OLS estimates of years of educationon cognition, panel B gives estimates of compulsory schooling years on cognition and panel C shows IV estimatesof years of education on cognitive outcomes. Country-fixed effects, cohort-fixed effects, country-specific lineartrends in birth cohorts, indicators for interview year, foreign born, female and indicators for the interviewersperception on wether something may have impaired the respondents performance on the tests and whetheranother person was present during the interview are included in all regressions. Heteroscedasticity and cluster-robust standard errors in parentheses (clusters are country-cohorts). ***, ** and * indicate statistical significanceat the 1-percent, 5-percent and 10-percent level.
15

towards improving strategies for encoding and organizing new information and to
increase one’s ability to remember.
The lack of effects on numeracy could partly be due to the fact that there is
a very high correct share of responses, which may indicate that a ”ceiling effect”
is reached, where the educational expansions we consider will not affect responses
to this basic mathematical measure. Moreover, the skills learned at the relevant
school level may not be relevant for the numerical test given. Conducting basic
mathematical operations is a skill needed in basic household work and for both low
and high skilled occupations. Education is not necessarily related to the use of such
skills.6
The 2SLS coefficient of education on good orientation is positive and consistent
across specifications but only marginally significant in one out of four cases. In a
similar vein, the prevalence of dementia is reduced by an additional year of education
by 0.0016 - 0.004 percentage-points. These effects are statistically insignificant in
the smaller samples.7 Given an average prevalence rate of 0.003 in the full sample,
these effects are remarkable and suggest that education is causally related to a
postponement of dementia.
5.2 Heterogenous effects
In this section, we explore whether the IV-estimates of education on cognitive per-
formance vary by gender and family background. Panel A of Table 5 gives 2SLS
coefficients for Sample 10 and 7 for males and females, separately.
6Note that we neither do find significant coefficients when the numeracy score is treated ascontinuous variable or the cut-off of ’good numeracy’ is set at a lower level.
7As dementia is only measured in wave two of SHARE, we have a smaller sample for thisoutcome.
16

Table 5: Heterogeneous effects by gender and family background (2SLS)
Memory Good GoodImmediate Delayed Fluency Numeracy Orientation Dementia
A: By GenderMalesSample 10 0.156 0.111 -0.363 0.039 0.002 0.003
(0.119) (0.132) (0.581) (0.025) (0.018) (0.003)Observations 4,018 4,024 3,991 4,051 4,069 3,341Sample 7 0.302 0.281 -0.305 0.055 0.019 0.005
(0.123)** (0.128)** (0.595) (0.031)* (0.020) (0.003)Observations 3,136 3,142 3,120 3,166 3,180 2,595FemalesSample 10 0.100 0.194 0.372 -0.016 0.025 -0.010
(0.101) (0.089)** (0.462) (0.026) (0.016) (0.005)**Observations 4,857 4,858 4,836 4,876 4,891 4,094Sample 7 0.097 0.277 -0.208 -0.034 0.033 -0.010
(0.131) (0.098)*** (0.541) (0.036) (0.020) (0.005)*Observations 3,788 3,789 3,771 3,805 3,817 3,184B: By Family backgroundFew booksSample 10 0.124 0.236 -0.528 0.026 0.035 -0.006
(0.206) (0.134)* (0.733) (0.040) (0.028) (0.004)Observations 3,284 3,286 3,270 3,296 3,303 3,139Sample 7 0.281 0.324 -0.342 0.023 0.060 -0.006
(0.197) (0.151)** (0.763) (0.046) (0.034)* (0.004)Observations 2,543 2,545 2,534 2,551 2,558 2,430Many booksSample 10 0.133 0.080 0.019 -0.078 0.035 -0.001
(0.120) (0.124) (0.659) (0.049) (0.021)* (0.003)Observations 2,309 2,314 2,303 2,324 2,329 2,239Sample 7 0.182 0.106 -0.399 -0.073 0.020 0.003
(0.166) (0.169) (0.998) (0.060) (0.027) (0.005)Observations 1,809 1,814 1,805 1,824 1,825 1,748
Notes: Each coefficient represents a separate linear regression. Panel A gives 2SLS estimates of years ofeducation on cognitive outcomes by gender. Panel B gives estimates by parental background measured by thenumber of books at home when age 10. Few books are 0-10 and 11-25 books and many books means 26-100,100-200 and more than 200 books. Country-fixed effects, cohort-fixed effects, country-specific linear trends inbirth cohorts, indicators for interview year, foreign born and indicators for interview impairments and whetheranother person was present during the interview are included in all regressions. Female dummy included in panelB. Heteroscedasticity and cluster-robust standard errors in parentheses (clusters are country-cohorts). ***, **and * indicate statistical significance at the 1-percent, 5-percent and 10-percent level.
Similar to the baseline results, we find the strongest and most significant effects
for delayed memory, with similar coefficients for males and females. For immediate
memory, the coefficients show the same signs as they do in the baseline estimates
but most coefficients are statistically not significant anymore. For fluency, we again
17

find no causal impact of education, neither for males, nor for females. For good
numeracy, we obtain heterogeneous effects by gender. While for males the effects are
positive and statistically significant at the 10 percent-level with the smaller sample,
the coefficients are basically zero for females. No significant results are obtained for
good orientation. Interestingly, heterogenous effects are found for dementia. While
the effects are basically zero for males, the coefficients for females are statistically
significant and larger in magnitude. All of the results reported in Panel A of Table 5
are similar, when the baseline sample and Sample 5 are used to estimate the model.8
Panel B contains 2SLS estimates by parental background. At the time of the third
wave of SHARE in 2008/09, the survey incorporated a retrospective interview, called
SHARELIFE. Thus, the third wave contains information on childhood circumstances
of the respondents. Amongst others, the respondents were asked about the number
of books at home when they were 10 years old, i.e. before the treatment of extended
compulsory schooling. At the basis of this variable, we split our sample into two
parts, one sample for individuals with few books at home (0-10, 11-25 books; around
59%) and one sample for individuals with many books at home (26-100, 101-200,
more than 200 books; around 41%). Table 5 contains the analysis for these two
groups, separately.9
Generally, we find stronger and statistically more significant results for the group
with few books at home. Compared to respondents from more affluent families, they
experience high returns to schooling when it comes to delayed memory. For the other
measures of cognitive performance, the coefficients are mostly not statistically sig-
nificant, however the coefficients on good orientation and dementia are similar to
8The first stage regressions by gender show similar results, with slightly larger coefficients formales.
9Note, that the sample size is somewhat smaller in Panel B because only individuals whoparticipated also in the third wave of SHARE are included (around 63%). However, it seems thatthis attrition does not bias the results because we obtain the same results as in Table 4 when wedo the estimations for the smaller sample.
18

the baseline results when considering the group with less-favorable parental back-
ground.10
5.3 Robustness
In the estimations above, we control for country-specific trends in birth cohorts
that are linear. Since treatment and control groups (cohorts after and before the
reforms) differ in terms of age in each country, unobserved differences between these
two groups that are not captured by the cohort fixed effects over all countries might
bias the estimations. Country-specific smooth trends in cohorts should capture
these potential unobservable differences between treatment and control groups and
allowing for country-specific quadratic trends is one way to increase the flexibility of
these important control variables. We estimate our model controlling for quadratic
instead of linear trends for the two larger samples, the baseline sample and sample
10. In general, the results are robust. The coefficients for memory increase in
magnitude and statistical significance. We obtain statistically significant effects for
good orientation in the larger sample but the coefficients for dementia loose their
statistical significance. However, when we split the sample by gender, we again find
statistically significant coefficients of around -0.01 for females.
As compulsory schooling reforms affect cohorts differently, we might still be con-
cerned that our school reform variables pick up some unspecified time trends or
structural breaks in the countries. To test for this, we are performing a placebo
reform experiment. Similar to Black et al. (2008), we introduce a placebo treatment
where we add a hypothetical compulsory schooling reform five years in the future
for each of our countries. This placebo reform should not have any impact on the
cognitive scores. If we find an impact, our results might be driven by other unob-
served mechanisms, such as age effects or time trends. As the placebo reform should
have no impact on attended years of schooling, we can only use and compare the
10The first stage coefficients are 0.23-0.25 for the group with few books and 0.37-0.44 for thegroup with more books at home at age 10.
19

Table 6: Placebo treatments - Reduced forms estimates
Sample 10 Sample 7Reduced Form Reduced Form Reduced Form Reduced Form(see Table 4) +5yrs in future (see Table 4) +5yrs in future
A: Delayed Memory (both genders)Schooling reform 0.053 0.078 0.092 0.105
(0.028)* (0.032)** (0.030)*** (0.034)***Placebo reform 0.066 0.034
(0.046) (0.042)Observations 8,882 8,882 6,931 6,931
B: Dementia (females)Schooling reform -0.004 -0.004 -0.003 -0.003
(0.002)** (0.002)** (0.002)* (0.002)Placebo reform 0.000 0.000
(0.001) (0.002)Observations 4,094 4,094 3,184 3,184
Notes: Each column and panel represents a separate regression based on Sample 10 or 7. Country-fixedeffects, cohort-fixed effects, country-specific linear trends in birth cohorts, indicators for interview year, foreignborn and indicators for potential impairment and other person in room during cognitive tests are included inall regressions, female additionally included in panel A. Heteroscedasticity and cluster-robust standard errorsin parentheses (clusters are country-cohorts). ***, ** and * indicate statistical significance at the 1-percent,5-percent and 10-percent level.
Reduced Form estimates, the effects of compulsory schooling on cognitive outcomes,
to test for a placebo effect.
Table 6 shows the Reduced Form estimates for our main results obtained above,
the delayed memory score of males and females and the condition of dementia for
female seniors. We provide evidence for Sample 10 and 7 with country-specific lin-
ear trends in cohorts. In both panels, for comparison reasons the Reduced Form of
the baseline model is shown and the results of the placebo tests are given. Adding
placebo schooling reforms five years in the future (columns 2 and 4) does not sig-
nificantly alter the Reduced Form estimates of the original reforms. Furthermore,
each of the placebo laws has no significant impact on memory or dementia.11
Our identification strategy relies on the assumption that the instrument is ran-
domly assigned and the exclusion restriction holds, i.e. the instrument influences
11Note that we have to include the real compulsory schooling reforms in the regressions as well,as for some cohorts the placebo and the real reform overlap.
20
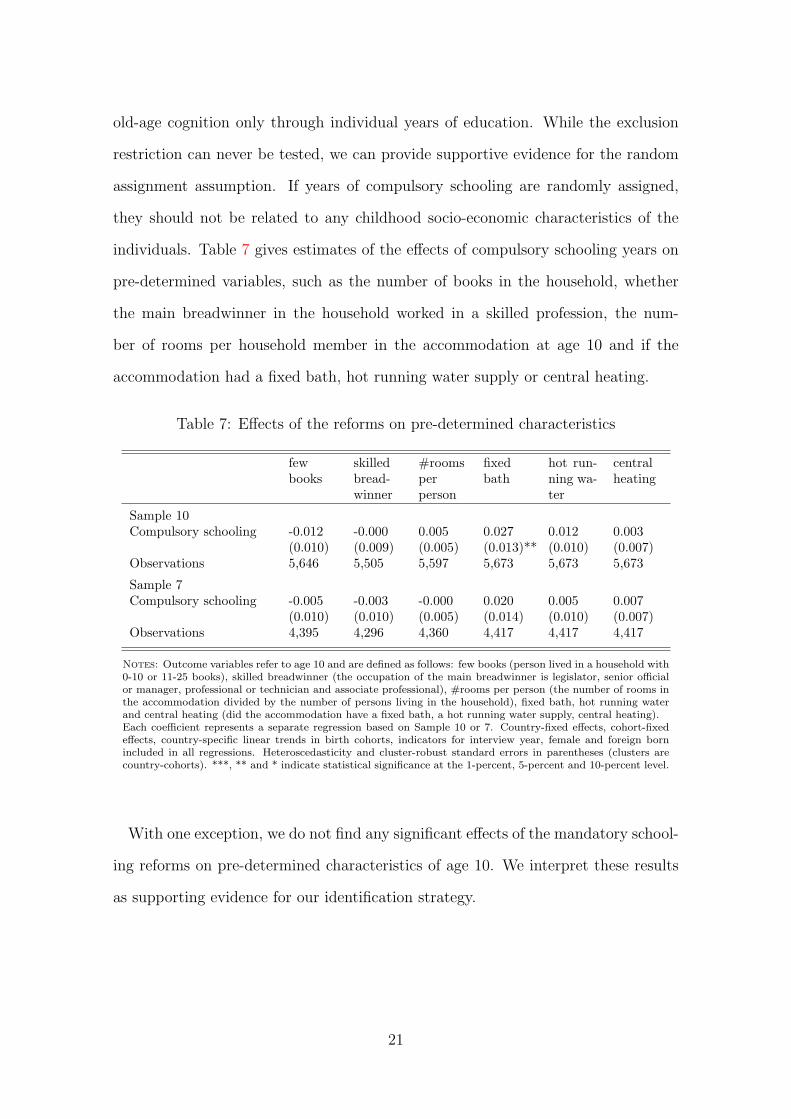
old-age cognition only through individual years of education. While the exclusion
restriction can never be tested, we can provide supportive evidence for the random
assignment assumption. If years of compulsory schooling are randomly assigned,
they should not be related to any childhood socio-economic characteristics of the
individuals. Table 7 gives estimates of the effects of compulsory schooling years on
pre-determined variables, such as the number of books in the household, whether
the main breadwinner in the household worked in a skilled profession, the num-
ber of rooms per household member in the accommodation at age 10 and if the
accommodation had a fixed bath, hot running water supply or central heating.
Table 7: Effects of the reforms on pre-determined characteristics
fewbooks
skilledbread-winner
#roomsperperson
fixedbath
hot run-ning wa-ter
centralheating
Sample 10Compulsory schooling -0.012 -0.000 0.005 0.027 0.012 0.003
(0.010) (0.009) (0.005) (0.013)** (0.010) (0.007)Observations 5,646 5,505 5,597 5,673 5,673 5,673
Sample 7Compulsory schooling -0.005 -0.003 -0.000 0.020 0.005 0.007
(0.010) (0.010) (0.005) (0.014) (0.010) (0.007)Observations 4,395 4,296 4,360 4,417 4,417 4,417
Notes: Outcome variables refer to age 10 and are defined as follows: few books (person lived in a household with0-10 or 11-25 books), skilled breadwinner (the occupation of the main breadwinner is legislator, senior officialor manager, professional or technician and associate professional), #rooms per person (the number of rooms inthe accommodation divided by the number of persons living in the household), fixed bath, hot running waterand central heating (did the accommodation have a fixed bath, a hot running water supply, central heating).Each coefficient represents a separate regression based on Sample 10 or 7. Country-fixed effects, cohort-fixedeffects, country-specific linear trends in birth cohorts, indicators for interview year, female and foreign bornincluded in all regressions. Heteroscedasticity and cluster-robust standard errors in parentheses (clusters arecountry-cohorts). ***, ** and * indicate statistical significance at the 1-percent, 5-percent and 10-percent level.
With one exception, we do not find any significant effects of the mandatory school-
ing reforms on pre-determined characteristics of age 10. We interpret these results
as supporting evidence for our identification strategy.
21

5.4 Channels
Our analysis gives evidence that schooling has a significant long-term effect on old-
age memory scores for males and females and dementia (including Alzheimer’s dis-
ease, organic brain syndrome, senility and other serious memory impairments) for
female seniors. There are several channels through which education might influence
old-age cognition, such as income, labor force participation, cognitive leisure activ-
ities, physical and social activities as well as health and health behaviors. Direct
effects of education and training on brain functioning can also play a rolel.
In the medical literature, many studies exist investigating risk and protective fac-
tors of cognitive decline and dementia (see e.g. Anstey et al., 2007, 2008; Hakansson
et al., 2009; Ninomiya et al., 2011; Ravaglia et al., 2008; Xu et al., 2011; Yang et al.,
2011). In its report, the Agency for Healthcare Research and Quality (2010) summa-
rizes the previous research and concludes that cognitive training, physical activity,
non-cognitive non-physical leisure activities and a Mediterranean diet are negatively
associated with the risk of cognitive decline. Furthermore, marriage seems to have
a protective effect and a depressive disorder, diabetes and current tobacco use are
positively correlated with cognitive decline and dementia. No consistent associations
are found for alcohol intake, obesity, hypertension and high cholesterol.
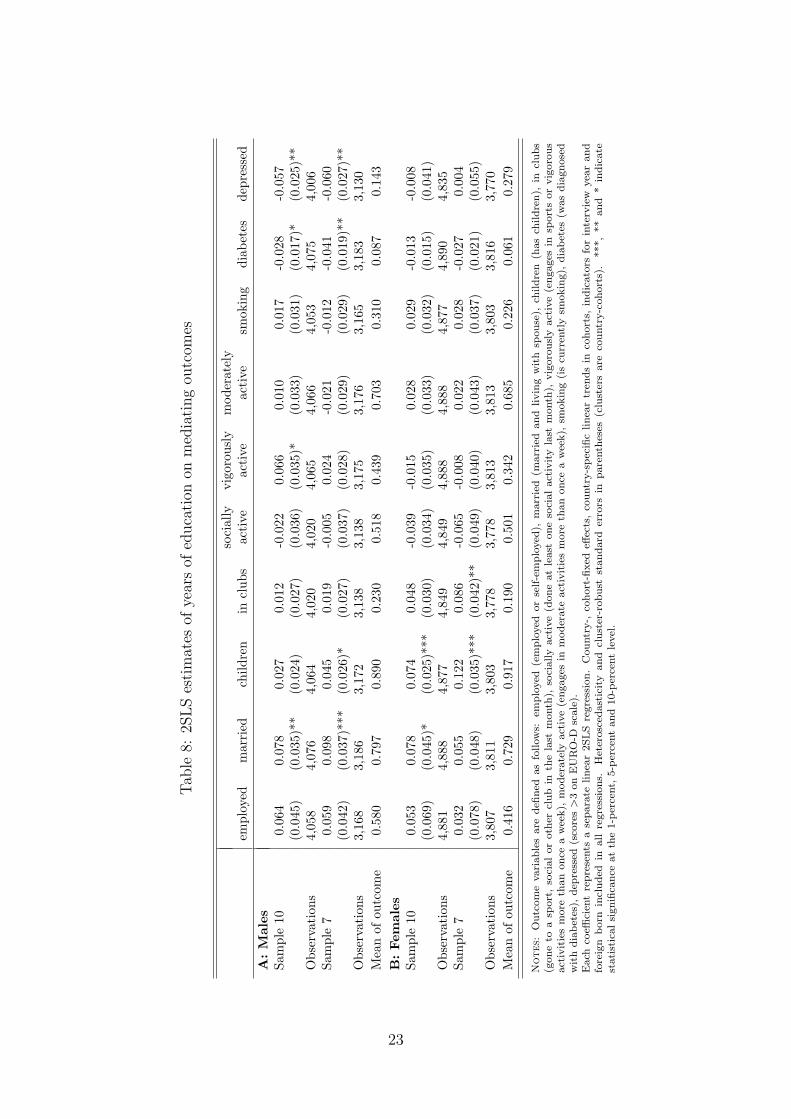
Following Banks and Mazzonna (2012), we identify possible channels on how ed-
ucation influences cognition by identifying the effects of schooling on outcomes that
are known to influence cognitive decline. Banks and Mazzonna (2012) found that
education does not have significant effects on social participation and quality of life.
Table 8 shows 2SLS estimates of years of education on factors influencing cogni-
tive decline and dementia for males and females, such as marriage, social activities,
physical activities, smoking, diabetes and depression. Since we suspect that being
socially active increases with labor force participation and the presence of children,
we, furthermore, include those variables in our analysis.
22
Tab
le8:
2SL
Ses
tim
ates
ofye
ars
ofed
uca
tion
onm
edia
ting
outc
omes
soci
ally
vigo
rous
lym
oder
atel
yem
ploy
edm
arri
edch
ildre
nin
club
sac
tive
acti
veac
tive
smok
ing
diab
etes
depr
esse
d
A:M
ales
Sam
ple
100.
064
0.07
80.
027
0.01
2-0
.022
0.06
60.
010
0.01
7-0
.028
-0.0
57(0
.045
)(0
.035
)**
(0.0
24)
(0.0
27)
(0.0
36)
(0.0
35)*
(0.0
33)
(0.0
31)
(0.0
17)*
(0.0
25)*
*O
bser
vati
ons
4,05
84,
076
4,06
44,
020
4,02
04,
065
4,06
64,
053
4,07
54,
006
Sam
ple
70.
059
0.09
80.
045
0.01
9-0
.005
0.02
4-0
.021
-0.0
12-0
.041
-0.0
60(0
.042
)(0
.037
)***
(0.0
26)*
(0.0
27)
(0.0
37)
(0.0
28)
(0.0
29)
(0.0
29)
(0.0
19)*
*(0
.027
)**
Obs
erva
tion
s3,
168
3,18
63,
172
3,13
83,
138
3,17
53,
176
3,16
53,
183
3,13
0M
ean
ofou
tcom
e0.
580
0.79
70.
890
0.23
00.
518
0.43
90.
703
0.31
00.
087
0.14
3B
:Fem
ales
Sam
ple
100.
053
0.07
80.
074
0.04
8-0
.039
-0.0
150.
028
0.02
9-0
.013
-0.0
08(0
.069
)(0
.045
)*(0
.025
)***
(0.0
30)
(0.0
34)
(0.0
35)
(0.0
33)
(0.0
32)
(0.0
15)
(0.0
41)
Obs
erva
tion
s4,
881
4,88
84,
877
4,84
94,
849
4,88
84,
888
4,87
74,
890
4,83
5Sa
mpl
e7
0.03
20.
055
0.12
20.
086
-0.0
65-0
.008
0.02
20.
028
-0.0
270.
004
(0.0
78)
(0.0
48)
(0.0
35)*
**(0
.042
)**
(0.0
49)
(0.0
40)
(0.0
43)
(0.0
37)
(0.0
21)
(0.0
55)
Obs
erva
tion
s3,
807
3,81
13,
803
3,77
83,
778
3,81
33,
813
3,80
33,
816
3,77
0M
ean
ofou
tcom
e0.
416
0.72
90.
917
0.19
00.
501
0.34
20.
685
0.22
60.
061
0.27
9
Notes:
Outc
om
evari
ab
les
are
defi
ned
as
follow
s:em
plo
yed
(em
plo
yed
or
self
-em
plo
yed
),m
arr
ied
(marr
ied
an
dlivin
gw
ith
spou
se),
child
ren
(has
childre
n),
incl
ub
s(g
on
eto
asp
ort
,so
cial
or
oth
ercl
ub
inth
ela
stm
onth
),so
cially
act
ive
(don
eat
least
on
eso
cial
act
ivit
yla
stm
onth
),vig
oro
usl
yact
ive
(en
gages
insp
ort
sor
vig
oro
us
act
ivit
ies
more
than
on
cea
wee
k),
mod
erate
lyact
ive
(en
gages
inm
od
erate
act
ivit
ies
more
than
once
aw
eek),
smokin
g(i
scu
rren
tly
smokin
g),
dia
bet
es(w
as
dia
gnose
dw
ith
dia
bet
es),
dep
ress
ed(s
core
s>
3on
EU
RO
-Dsc
ale
).E
ach
coeffi
cien
tre
pre
sents
ase
para
telinea
r2S
LS
regre
ssio
n.
Countr
y-,
coh
ort
-fixed
effec
ts,
countr
y-s
pec
ific
linea
rtr
end
sin
coh
ort
s,in
dic
ato
rsfo
rin
terv
iew
yea
ran
dfo
reig
nb
orn
incl
ud
edin
all
regre
ssio
ns.
Het
erosc
edast
icit
yan
dcl
ust
er-r
ob
ust
stan
dard
erro
rsin
pare
nth
eses
(clu
ster
sare
countr
y-c
oh
ort
s).
***,
**
an
d*
ind
icate
stati
stic
al
signifi
can
ceat
the
1-p
erce
nt,
5-p
erce
nt
and
10-p
erce
nt
level
.
23

As above, individual years of education are instrumented with mandatory years of
schooling. For males, we find that education increases the chance of being married
and decreases the risk for diabetes and depression. Among females, statistically sig-
nificant effects are obtained for having children; education increases the probability
of having children.12 Moreover, education causes also a higher participation in clubs
for females, the effect is only statistically significant in the narrower sample.
While this evidence is only suggestive, it shows that some factors which are known
from the epidemiological literature to cause or to be correlated with cognitive func-
tioning for seniors are themselves caused by increases in schooling.
6 Conclusions
Improving cognitive functioning among seniors is important for the aging societies
in Europe, but also for other parts of the world. For instance, China is expected to
have an older age structure of the population than Europe within the next three or
four decades (United Nations, 2011). Senior Europeans (from Central and Northern
parts) have - in a global perspective - a relatively high cognitive functioning level.
Our evidence suggests that the relatively high schooling levels in these regions are
an important reason for this.
In this study, we provide evidence of a causal link between schooling and old-age
cognitive outcomes. Studying the effects of exogenous variation in individual years of
schooling induced by compulsory schooling reforms in 6 European countries, we find
strong evidence for a positive effect of education on memory performance, in partic-
ular delayed memory. One year of education increases the memory score by around
16% of the standard deviation. Similar effects for a smaller set of cognitive outcomes
are obtained for individuals with low education in the United States (Glymour et al.,
2008) and England (Banks and Mazzonna, 2012). We do not find consistent effects
12This surprising result might be related to the results obtained for marriage and is also obtainedin Fort et al. (2011), who investigate compulsory schooling and fertility in more detail.
24

on verbal fluency, numeracy and orientation to date. Moreover, our study indicates
that longer schooling can lead to a significant decline in the prevalence of dementia
among women. This is important as a growing incidence level of dementia is one of
the most fundamental challenges faced by ageing economies (ADI, 2010).
We investigate potential channels through which education might influence cogni-
tion by studying the effects of education on outcomes that are suspected to influence
cognitive decline. While we do not find any causal effects of education on labor force
participation, social and physical activities and smoking at older ages, we obtain
positive significant estimates for having children among females and being married
among male seniors. Furthermore, for male seniors we find negative effects of edu-
cation on diabetes and depression. However, this evidence is suggestive only and we
leave a more detailed analysis on the question how education influences cognitive
decline for further research.
In sum, our study suggests that lengthening obligatory schooling can lead to
long term improvements in cognitive ability and mental health. This matters as
cognitive functioning is a precondition for the ability to work, to stay independent
and healthy and to enjoy a good quality of life. Extensions of schooling can represent
one important policy venue for improving economic and social prospects in a period
of population ageing.
25

References
ADI (2010), World Alzheimer Report 2010. The global economic impact of Dementia,
Alzheimer’s Disease International.
Agency for Healthcare Research and Quality (2010), Preventing Alzheimer’s disease
and cognitive decline, AHRQ Pulication No. 10-E005.
Angrist, Joshua D., Guido W. Imbens and Donald B. Rubin (1996), ‘Identification
of causal effects using instrumental variables’, Journal of the American Statistical
Association 91, 444–455.
Anstey, J. Kaarin, Chwee von Sanden, Agus Salim and Richard O’Kearney (2007),
‘Smoking as a risk factor for dementia and cognitive decline: A meta-analysis of
prospective studies’, American Journal of Epidemiology 166(4), 367–378.
Anstey, J. Kaarin, Darren M. Lipnicki and Lee-Fay Low (2008), ‘Cholesterol as a
risk factor for dementia and cognitive decline: A systematic review of prospective
studies with meta-analysis’, American Journal of Geriatric Psychiatry 16(5), 343–
354.
Banks, James and Fabrizio Mazzonna (2012), ‘The effect of education on old age
cognitive abilities: Evidence from a Regression Discontinuity design’, Economic
Journal 122, 418–448.
Black, Sandra E., Paul J. Devereux and Kjell G. Salvanes (2008), ‘Staying in the
classroom and out of the maternity ward? The effect of compulsory schooling
laws on teenage births’, Economic Journal 118(July), 1025–1054.
Brinch, C. and T. Galloway (2012), ‘Schooling in adolescence raises IQ scores’,
Proceedings of the National Academy of Science 109(2), 425–430.
26

Brookmeyer, Ron, Elizabeth Johnson, Kathryn Ziegler-Graham and H. Michael Ar-
righi (2007), ‘Forecasting the global burden of alzheimer’s disease’, Alzheimer’s &
Dementia: The Journal of the Alzheimer’s Association 3(3), 186–191.
Brunello, Giorgio, Daniele Fabbri and Margherita Fort (2012, forthcoming), ‘The
causal effect of education on the body mass: Evidence from Europe’, Journal of
Labor Economics .
Brunello, Giorgio, Margherita Fort and Guglielmo Weber (2009), ‘Changes in com-
pulsory schooling, education and the distribution of wages in Europe’, Economic
Journal 119(March), 516–539.
Brunello, Giorgio, Margherita Fort, Nicole Schneeweis and Rudolf Winter-Ebmer
(2011), ‘The causal effect of education on health: What’s the role of health be-
haviors?’. Instistute for the Study of Labor (IZA, Bonn) Discussion Paper No.
5944.
Cagney, K. and D. Lauderdale (2002), ‘Education, wealth and cognitive function in
later life’, Journal of Gerontology: Psychological Sciences 57B, 163–172.
Cascio, E.U. and E.G. Lewis (2006), ‘Schooling and the armed forces qualifying test.
Evidence from school-entry laws’, Journal of Humam Resources 41, 294–318.
Deary, I., M. Whiteman, J. Starr, L. Whalley and H. Fox (2004), ‘The impact of
childhood intelligence on later life: Following up the Scottish mental surveys of
1932 and 1947’, Journal of Personality and Social Psychology 86(1), 130–147.
Engelhardt, H., I. Buber, V. Skirbekk and A. Prskawetz (2010), ‘Social involve-
ment, behavioural risks and cognitive functioning among older people’, Ageing
and Society 30, 779–809.
Falch, T. and S. Massih (2011), ‘The effect of education on cognitive ability’, Eco-
nomic Inquiry 49, 838–856.
27

Fort, Margherita, Nicole Schneeweis and Rudolf Winter-Ebmer (2011), ‘More school-
ing, more children: Compulsory schooling reforms and fertility in Europe’. Instis-
tute for the Study of Labor (IZA, Bonn) Discussion Paper No. 6015.
Garrouste, Christelle (2010), 100 years of educational reforms in Europe: A contex-
tual database, European Commission Joint Research Center, Luxembourg: Pub-
lications Office of the European Union.
Glymour, M. M., I. Kawachi, C. S. Jencks and L. F. Berkman (2008), ‘Does child-
hood schooling affect old age memory or mental status? Using state schooling
laws as natural experiments’, Journal of Epidemiology and Community Health
62, 532–537.
Hakansson, Krister, Suvio Rovio, Eeva-Liisa Helkala, Anna-Riitta vilska, Bengt Win-
blad, Hilkka Soininen, Aulikki Nissinen, Abdul H. Mohammed and Miia Kivipelto
(2009), ‘Association between mid-life marital status and cognitive function in later
life: Population based cohort study’, British Medical Journal 339, 1–8.
Haworth, C., P. Daleb and R. Plomin (2008), ‘A twin study into the genetic and
environmental influences on academic performance in science in nine year old boys
and girls’, International Journal of Science Education 30(8), 1003–1025.
Husen, T. and A. Tuijnman (1991), ‘The contribution of formal schooling to the
increase in intellectual capital’, Educational Researcher 20(7), 17–25.
Katzman, R. (1993), ‘Education and the prevalence of dementia and alzheimer’s
disease’, Neurology 43, 13–20.
Lindenberger, U. and P. Ghisletta (2009), ‘Cognitive and sensory declines in old age:
Gauging the evidence for a common cause’, Psychology and Aging 24(1), 1–16.
28

Martensson, Johan, Johan Eriksson, Nils Christian Bodammer, Magnus Lindgren,
Mikael Johansson, Lars Nyberg and Martin L ovden (2012), ‘Growth of language-
related brain areas after foreign language learning’, NeuroImage 63(1), 240–244.
Maurer, J. (2011), ‘Education and male-female differences in later-life cognition:
International evidence from Latin America and the Caribbean’, Demography
48, 915–930.
Mura, T., J.-F. Dartigues and C. Berr (2010), ‘How many dementia cases in France
and Europe? Alternative projections and scenarios 2010-2050’, European Journal
of Neurology 17(2), 252–259.
Neisser, U., B. Boodoo, T. Bouchard, A. Boykin, B. Brody, S. Ceci, D. Halpern, J.
Loehlin, R. Perloft and S. Sternberg (1997), ‘Intelligence: Knowns & unknowns’,
Annual Progress in Child Psychiatry & Child Development pp. 95–134.
Ninomiya, Toshiharu, Tomoyuki Ohara, Yoichiro Hirakawa, Daigo Yoshida, Yasu-
fumi Doi, Jun Hata, Shigenobu Kanba, Toru Iwaki and Yutaka Kiyohara (2011),
‘Midlife and late-life blood pressure and dementia in Japanese elderly: The
Hisayama study’, Hypertension 58, 22–28.
Nisbett, R. (2009), Intelligence and How to Get It: Why Schools and Cultures Count,
WW Norton, New York.
Nisbett, R., J. Aronson, C. Blair, W. Dickens, J. Flynn, D. Halpern and E.
Turkheimer (2012), ‘Intelligence: New findings and theoretical developments’,
American Psychologist 67(2), 130–159.
OECD (2006), Live longer, work longer. Ageing and Employment Policies, Organi-
sation for Economic Cooperation and Development, Paris.
29

Ravaglia, G., P. Forti, A. Lucicesare, N. Pisacane, E. Rietti, M. Bianchin and E.
Dalmonte (2008), ‘Physical activity and dementia risk in the elderly: Findings
from a prospective Italian study’, Neurology 70(19), 1786–1794.
Richards, Marcus and Stephanie L. Hatch (2011), ‘A life course approach to the
development of mental skills’, The Journals of Gerontology Series B: Psychological
Sciences and Social Sciences 66B(suppl 1), i26–i35.
Salthouse, Timothy (2010), Major Issues in Cognitive Aging, Oxford Psychology
Series.
Sanderson, Warren C. and Sergei Scherbov (2005), ‘Average remaining lifetimes can
increase as human populations age’, Nature 435(7043), 811–813.
Schmidt, F. and J. Hunter (2004), ‘General mental ability in the world of work:
Occupational attainment and job performance’, Journal of Personality and Social
Psychology 86(1), 162–173.
Schooler, C., M. Mulatu and G. Oates (1999), ‘The continuing effects of substan-
tively complex work in the intellectual functioning of older workers’, Psychology
and Aging 14(3), 483–506.
Skirbekk, Vegard, Elke Loichinger and Daniela Weber (2012), ‘Variation in cognitive
functioning as a refined approach to comparing aging across countries’, Proceedings
of the National Academy of Sciences 109(3), 770–774.
Thorvaldsson, Valgeir, Scott M. Hofer, Stig Berg and Boo Johansson (2006), ‘Effects
of repeated testing in a longitudinal age-homogeneous study of cognitive aging’,
The Journals of Gerontology Series B: Psychological Sciences and Social Sciences
61(6), 348–354.
United Nations (2011), World Population Prospects, United Nations Population Di-
vision.
30

Warr, P. (1994), Age and employment, Consulting Psychologist Press, Thousand
Oaks, California, pp. 485–550.
Whalley, Lawrence J and Ian J Deary (2001), ‘Longitudinal cohort study of child-
hood IQ and survival up to age 76’, British Medical Journal 322(7290), 819.
Xu, W. L., A. R. Atti, M. Gatz, N. L. Pedersen, B. Johannson and L. Fratiglioni
(2011), ‘Midlife overweight and obesity increase late-life dementia risk: A
population-based twin study’, Neurology 76(18), 1568–1574.
Yang, Yuan-Han, Catherine M. Roe and John C. Morris (2011), ‘Relationship be-
tween late-life hypertension, bood pressure, and Alzheimer’s disease’, American
Journal of Alzheimer’s Disease and Other Dementias 26(6), 457–462.
Yount, K. M. (2008), ‘Gender, resources across the life cycle, and cognitive func-
tioning in Egypt’, Demography 45, 907–926.
31
A Appendix: Educational Reforms in Europe
In this section, we briefly describe the compulsory schooling reforms we are using in this
study.
Austria In 1962 a federal act was passed that increased compulsory schooling from 8 to
9 years. The law came into effect on September 1, 1966. Pupils who were 14 years old (or
younger) at that time had to attend school for an additional year. Since compulsory edu-
cation starts at the age of 6 and the cut-off date for school-entry is September 1, (mostly)
individuals born between September and December 1951 were the first ones affected by
the reform. Thus, the pivotal cohort is 1951.
Czech Republic In the 20th century, compulsory education was reformed several times.
In 1948 compulsory schooling was increased from 8 to 9 years (age 6 to 15). It was reduced
to 8 in 1953 and increased to 9 again in 1960. Two further changes took place in 1979
and 1990. We consider the education reform in 1960 for our analysis, with the first cohort
affected by this reform being the cohort born in 1947. See Garrouste (2010) for more
information on compulsory schooling reforms in the Czech Republic.
Denmark In 1958 compulsory education was increased by 3 years, from 4 to 7. In 1971
compulsory schooling was further increased by 2 years, from 7 to 9. Education started at
age 7, thus pupils who were 11 years old (or younger) in 1958 were potentially affected by
the first reform, i.e. children born in 1947 and after. Since our data only cover individuals
50+, we only consider the first reform for this study.
France Two education reforms were implemented in France. In 1936, compulsory school-
ing was increased from 7 to 8 years (age 13 to 14) and in 1959 from 8 to 10 years (age 14
to 16). After a long transition period, the second reform came into effect in 1967. For this
analysis we only consider the second reform, with the pivotal cohort being born in 1953.
Germany In the former Federal Republic of Germany compulsory schooling was in-
creased from 8 to 9 years, gradually among the German states, starting from 1949 in
Hamburg to 1969 in Bavaria. Due to the small sample size in several German states, we
only consider 4 German states: Baden-Wuerttemberg, Hesse, Northrhine-Westphalia and
Rhineland-Palatinate. In these states the education reform was implemented in 1967. The
first cohort potentially affected by these reforms is the cohort born in 1953.
Italy In 1963 junior high school became mandatory in Italy, which increased compulsory
years of schooling by 3 years (from 5 to 8 years). The first cohort potentially affected by
this reform is the cohort born in 1949.
32