does racial and ethnic discrimination vary across …ftp.iza.org/dp4947.pdf · 2010-05-19 · does...
TRANSCRIPT

DI
SC
US
SI
ON
P
AP
ER
S
ER
IE
S
Forschungsinstitut zur Zukunft der ArbeitInstitute for the Study of Labor
Does Racial and Ethnic Discrimination Vary Across Minority Groups? Evidence from a Field Experiment
IZA DP No. 4947
May 2010
Alison BoothAndrew LeighElena Varganova
Does Racial and Ethnic Discrimination Vary Across Minority Groups?
Evidence from a Field Experiment
Alison Booth Australian National University
and IZA
Andrew Leigh Australian National University
and IZA
Elena Varganova Australian National University
Discussion Paper No. 4947 May 2010
IZA
P.O. Box 7240 53072 Bonn
Germany
Phone: +49-228-3894-0 Fax: +49-228-3894-180
E-mail: [email protected]
Any opinions expressed here are those of the author(s) and not those of IZA. Research published in this series may include views on policy, but the institute itself takes no institutional policy positions. The Institute for the Study of Labor (IZA) in Bonn is a local and virtual international research center and a place of communication between science, politics and business. IZA is an independent nonprofit organization supported by Deutsche Post Foundation. The center is associated with the University of Bonn and offers a stimulating research environment through its international network, workshops and conferences, data service, project support, research visits and doctoral program. IZA engages in (i) original and internationally competitive research in all fields of labor economics, (ii) development of policy concepts, and (iii) dissemination of research results and concepts to the interested public. IZA Discussion Papers often represent preliminary work and are circulated to encourage discussion. Citation of such a paper should account for its provisional character. A revised version may be available directly from the author.
IZA Discussion Paper No. 4947 May 2010
ABSTRACT
Does Racial and Ethnic Discrimination Vary Across Minority Groups? Evidence from a Field Experiment*
We conduct a large-scale audit discrimination study to measure labor market discrimination across different minority groups in Australia – a country where one quarter of the population was born overseas. To denote ethnicity, we use distinctively Anglo-Saxon, Indigenous, Italian, Chinese, and Middle Eastern names, and our goal is a comparison across multiple ethnic groups rather than focusing on a single minority as in most other studies. In all cases, we applied for entry-level jobs and submitted a CV showing that the candidate had attended high school in Australia. We find economically and statistically significant differences in callback rates, suggesting that ethnic minority candidates would need to apply for more jobs in order to receive the same number of interviews. These differences vary systematically across groups, with Italians (a more established migrant group) suffering less discrimination than Chinese and Middle Easterners (who have typically arrived more recently). We also explore various explanations for our empirical findings. JEL Classification: J71, C93 Keywords: discrimination, field experiments, employment Corresponding author: Andrew Leigh Research School of Economics Australian National University Canberra ACT 0200 Australia E-mail: [email protected]
* We are grateful to Boyd Hunter, Gigi Foster, Steven Haider, and seminar participants at the Australian National University’s Social and Political Theory Seminar, the Australian National University Centre for Aboriginal Economic Policy Research seminar, the Australasian Labour Econometrics Workshop, and Monash University for valuable comments. Iktimal Hage-Ali and Amy King put us in touch with Gabriella Hannah, who is quoted at the start of the paper. Pablo Mateos kindly allowed us to use a beta version of his Onomap software to impute ethnicity to the names of employers. Mathias Sinning provided invaluable programming assistance and Susanne Schmidt outstanding research assistance. The background section of this paper uses unit record data from the Household, Income and Labour Dynamics in Australia (HILDA) Survey. The HILDA Project was initiated and is funded by the Australian Government Department of Families, Housing, Community Services and Indigenous Affairs (FaHCSIA) and is managed by the Melbourne Institute of Applied Economic and Social Research (MIAESR). The findings and views reported in this paper, however, are those of the authors and should not be attributed to either FaHCSIA or the MIAESR. We take very seriously the ethical issues surrounding this research. Our experiment received approval from the Australian National University’s Human Research Ethics Committee. It involves some deception of participants – for a thoughtful discussion on the ethics of deception in such field experiments, see Riach and Rich (2004).

1
“After completing TAFE in 2005 I applied for many junior positions where no experience in sales was needed – even though I had worked for two years as a junior sales clerk. I didn’t receive any calls so I decided to legally change my name to Gabriella Hannah. I applied for the same jobs and got a call 30 minutes later."
~ Gabriella Hannah, formerly Ragda Ali, Sydney I. Introduction
How should we measure racism and discrimination? Among economists, the most common
approach has been to compare labor market outcomes across racial or ethnic groups. But this
method may not provide an accurate answer. If an individual’s race is correlated with some
unobserved productive trait, then differences in economic outcomes will reflect more than just
discrimination. Similarly, social researchers have often used surveys to measure the degree of
racism in a society. But if respondents know the socially correct response, then this approach
will also provide a biased estimate of true attitudes towards racial groups. When studying labor
market outcomes, the problem arises from unobservable characteristics of racial minorities.
When analyzing social attitudes, the problem stems from unobservable biases in the reporting
of racial attitudes.
In both cases, field experiments can help solve the unobservables problem by creating a
context in which all other factors except race are held constant. In a context where the subject
is unaware that he or she is participating in an experiment – or in which it is difficult for the
subject to provide a socially acceptable response – it is more likely that the outcome will
provide an accurate measure of racism than with more traditional approaches.
In this paper, we present the results a field experiment aimed at studying attitudes
towards racial and ethnic minorities in Australia, a country whose immigration policy has been
admired by other countries.1 Unlike many field experiments, looking only at a single minority
group, we take a broader focus: comparing attitudes to Anglo-Saxon Australians with attitudes
to Indigenous Australians (the original inhabitants of the continent), Italian Australians (a
relatively established migrant group), Chinese Australians (a more recent migrant group), and
Middle Eastern Australians (another recent migrant group). By comparing across these groups,
we hope to shed light on how the process of immigrant assimilation might change over time.
With one in four residents born overseas, Australia is often regarded as something of a
poster child for its ability to absorb new migrants into its social and economic fabric.2 Skilled
1 For example, this points system has subsequently been taken up by other countries, including New Zealand and, from 2008, the UK. 2 The 2006 Census indicates that 28% of the foreign-born in Australia are from ‘Anglo’ countries, namely the UK, New Zealand, South Africa, USA, Ireland and Canada (listed in order of numerical importance).

2
migrants are selected through a points system, which gives preference to applicants with high
qualifications and workers in high-demand occupations.3 Perhaps because of this, most
research has found little discernable impact of migrants on the labor market conditions of
Australian natives.
Yet recent events suggest that the Australian melting pot may not be so successful after
all. In the late 1990s, Pauline Hanson’s One Nation Party, with its policy of reducing Asian
immigration to Australia, polled well in a number of federal and state elections. At the time of
the 2000 Sydney Olympics, many journalists drew attention to the poor social indicators
among Indigenous Australians. And in 2005, anti-Muslim riots on Sydney’s Cronulla Beach
drew international attention. As a series of reports have shown, some minority groups in
Australia suffer extreme forms of persecution at work and in public places (see e.g. Walker
2001; Kabir and Evans 2002; Poynting and Noble 2004; VicHealth 2007; Berman et al. 2008).
Our experiment aims to estimate racial discrimination by employers. To do this, we
conduct an audit discrimination study in which we randomly submit over 4000 fictional
applications for entry-level jobs, varying only the name as an indicator of ethnicity. In terms
of number of applications submitted, ours is one of the largest audit discrimination studies ever
conducted. This allows us to look at multiple racial groups, and to see whether our effects
differ by the gender of the fictitious applicant, the type of job advertised, and the city in which
the job is located.
Relative to other work on discrimination, our paper is novel in that we compare across
multiple ethnic groups. This allows us to learn more about the assimilation process than is
possible with studies that focus on just one minority.
The rest of the paper is structured as follows. In section II, we present background
information on the share of Australians falling into the four racial/ethnic categories studied in
this paper, and review the available evidence on labor market outcomes and attitudinal
surveys. In section III, we discuss the experiment and the various discrimination hypotheses
that our research proposes to test. In section IV, we present the results of our experiment, and
compare our findings with those from other similar studies. The final section concludes.
II. Background
We briefly outline the characteristics of the ethnic groups that are the focus of this study by
reviewing the literature on their population share, employment outcomes, and levels of
3 See Hatton (2005).
3
surveyed discrimination. Figure 1 depicts the share of Australian residents in each of the four
ethnic minority groups, based upon data from the Australian census, which was conducted in
1901, 1911, 1921, 1933, 1947, 1954, and every five years from 1961 onwards. Until the 1960s,
the share of Australians reporting their race as Indigenous was about 1 percent of the
population. Since then, the share has risen steadily, and was over 2 percent in 2006. This
change has been driven by two factors: higher fertility rates, and a growing willingness of
respondents to self-identify as Indigenous.
For Italian, Chinese, and Middle Eastern Australians, our estimates are based upon
country of birth (thereby ignoring second-generation immigrants). As the graph shows,
Australia experienced a large influx of Italian migrants immediately after World War II. From
the late-1970s, the share of Australians who are Italian-born has steadily declined. By contrast,
immigration from China and the Middle East only began to expand in the 1970s and 1980s. By
2006, the share of Australians born in Italy, China, and the Middle East was about 1 percent
each.
Since our experiment will focus on ethnicity rather than country of birth, a more
appropriate comparator might be ancestry. However, the Australian census has not consistently
asked respondents about their ancestry. Therefore it is only possible to look at recent data, and
not to construct a time series of ancestry shares. We focus here on respondents’ first answer to
the ancestry question in the 2006 census (it was possible to give multiple ancestries). The
ancestries that are relevant to our analysis are Italian (4%), Chinese (3%), and Arab (1%). By
comparison, the most common ancestries are Australian (27%) and British (35%). It is not
possible to distinguish Indigenous ancestry. While the country of birth figures suggest that
Italians, Chinese, and Middle Easterners are about equally represented among first-generation
migrants, the ancestry data indicate that Italians are substantially more numerous among
second-generation (and higher generation) migrants.
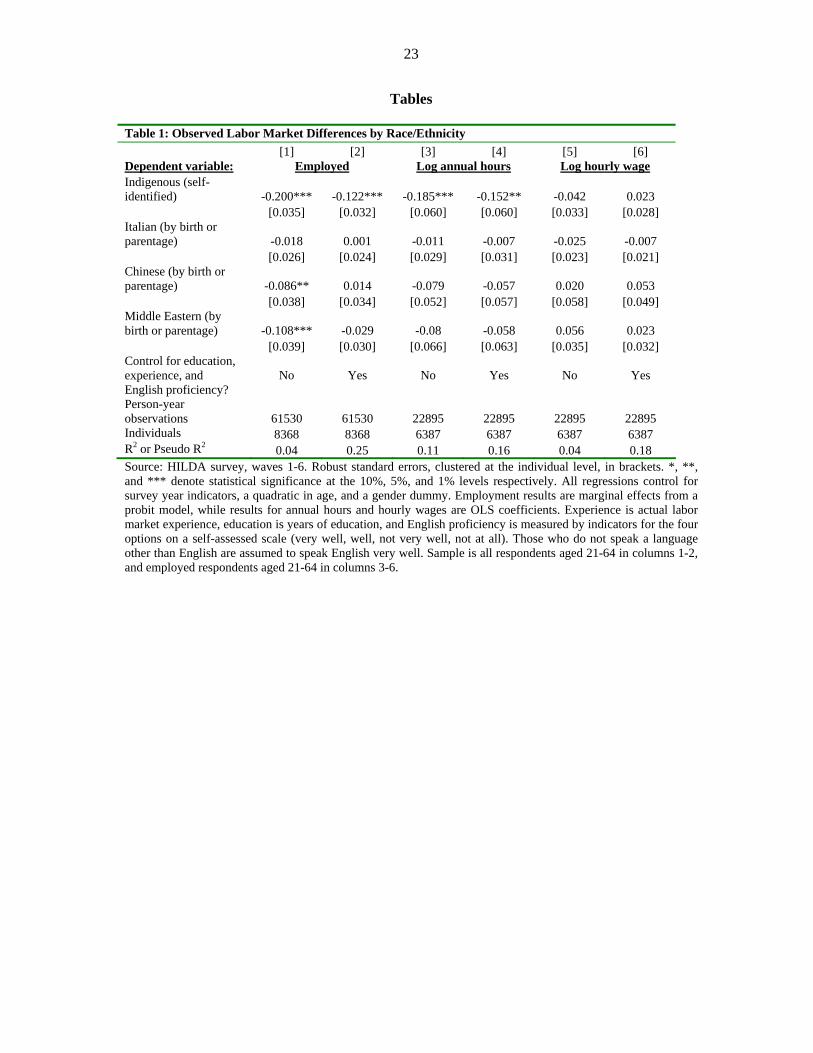
Table 1 shows how these four minority groups perform in the Australian labor market.4
We estimate three outcome measures – participation, log annual hours, and log hourly wages –
with the omitted group being Australian-born non-Indigenous respondents. For this analysis,
we require a large dataset with good information on employment participation and hourly
wages. Although the census samples are relatively large, earnings and hours are coded in
4 Naturally, we are not the first to use standard surveys to analyze migrant performance in the Australian labor market. For studies that have looked at various aspects of the labor market performance of migrants in Australia, see eg. Cobb-Clark (2003); Mahuteau and Junankar (2008).
4
bands, leading to very imprecise measures of hourly wages.5 We therefore opt to use the 2001-
06 Household, Income and Labour Dynamics in Australia survey (HILDA), pooling all six
waves and clustering standard errors at the person level. The sample is restricted to those who
are aged 21-64, with nonmissing information for all covariates.
Table 1 near here
Indigenous respondents are coded according to whether or not they self-identified as
Aboriginal or Torres Strait Islander (HILDA respondents are not asked whether their parents
are Indigenous). Respondents are coded as Italian, Chinese, or Middle Eastern if they – or
either of their parents – were born in one of those countries/regions.6 We exclude first-
generation or second-generation migrants from other regions, so that the omitted group
comprises respondents who were born in Australia and whose parents were both born in
Australia. Across this particular sample, 3 percent of respondents are Indigenous, 5 percent
are Italian, 3 percent are Chinese, and 3 percent are Middle Eastern.
In columns 1, 3, and 5, we include only a parsimonious set of controls – a survey year
indicator, a gender indicator, and a quadratic in age. In this specification, most of the
coefficients are negative, and there are four significant differences. In terms of employment,
Indigenous respondents are 20 percentage points less likely to be employed, Chinese
respondents are 9 percentage points less likely to be employed, and Middle Eastern
respondents are 11 percent less likely to be employed. Conditional on being employed,
Indigenous respondents work 19 percent fewer hours. Note that we find no significant
differences in hourly wages. If employers (or customers or co-workers) have a distaste for
associating with workers from ethnic minorities, or if there is statistical discrimination, we
would expect to see lower wages being offered for these groups. Yet this is not observed in the
HILDA data. This may reflect the fact that the Australian minimum wage is one of the highest
in the developed world (Leigh 2007). Other features of the Australian employment system
also lead to wage rigidity – for example, 17 percent of employees have their wages set by
industrial awards, while a further 39 percent have their wages set through registered collective
5 An alternative approach would have been to simply look at unemployment rates, using data on country of birth from the August 2006 Employee Earnings and Hours Survey, and data on race from the August 2006 census. The unemployment rates by country of birth in 2007 were: born in Australia 4.0%, born in Italy 3.7%, born in China 7.2%, and born in North Africa/Middle East 9.5%. The unemployment rate by race in 2006 was 5.0% for non-Indigenous people, and 15.6% for Indigenous people. 6 We include Hong Kong and Taiwan as part of China. Countries defined as Middle Eastern are Algeria, Egypt, Libya, Morocco, Sudan, Bahrain, Iran, Iraq, Israel, Kuwait, Lebanon, Oman, Syria, and Turkey. Because of the way we code ethnicity, the categories are not mutually exclusive. Dropping respondents who are in more than one minority ethnic category makes no tangible difference to the results.
5
agreements (ABS 2009).7 Given this institutional framework, the principal margin on which
employers can adjust is likely to be through hiring (Becker, 1971). We would therefore expect
to see lower employment rates for ethnic minorities. This is indeed what is observed in
columns 1, 3, and 5.
Table 2 near here
However, what happens when additional observables are added to the specification? In
columns 2, 4, and 5, we include controls for years of actual labor market experience, years of
education, and self-assessed English proficiency. In this specification, the coefficients tend to
be closer to zero, and the only significant differences are for Indigenous respondents, who are
12 percent less likely to be employed, and work on average 15 percent fewer hours. However,
the standard errors in Table 1 are sufficiently large that we cannot rule out modest levels of
labor market discrimination, even controlling for observable productivity differences.
Moreover, there are potentially important productivity differences that are unobservable,
including school quality, interpersonal skills, and work ethics. To the extent that these are
correlated with a respondent’s race or ethnicity, they could help explain (or confound)
estimates of labor market discrimination.
Can we learn more about employers’ ‘tastes for discrimination’ by examining reports
of Australians’ attitudes to these minority groups? One way to address this is to use surveys
asking Australians if immigration from particular regions should be reduced. According to one
recent survey, 12 percent of Australians thought immigration from Europe should be reduced,
23 percent thought immigration from Asia should be reduced, and 38 percent thought
immigration from the Middle East should be reduced (Issues Deliberation Australia 2007).
Surveys on attitudes to intermarriage find similar results (Dunn 2003; Forrest and Dunn 2007).
These findings certainly seem to suggest that, for whatever reason, there is prejudice in
Australia against particular ethnic groups. This could manifest itself in taste-based
discrimination by employers, workers, or customers. Next we consider whether or not there is
discrimination in hiring, as measured by the initial stage of the process – callback for an
interview.
7 Registered collective agreements are defined by the ABS as “An agreement between an employer (or group of employers) and a group of employees (or one or more unions or employee associations representing the employees). A collective agreement sets the terms of employment (pay and/or conditions) for a group of employees, and is usually registered with a Federal or State industrial tribunal or authority.”
6
III. The Audit Discrimination Experiment
The basic notion underlying audit discrimination studies is that an unbiased estimate of the
extent of hiring discrimination can be determined by conducting an experiment in which
fictional CVs, carrying ethnically or racially identifiable names, are sent to employers. By
comparing the callback rates for different ethnic groups, the researcher can estimate the degree
of racial or ethnic discrimination in a particular context.
According to a comprehensive review of the literature (Riach and Rich 2002), written
audit discrimination studies were initially conducted by British sociologists in 1969 (Jowell
and Prescott-Clarke 1970). Since then, researchers have applied the technique to Australia,
France, the Netherlands, Sweden, and the United States. (Below, we compare our findings to
those from previous studies.) Using written CVs, the audit discrimination technique has been
used to measure discrimination on the basis of gender, age, obesity, having a criminal record,
facial attractiveness, and sexual orientation. As well as studies that use written applications,
researchers have also trained pairs of actors to show up for job interviews, apply for rental
housing, and negotiate to purchase used cars (for a recent survey, see Pager 2007).
While such audit discrimination studies using fake CVs have the advantage of
providing unbiased estimates of the degree of discrimination in the hiring process, they can
only observe the first stage of the employment process. In theory, the level of discrimination in
the pre-interview stage could be negatively or positively correlated with discrimination in
hiring decisions and wage offers. As Heckman (1998, 102) notes, “A well-designed audit study
could uncover many individual firms that discriminate, while at the same time the marginal
effect of discrimination on the wages of employed workers could be zero.”8
During the six months from April 2007 to October 2007, we applied for over 5000 jobs
using an online job-finding website. Such a large sample size provides sufficient statistical
power to not only look at differences across five ethnic groups (Anglo-Saxon, Indigenous,
Chinese, Italian, and Middle Eastern), but also to see whether such effects differed by gender,
city, and job type. For example, we still have around 280 individuals per cell when looking at
differences by ethnicity and city. However, our results are fragile once we go to three-level
tabulations (e.g. ethnicity by job type by gender), so we do not show such results in our
tabulations.
8 Heckman (1998) and Heckman and Siegelman (1993) present a number of additional critiques of the methodology used in audit studies. Since these primarily deal with studies that use actors, we do not address them here, but one response may be found in Pager (2007).

7
In selecting appropriate occupations for this study, we focused on jobs that did not
require any post-school qualifications, and for which the application process was relatively
straightforward (in order to ensure that we could complete a sufficient number of applications
to have good statistical power).
Conjectures
While our primary goal is to establish the extent of discrimination and how it varies across
ethnic minorities in Australia, we also wished to test a number of related conjectures. These
are as follows.
First, we aim to test the conjecture that employers differentially discriminate in
response to perceived customer preferences. To assess this, we deliberately select occupations
for our analysis that involve face-to-face contact, and those that do not. The four occupations
we select are: waitstaff, data entry, customer service, and sales. Data entry involves no
customer contact, and therefore customer discriminatory preferences should not play a role in
the employer’s callback decision. In contrast, waitstaff jobs entail a high degree of
interpersonal contact. Hence for these jobs we would expect ethnic applicants to receive lower
callback rates if customer discriminatory preferences matter.
Examples of the types of jobs falling within these occupational categories are as
follows. Waitstaff jobs included positions at bistros, cafés, bars, restaurants, and hotels. Data
entry positions – also known as document processing officers or technical records officers –
included jobs working for an airline, a radio station, a bank, and a charity. Customer service
jobs were a mix of telephone support and face-to-face positions (it was often difficult to
distinguish these from the information available), and included staffing the front desk at a
bowling alley, answering customer support calls at a private health insurance company, and
staffing the front desk at a parking garage. Sales positions almost entirely involved in-person
sales, and included jobs at a tiling store, a supermarket, an electrical goods store, and a
pizzeria.
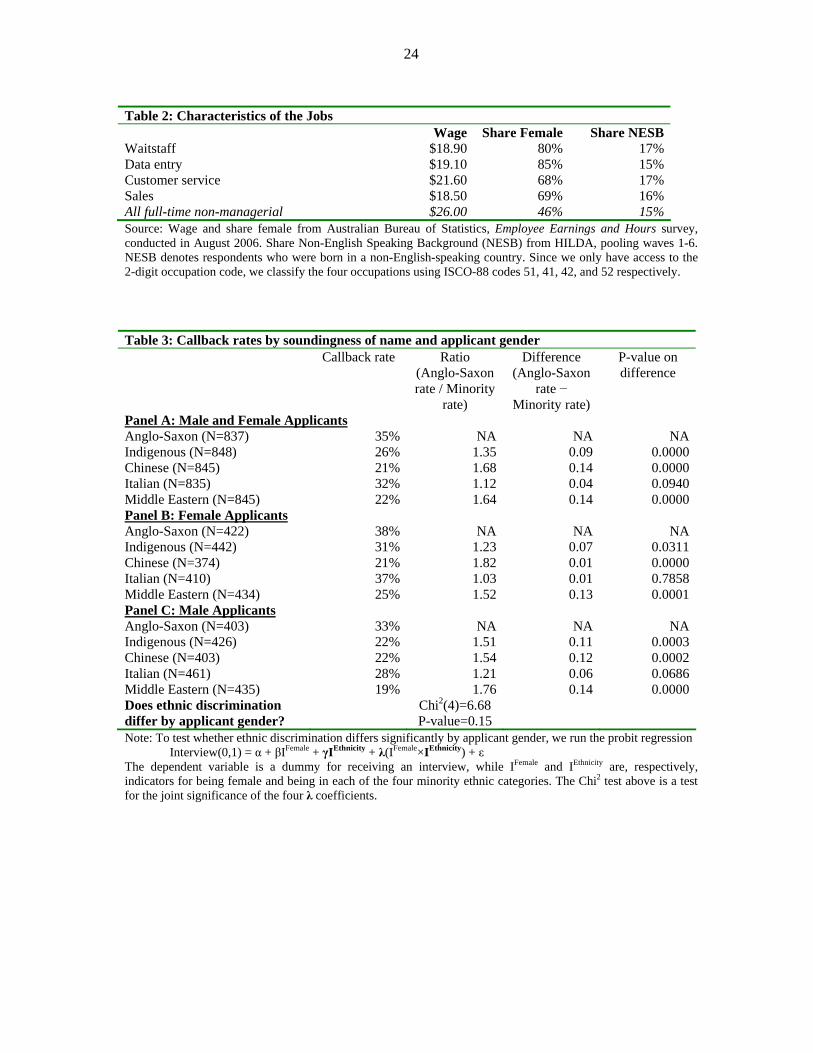
Table 2 gives average wages and share female in these occupations, based on data from
the Australian Bureau of Statistics’ Employee Earnings and Hours survey, conducted in
August 2006. The four jobs, more feminized than the non-managerial workforce as a whole,
also have a slightly above-average share of employees from non-English-speaking
backgrounds. Across the four jobs, workers are paid about three quarters of average wages.
Table 2 near here
8
The second conjecture that we wished to test was whether or not employers in
different Australian cities differentially discriminate against ethnic minority applicants. We
therefore applied for jobs in Australia’s three largest cities: Sydney, Melbourne, and Brisbane.
These cities differ in terms of their ethnic composition (with Sydney being the most ethnically
diverse of the three), their immigration history, and in the prevailing rate of unemployment at
the time of our study (with Brisbane having the tightest labor market).
Our third conjecture is whether or not racial-majority employers discriminate against
minority groups. We explore this in two ways, to be explained in greater detail towards the end
of this section. The first involves matching on the characteristics of the zipcode in which the
employer is located. The second exploits the fact that, for many jobs, we know the name of the
contact person listed on the advertisement, the person who responded to one or more of our
applicants, and sometimes both.
Our last conjecture might be that any observed differences in callback rates reflects
statistical discrimination, rather than tastes for discrimination on the part of employers,
potential co-workers or customers. In an audit study such as ours, it is difficult to separate
statistical discrimination from other possible factors. We discuss this in more detail below.
Collecting the data
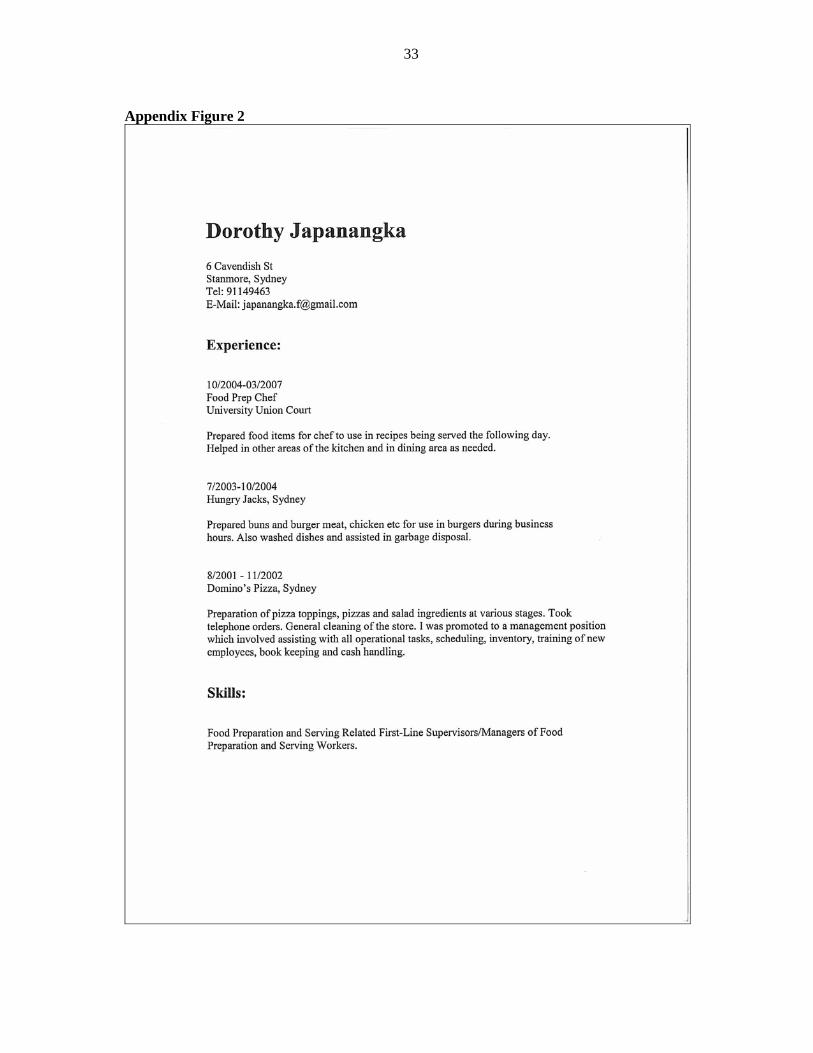
For each job category, we created four fictional CV templates that we used to apply for jobs.
These were obtained from a broad Internet search for similar CVs, and tailored to the particular
job. The CV template was augmented with the addition of an address (we selected four street-
suburb combinations in middle-income neighborhoods, and randomized the street number
between 1 and 20). Two sample CVs are depicted in Appendix Figures 1 and 2.
The ethnicity and race of the applicant was denoted by an ethnically distinguishable
name, which appeared in large print at the top of the CV. For each ethnic/racial group, we
identified five female first names, five male first names, and five last names, which were
combined randomly to create the job applicant’s name. Ideally, we would have obtained access
to a large database of Australians, containing names and self-identified race/ethnicity.
However, we were unable to locate a suitable public database, and sample surveys such as the
HILDA survey (or Indigenous databases such as those held by the Australian Institute of
Aboriginal and Torres Strait Islander Studies) turned down our requests to tabulate lists of
common names. We therefore chose our Anglo-Saxon, Italian, Chinese, and Middle Eastern
names by consulting the website www.behindthename.com, and our Indigenous names by
9
consulting the indexes of various books listing Indigenous artists.9 The full list of names used
in this study is provided in Appendix Table 1.
The job-finding website that we used had an online application process. For each
advertised position, we submitted four applications, ensuring that each of the four applications
was from a different ethnic group. Each application included a short covering letter, plus a fake
CV. For each sex-race cell, we set up a separate phone line with an answering machine (all
answering machines had a message left by a person with a regular Australian accent), plus an
email address. Employers could invite the applicant back for an interview by either sending an
email or making a telephone call.
IV. The Results
Table 3 sets out the callback rates from the experiment. In Panel A, we show results pooling
men and women. For Anglo-Saxon-sounding names, the mean callback rate was 35 percent.10
However, names connoting the four minority groups received a lower callback rate, with
Indigenous applicants obtaining an interview 26 percent of the time, Chinese 21 percent of the
time, Italian 32 percent of the time, and Middle Eastern 22 percent of the time. For Indigenous,
Chinese, and Middle Eastern applicants, the difference is highly statistically significant, but the
Anglo vs. Italian difference is only statistically significant at the 10 percent level.11
Table 3 near here
The middle column of Table 3 expresses the difference as a ratio. This is useful
because it provides an intuitive metric for the level of discrimination in terms of the number of
additional job applications that a minority applicant must submit to get the same number of
callbacks as an Anglo applicant. These ratios indicate that, in order to get as many interviews
as an Anglo applicant, an Indigenous person must submit 35 percent more applications, a
Chinese person must submit 68 percent more applications, an Italian person must submit 12
percent more applications, and a Middle Eastern person 64 percent more applications.
9 Since our CVs suggest that the job applicants are aged in their twenties, it is unlikely that employers would have thought that female applicants with non-Anglo names were actually Anglo respondents who had taken on a non-Anglo last name by marriage. 10 We also tested for differences between Catholic and Protestant names, but found no mean difference between the two groups. Because Catholic respondents were identified both by name and by having a Catholic school on their CV, we were concerned that they might not make an appropriate control group for the purpose of focusing on ethnicity and race. We therefore dropped Catholic CVs from the sample for the current analysis. 11 Although all applicants attended school in Australia, and we are able to hold constant their education and experience, it is possible that stereotypes about productivity still remain. However, as noted below, we find little evidence that second-generation immigrants have inferior English-speaking skills.

10
Panels B and C separate the analysis into female and male applicants. This
specification indicates that female Italian applicants are not discriminated against (relative to
female Anglo applicants), but otherwise the minority groups all have significantly lower
callback rates. Relative to Anglo applicants of the same sex, discrimination is generally worse
for minority men than for minority women (the exception being those with Chinese-sounding
names).12 However, when we formally test whether racial discrimination differs by gender, we
cannot reject the hypothesis that the level of discrimination is the same for men and women of
the same ethnic group. In Booth and Leigh (2008), we explore gender differences in more
detail and find that, overall, female candidates are more likely to receive a callback than male
candidates (the differences are largest for waitstaff and data entry occupations).
One way to benchmark our results is to compare the number of additional applications
that a minority candidate must submit in order to expect the same number of interviews.
Another is to think about the kind of labor market that minority applicants face.13 In effect, we
can ask the question: what would the prevailing unemployment rate have to be for an Anglo
person to face the same job-finding task as a member of a minority group?
To answer this, we exploit the fact that the unemployment rate differs across time, and
across the three cities in our experiment. Using only Anglo-Saxon respondents, we run a
simple probit regression of whether a given respondent gets an interview on the prevailing
unemployment rate in that month and city. The coefficient from this regression is -0.065
(standard error 0.033), suggesting that a 1-point increase in the unemployment rate reduces the
probability of an Anglo-Saxon applicant getting an interview by 6.5 percent. On average, the
prevailing unemployment rate during our analysis was 4.3 percent. However, when we
combine the analysis in the previous paragraph with the results in Table 3, it suggests that:
• Indigenous applicants faced the same difficulties in obtaining an interview as an Anglo
applicant when the unemployment rate was 5.6 percent;
• Chinese applicants faced the same difficulties in obtaining an interview as an Anglo
applicant when the unemployment rate was 6.4 percent;
• Italian applicants faced the same difficulties in obtaining an interview as an Anglo
applicant when the unemployment rate was 4.8 percent;
• Middle Eastern applicants faced the same difficulties in obtaining an interview as an
Anglo applicant when the unemployment rate was 6.4 percent. 12 We are inclined not to make much of the larger effect for Chinese women, since many non-Chinese would probably have difficulty distinguishing between male and female Chinese first names. 13 Another approach would be to benchmark the magnitude of our effects against the benefit of more education. However, returns to education did not differ systematically within jobs. We return to this issue below.

11
In summary, we have found clear evidence of discrimination in selection for interviews for
entry-level jobs in Australia. Of course, the audit discrimination technique only observes the
first stage of the employment process – selection for an interview – and hence we cannot
comment on the second stage of receiving a job offer. Nonetheless, our results provide clear
evidence of racial and ethnic discrimination at the callback stage. Next, we compare our
findings with earlier studies, before attempting to tease out more information about the reasons
for such discrimination and testing the conjectures outlined in the previous section.
How do our results compare with similar audit studies from other countries?
A survey by Riach and Rich (2002), supplemented with a literature review, returned 18
comparable studies (including ours), covering 34 minority ethnic groups. The results are set
out in full in Appendix Table 2, and graphed in Figure 2. The first comparison is with the
earlier Australian audit discrimination estimates from Riach and Rich (1991), based on data
collected in Melbourne between 1984 and 1988. In that study, the two minority groups were
Greeks and Vietnamese. Although our study does not analyze either of those two groups, it is
possible that discrimination involves regional stereotyping. To the extent that this is true, it is
notable that we observe little change in the level of discrimination against migrants from
Southern Europe (comparing Greeks in 1986 with Italians in 2007), but a substantial increase
in discrimination against migrants from South East Asia (comparing Vietnamese in 1986 with
Chinese in 2007).14
Figure 2 also provides an international benchmark for our results. For example, the level of
callback discrimination against Indigenous Australians in 2007 was lower than the level of
discrimination against African-Americans in the United States in 2001–2008, but higher than
the level of discrimination against Latino Americans in 2004. The level of discrimination
against Chinese Australians in 2007 is higher than the discrimination against Asians in the UK
in 1997 and against Chinese in Canada in 2008, but lower than against Asians in Ireland in
2008. The level of discrimination against Middle Eastern Australians in 2007 appears similar
to the level of discrimination against Arabic and Middle Easterners in Sweden in 2005-07. And
the level of discrimination against Italian Australians in 2007 is similar to the level of
discrimination against Australians in the UK in 1977–78.
Figure 2 near here 14 However, if we restrict the 2007 sample to Melbourne applicants only, there is no apparent discrimination against Southern Europeans applying for jobs in Australia in 2007.
12
Is there evidence of customer discrimination?
We constructed our experiment so that some of the jobs for which we applied required no
customer contact, and therefore customer discriminatory preferences should play no role in the
employer’s callback decision. In contrast, others entail a high degree of interpersonal contact.
A test for whether or not customer preferences might matter involves testing if the degree of
ethnic/racial discrimination differs across the four job types in the survey. These are waitstaff,
data entry, customer service, and sales. If customer discrimination is important, then one
should expect to see substantially more discrimination in jobs that involve the highest degree
of interpersonal contact (waitstaff) than those involving no customer contact (data entry).
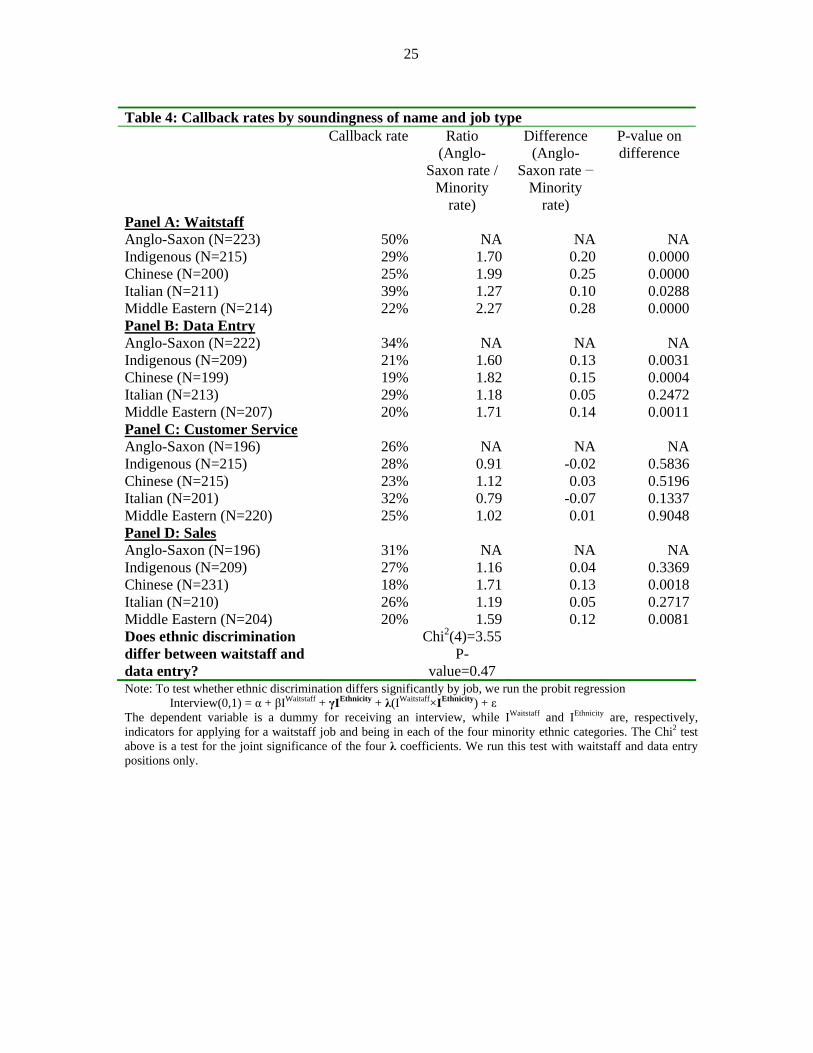
These results are presented in Table 4. Across the four jobs, we observe the greatest
amount of discrimination against minority applicants seeking waitstaff jobs. A Chinese and
Middle Eastern person seeking a job as a waiter or waitress must submit fully twice as many
applications in order to get as many interviews as an Anglo-Saxon applicant. However, there is
only slightly less discrimination in data entry jobs, and a formal test cannot reject that the
degree of discrimination is the same in both occupations. This suggests that relatively little of
the observed discrimination can be attributed solely to customer-based discrimination.
Curiously, the one job in which the level of discrimination appears to be lower is
customer service, in which there is no statistically significant discrimination against any of the
minority ethnic groups. This is also the one occupation in which those with more education
were significantly more likely to receive an interview (a pattern that did not hold in other
occupations, as we discuss below). This suggests that there could potentially be less
discrimination in higher-skill occupations than in the low-skill jobs analyzed here.
Table 4 near here
Are there differences in discrimination across cities?
Our second conjecture was that employers in the major Australian cities differentially
discriminate against ethnic-minority applicants. The three largest cities - Sydney, Melbourne,
and Brisbane - differ in terms of their ethnic composition, immigration history, and
unemployment rates at the time of our study (with Brisbane having the tightest labor market).
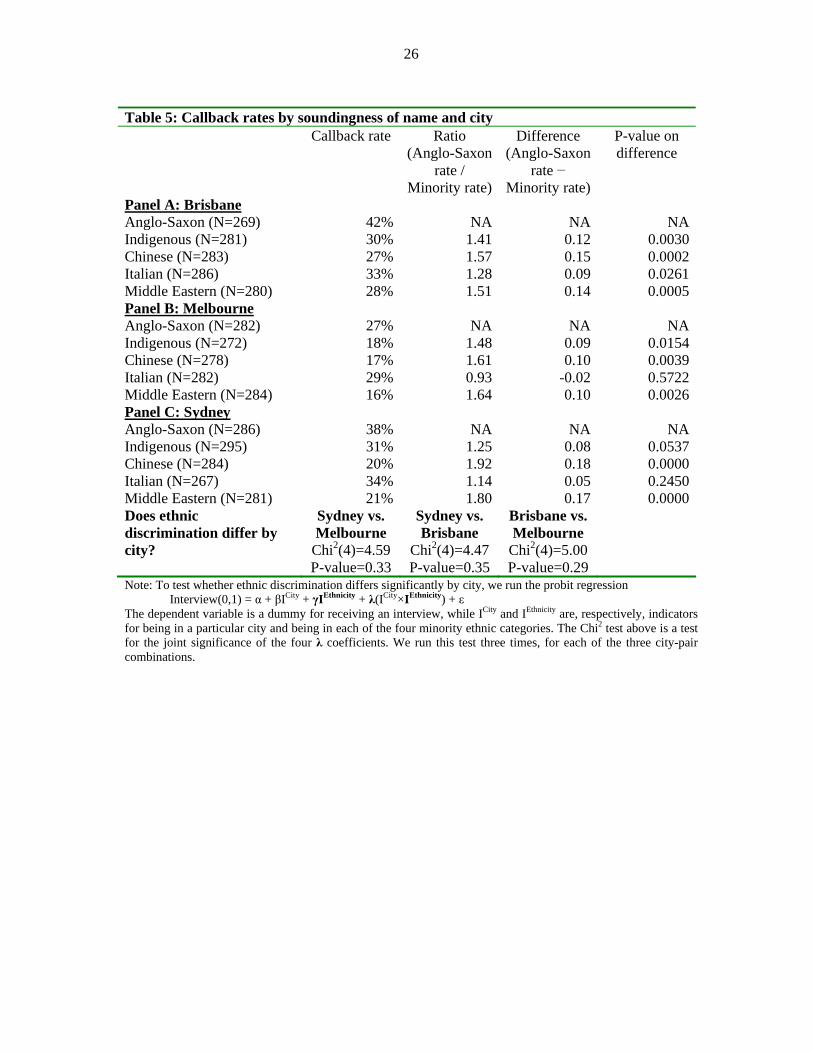
To what extent do levels of discrimination differ across the three cities in our experiment? In
Table 5, we present results tabulated separately for Brisbane, Melbourne, and Sydney. In
general, the patterns are quite similar. In each of the cities, discrimination is highest against
Chinese and Middle Eastern applicants, followed by Indigenous applicants, followed by Italian

13
applicants. However, the point estimates are suggestive of non-trivial differences. For
example, if they are to get as many interviews as an applicant with an Anglo name, Chinese
applicants must put in 57 percent more applications in Brisbane, but 92 percent more
applications in Sydney. In addition, there is a statistically significant degree of discrimination
against Italians in Brisbane, but no evidence of discrimination against Italians in Melbourne.
To the extent that such differences exist, they could be due to the tightness of the labor market,
the ethnic mix of the city, or differences in social norms. However, when we formally test the
hypothesis that discrimination is equal across the three cities, we are unable to reject it for any
of the three city-pair combinations. (Focusing on individual ethnicities, the only significant
difference is the degree of discrimination against Italians in Brisbane and Melbourne.)
Table 5 near here
Does discrimination vary with employer characteristics?
Our third conjecture was that racial-majority employers discriminate against minority groups.
To test this, we investigate if the level of discrimination varies systematically with employer
characteristics. We explore this in two ways. First, we match on the characteristics of the
zipcode in which the employer is located, using data from the 2006 census. Although this has
the advantage of precision, it suffers from the drawback that we cannot distinguish the
channels through which neighborhood characteristics affect employer behavior. For example,
employers in high-minority neighborhoods might themselves be non-Anglo, or they might
have greater exposure to other minorities.
The results of this exercise are shown in Table 6 where the sample is the 2701
applicants for which we know the zipcode of the employer and the dependent variable the
callback probability. In column 1, we interact the applicant’s ethnicity with a measure of the
share of respondents born overseas in the zipcode. The interaction coefficients are generally
positive, suggesting that discrimination is lower when there are more migrants in a
neighborhood. This interaction is significant (at the 10 percent level) for Middle Eastern
applicants. However, the magnitude of the effect is quite small – suggesting that discrimination
against Middle Eastern applicants is only wiped out when four-fifths of the zipcode is
overseas-born.
In column 2, we interact the applicant’s ethnicity with the share of people in the
employer’s zipcode that were born in that country. In column 3, we interact the applicant’s
ethnicity with the share of people in the employer’s zipcode that have that ancestry. Although
one main effect is significant (employers located in neighborhoods with more Chinese

14
residents have higher callback rates), the interaction effects are insignificant (we do not
observe any systematic relationship between applicants’ ethnicity and the share of their ethnic
group in the employer’s neighborhood).
Table 6 near here
We next exploit the fact that for many jobs, we know the name of the contact person
listed on the advertisement, the person who responded to one or more of our applicants, and
sometimes both. Software known as OnoMap (see www.onomap.org), developed by
researchers at University College London, was used to impute the ethnicity of these
individuals, providing a proxy measure of the ethnicity of the person who made the hiring
decision. OnoMap assigns ethnicity based on first names and last names, exploiting large
databases in which individuals’ true names and ethnicities are known. For more details of the
coding algorithm, see Mateos et al. (2007) and Mateos (2007).
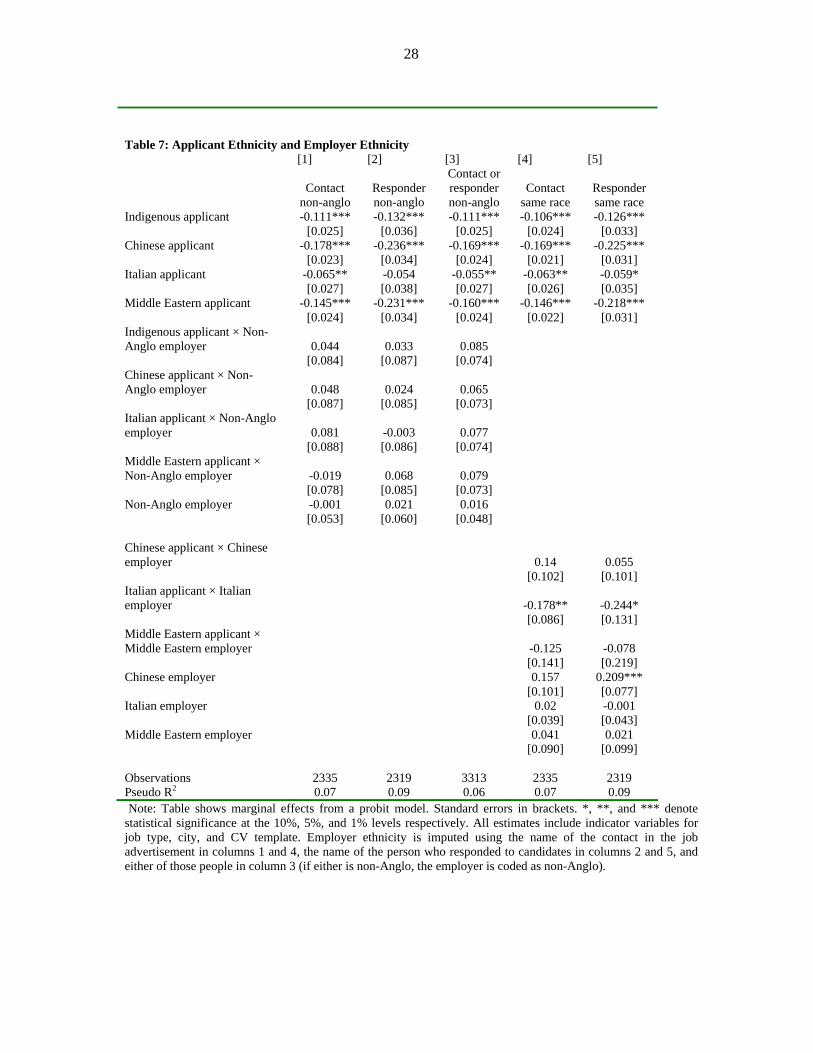
The results of this exercise are shown in Table 7, in the form of probit regressions
where the dependent variable is the callback rate. In the first three columns, we simply classify
contact people and responding people as Anglo (i.e. with names in the OnoMap Celtic or
English categories), or non-Anglo (i.e. with names in the following OnoMap groups: African,
East Asian & Pacific, European, Greek, Hispanic, International, Jewish & Armenian, Muslim,
Sikh, or South Asian). In columns 4-6, we classify employer names as being the same or
different from the applicant’s name (Italian applicants are matched to OnoMap’s European and
Greek groups, Chinese applicants are matched to OnoMap’s East Asian & Pacific and South
Asian groups, and Middle Eastern applicants are matched to OnoMap’s Muslim group).15
We observe positive main effects for Chinese employers, who appear to have a higher
callback rate. However, the only interaction effect we observe is for Italian employers, who
appear to be significantly less likely to call back job candidates with Italian names. This is a
surprising pattern, which suggests that a group with a relatively long history in Australia is
actually less inclined to assist members of the same group.
Table 7 near here
Can we say anything about statistical discrimination?
As Arrow (1998: 96) notes, without explicit measures for the individual’s marginal
productivity, it is impossible to distinguish between taste-based and statistical forms of 15 Matching more narrowly – e.g. matching Italian applicants to OnoMap’s Italian names, and Chinese applicants to OnoMap’s Chinese names – makes little difference to the results.
15
discrimination.16 While in our experiment all applicants attended school in Australia, and we
hold constant their education and experience, it is likely that stereotypes about productivity
still remain. For example, employers might view ethnic minority workers as less productive
because of poor language skills that are not manifest in the application. This might be so even
though such beliefs receive little support in, for example, the HILDA data. Among HILDA
respondents who were born in Australia, but whose parents were born overseas, 98-99 percent
report speaking English “very well” (the highest category in the survey). Since we cannot give
in our fictional CVs precise measures of the applicant’s productivity, we are unable in this
study to separately identify the extent of statistical discrimination.17
V. Discussion and Conclusion
The most common approach to estimating discrimination is through the use of surveys.
However, such an approach may potentially provide biased estimates of the true extent of
discrimination. For example, if earnings surveys do not contain good measures of productive
characteristics such as school quality, and these characteristics are systematically correlated
with both race and earnings, then their omission may bias estimates of labor market
discrimination. Similarly, in the case of attitudinal surveys, there is a risk that survey
respondents may proffer the socially acceptable answer rather than their actual belief.
To address these concerns, we conducted a large-scale audit discrimination experiment.
This involved sending fake CVs to employers, to obtain an experimental measure of the
relationship between job callbacks and the racial soundingness of the applicant’s name. We
find clear evidence of discrimination, with Chinese and Middle Easterners both having to
submit at least 50% more applications in order to receive the same number of callbacks as
Anglo candidates. Indigenous applicants also suffer a statistically significant level of
discrimination, though the effects are smaller (for example, Indigenous applicants in Australia
16 Statistical discrimination is a market-based explanation that does not require tastes (Arrow, 1998). There are a number of different models of statistical discrimination, and they typically all result in the same outcome as the taste for discrimination model. The following simple example illustrates. Suppose there are two types of individual, A and B, and that a type-A employer faces a pool of similar applicants from both groups. If the risk-averse employer is better informed about the productivity of their own group A than of group B, s/he will bid more for a type-A applicant than a type-B (lower expected variance). Thus type-B applicants would be offered a lower starting wage than otherwise identical type-A workers. However, if wages are inflexible, the employer’s only margin of adjustment is likely to be hiring. 17 Indeed, attempting to do so could be counter-productive. For example, a commercial firm that specializes in assisting migrants find work in Australia advises its clients “If the job absolutely specifically requires second language skills then include your proficiency with that language only. Otherwise do not write anything about your other language skills. Especially never write anything about your English language proficiency.” Jobseekers are also told “never include your country of birth”, and “Shorten and or anglicise names where possible and appropriate” (see www.migrantjobsservices.com.au, checked 18 June 2009).
16
appear to fare a little better than African-Americans in the US job market). We observe
virtually no discrimination against Italian applicants. To the extent that we can compare our
results with earlier evidence for Australia, our results do not suggest that ethnic and racial
discrimination fell from 1986 to 2007.
Naturally, the use of field experiments to measure discrimination has its own
limitations. For example, the way in which race and ethnicity is denoted may not necessarily
be representative of the general population. In our experiment, we use names that were chosen
on the basis that we judged them to be representative of the various ethnic groups. This allows
us to conduct an experiment in which we only vary the names, but it has the limitation that our
results will not necessarily generalize to individuals of the same ethnicity, but with an
Anglicized name. Another limitation is that our experiment provides a precise estimate on the
callback stage, but we are unable to speak to discrimination at the interview stage, nor on the
job.
Yet in spite of these caveats, our findings are important, since our study is one of the
first to compare multiple groups of immigrants in a country in which one in four Australians
are born overseas. As noted at the start of Section II, these groups range from earlier intakes of
Italians to more recent intakes of Chinese and Middle Eastern individuals, as immigration
policy in Australia has been progressively relaxed to admit immigrants from more diverse
backgrounds. In a stark reminder of how far our country has yet to go, we have found clear
evidence of discrimination against ethnic minorities – especially the more recently admitted
groups - at the initial stage of the job-finding process. But what explains this prejudice? The
higher rate of discrimination in the most customer-focused job (waitstaff) is consistent with
some degree of customer-based discrimination. However, the fact that we observe
discrimination in an occupation requiring no direct customer contact (data entry) suggests that
customer discrimination is not the whole story. Other alternatives could include taste-based
discrimination (on the part of co-workers or employers) or statistical discrimination. We have
not been able to distinguish between these two broad hypotheses, in common with the vast
majority of other studies investigating this issue with a variety of different methodologies. We
suspect it is a bit of both: statistical discrimination in the face of uncertainty and the
conservative tastes of the majority group revealed by attitudinal survey evidence.

17
References
Arrow, K.J. 1998. What Has Economics to Say about Racial Discrimination? The Journal of Economic Perspectives, Vol. 12, No. 2 (Spring, 1998), pp. 91-100. Australian Bureau of Statistics (ABS). 2009. Employee Earnings and Hours. Cat No 6306.0. ABS: Canberra Becker, G.S. 1971. The Economics of Discrimination. The University of Chicago Press Berman, G. and the Victorian Equal Opportunity & Human Rights Commission. 2008. Harnessing diversity: addressing racial and religious discrimination in employment. A collaborative project between the Victorian Multicultural Commission and the Victorian Equal Opportunity & Human Rights Commission. Melbourne: Victorian Equal Opportunity & Human Rights Commission. Bertrand, M. and Mullainathan, S. 2004. “Are Emily and Greg More Employable Than Lakisha and Jamal: A Field Experiment on Labor Market Discrimination”, American Economic Review, 94(4): 991-1013. Bertrand, M., Chugh, D. and Mullainathan, S. 2005. “Implicit Discrimination”, American Economic Review, 95(2): 94-98. Booth, A. and Leigh, A. 2008. Do Employers Discriminate by Gender? A Field Experiment in Female-Dominated Occupations. Canberra: Australian National University, mimeo. Bovenkerk, F., Kilborne, B., Raveau, F. and Smith, D. 1979. “Comparative aspects of research on discrimination against non-white citizens in Great Britain, France and the Netherlands”, in J. Berting, F. Geyer and R. Jurkovich (eds.), Problems in International Comparative Research in the Social Sciences, Oxford: Pergamon Press, pp. 105-122. Bovenkerk, F., Gras, M. and Ramsoedh, D. 1995. Discrimination against migrant workers and ethnic minoritiesin access to employment in the Netherlands. International Migration Papers 4, Geneva: ILO. Brown, C. and Gay, P. 1985. Racial Discrimination 17 Years After the Act. London: Policy Studies Institute. Bursell, M. 2007. What’s in a name? A field experiment test for the existence of ethnic discrimination in the hiring process. Working Paper 2007:7, Stockholm: The Stockholm University Linnaeus Center for Integration Studies. Carlsson, M. and Rooth, D.-O. 2007. Evidence of ethnic discrimination in the Swedish labor market using experimental data, Labour Economics, 14(4): 716-729. Cobb-Clark, D.A. 2003. “Public policy and the labor market adjustment of new immigrants to Australia”, Journal of Population Economics, 16: 655-681.

18
Dunn, K. 2003. Racism in Australia: findings of a survey on racist attitudes and experiences of racism. National Europe Centre Paper No. 77, Sydney: The University of New South Wales. Esmail, A. and Everington, S. 1993. “Racial discrimination against doctors from ethnic minorities”, British Medical Journal, 306: 691-692. Esmail, A. and Everington, S. 1997. “Asian doctors are still being discriminated against”, British Medical Journal, 314: 1619. Firth, M. 1981. “Racial discrimination in the British labour market”, Industrial and Labor Relations Review, 34: 265-272. Forrest J. and Dunn, K. 2007. Strangers in our midst? Intolerance and discrimination toward minority cultural groups in Victoria. Report to VicHealth. Goldberg, A., Mourinho, D. and Kulke, U. 1996. Labour market discrimination against foreign workers in Germany. International Migration Papers 7, Geneva: ILO. Available at http://www.ilo.org/public/english/protection/migrant/equality/discrimination/evidence.htm Hatton, T.J. 2005. “Explaining Trends in UK Immigration”, Journal of Population Economics, 18(4), 719-740. Heckman, J. 1998. “Detecting discrimination”, Journal of Economic Perspectives, 12(2): 101-116. Heckman, J. and Siegelman, P. 1993. “The Urban Institute audit studies: Their methods and findings”, in Fix, M. and Struyk, R.J. (eds.), Clear and convincing evidence: Measurement of discrimination in America. Washington, DC: Urban Institute Press, pp. 187-258. Hubbuck, J. and Carter, S. 1980. Half a Chance? A Report on Job Discrimination against Young Blacks in Nottingham. London: Commission for Racial Equality. Issues Deliberation Australia. 2007. “The Voice Of Australians: A National Random Sample Survey Of The Australian Population”, in Australia Deliberates: Muslims And Non-Muslims In Australia. IDA, pp. 88-104. Jowell, R. and Prescott-Clarke, P. 1970. “Racial discrimination and white-collar workers in Britain”, Race, 11: 397-417. Mahuteau, S. and Junankar, P.N. 2008 “Do Migrants Get Good Jobs in Australia? The Role of Ethnic Networks in Job Search”, Economic Record, 84(S1): S115 - S130 Kabir, N. and Evans, E. 2002. “Muslims and the Australian Labour Market, 1980-2001”, Immigrants and Minorities, 21(3): 70-95 Leigh, A. 2007. “Does Raising the Minimum Wage Help the Poor?”, Economic Record, 83(263): 432-445.
19
Mateos, P., Webber, R. and Longley, P. 2007. The Cultural, Ethnic and Linguistic Classification of Populations and Neighbourhoods using Personal Names. CASA Working Paper 116, London: Centre for Advanced Spatial Analysis, University College London. Mateos, P. 2007. “A review of name-based ethnicity classification methods and their potential in population studies”, Population Space and Place, 13(4): 243-263. McGinnity, F., Nelson, J., Lunn, P. and Quinn, E. 2009. “Discrimination in Recruitment Evidence from a Field Experiment”. The Equality Authority and The Economic and Social Research Institute, Dublin McIntosh, N. and Smith, D. 1974. The Extent of Racial Discrimination. Political and Economic Planning Broadsheet no. 547, London: Political and Economic Planning. Oreopoulos, P. 2009. “Why Do Skilled Immigrants Struggle in the Labor Market? A Field Experiment with Six Thousand Resumes”, NBER Working Paper No. 15036, NBER, Cambridge, MA. Pager D. 2003. “The mark of a criminal record”. American Journal of Sociology 108(5): 937–75 Pager, D. 2007. “The Use of Field Experiments for Studies of Employment Discrimination: Contributions, Critiques, and Directions for the Future”, The ANNALS of the American Academy of Political and Social Science, 609: 104-133. Pager, D., Western, B. and Bonikowski, B. 2009. “Discrimination in Low-Wage Labor Markets” American Sociological Review, forthcoming Poynting, S. and Noble, G. 2004. Living with Racism: The experience and reporting by Arab and Muslim Australians of discrimination, abuse and violence since 11 September 2001. Report to The Human Rights and Equal Opportunity Commission. Sydney: University of Western Sydney. Riach, P. and Rich, J. 1991. “Testing for racial discrimination in the labour market”, Cambridge Journal of Economics, 15: 239-256. Riach, P. and Rich, J. 2002. “Field Experiments of Discrimination in the Market Place”, Economic Journal, 112(483): F480-F518. Riach, P. and Rich, J. 2004. “Deceptive Field Experiments of Discrimination: Are they Ethical?”, Kyklos, 57(3): 457-470. Rooth, D.-O. 2007. Implicit Discrimination in Hiring: Real World Evidence. IZA DP No. 2764, Bonn: IZA. VicHealth 2007. More than tolerance: Embracing diversity for health: Discrimination affecting migrant and refugee communities in Victoria, its health consequences, community attitudes and solutions – A summary report. Melbourne: Victorian Health Promotion Foundation.

20
Walker, I. 2001. “The Changing Nature of Racism: From Old to New?” In Augoustinos, M. and Reynolds, K. (Eds). Understanding Prejudice, Racism and Social Conflict. London: Sage

21
Figures Figure 1: What Share of the Population do Our Minority Groups Comprise?
0%1%
2%3%
4%5%
6%
1900 1920 1940 1960 1980 2000
Middle Eastern-born Chinese-bornItalian-born Indigenous

22
Figure 2: Comparing Our Results with Prior Audit Studies
1 1.5 2
Majority callback /minority callback
AUS
CAN
DEU
GBR
IRE
NLD
SWE
USA
Greek 1984Vietnamese 1984
Chinese 2007Indigenous 2007
Italian 2007Middle Eastern 2007
Chinese 2008Indian 2008
Pakistani 2008
Turkish 1994
Asian 1969West Indian 1969
Asian /West Indian 1973African 1977
Asian 1977Australian 1977
French 1977Italian 1977
West Indian 1977Asian/West Indian 1984
Asian 1992Asian 1997
African 2008Asian 2008
German 2008
Surinamese 1993
Middle Eastern 2005Arabic/African 2006
African-American 2001African-American 2001African-American 2004
Latino 2004
Note: C
hart omits B
ovenkerk et al. (1979), who found a ratio of 3.47 for Antillian job applicants in France in 1976.
Two U
S estim
ates for 2001 are from different studies.
23
Tables Table 1: Observed Labor Market Differences by Race/Ethnicity [1] [2] [3] [4] [5] [6] Dependent variable: Employed Log annual hours Log hourly wage Indigenous (self-identified) -0.200*** -0.122*** -0.185*** -0.152** -0.042 0.023 [0.035] [0.032] [0.060] [0.060] [0.033] [0.028] Italian (by birth or parentage) -0.018 0.001 -0.011 -0.007 -0.025 -0.007 [0.026] [0.024] [0.029] [0.031] [0.023] [0.021] Chinese (by birth or parentage) -0.086** 0.014 -0.079 -0.057 0.020 0.053 [0.038] [0.034] [0.052] [0.057] [0.058] [0.049] Middle Eastern (by birth or parentage) -0.108*** -0.029 -0.08 -0.058 0.056 0.023 [0.039] [0.030] [0.066] [0.063] [0.035] [0.032] Control for education, experience, and English proficiency?
No Yes No Yes No Yes
Person-year observations 61530 61530 22895 22895 22895 22895 Individuals 8368 8368 6387 6387 6387 6387 R2 or Pseudo R2 0.04 0.25 0.11 0.16 0.04 0.18 Source: HILDA survey, waves 1-6. Robust standard errors, clustered at the individual level, in brackets. *, **, and *** denote statistical significance at the 10%, 5%, and 1% levels respectively. All regressions control for survey year indicators, a quadratic in age, and a gender dummy. Employment results are marginal effects from a probit model, while results for annual hours and hourly wages are OLS coefficients. Experience is actual labor market experience, education is years of education, and English proficiency is measured by indicators for the four options on a self-assessed scale (very well, well, not very well, not at all). Those who do not speak a language other than English are assumed to speak English very well. Sample is all respondents aged 21-64 in columns 1-2, and employed respondents aged 21-64 in columns 3-6.
24
Table 2: Characteristics of the Jobs Wage Share Female Share NESBWaitstaff $18.90 80% 17%Data entry $19.10 85% 15%Customer service $21.60 68% 17%Sales $18.50 69% 16%All full-time non-managerial $26.00 46% 15%Source: Wage and share female from Australian Bureau of Statistics, Employee Earnings and Hours survey, conducted in August 2006. Share Non-English Speaking Background (NESB) from HILDA, pooling waves 1-6. NESB denotes respondents who were born in a non-English-speaking country. Since we only have access to the 2-digit occupation code, we classify the four occupations using ISCO-88 codes 51, 41, 42, and 52 respectively. Table 3: Callback rates by soundingness of name and applicant gender Callback rate Ratio
(Anglo-Saxon rate / Minority
rate)
Difference (Anglo-Saxon
rate − Minority rate)
P-value on difference
Panel A: Male and Female Applicants Anglo-Saxon (N=837) 35% NA NA NAIndigenous (N=848) 26% 1.35 0.09 0.0000Chinese (N=845) 21% 1.68 0.14 0.0000Italian (N=835) 32% 1.12 0.04 0.0940Middle Eastern (N=845) 22% 1.64 0.14 0.0000Panel B: Female Applicants Anglo-Saxon (N=422) 38% NA NA NAIndigenous (N=442) 31% 1.23 0.07 0.0311Chinese (N=374) 21% 1.82 0.01 0.0000Italian (N=410) 37% 1.03 0.01 0.7858Middle Eastern (N=434) 25% 1.52 0.13 0.0001Panel C: Male Applicants Anglo-Saxon (N=403) 33% NA NA NAIndigenous (N=426) 22% 1.51 0.11 0.0003Chinese (N=403) 22% 1.54 0.12 0.0002Italian (N=461) 28% 1.21 0.06 0.0686Middle Eastern (N=435) 19% 1.76 0.14 0.0000Does ethnic discrimination differ by applicant gender?
Chi2(4)=6.68 P-value=0.15
Note: To test whether ethnic discrimination differs significantly by applicant gender, we run the probit regression Interview(0,1) = α + βIFemale + γIEthnicity + λ(IFemale×IEthnicity) + ε
The dependent variable is a dummy for receiving an interview, while IFemale and IEthnicity are, respectively, indicators for being female and being in each of the four minority ethnic categories. The Chi2 test above is a test for the joint significance of the four λ coefficients.
25
Table 4: Callback rates by soundingness of name and job type Callback rate Ratio
(Anglo-Saxon rate /
Minority rate)
Difference (Anglo-
Saxon rate − Minority
rate)
P-value on difference
Panel A: Waitstaff Anglo-Saxon (N=223) 50% NA NA NAIndigenous (N=215) 29% 1.70 0.20 0.0000Chinese (N=200) 25% 1.99 0.25 0.0000Italian (N=211) 39% 1.27 0.10 0.0288Middle Eastern (N=214) 22% 2.27 0.28 0.0000Panel B: Data Entry Anglo-Saxon (N=222) 34% NA NA NAIndigenous (N=209) 21% 1.60 0.13 0.0031Chinese (N=199) 19% 1.82 0.15 0.0004Italian (N=213) 29% 1.18 0.05 0.2472Middle Eastern (N=207) 20% 1.71 0.14 0.0011Panel C: Customer Service Anglo-Saxon (N=196) 26% NA NA NAIndigenous (N=215) 28% 0.91 -0.02 0.5836Chinese (N=215) 23% 1.12 0.03 0.5196Italian (N=201) 32% 0.79 -0.07 0.1337Middle Eastern (N=220) 25% 1.02 0.01 0.9048Panel D: Sales Anglo-Saxon (N=196) 31% NA NA NAIndigenous (N=209) 27% 1.16 0.04 0.3369Chinese (N=231) 18% 1.71 0.13 0.0018Italian (N=210) 26% 1.19 0.05 0.2717Middle Eastern (N=204) 20% 1.59 0.12 0.0081Does ethnic discrimination differ between waitstaff and data entry?
Chi2(4)=3.55 P-
value=0.47
Note: To test whether ethnic discrimination differs significantly by job, we run the probit regression Interview(0,1) = α + βIWaitstaff + γIEthnicity + λ(IWaitstaff×IEthnicity) + ε
The dependent variable is a dummy for receiving an interview, while IWaitstaff and IEthnicity are, respectively, indicators for applying for a waitstaff job and being in each of the four minority ethnic categories. The Chi2 test above is a test for the joint significance of the four λ coefficients. We run this test with waitstaff and data entry positions only.
26
Table 5: Callback rates by soundingness of name and city Callback rate Ratio
(Anglo-Saxon rate /
Minority rate)
Difference (Anglo-Saxon
rate − Minority rate)
P-value on difference
Panel A: Brisbane Anglo-Saxon (N=269) 42% NA NA NAIndigenous (N=281) 30% 1.41 0.12 0.0030Chinese (N=283) 27% 1.57 0.15 0.0002Italian (N=286) 33% 1.28 0.09 0.0261Middle Eastern (N=280) 28% 1.51 0.14 0.0005Panel B: Melbourne Anglo-Saxon (N=282) 27% NA NA NAIndigenous (N=272) 18% 1.48 0.09 0.0154Chinese (N=278) 17% 1.61 0.10 0.0039Italian (N=282) 29% 0.93 -0.02 0.5722Middle Eastern (N=284) 16% 1.64 0.10 0.0026Panel C: Sydney Anglo-Saxon (N=286) 38% NA NA NAIndigenous (N=295) 31% 1.25 0.08 0.0537Chinese (N=284) 20% 1.92 0.18 0.0000Italian (N=267) 34% 1.14 0.05 0.2450Middle Eastern (N=281) 21% 1.80 0.17 0.0000Does ethnic discrimination differ by city?
Sydney vs. Melbourne
Chi2(4)=4.59 P-value=0.33
Sydney vs. Brisbane
Chi2(4)=4.47 P-value=0.35
Brisbane vs. Melbourne
Chi2(4)=5.00 P-value=0.29
Note: To test whether ethnic discrimination differs significantly by city, we run the probit regression Interview(0,1) = α + βICity + γIEthnicity + λ(ICity×IEthnicity) + ε
The dependent variable is a dummy for receiving an interview, while ICity and IEthnicity are, respectively, indicators for being in a particular city and being in each of the four minority ethnic categories. The Chi2 test above is a test for the joint significance of the four λ coefficients. We run this test three times, for each of the three city-pair combinations.

27
Table 6: Applicant Ethnicity and Employer Neighborhood Characteristics [1] [2] [3] Overseas-born
share Born in same
country Same ancestry Indigenous applicant -0.167*** -0.090*** -0.090*** [0.046] [0.027] [0.026] Chinese applicant -0.153*** -0.127*** -0.130*** [0.048] [0.028] [0.028] Italian applicant -0.098* -0.068** -0.075** [0.052] [0.028] [0.035] Middle Eastern applicant -0.205*** -0.127*** -0.127*** [0.042] [0.024] [0.025] Indigenous addressee × Overseas born share 0.201 [0.140] Chinese addressee × Overseas born share 0.04 [0.142] Italian addressee × Overseas born share 0.137 [0.137] Middle Eastern addressee × Overseas born share 0.239* [0.140] Overseas born share 0.005 [0.100] Indigenous addressee × Indigenous share -1.578 -14.919 [1.475] [14.715] Chinese addressee × Chinese share -0.326 -0.165 [0.379] [0.270] Italian addressee × Italian share 2.283 1.079 [2.041] [1.098] Middle Eastern addressee × Middle Eastern share -1.626 -0.585 [1.717] [0.762] Indigenous share 0.328 1.11 [0.409] [0.809] Chinese share 0.650*** 0.441*** [0.189] [0.136] Italian share -1.879 -0.759 [1.203] [0.628] Middle Eastern share -0.219 -0.211 [0.532] [0.253] Observations 2701 2701 2701 Pseudo R2 0.07 0.07 0.07 Note: Table shows marginal effects from a probit model. Standard errors in brackets. *, **, and *** denote statistical significance at the 10%, 5%, and 1% levels respectively. All estimates include indicator variables for job type, city, and CV template. Share variables are the share born in a given country in column 2, and the share with a given ancestry in column 3.
28
Table 7: Applicant Ethnicity and Employer Ethnicity [1] [2] [3] [4] [5]
Contact non-anglo
Responder non-anglo
Contact or responder non-anglo
Contact same race
Responder same race
Indigenous applicant -0.111*** -0.132*** -0.111*** -0.106*** -0.126*** [0.025] [0.036] [0.025] [0.024] [0.033] Chinese applicant -0.178*** -0.236*** -0.169*** -0.169*** -0.225*** [0.023] [0.034] [0.024] [0.021] [0.031] Italian applicant -0.065** -0.054 -0.055** -0.063** -0.059* [0.027] [0.038] [0.027] [0.026] [0.035] Middle Eastern applicant -0.145*** -0.231*** -0.160*** -0.146*** -0.218*** [0.024] [0.034] [0.024] [0.022] [0.031] Indigenous applicant × Non-Anglo employer 0.044 0.033 0.085 [0.084] [0.087] [0.074] Chinese applicant × Non-Anglo employer 0.048 0.024 0.065 [0.087] [0.085] [0.073] Italian applicant × Non-Anglo employer 0.081 -0.003 0.077 [0.088] [0.086] [0.074] Middle Eastern applicant × Non-Anglo employer -0.019 0.068 0.079 [0.078] [0.085] [0.073] Non-Anglo employer -0.001 0.021 0.016 [0.053] [0.060] [0.048] Chinese applicant × Chinese employer 0.14 0.055 [0.102] [0.101] Italian applicant × Italian employer -0.178** -0.244* [0.086] [0.131] Middle Eastern applicant × Middle Eastern employer -0.125 -0.078 [0.141] [0.219] Chinese employer 0.157 0.209*** [0.101] [0.077] Italian employer 0.02 -0.001 [0.039] [0.043] Middle Eastern employer 0.041 0.021 [0.090] [0.099] Observations 2335 2319 3313 2335 2319 Pseudo R2 0.07 0.09 0.06 0.07 0.09 Note: Table shows marginal effects from a probit model. Standard errors in brackets. *, **, and *** denote statistical significance at the 10%, 5%, and 1% levels respectively. All estimates include indicator variables for job type, city, and CV template. Employer ethnicity is imputed using the name of the contact in the job advertisement in columns 1 and 4, the name of the person who responded to candidates in columns 2 and 5, and either of those people in column 3 (if either is non-Anglo, the employer is coded as non-Anglo).

29
Appendices
Appendix Table 1: Ethnically Distinctive Names Anglo first names Female: Jennifer, Lisa, Kimberly, Sarah, Amy
Male: Martin, Andrew, Phillip, Adam, Brian Anglo last names Abbott, Adams, Johnson, Mitchell, Robinson Middle Eastern first names Female: Fatima, Lala, Nadine, Anan, Hiyam
Male: Ahmed, Hassan, Bilal, Mahmoud, Rafik Middle Eastern last names Hariri, Baghdadi, Chikhani, Kassir, Gemayel Indigenous first names Female: Betty, Winnie, Daisy, Dorothy, Peggy
Male: Bobby, Jimmy, Tommy, Wally, Ronnie Indigenous last names Japanangka, Tjungarrayi, Djukukul, Tipungwuti,
Puruntatameri Chinese first names Female: Ping, Ming, Xiu, Ya, Nuying
Male: Tai, Hong, Yin, Peng, Hu Chinese last names Chen, Lin, Huang, Lee, Chang Italian first names Female: Maria, Anna, Rosa, Angela, Giovanna
Male: Giuseppe, Giovanni, Antonio, Mario, Luigi
Italian last names Rosso, Ferrari, Bianchi, Romano, Galeotti

30
Appendix Table 2: Comparison with Other Audit Discrimination Studies Study Country Year(s)
of test Minority Ratio (majority
callbacks divided by minority
callbacks) Riach and Rich (1991) Australia 1984–88 Vietnamese 1.38 Greek 1.10 Booth et al. (This study) Australia 2007 Indigenous 1.35 Chinese 1.68 Italian 1.12 Middle Eastern 1.64 Oreopoulos (2009) Canada 2008 Indian 1.31 Chinese 1.46 Pakistani 1.44 Bovenkerk et al. (1979) France 1976–77 Antillian 3.47 Goldberg et al. (1996) Germany 1994 Turkish 1.12 McGinnity et al. (2009) Ireland 2008 African 2.44 Asian 1.80 German 2.07 Bovenkerk et al. (1995) Netherlands 1993–94 Surinamese 1.22 Carlsson and Rooth (2007) Sweden 2005–06 Middle Eastern 1.50 Bursell (2007) Sweden 2006–07 Arabic/African 1.80 Jowell and Prescott-Clarke (1970) UK 1969 Asian 2.08 West Indian 1.13 McIntosh and Smith (1974) UK 1973 Asian /West Indian 1.47 Firth (1981) UK 1977–78 Asian 1.95 West Indian 1.76 Australian 1.14 French 1.25 African 1.60 Hubbuck and Carter (1980) UK 1977–79 Asian 1.80 West Indian 1.81 Italian 1.12 Brown and Gay (1985) UK 1984–85 Asian/West Indian 1.32 Esmail and Everington (1993) UK 1992 Asian 2.00 Esmail and Everington (1997) UK 1997 Asian 1.44 Bertrand and Mullainathan (2004) US 2001–02 African-American 1.50 Pager (2003) US 2001 African-American 2.43 Pager et al. (2009) US 2004 African-American 2.04 Latino 1.23 Note: All studies dated before 2000 (except Goldberg et al. 1996) are summarized in Riach and Rich (2002). Note that Jowell and Prescott-Clarke (1970) changed not only the names but also the qualifications. For Bovenkerk et al. (1995), we take the average of the estimate for Surinamese males (1.27) and females (1.17). Estimates from Pager (2003) exclude job applicants with criminal convictions. Estimates from Oreopoulos (2009) are based on respondents with Canadian qualifications and experience.

31
Appendix Figure 1

32
33
Appendix Figure 2

34