does modifying the thick texture and creamy flavour of a ... · sensory42 characteristics of foods...
TRANSCRIPT

1
Does modifying the thick texture and creamy flavour of a drink change portion 1
size selection and intake? 2
Keri McCrickerd1*
, Lucy Chambers1 and Martin R. Yeomans
1 3
1 School of Psychology, Pevensey Building, University of Sussex, Brighton, BN1 9QH, UK 4
5
* Corresponding author: 6
Keri McCrickerd 7
School of Psychology 8
University of Sussex 9
Brighton 10
BN1 9QH 11
Tel: +44-1273-872826 12
E-mail: [email protected] 13
14
2
Abstract 15
Previous research indicates that a drink's sensory characteristics can influence appetite regulation. 16
Enhancing the thick and creamy sensory characteristics of a drink generated expectations of satiety 17
and improved its actual satiating effects. Expectations about food also play an important role in 18
decisions about intake, in which case enhancing the thick and creamy characteristics of a drink might 19
also result in smaller portion size selection. In the current study forty-eight participants (24 female) 20
completed four test days where they came into the laboratory for a fixed-portion breakfast, returning 21
two hours later for a mid-morning drink, which they could serve themselves and consume as much as 22
they liked. Over the test days, participants consumed an iso-energetic drink in four sensory contexts: 23
thin and low-creamy; thin and high-creamy; thick and low-creamy; thick and high-creamy. Results 24
indicated that participants consumed less of the thick drinks, but that this was only true of the female 25
participants; male participants consumed the same amount of the four drinks regardless of sensory 26
context. The addition of creamy flavour did not affect intake but the thicker drinks were associated 27
with an increase in perceived creaminess. Despite differences in intake, hunger and fullness ratings 28
did not differ across male and female participants and were not affected by the drinks sensory 29
characteristics. The vast majority of participants consumed all of the drink they served themselves 30
indicating that differences in intake reflected portion size decisions. These findings suggest women 31
will select smaller portions of a drink when its sensory characteristics indicate that it will be 32
satiating. 33
34
35
Keywords: Beverage; sensory characteristics; satiation; viscosity; creaminess; expectations 36
37

3
Introduction 38
Energy-containing drinks are reported to have a weaker satiety value than energy-matched „foods‟, 39
such as solid and semi-solid items and liquid soups (Hulshof, Degraaf, & Weststrate, 1993; Mattes, 40
2005, 2006a; Mourao, Bressan, Campbell, & Mattes, 2007; Tournier & Louis-Sylvestre, 1991). Oro-41
sensory characteristics of foods are important for the development of satiety (Cecil, Francis, & Read, 42
1998, 1999), triggering learned salivatory and gastrointestinal cephalic phase responses which are 43
thought to aid the digestion of nutrients and enhance the experience of satiety (Mattes, 1997, 2006b; 44
Woods, 1991). Evidence that energy consumed in liquid form elicits a weak cephalic phase response 45
(Teff, 2010; Teff, Devine, & Engelman, 1995) suggests that the strength of associations formed 46
between a drink‟s sensory characteristics and its post-ingestive effect is weak; possibly because they 47
are consumed fast, and this reduced oral exposure time may limit the strength of its oro-sensory 48
signal and subsequent learning (Mars, Hogenkamp, Gosses, Stafleu, & De Graaf, 2009). As a result, 49
energy consumed as a drink may not be expected to be satiating, and the potential for these 50
expectations to influence decisions about consumption is the focus of the present study. 51
52
Resent research from our laboratory supports the idea that the sensory characteristics of a drink can 53
limit its satiety value: drinks varying in thick texture and creamy flavour were expected to have 54
different satiating effects (McCrickerd, Chambers, Brunstrom, & Yeomans, 2012). The thicker 55
drinks were expected to be more filling (expected satiation) and to suppress hunger to a greater 56
extent (expected satiety) than thin versions, regardless of their actual energy content. The addition of 57
creamy flavours did not affect expected satiety but did enhance the expectation that the drinks would 58
be filling, presumably because perceived creaminess has both textural (thickness and smoothness) 59
and flavour (dairy, vanilla and sweetness) attributes (de Wijk, Terpstra, Janssen, & Prinz, 2006; 60
Kirkmeyer & Tepper, 2005) typically associated with nutrients. Indeed, energy compensation 61
following a drink preload was improved by modifying its creamy texture and flavour to better signify 62

4
the presence of the nutrients (Bertenshaw, Lluch, & Yeomans, 2013; Yeomans & Chambers, 2011). 63
This fits with the Satiety Cascade Model (Blundell, Rogers, & Hill, 1987), which proposes that early 64
cognitive and sensory information is integrated with later post-ingestive and post-absorptive signals 65
to suppress appetite after an eating episode. However, the Satiety Cascade also predicts that sensory 66
characteristics and beliefs about the satiety value of food strongly influence satiation (the process of 67
ending a meal or eating episode) and therefore the amount people eat (Blundell et al., 2010; Blundell, 68
et al., 1987; Brunstrom, 2011). So if a person expects a drink to be filling because it is thick and 69
creamy, as our previous research suggests, they may select a smaller portion size and/or consume 70
less of that drink. 71
72
So far research has demonstrated that increasing the viscosity of a liquid did result in decreased ad 73
libitum consumption, but whether this reduction is based on a the belief that a thicker product would 74
be more filling is less clear. Hogenkcamp, Mars, Stafleu and de Graaf (2012) provided participants 75
with 1000g portions of a custard product as either a lemon-flavoured liquid or a meringue-flavoured 76
and “caramel” coloured semi-solid, both to be consumed from a large bowl with a spoon. 77
Participants expected the thicker custard to be most filling and consumed approximately 30% less of 78
that custard compared to the thin version. However, because the colour and flavour were not 79
matched across the thick and thin versions, the extent to which differences in intake can be attributed 80
to viscosity alone is limited. In a drink context, Zijlstra, Mars, de Wijk, Westerterp-Plantenga and de 81
Graaf (2008) found similar reductions in intake of an iso-energetic semi-solid chocolate milk 82
compared to a less viscous liquid version, which were presented in 1.5 litre opaque cartons and 83
frequently replaced so the serving could not be finished. The researchers suggest this was due to a 84
difference in eating rate between the products because when eating rate was standardised participants 85
consumed a similar amount of the thick and thin versions. Indeed, ad libitum consumption from a 86
„bottomless‟ portion is a good measure of satiation, but is likely to emphasis factors such as eating 87

5
rate, stomach distension and appetitive sensations, whilst limiting the opportunity for participants to 88
plan, see and adjust the amount of food they consume based on visual and olfactory cues and pre-89
existing expectations about its satiating effects. Instead, expectations held about the satiating value 90
of foods are an important determinant of self-selected portion size (Wilkinson et al., 2012) and 91
portion size decisions are a regular feature of everyday eating behaviour, alongside consuming all of 92
the food selected (Fay et al., 2011). 93
94
The present study aimed to extend the previous findings that thick texture and creamy flavours can 95
modify expectations and enhance satiety, by determining whether such sensory manipulations also 96
influence actual self-selected intake of a drink and assessing the relative contribution of satiety-97
relevant texture and flavour cues. Participants were able to select the amount of a drink to consume 98
across four different sensory contexts identical to those used in our previous research (McCrickerd, 99
et al., 2012): thin and low-creamy flavour; thin and high-creamy flavour; thick and low-creamy 100
flavour; thick and high-creamy flavour. It was predicted that participants would consume less of the 101
thicker drinks than the thinner ones, as thick texture generates strong expectations of satiety, and that 102
the addition of a creamy flavours would have more subtle effects on intake. A secondary prediction 103
was that the self-served drink would be consumed in its entirety. 104
105

6
Method and Materials 106
Participants 107
Forty-eight participants (24 female) completed the study “investigating the effect of breakfast on 108
mood and alertness”. Participants were recruited from a volunteer database of staff and students at 109
the University of Sussex. Participants were selected to be non-smokers, not currently dieting or 110
diagnosed with an eating disorder, without allergies or aversions to any of the test food ingredients 111
and not taking prescription medication. On average, participants were 20.8 years (range = 18-52 112
years, SD = 5.3), with a BMI of 22.5 kg/m2
(range = 18-30 kg/m2, SD = 2.8) and mean dietary 113
restraint score of 7.1 for males (range = 1-16, SD = 4.4) and 6.7 for females (range = 1-15, SD = 3.8), 114
measured using the Three Factor Eating Questionnaire (TFEQ: Stunkard & Messick, 1985). Male 115
and female participants did not differ in age, restraint and BMI. The research was approved by the 116
University of Sussex Life Science Research Ethics Board. 117
118
Design 119
A three-factor mixed design was used to assess the effect of drink texture (thin vs. thick) and the 120
addition of creamy flavours (low-creamy vs. high-creamy) on the self-selected consumption of a fruit 121
drink, controlling for participant gender. Based on our previous finding that texture (effect size r = 122
0.90) and flavour (effect size r = 0.74) of a drink (repeated measures) influenced how filling it was 123
expected to be (McCrickerd, et al., 2012) a sample size calculation was conducted, which indicated 124
that for the smallest effect size of interest (creamy flavour) a total of 8 participants would be needed. 125
However, it was assumed that the effect of these expectations on self-selected intake would be 126
smaller, therefore based on a medium effect size (r = 0.30) a second calculation suggested a sample 127
of 44 participants (22 males and females), which was taken to 48 to counterbalance drink order 128
across males and females. 129
130

7
Standard breakfast 131
On each test day all participants consumed a breakfast of cereal (“Crunchy Nut Cornflakes”, 132
Kelloggs, UK: males 80g, females 60g), semi-skimmed milk (Sainsbury‟s, UK: males 200g, females 133
160g) and orange juice (Sainsbury‟s, UK: males 200g, females 200g). The breakfast provided the 134
males with 540 kcal (2259 KJ) and the females with 440 kcal (1841 KJ), approximately 22% of an 135
adults daily average recommended energy intake. 136
137
Test drinks 138
The test drinks were based on the low energy versions of a fruit drink described in a previous study 139
from our laboratory (McCrickerd, et al., 2012), formulated and prepared in the Ingestive Behaviour 140
Unit at the University of Sussex. One hundred grams of the fruit drink base contained 23 kcal (96 141
KJ) and consisted of 31g of fresh mango, peach and papaya fruit juice (Tropicana Products, Inc.), 142
17g 0.1% fat fromage frais (Sainsbury‟s UK), 41g of water and 11g of peach flavoured diluting drink 143
(Robinsons from Britvic, UK). The drinks were prepared in four sensory contexts varying in thick 144
texture (thin vs. thick) and creamy flavours (low-creamy vs. high-creamy): thin/low-creamy; 145
thin/high-creamy; thick/low-creamy; thick/high-creamy. Small quantities of tara gum (Kaly‟s 146
Gastronomie, FR) were used to increase the viscosity of the drinks. The thin drinks contained 147
0.09g/100g of tara gum and the thick drinks 0.38g/100g. The amount of tara gum used in the drinks 148
was based on our previous work which established that across a range of concentrations, tara gum 149
added in these quantities produced subtle but highly perceptible differences in the viscosity without 150
effecting the taste, pleasantness and or look of the drinks (McCrickerd, et al., 2012). Creamy flavour 151
was enhanced by the addition of vanilla extract (Nielsen-Massey, NL: 0.33g/100g) and milk-caramel 152
favouring (Synrise, DE: 0.16g/100g) to the high-creamy but not to the low-creamy drinks. The two 153
physical properties attributed to creaminess were measured for the four test drinks: viscosity, which 154
relates to perceived thickness, and lubrication, which relates to smoothness. Lubrication properties 155
8
were measured at room temperature (22 °C ± 1°C) on an MTM2 tribometer (PCS Ltd. London) using 156
a stainless steel ball and elastomer disk (see: Mills, Norton, & Bakalis, 2013) at speeds between 1 157
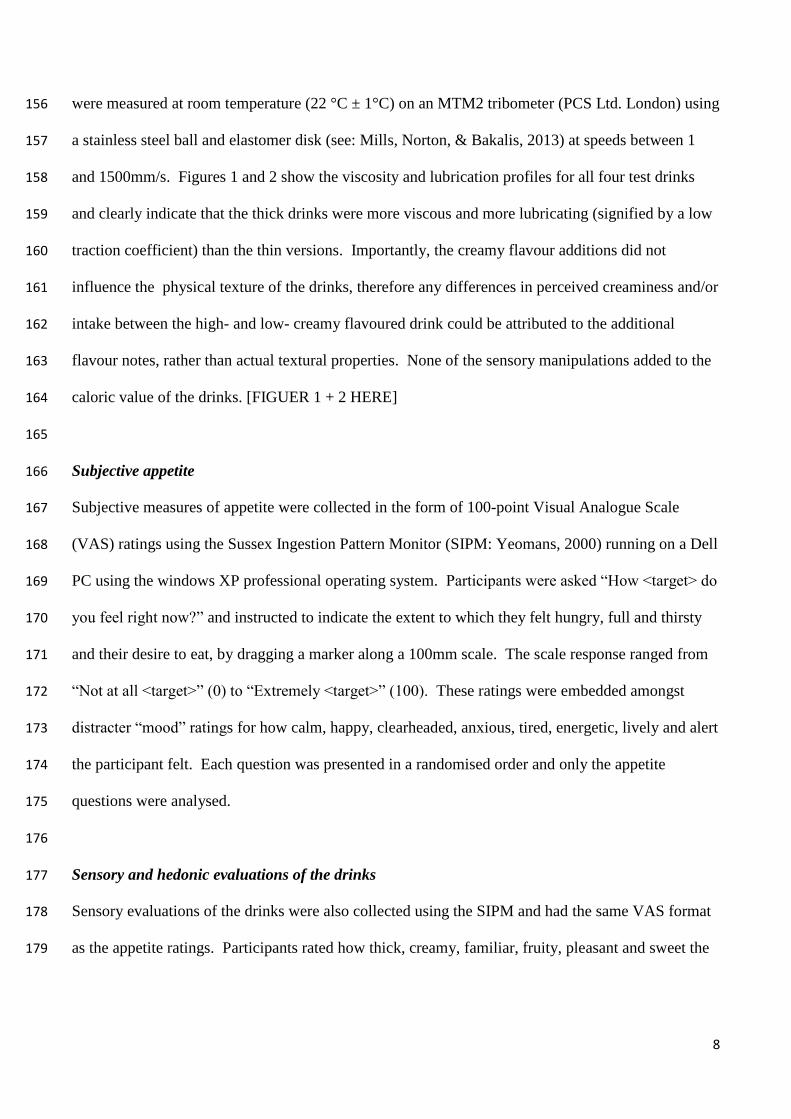
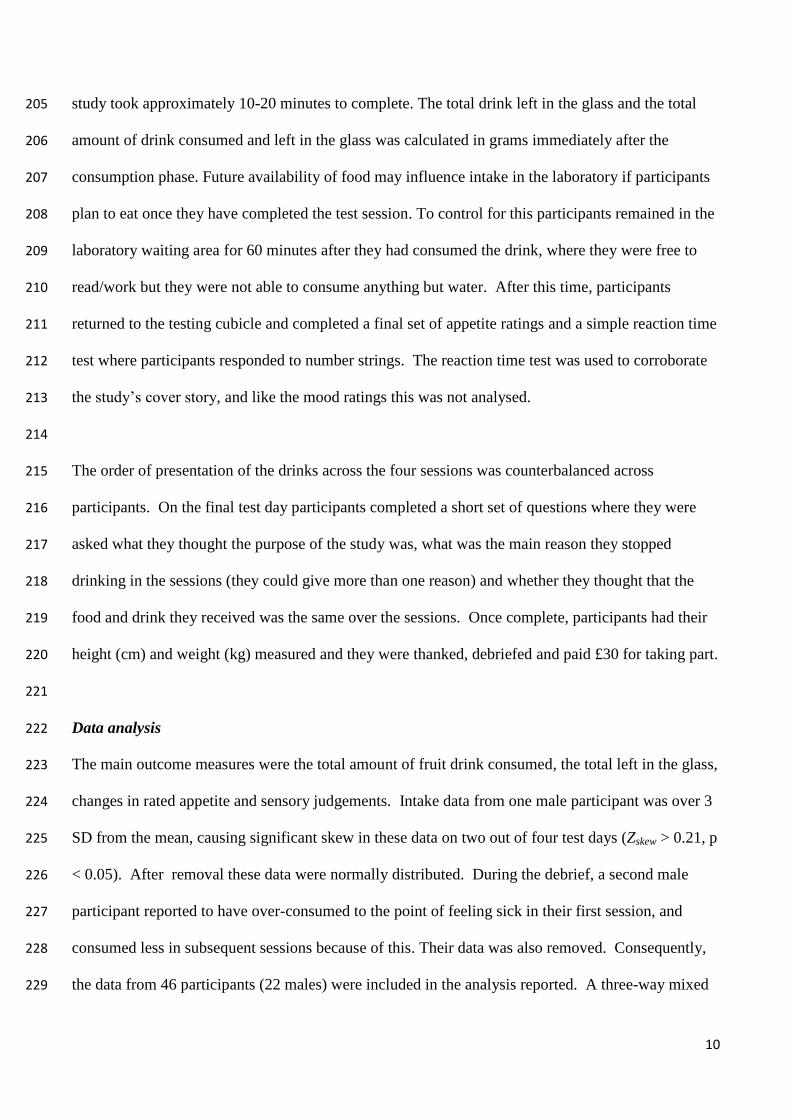
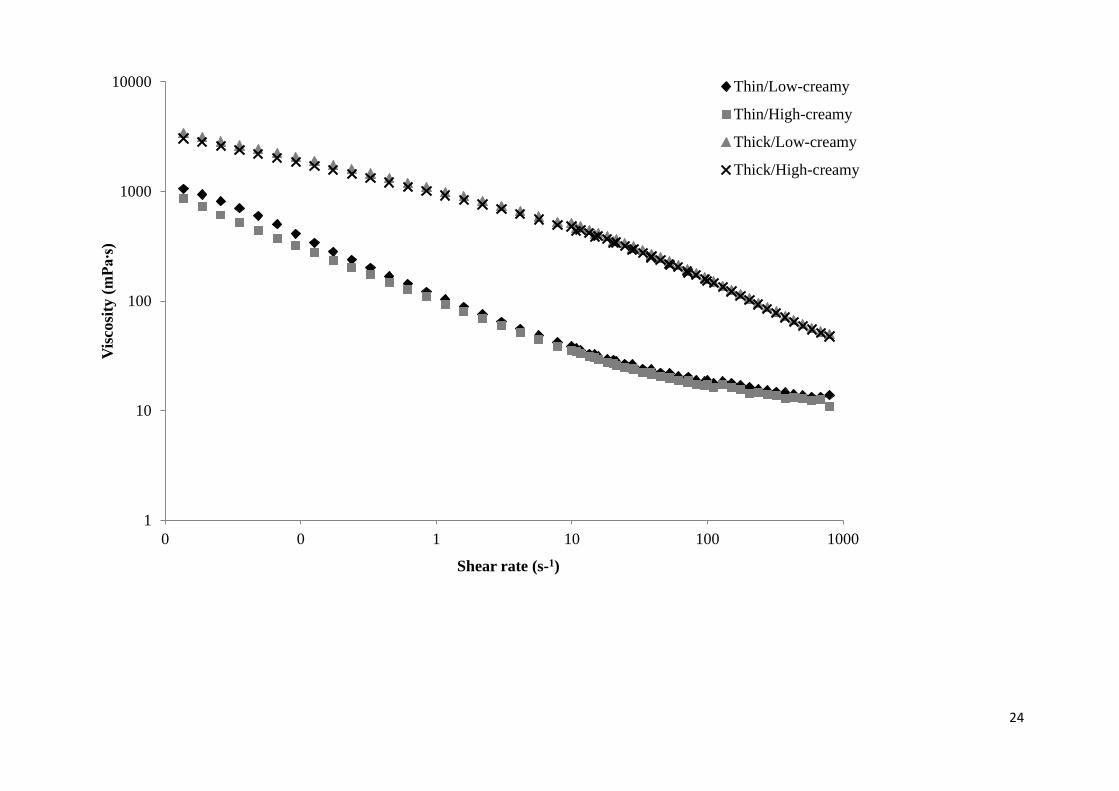
and 1500mm/s. Figures 1 and 2 show the viscosity and lubrication profiles for all four test drinks 158
and clearly indicate that the thick drinks were more viscous and more lubricating (signified by a low 159
traction coefficient) than the thin versions. Importantly, the creamy flavour additions did not 160
influence the physical texture of the drinks, therefore any differences in perceived creaminess and/or 161
intake between the high- and low- creamy flavoured drink could be attributed to the additional 162
flavour notes, rather than actual textural properties. None of the sensory manipulations added to the 163
caloric value of the drinks. [FIGUER 1 + 2 HERE] 164
165
Subjective appetite 166
Subjective measures of appetite were collected in the form of 100-point Visual Analogue Scale 167
(VAS) ratings using the Sussex Ingestion Pattern Monitor (SIPM: Yeomans, 2000) running on a Dell 168
PC using the windows XP professional operating system. Participants were asked “How <target> do 169
you feel right now?” and instructed to indicate the extent to which they felt hungry, full and thirsty 170
and their desire to eat, by dragging a marker along a 100mm scale. The scale response ranged from 171
“Not at all <target>” (0) to “Extremely <target>” (100). These ratings were embedded amongst 172
distracter “mood” ratings for how calm, happy, clearheaded, anxious, tired, energetic, lively and alert 173
the participant felt. Each question was presented in a randomised order and only the appetite 174
questions were analysed. 175
176
Sensory and hedonic evaluations of the drinks 177
Sensory evaluations of the drinks were also collected using the SIPM and had the same VAS format 178
as the appetite ratings. Participants rated how thick, creamy, familiar, fruity, pleasant and sweet the 179

9
drinks were, from “not at all” to “extremely”. Like the appetite questions, each rating was presented 180
in a randomised order. 181
182
Procedure 183
Participants completed four test sessions in the Ingestive Behaviour Unit (“food lab”) over four non-184
consecutive weekdays. To begin each session, the volunteers arrived at the laboratory for their 185
standard breakfast at a pre-arranged time between 8.30-10.00am, and were required to have 186
consumed only water since 11.00pm the previous evening. On their first session all participants 187
were reminded of the timings for the day‟s session and of any eating and drinking restrictions. After 188
breakfast, participants were instructed to leave the lab and return exactly two hours later having not 189
consumed anything but water in that time or taken part in any strenuous activities. 190
191
On their return to the laboratory participants were shown to an air-conditioned testing cubicle with a 192
PC computer where they completed the first set of appetite ratings. They were then presented with 193
an opaque glass containing a 15g sample of a fruit drink alongside an opaque jug containing 900g of 194
the same drink. The volunteers were instructed to taste the sample using a straw provided, hold it in 195
their mouth while they counted to three and then swallow, a method used to ensure sufficient oro-196
sensory exposure to the drinks (McCrickerd, et al., 2012). Participants then evaluated the sensory 197
and hedonic properties of the drink and once this was complete they were informed that they could 198
drink as much of the drink as they liked by pouring from the jug provided. They were informed that 199
if they finished the jug they would always be provided with another one. Explicit expectations 200
generated by the drinks sensory characteristics were not assessed again in this study to reduce the 201
potential demand effects on intake after reporting beliefs about how filling the drink was expected to 202
be. When participants had finished consuming the drink, the glass and jug were removed and they 203
completed a final set of appetite ratings and then took a seat in the waiting room. This part of the 204
10
study took approximately 10-20 minutes to complete. The total drink left in the glass and the total 205
amount of drink consumed and left in the glass was calculated in grams immediately after the 206
consumption phase. Future availability of food may influence intake in the laboratory if participants 207
plan to eat once they have completed the test session. To control for this participants remained in the 208
laboratory waiting area for 60 minutes after they had consumed the drink, where they were free to 209
read/work but they were not able to consume anything but water. After this time, participants 210
returned to the testing cubicle and completed a final set of appetite ratings and a simple reaction time 211
test where participants responded to number strings. The reaction time test was used to corroborate 212
the study‟s cover story, and like the mood ratings this was not analysed. 213
214
The order of presentation of the drinks across the four sessions was counterbalanced across 215
participants. On the final test day participants completed a short set of questions where they were 216
asked what they thought the purpose of the study was, what was the main reason they stopped 217
drinking in the sessions (they could give more than one reason) and whether they thought that the 218
food and drink they received was the same over the sessions. Once complete, participants had their 219
height (cm) and weight (kg) measured and they were thanked, debriefed and paid £30 for taking part. 220
221
Data analysis 222
The main outcome measures were the total amount of fruit drink consumed, the total left in the glass, 223
changes in rated appetite and sensory judgements. Intake data from one male participant was over 3 224
SD from the mean, causing significant skew in these data on two out of four test days (Zskew > 0.21, p 225
< 0.05). After removal these data were normally distributed. During the debrief, a second male 226
participant reported to have over-consumed to the point of feeling sick in their first session, and 227
consumed less in subsequent sessions because of this. Their data was also removed. Consequently, 228
the data from 46 participants (22 males) were included in the analysis reported. A three-way mixed 229
11
ANOVA contrasted the effect of drink thickness (thick vs. thin) and creamy flavour (low-creamy vs. 230
high-creamy) on the total drink consumed (g) and the total drink that was left in the glass (g), with 231
gender as the between-groups factor. Initially these analyses also included the order in which the 232
drinks were consumed over the four sessions as a factor. However, order did not significantly affect 233
overall intake and did not interact with the drinks sensory properties or participant gender to 234
influence intake, therefore it was removed from the final analysis. Pearson's correlations were used 235
to characterise the relationship between the total amount of drink consumed and participant BMI, 236
restraint and disinhibition scores. Initial analysis indicated that pre-test hunger, fullness, thirst and 237
desire to eat ratings were similar at the start of all of the four test sessions and were not affected by 238
participant gender. Thus, the main appetite analysis reported was conducted on change from 239
baseline (pre-drink) data. A series of four-way mixed ANOVAs assessed the effect of time (post-240
drink vs. 60 minutes later), drink texture (thick vs. thin) and creamy flavor (low-creamy vs. high-241
creamy) across male and female participants on hunger, fullness, thirst and desire to eat ratings. One 242
participant did not complete the final set of appetite ratings in one session and their data are missing 243
from this analysis (represented in reduced df). Finally, three-way mixed ANOVAs assessed the 244
effect of drink thickness (thick vs. thin) and the addition of creamy flavour (low-creamy vs. high-245
creamy) on the sensory and hedonic ratings of the test drinks, between male and female participants. 246
The means and SEM are presented throughout the results section and Bonferroni adjusted 247
comparisons were used to interpret any interaction effects. Pearson‟s coefficients (r) are reported for 248
estimates of effects sizes for all main effects comparing two groups and for any planned comparisons 249
(Rosnow, Rosenthal, & Rubin, 2000), where 0.50 represents a large effect, 0.30 a medium effect and 250
0.10 a small effect. 251
252

12
Results 253
Total intake 254
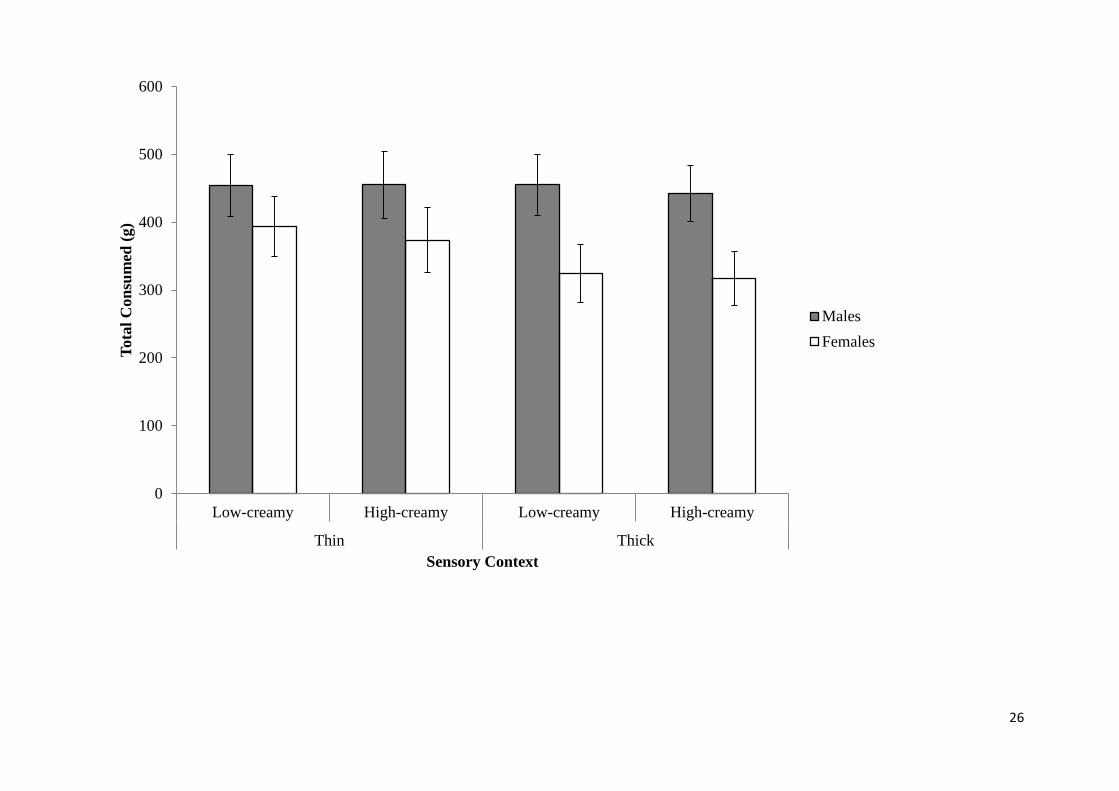
Participants consumed less of the thick drinks compared to the thin drinks (Mthick = 384.6 ± 27.7g, 255
Mthin = 418 ± 31.5g; F(1,44) = 5.71, p = .021, r = 0.34) and there was a trend for males participants 256
to consume more than female participants overall (Mmales = 451.5 ± 41.6 Mfemales = 351.9 ± 39.8; 257
F(1,44) = 3.00, p = .090, r = 0.25). However, a significant thick x gender interaction indicated that 258
only females consumed less of the thicker drinks (F(1,44) = 4.08, p = .049, see Figure 3). Separate 259
one-way ANOVAs for male and female participants compared the total intake of the thick and thin 260
drinks (using a Bonferroni adjusted significance level of p < .025). This indicated that the male 261
participants consumed a similar amount of the thick and thin drinks (Mthick = 448.9 ± 41.6g, Mthin = 262
454.2 ± 40.0g: F(1,21) = 0.09, p = .767, r = 0.07), while the female participants tended to drink less 263
of the thick drinks compared to the thin versions (Mthick = 320.4 ± 38.2g , Mthin = 383.4 ± 43.6: 264
F(1,23) = 8.14, p = .009, r = 0.51); a reduction of 63g. There was no effect of creamy flavour on the 265
total drink intake (F(1,44) = 0.45, p = .508, r = 0.10) and thick texture and creamy flavour did not 266
interact to influence the amount of the drink consumed (F(1,44) < 0.01, p = .984) and this was true 267
for both male and female participants (F(1,44) = 0.17, p = .681). There was no significant 268
relationship between the amount of drink consumed in each session and participants‟ BMI, restraint 269
(TFEQ-R) or disinhibition (TFEQ-D) scores (table 1). [FIGURE 3 HERE] [TABLE 1 HERE] 270
271
Total left in the glass 272
At the end of the ad libitum consumption, participants appeared to leave slightly more of the thick 273
drink in the glass compared to thin ones (Mthick = 10.2 ± 2.3g, Mthin = 3.8 ± 0.7g; F(1,44) = 9.39, p = 274
.004, r = 0.42), probably because the increased viscosity caused a small amount of the thicker drinks 275
to remain on the sides of the glass. There was no effect of creamy flavour (F(1,44) = 0.00, p = .986, 276
r < 0.01) and no thick x creamy interaction (F(1,44) = 1.46, p = .233) on the amount of drink left in 277
13
the glass after consumption and no effects of participant gender (F(1,44) = 0.11, p =0.742, r = 0.05 278
and for all interactions with gender p > .05). 279
280
Changes in appetite pre- to post-drink 281
As expected there was a significant effect of time on all of the appetite ratings. Rated hunger 282
(F(1,43) = 69.24, p <.001, r = 0.79), thirst (F(1,43) = 28.32, p < .001, r
= 0.63) and desire to eat 283
(F(1,43) = 42.70, p <.001, r = 0.71) decreased from pre- to immediately post-drink and then 284
increased towards the pre-drink levels 60 minutes later, see table 2. This pattern was mirrored in the 285
fullness ratings which increased immediately after consumption of the drink and then decreased 60 286
minutes later towards the pre-drink levels (F(1,43) = 77.88, p <.001, r = 0.80). 287
288
Despite differences in total intake of the drinks between male and female participants, gender did not 289
influence the changes in hunger, fullness, thirst and desire to eat (for each effect of gender p > .05 290
and r < 0.21; for all interactions with time p > .05). Furthermore, the drink‟s texture and creamy 291
flavour did not affect the changes in hunger, fullness and desire to eat (for all main effects of thick 292
and creamy flavour, p > .05 and r < 0.15; all thick x creamy interactions and all interactions with 293
time, p > .05), see table 1. However, there was a significant thick x creamy interaction for the thirst 294
ratings (F(1,43) = 7.09, p = .007) which indicated that overall the thin/high-creamy (M = -31.0 ± 4.0) 295
and thick/low-creamy (M = -27.8 ± 3.9) drinks reduced thirst more than the thin/low-creamy drink 296
(M = -22.7 ± 4.0) and thick/high-creamy drink (M = -19.8 ± 3.7), however, separate repeated 297
measures t-tests (using a Bonferroni adjusted significance level of p < .008) revealed that none of the 298
comparisons between the drinks reached significance (p > .018, r > 0.23). Changes in subjective 299
thirst over time were not affected by the drink thickness or creamy flavour (for all interactions p > 300
.05). [TABLE 2 HERE] 301
302
14
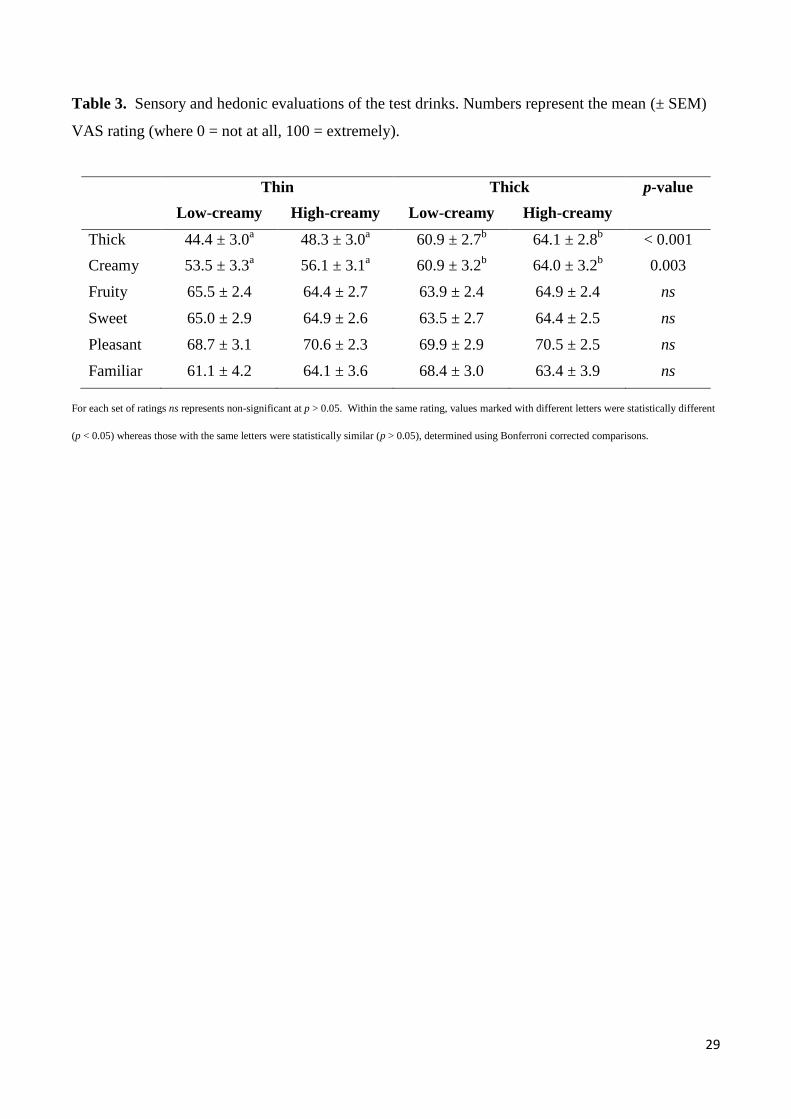
Sensory and hedonic ratings of the drinks 303
The mean sensory and hedonic ratings for each of the drinks are reported in table 3. There was no 304
effect of the thick and creamy sensory manipulations on the perceived fruitiness, sweetness, 305
pleasantness and familiarity of the drinks (for all main effects of thick texture and creamy flavour p > 306
.05 and r < 0.15, and for all thick x creamy interactions p > .05). Perceived thickness and creaminess 307
was affected by the sensory manipulations. The thick drinks were rated as thicker than the thin 308
drinks (F(1,44) = 42.34, p < .001, r = 0.70) and there was a trend for the high-creamy drinks to be 309
perceived as slightly thicker than the low-creamy versions (F(1,44) = 0.34, p = .072, r = 0.27). The 310
low-creamy drinks were perceived to be equally creamy as the high-creamy flavoured drinks (F 311
(1,44) = 1.98, p = .166, r = 0.21) but the thick drinks were rated as creamier than the thin drinks 312
(F(1,44) = 10.13, p = .003, r = 0.43). Thick texture and creamy flavour did not interact to influence 313
thick and creamy ratings (p > .05). Finally, there was no effect of gender on any of the sensory and 314
hedonic ratings (p > .05 and r < 0.19 for all main effects) and no interactions (p > .05). [TABLE 3 315
HERE] 316
317
Participant feedback 318
Most of the participants (85%) reported that they thought the study was assessing the effects of the 319
foods they were consuming on „mood‟ and feelings of „alertness‟ and „energy‟, in line with the cover 320
story. One participant said they had no idea what the purpose of the study was and the remaining 321
13% of the participants made other suggestions, such as market research for the drinks and testing 322
the drink as an alternative to breakfast and lunch. Forty three percent of the participants reported that 323
the most important reason they stopped drinking was because they felt full and 18 % reported that it 324
was because they no longer felt thirsty. Only one person reported that the main reason for stopping 325
drinking was that they had reached the bottom of the glass, and one that they had finished the bottom 326
of the jug. Regarding the sensory differences, 54% of participants reported that the drinks were 327
15
different, mostly commenting on textural differences, and 12% reported that they were different but 328
unsure how, but 34% of the participants believed that the four drinks were the same. Interestingly, 329
the mean intake values for those who reported that the drinks were the same across the four sessions 330
revealed a similar pattern to the one reported in the main analysis, with female participants tending to 331
reduce intake in response to the thick drinks (Mthin = 325.8 ± 52.0g, Mthick = 268.2 ± 41.5g), with 332
little evidence of this in the males (Mthin = 577.0 ± 67.1g , Mthick = 576.4 ± 53.6g).333
334

16
Discussion 335
The key finding from this study was that increasing the perceived thickness and creaminess of a 336
drink reduced intake in female participants. This builds on previous work suggesting that increasing 337
the viscosity of a drink increases the extent to which it is expected to be satiating and suggests that 338
such expectations can influence actual eating behaviour. The majority of participants consumed all 339
of the drink that they served themselves, indicating that the reduced intake of thicker drinks was 340
because female participants poured out less of these versions, which is in line with research 341
suggesting that pre-meal expectations of satiation and satiety are important determinants of meal size 342
(Fay, et al., 2011; Wilkinson, et al., 2012). The most common reason participants reported for 343
stopping drinking over the four sessions was feeling full and appetite ratings suggested that the 344
participants did feel equally full after each version of the drink, despite consuming different amounts. 345
Thus the drinks with satiety-relevant characteristics lead to a reduction in intake in female 346
participants without affecting subjective fullness. A key question for future research would be 347
whether sensory-related reductions in intake are compensated for in later meals. 348
349
In this study only the textural manipulation elicited a significant decrease in consumption. This 350
builds on our previous work indicating that a subtly thicker drink was expected to be more satiating 351
than a thinner version, with the addition of creamy flavour cues having less of an effect on these 352
expectations (McCrickerd, et al., 2012), but contrary to our prediction the addition of creamy 353
flavours had no impact on intake. However, perceived creaminess was associated with a decrease in 354
consumption. In this study, as well as in our last, the thicker drinks were consistently rated as thicker 355
and creamier than the thin versions. This is because perceived „creaminess‟ is a complex sensory 356
attribute, and characterised by both flavour and texture cues (de Wijk, et al., 2006; Kirkmeyer & 357
Tepper, 2005). Human adults have consumed a range of foods and drinks in their lifetime, and with 358
this experience, come to learn about their satiating consequences. These learned associations 359

17
between a food's sensory properties and post-ingestive consequences are likely to form the basis of 360
expectations about the how filling a food will be (Brunstrom, 2007). One possibility is that over a 361
lifetime increased viscosity is simply a more salient predictor of nutrients in food and drinks, 362
compared to creamy flavours alone which naturally occur in combination with changes in viscosity 363
and lubrication. Interestingly, one third of the participants reported that they perceived no 364
differences in the four drinks, highlighting that even though the sensory manipulations changed 365
behaviour they were subtle enough to not always be remembered. Indeed, in the current study the 366
four drinks were consumed across four non-consecutive days. This limits the extent to which the 367
participants could „compare‟ the drinks and highlights just how subtle the sensory manipulations 368
were, with the creamy flavour additions being less noticeable than the difference in viscosity. 369
370
Why then should only the female participants alter their intake of a drink in response to its texture? 371
Male and female participants were matched on characteristics previously thought to influence ad 372
libium intake, namely BMI, dietary restraint and disinhibition, as well as reporting similar appetite 373
sensations prior to consuming the drink (Blundell, et al., 2010; Herman & Polivy, 2008). The drinks 374
were all equally energy-dense and the order with which males and females consumed the different 375
drinks over the sessions did not affect intake behaviour, suggesting that differences in intake cannot 376
be explained by nutrient learning effects. Moreover, all participants rated the drinks as similarly 377
pleasant, sweet and familiar and both male and female participants perceived the thick drinks to be 378
thicker and creamier than the thin versions, so it is unlikely that perceived differences in these 379
characteristics influenced intake differentially in these groups. The decision not to re-test satiety 380
expectations in this study was taken to reduce the potential for response bias on intake, but this 381
means that we can only assume males and females held similar expectations that the thicker and 382
creamier drinks would be more satiating. However, gender differences in satiety expectations based 383

18
on the sensory characteristics of foods and drinks have not been previously reported (Hogenkamp, 384
Stafleu, Mars, Brunstrom, & de Graaf, 2011; McCrickerd, et al., 2012). 385
386
An alternative explanation for the males in this study not adjusting their intake in response to the 387
sensory manipulations is that there was another more salient influence on meal size in this group. 388
Research investigating ad libitum consumption of drinks differing in viscosity reported that 389
participants consumed less of a thicker semi-solid drink compared to a less viscous liquid version, 390
and there was no evidence that this effect depended on the participant‟s gender (Zijlstra, et al., 2008). 391
But a key difference between that and the current research is that Zijlstra and colleagues removed an 392
important environmental cue for meal termination from their study: finishing the serving (Fay, et al., 393
2011). In the present study males consumed on average 451g of the drinks; this was 100g more than 394
female participants and almost exactly the same amount as the capacity of the glass (450-470g 395
depending on whether it was filled completely to the brim or just below). This suggests that for many 396
of the male participants, their desired portion size was probably greater than the maximum amount of 397
drink that could be held in the glass, and in order to consume this amount they had to pour a second 398
helping of the drink. Perhaps this portion size cue limited the influence of satiety expectations on 399
self-selection in the male participants more than the female participants, whose average serving size 400
was much less than the capacity of the glass. To increase the sensitivity of the study design, we 401
would need to provide participants with a big enough glass to reduce this bias. However, decanting a 402
portion of a drink from a larger container is arguably more applicable to real consumer behaviour 403
and perhaps what the current study actually demonstrates is the subtlety with which satiety 404
expectations are likely to influence real life portion size decisions in the face of other salient serving 405
size cues and portion norms. 406
407
Conclusion 408

19
This study indicates that increasing the perceived thickness and creaminess of a drink, by subtly 409
increasing its viscosity, led female participants to consume less of the drink but feel no less satisfied, 410
lending support to the idea that a food's sensory characteristics generate expectations of satiation and 411
satiety that can guide eating behaviours. An unexpected outcome was that the sensory characteristics 412
of the drink did not influence intake in the male participants, despite previous research suggesting 413
that both males and females expected a thicker drink to be more satiating. This highlights that 414
multiple external factors are likely to influence meal size selection and consumption not just in solid 415
foods, but drinks too 416
417
Abbreviations 418
mPa∙s: millipascal-second; s-1
: reciprocal seconds; mm∙s-1
: millimetres per second MTM2: Mini-419
Traction-Machine tribometer. 420
421
Acknowledgements 422
This research was funded by the BBSRC and DRINC initiative and conducted as part of a PhD 423
studentship. KMc, MRY and LC designed the study. KMc prepared the study materials, collected 424
and analysed the data and drafted the manuscript with commentary from LC and MRY. All authors 425
read and approved the final manuscript. The authors declare that they have no competing interests. 426
The authors would like to thank Jennifer Norton and Tom Mills at the University of Birmingham 427
Department of Chemical Engineering for use of the rheometer used to conduct the viscosity 428
measurements and give extra thanks to Tom Mills for collecting the tribology measurements.429
430
20
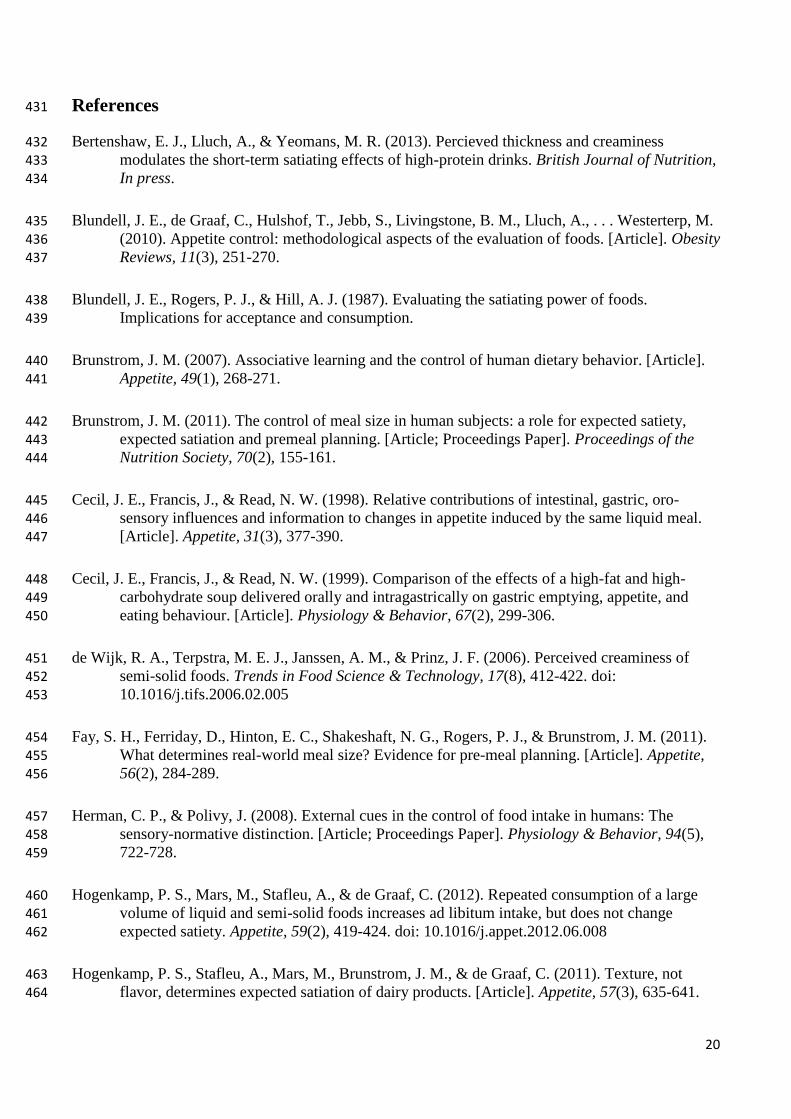
References 431
Bertenshaw, E. J., Lluch, A., & Yeomans, M. R. (2013). Percieved thickness and creaminess 432 modulates the short-term satiating effects of high-protein drinks. British Journal of Nutrition, 433 In press. 434
Blundell, J. E., de Graaf, C., Hulshof, T., Jebb, S., Livingstone, B. M., Lluch, A., . . . Westerterp, M. 435 (2010). Appetite control: methodological aspects of the evaluation of foods. [Article]. Obesity 436
Reviews, 11(3), 251-270. 437
Blundell, J. E., Rogers, P. J., & Hill, A. J. (1987). Evaluating the satiating power of foods. 438 Implications for acceptance and consumption. 439
Brunstrom, J. M. (2007). Associative learning and the control of human dietary behavior. [Article]. 440
Appetite, 49(1), 268-271. 441
Brunstrom, J. M. (2011). The control of meal size in human subjects: a role for expected satiety, 442
expected satiation and premeal planning. [Article; Proceedings Paper]. Proceedings of the 443 Nutrition Society, 70(2), 155-161. 444
Cecil, J. E., Francis, J., & Read, N. W. (1998). Relative contributions of intestinal, gastric, oro-445
sensory influences and information to changes in appetite induced by the same liquid meal. 446 [Article]. Appetite, 31(3), 377-390. 447
Cecil, J. E., Francis, J., & Read, N. W. (1999). Comparison of the effects of a high-fat and high-448 carbohydrate soup delivered orally and intragastrically on gastric emptying, appetite, and 449
eating behaviour. [Article]. Physiology & Behavior, 67(2), 299-306. 450
de Wijk, R. A., Terpstra, M. E. J., Janssen, A. M., & Prinz, J. F. (2006). Perceived creaminess of 451
semi-solid foods. Trends in Food Science & Technology, 17(8), 412-422. doi: 452 10.1016/j.tifs.2006.02.005 453
Fay, S. H., Ferriday, D., Hinton, E. C., Shakeshaft, N. G., Rogers, P. J., & Brunstrom, J. M. (2011). 454 What determines real-world meal size? Evidence for pre-meal planning. [Article]. Appetite, 455
56(2), 284-289. 456
Herman, C. P., & Polivy, J. (2008). External cues in the control of food intake in humans: The 457 sensory-normative distinction. [Article; Proceedings Paper]. Physiology & Behavior, 94(5), 458 722-728. 459
Hogenkamp, P. S., Mars, M., Stafleu, A., & de Graaf, C. (2012). Repeated consumption of a large 460 volume of liquid and semi-solid foods increases ad libitum intake, but does not change 461 expected satiety. Appetite, 59(2), 419-424. doi: 10.1016/j.appet.2012.06.008 462
Hogenkamp, P. S., Stafleu, A., Mars, M., Brunstrom, J. M., & de Graaf, C. (2011). Texture, not 463 flavor, determines expected satiation of dairy products. [Article]. Appetite, 57(3), 635-641. 464

21
Hulshof, T., Degraaf, C., & Weststrate, J. A. (1993). The Effects of Preloads Varying in Physical 465
State and Fat-Content on Satiety and Energy-Intake. [Article]. Appetite, 21(3), 273-286. 466
Kirkmeyer, S. V., & Tepper, B. J. (2005). Consumer reactions to creaminess and genetic sensitivity 467 to 6-n-propylthiouracil: A multidimensional study. [Article]. Food Quality and Preference, 468 16(6), 545-556. 469
Mars, M., Hogenkamp, P. S., Gosses, A. M., Stafleu, A., & De Graaf, C. (2009). Effect of viscosity 470 on learned satiation. Physiology & Behavior, 98(1-2), 60-66. 471
Mattes, R. D. (1997). Physiologic responses to sensory stimulation by food: Nutritional implications. 472 [Review]. Journal of the American Dietetic Association, 97(4), 406-&. 473
Mattes, R. D. (2005). Soup and satiety. [Article]. Physiology & Behavior, 83(5), 739-747. 474
Mattes, R. D. (2006a). Fluid calories and energy balance: The good, the bad, and the uncertain. 475 [Article; Proceedings Paper]. Physiology & Behavior, 89(1), 66-70. 476
Mattes, R. D. (2006b). Orosensory considerations. [Article]. Obesity, 14, 164S-167S. 477
McCrickerd, K., Chambers, L., Brunstrom, J. M., & Yeomans, M. R. (2012). Subtle changes in the 478
flavour and texture of a drink enhance expectations of satiety. Flavour, 1(20). 479
Mills, T., Norton, I. T., & Bakalis, S. (2013). Development of tribology equipment to study dynamic 480
processes. Journal of Food Engineering, 114(3), 384-390. doi: 481 http://dx.doi.org/10.1016/j.jfoodeng.2012.08.030 482
Mourao, D. M., Bressan, J., Campbell, W. W., & Mattes, R. D. (2007). Effects of food form on 483 appetite and energy intake in lean and obese young adults. [Article]. International Journal of 484
Obesity, 31(11), 1688-1695. 485
Rosnow, R. L., Rosenthal, R., & Rubin, D. B. (2000). Contrasts and correlations in effect-size 486 estimation. [Article]. Psychological Science, 11(6), 446-453. 487
Stunkard, A. J., & Messick, S. (1985). The 3-Factor Eating Questionnaire to Measure Dietary 488 Restraint, Disinhibition and Hunger. [Article]. Journal of Psychosomatic Research, 29(1), 489
71-83. 490
Teff, K. L. (2010). Cephalic phase pancreatic polypeptide responses to liquid and solid stimuli in 491
humans. [Article]. Physiology & Behavior, 99(3), 317-323. 492
Teff, K. L., Devine, J., & Engelman, K. (1995). Sweet Taste - Effect on Cephalic Phase Insulin 493 Release in Men. Physiology & Behavior, 57(6), 1089-1095. 494
Tournier, A., & Louis-Sylvestre, J. (1991). Effect of the physical state of a food on subsequent intake 495 in human subjects. Appetite, 16(1), 17-24. 496

22
Wilkinson, L. L., Hinton, E. C., Fay, S. H., Ferriday, D., Rogers, P. J., & Brunstrom, J. M. (2012). 497
Computer-based assessments of expected satiety predict behavioural measures of portion-size 498 selection and food intake. [Article]. Appetite, 59(3), 933-938. 499
Woods, S. C. (1991). The Eating Paradox - How We Tolerate Food. [Review]. Psychological 500 Review, 98(4), 488-505. 501
Yeomans, M. R. (2000). Rating changes over the course of meals: what do they tell us about 502 motivation to eat? [Review]. Neuroscience and Biobehavioral Reviews, 24(2), 249-259. 503
Yeomans, M. R., & Chambers, L. (2011). Satiety-relevant sensory qualities enhance the satiating 504 effects of mixed carbohydrate-protein preloads. [Article]. American Journal of Clinical 505 Nutrition, 94(6), 1410-1417. 506
Zijlstra, N., Mars, M., de Wijk, R. A., Westerterp-Plantenga, M. S., & de Graaf, C. (2008). The 507 effect of viscosity on ad libitum food intake. [Article]. International Journal of Obesity, 508
32(4), 676-683. 509
510
511

23
Figure 1. The viscosity of the four test drinks in millipascal-seconds (mPa∙s) measured under shear,
where a shear rate of between 10-100 s-1 are thought to best represent in-mouth viscosity.
Figure 2. The lubricating properties of the four test drinks measured as a traction coefficient, where
a lower traction coefficient represents a more lubricating sample.
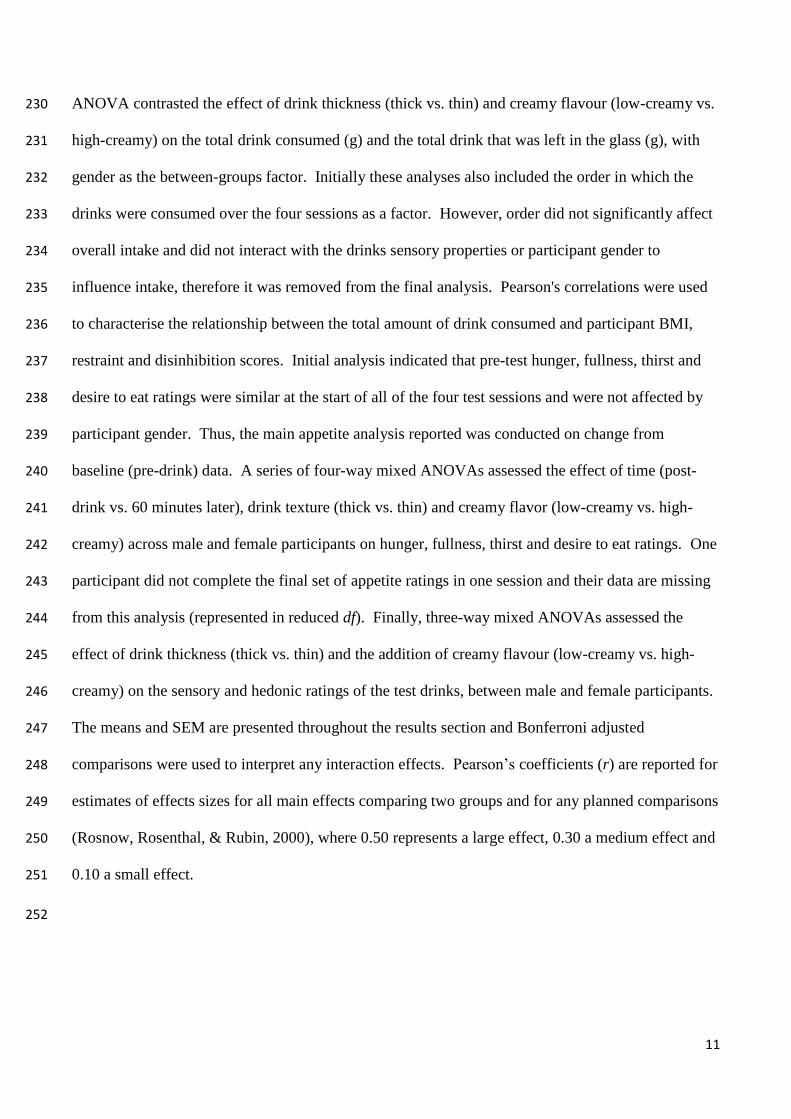
Figure 3. The total amount (g) of fruit drink consumed by male and female participants across the
four sensory contexts. Error bars are based on SEM. Male participants consumed a similar amount of
drink across the four sessions (p = .767), while female participants consumed less of the two thick
drinks (high- and low-creamy) compared to the two thin versions (high- and low-creamy; p = .009).
24
1
10
100
1000
10000
0 0 1 10 100 1000
Vis
cosi
ty (mPa∙s
)
Shear rate (s-1)
Thin/Low-creamy
Thin/High-creamy
Thick/Low-creamy
Thick/High-creamy

25
0.00
0.05
0.10
0.15
0.20
0.25
0.30
0.35
1 10 100 1000 10000
Lu
bri
cati
on
(T
ract
ion
Coef
fici
ent)
Speed (mm∙s-1)
Thin/Low-creamy
Thin/High-creamy
Thick/Low-creamy
Thick/High-creamy
26
0
100
200
300
400
500
600
Low-creamy High-creamy Low-creamy High-creamy
Thin Thick
Tota
l C
on
sum
ed (
g)
Sensory Context
Males
Females

27
Table 1. Pearson‟s correlations (r) between total intake of each drink BMI, TFEQ Restraint (R) and
TFEQ Disinhibition (D) scores, for male and female participants.
Thin Thick
Low-creamy High-creamy Low-creamy High-creamy
BMI Males 0.25 ns 0.34 ns 0.35 ns 0.14 ns
Females 0.28 ns 0.17 ns 0.13 ns 0.10 ns
TFEQ-R Males -0.16 ns -0.18 ns -0.31 ns < -0.01 ns
Females 0.15 ns -0.14 ns 0.14 ns 0.25 ns
TFEQ-D Males 0.23 ns 0.13 ns 0.24 ns 0.08 ns
Females 0.32 ns 0.26 ns <0.01 ns 0.10 ns
NS = p > .05

28
Table 2. Changes from baseline ratings of fullness, hunger, desire to eat and thirst for male and female participants across each of the drinks
consumed, immediately after consumption (post-drink) and 60 minutes later. Numbers represent the mean (± SEM) VAS rating (where 0 = not at
all, 100 = extremely).
Thin Thick
Low-Creamy High-Creamy Low-Creamy High-Creamy
Post-drink 60 min Post-drink 60 min Post-drink 60 min Post-drink 60 min
Fullness Males 22.9±5.5 8.7±5.0 23.4±6.1 7.6±5.1 25.0±5.0 7.6±6.0 22.8±5.0 11.5±5.7
Females 25.0±5.2 9.7±4.8 30.8±5.8 9.6±4.9 25.5±4.8 12.5±5.7 20.6±4.5 -0.1±5.4
Hunger Males -12.5±4.9 -4.6±5.5 -16.0±5.3 -0.8±5.1 -19.9±5.9 -3.9±7.2 -17.3±5.2 -10.2±6.8
Females -20.7±4.7 -9.0±5.2 -25.0±5.2 -3.7±4.9 -19.5±5.7 -4.5±6.9 -22.6±5.1 -1.3±6.5
Desire Males -12.7±5.9 -4.2±5.6 -12.3±5.1 -1.5±5.4 -19.6±5.0 -3.0±6.9 -17.4±6.1 -9.9±7.7
Females -18.6±5.6 -2.9±5.3 -23.4±4.9 -1.1±5.1 -18.1±4.7 -1.3±6.6 -17.5±5.8 -4.7±7.3
Thirst Males -26.8±6.2 -18.0±6.2 -25.0±6.1 -20.4±6.0 -29.7±6.3 -17.1±5.6 -20.8±6.4 -14.3±5.0
Females -29.6±5.9 -16.4±5.9 -42.8±5.8 -34.2±5.7 -37.0±6.0 -26.8±5.4 -26.8±6.1 -17.0±4.8
29
Table 3. Sensory and hedonic evaluations of the test drinks. Numbers represent the mean (± SEM)
VAS rating (where 0 = not at all, 100 = extremely).
Thin Thick p-value
Low-creamy High-creamy Low-creamy High-creamy
Thick 44.4 ± 3.0a 48.3 ± 3.0
a 60.9 ± 2.7
b 64.1 ± 2.8
b < 0.001
Creamy 53.5 ± 3.3a 56.1 ± 3.1
a 60.9 ± 3.2
b 64.0 ± 3.2
b 0.003
Fruity 65.5 ± 2.4 64.4 ± 2.7 63.9 ± 2.4 64.9 ± 2.4 ns
Sweet 65.0 ± 2.9 64.9 ± 2.6 63.5 ± 2.7 64.4 ± 2.5 ns
Pleasant 68.7 ± 3.1 70.6 ± 2.3 69.9 ± 2.9 70.5 ± 2.5 ns
Familiar 61.1 ± 4.2 64.1 ± 3.6 68.4 ± 3.0 63.4 ± 3.9 ns
For each set of ratings ns represents non-significant at p > 0.05. Within the same rating, values marked with different letters were statistically different
(p < 0.05) whereas those with the same letters were statistically similar (p > 0.05), determined using Bonferroni corrected comparisons.