does job satisfaction improve the health of …ftp.iza.org/dp3256.pdfdoes job satisfaction improve...
TRANSCRIPT

IZA DP No. 3256
Does Job Satisfaction Improve the Health ofWorkers? New Evidence Using Panel Data andObjective Measures of Health
Justina A.V. FischerAlfonso Sousa-Poza
DI
SC
US
SI
ON
PA
PE
R S
ER
IE
S
Forschungsinstitutzur Zukunft der ArbeitInstitute for the Studyof Labor
December 2007

Does Job Satisfaction Improve the
Health of Workers? New Evidence Using Panel Data and
Objective Measures of Health
Justina A.V. Fischer Stockholm School of Economics
Alfonso Sousa-Poza
University of Hohenheim and IZA
Discussion Paper No. 3256 December 2007
IZA
P.O. Box 7240 53072 Bonn
Germany
Phone: +49-228-3894-0 Fax: +49-228-3894-180
E-mail: [email protected]
Any opinions expressed here are those of the author(s) and not those of the institute. Research disseminated by IZA may include views on policy, but the institute itself takes no institutional policy positions. The Institute for the Study of Labor (IZA) in Bonn is a local and virtual international research center and a place of communication between science, politics and business. IZA is an independent nonprofit company supported by Deutsche Post World Net. The center is associated with the University of Bonn and offers a stimulating research environment through its research networks, research support, and visitors and doctoral programs. IZA engages in (i) original and internationally competitive research in all fields of labor economics, (ii) development of policy concepts, and (iii) dissemination of research results and concepts to the interested public. IZA Discussion Papers often represent preliminary work and are circulated to encourage discussion. Citation of such a paper should account for its provisional character. A revised version may be available directly from the author.

IZA Discussion Paper No. 3256 December 2007
ABSTRACT
Does Job Satisfaction Improve the Health of Workers? New Evidence Using Panel Data and Objective Measures of Health*
This paper evaluates the relationship between job satisfaction and measures of health of workers using the German Socio-Economic Panel (GSOEP). Methodologically, it addresses two important design problems encountered frequently in the literature: (a) cross-sectional causality problems and (b) absence of objective measures of physical health that complement self-reported measures of health status. Not only does using the panel structure with individual fixed effects mitigate the bias from omitting unobservable personal psycho-social characteristics, but employing more objective health measures such as health-system contacts and disability addresses such measurement problems relating to self-report assessments of health status. We find a positive link between job satisfaction (and changes over time therein) and subjective health measures (and changes therein); that is, employees with higher or improved job satisfaction levels feel healthier and are more satisfied with their health. This observation also holds true for more objective measures of health. Particularly, improvements in job satisfaction over time appear to prevent workers from (further) health deterioration. JEL Classification: I18, I19, J28 Keywords: job satisfaction, well-being, health, panel data analysis Corresponding author: Justina A.V. Fischer Stockholm School of Economics Department of Economics Sveavägen 65 SE-11383 Stockholm Sweden E-mail: [email protected]
* There are no potential conflicts arising from financial and personal relationships of the authors. The individual data used in this study have been collected by a national scientific organization (German Socio-Economic Panel) based on voluntary interviews, complying with common ethical standards. The data used in this publication were made available by the German Socio-Economic Panel Study (GSOEP) at the German Institute for Economic Research (DIW), Berlin. For a detailed description, see Wagner et al (1993). Justina Fischer acknowledges financial support from the Swiss National Science Foundation and the EU Marie Curie fellowship scheme.

DOES JOB SATISFACTION IMPROVE THE HEALTH OF WORKERS?
NEW EVIDENCE USING PANEL DATA AND OBJECTIVE MEASURES OF HEALTH
1. Introduction
Some research evidence suggests that the average workplace in several industrialized
countries has become less stable and more insecure and that, in general, employment
conditions have deteriorated (e.g., Schmidt, 1999; Swinnerton and Wial, 1995). Research also
indicates that levels of job satisfaction have declined in the past decades (Hamermesh, 2001;
Sousa-Poza and Sousa-Poza, 2003). Suggested reasons for this apparent trend include
globalization, flexible employment, technological advancements (IT coverage), higher
mobility, and in many countries, a deep recession in the 1990s. Even though to some extent
such worries may be inflated (Wanner, 1999; Winkelmann and Zimmermann, 1998), the
public at large is somewhat concerned that deteriorating job conditions and the resulting
decline in job satisfaction may influence worker health. Thus, understanding the effects of job
dissatisfaction (or stress) on an individual’s health is important not only from a medical but
also from an economic perspective. For example, while job satisfaction plays an important
role at the employee level as a determinant of individual well-being, at the aggregate level, it
equally affects worker productivity and retirement decisions, and ultimately, a society’s
economic prosperity (Faragher et al., 2005). Knowing whether such components of subjective
well-being affect individual health can thus provide valuable information on key policy issues
like the rise in healthcare costs and the economic performance in many industrialized nations.
Therefore, this study tests whether job satisfaction determines worker health.
Because of the topic’s obvious relevance and importance, a large body of literature has
already evolved on the relationship between employee job satisfaction and ill health (see
Faragher et al., 2005, for a meta-analysis of over 450 studies). Arguments for the existence of
such a link are many and varied. Recent research by organizational psychologists suggests
3

that job satisfaction may have an indirect influence on workers’ health through both physical
and psycho-social employment conditions like workplace safety, lightening, quality of air,
degree of automation, but equally harassment, hierarchical position, network support,
responsibility, effort-reward imbalance, work stress, and job security (e.g. Stansfeld et al.,
1997, 1998).
However, most of the literature on the subjective well-being–health link is hampered by
methodological and design problems (Spector, 1997), including the use of cross-sectional
data, unrepresentative datasets, and unreliable statistical methods reporting simple correlation
coefficients. Whereas simple correlations fail to take into account the impact of other potential
determinants of health, regression analyses on cross-sectional data allow no conclusion of
causality because of omitted and unobservable personal characteristics. In addition, since most
studies rely on self-reports rather than objective health measures, the finding that job
satisfaction is conducive to subjective health may be driven by ‘third factors’ like personality
traits such as neuroticism, hardiness, extroversion, or negative affectivity (Brief et al., 1988;
Watson et al., 1988). For example, individuals high in negative affectivity2 tend, other things
being equal, to be more discontented at work and equally more likely to self-assess their
health problems negatively (Stansfeld et al., 1998). Moreover, as most studies only analyze
specific populations, it is often impossible to generalize results to the entire working/active
population.
Thus, this paper contributes to the research stream by examining the relationship between
health and job satisfaction—a specific subjective measure of well-being—in a manner that
remedies the shortcomings of previous research in the following respects:
First, our use of regression analysis partially eliminates the impact of other potential
worker health determinants that may correlate with job satisfaction. Second, our use of panel
2 The personality trait of negative affectivity reflects a person’s tendency to experience negative emotions like
anxiety or depression across a wide variety of situations (Spector, 1997, p. 52).
4

data from the German Socio-Economic Panel (GSOEP)3 to test for causality between job
satisfaction and health permits – through using individual fixed effects - the controlling for
unobservable individual characteristics such as affectivity, thereby enabling more convincing
conclusions on causality. Third, employing objective health measures such as the degree of
disability and the Body Mass Index (BMI) should yield more reliable results than using
subjective measures of health only.4
The remainder of the paper is organized as follows. Section 2 discusses the empirical
literature relating to job satisfaction and health. Section 3 introduces the model and data, and
describes the estimation techniques. Section 4 discusses the estimation results and presents the
robustness test, after which Section 5 summarizes the findings and concludes the paper.
2. Previous Research
To date, economists have concentrated primarily on analyzing the determinants of job
satisfaction, which are influenced by many personal facets including gender (Clark, 1997;
Clark and Oswald, 1996; Sousa-Poza and Sousa Poza, 2000a), age (Clark et al., 1995),
education (Clark and Oswald, 1996; Tsang et al., 1991), as well as workplace characteristics,
employment conditions, and career perspectives (for an overview, see Sousa-Poza and Sousa-
Poza, 2000b). However, job satisfaction as an explanatory variable appears infrequently in the
economic literature, with the notable exception of research on the job satisfaction’s effect on
quitting behaviour and retirement decisions. Nonetheless, limited recent empirical evidence
does exist that current job satisfaction influences future labour turnover (see, e.g., Clark,
2001; Clark et al., 1998; Freeman, 1978).
In contrast, the relationship between job satisfaction and health has been extensively
studied by health scientists and organizational psychologists. For example, one
3 See Wagner et al (1993) for a detailed description. 4 For a study using the cross-sectional SHARE data which contains a wide array of objective measures of
health, see Fischer and Sousa-Poza (2007).
5
comprehensive meta-analysis of 485 predominantly cross-sectional studies with mostly small
sample sizes (although with a combined sample size of 267,995 individuals) based on self-
report measures of both job satisfaction and health show an overall (simple) correlation across
all health measures of 0.312 (Faragher et al., 2005). Even though this analysis shows a strong
correlation between job satisfaction and psychological problems like burnout (ρ = 0.478),
self-esteem issues (ρ = 0.429), depression (ρ = 0.428), and anxiety (ρ = 0.420); correlations
with subjective evaluations of physical illness are much smaller (ρ = 0.287). Attempts to
reveal a relationship between more objective measures of physical health and job satisfaction
have been less fruitful (Spector, 1997, p. 67).
3. Data
To analyze the relationship between job satisfaction and health, we employ panel data of
persons active in the labour market based on the German Socio-Economic Panel (GSOEP).
The GSOEP, a longitudinal panel survey with representative data for the population in
Germany, has been conducted annually since the eighties, and covers the personal, economic,
social, and political aspects of the respondent and her family. The GSOEP data contain
various self-report measures of health, which all form our set of dependent variables in this
study. In particular, they include assessments of individual general health status or satisfaction
with health, as well as items relating to more specific health problems such as impediments to
daily activities. It also provides information on personal recall of hospital stays, doctor visits
and longer periods of illnesses, which are all good indicators of more severe health problems
among respondents. Finally, it also contains a few objective measures of health such as BMI
and the officially recognized disability status.
In this study, we employ all these available physical health variables in the GSOEP data,
thereby covering the widest range possible to ensure the robustness of our results. However,
not all health measures are available for all waves of the GSOEP. Our variable of interest, the
6

job satisfaction indicator, is measured on an 11-point scale (from 0, “not at all satisfied” to 10,
“completely satisfied”) and reported in each wave in our sample for all who are currently
employed, either full-time, regular part-time, through a vocational training or irregular part-
time.
To estimate our model with German panel data, we use the waves following German
unification from 1992 until 2005, resulting in an unbalanced panel with a maximum of about
17,000 individuals in each wave. To mitigate the impact of selection effect of dissatisfied
individuals leaving the labour market (either into early retirement or occupation as
houseman/housewife), we have restricted the sample to (self-) employed respondents aged
between 16 and 60 years, far below the official retirement age of 65 years.5 Table A1 of the
Appendix provides actual variable definitions used and Table A2 descriptive statistics.
4 Model
We test the hypothesis that a worker’s job satisfaction affects her health status by estimating
two models: first, we assess the causal relationship between her degree of job satisfaction and
levels of self-report health. Second, in the tradition of an ‘intervention’ analysis, we attempt to
relate changes in individual health status over time to changes in her job satisfaction during
the same period. For both models, we exclude all work-related factors that might determine
job satisfaction (and changes thereof) such as industry sector, type of work, employment
contract, wage level, match of skills with job requirements, reputation gains and career
prospects, etc. Thus, in a first step, we estimate the following model:
5 In general, the effect of job dissatisfaction on labour market exits is relatively small (see Sousa-Poza and
Sousa-Poza, 2007). The official retirement age of 65 applies to both genders and has not been changed since the 1970ies.
7

yit = βxit + χ'git + εit with εit = υi+ ϖit for t = 1992 - 2005 (1)
where yit denotes individual i’s health state at time t, xit the variable of interest (i.e., job
satisfaction), git a vector of additional control variables, while ϖit and vi are the time-variant
and time-invariant components, respectively, of the error term. Individual fixed effects
(contained in git) account for individual heterogeneity caused by unobservable characteristics
such as negative and positive affectivity that might give rise to a positive (but ultimately
spurious) relationship between job satisfaction and self-assessed health in a purely cross-
sectional setting.6 Thus, inclusion of individual fixed effects, the so-called within-
transformation, prevents the biasing of the estimated coefficient vector caused by omitted
variables that are correlated with both job satisfaction and health. 7
To ease interpretation of the fixed effects model, equation (1) can be transformed into and
estimated as:
(yit- θYi) = β(xit – θXi)+ χ'(git – θGi)+ (ϖit – Ωi) (2)
where capital letters (Yi, Xi, Gi, Ωi) denote individual-specific averages over all time
periods t in the sample. Thus, in a fixed effects model only the impact of time-varying
determinants (in form of deviations from the average over time) are identifiable. The
individual fixed effects capture not only genetically shaped psychological traits or innate
health risks of the observed person, but also other (potentially observable) time-invariant
6 That personality traits play an important role for self-report measures in general (such as happiness) has
been shown by several researchers (e.g. Brebner et al., 1995; Cheny & Furnham, 2001; Lonigan, 1994; Watson & Pennebaker, 1998). In addition, personal traits also appear to be responsible for the development of health problems (see Alamada et al., 1991; Costa,1987; Kohler et al., 1993).
7 Ultimately, the direction of the bias is not clear-cut in a model with more than two independent variables, as the bias depends not only on the correlations between the omitted and the included variables but also on the correlations among the included variables, and their variances (e.g. Clarke, 2005). However, assuming a two-variables model, the bias is likely to be positive in case job satisfaction and the omitted factor ‘personality traits’ are positively correlated and the latter is also partially positively correlated with the outcome health in the true model.
8

socio-demographic characteristics of the respondent such as gender, being foreign-born, early
childhood conditions, level of schooling, and religious-cultural background.8 As additional
(time-varying) controlling variables that are not mediated by job satisfaction we include a
respondent’s age and marital status (‘married’, ‘widowed’, ‘separated’, ‘divorced’, with
‘single’ as the reference category). In addition, we add household income; with its correlation
with wage earnings being relatively low (0.3) it thus accounts for a common pool of financial
resources for the family that facilitates the maintenance of a good health state for all its
members. Year dummies controlling for systematic shocks and state of the macro-economy
that pertain to all respondents of the same wave complete this model. This vector of control
variables is identical for all estimated models.
In a second step we relate alterations in job satisfaction from one period to the next (yit -
yit-1) to changes in health state over the same period (xit - xit-1). Again, unobservable
psychological traits of an individual may not only affect how she perceives her current health
and job satisfaction states, but equally how she assesses changes in either of them. For
example, positive affectivity might cause an upward bias in the perception and evaluation of
health improvements. For this reason, we take account of unobserved individual heterogeneity
by first differencing of model (1). This approach has the advantage that the difference of time-
invariant characteristics across two subsequent waves equal zero so that the presence of
unobservable personal traits will not bias the estimator. As in the first model, we also include
age, marital status, family income in form of their first differences over time. Time dummies
complete the model specification, which looks as follows:
yit - yit-1 = β(xit - xit-1) + χ'(git - git-1) + (υi - υi) + (ϖit - ϖit-1) (3)
8 In addition, they might equally reflect (unobservable but time-invariant) workplace characteristics and job
types, as well as a general propensity to exercise regularly, that might potentially confound the analysis in a cross-section of data.
9

For both models (equations (2) and (3)), the estimation techniques are selected according
to the type of dependent variable. For estimating the first model, we employ individual-
specific fixed-effects GLS (FGLS) or a conditional fixed-effects logit model for panel data9 in
case the dependent variable is of a dichotomous nature; in contrast, for estimating first
differences random effects panel estimators are employed, in case that more than two waves
are available.10 Heteroscedasticity and intra-group correlation (namely arbitrary serial
correlation as the ‘group’ is the identical individual observed over time) corrected standard
errors are obtained through clustering at the individual level.11
Since we estimate the relationship between two categorical variables with an estimator
that assumes cardinality, we will focus on the direction of impact and, in most cases, abstain
from drawing conclusions with respect to the size of influence. The alternative would be to
risk a more severe bias by not taking into account unobserved individual heterogeneity when
employing a random effects (ordered) probit panel estimator (see also Ferrer-i-Carbonell and
Frijters, 2004). Indeed, Ferrer-i-Carbonell and Frijters (2004) showed that the estimation
results for the self-report happiness question are qualitatively identical (in terms of direction,
significance, and trade-offs among regressors) when assuming either cardinality or ordinality
of the dependent variable.
Nevertheless, although this approach constitutes an important improvement compared to
approaches used in previous studies, we should note that we do not account for the fact that
health state itself might influence job satisfaction. Usage of an instrumental variable
technique, however, is not feasible due to a lack of suitable instruments that satisfy the
9 Estimated with Stata 9.2’s xtreg and clogit commands, which allow for clustering at the individual level
even in the presence of individual fixed effects. 10 An ordered probit or logit individual fixed effects estimator that yields consistent estimates has not been
developed yet. As we are interested in the direction of the effect rather than its magnitude, using FGLS for a categorical dependent variable with more than 2 categories is feasible. In principle, the bias caused by assuming cardinality diminishes with the number of categories. Results based on ordered probit random effect estimators for panels using the Swiss Household Panel are shown in Fischer and Sousa-Poza (2007).
11 Stock and Watson (2006) show that using Sandwich robust standard errors yields inconsistent estimates in a fixed effects context. In contrast, the number of clusters (often > 5,000) is sufficiently large for being regarded as close to ‘infinity’.
10

exclusion restriction requirement. In other words, we were not able to find a time-varying
variable that was correlated with job satisfaction only, but not with the health measure.
As robustness check and to account for selection into and out of the labour market, we
have estimated both models for gender- and age-specific subsamples. In particular, in
Germany, according to the traditional role model, most of the male population is not given the
option of becoming inactive housemen before reaching an (early) retirement age (of 55),
while the female population under the age of 25 exhibits a labour force participation rate
similar to that of the male population. Given the more robust health of younger persons, we
expect more sizeable effects in the full sample. In principle, a most flexible functional form
with regards to job satisfaction is chosen, that includes its squared term, but we provide F-
tests or Wald-tests on the joint significance of the jobs satisfaction variables due to their
considerable correlation.12
4. Empirical results
Satisfaction with health and self-assessed state of health
Table 1 reports the results for a first subjective measure of health state, as indicated by
satisfaction with one’s own health, which ranges from 0 (low) to 10 (high). This specific
health measure is recorded in our unbalanced GSOEP panel for up to 10,000 (self-)employed
per wave observed over a maximum period from 1992 to 2002, varying for each person from
1 to 11 years (average: 4.3 years), giving rise to up to 75,000 observations.13
The results in column (1) for the whole working population show that the level of job
satisfaction is positively associated with satisfaction with one’s own health (significant at the
0.1% level). The positive sign of the estimated coefficient of the squared term suggests that
satisfaction with one’s health increases over-proportionally in job satisfaction (equally 12 The correlation is ρ = 0.97 for the levels and ρ = 0.96 for the differences. The reader should note that
despite this high correlation both variables often turn out independently significant in the regression analysis if the sample is sufficiently large (at least 30000 observations in Table 1).
13 The maximum number of active persons covered by one wave is 11,000.
11

significant at the 0.1% level). Assuming cardinality of both regressand and focal regressor, an
increase in job satisfaction by one category raises one’s own health category by about 0.15
points or one sixth of one health category. In other words, the effect is rather small: a positive
change in one health category would require an approximate change in job satisfaction by 7
categories. The results for the controlling variables indicate that older persons are more
satisfied with their health state, while marital status and household income are not significant
in this sample.14 Most of the year effects (not reported) are individually significant so that
they should not be omitted from the model. In the remaining part of the paper, we always
include these controlling variables in our regressions and report them in the output tables
(Tables 1 – 7), but will not discuss their observed effects in the main text.
It should be noted that all our results for our job satisfaction variable prevail when the
most parsimonious specification, only controlling for year and individual fixed effects, is
employed. Whether the job satisfaction variables turn out significant or not is reported in the
lower part of the Tables 1 through 7. Contrary to expectations, for all models the previously
observable significant impact can be corroborated, while for two models significant relations
become evident that are disguised in the full specification (Table 4 column 3 and Table 6
column 3). This robustness test shows that our results presented in this paper are not caused
by a so-called over-identification problem.
Through the inclusion of individual fixed effects we account for unobservable personality
traits such as negative or positive affectivity (but also job characteristics and type of work)
that might give rise to a spurious positive relationship between the variable of interest and
14 This insignificance can, most possibly, be attributed to the inclusion of individual fixed effects. First, they
capture all time-invariant socio-demographic characteristics, such as marital status for most persons during the observational period. Analogously, the individual fixed effects might also capture a ‚base wage’ effect, given that taking the natural logarithm of income filters out wage increases due to inflation or contract renegotiations at the national level, which are reflected by the year fixed effects estimates. Indeed, estimation of a random effects model shows a positive association of income with satisfaction with one’s health, significant at the 0.1% level. The results for age are sensitive to employing them in their natural log form. The effect is negative (health satisfaction declines with age) when their unlogarithmized form is used, or when a random effects model is employed (irrespective of functional form). However, correlation between age and its logarithmized form is 0.98. On the other hand, a lowering of aspiration levels with regards to health as age increases might equally explain such result (e.g., Clark and Warr, 1995).
12

health in a purely cross-sectional setting or when estimating a random effects model. Based
on the fixed-effects (FE) panel analysis we can therefore confirm the finding of previous
cross-sectional studies, namely that job satisfaction is conducive to individual health
satisfaction, and that is effect is unrelated to an individual’s (time-invariant) personality
characteristics.
Estimations for subpopulations (only men below 55 years and only persons below the age
of 25 years) corroborate this positive relationship, suggesting that it is not restricted to
samples pertaining to a particular age group, gender or to those who selected into/did not
select out of the labour market. However, we should note that the slope is rather constant for
younger persons while it is increasing for men, as already observed in the full sample.
The second part of the health-job satisfaction analysis is carried out for changes in the
regressand that may be triggered by changes in job satisfaction (potentially non-linearly,
therefore we included the change of the squared term), also controlling for changes in the
remaining variables of the model. In the full sample (column 4), a strong positive relationship
of (contemporaneous) changes in job satisfaction with changes in satisfaction with one’s own
health state emerges. The effect is more sizeable than that observed for the levels, as a change
in roughly five job satisfaction categories appears sufficiently large to induce a change by one
health satisfaction category.
Again, regressing differences on differences accounts for unobserved individual
heterogeneity, so that a positive association between the two change variables reflects a true
causal relationship. Once again, a similar relationship is identifiable in our male worker
subsample (column 5), suggesting that this finding is not caused by happy workers who stay
in the labour market. Moreover, this positive relationship is equally evident in the sample of
the 25 year old (column 6), as the Wald-test on the joint significance indicates, despite of a
potentially stronger stress resistance in this age group so that changes in job satisfaction are
not expected to necessarily translate into actual changes in health satisfaction.
13

------------------------------------------------
Insert Table 1 about here ------------------------------------------------
In Table 2 we employ a widely-used categorical health-state variable for whether
respondents consider their own health as ‘very good’ up to ‘bad’, on a 5-point scale. In the
full sample, we again observe a positive relationship between levels of job satisfaction and
degree of self-assessed health state (column 1) – even after controlling for individuals’
unobservable time-invariant characteristics. The coefficients suggest that the health returns to
job satisfaction are slightly increasing; however, the marginal effect is negligibly small.15 In
support, the estimation for the male sample in column 2 indicates that this positive health
effect is independent of older workers’ early retirement decision, and also prevails in the
younger age groups.
Turning to the results for changes in self-assessed health (Table 2 columns 4 to 6), we find
for the full sample that positive changes in job satisfaction trigger positive changes in self-
assessed health, again at an increasing rate, but with a quantitatively small total marginal
impact. In the male employee and the younger age group samples, we also observe a positive
relationship, as the Wald-tests suggest.
To sum up, the results of both Tables 1 and 2 show that there is a strong and robust
relationship between job satisfaction and (satisfaction with) one’s own health state, both in
terms of levels and changes, and both for the full sample and specific population groups that
are less subject to selection effects. In the remaining analyses we will therefore omit the
15 Assuming cardinality, it would require a change in job satisfaction of (theoretically) 34 categories to observe
a change in self-assed health state by one category.
14

analysis for these subsamples as they do not appear to differ significantly in their behaviour
from that observed in the full sample.16
----------------------------------------------
Insert Tables 2 about here
----------------------------------------------
Contacts with the health care system
Table 3 presents the coefficients of levels of the job satisfaction variable for frequency and
type of contact with the health care system – including doctor visits and overnight stays in
hospitals. It also includes measures relating to sick days taken off from work and accidents at
the work place.
In general, the results in Table 3 show that job satisfaction leads to less health care facility
contacts (hospital stays and doctor visits), reduces the likelihood of work accidents that
require medical treatment, and lowers the frequency of sick leave from work (both minor as
well as more severe illnesses); as the either independently or jointly significant job
satisfaction variables indicate. Among the six different measures tested, only for ‘in patient
treatment’ no relation with job satisfaction exists.
Most of these effects are quantified through the coefficient sizes (except for column 4 in
which a conditional fixed effects estimator is reported); for example, to describe the most
sizeable ones, a rise in satisfaction with one’s work by two categories decreases the number of
annual doctor visits by more than 1 time (column 1), and the number of sick days by at least 2
working days (column 5). It is important to note once again that this negative relationship is
then not driven by innate personality traits such as optimism that may decrease the probability
of seeking professional medical advice in case of an injury or disease compared to not so an
16 The significance of the coefficient of job satisfaction, lagged by one year, is observable for all populations
and models (levels and differences) of Tables 1 and 2. An exception pertains to the group of young employees for which past job satisfaction levels exert no impact on present-time self-assessed health state (cf. Table 2 column 3).
15

optimistic person. Moreover, this approach also controls for the fact that an overly optimistic
person may not only underestimate the severity of an illness, but equally may also
systematically not be able to recall doctoral visits and number of sick days of the past year.
Thus, we can conclude that persons who are more satisfied with their jobs are less severely
sick and less vulnerable, independent of their personality traits.17
For the identical measures of health we have also investigated the impact of changes in job
satisfaction over time. The results in Table 4 show that the relationship is less robust than the
one observed for the levels (Table 3). In general, only for changes in the number of annual
doctor visits and (shorter and longer lasting) sick leaves (columns 1, 5 and 6) do we observe
that changes in job satisfaction do matter. To quantify these effects, a positive change of job
satisfaction by one category over time halves the number of annual doctor visits across the
two periods, the number of sick leaves from work by more than one entire working day, while
the quantitative impact on long-term diseases is only negligible (-0.007 times). For the
remaining measures pertaining to changes in health service contacts the change in job
satisfaction is not significant.18
----------------------------------------------
Insert Tables 3 and 4 about here
----------------------------------------------
17 Moreover, given that most workers do not switch the type of job (e.g. working in an office or having a
physically demanding occupation), the observed impact of job satisfaction is also independent of one’s time-invariant job characteristics. For the impact of psycho-social work characteristics and employment grade on short work absences due to ‘back pain’, see Hemingway et al. (1997). Using job satisfaction lagged by one period, we find workers’ satisfaction in the past to lower the present-time number of in patient nights in hospital (at the 1% level) and sick leaves exceeding 6 weeks (at the 5% level), while the remaining measures of health care contacts remain unaffected. This finding might indicate that past job satisfaction impacts the development of severe illnesses stronger than present-time job satisfaction.
18 Lagging the job satisfaction variable by one period leaves the coefficient in model (1) ('number of annual doctor visits’) insignificant, whereas the significance for 'number of days out sick’ persists at the 5 percent level (model 5). Moreover, positive changes in job satisfaction from t-2 to t-1 lead to decreases in inpatient nights in hospital between t-1 and t by 0.04, at the 5% level.
16

Health Impairment (self-assessed)
Finally, we turn to self-reported measures of daily impairment. Here we face the problem that
most types of impairment reported in the GSOEP are so severe that they inhibit participation
in the labour market. This applies to difficulties with daily activities such as dressing oneself
alone or getting out of bed. As a result, there are too few observations (about 40 – 70 in the
whole panel of active labor market participants) to robustly estimate the relationship between
job satisfaction and such measures of health impairment.
An exception applies to the variable ‘having troubles with climbing stairs’; about 5000
workers report that they experience such problems, which makes it suitable for our analysis.
Unfortunately, however, this question has only been posed in the two most recent waves,
namely in 2002 and 2004.19 For this reason, analysing levels with a fixed effects model is
econometrically problematic as the calculation of the variance-covariance matrix could be
affected (as deviations from the average over time are analysed). On the other hand, a random
effects estimation might yield biased coefficients due to unobserved individual heterogeneity,
as discussed in the model section. However, as this health outcome is reported in two waves,
the method of first differencing (see equation (3)) can be applied, which, in this specific case,
results in estimating a cross section.20
Table 5 reports the results of this analysis. For simplicity, we have assumed that (the
difference in) health state with respect to having problems climbing stairs is linear in (a
change in) job satisfaction. Column 1 gives the outcomes for a logit random effects panel
model in which health state (as level) is the dependent variable. The estimate suggests that
persons who are more satisfied with their work are 26 percentage points less likely to
experience the health problem of having difficulties with climbing the stairs (significant at the
19 The alternatively suitable measures ‘health limits kneeling’ and ‘health limits vigorous activities’ have not
been collected between 1992 and 2005. 20 As the age difference is identical across individuals (+ 2 years) it drops automatically out of the regression.
17

0.1% level). However, as said before, without the inclusion of individual fixed effects this
sizeable correlation may be spurious.
The result of the first difference model is reported in column (2). Given that the
underlying measure of health is dichotomous with value ‘1’ indicating that the respondent
suffers from problems with climbing stairs, the difference can take on the values ‘-1’, ‘0’, and
‘1’. While ‘0’ indicates that the health state has not changed between periods 2002 and 2004,
‘1’ reflects a worsening (moving from ‘no problems = 0’ to ‘having difficulties = 1’, while ‘-
1’ denotes an improvement. In our sample of 7500 persons recorded in both waves, about
6000 experienced no change in their health state between t-2 and t, about 640 an improvement
and about 850 a worsening. Given the cross-sectional nature of our data, the model is
estimated with a multinomial logit.
The results show that a change in job satisfaction between 2002 and 2004 does not induce
an improvement of the respondent’s health state (column 2), compared to the reference group
of those who experienced no change in their health (difference = 0). In contrast, for the
outcome (1) the negative sign of the significant coefficient on the difference in job satisfaction
suggests that improving workers satisfaction over time decreases the probability of health
state deterioration during the same period, by roughly 1 percentage point for an increase in job
satisfaction by one category. In contrast, the analysis of the identical model for those workers
aged 25 or younger (about 400 observations) suggests that an increase in job satisfaction over
time does not affect the ability to climb stairs, a finding not unexpected for this particular age
group.21 In other words, job satisfaction appears to protect particularly middle-aged and older
workers against developing health problems of having difficulties with climbing stairs, but
seems less likely to support healing processes.
21 Assuming non-linearity in job satisfaction does not alter our findings. Estimation results are available upon
request. Lagging the job satisfaction variable by one period showed the identical impact for the random effects model (at the 1% level), but no effect on changes in problems with climbing stairs.
18

-------------------------------------
Insert Table 5 about here
-------------------------------------
Objective measures of health
With regards to objective health measures, the GSOEP contains information on an
individual’s disability status and body weight and height. In general, objective measures have
the advantage that they are less subject to recall errors that could be caused by an individual’s
character. The measures relating to ‘being disabled’ are available for almost all waves in our
panel and have the advantage that the degree of disability, measured in percentage points, is,
at least in Germany, officially defined and assessed by external administrators. As there are
financial and social advantages from being recognized as ‘disabled’, there is a strong
economic incentive to report even minor disabilities, also for ‘optimistic’ persons. In
Germany, disabilities may include not only physical impairment, but also mental diseases.
Information on body weight and (mostly time-invariant) height constitute the main
components for the BMI (Body Mass Index), which are available for the years 2002 and 2004
only. For this reason, only the first differencing estimation strategy can be applied as argued
in the preceding section.
The results are reported in Table 6. Controlling for unobservable personal characteristics
through inclusion of individual fixed effects, a lower level of job satisfaction appears
significantly negatively related with the probability of being severely disabled (column 1). In
other words, individuals who are more satisfied with their work are less likely to be an
officially recognized disabled person – by 1.2 percentage points.22 In addition, higher levels of
job satisfaction are also negatively associated with the degree of disability, ranging from zero
(not disabled) to 100% (fully disabled), albeit with a small marginal effect as indicated by the
22 Marginal effect is calculated based on a logit fixed effects estimation without clustering by individuals.
19

size of the coefficient.23 Thus, we observe a positive relationship between job satisfaction and
physical or mental health that is not driven by personality traits such as negative or positive
affectivity.24
Turning to the estimation with the difference in dichotomously measured disability status
between period t and the preceding period t-1 as the dependent variable, we observe no
significant impact of a change in job satisfaction over time with a change in health (column
3).25 In contrast, employing the change in the continuously coded degree in disability (column
4), we find that an improvement in job satisfaction exerts a contemporaneous, beneficial,
health improving influence; an improvement by one category over time is associated with a
lower degree of 0.12 percentage points of disability.26
However, estimating the same model for the subpopulations of workers younger than 25
and male workers younger than 55 renders the coefficients on the change in job satisfaction
independently and jointly insignificant. In contrast, the disability-reducing effect of the level
of job satisfaction is also observable in the male worker group below early retirement age of
55 (while no significance can be detected in the young workers’ sample). Further analysis
indicates that the effect of the change in the total population is driven by female workers and
those male workers who are older than 55 years, who are both more likely to leave the labour
force in case their health state does not improve or worsens. Thus, although levels of job
satisfaction and degree of disability appear robustly related, no such statement can be made
for changes therein.
Finally, we also analyzed changes in weight and BMI using the difference model
(equation (3)). Table 7 column 1 reports the results for changes in body weight (measured in
23 An increase of job satisfaction by one category out of available ten would decrease the degree of disability
by 0.2 percentage point. 24 The health improving effect on the probability of being disabled remains when job satisfaction is lagged by
one period (at the 5% level), while the degree of disability appears now only weakly affected (10% level). 25 Assuming a non-linear functional form does not alter the main finding. 26 The health improving effect for changes in being disabled or the degree of disability appears unrelated to
changes in job satisfaction when lagged by one period.
20

kilograms) and column (2) those for changes in BMI (calculated as height divided by squared
body weight). In both cases, the change in job satisfaction does not appear to exert any
decisive impact on changes in any of these two objective measures of physical health. 27
However, the results for the BMI are sensitive to using a different definition of deviations
from the normal body mass. More specifically, constructing two categorical measures of
‘having normal weight’ and ‘having abnormal weight’ (BMI2 and BMI3) based on the
cardinal BMI variable and calculating the differences, yields a different picture. In the first
case (change in BMI2), reported in columns 3 and 4, the outcome (-1) indicates that body
weight has been reduced, while outcome (1) reflects the case in which the respondent’s weight
has substantially increased. The coefficient estimates and their marginal effects (based on
multinomial logit) in column (3) show that a positive change by one category in job
satisfaction significantly lowers the probability of a weight loss by almost 0.3 percentage
points (at the 1% level), while the probability of a weight gain is not affected. This result is
difficult to interpret, as a decrease in weight occurs both in case when an overweight person
looses weight (0 - 1 = -1) as well as in case when a person develops an underweight problem
(-1 - 0 = -1). Thus, it is not clear whether job satisfaction prevents employees from developing
dangerous underweight or prevents workers from undertaking a health-improving diet.28
We therefore also analyzed the impact of changes in job satisfaction on a change in BMI
(measured by BMI3) where the outcome (0) indicates that the respondent always had normal
weight in the two observational periods, (-1) that she returned from having a weight problem
(in either direction) to normal weight again, and (1) that she developed an abnormal weight
between periods 2004 and 2002. The regression results in columns (5) and (6) imply that
positive changes in job satisfaction lower the probability of returning to normal weight
27 These results are independent of the assumed functional form of job satisfaction or lagging it by one year. 28 It has been argued that this result might reflect that changes in mood and weight losses are both triggered by
the unobservable ‚cancer risk’ or, more specifically, symptoms of early stages of cancer development. In response, the estimation strategy implicitly controls also for ‚genetic disposition’ to develop any disease, and the ‚job satisfaction’ question attempts to capture long-term effects that are not driven by mood or moodiness.
21
(outcome (-1)) again by 0.03 percentage points, as the marginal effects indicate. On the other
hand, no significant impact on developing a weight problem is observable.29 Combining the
last two findings for BMI2 and BMI3, it appears that improvements in job satisfaction make
adjustments to normal weight through weight losses less likely. In other words, happier but
overweight workers do not appear to undertake a (from a health economists’ perspective)
necessary diet during the same time period, or are less likely to complete such with success.
5. Conclusions
This paper analyzes the impact of job satisfaction on the health of persons active in the labour
market using a national German panel dataset (German Socio-Economic Panel, GSOEP). The
initial analysis uses both subjective and objective health measures. In addition, the study also
investigates both the effect of levels of and changes in job satisfaction on (changes in) health.
Using data from the 1992 – 2005 waves, we show that self-reported measures of health
(such as health status and health satisfaction) are positively influenced by job satisfaction,
both for levels as well as changes. Admittedly, even though knowing what effects job
satisfaction has on self-reported health is important (Burke et al., 1993), this relationship may
be partly driven by personal traits like negative affectivity. If so, this problem would probably
be best tackled by using objective measures of health or taking mood factors directly into
account. In the model estimated with GSOEP panel data, inclusion of individual fixed effects
or differencing them out allows us to control for potentially omitted unobservable personal
traits, such as psychic constitution or early childhood experiences. The results show an
unambiguously increasing effect of job satisfaction on health. This result corresponds well to
29 Lagging the job satisfaction variable by one period shows the likelihood of a weight gain to be significantly
reduced (BMI2), while no effect is observable for the BMI3 measure. This differing outcome might well reflect the difference between contemporaneous and lagged effects of job satisfaction.
22
the numerous cross-sectional analyses on this topic. In consequence, qualitatively, omitted
variable bias in these cross-sectional studies does not appear to be a major problem.
With respect to more specific health problems, job satisfaction decreases the self-reported
impediment of the daily activity of climbing stairs and also lowers the likelihood of medical
treatment as measured by the self-report number of doctor visits or hospital stays, or sick
leaves from work. Most importantly, job satisfaction does not only prevent workers from
becoming disabled or from developing more severe forms of disability, but there is also some
evidence that improvements in job satisfaction over time exert a ‘healing’ effect with respect
to this more objective health measure. Interestingly, however, increases in job satisfaction
reduce the probability of a worker successfully combating a weight problem, potentially
through generating disincentives to do so, assuming that the decision to adjust weight is
rational and based on a cost-benefit analysis.
By controlling for individual heterogeneity, our results based on subjective health
measures offer a more convincing causal relationship between self-reported measures of job
satisfaction and employee health than previous cross-sectional studies. In addition, our
analysis reveals that this effect of job satisfaction goes beyond the influence on subjective
health assessments – the positive relationship also holds with more objective health measures
such as contacts with the healthcare system and sick leave from work. Moreover, for self-
reported impairment and officially recognized disability status, our results suggest that the
health-preserving impact of job satisfaction pertains not only to levels of health but also to
changes in health.
Although the approach taken in this paper provides a strong methodological improvement
over previous analyses that relied on cross-sections only, it does not correct for endogeneity
caused by time-varying factors that are related to health that can only be resolved using an
instrumental variable approach. Until this issue of causality is fully resolved, policy
recommendations can only be preliminary. However, our results strongly suggest that
23

anything that is conducive to job satisfaction, for example improvements in working
conditions, would be beneficial to health perceptions and accrual health state. Thus, in turn,
job satisfaction may impact not only on workers’ productivity, but would also come along
with large-scale cost savings in the healthcare sector, particularly, as our most sizeable effects
suggest, through lesser sick leaves from work and fewer contacts with the healthcare system.
24

References
Almada SJ, Zonderman AB, Shekelle RB, Dyer AR, Daviglus ML, Costa PT, Stamler J.
Neuroticism and Cynicism and Risk of Death in Middle-Aged Men: The Western
Electric Study, Psychosomatic Medicine 1991; 53: 165-175.
Brebner J, Donaldson J, Kirby N, Ward L. Relationships between personality and happiness.
Personality and Individual Differences 1995; 19: 251-258.
Brief AP, Burke MJ, George JM, Robinson BR, Webster J. Should negative affectivity remain
an unmeasured variable in the study of job stress? Journal of Applied Psychology 1988;
73: 193-198.
Burke MJ, Brief AP, George JM. The role of negative affectivity in understanding relations
between self-reports of stressors and strains: a comment on the applied psychology
literature. Journal of Applied Psychology 1993; 78: 402-412.
Cheng H, Furnham A. Attributional Style and Personality as Predictors of Happiness and
Mental Health. Journal of Happiness Studies 2001; 2: 207-327.
Clark AE. What really matters in a job? Hedonic measurement using quit data. Labour
Economics 2001; 8: 223-242.
Clark AE. Job satisfaction and gender: Why are women so happy at work? Labour Economics
1997; 4: 341-372.
Clark AE, Georgellis Y, Sanfey P. Job satisfaction, wage changes and quits: Evidence from
Germany. Research in Labor Economics 1998; 17: 95-121.
Clark AE, Oswald AJ. Satisfaction and comparison income. Journal of Public Economics
1996; 61: 359-381.
Clark AE, Oswald AJ, Warr PB. Is job satisfaction U-shaped in age? Journal of Occupational
and Organizational Psychology 1995; 6: 57-81.
25

Clarke, KA. The Phantom Menace: Omitted Variable Bias in Econometric Research. Conflict
Management and Peace Science 2005; 22: 341–352.
Costa PT. Influence of the normal personality dimension of neuroticism on chest pain
symptoms and coronary artery disease. American Journal of Cardiology 1987; 60: 20J-
26J.
Ferrer-i-Carbonell, A, Frijters, P. How Important is Methodology for the Estimates of the
Determinants of Happiness? The Economic Journal 2004; 114: 641-659.
Fischer, J.A.V. and Sousa-Poza, Alfonso (2007). Personality, job satisfaction and health – the
mediating influence of affectivity. University of St. Gallen Working Paper 2007-31.
Faragher BE, Cass M, Cooper CL. The relationship between job satisfaction and health: A
meta-analysis. Occupational and Environmental Medicine 2005; 62: 105-112.
Freeman RB. Job satisfaction as an economic variable. American Economic Review 1978; 68:
135-141.
Hamermesh DS. The changing distribution of job satisfaction. Journal of Human Resources
2001; 36: 1-30.
Hemingway, H, Shipley, MJ, Stansfeld, S, Marmot M. Sickness absence from back pain,
psychosocial work characteristics and employment grade among office workers.
Scandinavian Journal of Work, Environment & Health 1997; 23:121-9.
Kohler T, Scherbaum N, Richter R, & Bottcher S. The relationship between neuroticism and
blood pressure reexamined. Psychotherapy and Psychosomatics 1993; 60: 100-105.
Lonigan CJ, Carey MP, Finch AJ Jr, Anxiety and depression in children and adolescents:
negative affectivity and the utility of self-reports. Journal of Consulting and Clinical
Psycholology 1994; 62: 1000-8.
OECD. Income-Related Inequalities in the Use of Medical Care in 21 OECD Countries.
OECD Health Working Papers 2004; No. 14.
26

Schmidt, SR. Long-run trends in workers' beliefs about their own job security: Evidence from
the General Social Survey. Journal of Labor Economics 1999; 17: S127-S141.
Sousa-Poza A, Sousa-Poza AA. Gender differences in job satisfaction in Great Britain, 1991-
2000: Permanent or transitory? Applied Economics Letters 2003; 10: 691-694.
Sousa-Poza A, Sousa-Poza AA. Taking another look at the gender/job-satisfaction paradox.
Kyklos 2000a; 53: 135-152.
Sousa-Poza A, Sousa-Poza AA. Well-being at work: A cross-national analysis of the levels
and determinants of job satisfaction. Journal of Socio-Economics 2000b; 29: 517-538.
Sousa-Poza A, Sousa-Poza AA. The effect of job satisfaction on labor turnover by gender: an
analysis for Switzerland. Journal of Socio-Economics 2007 (forthcoming).
Stock, J.H., Watson, M.W. (2006). Heteroskedasticity-Robust Standard Errors for Fixed
Effects Panel Data Regression, NBER Technical Working Paper No. 323.
Stansfeld, SA, Bosma, H, Hemingway, H, Marmot, MG. Psychosocial Work Characteristics
and Social Support as Predictors of SF-36 Health Functioning: The Whitehall II Study.
Psychosomatic Medicine 1998; 60: 247-255.
Stansfeld, SA, Fuhrer, R, Head, J, Ferrie, J, Shipley. Work and psychiatric disorder in the
Whitehall II Study. Journal of Psychosomatic Research 1997; 43: 73-81.
Spector PE. Job Satisfaction: Application, Assessment, Causes, and Consequences. SAGE
Publications: Thousand Oaks, 1997.
Swinnerton, KA, Wial H. Is job stability declining in the US economy? Industrial and Labor
Relations Review 1995; 48: 293-304.
Tsang MC, Rumberger RW, Levin H M. The impact of surplus schooling on worker
productivity. Industrial Relations 1991; 30: 209-228.
Wagner, G, Burkhauser, RV, and Behringer, F. The English Language Public Use File of the
German Socio-Economic Panel Study. The Journal of Human Resources 1993, 28: 429-
433.
Wanner, E. Preface to the special issue on 'Changes in Job Stability and Job Security'. Journal
of Labor Economics 1999; 17: Siii-Siv.
27

Watson D, Pennebaker, JW. Health complaints, stress, and distress: Exploring the central role
of negative affectivity. Psychological Review 1998; 96: 234-254.
Watson D, Clark LA, Carey G. Positive and negative affect and their relation to anxiety and
depressive disorders. Journal of Abnormal Psychology 1988; 97: 346-353.
Winkelmann R, Zimmermann KF. Is job stability declining in Germany? Evidence from count
data models. Applied Economics 1998; 30: 1413-1420.
28

Appendix
Table A1: Description of variables
Variable Definition
Health variables
Satisfaction with health status Satisfaction of respondent with her health, on a categorical scale from 0 (low) to 10 (high), categorical variable.
Self-assessed health status Subjective assessment of health status in 5 categories. Ranging from ‘bad’ (lowest category), ‘poor’, ‘good’, ‘satisfactory’, to ‘very good’ (highest category).
Number of annual doctor visits
Continuous variable from 0 to 360 measuring the number of doctor consultations in a year.
Number of inpatient nights in hospital
Continuous variable from 0 to 243 measuring the number of inpatient nights in hospital in a year.
Number of work accidents that required treatment
Dichotomous variable: ‘1’ indicates ‘one accident’, and ‘0’ ‘no accident’.
Inpatient treatment Dichotomous variable: ‘1’ indicates ‘yes’, and ‘0’ ‘no’.
Number of days sick leave Continuous variable from 0 to 366 measuring the number of days the respondent was on sick leave in a year.
Sick leave exceeding 6 weeks Categorical variable measuring absence due to sick leave lasting more than six weeks, with ‘0’ indicating ‘no’, ‘1’ ‘once’, and ‘2’ ‘several times’.
Troubles climbing stairs Dichotomous variable: ‘1’ indicates ‘yes’, and ‘0’ ‘no’.
Being disabled Dichotomous variable: ‘1’ indicates ‘yes’, and ‘0’ ‘no’.
Degree of disability Officially recognized degree of disability (physical and/or mental) ranging from 0 to 100 percent.
Weight Weight of respondent measured in kilograms, ranging from 37 kg to 185 kg.
BMI BMI is defined as height (in m) divided by weight squared (in kg).
BMI2 BMI2 takes on the value of ‘0’ if the BMI indicates a normal weight, ‘1’ overweight (BMI > 30) and ‘-1’ underweight (BMI < 18.5).
BMI3 BMI3 takes on the value of ‘1’ if the respondent deviates strongly from the normal weight in any direction (based on BMI2), and ‘0’ otherwise.
Explanatory variables
Job satisfaction Satisfaction of respondent with her work, from a scale 0 (low) to 10 (high), categorical variable.
Age Age of respondent, continuous variable between 16 and 60.
Married Married person, dichotomous variable.
Widowed Widowed person, dichotomous variable.
Divorced Divorced person, dichotomous variable.
Separated Separated person, dichotomous variable.
Household income (ln) Monthly household net income, continuous variable.
29
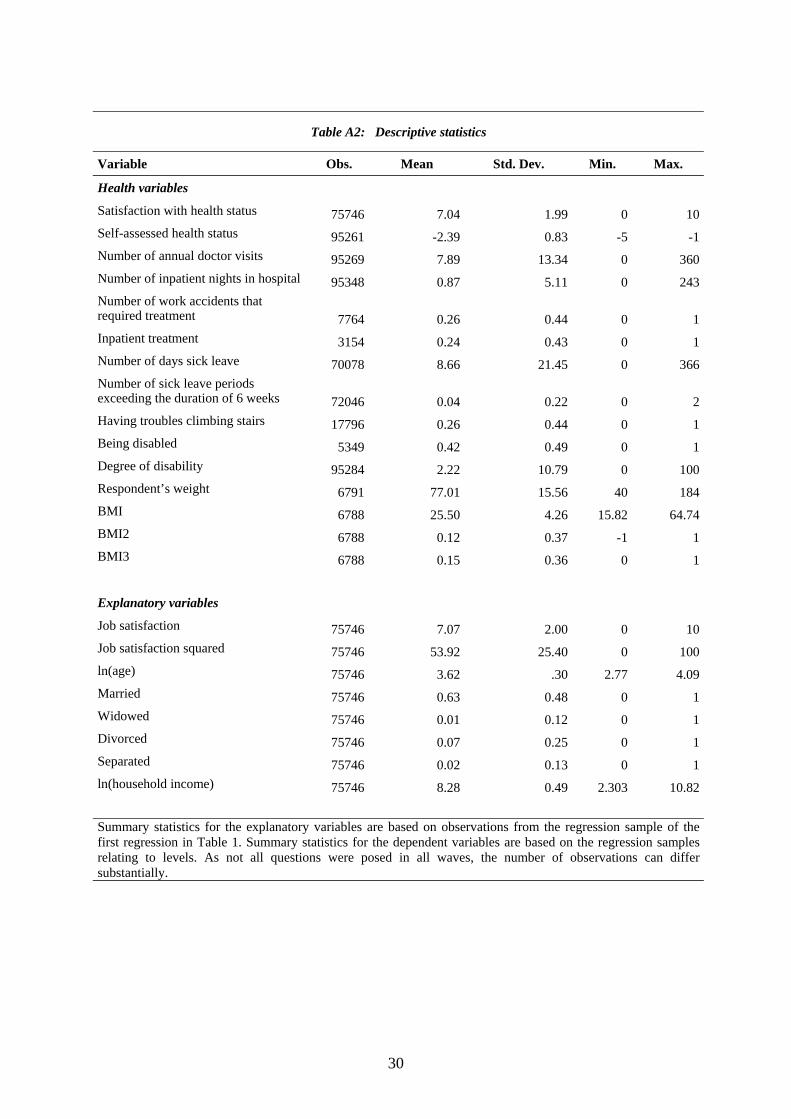
Table A2: Descriptive statistics
Variable Obs. Mean Std. Dev. Min. Max.
Health variables
Satisfaction with health status 75746 7.04 1.99 0 10Self-assessed health status 95261 -2.39 0.83 -5 -1Number of annual doctor visits 95269 7.89 13.34 0 360Number of inpatient nights in hospital 95348 0.87 5.11 0 243Number of work accidents that required treatment 7764 0.26 0.44 0 1Inpatient treatment 3154 0.24 0.43 0 1Number of days sick leave 70078 8.66 21.45 0 366Number of sick leave periods exceeding the duration of 6 weeks 72046 0.04 0.22 0 2Having troubles climbing stairs 17796 0.26 0.44 0 1Being disabled 5349 0.42 0.49 0 1Degree of disability 95284 2.22 10.79 0 100Respondent’s weight 6791 77.01 15.56 40 184BMI 6788 25.50 4.26 15.82 64.74BMI2 6788 0.12 0.37 -1 1BMI3 6788 0.15 0.36 0 1
Explanatory variables
Job satisfaction 75746 7.07 2.00 0 10Job satisfaction squared 75746 53.92 25.40 0 100ln(age) 75746 3.62 .30 2.77 4.09Married 75746 0.63 0.48 0 1Widowed 75746 0.01 0.12 0 1Divorced 75746 0.07 0.25 0 1Separated 75746 0.02 0.13 0 1ln(household income) 75746 8.28 0.49 2.303 10.82 Summary statistics for the explanatory variables are based on observations from the regression sample of the first regression in Table 1. Summary statistics for the dependent variables are based on the regression samples relating to levels. As not all questions were posed in all waves, the number of observations can differ substantially.
30

Tables
Table 1: Satisfaction with own health status
Levels Changes (1) (2) (3) (4) (5) (6)
Full sample Men below
55 25 year
olds Full sample Men below
55 25 year
olds Satisfaction with work / ∆ 0.152** 0.154** 0.154* 0.201** 0.183** 0.121 [7.20] [5.18] [2.56] [8.56] [5.45] [1.83] Job satisfaction squared / ∆ 0.009** 0.010** 0.007 0.005** 0.008** 0.010* [5.85] [4.58] [1.63] [3.00] [3.05] [2.07] ln (age) / ∆ 0.778* 0.365 -0.587 2.025** 1.558 -4.166 [2.24] [0.74] [0.18] [3.35] [1.76] [0.98] ln (household income)/ ∆ -0.007 -0.001 0.073 0.015 0.046 0.086 [0.29] [0.02] [1.11] [0.48] [1.11] [1.11] Married / ∆ -0.061 -0.006 0.104 -0.105 -0.011 0.045 [1.41] [0.10] [0.72] [1.70] [0.13] [0.26] Widowed/ ∆ -0.178 -0.598 . -0.430* -0.971* . [1.24] [1.65] . [1.99] [2.18] . Divorced/ ∆ -0.058 -0.054 0.029 -0.055 0.014 -0.839* [0.87] [0.60] [0.07] [0.62] [0.12] [1.98] Separated/ ∆ -0.014 -0.003 -0.056 -0.03 0.042 0.094 [0.19] [0.03] [0.13] [0.32] [0.34] [0.16] Constant 2.41 4.184* 7.332 -0.065* -0.123** 0.354 [1.84] [2.35] [0.68] [2.25] [3.09] [1.60] Observations 75746 38849 9706 53740 27967 5194 Number of Persons 17423 8763 3882 13252 6779 2297 F-statistics / Wald-statistics 217.258 129.092 22.215 2182.548 1270.471 244.236 (p-value) 0.00 0.00 0.00 0.00 0.00 0.00 F-test / Wald-test on joint sign. of job satisfaction variables 1483.85 865.47 161.66 2182.548 1270.471 244.236 (p-value) 0.00 0.00 0.00 0.00 0.00 0.00 Satisfaction variable significant in parsimonious model Yes Yes Yes Yes Yes Yes Notes: Dependent variable: satisfaction with own health ranked on a scale from 0 (low) to 10 (high). FGLS estimation with fixed effects and clustering at the individual level. Robust t-statistics in brackets. * significant at 5%; ** significant at 1%, Coefficients on year fixed effects are not reported.
31

Table 2: Self-assessed health status
Levels Changes (1) (2) (3) (4) (5) (6)
Full sample Men below
55 25 year
olds Full sample Men below
55 25 year
olds Satisfaction with work / ∆ 0.029** 0.028** 0.060** 0.022** 0.019 0.047 [4.31] [3.05] [2.89] [2.69] [1.74] [1.88] Job satisfaction squared / ∆ 0.003** 0.003** 0.000 0.003** 0.003** 0.001 [5.06] [4.21] [0.11] [4.17] [3.66] [0.50] ln (age) / ∆ 0.631** 0.214 -1.783 0.386 -0.187 -1.996 [4.92] [1.18] [1.35] [1.54] [0.51] [1.10] ln (household income) / ∆ 0.006 -0.008 0.012 -0.002 -0.002 -0.011 [0.60] [0.63] [0.52] [0.15] [0.13] [0.38] Married / ∆ -0.027 -0.035 0.047 0.018 0.007 0.131 [1.62] [1.63] [0.85] [0.73] [0.21] [1.55] Widowed / ∆ -0.058 -0.250* . -0.028 -0.294* . [1.05] [2.41] . [0.37] [2.09] . Divorced / ∆ -0.023 -0.048 0.14 0.037 0.028 0.403 [0.93] [1.43] [1.26] [1.01] [0.59] [1.88] Separated / ∆ 0.023 0.000 -0.114 0.069 0.077 0.005 [0.85] [0.01] [0.58] [1.80] [1.52] [0.02] Constant -5.301** -3.584** 3.223 -0.036** -0.040* 0.061 [10.91] [5.24] [0.73] [2.90] [2.26] [0.64] Observations 95261 48034 11797 65332 33178 5915 Number of Persons 18832 9419 4566 14124 7057 2527 F-statistics / Wald-statistics 168.35 99.52 16.57 844.121 483.459 143.759(p-value) 0.000 0.000 0.000 0.000 0.000 0.000 F-test/Wald-test on joint significance of job satisfaction variables 732.967 412.779 84.902 767.446 440.092 108.677(p-value) 0.00 0.00 0.00 0.00 0.00 0.00 Satisfaction variable significant in parsimonious model Yes Yes Yes Yes Yes Yes Notes: Dependent variable: Current Self-rated health status measured in 5 categories (‘-5’ “bad” to ‘-1’ “very good”) (original values recoded). FGLS estimation with individual fixed (levels) or random (changes) effects. Observations are clustered by person ID. Robust t-statistics in brackets. * significant at 5%; ** significant at 1%, Coefficients on year fixed effects are not reported.
.
32

Table 3: Contacts with the health services and illness at work place (levels)
(1) (2) (3) (4) (5) (6)
number of annual
doctor visits
inpatient nights
in hospital
work accidents required treatment
in patient treatment
number of days
sick leave
sick leaves exceeding 6 weeks
Satisfaction with work -0.609** -0.05 -0.053 -0.054 -1.207** -0.008** [4.05] [0.90] [0.77] [0.50] [3.06] [2.70] Job satisfaction squared 0.018 0.000 0.001 0.001 0.057* 0.000 [1.59] [0.02] [0.10] [0.10] [2.02] [1.67] ln(age) -12.629** -4.242** -2.452 -5.407 -30.082** -0.172** [6.22] [4.90] [1.53] [1.41] [6.53] [3.58] ln (household income) -0.420* -0.161 0.093 -0.118 -0.580 -0.005 [2.53] [1.86] [0.80] [0.62] [1.86] [1.44] Married 0.842** 0.03 0.162 0.339 0.497 -0.006 [2.74] [0.26] [0.85] [0.85] [1.08] [1.24] Widowed 1.629 0.017 1.238* -0.918 0.916 -0.043 [1.57] [0.05] [2.20] [0.89] [0.30] [1.56] Divorced 0.951* 0.081 0.735** -0.831 -0.164 -0.002 [1.98] [0.40] [2.64] [1.57] [0.19] [0.20] Separated 1.00 -0.019 0.525 0.618 0.413 -0.006 [1.92] [0.07] [1.62] [1.07] [0.42] [0.54] Constant 61.572** 18.382** 131.655** 0.784** [7.92] [5.27] [7.46] [4.27] Observations 95269 95348 7764 3154 70078 72046 Number of Persons 18838 18837 1472 659 14663 14800 F-statistics / Wald-statistics 15.34 3.20 35.35 21.40 5.82 7.19 (p-value) 0.00 0.000 0.001 0.065 0.00 0.00 F-test / Wald-test on joint sign. of job satisfaction variables 76.56 7.90 7.00 2.41 19.3 13.21 (p-value) 0.00 0.00 0.03 0.30 0.00 0.00 Satisfaction variable significant in parsimonious model Yes Yes Yes No Yes Yes Notes: FGLS and/or conditional logit estimation with fixed effects and clustering at the individual level. Significant at 5%; ** significant at 1%, Robust t(z)-statistics in brackets. Coefficients on year fixed effects are not reported.
33

Table 4: Contacts with the health services and illness at work place (changes)
(1) (2) (3) (4) (5) (6)
number of annual
doctor visits
inpatient nights
in hospital
work accidents required treatment
in patient treatment
number of days
sick leave
sick leaves exceeding 6 weeks
∆ Satisfaction with work -0.551** 0.027 -0.009 -0.002 -1.175** -0.007* [2.94] [0.43] [1.95] [0.34] [2.80] [2.07] ∆ Job satisfaction squared 0.021 -0.004 0.001 0.000 0.075* 0.000 [1.49] [0.77] [1.62] [0.04] [2.44] [1.67] ∆ ln(age) -16.083** -1.216 0.245 -0.090 -29.969** -0.173 [3.63] [0.48] [1.37] [0.81] [3.08] [1.84] ∆ ln (household income) -0.559* 0.017 0.004 -0.004 -0.548 0.000 [2.31] [0.18] [0.44] [0.70] [1.34] [0.03] ∆ Married 0.705 -0.196 -0.014 0.008 0.552 0.002 [1.72] [1.58] [0.82] [1.03] [0.78] [0.26] ∆ Widowed 1.436 -0.687 0.058 -0.105* -3.381 -0.089 [0.99] [1.20] [1.09] [1.97] [0.92] [1.93] ∆ Divorced -0.135 -0.124 -0.018 -0.012 -0.087 0.001 [0.20] [0.63] [0.79] [0.78] [0.06] [0.05] ∆ Separated 0.847 -0.041 0.023 0.023 1.593 0.012 [1.13] [0.15] [0.89] [1.41] [1.23] [0.80] Constant 0.850** -0.077 -0.006 0.004 2.193** 0.015** [3.44] [0.69] [0.89] [0.82] [4.04] [2.76] Observations 65398 65446 22304 20443 51630 54203 Number of Persons 14133 14136 7101 6017 11821 12053 F-statistics / Wald-statistics 163.40 15.93 19.21 20.68 52.15 38.54 (p-value) 0.00 0.59 0.08 0.05 0.00 0.003 F-test / Wald-test on joint sign. of job satisfaction variables 52.92 2.40 5.16 2.82 10.72 6.67 (p-value) 0.00 0.30 0.08 0.24 0.00 0.04 Satisfaction variable significant in parsimonious model Yes No Yes No Yes Yes
5 % level Notes: FGLS random effects estimation with clustering at the individual level. Significant at 5%; ** significant at 1%, Robust t(z)-statistics in brackets. Coefficients on year fixed effects are not reported.
34

Table 5: Problems with climbing stairs
(1) (2) (3) level changes improvement worsening outcome (0/1) outcome (-1) outcome (1) Satisfaction with work / ∆ -0.261** 0.017 -0.058** [16.85] [0.72] [2.77] ln (age) / ∆ 2.955** -18.335** -20.065** [17.93] [2.79] [3.45] ln (household income) / ∆ -0.560** -0.112 0.011 [7.72] [0.70] [0.08] Married / ∆ 0.335** -0.278 0.001 [3.26] [0.59] [0.00] Widowed / ∆ 0.658* -0.146 -0.248 [2.23] [0.13] [0.22] Divorced / ∆ 0.062 0.561 0.209 [0.42] [0.80] [0.35] Separated / ∆ 0.038 -0.289 -0.017 [0.17] [0.47] [0.03] Constant -6.740** -1.766** -1.451** [8.79] [10.35] [9.63] Observations 17796 6437 Number of Persons 10944 6437 F-statistics / Wald-statistics 823.28 32.591 (p-value) 0.00 0.003 Satisfaction variable significant in parsimonious model Yes No Yes Notes: Logit random effects (column (1)) and multinomial logit estimation (columns (2) and (3). * significant at 5%; ** significant at 1%, Robust t(z)-statistics in brackets. Coefficients on year fixed effects are not reported.
35

Table 6: Objective measures of health: disability
(1) (2) (3) (4) level Change
being disabled degree of disability
being disabled
degree of disability
Satisfaction with work / ∆ -0.203* -0.214** -0.003 -0.121* [2.47] [3.02] [1.58] [2.05] Job satisfaction squared / ∆ 0.009 0.012* 0.00 0.007 [1.24] [2.16] [1.30] [1.58] ln (age) / ∆ -9.285** -17.303** -0.399** -16.523** [2.78] [10.58] [8.54] [9.07] ln (household income) / ∆ -0.27 -0.267** -0.001 -0.017 [1.36] [3.05] [0.30] [0.21] Married / ∆ 0.162 0.151 0.004 0.145 [0.36] [1.07] [0.88] [0.94] Widowed / ∆ 0.226 -0.117 0.001 -0.477 [0.18] [0.14] [0.04] [0.36] Divorced / ∆ 0.537 0.192 0.020* 0.697* [0.93] [0.75] [2.33] [2.30] Separated / ∆ 0.227 0.23 0.004 0.207 [0.37] [0.82] [0.50] [0.86] Constant 71.369** 0.013** 0.614** [11.18] [5.36] [6.93] Observations 5349 95284 65513 65377 Number of Persons 697 18837 14142 14133 F-statistics / Wald-statistics 250.578 15.816 100.781 94.558 (p-value) 0.00 0.00 0.00 0.00 F-test / Wald-test on joint sign. of job satisfaction variables 20.529 10.621 3.482 8.379 (p-value) 0.00 0.00 0.17 0.01 Satisfaction variable significant in parsimonious model Yes Yes Yes Yes 5% level Notes: Conditional logit or FGLS estimation with individual fixed effects (levels). FGLS random effects (changes). Observations are clustered by person ID. * significant at 5%; ** significant at 1%, Robust t(z)-statistics in brackets. Coefficients on year fixed effects are not reported.
36

Table 7: Objective measures of health: BMI
(1) (2) (3) (4) (5) (6) Changes weight BMI BMI2 BMI3
Outcome
(-1) Outcome (1) Outcome
(-1) Outcome (1)
weight
loss weight gain
returning to normal
weight deviation
from normal weight ∆ Satisfaction with work 0.043 0.018 -0.116** -0.051 -0.107** -0.047 [1.13] [1.36] [2.79] [1.66] [2.86] [1.44] ∆ ln(age) 44.069** 13.588** -20.790 13.042 26.150** -17.948 [4.46] [4.01] [1.71] [1.72] [2.93] [1.94] ∆ ln (household income) -0.163 -0.085 0.083 0.261 0.275 0.143 [0.64] [0.97] [0.29] [1.28] [1.11] [0.64] ∆ Married 0.735 0.229 -0.319 -0.006 0.202 -0.501 [1.13] [1.03] [0.38] [0.01] [0.36] [0.74] ∆ Widowed -2.19 -0.667 1.315 1.041 1.889 0.600 [1.08] [0.96] [0.96] [0.88] [1.55] [0.47] ∆ Divorced -1.165 -0.430 2.417* -0.231 1.827 0.275 [1.09] [1.17] [2.18] [0.28] [1.82] [0.28] ∆ Separated -0.574 -0.195 1.214 -0.821 0.811 -0.167 [0.62] [0.62] [1.31] [1.04] [0.97] [0.20] Constant -0.182 -0.033 -3.150** -3.326** -4.180** -2.630** [0.69] [0.36] [10.10] [15.94] [16.44] [11.05] Observations 6378 6375 6375 6375 Number of Persons 6378 6375 6375 6375 F-statistics / Wald-statistics 4.393 3.846 33.687 31.74 (p-value) 0.00 0.00 0.002 0.004 Satisfaction variable significant in parsimonious model No No Yes No Yes No Notes: BMI is defined as height (in m) divided by weight squared. BMI2 takes on the value of ‘0’ if the BMI indicates a normal weight, ‘1” overweight (BMI > 30) and ‘-1’ underweight (BMI < 18.5). BMI3 takes on the value of ‘1’ if the respondent deviates strongly from the normal weight in any direction (based on BMI2), and ‘0’ otherwise. The change variables based on BMI, BMI2, and BMI3 take then on the values (-1), (0) and (1) accordingly. OLS and/or multinomial logit estimation. * significant at 5%; ** significant at 1%, Robust t(z)-statistics in brackets.
37