does innovation promote economic growth? evidence from
TRANSCRIPT

RESEARCH Open Access
Does innovation promote economicgrowth? Evidence from European countriesRana P. Maradana, Rudra P. Pradhan*, Saurav Dash, Kunal Gaurav, Manju Jayakumar and Debaleena Chatterjee
* Correspondence:[email protected] Gupta School ofManagement, Indian Institute ofTechnology, Kharagpur 721302,India
Abstract
The paper examines the long-run relationship between innovation and per capitaeconomic growth in the 19 European countries over the period 1989–2014. Thisstudy uses six different indicators of innovation: patents-residents, patents-non-residents, research and development expenditure, researchers in research anddevelopment activities, high-technology exports, and scientific and technical journalarticles to examine this long-run relationship with per capita economic growth.Using cointegration technique, the study finds evidence of long-run relationshipbetween innovation and per capita economic growth in most of the cases, typicallywith reference to the use of a particular innovation indicator. Using Granger causalitytest, the study finds the presence of both unidirectional and bidirectional causalitybetween innovation and per capita economic growth. These results vary fromcountry to country, depending upon the types of innovation indicators that we usein the empirical investigation process. Most importantly, the study finds that all theseinnovation indicators are considerably linked with per capita economic growth.This particular linkage is either supply-leading or demand-following in someoccasions, while it is the occurrence of both in some other occasions. The policyimplication of this study is that countries should recognize the differences ininnovation and per capita economic growth in order to maintain sustainabledevelopment in these countries.
Keywords: Innovation, Per capita economic growth, Cointegration, Grangercausality, European countries
JEL Classification: O43, O16, E44
Background
Why do some regions grow continuously for many years whereas others stagnate?
Why do some regions grow faster than others? The theoretical breakthrough in
answering these questions started by Solow (1956) and Romer (1990) has lost its
momentum, leaving some important questions unanswered. Following the
neoclassical growth and endogenous growth theories, technological advance is
believed to be the major driver of economic growth, yet how exactly new knowledge
translates into superior economic performance by regions was neither described by
the growth theories nor found unequivocal empirical explanation. Empirical studies,
lacking theoretical underpinnings, looked into networks (Wal and Boschma 2009),
Journal of Innovation andEntrepreneurship
© The Author(s). 2017 Open Access This article is distributed under the terms of the Creative Commons Attribution 4.0 InternationalLicense (http://creativecommons.org/licenses/by/4.0/), which permits unrestricted use, distribution, and reproduction in any medium,provided you give appropriate credit to the original author(s) and the source, provide a link to the Creative Commons license, andindicate if changes were made.
Maradana et al. Journal of Innovation and Entrepreneurship (2017) 6:1 DOI 10.1186/s13731-016-0061-9

labour mobility (Almeida and Kogut 1999), and other potential facilitators of
spillovers (Tsvetkova 2015).
In the recent years, both researchers and policymakers have increasingly paid attention
to investigate the link between innovation, entrepreneurship, and regional outcomes
(Galindo and Mendez-Picazo 2014; Grossman 2009; Howells 2005; Malerba and Brusoni
2007; Tsvetkova 2015; Wang et al. 2005). However, in this paper, we specifically1 look into
the linkage between innovation2 and economic growth in the selected European coun-
tries. Innovation is considered as one of the key drivers of the economy (Andergassen et
al. 2009; Bae and Yoo 2015; Mansfield 1972; Nadiri 1993; Romer 1986; Santacreu 2015;
Solow 1956), particularly since the seminal work of Schumpeter3 (1911). It affects the
economy in multiple channels, such as economic growth, global competitiveness, fi-
nancial systems, quality of life, infrastructure development, employment, trade open-
ness, and hence, spawns high economic growth.4 All these above studies mostly focus
on the impact of innovation towards economic growth, indicating the supply-driven
approach of innovation-growth nexus. But in reality, it is the economic growth that
can also increase the level of innovation in the development process. That means there is
a feasibility of bidirectional causality between innovation and economic growth (Pradhan
et al. 2016). Hence, the main objective of this paper is to examine the bidirectional linkage
between innovation and economic growth. In sum, we would like to assess the import-
ance of innovation-economic growth linkage, by investigating whether the level of
innovation has contributed to economic growth, or whether the extension of the
innovation is simply a consequence of rapid economic growth.
In this paper, we utilize the Granger causality approach to examine the dynamics
between innovation and economic growth for a sample of 19 European countries.
The main contribution of the study is twofold. First, we specifically assess the import-
ance of innovation activities on economic growth, by investigating whether the
innovation activities have contributed to economic growth, or whether the expansion
of innovation activities are simply a consequence of rapid economic growth. The
Granger causality approach has been deployed to carry out this investigation.5 Second,
our data set is more recent and comprehensive (i.e. 1989–2014) in contrast to existing
studies.
The rest of the paper is sketched as follows. The “Theoretical basis and literature re-
view” section presents the theoretical basis and literature review. The “An outline of
innovation in the European countries” section summarizes the status of innovation in
the European countries. The “Proposed hypotheses, variables, data structure, and model”
section describes the proposed hypothesis, variables, data, and model. The “Results and
discussion” section presents the results and discussion. Finally, we summarize and con-
clude in the “Conclusion” section.
Theoretical basis and literature reviewFor linking the relationship between innovation activities and economic growth, we
draw upon the basic theory of endogenous technical change developed by Romer
(1990), Grossman and Helpman (1991), and Aghion and Howitt (1992). Our typical
version of this theory contains innovation activities which allow a specific entrepreneur
to produce one of many intermediate products at a cost temporarily lower than that of
Maradana et al. Journal of Innovation and Entrepreneurship (2017) 6:1 Page 2 of 23

his rivals. The extent of innovative activities undertaken by society commands the rate
of economic growth (see, for instance, Schumpeter (1912), King and Levine (1993),
Ulku (2004), Aghion et al. (2005)).
Literature specifies that innovation activities contribute to economic growth, both
directly and indirectly via other macroeconomic factors, see, for instance, Furman et al.
(2002), Hassan and Tucci (2010). But it is possible that innovation activities are also
equally affected by economic growth and other macroeconomic factors. That means, in
practice, both innovation activities and economic growth can cause each other and
therefore, there is the possibility of feedback relationship between the two. Previous
studies on this issue, in general, can be categorized in four different forms (Cetin 2013;
Pradhan et al. 2016), namely supply-leading hypothesis (SLH), demand-following
hypothesis (DFH), feedback hypothesis (FBH), and neutrality hypothesis (NLH). The
SLH shows unidirectional causality from innovation activities to economic growth
(see, for instance, Pradhan et al. (2016), Cetin (2013) Guloglu and Tekin (2012), Fan
(2011), Yang (2006)). The DFH reflects unidirectional causality from economic growth
to innovation activities (see, for instance, Pradhan et al. (2016), Sadraoui et al. (2014),
Cetin (2013), Sinha (2008), Howells (2005)). The FBH reveals the bidirectional causality
between economic growth and innovation activities (see, for instance, Pradhan et al.
(2016), Guloglu and Tekin (2012), Cetin (2013), Howells (2005)). Finally, the NLH
displays the independent relationship between economic growth and innovation activities
(see, for instance, Pradhan et al. (2016), Cetin (2013)). The aim of our study is to validate
these four hypotheses in the selected European countries—a group of countries that has
little attention in the literature.
An outline of innovation in the European countriesAs cited above, innovation and economic growth cause each other in the development
process (Agenor and Neanidis 2015; Aghion et al. 2010; Fan 2011). There are two ways
we can address the innovation-growth issue: first, the regional disparities of innovation
activities and economic growth in the European countries, and second, the causal link
between innovation and economic growth in these countries. This paper deals with
both issues. However, in this section, we address the disparity issue. Overall, innovation
can be represented in multiple ways (see, for instance, Pradhan et al. (2016)). Nonetheless,
we use six different types of innovation6 in this paper. These include number of patents-
residents (PAR), measured per thousand of population; number of patents-non-residents
(PAN), measured per thousand of population; research and development expenditure
(RDE), measured as a percentage of real gross domestic product; researchers in research
and development activities (RRD), measured per thousand population; high-technology
exports (HTE), measured as a percentage of real domestic product; and scientific and
technical journal articles (STJ), measured per thousand population. The detailed
descriptions of these six innovation indicators are available in Table 1.
Tables 2 and 3 provide the general status of innovation indicators in the European
countries, both individually and as a group. The status of innovation (PAR, PAN, RDE,
RRD, HTE, and STJ) in the European countries is noticed here during four different
time periods from 1989 to 20147 (see, Tables 2 and 3). These four periods are P1:
1989–2000, P2: 2001–2007, P3: 2008–2014, and P4: 1989–2014. The salient points of
this innovation status are as follows.
Maradana et al. Journal of Innovation and Entrepreneurship (2017) 6:1 Page 3 of 23

First, the status of patents-residents is relatively high in comparison to patents-non-
residents. This is true for most of the European countries and for all the four time
periods (P1–P4).
Second, the volume of patents-residents is relatively high in Germany, France, the
UK, and Italy, while it is considerably low in Belgium, Czech Republic, Greece, and
Portugal.
Third, the volume of patents-non-residents is considerably high in Germany, the UK,
France, and Norway, while it is relatively low in Belgium, Greece, Portugal, and
Romania.
Fourth, the level of research and development expenditure is legitimately high in
Sweden, Finland, Germany, France, Denmark, and the Netherlands, while it is relatively
low in Romania, Greece, Portugal, and Hungary.
Fifth, the level of researchers in research and development activities is fairly high in
Finland, Norway, Denmark, Ireland, and Sweden, while it is fairly low in Italy, Poland,
France, Germany, Spain, and Romania.
Sixth, the volume of high-technology exports is moderately high in Ireland, the
Netherlands, the UK, Finland, and Belgium, while it is noticeably low in Hungary,
Czech Republic, Poland, and Norway.
Seventh, the volume of scientific and technical journal articles is relatively high in
Sweden, Finland, Denmark, the UK, and the Netherlands, while it is considerably low
in Romania, Poland, Portugal, and Hungary.
The above observations are absolutely true for all the four time periods, i.e. P1
(1989–2000) to P4 (1989–2014). However, the overall trend has been increasing for all
the innovation indicators.
Methods of StudyIn this section, we empirically test the causality between innovation and per capita
economic growth. Specifically, the causality between innovation and per capita
economic growth can be addressed in four different ways: supply-leading hypothesis
of innovation-growth nexus, demand-following hypothesis of innovation-growth
nexus, feedback hypothesis of innovation-growth nexus, and neutrality hypothesis of
innovation-growth nexus. These are all clearly elaborated in the literature review
section.
Table 1 Definition of variables
Variable code Variable definition
GDP Per capita economic growth: expansion of a country’s economy, expressed in per capita grossdomestic product.
PAR Patents filed by residents: expressed in numbers per thousand population.
PAN Patents filed by non-residents: expressed in numbers per thousand population.
RDE Research and development expenditure: expressed as a percentage of real gross domesticproduct.
RRD Researchers in research and development activities: expressed in numbers per thousandpopulation.
HTE High-technology exports: expressed as a percentage of real gross domestic product.
STJ Scientific and technical journal articles: expressed in numbers per thousand population.
Variables above are defined in the World Development Indicators of World Bank
Maradana et al. Journal of Innovation and Entrepreneurship (2017) 6:1 Page 4 of 23

Figure 1 depicts the possible patterns of causal relations between innovation activities
and economic growth. We intend to test the following two hypotheses8:
H1A0 : Innovation activities do not Granger-cause per capita economic growth.
H1A1 : Innovation activities Granger-cause per capita economic growth.
H1B0 : Per capita economic growth does not Granger-cause innovation activities.
H1B1 : Per capita economic growth Granger-causes innovation activities.
The importance of this study is twofold: (a) we use a large sample of countries, from the
European Union, over a recent span of time, and (b) we use the sophisticated econometric
tools—and certain empirical approaches that have not been taken in these literature—to
answer questions concerning the nature of Granger causal relationship between
innovation and per capita economic growth, both in the short-run and long-run.
The inclusion of innovation as a determinant of economic growth (and vice versa) in
empirical research is its straightforward measurement. Researchers can use either the
input measures such as research and development expenditure (Goel and Ram 1994;
Griliches 1992; Griliches and Mairesse 1986; Mansfield 1972) or innovation outputs
such as patents (Audretsch and Feldman 1996; Bayoumi et al. 1999; Coe and Helpman
Table 2 Trend of Innovation (per thousand population) in European countries
Countries PAR PAN RDE
P1 P2 P3 P4 P1 P2 P3 P4 P1 P2 P3 P4
Austria 0.25 0.26 0.27 0.26 0.06 0.03 0.03 0.05 1.77 2.29 2.76 2.28
Belgium 0.07 0.05 0.06 0.06 0.04 0.02 0.01 0.03 1.87 1.90 2.12 1.95
Czech Republic 0.06 0.06 0.08 0.07 0.33 0.19 0.01 0.19 1.07 1.23 1.51 1.26
Denmark 0.25 0.32 0.27 0.28 0.14 0.03 0.03 0.08 1.99 2.49 2.99 2.53
Finland 0.44 0.38 0.32 0.39 0.38 0.04 0.02 0.20 2.93 3.43 3.77 3.38
France 0.22 0.22 0.22 0.22 0.06 0.05 0.03 0.05 2.18 2.15 2.23 2.18
Germany 0.48 0.59 0.58 0.54 0.11 0.14 0.16 0.13 2.32 2.51 2.83 2.55
Greece 0.02 0.04 0.06 0.04 0.02 0.01 0.01 0.01 0.53 0.58 0.68 0.59
Hungary 0.13 0.08 0.07 0.10 0.18 0.23 0.01 0.15 0.70 0.95 1.17 0.94
Ireland 0.23 0.21 0.14 0.20 0.35 0.02 0.01 0.18 1.22 1.19 1.64 1.33
Italy 0.13 0.16 0.14 0.15 0.01 0.01 0.01 0.15 1.02 1.11 1.25 1.13
Netherlands 0.14 0.13 0.15 0.14 0.04 0.03 0.02 0.03 1.96 1.89 1.92 1.91
Norway 0.26 0.25 0.23 0.25 1.04 1.08 0.32 0.88 1.63 1.59 1.67 1.62
Poland 0.08 0.06 0.09 0.08 0.06 0.09 0.01 0.05 0.66 0.57 0.74 0.64
Portugal 0.01 0.01 0.05 0.02 0.10 0.01 0.01 0.05 0.63 0.84 1.55 0.99
Romania 0.09 0.05 0.06 0.07 0.02 0.01 0.01 0.01 0.51 0.42 0.50 0.47
Spain 0.06 0.07 0.07 0.06 0.02 0.01 0.01 0.01 0.85 1.09 1.36 1.09
Sweden 0.43 0.33 0.24 0.35 0.10 0.06 0.03 0.07 3.52 3.70 3.50 3.59
United Kingdom 0.33 0.32 0.25 0.31 0.16 0.17 0.19 0.15 1.77 1.73 1.77 1.75
European panel# 3.68 3.59 3.35 3.59 3.22 2.23 0.93 2.47 1.49 1.66 1.93 1.80
PAR is number of patents by residents, PAN is number of patents by non-residents, and RDE is research and developmentexpenditure. P1 is 1989–2000, P2 is 2001–2007, P3 is 2008–2014, and P4 is 1989–2014#The figures are average of all 19 European countries
Maradana et al. Journal of Innovation and Entrepreneurship (2017) 6:1 Page 5 of 23

1995; Griliches 1990; Kim and Lee 2015; Maurseth and Verspagen 2002; Pradhan et al.
2016; Stokey 1995; Wang et al. 2005). But in this study, we deploy both types of
innovation indicators (input and output) to investigate the linkage between innovation
and economic growth.
On the empirical front, we use two variables: per capita economic growth (variable:
GDP9) and innovation (variable: INN10). Table 4 presents the descriptive statistics of
these innovation variables, particularly with reference to PAR, PAN, RDE, RRD, HTE,
and STJ.
We take the sample of 19 European countries11 to investigate the validity of two
hypotheses, namely H1A,B and H2A,B. The empirical investigation follows annual data
over the period 1989 to 2014 and was obtained from the World Development Indicators
of the World Bank. The study deploys cointegration and Granger causality (Granger
1988; 1986) to validate the above two null hypotheses (H1A0 and H1B
0 ). We have six
different cases to validate these two hypotheses, particularly with reference to six
different indicators of innovation. Case 1 deals with GDP and PAR, case 2 deals with
GDP and PAN, case 3 deals with GDP and RDE, case 4 deals with GDP and RRD, case
5 deals with GDP and HTE, and case 6 deals with GDP and STJ.
Following Holtz-Eakin et al. (1988), we use the succeeding regression models to
notice the long-run and short-run causal relationship between innovation and per
capita economic growth.
Table 3 Trend of innovation (per thousand population) in European countries
Countries RRD HTE STJ
P1 P2 P3 P4 P1 P2 P3 P4 P1 P2 P3 P4
Austria 0.29 0.41 0.51 0.45 24.7 49.1 48.7 36.9 0.43 0.57 0.59 0.50
Belgium 0.27 0.30 0.34 0.30 58.0 67.4 87.6 73.2 0.55 0.62 0.68 0.61
Czech Republic 0.12 0.19 0.27 0.19 0.88 2.56 4.79 2.84 0.23 0.30 0.39 0.30
Denmark 0.63 0.89 1.21 0.95 4.24 6.09 5.28 5.01 0.82 0.93 1.01 0.89
Finland 1.17 1.45 1.42 1.37 67.8 70.8 34.3 48.3 0.90 0.95 0.93 0.85
France 0.04 0.05 0.06 0.05 38.1 38.2 49.2 37.9 0.51 0.49 0.49 0.48
Germany 0.04 0.04 0.05 0.04 35.5 54.9 63.9 45.7 0.51 0.53 0.55 0.50
Greece 0.12 0.15 0.20 0.15 4.77 4.78 5.15 4.01 0.26 0.37 0.43 0.29
Hungary 0.11 0.15 0.21 0.16 0.57 0.24 0.64 0.44 0.19 0.24 0.24 0.22
Ireland 0.54 0.64 0.73 0.64 294.8 201.6 134.6 201.2 0.38 0.48 0.64 0.43
Italy 0.02 0.02 0.03 0.02 15.6 16.1 17.4 16.4 0.35 0.42 0.45 0.41
Netherlands 0.16 0.18 0.19 0.18 73.3 102.2 96.2 86.9 0.75 0.81 0.91 0.81
Norway 0.92 1.01 1.12 1.07 1.37 1.51 1.57 1.53 0.69 0.76 0.92 0.85
Poland 0.03 0.04 0.04 0.04 1.04 2.09 5.65 2.98 0.13 0.17 0.19 0.16
Portugal 0.14 0.20 0.41 0.24 8.51 15.5 10.4 11.9 0.14 0.27 0.40 0.26
Romania 0.05 0.04 0.04 0.05 4.70 3.22 6.10 4.59 0.04 0.04 0.07 0.05
Spain 0.04 0.05 0.06 0.05 11.3 10.5 11.8 11.1 0.34 0.41 0.47 0.41
Sweden 0.51 0.61 0.56 0.59 6.51 5.26 4.52 4.98 1.12 1.10 1.02 1.06
United Kingdom 0.04 0.06 0.06 0.06 68.9 60.1 34.7 54.1 0.80 0.76 0.74 0.77
European panel# 0.27 0.33 0.40 0.33 52.2 38.2 34.5 44.1 1.01 0.57 0.62 0.53
RRD is researchers in research and development activities, HTE is high-technology exports, and STJ is scientific and technicaljournal articles. P1 is 1989–2000, P2 is 2001–2007, P3 is 2008–2014, and P4 is 1989–2014#The figures are average of all 19 European countries
Maradana et al. Journal of Innovation and Entrepreneurship (2017) 6:1 Page 6 of 23

PAN
RDE
RRD
INN GDP
PAR
HTE
STJ
Fig. 1 Conceptual framework of the causality between innovation and per capita economic growth. Note1: GDP is per capita economic growth and INN is innovation and used as a proxy for PAR, PAN, RDE, RRD,HTE, and STJ. Note 2: PAR is number of patents by residents, PAN is number of patents by non-residents,RDE is research and development expenditure, RRD is the researchers in research and development activities,HTE is the high-technology exports, and STJ is the scientific and technical journal articles
Table 4 Descriptive statistics of the variables
Countries Variables
PAR PAN RDE RRD THE STJ
Austria −0.57/0.03 −1.44/0.07 0.38/0.06 −0.36/0.08 0.68/0.08 −0.24/0.02
Belgium −1.27/0.05 −1.81/0.13 0.29/0.02 −0.51/0.03 0.85/0.07 −0.20/0.03
Czech Republic −1.20/0.06 −0.10/0.73 0.08/0.06 −0.75/0.15 −0.69/0.30 −0.53/0.10
Denmark −0.53/0.04 −1.50/0.08 0.40/0.07 −0.04/0.11 −0.25/0.06 −0.03/0.03
Finland −0.41/0.07 −1.42/0.16 0.53/0.04 0.13/0.05 0.77/0.15 −0.03/0.01
France −0.65/0.01 −1.35/0.14 0.34/0.01 −1.29/0.05 0.60/0.05 −0.31/0.01
Germany −0.24/0.02 −0.86/0.05 0.40/0.03 −1.40/0.05 069/0.12 −0.28/0.02
Greece −1.40/0.13 −2.57/0.18 −0.24/0.05 −0.85/0.11 −0.35/0.10 −0.47/0.12
Hungary −1.14/0.04 −1.26/0.80 −0.04/0.09 −0.82/0.11 −1.32/0.25 −0.64/0.04
Ireland −0.69/0.10 −1.67/0.19 0.11/0.06 −0.20/0.05 1.31/0.14 −0.32/0.10
Italy −0.86/0.05 −1.74/0.12 0.06/0.05 −1.60/0.07 0.22/0.03 −0.38/0.05
Netherlands −0.84/0.03 −1.54/0.15 0.28/0.02 −0.75/0.04 0.98/0.06 −0.08/0.03
Norway −0.60/0.04 −0.15/0.35 0.21/0.02 0.01/0.03 −0.82/0.02 −0.10/0.10
Poland −1.19/0.07 −1.40/0.57 −0.20/0.05 −1.40/0.03 −0.69/0.30 −0.79/0.08
Portugal −1.79/0.31 −2.29/0.18 −0.05/0.16 −0.68/0.19 0.05/0.17 −0.62/0.19
Romania −1.28/0.11 −2.14/0.49 −0.34/0.08 −1.35/0.06 −0.37/0.17 −1.31/0.11
Spain −1.17/0.05 −2.10/0.18 0.03/0.09 −1.30/0.10 0.03/0.04 −0.40/0.06
Sweden −0.51/0.12 −1.27/0.17 0.56/0.02 −0.24/0.04 −0.29/0.07 0.03/0.02
United Kingdom −0.51/0.06 −0.82/0.10 0.24/0.01 −1.24/0.07 0.74/0.12 −0.12/0.01
European panel# −0.89/0.42 −1.47/0.62 0.16/0.26 −0.79/0.53 0.13/0.74 −0.37/0.34
PAR is number of patents by residents, PAN is number of patents by non-residents, RDE is research and developmentexpenditure, RRD is researchers in research and development activities, HTE is high-technology exports, STJ is scientificand technical journal articles, and GDP is per capita economic growth. Values reported here are natural logs of the variables#The reported statistics are calculated at the panel level
Maradana et al. Journal of Innovation and Entrepreneurship (2017) 6:1 Page 7 of 23

Model 1: For individual country analysis
ΔGDPt ¼ α1 þXp
k¼1
β1k ΔGDPt−k þXq
k¼1
λ1k ΔINNt−k þ δ1ECTt−1 þ ε1t ð1Þ
The testable hypotheses are:
H0 : λ1k ¼ 0 ; and δ1 ¼ 0 for k ¼ 1; 2; …; q
HA : λ1k # 0; and δ1# 0 for k ¼ 1; 2; …; q
ΔINNt ¼ α2 þXp
k¼1
β2k ΔINNt−k þXq
k¼1
λ2k ΔGDPt−k þ δ2ECTt−1 þ ε2t ð2Þ
The testable hypotheses are:
H0 : λ2k ¼ 0 ; and δ2 ¼ 0 for k ¼ 1; 2; …; q
HA : λ2k # 0; and δ2# 0 for k ¼ 1; 2; …; q;
where ECT12 is error correction term, which is derived from the long-run cointegration
equation; p and q are the lag lengths for the estimation; Δ is the first difference operator;
and ε1t and ε2t are the independent and normally distributed random error with a zero
mean and a finite heterogeneous variance.
Model 2: For panel data analysis
ΔGDPit ¼ α3j þXp
k¼1
β3ik ΔGDPit−k þXq
k¼1
λ3ik ΔINNit−k þ δ3iECTit−1 þ ε3it ð3Þ
The testable hypotheses are:
H0 : λ3ik ¼ 0 ; and δ3i ¼ 0 for k ¼ 1; 2; …; q
HA : λ3ik # 0; and δ3i# 0 for k ¼ 1; 2; …; q
ΔINNit ¼ α4j þXp
k¼1
β4ik ΔGDPit−k þXq
k¼1
λ4ik ΔINNit−k þ δ4iECTit−1 þ ε4it ð4Þ
The testable hypotheses are:
H0 : λ4ik ¼ 0 ; and δ4i ¼ 0 for k ¼ 1; 2; …; q
HA : λ4ik # 0; and δ4i# 0 for k ¼ 1; 2; …; q;
where i = 1, 2, …., N represents a country in the panel, t = 1, 2, …., and T represents the
year in the panel.
This study uses HQIC13 statistics to select the optimum lag length.
Moreover, the choice of a particular model (with/without ECT) depends upon the
order of integration and the cointegrating relationship between innovation and per
capita economic growth. Therefore, we first deploy unit root test and cointegration test,
both at individual country and the panel setting, for knowing the order of integration
and the presence of cointegrating relationship between innovation and per capita
economic growth.
The Augmented Dickey Fuller (ADF) unit root test (Dickey and Fuller 1981) is used
for individual country analysis, while the ADF—Fisher Chi-square panel unit root test
(Maddala and Wu 1999) is used for the panel setting. On the other hand, Johansen
cointegration test (Johansen 1988) is deployed for individual country analysis, while
Maradana et al. Journal of Innovation and Entrepreneurship (2017) 6:1 Page 8 of 23

Fisher/Maddala cointegration test (Maddala and Wu 1999; Fisher 1932) is deployed at
the panel setting. The details of these two unit root tests (unit root and cointegration)
are not available here and can be incorporated, if required.
Results and discussionThe discussion begins with order of integration and cointegration between innovation14
and per capita economic growth. Using unit root (simple ADF test at each of the
individual country and panel ADF15 at the panel setting), we reject the null hypothesis
of unit root at the first difference but not at the level data. Table 5 presents these unit
root test results, both for individual country and for the European panel. The results
indicate that innovation (INN: PAR, PAN, RDE, RRD, HTE, and STJ) and per capita
economic growth (GDP) are non-stationary at the level data but are stationary at the
first difference. This is true for all the 19 European countries, both at the individual
country and at the group level (panel setting). The findings suggest that both
innovation and per capita economic growth are integrated of order one [i.e. I (1)],
which unbolts the possibility of cointegration between the two (innovation and per
capita economic growth).
In the succeeding step, we deploy the Johansen Maximum Likelihood cointegration
test (by λTra and λMax test) at the individual country and Fisher cointegration test at the
panel setting for checking the cointegration between innovation and per capita
economic growth. The results of both the test statistics are reported in Tables 6, 7, and
8. Tables 6 and 7 report λTra and λMax test statistics, respectively, while Table 8 reports
the summary of cointegration test. These results indicate that innovation and per capita
economic growth are cointegrated in some European countries,16 while it is not
cointegrated in rest of the countries.17 The cointegration between innovation and per
capita economic growth varies from case to case (for PAR, PAN, RDE, RRD, HTE,
and STJ) and country to country (see Table 8).
The incidence of cointegration suggests that there is a long-run equilibrium relation-
ship between innovation and per capita economic growth (Engle and Granger 1987).
On the contrary, the absence of cointegration indicates that there is no long-run rela-
tionship between these two variables. The summary of these cointegration test results
are reported in Table 8.
In the next section, we detect the Granger causality by deploying vector error
correction model (VECM) for the presence of cointegration between innovation and
per capita economic growth, and simple vector autoregressive (VAR) model for the
absence of cointegration between the two. Having known the cointegration between
the two, the next step is to determine the direction of causality between innovation
and per capita economic growth. Using Granger causality test, the estimated results
are reported in Tables 9, 10, 11, 12, and 13. Tables 9 and 10 report the presence of
both short-run and long-run equilibrium relationship between innovation and per
capita economic growth, while Tables 11, 12, and 13 report the summary of short-run
Granger causal nexus between these two sets of variables (GDP vs. PAR; GDP vs.
PAN; GDP vs. RDE; GDP vs. RRD; GDP vs. THE; and GDP vs. STJ). The analysis is
based on the individual indicators of innovation and per capita economic growth.
Coming to long-run equilibrium relationship,18 we find the presence in a few cases,19
while absence in remaining cases.20 On the contrary, we have diverging experience in
Maradana et al. Journal of Innovation and Entrepreneurship (2017) 6:1 Page 9 of 23

Table
5Results
ofun
itroot
test
Cou
ntries
Variables
PAR
PAN
RDE
RRD
HTE
STJ
GDP
LD/FD
LD/FD
LD/FD
LD/FD
LD/FD
LD/FD
LD/FD
Austria
0.14/−5.40*
1.82/−7.46*
3.81/−2.39**
−0.67/−3.22*
1.57/−5.10*
−1.30/−2.64**
−0.74/−5.64*
Belgium
0.05/−4.65*
1.06/−5.89*
1.81/−2.56**
−0.62/−2.46**
2.28/−2.96*
−1.32/−10.0*
−0.54/−5.84*
Czech
Repu
blic
−0.23/−2.33**
0.52/−2.36**
2.85/−1.89***
−1.31/−2.73**
−0.43/−2.06***
−0.69/−4.03*
−0.82/−6.61*
Den
mark
−0.40/−5.90*
0.62/−6.66*
1.87/−1.98***
−0.99/−5.07*
−1.64/−6.91*
−0.34/−4.42*
−0.68/−7.68*
Finland
1.02/−4.07*
0.92/−3.91*
−0.22/ −1.65***
0.43/−3.33*
−0.49/−3.32*
−1.25/−12.5*
−0.55/−3.49*
France
−0.31/−5.96*
0.63/−2.90*
−0.09/−3.52*
1.02/−5.83*
1.75/−5.14*
−0.76/−3.74*
−0.74/−5.73*
Germany
−1.11/−2.44**
−1.21/−3.09*
3.12/−2.44**
−1.63/−2.28**
1.99/−3.55*
−0.38/−3.81*
−1.16/−4.60*
Greece
−1.06/−5.36*
1.23/−5.27*
–/–
–/–
−1.56/−6.67*
−0.88/−2.39***
0.80/−3.63*
Hun
gary
1.63/−2.96*
0.73/−3.54*
−1.12/−2.84**
−1.79/−5.70*
1.41/−4.81*
−1.16/−4.44*
−1.40/−4.71*
Ireland
1.90/−2.83*
0.69/−3.75*
1.43/−1.88***
−3.93/−1.88***
−0.62/−2.96*
−0.77/−2.42**
−0.80/−3.12*
Italy
0.15/−3.03*
−0.94/−4.40*
1.46/−2.65**
−1.13/−3.88*
0.90/−7.60*
−0.29/−2.32**
−0.92/−6.04*
Nethe
rland
s0.04/−4.52*
0.89/−3.21*
0.43/−2.47**
−1.54/−4.54*
1.08/−3.96*
−1.91/−2.23**
−0.65/−5.87*
Norway
0.17/−6.18*
−0.70/−2.83**
0.04/−2.47**
0.10/−2.72**
−0.24/−5.46*
−0.43/−3.54*
−0.23/−5.89*
Poland
0.22/−3.34*
0.47/ −3.75*
−0.90/−2.02**
−2.49/−4.00*
−0.95/−2.37**
−0.46/−1.87***
−0.33/−5.20*
Portug
al−1.81/−4.83*
0.71/−3.88*
−1.59/−1.59***
−3.54/−1.84***
−2.10/−4.74*
−0.90/−2.88*
−1.10/−5.81*
Romania
0.80/−4.88*
0.47/−4.10*
0.23/−2.70**
0.82/−4.02*
−4.62/−2.51**
−1.92/−5.11*
1.58/−4.88*
Spain
−0.78/−5.21*
2.30/−4.59*
−1.67/−2.14**
−2.66/−2.66**
−0.93/−3.69*
−0.54/−2.53**
−0.67/−6.30*
Swed
en1.08/−3.28*
1.53/−5.36*
−1.27/−4.47*
0.14/−3.80*
−0.74/−4.93*
−1.46/−1.94***
−2.32/−7.96*
UnitedKing
dom
0.90/−2.25**
−0.08/−2.32**
−0.54/−4.16*
−1.11/−2.50**
−0.97/−2.18***
−1.08/−4.06*
−0.69/−6.84*
Europe
anpane
l#50.5/136.7*
14.8/129.1*
23.4/122.7*
18.0/95.4*
50.7/144.1*
113.3/104.1*
34.2/197.5*
PARisnu
mbe
rof
patentsby
reside
nts,PA
Nisnu
mbe
rof
patentsby
non-reside
nts,RD
Eisresearch
andde
velopm
entexpe
nditu
re,R
RDisresearchersin
research
andde
velopm
entactiv
ities,H
TEishigh
-techn
olog
yexpo
rts,STJisscientifican
dtechnicaljou
rnal
articles,an
dGDPispe
rcapita
econ
omicgrow
th.The
investigationisdo
neat
threelevels—
notren
dan
dintercep
t,with
intercep
t,an
dwith
both
intercep
tan
dtren
d.Th
eresults
aremoreor
less
unifo
rm;h
owever,the
repo
rted
statisticsin
thetablepresen
ttheADFstatisticsat
notren
dan
dno
intercep
t*Statistical
sign
ificanceat
1%level;**statistical
sign
ificanceat
5%level;***statistical
sign
ificanceat
10%
level
# The
repo
rted
statisticsarecalculated
atthepa
nellevel
Maradana et al. Journal of Innovation and Entrepreneurship (2017) 6:1 Page 10 of 23

the context of short-run Granger causality between innovation and per capita economic
growth. These results are presented below.
Case 1: between patents-residents (PAR) and per capita economic growth (GDP)
For countries like Belgium, Finland, France, Germany, Greece, Italy, the Netherlands,
Portugal, Romania, and the UK, we find the unidirectional causality from innovation to
per capita economic growth (PAR => GDP), whereas for countries like Czech Republic,
Denmark, Hungary, Ireland, and Norway, we find unidirectional causality from per
capita economic growth to innovation (PAR <= GDP). Additionally, for countries like
Austria, Poland, Spain, and Sweden, and the European panel, we find the bidirectional
causality between innovation and per capita economic growth (PAR <=> GDP).
Case 2: between patents-non-residents (PAN) and per capita economic growth
For countries like Austria, Belgium, Czech Republic, France, the Netherlands, Romania,
Spain, and Sweden, there is a unidirectional causality from innovation to per capita
economic growth (PAN => GDP), whereas for Finland, Germany, Greece, and Norway,
we find unidirectional causality from per capita economic growth to innovation (GDP
=> PAN). Additionally, for countries like Denmark, Hungary, Ireland, Portugal, and the
Table 6 Results of Johansen-Juselius Cointegration Test (Max Test)
Countries Cointegration with GDP
PAR PAN RDE RRD HTE STJ
Austria 14.5*/4.55* 15.9/* 7.73* 24.1*/10.2* 13.7/3.35 14.8/0.85 18.3*/5.67*
Belgium 28.8*/1.95 8.97/2.87 9.75/0.81 13.8/1.26 10.2/0.16 14.7*/5.74*
Czech Republic 9.93/0.07 12.3/0.48 14.1/2.52 13.3/0.57 13.9/4.34 10.4/0.67
Denmark 9.43/1.55 36.6*/7.46* 23.9*/3.18 1.9/1.61 20.7*/3.51 16.1*/0.83
Finland 13.5/0.11 17.1*/5.76* 18.4*/4.52* 7.43/0.15 17.*/0.15 38.2*/14.6*
France 18.8*/3.53 22.0*/0.97 12.3/2.74 15.5*/0.20 13.9/1.51 22.2*/7.72*
Germany 16.4*/7.96* 15.4*/0.81 12.2/0.48 11.4/0.78 17.4*/0.37 20.2*/5.09*
Greece 9.43/0.01 10.9/1.17 –/– –/– 3.99/0.01 9.63/2.46
Hungary 11.4/3.60 18.96*/2.89 9.52/0.01 15.0*/0.43 13.7/5.46* 13.7/2.29
Ireland 5.78/0.14 10.2/0.18 12.0/0.31 12.5/0.11 10.2/0.78 7.45/2.56
Italy –/– –/– 13.1/0.19 12.3/0.01 16.2*/0.74 30.9*/8.71*
Netherlands 8.80/3.55 20.5*/5.00* 20.3*/2.88 11.3/0.01 18.4*/5.07* 15.0*/1.07
Norway 14.7*/3.25 13.4/0.04 18.3*/3.96* 20.2*/5.26* 18.5*/3.40 11.7/0.41
Poland 12.2/0.04 8.28/0.58 12.8/0.01 14.2*/0.18 10.2/0.30 13.9/2.54
Portugal 14.8*/0.46 8.83/3.38 13.4/1.78 10.3/0.03 11.5/2.66 17.4*/4.45*
Romania 10.10/4.31 8.50/0.45 24.4*/0.01 39.9*/9.95* 17.2*/4.97* 8.05/0.06
Spain 13.3/1.53 10.05/1.61 17.0*/3.79 20.2*/6.72* 15.0*/4.55* 20.3*/4.82*
Sweden 15.7*/0.44 12.3/0.03 8.61/2.36 10.9/1.19 16.6*/4.56* 21.8*/5.57*
United Kingdom 11.57/0.26 17.6*/3.83 20.5*/4.77* 19.9*/7.82* 14.2*/0.01 20.2*/4.87*
European panel 107.9*/77.8* 104.5*/58.6* 99.56*/79.17* 108.9*/76.37* 128.5*/68.73* 96.1*/64.6*
PAR is number of patents by residents, PAN is number of patents by non-residents, RDE is research and developmentexpenditure, RRD is researchers in research and development activities, HTE is high-technology exports, STJ is scientificand technical journal articles, and GDP is per capita economic growth. We observe statistical significance at 5% level*Indicates the statistical significance of the cointegrating vector and confines the presence of cointegration betweeninnovation and per capita economic growth
Maradana et al. Journal of Innovation and Entrepreneurship (2017) 6:1 Page 11 of 23
UK, and the European panel, we find bidirectional causality between innovation and per
capita economic growth (PAN <=> GDP), while in the context of Italy, and Poland, we
find per capita economic growth does not Granger-cause innovation (GDP <#> PAN).
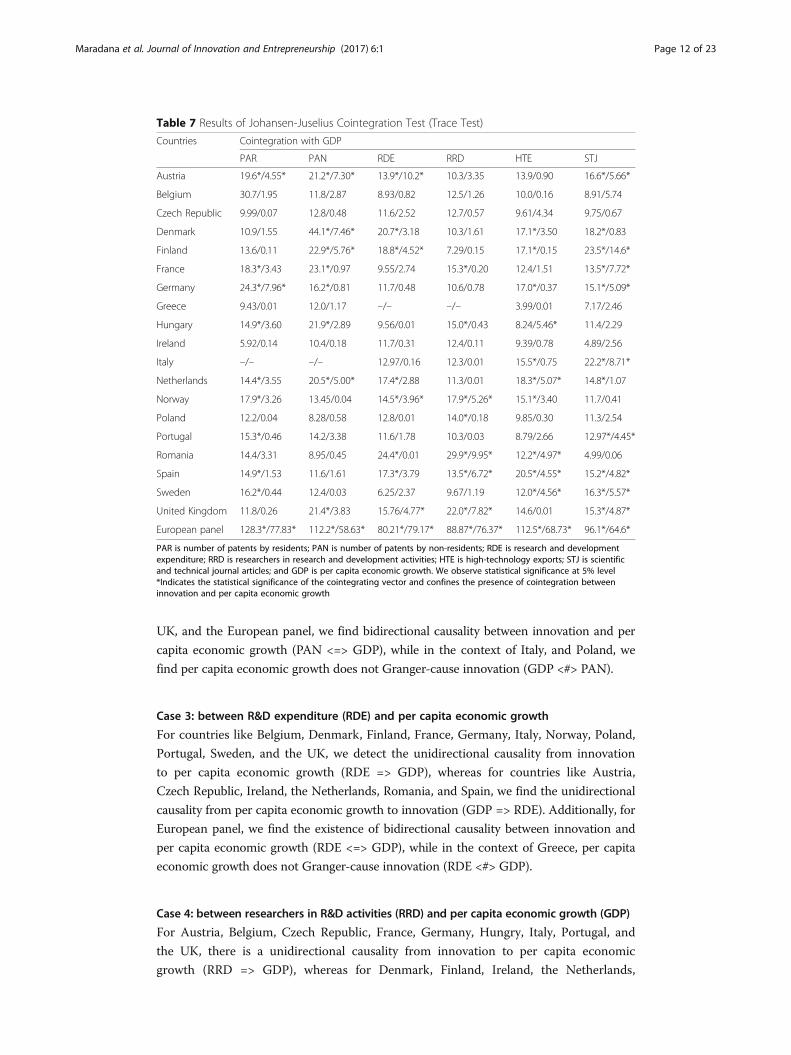
Case 3: between R&D expenditure (RDE) and per capita economic growth
For countries like Belgium, Denmark, Finland, France, Germany, Italy, Norway, Poland,
Portugal, Sweden, and the UK, we detect the unidirectional causality from innovation
to per capita economic growth (RDE => GDP), whereas for countries like Austria,
Czech Republic, Ireland, the Netherlands, Romania, and Spain, we find the unidirectional
causality from per capita economic growth to innovation (GDP => RDE). Additionally, for
European panel, we find the existence of bidirectional causality between innovation and
per capita economic growth (RDE <=> GDP), while in the context of Greece, per capita
economic growth does not Granger-cause innovation (RDE <#> GDP).
Case 4: between researchers in R&D activities (RRD) and per capita economic growth (GDP)
For Austria, Belgium, Czech Republic, France, Germany, Hungry, Italy, Portugal, and
the UK, there is a unidirectional causality from innovation to per capita economic
growth (RRD => GDP), whereas for Denmark, Finland, Ireland, the Netherlands,
Table 7 Results of Johansen-Juselius Cointegration Test (Trace Test)
Countries Cointegration with GDP
PAR PAN RDE RRD HTE STJ
Austria 19.6*/4.55* 21.2*/7.30* 13.9*/10.2* 10.3/3.35 13.9/0.90 16.6*/5.66*
Belgium 30.7/1.95 11.8/2.87 8.93/0.82 12.5/1.26 10.0/0.16 8.91/5.74
Czech Republic 9.99/0.07 12.8/0.48 11.6/2.52 12.7/0.57 9.61/4.34 9.75/0.67
Denmark 10.9/1.55 44.1*/7.46* 20.7*/3.18 10.3/1.61 17.1*/3.50 18.2*/0.83
Finland 13.6/0.11 22.9*/5.76* 18.8*/4.52* 7.29/0.15 17.1*/0.15 23.5*/14.6*
France 18.3*/3.43 23.1*/0.97 9.55/2.74 15.3*/0.20 12.4/1.51 13.5*/7.72*
Germany 24.3*/7.96* 16.2*/0.81 11.7/0.48 10.6/0.78 17.0*/0.37 15.1*/5.09*
Greece 9.43/0.01 12.0/1.17 –/– –/– 3.99/0.01 7.17/2.46
Hungary 14.9*/3.60 21.9*/2.89 9.56/0.01 15.0*/0.43 8.24/5.46* 11.4/2.29
Ireland 5.92/0.14 10.4/0.18 11.7/0.31 12.4/0.11 9.39/0.78 4.89/2.56
Italy –/– –/– 12.97/0.16 12.3/0.01 15.5*/0.75 22.2*/8.71*
Netherlands 14.4*/3.55 20.5*/5.00* 17.4*/2.88 11.3/0.01 18.3*/5.07* 14.8*/1.07
Norway 17.9*/3.26 13.45/0.04 14.5*/3.96* 17.9*/5.26* 15.1*/3.40 11.7/0.41
Poland 12.2/0.04 8.28/0.58 12.8/0.01 14.0*/0.18 9.85/0.30 11.3/2.54
Portugal 15.3*/0.46 14.2/3.38 11.6/1.78 10.3/0.03 8.79/2.66 12.97*/4.45*
Romania 14.4/3.31 8.95/0.45 24.4*/0.01 29.9*/9.95* 12.2*/4.97* 4.99/0.06
Spain 14.9*/1.53 11.6/1.61 17.3*/3.79 13.5*/6.72* 20.5*/4.55* 15.2*/4.82*
Sweden 16.2*/0.44 12.4/0.03 6.25/2.37 9.67/1.19 12.0*/4.56* 16.3*/5.57*
United Kingdom 11.8/0.26 21.4*/3.83 15.76/4.77* 22.0*/7.82* 14.6/0.01 15.3*/4.87*
European panel 128.3*/77.83* 112.2*/58.63* 80.21*/79.17* 88.87*/76.37* 112.5*/68.73* 96.1*/64.6*
PAR is number of patents by residents; PAN is number of patents by non-residents; RDE is research and developmentexpenditure; RRD is researchers in research and development activities; HTE is high-technology exports; STJ is scientificand technical journal articles; and GDP is per capita economic growth. We observe statistical significance at 5% level*Indicates the statistical significance of the cointegrating vector and confines the presence of cointegration betweeninnovation and per capita economic growth
Maradana et al. Journal of Innovation and Entrepreneurship (2017) 6:1 Page 12 of 23

Norway, Poland, and Spain, we find per capita economic growth Granger-causes
innovation (RRD <= GDP). Additionally, for Romania, and the European panel, there is
bidirectional causality between innovation and per capita economic growth (RRD <=>
GDP), while in the context of Greece and Sweden, per capita economic growth does
not Granger-cause innovation (RRD <#> GDP).
Case 5: between high-technology exports (HTE) and per capita economic growth
For countries like Belgium, France, Ireland, the Netherlands, and Sweden, we find the
presence of unidirectional causality from innovation to per capita economic growth
(HTE = > GDP), whereas for countries like Hungary, Italy, Norway, Poland, Portugal,
Romania, and Spain, we find the presence of unidirectional causality from per capita
economic growth to innovation (GDP => HTE). Moreover, for countries like Finland,
Germany, and the UK, and the European panel, there is bidirectional causality between
innovation and per capita economic growth (HTE <=> GDP), while in the context of
Table 8 Summary of cointegration test results
Cointegrated status
Case 1 Case 2 Case 3 Case 4 Case 5 Case 6
Austria (2) Austria (2) Austria (2) Austria (0) Austria (0) Austria (2)
Belgium (1) Belgium (0) Belgium (0) Belgium (0) Belgium (0) Belgium (2)
CR (0) CR (0) CR (0) CR (0) CR (0) CR (0)
Denmark (0) Denmark (2) Denmark (1) Denmark (0) Denmark (1) Denmark (0)
Finland (0) Finland (2) Finland (2) Finland (0) Finland (1) Finland (2)
France (1) France (1) France (0) France (1) France (0) France (2)
Germany (2) Germany (1) Germany (0) Germany (0) Germany (1) Germany (2)
Greece (0) Greece (0) Greece (0) Greece (0) Greece (0) Greece (0)
Hungary (0) Hungary (1) Hungary (0) Hungary (1) Hungary (1) Hungary (0)
Ireland (0) Ireland (0) Ireland (0) Ireland (0) Ireland (0) Ireland (0)
Italy (0) Italy (0) Italy (0) Italy (0) Italy (1) Italy (2)
Netherlands (0) Netherlands (2) Netherlands (1) Netherlands (0) Netherlands (2) Netherlands (1)
Norway (1) Norway (0) Norway (2) Norway (2) Norway (1) Norway (0)
Poland (0) Poland (0) Poland (0) Poland (1) Poland (0) Poland (0)
Portugal (1) Portugal (0) Portugal (0) Portugal (0) Portugal (0) Portugal (2)
Romania (0) Romania (0) Romania (1) Romania (2) Romania (2) Romania (0)
Spain (0) Spain (0) Spain (2) Spain (2) Spain (2) Spain (2)
Sweden (1) Sweden (0) Sweden (0) Sweden (0) Sweden (2) Sweden (2)
UK (0) UK (2) UK (2) UK (2) UK (1) UK (2)
EP (2) EP (2) EP (2) EP (2) EP (2) EP (2)
Case 1: cointegration between PAR and GDP; case 2: cointegration between PAN and GDP; case 3: cointegration betweenRDE and GDP; case 4: cointegration between RRD and GDP; case 5: cointegration between HTE and GDP; case 6:cointegration between STJ and GDP. PAR is number of patents by residents, PAN is number of patents by non-residents,RDE is research and development expenditure, RRD is researchers in research and development activities, HTE is high-technology exports, STJ is scientific and technical journal articles, and GDP is per capita economic growth. 0 stands forabsence of cointegration between innovation (PAR/PAN/RDE/RRD/HTE/STJ) and per capita economic growth, 1 stands forpresence of one cointegrating vector between innovation (PAR/PAN/RDE/RRD/HTE/STJ) and per capita economic growth,and 2 stands for presence of two cointegrating vectors between innovation (PAR/PAN/RDE/RRD/HTE/STJ) and per capitaeconomic growth. Parentheses indicate number of cointegrating vector (s). Results are derived on the basis of Tables 6and 7 resultsCR Czech Republic, UK United Kingdom, EP European panel
Maradana et al. Journal of Innovation and Entrepreneurship (2017) 6:1 Page 13 of 23

Austria, Czech Republic, Denmark, Greece, and Poland, per capita economic growth
does not Granger-cause innovation (HTE <#> GDP).
Case 6: between scientific and technical journal articles (STJ) and per capita economic
growth
For countries like Finland, France, Hungary, Romania, and Spain, we detect the
presence of unidirectional causality from innovation to per capita economic growth
(STJ => GDP), whereas for countries like Austria, Belgium, Denmark, Germany,
Ireland, Italy, and the UK, and the European panel, we find the presence of unidirectional
causality from per capita economic growth to innovation (GDP => STJ). Additionally, for
countries like Greece, the Netherlands, Norway, Poland, Portugal, and Sweden, we
observe bidirectional causality between innovation and per capita economic growth (STJ
<=> GDP), while in the context of Czech Republic, we find that per capita economic
growth does not Granger cause innovation (STJ <#> GDP).
As is evident by these individual country results,21 the nature of causal relationship
between innovation and per capita economic growth is more or less country specific
and innovation indicator specific.22
Table 9 Results of test from error correction model
Countries Granger causality test between
PAR and GDP PAN and GDP RDE and GDP
Short-run Long-run Short-run Long-run Short-run Long-run
Austria 4.90*/4.16* −3.39*/−1.33 8.97*/−1.90 −1.79/−1.03 0.634/6.37* −0.25/−4.17*
Belgium 18.9*/1.21 −2.46/−0.53 3.62**/1.48 −2.12/1.13 3.55*/0.28 NA/NA
Czech Republic 1.62/4.35* NA/NA 3.27**/0.74 NA/NA 1.17/4.91* NA/NA
Denmark 0.42/4.32** NA/NA 3.16**/9.69* −1.83/−3.21** 20.6*/0.11 −6.03*/−2.67
Finland 4.32*/0.31 NA/NA 0.57/5.29* −1.20/2.03 4.39*/1.08 −1.56/1.75
France 3.19**/0.60 −2.83/−1.12 13.8*/2.57 2.91/−1.41 3.93*/2.00 NA/NA
Germany 3.34**/1.01 −3.27*/−0.82 0.72/12.2* −4.03*/−2.92** 9.32*/1.24 NA/NA
Greece 6.73*/0.12 NA/NA 1.09/8.64* NA/NA –/– –/–
Hungary 1.51/5.58* NA/NA 4.50*/5.28* −2.03/−1.57 4.77*/1.94 NA/NA
Ireland 0.63/3.95* NA/NA 3.25**/5.63* NA/NA 0.33/4.33 NA/NA
Italy 6.74*/0.71 NA/NA 0.49/1.87 NA/NA 5.09*/1.50 NA/NA
Netherlands 3.26**/0.90 NA/NA 3.64**/2.23 −2.38/−1.57 0.34/4.44* −2.52/−0.33
Norway 2.83/14.5* −0.85/−5.06* 1.62/23.8* NA/NA 4.72*/0.79 0.30/−1.60
Poland 14.3*/5.46* NA/NA 0.67/1.42 NA/NA 3.97*/1.78 NA/NA
Portugal 5.19*/1.20 −3.69***/1.28 4.09**/16.8* NA/NA 10.3*/0.21 NA/NA
Romania 5.10*/0.86 NA/NA 3.69*/2.07 NA/NA 0.80/5.37* −4.41/−3.07**
Spain 4.21*/4.56* NA/NA 5.42*/0.96 NA/NA 0.23/7.71* −1.73/−3.03**
Sweden 8.93*/13.5* −4.10*/−2.33 7.15*/0.13 NA/NA 3.36*/2.28 NA/NA
United Kingdom 2.99**/0.33 NA/NA 10.1*/3.81** −4.69*/−2.97** 3.69*/1.94 −1.16/−2.19
European panel 5.91*/10.1* −6.09*/−2.60 0.45/6.61* −6.23*/−2.38 2.84*/6.08* −5.34*/−1.14
GDP is per capita economic growth; PAR is the number of patents by residents; PAN is the number of patents by non-residents; and RDE is research and development expenditure. The short-run causality is detected through the Waldstatistics, while long-run causality is detected through the statistical significance of error correction term. For bothshort-run and long-run, the first value represents GDP as the dependent variable and the second value representsinnovation (PAR/PAN/RDE) as the dependent variable*Indicates the statistical significance at 5% level; **indicates the statistical significance at 10% level
Maradana et al. Journal of Innovation and Entrepreneurship (2017) 6:1 Page 14 of 23

ConclusionThe level and structure of innovation should not be ignored because it plays an
imperative role in stimulating economic growth (Pradhan et al. 2016; Hassan and
Tucci 2010). This study explored the Granger causal nexus between innovation
and per capita economic growth for the 19 European countries using time series
data from 1989 to 2014. The pivotal message from our study for the policymakers
and academicians alike is that implications drawn from research on per capita
economic growth that disregard the dynamic interrelation of the two variables will
be imperfect. It is the conjoined back-and-forth relationship between innovation
and per capita economic growth that builds our study and guides the future
research on this topic.
Our study acknowledges mixed evidence on the relationship between the innovation
and per capita economic growth in the 19 European countries, both at the individual
country and at the panel setting. In some instances, per capita economic growth leads
to innovation, lending support to demand-following hypothesis of innovation-growth
nexus. In some other instances, it is innovation that regulates the level of per capita
economic growth, lending support to supply-leading hypothesis of innovation-growth
nexus. There are also circumstances, where innovation and per capita economic growth
Table 10 Results of test from error correction model
Countries Granger causality test between
RRD and GDP HTE and GDP STJ and GDP
Short-run Long-run Short-run Long-run Short-run Long-run
Austria 3.20**/0.40 NA/NA 0.89/0.63 −3.18**/−0.99 1.64/6.54* −1.53/−2.13
Belgium 13.6*/1.19 NA/NA 3.40*/0.48 NA/NA 0.32/5.03* −1.29/−2.85
Czech Republic 5.14*/0.41 NA/NA 1.76/0.01 NA/NA 1.27/0.43 NA/NA
Denmark 0.46/5.28* NA/NA 0.51/0.19 −1.92/−2.26 0.06/21.1* −1.96/−4.13*
Finland 0.07/25.3* NA/NA 18.3*/3.73** −3.46**/−0.32 36.8*/0.92 −6.10/−2.12
France 3.12**/2.12 −2.35/−1.13 3.41*/0.09 NA/NA 8.21*/0.44 −0.66/−5.31*
Germany 5.31*/0.18 NA/NA 12.2*/3.07** −5.94*/−1.82 0.40/4.06* −2.65/−1.93
Greece –/– –/– 1.33/1.85 –/– 8.49*/5.33* –/–
Hungary 7.12*/0.46 −4.14*/−1.26 1.20/19.6* −2.25/−4.37* 5.29*/0.97 NA/NA
Ireland 0.99/3.62** NA/NA 18.1*/0.26 NA/NA 2.02/4.19* NA/NA
Italy 4.43*/0.47 NA/NA 2.10/9.59* −3.64*/−2.07 0.02/11.4 −0.65/−4.68*
Netherlands 1.34/6.33* NA/NA 7.60*/1.18 0.22/−2.65 3.51*/5.59* NA/NA
Norway 0.01/5.86* NA/NA 0.90/4.97* −0.16/−3.90* 2.89**/6.04* NA/NA
Poland 0.75/5.68* −0.86/−1.90 0.67/3.03** NA/NA 3.48**/3.05** NA/NA
Portugal 9.83*/1.46 NA/NA 1.33/3.53* NA/NA 17.9*/3.57** −4.52*/−1.35
Romania 3.84*/3.74* −7.97*/1.96 0.50/3.66* −1.26/−3.61** 3.87*/1.85 NA/NA
Spain 0.15/6.46* −0.62/−3.14 1.04/11.3* NA/NA 5.58*/2.05 −1.15/−4.73*
Sweden 1.45/0.15 NA/NA 3.26*/0.87 −3.52**/−0.66 8.15*/4.55* NA/NA
United Kingdom 9.47*/2.25 NA/NA 25.9*/0.82 NA/NA 1.14/9.10* NA/NA
European panel 3.03*/2.95* −6.15*/−1.23 7.95*/4.41* −6.31*/−1.69 2.13/6.88* −7.09*/−2.56
RRD is the researchers in research and development activities; HTE is the high-technology exports; STJ is the scientificand technical journal articles; and GDP is per capita economic growth. The short-run causality is detected through theWald statistics, while long-run causality is detected through the statistical significance of error correction term. For bothshort-run and long-run, the first value represents GDP as the dependent variable and the second value representsinnovation (RRD/HTE/STJ) as the dependent variable*Indicates the statistical significance at 5% level; **indicates the statistical significance at 10% level
Maradana et al. Journal of Innovation and Entrepreneurship (2017) 6:1 Page 15 of 23

are mutually interdependent. That is the situation where both are self-reinforcing and
offer support to feedback hypothesis of innovation-growth nexus. Additionally, there
are also cases where innovation and per capita economic growth are independent of
each other. That is the situation where both are neutral and offer support to neutrality
hypothesis of innovation-growth nexus.
The study accordingly suggests that in order to promote per capita economic growth,
attention must be paid to policy strategies that promote innovation. Given the possibility
of reverse causality or bidirectional causality for some cases, policies that increase per
capita economic growth (such as actions to increase investment) would be desirable to
bring more innovation in the economy. Consequently, it is suggested that government
should play a more positive role in order to foster innovation and then integrate it with
per capita economic growth. No doubt, in recent times, many countries including
European countries have recognized the importance of innovation for high economic
growth and consequently, they have increased their effort to have more innovation in
their countries. Nonetheless, what is needed is that government of the respective
countries should pay higher attention to bring the steady environment in order to
Table 11 Summary of Granger causality test
Countries Nature of Granger causality between
Case 1 Case 2 Case 3 Case 4 Case 5 Case 6
PAR and GDP PAN and GDP RDE and GDP RRD and GDP HTE and GDP STJ and GDP
Austria FBH SLH DFH SLH NEH DFH
Belgium SLH SLH SLH SLH SLH DFH
Czech Republic DFH SLH DFH SLH NEH NEH
Denmark DFH FBH SLH DFH NEH DFH
Finland SLH DFH SLH DFH FBH SLH
France SLH SLH SLH SLH SLH SLH
Germany SLH DFH SLH SLH FBH DFH
Greece SLH DFH – – NEH FBH
Hungary DFH FBH SLH SLH DFH SLH
Ireland DFH FBH DFH DFH SLH DFH
Italy SLH NEH SLH SLH DFH DFH
Netherlands SLH SLH DFH DFH SLH FBH
Norway DFH DFH SLH DFH DFH FBH
Poland FBH NEH SLH DFH DFH FBH
Portugal SLH FBH SLH SLH DFH FBH
Romania SLH SLH DFH FBH DFH SLH
Spain FBH SLH DFH DFH DFH SLH
Sweden FBH SLH SLH NEH SLH FBH
United Kingdom SLH FBH SLH SLH SLH DFH
European panel FBH DFH FBH FBH FBH DFH
Case 1: cointegration between PAR and GDP; case 2: cointegration between PAN and GDP; case 3: cointegration betweenRDE and GDP; case 4: cointegration between RRD and GDP; case 5: cointegration between HTE and GDP; case 6:cointegration between STJ and GDP. PAR is number of patents by residents, PAN is number of patents by non-residents,RDE is research and development expenditure, RRD is researchers in research and development activities, HTE is high-technology exports, STJ is scientific and technical journal articles, and GDP is per capita economic growth. SLH indicatesthe unidirectional causality from innovation to economic growth, DFH indicates the unidirectional causality from economicgrowth to innovation, FBH indicates the bidirectional causality between innovation and economic growth, and NEH indicatesno causal flow between innovation and economic growth. Results are derived on the basis of Tables 9 and 10 results
Maradana et al. Journal of Innovation and Entrepreneurship (2017) 6:1 Page 16 of 23

promote the link between innovation and per capita economic growth. This requires
the followings. First, government everywhere can acknowledge the importance of
innovation for long-term growth. This is most evident in those countries where the
easy options have been exhausted and future growth depends on more efficient ways
of combining inputs or producing new or improved outputs. Second, government can
nurture innovation indirectly by providing an appropriate environment for firms that
are willing to invest more and innovate. They can also support innovation directly, by
either funding public research or encouraging private investment in research and
innovation. The cited examples are through innovation-related tax incentives and
Table 12 Summary of Granger causality test results
Supply-leading hypothesis of innovation-growthnexus
Demand-following hypothesis of innovation-growthnexus
Case 1 Case 2 Case 3 Case 1 Case 2 Case 3
Austria Austria
Belgium Belgium Belgium Czech Republic
Czech Republic Czech Republic Ireland
Denmark
Finland Finland Denmark Netherlands
France France France Finland Romania
Germany Germany Germany Spain
Greece Hungary Greece
Italy Italy Italy Hungary
Netherlands Netherlands Norway Ireland
Poland Norway Norway
Portugal European panel
Portugal Sweden
Romania Romania United Kingdom
Spain
Sweden
United Kingdom
Feedback hypothesis of innovation-growth nexus Neutrality hypothesis of innovation-growth nexus
Case 1 Case 2 Case 3 Case 1 Case 2 Case 3
Austria
Denmark Finland
Greece
Hungary Italy
Ireland Ireland
Netherlands
Poland
Portugal Poland
Spain
Sweden
United Kingdom
European panel European panel
Case 1: cointegration between PAR and GDP; case 2: cointegration between PAN and GDP; case 3: cointegration betweenRDE and GDP. PAR is the number of patents by residents, PAN is the number of patents by non-residents, RDE is researchand development expenditure, and GDP is per capita economic growth. Results are derived on the basis of Table 11 results
Maradana et al. Journal of Innovation and Entrepreneurship (2017) 6:1 Page 17 of 23

grants. Third, there is requirement of policy options for sector-wise level importance,
depending upon the particular requirement of country’s development. This requires
governments to make difficult choices, striking a balance between improvements in
the general environment for innovation and direct support for innovation, targeted or
not to specific (groups of) actors. The combination of policy objectives and instruments
should be tailored to a country’s level of development and the strengths and weaknesses
of its innovation system, so it should vary both across countries and over time (see, for
instance, Veugelers and Schweiger 2016).
Over and above, our study is strictly constrained to examine the causal nexus
between innovation activities and economic growth. So, we have not included other
relevant factors, such as capital, labour, infrastructure, entrepreneurship, and venture
Table 13 Summary of Granger causality test results
Supply-leading hypothesis of innovation-growthnexus
Demand-following hypothesis of innovation-growthnexus
Case 4 Case 5 Case 6 Case 4 Case 5 Case 6
Austria Austria
Belgium Belgium Belgium
Czech Republic Finland Czech Republic
France France France Denmark Denmark
Germany Hungary Finland
Greece Finland
Hungary Germany
Italy Italy Hungary Ireland
Portugal Netherlands Hungary Norway Italy
United Kingdom Ireland Poland
Netherlands Portugal
Romania Romania Norway Romania
Spain Spain Poland Spain United Kingdom
Sweden Portugal European panel
Feedback hypothesis of innovation-growth nexus Neutrality hypothesis of innovation-growth nexus
Case 4 Case 5 Case 6 Case 4 Case 5 Case 6
Austria United Kingdom Austria
Finland Netherlands Czech Republic Czech Republic
Germany Norway Denmark
Poland Greece
Ireland Portugal
Sweden
Poland
Portugal
Spain
Sweden
United Kingdom
European panel European panel
Case 4: cointegration between RRD and GDP; Case 5: cointegration between HTE and GDP; Case 6: cointegrationbetween STJ and GDP. RRD is researchers in research and development activities, HTE is high-technology exports, STJ isscientific and technical journal articles, and GDP is per capita economic growth. Results are derived on the basis ofTable 11 results
Maradana et al. Journal of Innovation and Entrepreneurship (2017) 6:1 Page 18 of 23

capital (see, for instance, Galindo and Mendez-Picazo (2014), Navas (2015), Samila
and Sorenson (2011), Santacreu (2015)), in our empirical investigation process. The
inclusion of these factors may affect our main findings and this could be a subject of
future research. Additionally, the other limitations do exist in this study. First, no
indirect or complementary effects on the nexus between innovation activities and
economic growth; second, exclusion of sector-wise impact of innovation activities on
economic growth; third, small time-dimension of data, i.e. from 1989 to 2014; and
fourth, the findings are regulated to European countries only. Consequently, further
study in these mutable areas can produce more inspiring and spontaneous findings to
the nexus between innovation and economic growth.
Endnotes1The specification is mostly due to the fact that innovation can be considered important
for potential economic growth. So what evidence do we have that innovation is linked to
economic growth, and at what levels of analysis? (Bottazzi and Peri 2003; Cameron 1998;
Coad et al. 2016; Hassan and Tucci 2010; Hsu et al. 2014).2Innovation is a notion that has been defined and generalized in many ways by both
researchers and policymakers, both as a process and as an outcome (Garcia and
Calantone 2002; Grossman and Helpman 1991, 1994; OECD 2005a; Raymond and
St-Pierre 2010).3When Schumpeter wrote about innovation, he clearly intended to emphasize not
only the “destructive” aspect of creative destruction, but the “creative” part as well
(Aghion and Howitt, 1992; Freeman and Soete 1997; Hassan and Tucci 2010).4See Agenor and Neanidis (2015), Aghion and Howitt (2009), Corrado et al. (2012;
2013); Dachs and Peters (2014), de Serres et al. (2006), Dosi (1988), Fagerberg (1994),
Fan (2011), Galindo and Mendez-Picazo (2013), Grossman (2009), Grossman and
Helpman (1994), Hanley et al. (2011), Hsu et al. (2015), Hudson and Minea (2013),
Huang (2011), Kirchhoff (1994), Laeven et al. (2015), Mandel (2009), Navas (2015),
OECD (2005b, 2007), Petrakis et al. (2015), Rogers (1995), Roig-Tierno et al. (2015),
Sohag et al. (2015), Tellis et al. (2008), and Wennekers (1999).5It can be noted that most of the previous works on “innovation-growth nexus” are
flooded with production function approach and lacks in Granger causality approach.6The choice of these six innovation indicators are with respect to data availability in
the European countries.7The choice of these time periods is as per the data availability.8The rejection of H1A
0 ensures the case of SLH; the rejection of H1B0 ensures the case
of DFH, the rejection of both (H1A0 and H1B
0 ) ensure the case of FBH, and the acceptance
of both (H1A0 and H1B
0 ) ensures the case of NEH.9GDP represents the level of economic growth.10INN is used here as a proxy for six different innovation indicators, such as PAR,
PAN, RDE, RRD, HTE, and STJ. Table 1 provides a detailed discussion of these
variables.11These include Austria, Belgium, Czech Republic, Denmark, Finland, France,
Germany, Greece, Hungary, Ireland, Italy, Norway, Poland, Portugal, Romania, Spain,
Sweden, the Netherlands, and the UK.
Maradana et al. Journal of Innovation and Entrepreneurship (2017) 6:1 Page 19 of 23

12The involvement of ECT in the model depends upon the presence of cointegration
between innovation (any of the indicators from PAR, PAN, RDE, RRD, HTE, and STJ)
and per capita economic growth. The ECT will be removed in the estimation process,
if innovation and per capita economic growth are not cointegrated.13HQIC stands for Hannan-Quinn Information Criterion and it is the most appropriate
for choosing optimum lag length (see, for instance, Brooks (2014)).14It is with respect to PAR, PAN, RDE, RRD, HTE, and STJ.15Panel ADF stands for ADF—Fisher Chi-square panel unit root test (Maddala and
Wu 1999)16These include Austria, Belgium, Germany, Finland, Italy, France, the Netherlands,
and Sweden.17These include Czech Republic, Denmark, Greece, Hungary, Ireland, Italy, Norway,
Poland, Portugal, Spain, and the UK.18Detected through the significance of error correction term (ECT) (see Eqs. 1–4).19These include Austria, Belgium, Germany, Norway, Portugal, Sweden and the
European panel in case 1; Austria, Denmark, Finland, France, Germany, the
Netherlands, the UK and the European panel in case 2; Austria, Denmark, Finland,
the Netherlands, Norway, Romania, Spain, the UK and the European panel in case 3;
Hungary, Norway, Poland, Romania, Spain, the UK, and the European panel in case
4; Denmark, Germany, Italy, the Netherlands, Norway, Romania, Spain, Sweden, the
UK, and the European panel in case 5; and Austria, Belgium, Finland, France,
Germany, Italy, the Netherlands, Portugal, Spain, Sweden, the UK, and the European
panel in case 6.20These include Czech Republic, Greece, Ireland, Italy, Poland, Romania and Spain in
all the three cases.21The small sample size of this study may hinder the generalizability of our findings.
However, the sample size is well representative of a few countries and at the panel
level. Moreover, we have conducted some robustness checks for this analysis. These
include (1) deployment of normalized data for both innovation indicators and per capita
economic growth, (2) incorporation of additional unit root tests (KPSS (Kwiatkowski et al.
1992) unit root test at the individual country and LLC (Levine et al. 2002) unit root test at
the panel level) to know the order of integration, (3) deployment of additional
cointegration tests (Engle and Granger (1987) at individual country level and Pedroni
(1999) test at the panel level), and (4) testing the VECM/VAR model by changing lag
structure. Our results are more or less consistent with these robustness checks.22It is mostly due to the involvement of different innovation indicators, namely PAR,
PAN, RDE, RRD, HTE, and STJ.
AcknowledgementsAn earlier version of this paper was presented at the 2nd North America Conference on Cities and Regions: ManagingGrowth and Change, Georgia Institute of Technology, Atlanta, USA, June 15–17, 2016. We thank the conferenceparticipants for helpful comments and suggestions.
Authors’ contributionsWe declare that all authors have equal contribution in this paper. All authors read and approved the final manuscript.
Competing interestsThe authors declare that they have no competing interests.
Received: 18 August 2016 Accepted: 16 December 2016
Maradana et al. Journal of Innovation and Entrepreneurship (2017) 6:1 Page 20 of 23

ReferencesAgenor, P., & Neanidis, K. C. (2015). Innovation, public capital, and growth. Journal of Macroeconomics, 44(3), 252–275.Aghion, P. and Howitt, P. (1992). A Model of Growth through Creative Destruction. Econometrica, 60(2), 323–351.Aghion, P., & Howitt, P. (2009). The economics of growth. Cambridge: MIT Press.Aghion, P., Bloom, N., Blundell, R., Griffith, R., & Howitt, P. (2005). Competition and innovation: an inverted U
relationship. Oxford Journals, Quaterly Journal of Economics, 120(2), 701–728.Aghion, P., Harmgart, H., and Weisshaar, N. (2010). Fostering growth and CEE countries: a country-tailored approach to
growth policy. European Bank for Reconstruction and Development (EBRD). Working Paper No., 118/2010,pp. 1–29. EBRD, London.
Almeida, P., & Kogut, B. (1999). Localization of knowledge and the mobility of engineers in regional networks.Management Science, 45(7), 905–917.
Andergassen, R., Nardini, F., & Ricottilli, M. (2009). Innovation and growth through local and global interaction. Journalof Economic Dynamics and Control, 33(10), 1779–1795.
Audretsch, D. B., & Feldman, M. P. (1996). R&D spillovers and the geography of innovation and production. AmericanEconomic Review, 86(3), 630–640.
Bae, S. H., & Yoo, K. (2015). Economic modelling of innovation in the creative industries and its implications.Technological Forecasting and Social Change, 96, 101–110.
Bayoumi, T., Coe, D. T., & Helpman, E. (1999). R&D spillovers and global growth. Journal of International Economics,47(2), 399–428.
Bottazzi, L., & Peri, G. (2003). Innovation and spillovers in regions: evidence from European patent data. EuropeanEconomic Review, 47(4), 687–710.
Brooks, C. (2014). Introductory econometrics for finance. Cambridge: Cambridge University Press.Cameron, G. (1998). Innovation and growth: a survey of the empirical evidence. Working Paper, Nuffield College, Oxford
University, OxfordCetin, M. (2013). The hypothesis of innovation-based economic growth: a causal relationship. International Journal of
Economic and Administrative Studies, 6(11), 1–16.Coad, A., Segarra, A., & Teruel, M. (2016). Innovation and firm growth: does firm age play a role? Research Policy, 45(2),
387–400.Coe, D. T., & Helpman, E. (1995). International R&D spillovers. European Economic Review, 39(5), 859–887.Corrado, C., Haskel, J., Jona-Lasinio, C., and Iommi, M. (2012). Intangible capital and growth in advanced economies:
measurement methods and comparative results. Discussion Paper, No. 6733. Institute for the Study of Labor (IZA), Bonn.Corrado, C., Haskel, J., Jona-Lasinio, C., & Iommi, M. (2013). Innovation and intangible investment in Europe, Japan, and
the United States. Oxford Review of Economic Policy, 29(2), 261–286.Dachs, B., & Peters, B. (2014). Innovation, employment growth, and foreign ownership of firms: a European perspective.
Research Policy, 43(1), 214–232.de Serres, A., Kobayakawa, S., Sløk, T., and Vartia, L. (2006). Regulation of financial systems and economic growth, OECD
Economics Department Working Paper No. 506. Paris: Organisation for Economic Co-operation and Development.Dickey, D. A., & Fuller, W. A. (1981). Likelihood ratio statistics for autoregressive time series with a unit root.
Econometrica, 49(4), 1057–1072.Dosi, G. (1988). Sources, procedures, and macroeconomic effects of innovation. Journal of Economic Literature, 26(3),
1120–1171.Engle, R. F., & Granger, C. W. J. (1987). Cointegration and error correction: representation, estimation and testing.
Econometrica, 55(2), 251–276.Fagerberg, J. (1994). Technology and international differences in growth rates. Journal of Economic Literature, 32(3),
1147–1175.Fan, P. (2011). Innovation capacity and economic development: China and India. Economic Change and Restructuring,
44(1–2), 49–73.Fisher, R. A. (1932). Statistical methods for research workers (4th ed.). Edinburgh: Oliver & Boyd.Freeman, C., & Soete, L. (1997). The economics of industrial innovation. Cambridge: MIT Press.Furman, J., Porter, M. E., & Stern, S. (2002). The determinants of national innovative capacity. Research Policy, 31, 899–933.Galindo, M., & Mendez-Picazo, M. (2013). Innovation, entrepreneurship and economic growth. Management Decision,
51(3), 501–514.Galindo, M., & Mendez-Picazo, M. (2014). Entrepreneurship, economic growth, and innovation: are feedback effects at
work. Journal of Business Research, 67(5), 825–829.Garcia, R., & Calantone, R. (2002). A critical look at technological innovation typology and innovativeness terminology: a
literature review. Journal of Product Innovation Management, 19(2), 110–132.Goel, R. K., & Ram, R. (1994). Research and development expenditures and economic growth: a cross-country study.
Economic Development and Cultural Change, 42(2), 403–411.Granger, C. W. (1986). Developments in the study of cointegrated economic variables. Oxford Bulletin of Economics and
Statistics, 48(3), 213–228.Granger, C. W. J. (1988). Some recent developments in a concept of causality. Journal of Econometrics, 39(1–2), 199–211.Griliches, Z. (1990). Patent statistics as economic indicators: a survey. Journal of Economic Literature, 28(4), 1661–1707.Griliches, Z. (1992). The search for R&D spillovers. Scandinavian Journal of Economics, 94(1), 29–47.Griliches, Z., & Mairesse, J. (1986). R&D and productivity growth: comparing Japanese and US manufacturing firms.
European Economic Review, 21(1–2), 89–119.Grossman, V. (2009). Entrepreneurial innovation and economic growth. Journal of Macroeconomics, 31(4), 602–613.Grossman, G., & Helpman, E. (1991). Innovation and growth in the global economy. Cambridge: MIT Press.Grossman, G. M., & Helpman, E. (1994). Endogenous innovation in the theory of growth. Journal of Economic
Perspectives, 8(1), 23–44.Guloglu, B., & Tekin, R. B. (2012). A panel causality analysis of the relationship among research and development,
innovation, and economic growth in high-income OECD countries. Eurasian Economic Review, 2(1), 32–47.
Maradana et al. Journal of Innovation and Entrepreneurship (2017) 6:1 Page 21 of 23

Hanley, A., Liu, W. and Vaona, A. (2011). Financial development and innovation in China: evidence from the provincialdata. Kiel Working Paper, No. 1673. Kiel Institute of World Economy, Hindenburgufer.
Hassan, I., & Tucci, C. L. (2010). The innovation-economic growth nexus: global evidence. Research Policy, 39(10), 1264–1276.Holtz-Eakin, D., Newey, W., & Rosen, H. S. (1988). Estimating vector auto regressions with panel data. Econometrica, 56(6),
1371–1395.Howells, J. (2005). Innovation and regional economic development: a matter of perspective? Research Policy, 34(8),
1220–1234.Hsu, P. H., Tian, X., & Xu, Y. (2014). Financial development and innovation: cross-country evidence. Journal of Financial
Economics, 112(1), 116–135.Hsu, C., Lien, Y., & Chen, H. (2015). R&D internationalization and innovation performance. International Business Review,
24, 187–195.Huang, K. F. (2011). Technology competencies in competitive environment. Journal of Business Research, 64(2), 172–179.Hudson, J., & Minea, A. (2013). Innovation, intellectual property rights, and economic development: a unified empirical
investigation. World Development, 46(1), 66–78.Johansen, S. (1988). Statistical analysis of cointegration vectors. Journal of Economic Dynamics and Control, 12(2–3), 231–254.Kim, J., & Lee, S. (2015). Patent databases for innovation studies: a comparative analysis of USPTO, EPO, JPO and KIPO.
Technological Forecasting and Social Change, 92, 332–345.King, R., & Levine, R. (1993). Finance, entrepreneurship and economic growth: theory and evidence. Journal of Monetary
Economics, 32(3), 513–542.Kirchhoff, B. A. (1994). Entrepreneurship and dynamic capitalism: the economics of business firm formation and growth.
Westport: Praeger.Kwiatkowski, D., Phillips, P. C. B., Schmidt, P., & Shin, Y. (1992). Testing the null hypothesis of stationarity against the
alternative of a unit root. Journal of Econometrics, 54(1–3), 159–178.Laeven, L., Levine, R., & Michalopoulos, S. (2015). Financial innovation and endogenous growth. Journal of Financial
Intermediation, 24(1), 1–24.Levine, A., Lin, C. F., & Chu, C. S. (2002). Unit root tests in panel data: asymptotic and finite sample properties. Journal of
Econometrics, 108(1), 1–24.Maddala, G. S., & Wu, S. (1999). A comparative study of unit roots with panel data a new simple test. Oxford Bulletin of
Economics and Statistics, 61(4), 631–651.Malerba, F., & Brusoni, S. (2007). Perspectives on innovation. Cambridge: Cambridge University Press.Mandel, M. (2009). The failed promise of innovation in the US. Businessweek, June 3, 26–34.Mansfield, E. (1972). Contribution of research and development to economic growth of the United States. Papers and
Proceedings of a Colloquium on Research and Development and Economic Growth Productivity, National ScienceFoundation, Washington DC.
Maurseth, P. B., & Verspagen, B. (2002). Knowledge spillovers in Europe: a patent citation analysis. Scandinavian Journalof Economics, 104(4), 531–545.
Nadiri, I. (1993). Innovations and technological spillovers. Working Paper, No. 423, National Bureau of EconomicResearch, Cambridge, MA.
Navas, A. (2015). Trade liberalisation and innovation under sector heterogeneity. Regional Science and Urban Economics,50, 42–62.
OECD. (2005a). Oslo manual: guidelines for collecting and interpreting innovation data (3rd ed.). Paris: Organization forEconomic Cooperation and Development (OECD).
OECD. (2005b). Economics Policy Reforms 2005: going for growth. Paris: OECD.OECD. (2007). Innovation and growth: rationale for an innovation strategy. Paris: OECD.Pedroni, P. (1999). Critical values for cointegration tests in heterogeneous panels with multiple regressors. Oxford
Bulletin of Economics and Statistics, 61(4), 653–670.Petrakis, P. E., Kostis, P. C., & Valsamis, D. G. (2015). Innovation and competitiveness: culture as a long-term strategic
instrument during the european great recession. Journal of Business Research, 68, 1436–1438.Pradhan, R. P., Arvin, M. B., Hall, J. H., and Nair, M. (2016). Innovation, financial development and economic growth in
eurozone countries. Applied Economics Letters, 23(16), 1141–1144.Raymond, L., & St-Pierre, J. (2010). R&D as a determinant of innovation in manufacturing SMEs: an attempt at empirical
clarification. Technovation, 30(1), 48–56.Rogers, E. (1995). Diffusion of innovations. New York: New York Free Press.Roig-Tierno, N., Alcazar, J., & Ribeiro-Navarrete, S. (2015). Use of infrastructures to support innovative entrepreneurship
and business growth. Journal of Business Research, 68, 2290–2294.Romer, P. M. (1986). Increasing returns and long-run growth. Journal of Political Economy, 94, 1002–1037.Romer, P. M. (1990). Endogenous technological change. Journal of Political Economy, 98(5), S71–S102.Sadraoui, T., Ali, T. B., & Deguachi, B. (2014). Economic growth and international R&D cooperation: a panel granger
causality analysis. International Journal of Econometrics and Financial Management, 2(1), 7–21.Samila, S. and Sorenson, O. (2011). Venture Capital, Entrepreneurship, and Economic Growth. Review of Economics and
Statistics, 93(1), 338–349.Santacreu, A. M. (2015). Innovation, diffusion, and trade: theory and measurement. Journal of Monetary Economics, 75, 1–20.Schumpeter, J. A. (1911). The theory of economic development. Cambridge: Harvard University Press.Schumpeter, J. A. (1912). The theory of the economic development: an inquiry into profits, capital, credit, interest and
business cycle. Cambridge: Harvard Press.Sinha, D. (2008). Patents, innovations and economic growth in Japan and South Korea: evidence from individual
country and panel data. Applied Econometrics and International Development, 8(1), 181–188.Sohag, K., Begum, R. A., Abdullah, S. M. S. and Jaafar, M. (2015). Dynamics of energy use, technological innovation,
economic growth and trade openness in Malaysia. Energy, 1–11 (in press). doi:10.1016/j.energy.2015.06.101.Solow, R. (1956). A contribution to the theory of economic growth. Quarterly Journal of Economics, 70(1), 65–94.Stokey, N. L. (1995). R&D and economic growth. Review of Economic Studies, 28(4), 1661–1707.
Maradana et al. Journal of Innovation and Entrepreneurship (2017) 6:1 Page 22 of 23

Tellis, G. J., Eisingerich, A. B., Chandy, R. K., & Prabhu, J. C. (2008). Competing for the future: patterns in the global location ofR&D centers by the world’s largest firms. ISBM Report 06–2008. University Park: Institute for the Study of Business Markets.
Tsvetkova, A. (2015). Innovation, entrepreneurship, and metropolitan economic performance: empirical test of recenttheoretical propositions. Economic Development Quarterly, 29(4), 299–316.
Ulku, H. (2004). R&D, innovation, and economic growth: an empirical analysis. International Monetary Fund WorkingPapers, 4(185), 2-35.
Veugelers, R., & Schweiger, H. (2016). Innovation policies in transition countries: one size fits all? Economic Change andRestructuring, 49, 241–267.
Wal, A. T., & Boschma, R. (2009). Applying social network analysis in economic geography: framing some key analyticissues. Annals of Regional Science, 43(3), 739–756.
Wang, P. K., Ho, Y. P., & Autio, E. (2005). Entrepreneurship, innovation and economic growth: evidence from GEM data.Small Business Economics, 24(3), 335–350.
Wennekers, S. (1999). Linking entrepreneurship and economic growth. Small Business Economics, 13(1), 27–55.Yang, C. (2006). Is innovation the story of Taiwan’s economic growth? Journal of Asian Economics, 17(5), 867–878.
Submit your manuscript to a journal and benefi t from:
7 Convenient online submission
7 Rigorous peer review
7 Immediate publication on acceptance
7 Open access: articles freely available online
7 High visibility within the fi eld
7 Retaining the copyright to your article
Submit your next manuscript at 7 springeropen.com
Maradana et al. Journal of Innovation and Entrepreneurship (2017) 6:1 Page 23 of 23