does inflation targeting matter for attracting foreign ...cerdi.org/uploads/ed/2012/2012.03.pdf ·...
TRANSCRIPT
CERDI, Etudes et Documents, E 2012. 03
0
C E N T R E D ' E T U D E S
E T D E R E C H E R C H E S
S U R L E D E V E L O P P E M E N T
I N T E R N A T I O N A L
Document de travail de la série
Etudes et Documents
E 2012.03
Does Inflation Targeting Matter for Attracting Foreign Direct
Investment into Developing Countries?
René TAPSOBA
Février 2012
CERDI
65 BD. FRANÇOIS MITTERRAND 63000 CLERMONT FERRAND - FRANCE
TEL. 04 73 17 74 00 FAX 04 73 17 74 28
www.cerdi.org

CERDI, Etudes et Documents, E 2012. 03
1
L'auteur
René Tapsoba
PhD Student, Clermont Université, Université d’Auvergne, CNRS, UMR 6587, Centre d’Etudes et
de Recherches sur le Développement International (CERDI), F-63009 Clermont-Ferrand, France
Email : René[email protected]
La série des Etudes et Documents du CERDI est consultable sur le site :
http://www.cerdi.org/ed
Directeur de la publication : Patrick Plane
Directeur de la rédaction : Catherine Araujo Bonjean
Responsable d’édition : Annie Cohade
ISSN : 2114-7957
Avertissement :
Les commentaires et analyses développés n’engagent que leurs auteurs qui restent seuls
responsables des erreurs et insuffisances.
CERDI, Etudes et Documents, E 2012. 03
2
Abstract:
This paper investigates the effect of Inflation Targeting (IT) on Foreign Direct Investment
(FDI). Based on panel data of 53 developing countries over the period 1980-2007, this study
is the first, to the best of the author’s knowledge, to evaluate directly the effect of IT on FDI.
Using a variety of propensity scores-matching methods which allow controlling for self-
selection in policy adoption, it finds that the treatment effect of IT on FDI is positive,
statistically significant and robust to a set of alternative specifications. In terms of policy
recommendations, this finding therefore suggests that if well implemented, IT adoption can be
a legitimate part of the policy toolkit available to policymakers in developing countries in
their competition to attract more FDI.
JEL Codes : C21, E31, E52, E58, F21, G11.
Keywords: Inflation Targeting, Foreign Direct Investment, Propensity Scores-Matching,
Developing Countries.
Acknowledgements
I am grateful to, Combes J-L., Ebéké C., Minea, A., Turcu C., Duvivier C., Léon F. and S.A. Tapsoba for their helpful comments on an earlier draft of this paper. I would also like to thank participants in seminars (CERDI, Orléans-CERDI-CES-Graduate Institute Doctoral Meeting) for their comments and suggestions.

CERDI, Etudes et Documents, E 2012. 03
3
1. Introduction
Does Inflation Targeting –IT hereafter- help attracting Foreign Direct Investment –
FDI hereafter- into developing countries? This paper aims to address this question on the
basis of an empirical study on a sample of 53 developing countries over the period 1980-
2007. Since its first adoption by the Central Bank of New Zealand in 1990, the popularity of
IT has grown considerably. Twenty-six central banks use it currently as their operational
framework for the conduct of monetary policy and many others, especially in Developing
countries, are planning to move towards it.1 According to the proponents of IT, this new
monetary policy framework, by increasing the transparency and the accountability of the
central bank, enhances its credibility, allowing it to tackle the time inconsistency problem
(Bernanke et al., 1999).2 Accordingly, IT adoption helps anchoring credibly inflation
expectations and stabilizing the macroeconomic environment. However, Epstein (2007)
challenged the merits of IT, namely its ability, inter alia, to attract more FDI. Attempting to
answer the question whether or not IT has helped developing countries to attract more FDI, he
pointed out the lack of direct studies evaluating the effect of IT on FDI. It is therefore
important to fill this gap in the empirical literature by highlighting the effect of IT on FDI.
The classical FDI push-pull factors literature distinguishes two kinds of factors
affecting the inflows of FDI: the external or push factors and the domestic or pull factors
(Asiedu, 2002; Calvo et al., 1996; Fernandez-Arias, 1996; Gastanga et al., 1998; Kim, 2000;
Kinda, 2010; Montiel and Reinhart, 1999; Root and Ahmed, 1979; Schneider and Frey, 1985).
Push factors represent the economic conditions in the developed countries and reflect the
1 See Roger (2009). Three other countries, Finland, Spain and the Slovak Republic adopted IT but abandoned it when they began to use the euro as their currency. 2 IT is a framework for monetary policy characterized by five main elements: “ (i) the public announcement of medium-term
numerical targets for inflation; (ii) an institutional commitment to price stability as the primary goal of monetary policy, to which other goals are subordinated; (iii) an information-inclusive strategy in which many variables, and not just monetary aggregates or the exchange rate, are used for deciding the setting of policy instruments; (iv) increased transparency of the monetary-policy strategy through communication with the public and the markets about the plans, objectives, and decisions of the monetary authorities; and (v) increased accountability of the central bank for attaining its inflation objectives” (Mishkin, 2000).

CERDI, Etudes et Documents, E 2012. 03
4
opportunity cost in investing in these countries. Pull factors concern the macroeconomic
conditions and the institutional environment in the recipient countries. With respect to this
literature, IT may be related to the pull factors in that it affects the domestic macroeconomic
conditions. Indeed, the increased credibility that IT gives the central bank makes it easier for
the financial markets and the private sector to infer the central bank’s intentions from
monetary policy announcements (Geraats et al., 2006). IT adoption therefore gives the
financial markets and the private sector a transparent and predictable framework to plan their
future investment decisions. This increased transparency and predictability lower policy
uncertainty, which in turn decreases the transaction and the access to information costs. As a
result, the expected return rates and the productivity prospects increase, making investment
decisions easier, especially the longer-term ones since the cash-flows attached to them
become less uncertain (Serven, 1998). Given that FDI requires long term investment
decisions, such a sound macroeconomic environment induced by IT should be conducive to
larger inflows of FDI into Developing countries. Indeed, due to the large sunk costs involved
by FDI, their levels and their localization depend heavily on the confidence of the foreign
investors regarding the soundness of the macroeconomic environment (Fischer, 1993).
A vast strand of the empirical literature also found evidence supporting the idea that IT
allows creating a sound and stable macroeconomic environment, especially in Developing
countries. IT adoption has been followed by a downward trend in inflation dynamics, interest
rates levels and exchange rate pass-through, and this has been achieved without an increase in
output volatility, particularly in Developing countries (Batini and Laxton, 2007; Gonçalves
and Salles, 2008; IMF, 2005; Lin and Ye, 2009; Mishkin, 2007). By improving key
macroeconomic variables, especially average inflation and its volatility, IT should help
attracting more FDI into Developing countries since inflation is known to be negatively
associated with FDI in the pull factors literature.

CERDI, Etudes et Documents, E 2012. 03
5
However, it is worth noting that some empirical studies challenged these
macroeconomic benefits of IT. On a sample of developed countries, Ball and Sheridan (2005)
find no significant difference between the IT countries and the non IT countries in terms of
inflationary performances. More recently, Brito and Bystedt (2010) showed that in the
emerging IT countries, the lower inflation levels recorded have been achieved at the cost of a
lower real output growth rate. In other words, the sacrifice ratios associated with IT have not
decreased in these emerging countries relatively to those induced by the alternative
frameworks for monetary policy. Accordingly, one could also assume that IT might lead to
lower FDI into the emerging countries. Indeed, in line with the FDI pull factors literature, a
lower real output growth rate may makes less optimistic the expectations of productivity gains
and profit prospects, discouraging foreign investors to enter the economy.
Overall, it follows that the effect of IT on FDI into Developing countries is ambiguous
à priori and needs to be addressed empirically. Using panel data of 53 Developing countries,
of which 20 that have adopted IT by the end of 2007, this paper analyzes the relationship
between IT and FDI over the period 1980-2007. Such an exercise is interesting in that it will
not only shed light on the debate relative to the question raised by Epstein (2007), but might
also reveal an additional ingredient helping developing countries to attract more FDI.
Attracting FDI is especially important for developing countries because it is well-known that
they are sometimes characterized by an insufficient mobilization of domestic resources,
though essential to sustain economic growth and pursue the development agenda. In the
current context of drying in aid inflows toward these countries, combined with their lesser
access to financial markets, attracting more FDI may therefore be a solution to close the
domestic saving gaps in these countries. In addition, FDI is not only the most stable external
capital flowing into Developing countries, but also an excellent vehicle for the transfer of
technology, knowledge and managerial skills into these countries.

CERDI, Etudes et Documents, E 2012. 03
6
The remainder of the paper is organized as follows: section two presents the
econometric methodology and introduces the dataset. Section 3 shows the estimation results
while section 4 considers some robustness checks. Section 5 briefly concludes and draws
some policy recommendations.
2. Methodology and Data
Our objective is to evaluate the treatment effect of IT on FDI in the countries having
adopted IT (ITer hereafter), the so-called average treatment effect on the treated (ATT),
]1[]1[]1)[( 0101 =−===−= iiiiiii ITYEITYEITYYEATT (1)
where iIT is the IT dummy variable. 1iY is the value of the outcome variable when the country
i has adopted IT and 0iY if not. 1/0 =ii ITY is the outcome value that would have been
observed if an ITer had not adopted IT regime, and 1/1 =ii ITY the outcome value really
observed on the same IT country. Equation (1) is telling us that a simple comparison between
the outcome value (FDI in our case) observed in the treatment group (ITers) and the outcome
value observed in the same countries if they had not adopted IT would give us an unbiased
estimate of ATT. Unfortunately, it is not possible to observe this latter outcome value since we
cannot observe the FDI flowing into an IT country had it not adopted IT. We face here, as it is
common in non-experimental studies, an identification problem.
A common approach to circumvent this difficulty is to compare the sample mean FDI
of the treatment group (ITers) with that of the control group (non ITers) if and only if
assignment to the treatment is random. However, IT adoption may be non-random, as it may
be correlated with a set of observable variables that also affects the outcome variable, leading
CERDI, Etudes et Documents, E 2012. 03
7
to the so-called self-selection problem.3 Simple comparison of the sample mean FDI between
the two groups would then produce biased estimates of the ATT. As in Lin and Ye (2007), to
address this problem of selection on observables, we make use of a variety of propensity
scores matching methods recently developed in the treatment literature.
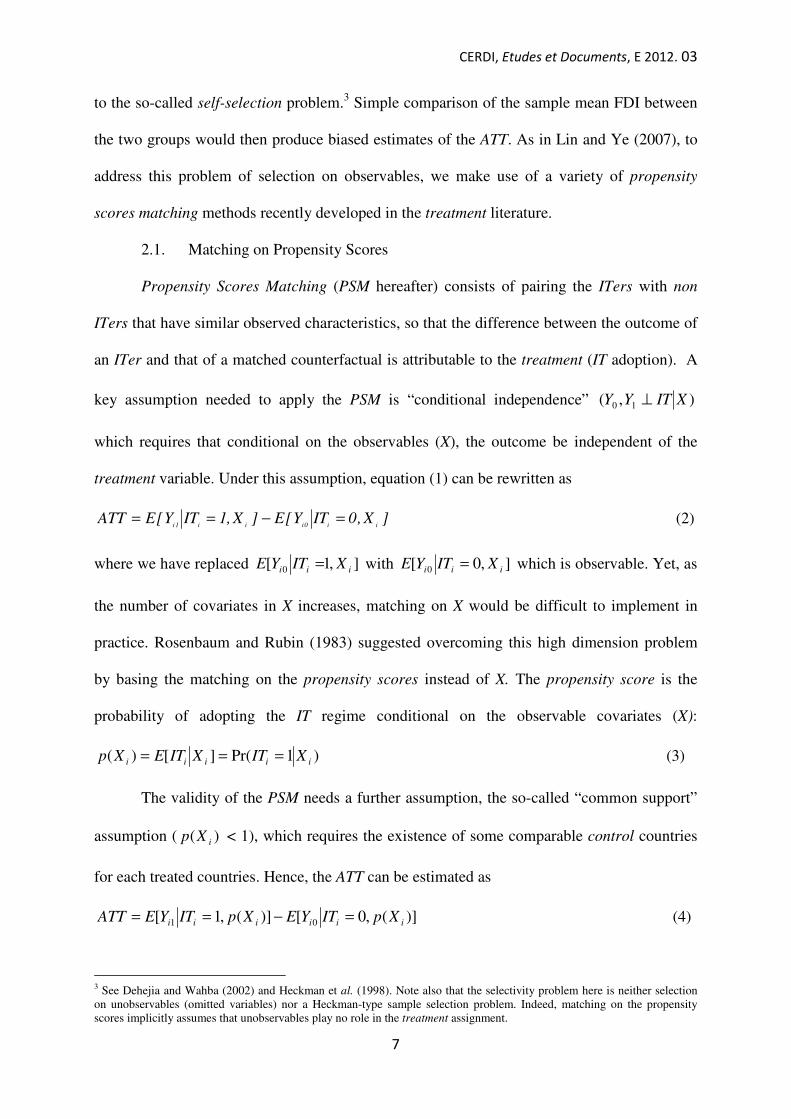
2.1. Matching on Propensity Scores
Propensity Scores Matching (PSM hereafter) consists of pairing the ITers with non
ITers that have similar observed characteristics, so that the difference between the outcome of
an ITer and that of a matched counterfactual is attributable to the treatment (IT adoption). A
key assumption needed to apply the PSM is “conditional independence” ),( 10 XITYY ⊥
which requires that conditional on the observables (X), the outcome be independent of the
treatment variable. Under this assumption, equation (1) can be rewritten as
]X,0ITY[E]X,1ITY[EATTii0iii1i
=−== (2)
where we have replaced ],1[ 0 iii XITYE = with ],0[ 0 iii XITYE = which is observable. Yet, as
the number of covariates in X increases, matching on X would be difficult to implement in
practice. Rosenbaum and Rubin (1983) suggested overcoming this high dimension problem
by basing the matching on the propensity scores instead of X. The propensity score is the
probability of adopting the IT regime conditional on the observable covariates (X):
)1Pr(][)( iiiii XITXITEXp === (3)
The validity of the PSM needs a further assumption, the so-called “common support”
assumption ( )( iXp < 1), which requires the existence of some comparable control countries
for each treated countries. Hence, the ATT can be estimated as
)](,0[])(,1[ 01 iiiiii XpITYEXpITYEATT =−== (4)
3 See Dehejia and Wahba (2002) and Heckman et al. (1998). Note also that the selectivity problem here is neither selection on unobservables (omitted variables) nor a Heckman-type sample selection problem. Indeed, matching on the propensity scores implicitly assumes that unobservables play no role in the treatment assignment.

CERDI, Etudes et Documents, E 2012. 03
8
2.2. Data
Our dataset consists of 53 Developing countries examined over the period 1980-2007.
This is an unbalanced panel because of missing data on some variables such as Central Bank
Turnover rate, control of corruption, financial openness and financial reforms. The sample is
composed of 20 Developing countries that have adopted IT by the end of 2007 (called ITers
or treatment group) and 33 non ITers (control group). For purpose of comparability, our
sample relies on Lin and Ye (2009) and has been enriched thereafter in several aspects.4
While the sample in Lin and Ye (2009) spanned from 1985 to 2005, ours covers a larger
period, spanning from 1980 to 2007. Accordingly, some countries such as Guatemala,
Romania, Slovak Republic and Turkey that adopted IT between 2005 and 2006 and were
therefore in the control group in Lin and Ye (2009) are treated as ITers in our study.
Furthermore, Serbia and Ghana that adopted IT respectively in 2006 and 2007 are included in
our sample whereas they were absent in Lin and Ye (2009).
ITers along with their starting dates can be found at Appendix B. Data on the starting
dates come from Rose (2007) and have been supplemented with data from Roger (2009)
regarding IT adoption between 2005 and 2007. An important issue in evaluating the treatment
effect of IT is the sensitivity of the result regarding the chosen starting dates. Following Rose
(2007), we consider two kinds of dates: default starting dates and conservative starting dates.5
Indeed, some central banks first implemented a “partial” IT before moving gradually to Full-
Fledged IT. For instance, Chile has two IT starting dates: a default starting date (1991)
corresponding to a “partial” IT, characterized by a mixture of IT and a crawling exchange rate
regime, and a conservative starting date (1999) corresponding to a full-fledged IT. Israel also
implemented IT together with a widening exchange rate band in 1992 before abandoning the
4 The country list can be found at Appendix A. China Macao has been dropped because of lack of available data. The
developing countries category considered here refers to the World Bank classification, thus includes both low-income countries and emerging-market countries. 5 The conservative starting dates refer to dates corresponding to the implementation of a Full-fledged IT, while the default
starting dates refer to a “partial or informal” IT. Under partial IT, the central bank does not have IT as its framework for monetary policy exclusively: it sometimes accompany IT with a monetary targeting or an exchange rate targeting.

CERDI, Etudes et Documents, E 2012. 03
9
exchange rate target in 1997 and to commit explicitly to full-fledged IT. Mexico’s default
starting date (1999) corresponds to a mixture of IT and monetary targeting while its
conservative starting date (2001) refers to Full-Fledged IT. Accordingly, it is important to
make sure that the estimated treatment effect of IT upon FDI is not driven by the chosen
starting dates of IT. We therefore employ alternatively the two kinds of starting dates to
investigate whether the effect of IT on FDI differs depending on the starting dates employed.
Data on FDI come from the World Development Indicators (WDI, 2009). These are
the net inflows of FDI as GDP percentage and represent the net inflows of investments aiming
to acquire a lasting management interest (10 percent or more of voting right) in an enterprise
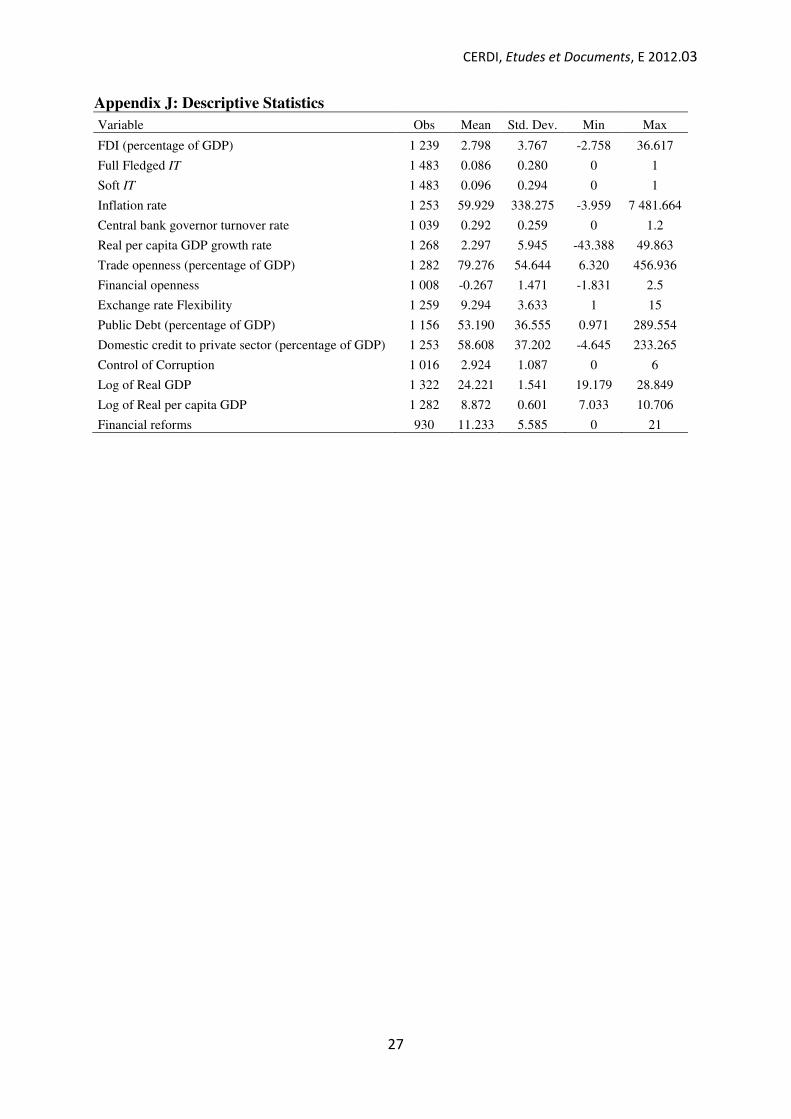
operating in an economy other than that of the investor. Definitions, sources and descriptive
statistics of the other variables can be found in Appendices I and J.
3. Estimation results
3.1. Estimating the propensity scores (PS)
We estimate the PS using a probit model with the binary variable IT as the dependent
variable.6 The explanatory variables are twofold: on the one hand, we account for the fact that
a country should reasonably adopt IT after having met some preconditions, and on the other
hand, we consider the likelihood for a country to adopt an alternative framework for monetary
policy (exchange rate targeting and money growth targeting).7
As precondition variables we include the lagged inflation rate, central bank governors’
turnover rates (reverse proxy for the independence of the central bank), public debt over GDP,
Real per capita GDP growth rate, Domestic Credit to private sector as GDP percentage (proxy
for financial development) institutional quality (proxied by the ICRG index for control of
corruption), and financial openness. We expect a negative correlation between the probability
6 Logit model does not change the results significantly. 7 According to the conditional independence assumption, omitting in the probit model, variables that systematically affect the
targeting probability but do not affect FDI, has little influence on results (Persson, 2001). In other words, an estimate bias occurs only if we omit an explanatory variable that simultaneously affect FDI and the probability of adopting IT. We give much attention to this issue when selecting variables in the probit model.

CERDI, Etudes et Documents, E 2012. 03
10
of IT adoption and the first three variables.8 We expect a negative correlation between the
probability of IT adoption and the real per capita GDP growth rate. Indeed, a high GDP
growth rate may be viewed as the result of successful macroeconomic policies, which implies
no need to adopt an alternative monetary policy framework. Regarding financial development
and financial openness, we expect them to be correlated positively with the probability of IT
adoption. Indeed, a well developed financial system gives the central bank a higher capacity
to implement monetary policy more effectively. Financial development should therefore be
correlated positively with IT adoption. Moreover, for some countries, namely Central and
Eastern European Countries (CEEC), IT has been adopted simultaneously with a wave of
other reforms, including financial openness (Roger, 2009). Consequently, one should expect a
positive correlation between financial openness and the probability of IT adoption. The
expected sign on institutional quality is ambiguous à priori. On the one hand, a high
institutional quality may reflect a better capacity to implement IT credibly. Indeed such a high
quality of institutions will be viewed by financial markets as a signal that the central bank will
be supported by the government to hit its inflation target. As a result, a higher institutional
quality should affect the probability of adopting IT positively. But on the other hand, it may
be assumed that a country chooses to adopt IT as a tool to “tie its own hand” and to improve
the quality of its institutions. In this sense, the expected sign of the effect of institutional
quality on the probability of IT adoption should be negative. Concerning the second set of
controls, we choose trade openness and exchange rate flexibility. We expect them to be
correlated negatively with the probability of IT adoption (see Lin and Ye, 2009).
8 Indeed, a country should adopt IT when its inflation rate is at reasonably low level, preferably after a successful disinflation (Masson et al., 1997). Moreover, a high debt ratio should determine negatively IT adoption since this may be interpreted by the financial markets as the sign of a future pressure of the government on the central bank for monetizing the public debt, which will prevents it from hitting its inflation target. Finally, Operational independence –and not necessarily independence of goal- of the central bank is a desirable precondition for IT adoption (Mishkin, 2000). It is therefore reasonable to expect a negative correlation between the reverse proxy for central bank independence –turnover rate- and the probability of IT
adoption.

CERDI, Etudes et Documents, E 2012. 03
11
Table 1 below reports the probit estimates of the PS. The benchmark model [1] based
on the conservative starting dates of IT supports our intuition, as most coefficients are
significant and have the expected sign.9 Lagged inflation, central bank governors’ turnover
rate, debt ratio, control of corruption and trade openness are correlated negatively with IT
adoption, while real per capita GDP growth rate, domestic credit to the private sector and
exchange rate flexibility enhance the targeting probability. The overall fit of the regression is
also quite reasonable, with the pseudo-R-squared around 0.432.
3.2. Results from matching
Based on the PS estimated above, we employ four commonly used methods to match
each ITer with non-ITers, depending on the closeness of their scores to that of the ITer.10
First, the nearest neighbor matching with replacement, which matches each treated country to
the N control countries that have the closest PS (we use 1=N , 2=N and 3=N ). Second,
the radius matching, which performs the matching based on PS falling within a certain radius
or “caliper” R (we use a small radius R=0.005, a medium radius R=0.01 and a wide radius
R=0.03). The third method is the regression-adjusted local linear matching developed by
Heckman et al. (1998). Fourth, we consider the kernel matching, which matches an ITer to all
non-ITers weighted proportionally to their closeness to the treated country. As the matching
estimator presents no analytical variance, we compute standard errors by bootstrapping (i.e.
by re-sampling the observations of the control group, see Dehejia and Wahba, 2002).
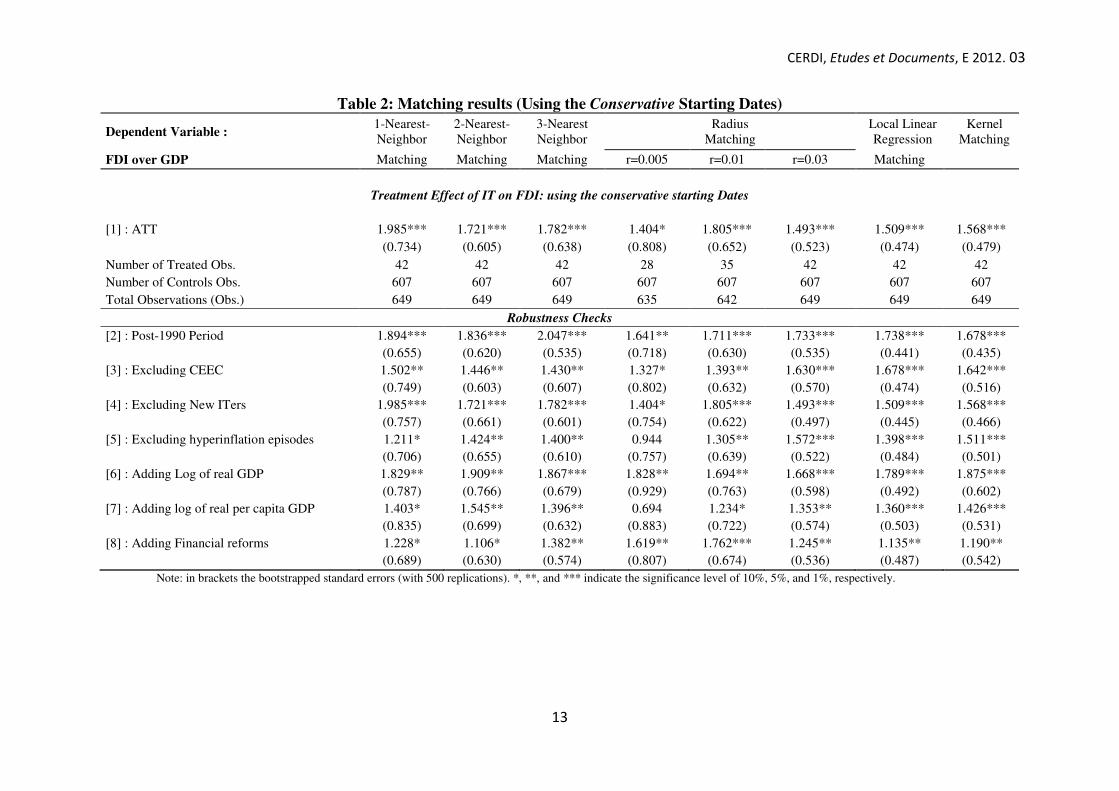
The upper panel of Table 2 below reports the estimated ATT of IT on FDI based on the
conservative starting dates. Irrespective of the matching method, the estimation results show
9 Except the estimated coefficient of the real per capita GDP growth rate which is positive whereas we expected it to be negative. 10 While matching ITers to non-ITers, we employ the “common support” option. With this option, we exclude the treated countries whose the PS is higher than the maximum or less than the minimum PS of the untreated countries.

CERDI, Etudes et Documents, E 2012. 03
12
Table 1: Probit estimates of the propensity scores (using the Conservative Starting Dates) Dependent Variable IT (Conservative Starting Dates)
[1]
[2]
Post-1990
[3]
No CEEC
[4]
No New ITers
[5]
No hyper-inflation [6] [7] [8]
Inflation lagged one year -0.125*** -0.123*** -0.174*** -0.125*** -0.125*** -0.127*** -0.129*** -0.147***
(0.023) (0.023) (0.032) (0.023) (0.023) (0.0254) (0.0246) (0.0288)
Governors’ turnover rate -1.785*** -1.147** -3.146*** -1.785*** -1.771*** -1.864*** -2.425*** -1.237**
(0.534) (0.566) (0.766) (0.534) (0.542) (0.630) (0.610) (0.587)
Debt ratio -0.015*** -0.017*** -0.020*** -0.015*** -0.016*** -0.0126*** -0.00825** -0.0088*
(0.004) (0.004) (0.005) (0.004) (0.004) (0.0039) (0.0035) (0.0048)
Real per capita GDP growth rate 0.016 0.010 0.005 0.016 0.010 0.00004 0.00112 0.0260
(0.023) (0.024) (0.028) (0.023) (0.024) (0.0254) (0.0217) (0.0252)
Domestic credit to private sector 0.001 -0.001 0.003 0.001 0.001 -0.0043 -0.0005 -0.0022
(0.003) (0.003) (0.003) (0.003) (0.003) (0.0027) (0.0025) (0.0035)
Financial openness 0.154** 0.086 0.1498* 0.154*** 0.156** 0.159** 0.0625 -0.289**
(0.075) (0.079) (0.088) (0.075) (0.075) (0.0701) (0.0720) (0.113)
Control of corruption -0.260** -0.297*** -0.455*** -0.260*** -0.283*** -0.204** -0.469*** -0.380***
(0.102) (0.110) (0.129) (0.102) (0.104) (0.101) (0.114) (0.124)
Trade openness -0.004* -0.004* -0.007*** -0.004* -0.004* -0.0023 -0.0096*** -0.0062***
(0.002) (0.002) (0.003) (0.002) (0.002) (0.0015) (0.0021) (0.0018)
Exchange rate flexibility 0.360*** 0.372*** 0.414*** 0.360*** 0.368*** 0.337*** 0.337*** 0.360***
(0.051) (0.053) (0.064) (0.051) (0.052) (0.0475) (0.0451) (0.0481)
Log of Real GDP
0.468***
(0.0824)
Log of real per capita GDP
1.368***
(0.254)
Financial reforms
0.278***
(0.0532)
No of observations 663 506 575 663 564 663 665 589
Pseudo R2 0.432 0.434 0.526 0.432 0.410 0.489 0.506 0.579
Note: Robust standard errors are reported in brackets. *, **, and *** indicate the significance level of 10%, 5%, and 1%, respectively. Constant are included (not reported).
CERDI, Etudes et Documents, E 2012. 03
13
Table 2: Matching results (Using the Conservative Starting Dates)
Dependent Variable : 1-Nearest- Neighbor
2-Nearest-Neighbor
3-Nearest Neighbor
Radius Matching
Local Linear Regression
Kernel Matching
FDI over GDP Matching Matching Matching r=0.005 r=0.01 r=0.03 Matching
Treatment Effect of IT on FDI: using the conservative starting Dates
[1] : ATT 1.985*** 1.721*** 1.782*** 1.404* 1.805*** 1.493*** 1.509*** 1.568***
(0.734) (0.605) (0.638) (0.808) (0.652) (0.523) (0.474) (0.479)
Number of Treated Obs. 42 42 42 28 35 42 42 42
Number of Controls Obs. 607 607 607 607 607 607 607 607
Total Observations (Obs.) 649 649 649 635 642 649 649 649
Robustness Checks
[2] : Post-1990 Period 1.894*** 1.836*** 2.047*** 1.641** 1.711*** 1.733*** 1.738*** 1.678***
(0.655) (0.620) (0.535) (0.718) (0.630) (0.535) (0.441) (0.435)
[3] : Excluding CEEC 1.502** 1.446** 1.430** 1.327* 1.393** 1.630*** 1.678*** 1.642***
(0.749) (0.603) (0.607) (0.802) (0.632) (0.570) (0.474) (0.516)
[4] : Excluding New ITers 1.985*** 1.721*** 1.782*** 1.404* 1.805*** 1.493*** 1.509*** 1.568***
(0.757) (0.661) (0.601) (0.754) (0.622) (0.497) (0.445) (0.466)
[5] : Excluding hyperinflation episodes 1.211* 1.424** 1.400** 0.944 1.305** 1.572*** 1.398*** 1.511***
(0.706) (0.655) (0.610) (0.757) (0.639) (0.522) (0.484) (0.501)
[6] : Adding Log of real GDP 1.829** 1.909** 1.867*** 1.828** 1.694** 1.668*** 1.789*** 1.875***
(0.787) (0.766) (0.679) (0.929) (0.763) (0.598) (0.492) (0.602)
[7] : Adding log of real per capita GDP 1.403* 1.545** 1.396** 0.694 1.234* 1.353** 1.360*** 1.426***
(0.835) (0.699) (0.632) (0.883) (0.722) (0.574) (0.503) (0.531)
[8] : Adding Financial reforms 1.228* 1.106* 1.382** 1.619** 1.762*** 1.245** 1.135** 1.190**
(0.689) (0.630) (0.574) (0.807) (0.674) (0.536) (0.487) (0.542)
Note: in brackets the bootstrapped standard errors (with 500 replications). *, **, and *** indicate the significance level of 10%, 5%, and 1%, respectively.
CERDI, Etudes et Documents, E 2012. 03
14
that IT adoption enhances FDI inflows, as the estimated ATT is positive and statistically
significant. The amplitude of the estimated ATT ranges from 1.404 (radius matching
R=0.005) to 1.985 (1-Nearest-neighbor) percentage points of GDP.
4. Robustness checks
Now we test the sensitivity of the results above to a set of alternative specifications.
First, we perform regressions on different sub-samples. We restrict the regressions to the post-
1990 period (column [2], Table 1) and exclude Central and Eastern European Countries
(CEEC) (column [3] in Table 1).11 Also, we exclude the New ITers (column [4] in Table 1)
from the treatment group. New ITers consist of the countries having adopted IT only since
2005 (Slovak Republic, Guatemala, Indonesia, Romania, Turkey, Serbia and Ghana) and were
therefore not included in the treatment group in Lin and Ye (2009).12 Accordingly, excluding
them from the analysis make our sample comparable to Lin and Ye (2009). As depicted by
columns [2], [3] and [4] of Table 1 and the first three lines in the bottom panel of Table 2, the
probit results and their corresponding results for the ATT are qualitatively similar to the ones
from the benchmark model.
Second, we discard the hyperinflation episodes (column [5] in Table 1).13 The probit
results and their corresponding results for the ATT (fourth line in the bottom panel of Table 2)
remain almost identical to the benchmark.
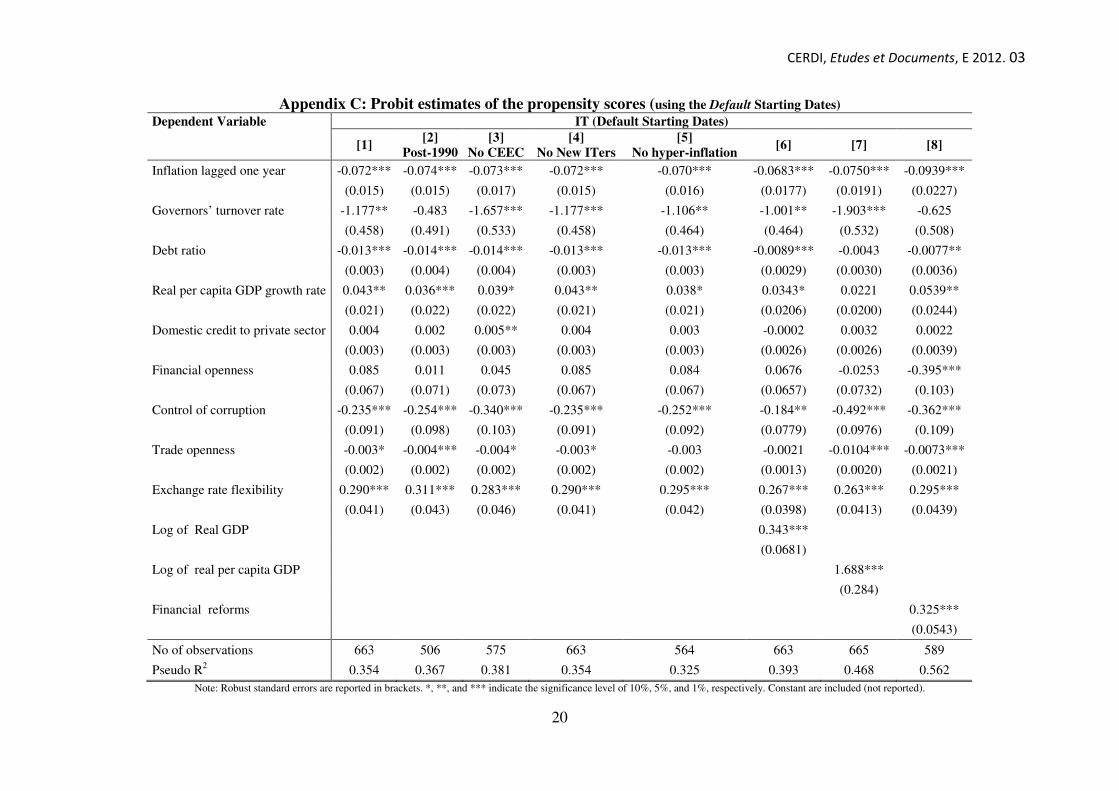
The third set of robustness checks consists of considering the default starting dates of
IT rather than the conservative ones, in order to make sure that our previous results are not
driven by the chosen starting dates. Columns [1] to [8] of Appendix C report the probit
11 As IT starts in 1990, performing the regression on the post-1990 period allows focusing more on the cross-countries differences in FDI (ITers versus non-ITers) rather than on time-differences (pre-IT versus post-IT period). Also, carrying out matching only on the post-1990 period allows us to check whether or not the benchmark matching results are not driven by a possible common-time trend effect. Regarding the exclusion of the CEEC, it allows testing whether the results above are not sensitive to the fact that the majority of the CEEC were created after 1990 whereas our sample spans from 1980 to 2007. 12 Note that Slovak Republic ceased IT to join the Euro area in 2009. But as our sample ends in 2007, this does not affect our results. 13 We discard observations for inflation higher than 40 percent (proxy for hyperinflation episodes) to check whether our results are not sensitive to these outliers.

CERDI, Etudes et Documents, E 2012. 03
15
estimates of the PS using this time the default starting dates. Except the coefficient on real
GDP growth rate which become statistically significant, the probit results do not change
significantly compared to those found previously with the conservative starting dates. The
matching results corresponding to these default starting dates are reported in Appendix D.
Irrespective of the matching estimator used, the results are almost similar to those found with
the conservative starting dates. The ATT of IT on FDI in Developing countries still is positive
and statistically significant.
Fourth, to make sure that we filter out sufficiently any possible polluting effect
resulting from observables known to affect both FDI and the targeting probability, we
augment the probit model by controlling respectively for country’s economic size (logarithm
of total GDP), country’s stage of development (logarithm of real GDP per capita) and for
macroeconomic financial reforms (financial reform index, Abiad et al. (2008)).14 Columns
[6], [7] and [8] of Table 1 show the probit results for the conservative starting dates of IT
while their corresponding results for the ATT are depicted in Table 2 (lines [6] to [8]). The
results remain robust to these new specifications: the probit results and the estimated ATT do
not change qualitatively and quantitatively. Note however that because of missing
observations, the inclusion of financial reform reduced considerably the sample size.
Finally, for the sake of further robustness check, we follow Vega and Winkelried
(2005) and apply matching to cross-sectional pretreatment observations. This approach
enables us to make sure that the results found previously with matching to panels do not skew
our conclusions. The main results do not change significantly with respect to this approach.15
15 For purpose of space economy, these results are not reported but are available upon request to the author.
CERDI, Etudes et Documents, E 2012. 03
16
5. Conclusion and policy implications
In this paper, we highlight the effect of Inflation Targeting (IT) on Foreign Direct
Investment (FDI) inflows into developing countries. Based on panel data of 53 Developing
countries over the period 1980-2007, this paper is the first, to the best of our knowledge, to
evaluate directly the effect of IT on FDI. Relying on the pull factors literature and using a
variety of propensity scores matching methods allowing us to control for self-selection in
policy adoption, we find that the Average Treatment effect (ATT) of IT on FDI is positive and
statistically significant. The magnitude of the contribution of IT to FDI inflows is rather
important, as IT enhances FDI inflows by at least 1.404 (radius matching r=0.005) and up to
1.985 percentage points of GDP (1-Nearest-neighbor), and the result is found to be robust to
several robustness checks.
Regarding the question raised by Epstein (2007), this paper fills the gap in the literature by
shedding light on the debate relative to the effect of IT on FDI: IT does help attracting more
FDI inflows into Developing countries. Consequently, in terms of policy recommendations,
this paper suggests that if well implemented, namely by fulfilling the necessary prerequisites
for a credible adoption, IT can be, in addition to the traditional pull factors, another legitimate
part of the policy toolkit available to policymakers in developing countries in their
competition to attract more FDI flows. This result is particularly important, since not only it is
well-known that FDI is the most stable external capital flowing into Developing countries,
allowing them to close their domestic savings gaps and finance the development agenda, but
also exhibit growth-promoting effects through the transfers of technology, knowledge and
managerial skills. However, it is worth noting that we are not suggesting that IT is the best
framework for monetary policy in Developing countries. We are just suggesting that in these
countries, when it comes to the competition for FDI attraction, IT seems to be more
appropriate.
CERDI, Etudes et Documents, E 2012. 03
17
References
Abiad, A., Detragiache, E., Tressel, T., 2008. A New Database of Financial Reforms. IMF Working Paper 08–266.
Asiedu, E., 2002. On the determinants of foreign direct investment to developing countries: Is Africa different? World Development. 30(1), 107–119.
Ball, L., Sheridan, N., 2005. Does inflation targeting matter? In: Bernanke, B., Woodford, M. (Eds.), The inflation targeting debate. The University of Chicago Press, Chicago, pp. 249–276.
Batini, N., Laxton, D., 2007. Under what conditions can inflation targeting be adopted? The experience of emerging markets, In: Mishkin, F.S., Schmidt-Hebbel, K., (Eds.), Monetary Policy under Inflation Targeting. Central Bank of Chile, 11, pp. 467–506.
Bernanke, B.S., Laubach, T., Mishkin, F.S., Posen, A.S., 1999. Inflation Targeting: Lessons from the International Experience. Princeton University Press, Princeton.
Brito, R.D., Bystedt, B., 2010. Inflation targeting in emerging economies: Panel evidence. Journal of Development Economics, 91(2), 198–210.
Calvo, G.A., Leiderman, L., Reinhart, C.M., 1996. Inflows of capital to developing countries in the 1990s. Journal of Economic Perspectives, 10(2), 123–139.
Chinn, M., Ito, H., 2008. A New Measure of Financial Openness. Journal of Comparative Policy Analysis: Research and Practice, 10(3), 309–322.
Dehejia, R.H., Wahba, S., 2002. Propensity score-matching methods for nonexperimental causal studies. The Review of Economics and Statistics, 84(1), 151–161.
Epstein, G., 2007. Central banks, inflation targeting and employment creation. International Labor Office, Economic and Labor Market Working Paper 2007–02.
Fernandez-Arias, E., 1996. The new wave of private capital inflows: Push or pull? Journal of Development Economics, 48(2), 389–418.
Fischer, S., 1993. The Role of Macroeconomic Factors in Growth. Journal of Monetary Economics, 32(3), 485–512.
Gastanaga, V.M., Nugent, J.B., Pashamova, B., 1998. Host country reforms and FDI inflows: How much difference do they make? World Development, 26(7), 1299–1314.
Geraats, P.M., Eijffinnger, S.C., van der Cruijsen, C.A., 2006. Does central bank transparency reduce interest rates? Netherlands Central Bank Research Department Working Paper 085.
Ghosh, A.R., Gulde, A.M., Wolf, H.C., 2003. Exchange Rate Regimes: Choices and Consequences. The MIT Press.
Gonçalves, C.E.S., Salles, J.M., 2008. Inflation targeting in emerging economies: What do the data say? Journal of Development Economics, 85(1-2), 312–318.
Heckman, J.J., Ichimura, H., Todd, P., 1998. Matching as an econometric evaluation estimator. Review of Economic Studies, 65(2), 261–294.
International Monetary Fund, 2005. World Economic Outlook. International Monetary Fund Washington, September.
Jaimovich, D., Panizza, U., 2010. Public debt around the world: a new data set of central government debt. Applied Economics Letters, 17(1), 19–24.
Kinda, T., 2010. Increasing Private Capital Flows To Developing Countries: The Role Of Physical And Financial Infrastructure In 58 Countries, 1970-2003. Applied Econometrics and International Development, Euro-American Association of Economic Development, 10(2).

CERDI, Etudes et Documents, E 2012. 03
18
Lin, S., Ye, H., 2007. Does inflation targeting really make a difference? Evaluating the treatment effect of inflation targeting in seven industrial countries. Journal of Monetary Economics, 54(8), 2521–2533.
Lin, S., Ye, H., 2009. Does inflation targeting make a difference in developing countries? Journal of Development Economics, 89(1), 118–123.
Masson, P., Savastano, M., Sharma, S., 1997. The scope for inflation targeting in developing countries. IMF Working Paper 97–130.
Mishkin, F.S., 2000. Inflation targeting in emerging-market countries. American Economic Review, 90(2), 105–109.
Mishkin, F.S., Schmidt-Hebbel, K.., 2007. Does inflation targeting make a difference? NBER Working Paper 12876.
Montiel, P.J., Reinhart, C., 1999. Do capital controls and macroeconomic policies influence the volume and composition of capital flows? Evidence from the 1990s. Journal of International Money and Finance, 18(4), 619–635.
Persson, T., 2001. Currency unions and trade: how large is the treatment effect? Economic Policy, 16(33), 433–462.
Reinhart, C.M., Rogoff, K.S., 2004. The modern history of exchange rate arrangements: A reinterpretation. The Quarterly Journal of Economics, 119(1), 1–48.
Roger, S., 2009. Inflation targeting at 20: Achievements and challenges. IMF Working Paper 09–236.
Root, F.R., Ahmed, A.A., 1979. Empirical determinants of manufacturing direct foreign investment in developing countries. Economic Development and Cultural Change, 27(4), 751–67.
Rose, A.K., 2007. A stable international monetary system emerges: Inflation targeting is Bretton woods, reversed. Journal of International Money and Finance, 26(5), 663–681.
Rosenbaum, R., Rubin, B. 1983. The central role of the propensity score in observational studies for causal effects. Biometrika, 70(1), 41–55.
Schneider, F., Frey, B.S., 1985. Economic and political determinants of foreign direct investment. World Development, 13(2), 161–175.
Servén, L., 1998. Macroeconomic uncertainty and private investment in developing countries - an empirical investigation. The World Bank Working Paper 2035.
Truman, E.M., 2003. Inflation Targeting in the World Economy. Institute for International Economics, Washington DC.
Vega, M., Winkelried, D., 2005. Inflation targeting and inflation behavior: a successful story? International Journal of Central Banking, 1(3), 153-175.

CERDI, Etudes et Documents, E 2012. 03
19
Appendices Appendix A: Country List
Treatment Group Control group
Brazil Poland Algeria Georgia Morocco
Chile Romania* Argentina Hong Kong, China Paraguay
Colombia Slovakia* Belarus Iran Russia
Czech Republic South Africa Bulgaria Jamaica Singapore
Guatemala* South Korea Cape Verde Jordan Slovenia
Hungary Thailand China Kazakhstan Syria
Indonesia* Turkey* Costa Rica Latvia Trinidad & Tobago
Israel Serbia++ Croatia Lebanon Tunisia
Mexico Ghana++ Dominican Republic Lithuania Ukraine
Peru Egypt Macedonia Uruguay
Philippines Estonia Mauritius Venezuela
*: ITer that was not ITer in Lin and Ye (2009) yet; ++: countries absent in Lin and Ye (2009)’ sample.
Appendix B: Developing Inflation Targeters along with their starting dates
Countries Soft IT: default
starting dates
Full-Fledged IT:
conservative starting dates
Chile January 1991 August 1999 Israel January 1992 June 1997
Czech Republic January 1998 January 1998 South Korea April 1998 April 1998
Poland September 1998 September 1998 Mexico January 1999 January 2001 Brazil June 1999 June 1999
Colombia September 1999 October 1999 Philippines January 2002 January 2002
South Africa February 2000 February 2000 Thailand May 2000 May 2000 Hungary June 2001 August 2001
Peru January 2002 January 2002 Slovakia January 2005 January 2005
Guatemala January 2005 January 2005 Indonesia July 2005 July 2005 Romania August 2005 August 2005 Turkey January 2006 January 2006 Serbia September 2006 September 2006 Ghana January 2007 January 2007
Source: Rose (2007) and Roger (2009). Note that Slovakia abandoned IT in 2009 and joined the euro area.
CERDI, Etudes et Documents, E 2012. 03
20
Appendix C: Probit estimates of the propensity scores (using the Default Starting Dates) Dependent Variable IT (Default Starting Dates)
[1]
[2]
Post-1990
[3]
No CEEC
[4]
No New ITers
[5]
No hyper-inflation [6] [7] [8]
Inflation lagged one year -0.072*** -0.074*** -0.073*** -0.072*** -0.070*** -0.0683*** -0.0750*** -0.0939***
(0.015) (0.015) (0.017) (0.015) (0.016) (0.0177) (0.0191) (0.0227)
Governors’ turnover rate -1.177** -0.483 -1.657*** -1.177*** -1.106** -1.001** -1.903*** -0.625
(0.458) (0.491) (0.533) (0.458) (0.464) (0.464) (0.532) (0.508)
Debt ratio -0.013*** -0.014*** -0.014*** -0.013*** -0.013*** -0.0089*** -0.0043 -0.0077**
(0.003) (0.004) (0.004) (0.003) (0.003) (0.0029) (0.0030) (0.0036)
Real per capita GDP growth rate 0.043** 0.036*** 0.039* 0.043** 0.038* 0.0343* 0.0221 0.0539**
(0.021) (0.022) (0.022) (0.021) (0.021) (0.0206) (0.0200) (0.0244)
Domestic credit to private sector 0.004 0.002 0.005** 0.004 0.003 -0.0002 0.0032 0.0022
(0.003) (0.003) (0.003) (0.003) (0.003) (0.0026) (0.0026) (0.0039)
Financial openness 0.085 0.011 0.045 0.085 0.084 0.0676 -0.0253 -0.395***
(0.067) (0.071) (0.073) (0.067) (0.067) (0.0657) (0.0732) (0.103)
Control of corruption -0.235*** -0.254*** -0.340*** -0.235*** -0.252*** -0.184** -0.492*** -0.362***
(0.091) (0.098) (0.103) (0.091) (0.092) (0.0779) (0.0976) (0.109)
Trade openness -0.003* -0.004*** -0.004* -0.003* -0.003 -0.0021 -0.0104*** -0.0073***
(0.002) (0.002) (0.002) (0.002) (0.002) (0.0013) (0.0020) (0.0021)
Exchange rate flexibility 0.290*** 0.311*** 0.283*** 0.290*** 0.295*** 0.267*** 0.263*** 0.295***
(0.041) (0.043) (0.046) (0.041) (0.042) (0.0398) (0.0413) (0.0439)
Log of Real GDP
0.343***
(0.0681)
Log of real per capita GDP
1.688***
(0.284)
Financial reforms
0.325***
(0.0543)
No of observations 663 506 575 663 564 663 665 589
Pseudo R2 0.354 0.367 0.381 0.354 0.325 0.393 0.468 0.562
Note: Robust standard errors are reported in brackets. *, **, and *** indicate the significance level of 10%, 5%, and 1%, respectively. Constant are included (not reported).

CERDI, Etudes et Documents, E 2012. 03
21
Appendix D: Matching results (Using the Default Starting Dates)
Dependent Variable : 1-Nearest- Neighbor
2-Nearest-Neighbor
3-Nearest Neighbor
Radius Matching
Local Linear Regression
Kernel Matching
FDI over GDP Matching Matching Matching r=0.005 r=0.01 r=0.03 Matching
Treatment Effect of IT on FDI: using the Default starting Dates
[1] : ATT 1.624*** 1.467** 1.500*** 1.329** 1.459*** 1.679*** 1.778*** 1.814***
(0.565) (0.577) (0.493) (0.617) (0.506) (0.410) (0.368) (0.373)
Number of Treated Obs. 60 60 60 41 47 59 60 60
Number of Controls Obs. 597 597 597 597 597 597 597 597
Total Observations (Obs.) 657 657 657 638 644 656 657 657
Robustness Checks
[2] : Post-1990 Period 2.039*** 1.727*** 1.670*** 1.521** 1.844*** 1.873*** 1.433*** 1.660***
(0.544) (0.507) (0.459) (0.670) (0.524) (0.421) (0.365) (0.386)
[3] : Excluding CEEC 1.855*** 1.830*** 1.735*** 1.239* 1.498*** 1.786*** 1.752*** 1.824***
(0.582) (0.555) (0.483) (0.651) (0.542) (0.403) (0.375) (0.371)
[4] : Excluding New ITers 1.624*** 1.467*** 1.500*** 1.329** 1.459*** 1.679*** 1.778*** 1.814***
(0.623) (0.552) (0.496) (0.599) (0.526) (0.402) (0.373) (0.390)
[5] : Excluding hyperinflation episodes 2.056*** 1.887*** 2.070*** 1.815*** 2.054*** 1.844*** 1.907*** 1.833***
(0.700) (0.563) (0.530) (0.613) (0.526) (0.403) (0.396) (0.372)
[6] : Adding Log of real GDP 1.878*** 1.865*** 1.979*** 1.791*** 1.912*** 2.107*** 1.972*** 2.061***
(0.665) (0.552) (0.553) (0.694) (0.551) (0.424) (0.375) (0.407)
[7] :Including Log of real per capita GDP 2.112*** 1.674** 1.551** 1.534** 1.741*** 1.463*** 1.324*** 1.505***
(0.768) (0.694) (0.667) (0.736) (0.591) (0.493) (0.465) (0.453)
[8] : Adding Financial reforms 2.123*** 1.834*** 1.723*** 1.773** 1.833*** 1.766*** 1.560*** 1.771***
(0.566) (0.526) (0.517) (0.888) (0.671) (0.487) (0.402) (0.444)
Note: in brackets the bootstrapped standard errors (with 500 replications). *, **, and *** indicate the significance level of 10%, 5%, and 1%, respectively.

CERDI, Etudes et Documents, E 2012. 03
22
Appendix E: Cross-sections-based Probit estimates of the propensity scores Dependent Variable IT (Conservative Starting Dates)
[1] [2]
No CEEC [3]
No New ITers [4]
No hyper-inflation [5] [6] [7]
Inflation -0.003*** -0.003** -0.001 -0.071*** -0.003*** -0.003*** -0.0004 (0.001) (0.002) (0.001) (0.019) (0.001) (0.001) (0.001) Governors’ turnover rates 1.490** 2.739*** 0.768 1.791** 1.063* 1.808*** 1.036 (0.62) (0.941) (0.748) (0.827) (0.634) (0.652) (0.850) Debt Ratio -0.006* -0.007 -0.016*** -0.010** -0.003 -0.011*** -0.007 (0.003) (0.004) (0.004) (0.004) (0.003) (0.004) (0.005) Real per capita GDP growth rate 0.055 -0.004 0.018 -0.065 0.049 0.065* 0.247*** (0.037) (0.055) (0.045) (0.046) (0.036) (0.037) (0.078) Domestic credit to private sector 0.017*** 0.018*** 0.043*** 0.008* 0.011*** 0.021*** 0.017*** (0.004) (0.005) (0.007) (0.005) (0.003) (0.004) (0.005) Financial openness 0.044 0.044 0.420*** -0.042 0.056 0.164 -0.770*** (0.106) (0.109) (0.141) (0.103) (0.110) (0.103) (0.209) Control of corruption 0.003 -0.547*** 0.527*** 0.023 0.024 0.193 -0.553*** (0.127) (0.169) (0.174) (0.148) (0.129) (0.125) (0.169) Trade openness -0.009*** -0.009*** -0.015*** -0.010*** -0.007*** -0.008*** -0.010*** (0.002) (0.003) (0.002) (0.002) (0.001) (0.002) (0.002) Exchange rate flexibility 0.182*** 0.247*** 0.308*** 0.396*** 0.140*** 0.237*** 0.093** (0.039) (0.046) (0.055) (0.065) (0.041) (0.039) (0.047) Log of Real GDP 0.256*** (0.076) Log of per capita Real GDP -0.723** (0.281) Financial reforms 0.450*** (0.081)
Observations 45 34 45 38 45 45 39 Pseudo R2 0.256 0.331 0.411 0.338 0.283 0.280 0.466
Note: Robust standard errors are reported in brackets. *, **, and *** indicate the significance level of 10%, 5%, and 1%, respectively. Constant are included (not reported).

CERDI, Etudes et Documents, E 2012. 03
23
Appendix F: Cross-sections-based Probit estimates of the propensity scores Dependent Variable IT (Default starting Dates)
[1] [2]
No CEEC [3]
No New ITers [4]
No hyper-inflation [5] [6] [7]
Inflation 0.004*** 0.061*** 0.006*** 0.039*** 0.003** 0.004*** 0.004*** (0.001) (0.017) (0.002) (0.013) (0.001) (0.001) (0.001) Governors’ turnover rates -0.224 1.405** -0.549 0.117 -0.043 0.295 -1.380** (0.570) (0.712) (0.792) (0.631) (0.548) (0.671) (0.621) Debt Ratio 0.00003 -0.001 -0.007* -0.001 0.003 -0.009** -0.002 (0.004) (0.004) (0.004) (0.004) (0.004) (0.004) (0.005) Real per capita GDP growth rate -0.055 0.051 -0.088* 0.004 -0.047 -0.047 -0.113** (0.041) (0.049) (0.048) (0.043) (0.042) (0.047) (0.051) Domestic credit to private sector 0.018*** 0.013*** 0.036*** 0.019*** 0.013*** 0.024*** 0.018*** (0.004) (0.003) (0.005) (0.004) (0.004) (0.004) (0.004) Financial openness 0.101 0.089 0.196 0.131 0.122 0.243*** -0.139 (0.087) (0.077) (0.120) (0.082) (0.091) (0.092) (0.111) Control of corruption 0.329*** -0.127 1.019*** 0.303*** 0.362*** 0.685*** 0.486*** (0.114) (0.137) (0.156) (0.113) (0.118) (0.130) (0.114) Trade openness -0.010*** -0.006*** -0.016*** -0.008*** -0.008*** -0.008*** -0.012*** (0.002) (0.002) (0.003) (0.002) (0.002) (0.002) (0.002) Exchange rate flexibility 0.245*** 0.233*** 0.285*** 0.218*** 0.218*** 0.331*** 0.314*** (0.046) (0.052) (0.062) (0.058) (0.043) (0.054) (0.052) Log of Real GDP 0.242*** (0.082) Log of per capita Real GDP -1.299*** (0.287) Financial reforms 0.079* (0.043)
Observations 42 31 42 39 42 42 37 Pseudo R2 0.286 0.330 0.503 0.290 0.307 0.349 0.382
Note: Robust standard errors are reported in brackets. *, **, and *** indicate the significance level of 10%, 5%, and 1%, respectively. Constant are included (not reported).

CERDI, Etudes et Documents, E 2012. 03
24
Appendix G: Matching results (Using the Conservative Starting Dates and cross-sections-based Propensity scores) Dependent Variable : 1-Nearest-
Neighbor 2-Nearest-Neighbor
3-Nearest Neighbor
Radius Matching
Local Linear Regression
Kernel Matching
FDI over GDP Matching Matching Matching r=0.005 r=0.01 r=0.03 Matching
Treatment Effect of IT on FDI: using the conservative starting Dates
[a] : ATT 3.465*** 3.365*** 3.256*** 3.465*** 2.387*** 2.324*** 2.477*** 2.346***
(0.522) (0.421) (0.362) (0.497) (0.329) (0.355) (0.321) (0.321)
Number of Treated Obs. 42 42 42 28 35 42 42 42
Number of Controls Obs. 607 607 607 607 607 607 607 607
Total Observations (Obs.) 649 649 649 635 642 649 649 649
Robustness Checks
[b] : Excluding CEEC 2.617*** 2.499*** 2.462*** 2.617*** 1.724*** 1.649*** 1.820*** 1.672***
(0.365) (0.346) (0.310) (0.427) (0.175) (0.225) (0.219) (0.219)
[c] : Excluding New ITers 3.581*** 3.471*** 3.346*** 3.581*** 2.573*** 2.777*** 2.674*** 2.681***
(0.571) (0.429) (0.364) (0.538) (0.330) (0.368) (0.385) (0.352)
[d] : Excluding hyperinflation episodes 2.998*** 2.845*** 2.791*** 2.998*** 2.087*** 2.163*** 2.047*** 2.232***
(0.533) (0.435) (0.392) (0.488) (0.353) (0.361) (0.406) (0.314)
[e] : Adding Log of real GDP 3.465*** 3.365*** 3.256*** 3.465*** 2.661*** 2.582*** 2.483*** 2.541***
(0.502) (0.415) (0.362) (0.537) (0.351) (0.355) (0.332) (0.360)
[f] : Adding Log of real per capita GDP 3.465*** 3.365*** 3.256*** 3.465*** 2.234*** 2.453*** 2.385*** 2.590***
(0.485) (0.427) (0.390) (0.519) (0.310) (0.342) (0.330) (0.337)
[g] : Adding Financial reforms 3.446*** 3.343*** 3.253*** 3.446*** 2.339*** 2.352*** 2.412*** 2.324***
(0.455) (0.396) (0.338) (0.474) (0.291) (0.322) (0.304) (0.308)
Note: in brackets the bootstrapped standard errors (with 500 replications). *, **, and *** indicate the significance level of 10%, 5%, and 1%, respectively.
CERDI, Etudes et Documents, E 2012. 03
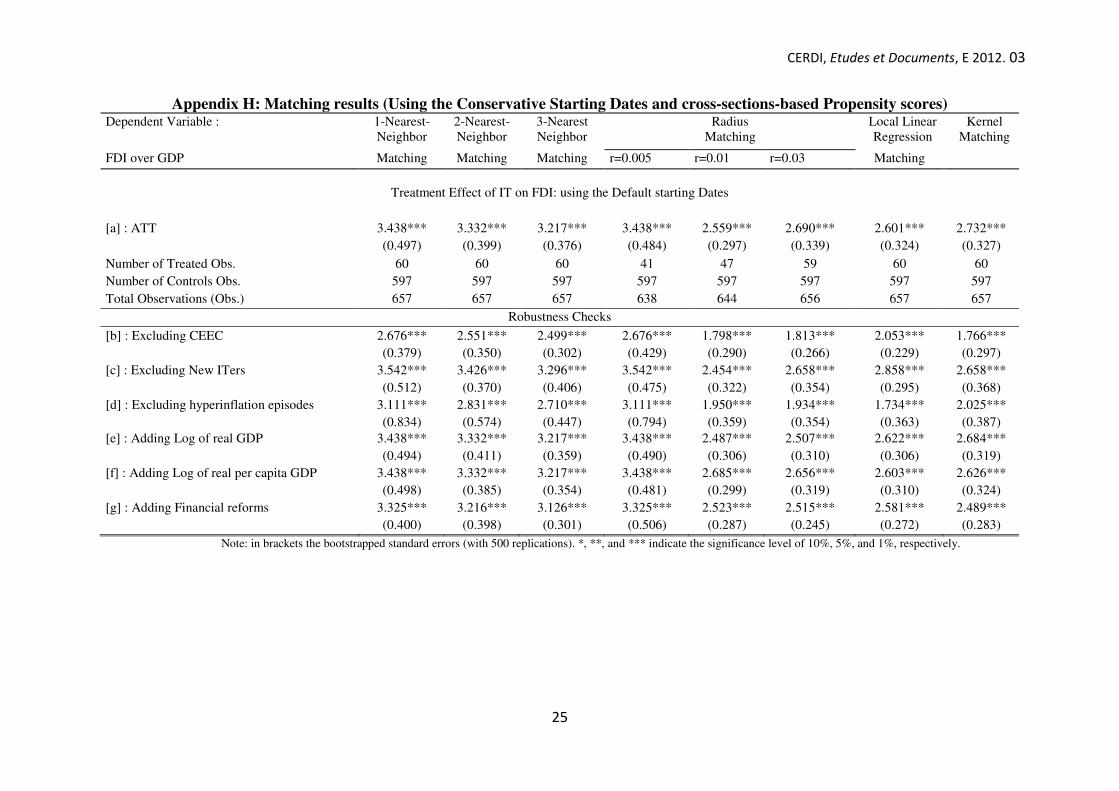
25
Appendix H: Matching results (Using the Conservative Starting Dates and cross-sections-based Propensity scores) Dependent Variable : 1-Nearest-
Neighbor 2-Nearest-Neighbor
3-Nearest Neighbor
Radius Matching
Local Linear Regression
Kernel Matching
FDI over GDP Matching Matching Matching r=0.005 r=0.01 r=0.03 Matching
Treatment Effect of IT on FDI: using the Default starting Dates
[a] : ATT 3.438*** 3.332*** 3.217*** 3.438*** 2.559*** 2.690*** 2.601*** 2.732***
(0.497) (0.399) (0.376) (0.484) (0.297) (0.339) (0.324) (0.327)
Number of Treated Obs. 60 60 60 41 47 59 60 60
Number of Controls Obs. 597 597 597 597 597 597 597 597
Total Observations (Obs.) 657 657 657 638 644 656 657 657
Robustness Checks
[b] : Excluding CEEC 2.676*** 2.551*** 2.499*** 2.676*** 1.798*** 1.813*** 2.053*** 1.766***
(0.379) (0.350) (0.302) (0.429) (0.290) (0.266) (0.229) (0.297)
[c] : Excluding New ITers 3.542*** 3.426*** 3.296*** 3.542*** 2.454*** 2.658*** 2.858*** 2.658***
(0.512) (0.370) (0.406) (0.475) (0.322) (0.354) (0.295) (0.368)
[d] : Excluding hyperinflation episodes 3.111*** 2.831*** 2.710*** 3.111*** 1.950*** 1.934*** 1.734*** 2.025***
(0.834) (0.574) (0.447) (0.794) (0.359) (0.354) (0.363) (0.387)
[e] : Adding Log of real GDP 3.438*** 3.332*** 3.217*** 3.438*** 2.487*** 2.507*** 2.622*** 2.684***
(0.494) (0.411) (0.359) (0.490) (0.306) (0.310) (0.306) (0.319)
[f] : Adding Log of real per capita GDP 3.438*** 3.332*** 3.217*** 3.438*** 2.685*** 2.656*** 2.603*** 2.626***
(0.498) (0.385) (0.354) (0.481) (0.299) (0.319) (0.310) (0.324)
[g] : Adding Financial reforms 3.325*** 3.216*** 3.126*** 3.325*** 2.523*** 2.515*** 2.581*** 2.489***
(0.400) (0.398) (0.301) (0.506) (0.287) (0.245) (0.272) (0.283)
Note: in brackets the bootstrapped standard errors (with 500 replications). *, **, and *** indicate the significance level of 10%, 5%, and 1%, respectively.

CERDI, Etudes et Documents, E 2012.03
26
Appendix I: Sources and definitions of data
Variables
Definition
Sources
FDI over GDP Net Inflows of Foreign Direct Investments, as GDP per cent
World Development Indicators (WDI, 2009),
World Bank
Domestic credit to private sector (GDP percent) Total GDP
Proxy of the financial development: credit offered by the banks to the private sector, as GDP per cent. Gross Domestic Product (constant 2000US$). Proxy for a country’s economic size.
Fully Fledged IT
Dummy Variable taking the value 1 if in a given year the country practices IT, the starting dates considered being the conservative ones.
Rose (2007) and Roger (2009)
Soft IT Dummy Variable taking the value 1 if in a given year the country practices IT, the starting dates considered being the default ones.
Inflation
Annual growth rate of average CPI
World Economic Outlook (WEO, 2009)
Corruption
Index ranged from 0 to 6, assessing the corruption in the political system. The higher the index, the less corrupt the political system is.
International Country Risk Guide (ICRG, 2009)
Real per capita output growth rate Real GDP per capita
Annual growth rate of the real output per capita Real GDP per capita, constant prices. Proxy for a country’s stage of development.
Penn World Table (PWT6.3)
Trade Openness (GDP percent) Sum of imports and exports divided by GDP
Exchange rate Flexibility
Fine classification codes for exchange rates regimes, ranging from 1 (no separate legal tender) to 15 (Dual markets in which parallel market data is missing). The higher the code value, the more flexible the exchange rate regime.
Reinhart and Rogoff
(2004), updated
Debt (GDP percent) Outstanding central government debt to GDP Jaimovich and Panizza (2010)
Turnover Rates Central Banks’ governors turnover rates Ghosh et al. (2003), updated
Financial Openness
Index measuring the extent of openness in external account transactions, with respect to four aspects: i) presence of multiple exchange rates; ii) restrictions on current account transactions; iii) restrictions on capital account transactions; and iv) requirement of the surrender of export proceeds. The higher the index, the more open the external accounts.
Chinn and Ito (2008)
Financial reforms
Multi-faceted measure of reforms, covering seven aspects of financial sector policy: i) credit controls and reserves requirements; ii) interest rate controls; iii) entry barriers; iv) state ownership in the banking sector; v) capital account restrictions; vi) prudential regulations and supervision of the banking sector; and vii) security market policies. The higher the index, the better the reforms in the financial sector.
Abiad et al. (2008)
CERDI, Etudes et Documents, E 2012.03
27
Appendix J: Descriptive Statistics
Variable Obs Mean Std. Dev. Min Max
FDI (percentage of GDP) 1 239 2.798 3.767 -2.758 36.617
Full Fledged IT 1 483 0.086 0.280 0 1
Soft IT 1 483 0.096 0.294 0 1
Inflation rate 1 253 59.929 338.275 -3.959 7 481.664
Central bank governor turnover rate 1 039 0.292 0.259 0 1.2
Real per capita GDP growth rate 1 268 2.297 5.945 -43.388 49.863
Trade openness (percentage of GDP) 1 282 79.276 54.644 6.320 456.936
Financial openness 1 008 -0.267 1.471 -1.831 2.5
Exchange rate Flexibility 1 259 9.294 3.633 1 15
Public Debt (percentage of GDP) 1 156 53.190 36.555 0.971 289.554
Domestic credit to private sector (percentage of GDP) 1 253 58.608 37.202 -4.645 233.265
Control of Corruption 1 016 2.924 1.087 0 6
Log of Real GDP 1 322 24.221 1.541 19.179 28.849
Log of Real per capita GDP 1 282 8.872 0.601 7.033 10.706
Financial reforms 930 11.233 5.585 0 21