does high school quality matter? evidence from …dmberk/schoolquality.pdf · does high school...
TRANSCRIPT

Does High School Quality Matter? Evidence from Admissions Data*
Daniel Berkowitz*
University of Pittsburgh
Mark Hoekstra*
University of Pittsburgh
June 8, 2010
Abstract
This paper examines the effect of attending elite private high school on college placement using admissions data from the most selective high school in a large metropolitan area. To overcome omitted variable bias, we limit the sample to admitted applicants and control directly for the scores assigned by admissions based on in-depth analyses of the applicants and their families. In addition, we control for a wide set of covariates including student and family characteristics and entrance exam scores. Results indicate that attending selective private high school rather than other public and private high schools causes students to attend more selective universities. Effects are driven by gains for girls and students from lower-income neighborhoods. JEL Codes: I21 (Analysis of Education)
Keywords: Education; School Quality
_________________
*Department of Economics, Pittsburgh, PA (email: Daniel Berkowitz: [email protected]; Mark Hoekstra: [email protected]). We would like to thank an anonymous selective private high school for providing us with the data used in this project. We would also like to thank Todd Elder, Randy Walsh, and Scott Carrell for helpful comments and suggests. Any errors are our own.
1
1. Introduction
While there is widespread perception that school quality varies significantly, rigorously
assessing whether some kinds of schools are more effective than others is difficult due to
nonrandom selection into schools. The primary concern is that one of the many unobserved
factors that determines whether a student attends a particular school will also affect outcomes
after graduation. For example, while it is difficult to measure the extent to which a student’s
family is supportive of a highly rigorous education, this unobserved factor can influence the
selection of high school as well as subsequent outcomes such as college quality and labor market
performance. Thus, even with data sets containing rich measures of family demographics and
student quality, estimates of the effect of attending selective schools may suffer from omitted
variable bias.
In this paper, we address whether attending an elite private high school causes students to
attend more selective colleges by utilizing an exceptional administrative data set from the most
selective high school in a large metropolitan area. These data allow us to address omitted
variable bias in three ways. First, we can estimate the effect of attending private school after
conditioning on admission to the school, a factor rarely observed in most data sets. Thus, we can
avoid the potential pitfalls associated with comparing students who attend selective private
school with those rejected by the school.1
Second, we have acquired the actual scores assigned by the admission committee as a
summary statistic for all student and family characteristics, including information on “difficult to
1 By conditioning on admission to help overcome selection issues, our research design is most similar to Dale and Krueger (2002), who infer applicant quality using college admission decisions in order to estimate labor market returns to attending more selective private colleges.

2
quantify” characteristics such as student motivation and parental support. In short, we observe
the exact information that to our knowledge has never been observed by the econometrician in
this context, and would thus typically cause omitted variable bias. In addition, the data set also
contains standard measures of family demographics and student quality employed in the
literature including applicant race, gender, neighborhood income, grade point average, existing
school type, and entrance exam scores. Collectively, the richness of the data allows us to more
convincingly estimate the causal effect of attending private school.
Third, we formally test for the presence of omitted variable bias using the methods
proposed by Altonji, Elder, and Taber (2005). The results provide further support for our
identification strategy: While we reject the null hypothesis of no omitted variable bias when
using the full sample of applicants, we find no evidence of such bias once we condition on
admission.
We find that attending an elite private high school has a statistically significant effect on
the selectivity of the college later attended. Estimates imply that enrollees at the elite private
school subsequently attend colleges and universities whose students have SAT scores that are 20
points higher on average,2 which is approximately the difference between Oregon State and the
University of Oregon, the University of Pittsburgh and Pennsylvania State, or Princeton and
Harvard. These effects are driven largely by girls and students from lower-income
neighborhoods. Importantly, recent estimates suggest that the economic gains to attending more
2 Methods developed by Altonji, Elder and Taber (2005) show that these estimates are understated. Using their method, in fact, we can find that enrollees at elite private schools attend colleges and universities whose attendees have SAT scores that are roughly 40 points higher.

3
selective universities can be significant. For example, Hoekstra (2009) reports that attending the
flagship university increases earnings by 20% relative to attending college elsewhere.
2. Data
An anonymous independent elite high school provided the admission data. In return, we
agreed not to reveal the school’s identity. However, we can say that the school itself is a
member of the National Association of Independent Schools, an organization representing more
than 1,300 schools nationwide. Furthermore, in discussions with members of the education
community it was our perception that this is the most selective private high school in the
metropolitan area for the period that of the study. For example, it is the only high school in the
area ranked in the top 100 nationally based on the share of students placed at Harvard, Princeton,
or Yale.3
The admission data include information on applicants who applied for admission for the
academic years of 1992-93 to 2005-2006.4 Applicants are primarily 8th graders who were
attending other schools and thus had to apply in order to gain admission to the high school. For
each student, we observe the type of middle school they were currently attending (public,
parochial, or independent) as well as their race, gender, legacy status, and grade point average.
In order to obtain a proxy for family income, applicants were also linked to median family
income from the 2000 Census. In addition, we also observe the percentile ranking on the math
3 This comes from the highly cited issue of Worth Magazine (September 2002, pp. 94-104). See www.electricprint.com/edu4/classes/readings/edu-eliteschools.htm.
4 Since we examine college enrollment as the primary outcome variable, we only use data on applicants who are observed for at least 8 months after high school graduation. Consequently, we use no applicants to the 9th and 10th-grade from 2005-2006 and no applicants to the 9th grade from 2004-2005.

4
and verbal sections of Independent School Entrance Examination. This exam is perhaps best
viewed as the middle school version of the SAT, and as such is considerably more rigorous than
typical standardized tests taken by 8th graders.
Finally, we also observe the admission score assigned by the committee that the
admission director subsequently used to determine admission.5 This was the median score given
by the members of the admission committee, which we normalized within application year to
ensure comparability over time. Importantly, this score represents a summary statistic of the
applicant strength based on important determinants of applicant quality that are typically
unobserved by the econometrician. Each teacher on the committee would interview an applicant
and ask the student, for example, to discuss a recent book that she had recently read or to
describe her hobby. In addition, teachers on the committee reviewed written recommendations
made on behalf of the applicant and read a sample of the applicants’ writing and academic
record. Often, a member of the committee would present the qualifications of an applicant to the
rest of the committee. In addition, both the admissions director and committee often interviewed
the parents in order to determine whether the applicant would have the family support necessary
to succeed in an academically challenging environment.6
These data were then sent to the National Student Data Clearinghouse and linked to
college records using date of birth and first and last name. This information includes the first
5 The general process was to admit enough applicants so as to reach the desired cohort size, though the admissions director did occasionally make exceptions and admit students with lower scores to meet desired gender ratios or address other goals. For example, if 75 slots were available and the admission director expected an enrollment rate of 75 percent, then he or she would admit the 100 students with the highest scores.
6 The admission score contains information above and beyond that available through measures of demographics and other controls: a regression of admission score on all covariates except for enrollment implies that at most 55 percent of the variation in admission score is explained by the other measures of student and family quality.
5
full-time college enrollment between high school graduation and January of the following year.
This provides a nearly complete picture of college decisions for these applicants since the
National Student Data Clearinghouse tracks enrollments at 92 percent of the nation’s colleges
and universities. However, applicants were not linked to college enrollment information if the
applicant identifiers did not uniquely identify a student.7
The primary outcome used in this study is the selectivity of the college attended in the
eight months following high school graduation.8 The median SAT score of the college’s
entering freshmen class is used to measure selectivity.9 These data were obtained from the
National Center for Education Statistics (NCES) Integrated Postsecondary Education Data
System (IPEDS). While this indicator of student success does not measure the outcome favored
by labor economists (wages) or broader measures of success favored by the school’s teachers and
administrators,10 it does measure an outcome of significant importance to parents. Moreover,
there is increasing evidence that attending higher quality colleges causes subsequent success in
7 For example, a high school applicant named John Doe who was born on January 1, 1980 who did attend college would not be observed in our data if the National Student Data Clearinghouse had records of two or more different individuals named John Doe born on that same date.
8 We also attempted to acquire data on applicant SAT scores from the College Board, but were unable to do so due to the cost of the data (the College Board charges on a per-year basis) and restrictions on what they were willing to provide.
9 This was computed as the midpoint of the 25th and 75th percentiles. We were unable to link SAT scores to colleges attended by 12 applicants in our data. Consequently, for these colleges we assigned the average selectivity score of the colleges in our data that received the same Barron’s ranking.
10 The school president, admissions director, and one teacher with whom we spoke stated they are most concerned with whether their graduates distinguish themselves in important, thought not necessarily lucrative, fields such as the arts, education, government, and social entrepreneurship, as well as whether the student was subsequently involved in philanthropic endeavors. We leave the question of the effects of private schooling on such outcomes to future research.
6
the labor market (Behrman, Rozenzweig, and Taubman, 1996; Brewer, Eide, and Ehrenberg,
1999; Hoekstra, 2009).
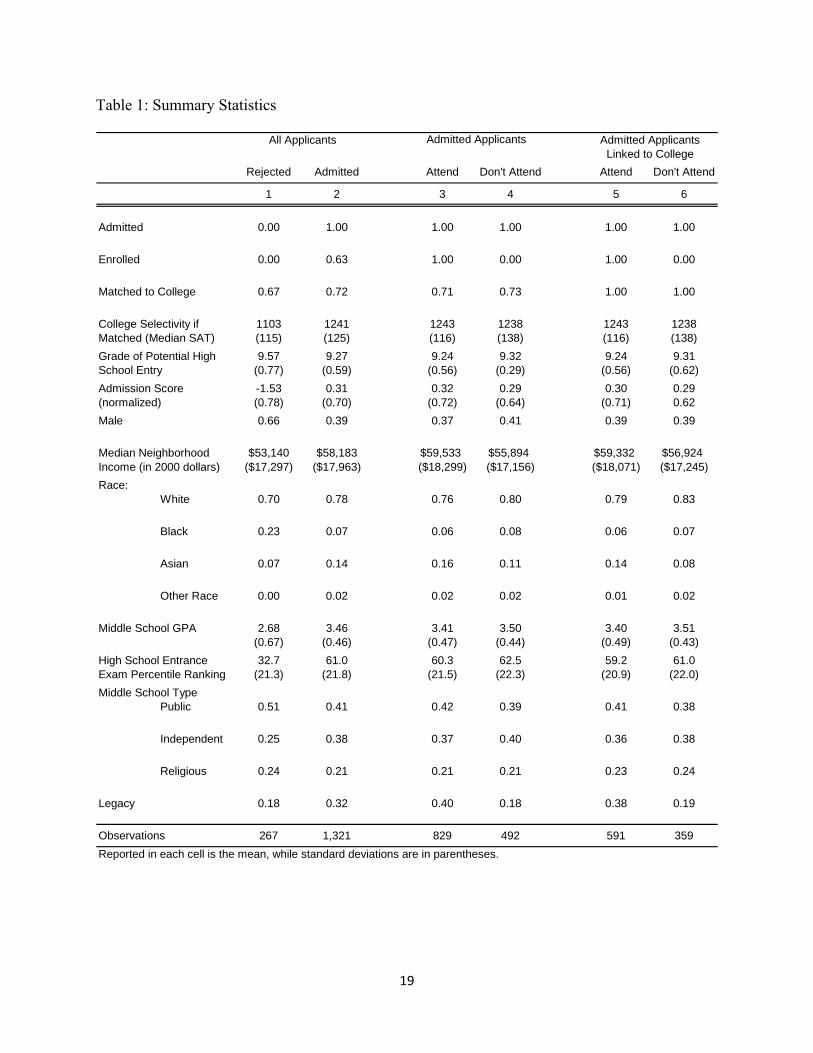
Descriptive statistics for the applicants are contained in Table 1, where columns 1 and 2
show figures for all rejected applicants and for all admitted applicants. It is not surprising that
admitted applicants have much higher GPAs and admission and entrance exam scores and come
from higher-income neighborhoods. These differences highlight the potential difficulty in
comparing admitted applicants to rejected applicants: given the significant differences in
observed characteristics, one might reasonably wonder if the two populations also differ in ways
unobserved to the econometrician. Furthermore, one might reasonably expect the differences to
be even more stark if one were to compare admitted applicants to students who did not apply to
the selective school. Thus, while we also observe that admitted applicants are subsequently more
likely to be observed in college (72% versus 67%) and to attend much more selective colleges
(i.e., where SAT scores for students average 1241 compared to 1103), one might well be
skeptical that these differences are solely driven by whether a student went to a selective high
school.
Consequently, to identify the effects of attending elite private school on college
placement, we rely on the comparison of admitted applicants who attend the selective school to
admitted applicants who attend high school elsewhere. Descriptive statistics for these two
groups are shown in columns 3 and 4 of Table 1. In general, these two groups of applicants are
much more similar to each other than are admitted and rejected applicants. Admitted students
who attend the selective high school have marginally lower GPAs (3.41 versus 3.50) and a
marginally lower percentile ranking in the entrance exam score (60.3 percent versus 62.5
percent). However, admitted student come from neighborhoods where family income is

7
approximately $3,500 higher11and they are much more likely to be legacies (40 percent versus 18
percent).12 There appears to be little difference in college-attendance (71% versus 73%),13 which
is consistent with what one would expect for students admitted to a selective high school.
Finally, students who attend the selective private high school and are subsequently observed with
college records attend colleges where the median SAT score of the entering freshmen class was
1243 out of 1600. Thus, the average enrollee attended universities like the University of Florida,
Pepperdine University, Gettysburg College, and the University of Illinois at Urbana-Champaign.
Since our main outcome of interest is the selectivity of college subsequently attended and
since some students were not observed with college records since they were not uniquely
identified with first and last name and date of birth, in columns 5 and 6 of Table 1 we show
descriptive statistics for admitted students linked to a college after graduation. There is little to
no difference between admitted applicants subsequently linked to college records and those not.
This suggests that the reason we only observe around 70% of applicants with college records is
in fact due to the uniqueness problem with the matching, rather than to the possibility that
admitted applicants do not subsequently enroll in college.14
11 The differences in GPA and neighborhood income are both significant at the 1% level, while the p-value for the difference in entrance exam scores is 10.9%.
12 To deal with these differences we will explicitly control for the neighborhood income and whether or not a student is a legacy in our formal empirical analysis. 13 Recall that we only observe college attendance for students uniquely linked to college records on the basis of first name, last name, and date of birth.
14 In results not shown, we have also estimated effects after imputing college selectivity for admitted students not observed with college records using all covariates from estimating equation except for enrolled. Estimates of the enrollment effect are 15.2 and 12.8 SAT points, both of which are significant at the 5% level and correspond to estimates of 19.9 and 18.2 SAT points presented in columns 5 and 6 of Table 4.

8
3. Identification Strategy and Methodology
In general, researchers have used one of two methods for tackling the selection problems
plaguing estimates of attending private schools. The first is to employ instrumental variables
methods to examine the effect of attending private school on test scores, high school completion,
and college attendance.15 However, the validity of these instruments has been questioned by
Altonji, Elder and Taber (2002). This criticism reflects the general difficulty of finding
instruments that are both “strong” and satisfy the exclusion restriction (see Berkowitz, Caner and
Fang, 2009; Conley, Hansen and Rossi, 2007; and Kraay, 2008). More recently, researchers
have exploited discontinuities created by admission rules to examine the impact of attending
selective schools on university enrollment in the United Kingdom (Clark, 2009), or of attending
selective universities on earnings in the United States and Colombia (Hoekstra, 2009; Saavedra,
2009).
A second solution is to assume that students select into private schools only on the basis
of observable characteristics, a solution only as effective as the data set used.16 In most
applications—including returns to private schooling—it is unlikely that the econometrician
observes the factors that determine both treatment (enrollment at the private school) as well as
subsequent success. This problem is likely to be particularly severe in the context of selective
private schools. Consequently, a related approach is to infer unobserved student quality from
information on an individual’s admission decisions at various schools. This approach was
15 For example, Evans and Schwab (1995), Neal (1997), Sander (1996), and Sander and Krautmann (1995) use instruments capturing religious affiliation or proximity to schools to estimate the effect of attending Catholic schools on test scores and college attendance. Also, see Figlio and Stone (1999).
16 Jepsen (2003) uses this strategy to investigate the effect of attending Catholic school.

9
implemented by Dale and Krueger (2002), who identify the impact of attending selective
colleges on earnings by comparing the outcomes of individuals who attended more selective
schools to those who were admitted to similarly selective schools, but attended less selective
schools.
We implement an identification strategy similar to Dale and Krueger (2002) in that we
compare students who enrolled at the private high school to those who were admitted by the
private school, but attended high school elsewhere.17 However, we extend this research design
by additionally controlling for the continuous score given by the admission committee.
Importantly, the information contained in this score is largely unexplained by the other
covariates; estimates indicate that at most 55% of the variation in the admission score can be
explained with the other measures available to the admissions committee such as GPA and
entrance exam scores.18 This suggests that the admission score likely contains additional
information relevant for predicting post-high school outcomes.
To formally test whether attending the elite private high school impacts college
enrollment and selectivity, we estimate two versions of the following equation for admitted
students using ordinary least squares:
iii
iiiii
iteHSAttendedElcoreAdmissionSamEntranceExLegacyPAMiddleSchGXOutcome
εβββββββ
+++++++=
65
43210
17 While the existence of the admission score would suggest that we could additionally use a regression discontinuity design, we are unable to do so due to a lack of power. While there is a jump in enrollment of 20 percent at the admission cutoff, the standard error for the (unweighted) RD estimate on college selectivity is three times as large as that for the OLS estimates, making estimates uninformative.
18 See footnote 7.

10
In the first version of the estimating equation, Outcomei measures whether student i is observed
to have enrolled in college; in the second version Outcomei is the median SAT score of the
entering class at the college subsequently attended. The vector of controls is given by X, which
includes neighborhood (i.e., zip code) income, race and gender fixed effects, application year and
grade of application fixed effects, and middle school fixed effects (religious, public, or
independent). The variable MiddleSchGPA captures the applicant’s grade point average at the
middle school, Legacy is equal to one if the applicant had family or siblings who had attended
the elite private school, EntranceExam captures the percentile ranking of students on the verbal
and quantitative sections of the Independent School Entrance Exam, and AdmissionScore
captures the score given to the admission committee after reviewing all of this information and
much more. We control for quadratic functions of all continuous control variables to allow for
nonlinearities. In addition, since not all students were observed with all covariates, indicators for
missing variables were also included.19
The coefficient of interest is β6, which captures the effect of enrolling at the selective
private school. The interpretation of this estimate depends on the nature of the counterfactual.
While we do not observe the high school of applicants who did not attend this particular high
school, discussions with the admissions director suggest that most stayed in the same school
system attended during middle school. Assuming that this is the case, 39 percent of students
19 Of the 950 admitted applicants in our data linked to colleges, neighborhood income was missing for 3 students, race was missing for 152 students, middle school GPA was missing for 288 students, entrance exam scores were missing for 176 students, school type (e.g., public, independent, religious) was missing for 64 students, and legacy status was missing for 1 student.

11
who enrolled elsewhere attended public high school, 21 percent attended religious high schools,
and 40 percent attended other independent high schools.20,21
4. Results
4.1 The Effect of Attending a Selective Private High School on College Attendance
We first examine whether attending an elite private high school affects the likelihood that
a student is enrolled in college within eight months after graduating from high school. Results
are shown in Table 2, where the first two columns contain results for the full sample of
applicants (those who were admitted as well as those who were rejected) and subsequent
columns contain findings for the set of students who were admitted. Column 1 shows results
from a specification with all controls except for admission score, and column 2 additionally
controls for admission score.
Results indicate there is little evidence that attending the selective high school affects
college attendance. Results remain unchanged when the sample is restricted to only admitted
applicants, as shown in columns 3 and 4, for which the estimates remain small and statistically
insignificant.
In Table 3 we investigate whether attending the selective high school affects college
attendance differently by gender or neighborhood income. Results for admitted applicants are
presented in columns 1 through 5 of Table 3, which show estimates for all applicants, boys, girls,
20 If anything, this probably understates the extent to which these students attended other private schools since their application suggests that they were clearly interested in doing so.
21 In unreported results, we find the effects of attending the elite private school on college selectivity are largest for students coming from religious middle schools, though the effect is not statistically distinguishable from the effects for students from public and private middle schools.

12
students from higher-income neighborhoods, and students from lower-income neighborhoods.
None of the estimates are statistically significant at conventional levels.
In summary, we find little evidence that enrolling at the selective school affects the
likelihood that students will subsequently enroll in college. While this comes as little surprise
given that applying to this school signals both high student ability and high parental valuation of
education, it does mean that estimates of the effect on college selectivity should be unaffected by
selection into college attendance.
4.2 The Effect of Attending Elite Private High School on College Selectivity
We now turn to whether attending the elite private high school affects the selectivity of
the college subsequently attended, as measured by the median SAT score of the entering class of
the college. Table 4 takes the same form as Table 2, where columns 1 and 2 contain estimates
for all applicants, while columns 3 and 4 show estimates for only admitted applicants. In
addition, below each estimate we report the t-statistic for the test proposed by Altonji et al.
(2005), where the null hypothesis is that there is no omitted variable bias. This method uses the
correlation between the treatment (whether or not a student enrolls) and all other observables in
order to gauge the correlation between the treatment and the stochastic error term. Thus, this test
relies on the somewhat conservative assumption that selection on unobservables is similar to
selection on observables, and allows one to compute estimates of omitted variable bias and the
associated standard errors.22
22 We thank Todd Elder for patiently explaining how this method works and how it can be implemented.

13
As shown in column 1, the estimated difference in college selectivity for the full sample
of applicants is 25 SAT points, while additionally controlling for admission score in column 2
reduces the estimate to 19 points. However, the results of the Altonji et al. (2005) omitted
variable test suggest that one cannot rule out that the positive effects found are due entirely to
omitted variable bias. Specifically, we can resoundingly reject the null hypothesis of no omitted
variable bias (t = 6.9), finding instead that the estimates are significantly overestimated. This
highlights the difficulty in ruling out omitted variable bias when comparing outcomes of two
groups that differ so considerably on observable characteristics.
Consequently, we next move to our preferred identification strategy, which relies on
comparing admitted applicants to attend the selective school to admitted applicants who attend
elsewhere. Estimates are shown in columns 3 and 4 of Table 4. Results indicate that the effect
of attending the private school is approximately 18 to 20 SAT points, which is statistically
significant at the 5 percent level. Furthermore, we cannot reject the null hypothesis of no
omitted variable bias for the specification in either column, and the sign of the omitted variable
bias suggests that if anything, our estimates understate the true effect. Specifically, bias-
corrected estimates for columns 3 and 4 are 41.7 (se=16.8) and 36.1 (se=16.3) SAT points,
respectively.23
We also investigate whether the effects vary by gender or family income. Estimates are
shown in Table 5. Results indicate that the effect of attending the selective high school works
largely through significant positive effects for girls (26 SAT points) and students from lower-
23 Standard errors are computed assuming independence.

14
income families (29 SAT points).24 In contrast, we find little evidence that boys or students from
higher-income families attend more selective universities due to attending the selective high
school, though we note that the Altonji et al. (2005) test indicates that we have underestimated
the effects for both subgroups. For example, assuming selection on unobservables is similar to
selection on observables produces bias-adjusted estimates of 54.1 (se=25.1) and 40.7 (se=21.9)
SAT points for boys and lower-income students, respectively.
In summary, our study yields two important findings. First, we find evidence of a
statistically significant effect of attending a highly selective private high school relative to other
top public and private schools on the selectivity of the college subsequently attended. In
addition, we find that this effect is largely driven by gains for girls and students from lower-
income families.
5. Conclusions
Understanding the extent to which school quality impacts subsequent outcomes is of
interest to parents and students as well as to policymakers. However, as is the case with many
interesting questions in economics, it difficult to disentangle the effect of school quality from the
selection effects associated with attending different types of schools. This problem is likely to be
particularly severe for assessing school quality at the top end of the school/student ability
distribution, where students must first gain admission based on characteristics not typically
observed by the econometrician.
24 We also estimate specifications that allow for separate effects for both low and high-income girls, and we find evidence that both groups experience statistically significant benefits from attending the selective private school. This suggests that the benefits are not driven entirely by children from lower-income neighborhoods who on average would have attended somewhat lower quality high schools. Instead, it appears that attending a top private school is beneficiary even for girls who otherwise would have attended top suburban high schools.

15
In this paper, we address this question by exploiting a unique administrative data set
obtained from the most selective high school in a large metropolitan area. The data enable us to
do two important things to overcome the identification problem associated with estimating
returns to selective schooling. First, we can condition on admission to the selective school in a
way similar to Dale and Krueger (2002). Thus, we avoid comparing the outcomes of students
who attend a highly selective school to those rejected by the school, a decision at least partly
based on factors not typically observed by researchers. In addition, we can also control directly
for the score assigned to each applicant by the school, a measure rarely if ever available in other
data sets.
Results indicate that attending the elite private high school causes students to
subsequently attend more selective colleges and universities. Specifically, we find that enrolling
at the selective high school causes students to enroll at colleges where the median SAT score of
the entering class is 20 points higher. This effect is relative to attending other top public and
private high schools in the area and is approximately the difference between attending Oregon
rather than Oregon State, Pennsylvania State rather than the University of Pittsburgh, or Harvard
rather than Princeton. We find no evidence that our estimates are due to omitted variable bias
using the methods of Altonji et al. (2005), finding instead that if anything, our estimates are
somewhat understated. Furthermore, our results indicate that this effect is driven largely by
gains for girls and children from low-income families.
While the effects are not extremely large, recent evidence suggests that attending more
selective universities can lead to significant increases in earnings, at least for some subgroups.
For example, Dale and Krueger (2002) find that among students attending highly selective
private colleges, attending more selective colleges increases earnings for students from low-

16
income families, though it has no effect on the earnings of other students. Brewer, Eide, and
Ehrenberg (1999) find significant returns to attending elite private institutions for all students,
while Behrman, Rozenzweig, and Taubman (1996) report evidence of a positive payoff from
attending Ph.D.-granting private institutions with well-paid faculty. Hoekstra (2009) finds that
enrolling at the flagship state university increases earnings by approximately 20 percent. While
the difference in the quality of the flagship relative to the alternative options was greater in the
case of Hoekstra (2009) than the effect estimated here, scaling the earnings estimates suggests
that attending a highly selective private high school would still increase earnings by 5 percent.25
Thus, our results suggest that differences in school quality may be important across the
distribution of schools, rather than only for students attending failing schools.
25 Hoekstra (2009) reports that the 2nd-and 3rd-most selective state universities in that study ranked 65 and 83 SAT points lower than the flagship, respectively. Thus, the effect of 18 SAT points presented here is approximately 24 percent of the difference between the flagship and those two schools, implying that the rescaled difference in earnings would be.24%*20% = 5%.

17
References
Altonji, Joseph G., Todd E. Elder, and Christopher R. Taber. 2002. “An Evaluation of Instrumental Variable Strategies for Estimating the Effects of Catholic Schools,” NBER Working Paper W9358.
Altonji, Joseph G., Todd E. Elder, and Christopher R. Taber. 2005. “Selection on Observed and Unobserved Variables: Assessing the Effectiveness of Catholic Schools,” Journal of Political Economy, 113 (1): 151-184.
Behrman, Jere; Mark Rozenzweig, and Paul Taubman. 1996. “College Choice and Wages: Evidence from Female Twins,” Review of Economics and Statistics, 78: 672-685.
Berkowitz, Daniel, Mehmet Caner and Ying Fang. 2009. “The Validity of Instruments Revisited,” mimeo, September 14.
Brewer, Dominic, Eric Eide, and Ronald Ehrenberg. 1999. “Does It Pay to Attend an Elite Private College? Cross-Cohort Evidence on the Effects of College Type on Earnings,” Journal of Human Resources 34 (1): 104-123.
Conley, T.., C. Hansen and P.E. Rossi. 2007. “Plausibly Exogeneous,” Booth School, University of Chicago.
Clark, Damon. 2007. “Selective Schools and Academic Achievement,” Working Paper.
Coleman, James, Thomas Hoffer, and Sally Kilgore. 1982. High school Achievement: Public, Catholic and Private Schools Compared. Basic Books, New York, NY.
Dale, Stacy Berg and Alan Krueger. 2002. “Estimating the Payoff to Attending a More Selective College: An Application of Selection on Observables and Unobservables.” Quarterly Journal of Economics 117 (4): 1491-1527.
Evans, William N. and Robert M. Schwab. 1995. “Finishing High School and Starting College: Do Catholic Schools Make a Difference?” Quarterly Journal of Economics 110 (4): 941-974.
Figlio, David N. and Joe A. Stone. 1999. “Are Private Schools Really Better?” In Research in Labor Economics, vol. 18, edited by Solomon W. Polachek. Stamford, CT: JAI.
Hoekstra, Mark. 2009. “The Effect of Attending the Flagship State University on Earnings: A Discontinuity-Based Approach,” Review of Economics and Statistics 91 (4): 717-724.
Jepsen, Christopher. 2003. “The Effectiveness of Catholic Primary Schooling,” Journal of Human Resources 38: 928-941.
Kraay, Aart. 2008. “Instrumental Variables Regressions with Honestly Uncertain Exclusion Restrictions.” Mimeo, World Bank.
Neal, Derek. 1997. “The Effects of Catholic Secondary Schooling on Educational Achievement,” Journal of Labor Economics, 15 (1): 98-123.

18
Saavedra, Juan. 2009. “The Learning and Early Labor Market Effects of College Quality: A Regression Discontinuity Analysis.” Working paper.
Sander, William. 1996. “Catholic Grade Schools and Academic Achievement,” Journal of Human Resources, 31 (3): 540-548.
Sander, William, and Anthony Krautmann. 1995. “Catholic Schools, Dropout Rates, and Educational Attainment.” Economic Inquiry 23: 217-233.
19
Table 1: Summary Statistics
Rejected Admitted Attend Don't Attend Attend Don't Attend
1 2 3 4 5 6
Admitted 0.00 1.00 1.00 1.00 1.00 1.00
Enrolled 0.00 0.63 1.00 0.00 1.00 0.00
Matched to College 0.67 0.72 0.71 0.73 1.00 1.00
1103 1241 1243 1238 1243 1238(115) (125) (116) (138) (116) (138)9.57 9.27 9.24 9.32 9.24 9.31
(0.77) (0.59) (0.56) (0.29) (0.56) (0.62)-1.53 0.31 0.32 0.29 0.30 0.29(0.78) (0.70) (0.72) (0.64) (0.71) 0.62
Male 0.66 0.39 0.37 0.41 0.39 0.39
$53,140 $58,183 $59,533 $55,894 $59,332 $56,924($17,297) ($17,963) ($18,299) ($17,156) ($18,071) ($17,245)
Race:White 0.70 0.78 0.76 0.80 0.79 0.83
Black 0.23 0.07 0.06 0.08 0.06 0.07
Asian 0.07 0.14 0.16 0.11 0.14 0.08
Other Race 0.00 0.02 0.02 0.02 0.01 0.02
Middle School GPA 2.68 3.46 3.41 3.50 3.40 3.51(0.67) (0.46) (0.47) (0.44) (0.49) (0.43)32.7 61.0 60.3 62.5 59.2 61.0
(21.3) (21.8) (21.5) (22.3) (20.9) (22.0)Middle School Type
Public 0.51 0.41 0.42 0.39 0.41 0.38
Independent 0.25 0.38 0.37 0.40 0.36 0.38
Religious 0.24 0.21 0.21 0.21 0.23 0.24
Legacy 0.18 0.32 0.40 0.18 0.38 0.19
Observations 267 1,321 829 492 591 359Reported in each cell is the mean, while standard deviations are in parentheses.
Admitted ApplicantsAll Applicants Admitted Applicants Linked to College
Median Neighborhood Income (in 2000 dollars)
College Selectivity if Matched (Median SAT)Grade of Potential High School EntryAdmission Score (normalized)
High School Entrance Exam Percentile Ranking

20
Table 2: The Effect of Elite Private High School on College Attendance
Sample
1 2 3 4
0.00 -0.01 -0.02 -0.01(0.03) (0.03) (0.03) (0.03)
Observations 1,588 1,588 1,321 1,321
* Significant at the 10% level** Significant at the 5% level*** Significant at the 1% level
YesYes No
Notes: Each column represents a separate regression of college selectivity on enrollment at the elite school and other controls. Robust standard errors are in parentheses. Student & family characteristics include math and verbal admission test scores, legacy status, GPA, neighborhood income, and indicators for race, sex, middle school type, application year, and application grade.
Enrollment Effect on Attending College
Only Admitted ApplicantsAll Applicants
Controls for Admission Score
Yes YesYesControls for Student & Family Characteristics Yes
No
Table 3: Subgroup Analysis: The Effect of Elite Private High School on College Attendance
Sample
1 2 3 4 5
-0.01 0.01 -0.04 -0.06 0.04(0.03) (0.05) (0.04) (0.04) (0.05)
Observations 1,321 512 809 660 656
* Significant at the 10% level** Significant at the 5% level*** Significant at the 1% level
All Admitted Students
Boys Only Girls Only
Notes: Each sample only includes admitted applicants. Each column represents a separate regression of college selectivity on enrollment at the elite school and other controls. Robust standard errors are in parentheses. Student & family characteristics include math and verbal admission test scores, legacy status, GPA, neighborhood income, and indicators for race, sex, middle school type, application year, and application grade.
Enrollment Effect on Attending College
Yes Yes Yes YesYes
High-Income Families
Lower-Income Families
Yes YesYes YesControls for Student & Family Characteristics Yes
Controls for Admission Score

21
Table 4: The Effect of Attending Elite Private High School on College Selectivity
Sample
1 2 3 4
25.54*** 19.14** 19.88** 18.26**(8.52) (8.49) (9.21) (9.17)
Observations 1,130 1,130 950 950
6.08 6.89 -1.56 -1.32
* Significant at the 10% level** Significant at the 5% level*** Significant at the 1% level
Omitted Variable Bias t-statistic
Yes (biased upward)
Controls for Student & Family Characteristics Yes
Enrollment Effect on College Selectivity
Only Admitted ApplicantsAll Applicants
Controls for Admission Score
Yes YesYes
No
Notes: Each column represents a separate regression of college selectivity on enrollment at the elite school and other controls. Robust standard errors are in parentheses. Student & family characteristics include math and verbal admission test scores, legacy status, GPA, neighborhood income, and indicators for race, sex, middle school type, application year, and application grade. The omitted variable test statistic is the from the test proposed by Altonji et al. (2005), where the null hypothesis is that there is no omitted variable bias.
Reject null hypothesis of no omitted variable bias? No
No Yes No Yes
Yes (biased upward)

22
Table 5: Subgroup Analysis: The Effect of Attending Elite Private High School on College Selectivity
Sample
1 2 3 4 5
18.26** 8.12 26.06** 7.62 29.86**(9.17) (15.10) (11.83) (12.72) (14.23)
Observations 950 371 579 486 461
-1.32 -2.29 0.37 -1.85 -0.30
* Significant at the 10% level** Significant at the 5% level*** Significant at the 1% level
Reject null hypothesis of no omitted variable bias?
Yes YesControls for Student & Family Characteristics Yes
Controls for Admission ScoreOmitted Variable Bias t-statistic
High-Income Families
Lower-Income Families
Yes Yes
Yes (biased downward) No
Yes
No Yes (biased downward)
All Admitted Students
Boys Only Girls Only
Notes: Each sample only includes admitted applicants. Each column represents a separate regression of college selectivity on enrollment at the elite school and other controls. Robust standard errors are in parentheses. Student & family characteristics include math and verbal admission test scores, legacy status, GPA, neighborhood income, and indicators for race, sex, middle school type, application year, and application grade. The omitted variable test statistic is the from the test proposed by Altonji et al. (2005), where the null hypothesis is that there is no omitted variable bias.
Enrollment Effect on College Selectivity
Yes Yes Yes Yes
No