does education matter for economic growth?ftp.iza.org/dp7089.pdf · does education matter for...
TRANSCRIPT

DI
SC
US
SI
ON
P
AP
ER
S
ER
IE
S
Forschungsinstitut zur Zukunft der ArbeitInstitute for the Study of Labor
Does Education Matter for Economic Growth?
IZA DP No. 7089
December 2012
Michael S. DelgadoDaniel J. HendersonChristopher F. Parmeter

Does Education Matter for Economic
Growth?
Michael S. Delgado Purdue University
Daniel J. Henderson
University of Alabama and IZA
Christopher F. Parmeter
University of Miami
Discussion Paper No. 7089 December 2012
IZA
P.O. Box 7240 53072 Bonn
Germany
Phone: +49-228-3894-0 Fax: +49-228-3894-180
E-mail: [email protected]
Any opinions expressed here are those of the author(s) and not those of IZA. Research published in this series may include views on policy, but the institute itself takes no institutional policy positions. The IZA research network is committed to the IZA Guiding Principles of Research Integrity. The Institute for the Study of Labor (IZA) in Bonn is a local and virtual international research center and a place of communication between science, politics and business. IZA is an independent nonprofit organization supported by Deutsche Post Foundation. The center is associated with the University of Bonn and offers a stimulating research environment through its international network, workshops and conferences, data service, project support, research visits and doctoral program. IZA engages in (i) original and internationally competitive research in all fields of labor economics, (ii) development of policy concepts, and (iii) dissemination of research results and concepts to the interested public. IZA Discussion Papers often represent preliminary work and are circulated to encourage discussion. Citation of such a paper should account for its provisional character. A revised version may be available directly from the author.

IZA Discussion Paper No. 7089 December 2012
ABSTRACT
Does Education Matter for Economic Growth?* Empirical growth regressions typically include mean years of schooling as a proxy for human capital. However, empirical research often finds that the sign and significance of schooling depends on the sample of observations or the specification of the model. We use a nonparametric local-linear regression estimator and a nonparametric variable relevance test to conduct a rigorous and systematic search for significance of mean years of schooling by examining five of the most comprehensive schooling databases. Contrary to a few recent papers that have identified significant nonlinearities between education and growth, our results suggest that mean years of schooling is not a statistically relevant variable in growth regressions. However, we do find evidence (within a cross-sectional framework), that educational achievement, measured by mean test scores, may provide a more reliable measure of human capital than mean years of schooling. JEL Classification: C14, J24, I20, O10, O40 Keywords: mean years of schooling, human capital, irrelevant variables, significance
testing, nonparametric Corresponding author: Daniel J. Henderson Department of Economics, Finance and Legal Studies University of Alabama Tuscaloosa, AL 35487-0224 USA E-mail: [email protected]
* We thank the editor Jon Temple, Jenny Minier, Thanasis Stengos, two anonymous referees, and participants at the 2010 Southern Economic Association Conference and the University of Palermo for helpful comments and suggestions.
I. IntroductionThere is a large literature that focuses both on the significance of education in an internationalgrowth regression and the sensitivity of such regressions to the functional form of the model(Kalaitzidakis et al., 2001). Consistent with this emphasis on functional form sensitivity isthe lack of consensus within the literature on whether mean years of schooling is a robustlysignificant correlate of economic growth. Our goal is to investigate the relevance and statisticalsignificance of mean years of schooling in a generalized empirical growth model that doesnot require a priori specification of a functional form that may bias the resulting estimatesof schooling. Failure to find statistical relevance of schooling in our analysis implies thatsignificance of mean years of schooling in a standard growth model is an artifact of modelmisspecification.
Much of the existing literature has emphasized the importance of modeling heterogeneityand nonlinearities within the growth process. Temple (2001) and Kalaitzidakis et al. (2001), forexample, argue that there is a significant nonlinear relationship between economic growth ratesand schooling. Durlauf et al. (2001) argue that the relationship between growth and initial in-come is also significantly nonlinear. Sianesi and Van Reenen (2003) provide a thorough reviewof many econometric issues frequently arising in empirical growth studies, such as parameterheterogeneity, model uncertainty, and nonlinearities. Equally compelling arguments for nonlin-earities with respect to schooling come from the micro-foundations of education. For example,Bils and Klenow (2000) argue that human capital is best modeled as a nonlinear function ofschooling, and develop a model of human capital and schooling that is based on a typical Min-cer model of schooling. Indeed, the earliest microeconomic models of earnings and schoolinginvolved nonlinear relationships (Mincer, 1974). Hence, while the exact relationship betweeneconomic growth rates and schooling is not known, it is clear that simple linear econometricmodels are not sufficient.
One advantage of our fully nonparametric approach is that our model allows for nonlin-earities in the growth process for all of the variables in our model. This stands in contrast toparametric and semiparametric models that require specification of at least part of the empiri-cal model, often assuming some part of the growth process is linear and homogeneous acrosscountries. The nonparametric growth model also has an advantage over model averaging tech-niques (Fernandez et al., 2001) that are often employed to search for robustness of variablesin growth models, because model averaging techniques typically assume that the underlyinggrowth model is linear.1 While our approach does not allow for simultaneous comparison ofnumerous potential growth determinants, as does a parametric model averaging approach, theresults from our model do not hinge upon correct specification of the functional form of themodel.
To further motivate our interest in examining the statistical significance of schooling in anonparametric growth model, Table 1 provides a brief sample of recent research focusing onthe effect of educational attainment on economic growth.2 It is clear from the table that a
1In principle, a model averaging analysis may assume the underlying growth model is nonlinear, but wouldstill typically require specification of the nonlinearities potentially present in the model.
2Educational attainment is traditionally measured using either enrollment rates or mean years of schooling.According to Mankiw et al. (1992), which measure of educational attainment should be used depends on ‘whetherthe available data on human capital correspond more closely to the rate of accumulation (sh) or to the level ofhuman capital (h).’ See also Gemmell (1996) for a more formal discussion of the difference between the stockand flow of human capital in growth regressions.
2

consensus fails to exist on the empirical significance of educational attainment in growth re-gressions. Indeed, there are a variety of parametric, semiparametric, and nonparametric studiesthat reach widely different conclusions regarding the statistical significance of education in agrowth model. The table shows that it is unclear which econometric specification is appropriatein order to correctly capture fundamental aspects of the growth process, and we conclude thatthe statistical significance of schooling in growth regressions may not be robust across differenteconometric specifications.
Our nonparametric model is analogous to the benchmark augmented Solow model thatincludes initial income, investment in physical capital, population growth, and schooling. Weinclude indicator variables to account for region and year fixed effects. We have opted to usea parsimonious specification since the focus here is on the effect of schooling on economicgrowth and the inclusion of additional variables will most likely introduce collinearity andmeasurement error into the model. Krueger and Lindahl (2001), for example, note that manyother potentially relevant factors of growth may likely depend heavily on education levels (e.g.fertility rates). Moreover, Durlauf et al. (2005) have identified over 100 potential growthdeterminants found in the empirical growth literature. It is not feasible to include all potentialgrowth determinants one might imagine in a single regression, nor would it ever completelyremove the possibility of an omitted variable bias. Thus, to simplify issues, and allow a morefocused analysis of schooling and economic growth, we include only the ‘traditional’ Solowvariables.
It is important in any parametric or nonparametric growth model to recognize the potentialendogeneity of schooling. One advantage of using mean years of schooling to proxy for humancapital in an empirical growth model is that mean years of schooling is less likely to be cor-related with contemporaneous macroeconomic shocks that also effect growth rates, especiallyover shorter time horizons. Enrollment rates do not have this advantage. Exogenous shocksthat affect growth rates could lead to an immediate or rapid change in enrollment rates. How-ever, increased school enrollment, for example, will not lead to higher average schooling of theworkforce until the new enrollees have finished their schooling and have entered the workforce.Hence, any shocks to growth rates that cause changes in enrollment rates will not have largeeffects on mean years of schooling over short time horizons, particularly for schooling mea-sures based on the population 25 years old and above. For this reason, we do not focus on anypotential endogeneity of mean years of schooling. Implicit in this approach is the assumptionthat investment in schooling is not made in anticipation of growth (Bils and Klenow, 2000), orthat this effect is not strong enough to influence our results.
We address the issue of data construction for mean years of schooling by considering fivedifferent schooling databases that have received considerable attention in the empirical litera-ture (Nehru et al., 1995; de la Fuente and Domenech, 2002; Cohen and Soto, 2007; Lutz et al.,2007; Barro and Lee, 2010). Each database has been created specifically to overcome potentialweaknesses and inconsistencies identified in competing databases or previous versions of thesame database. Hence, data construction techniques and measurement error have been rigor-ously addressed across each of the education databases, and by considering each separatelywe can be certain that our results do not hinge upon the data source or methods by which ourschooling data are constructed. See Sianesi and Van Reenen (2003) and Pritchett (2006) for athorough discussion of the measurement of the stock of education of a country and potentialissues concerning measurement error in growth regressions.
We use two nonparametric procedures to investigate the significance of schooling in our
3

TABLE 1Sample of recent literature investigating human capital and economic growth
Paper Human capital data Method Summary and significance
Barro (1991) Primary and secondary schoolenrollment rates
OLS cross-section Significant, positive effect of human capitalon economic growth
Mankiw et al. (1992) Secondary school enrollmentrates
OLS cross-section Significant, positive effect of human capitalon economic growth
Durlauf and Johnson(1995)
Secondary school enrollmentrates
OLS cross-section and re-gression tree
Human capital significance depends on sam-ple of nations included in regression
Islam (1995) Barro and Lee (1993) OLS panel data withdummy variables
Insignificant and negative effect of humancapital after controlling for fixed effects
Nonneman and Vanhoudt(1996)
Secondary school enrollmentrates
OLS cross-section Insignificance of human capital after control-ling for ‘technological know-how’
Liu and Stengos (1999) Secondary school enrollmentrates
OLS and semiparametricpartial linear model
Insignificance of human capital in the para-metric model; human capital is insignificantand linear in the semiparametric model
Barro (2001) Barro and Lee (2001) 3SLS with panel data Significant, positive effect of male secondaryeducation; insignificant effect of female andprimary male education
Durlauf et al. (2001) Secondary school enrollmentrates
Semiparametric smoothcoefficient model
Significant, nonlinear effect of human capi-tal conditional upon initial income estimates
Kalaitzidakis et al. (2001) Barro and Lee (1996) OLS and semiparametricpartially linear regressionmodel
Insignificance in parametric models; signifi-cant nonlinearities in semiparametric models
Temple (2001) Barro and Lee (1993, 2000) OLS and Least TrimmedSquares
Evidence of sensitivity to outliers; nonlinear-ities in education; tentative evidence of sig-nificance of education
Sala-i-Martin et al. (2004) Barro and Lee (1993) Bayesian Averaging ofClassical Estimates
Significant relationship between growth andprimary schooling; insignificant relationshipbetween growth and higher education
Maasoumi et al. (2007) Barro and Lee (2001) OLS panel data withdummy variables andlocal-linear least-squares
Insignificance of human capital in the OLSmodel and significance in the LLLS model
Minier (2007) Barro and Lee (2001) OLS cross-section and re-gression tree
Positive, significant effect of human capitalin baseline regressions; insignificance whencontrolling for policy and executive con-straints
Durlauf et al. (2008) Barro and Lee (2001) Bayesian model averaging Little evidence that human capital is signifi-cant and robust
Henderson (2010) Barro and Lee (2001) Nonparametric local-linear least-squares
Insignificance for human capital on eco-nomic growth
nonparametric growth model. First, we examine the statistical significance of the partial effectsof schooling in our nonparametric model to see whether or not a marginal change in meanyears of schooling leads to a significant change in growth rates. Second, we employ a nonpara-metric test of variable relevance (Lavergne and Vuong, 2000) to test the null hypothesis thatschooling is irrelevant in our model. We find that our nonparametric regression estimates yield
4

statistically insignificant partial effects of schooling on growth rates, and our nonparametricvariable relevance test fails to reject the null hypothesis of variable irrelevance for nearly allof the specifications we consider. We find relevance for mean years of schooling for two outof five specifications using a nonparametric median regression model, but note that the partialeffects for each of these specifications are neither statistically nor economically significant. Bycontrast, we apply the same nonparametric procedures to our other covariates (initial income,investment, and population growth) and find that each of these variables are generally rele-vant and statistically significant correlates of economic growth. While there is less uncertaintyabout the significance of these variables within the empirical growth literature, our results pro-vide evidence that their significance is robust to arbitrary forms of nonlinearities, heterogeneity,or model specification.
Even though nonparametric estimators are local estimators, they are not immune to out-liers. It is well documented that nonparametric methods may be sensitive to outliers, especiallyin the context of a conditional mean model or empirical economic growth models (given thesmall sample sizes available). We follow Temple (1998, 2000) and investigate the sensitivity ofour primary results to outliers. We use a minimum covariance determinant estimator to identifyand remove outliers, a nonparametric median regression estimator and testing procedure, anda measurement error corrected education dataset (Portela et al., 2010). We find that the irrel-evance of schooling is robust to our outlier sensitivity assessments. We next consider 5-, 10-,and 20-year lagged effects of schooling on growth as well as a variety of different subsamples,including OECD/non-OECD countries and male/female subsamples, and fail to find relevanceof schooling.
Therefore, we conclude that mean years of schooling is not a relevant variable in an em-pirical growth model. Our result is robust to different functional form assumptions that maybe imposed on the growth model, to the choice of aggregate schooling database, and the con-struction methods incorporated into each. Any empirical significance found for education inprevious research using just the Solow variables is most likely because of model misspecifi-cation. We caution that our results do not necessarily imply that schooling is a poor measureof human capital, only that schooling is not a relevant factor in determining growth rates. In-deed, Pritchett (2001) argues that schooling may not be associated with higher growth ratesbecause (i) educated workers may be motivated to participate in socially unproductive activi-ties - ‘piracy’; (ii) a surplus of skilled labor has suppressed wages and dampened growth; and(iii) that poor quality of schooling has not translated into any increase in human capital. Onlyin the third case is schooling a poor proxy for human capital. Hence, one implication of ourresults is that further research into alternative and complementary measures of human capital,such as test scores and health-based measures of human capital, may be warranted.
In order to provide a brief exploration into the potential of alternative human capital mea-sures, we consider a cross-section of the human capital quality data constructed by Hanushekand Kimko (2000) and find variable relevance as well as robust statistical significance of thepartial effects of education quality. Bearing in mind the limited capacity of the Hanushek andKimko (2000) data because of its small sample size, our results suggest that test score qualitymeasures may provide a more reliable measure of human capital than mean years of schooling.Indeed, significant differences in the quality of schooling across countries likely implies thateconomic growth rates are more highly correlated with educational achievement than attain-ment (Schoellman, 2012).
The rest of this paper is outlined as follows. Section 2 details the empirical methodologies
5

used throughout the analysis. Section 3 provides a description of the data. Section 4 presentsthe results from the baseline sample regressions. Section 5 presents a summary of the resultsfrom a variety of robustness checks, which include outlier sensitivity, lagged schooling effects,alternative subsamples and specifications, and measures of educational achievement. Section 6concludes.
II. MethodologyOur econometric strategy is based on a nonparametric version of the canonical growth regres-sion model. Our model is analogous to the conditional convergence equation in Mankiw et al.(1992), in which human capital is measured as a stock instead of a flow. The nonparametricregression model is
gi = m(xi)+ui, i = 1,2, . . . ,nT (1)
in which gi is the growth rate of a particular country in a particular time period, m(·) is asmooth function of unknown form, xi is a p-dimensioned vector of explanatory regressors,and ui is a mean zero error term. Specifically, we define m(xi) ≡ E[gi|xi]; that is, we definem(xi) to be the conditional mean of gi given the regressors in xi. Our regressors include initialincome, investment in physical capital, population growth, education (defined as mean yearsof schooling, to proxy for the stock of human capital), and indicator variables controlling forregion and year fixed effects.
We employ a dual nonparametric approach to check for robustness of schooling in our non-parametric growth model. We first employ nonparametric local-linear least-squares to estimateEq. (1), and look for statistical significance of the partial effects of education on the economicgrowth rate. This strategy is analogous to using a t-test for coefficient significance in a standardparametric linear regression model, albeit at fixed points. However, because our regressionmodel is nonparametric, we have the added advantage of avoiding parametric model misspeci-fication that may influence whether or not we find statistical significance of the partial effects.As in a parametric t-test of coefficient significance, we interpret statistical insignificance of thepartial effects to imply that the regressor (at that point) does not have a significant effect on theeconomic growth rate, holding constant other variables in the model.
The test of significance for the partial effects of education on economic growth is informa-tive as it tells us whether or not a marginal change in mean years of schooling is correlatedwith a significant change in economic growth rates. However, this test is limited in its abilityto determine whether or not education is a robust variable. Finding that the partial effect(s) ofeducation on economic growth is insignificant does not allow us to exclude education from themodel. Hence, we also employ a formal nonparametric test of variable relevance (Lavergne andVuong, 2000) to help us determine whether or not education is a robust and relevant regressor,and this test provides the backbone of our analysis. If the nonparametric test of variable rele-vance fails to reject the null hypothesis that education is an irrelevant variable, then we haveformal statistical evidence that education, as measured by mean years of schooling, does notbelong in a growth model such as Eq. (1). Of course, if the test rejects the null hypothesis thateducation is an irrelevant variable, then we have robust statistical evidence that education, asmeasured by mean years of schooling, is a robust correlate of the rate of economic growth.
The local-linear least-squares estimator of Eq. (1) is derived from a first-order Taylor ex-
6

pansion of Eq. (1) around a point x in the subset of continuous regressors in xi:
gi ≈ m(x)+(xci − xc)β(x)+ui (2)
in which xci denotes the continuous regressors in xi, and β(x) denotes the partial derivative of
m(x) with respect to x. The local-linear estimator provides an estimate of δ(x)≡(m(x)
β(x)
)via
δ(x) = (X ′Kh(x)X)−1X ′Kh(x)g (3)
in which X is a matrix containing a column of ones and the continuous regressors in xi with theith row being Xi = [1 (xc
i −xc)], Kh(x) is a weighting matrix with kh(xi,x) on the diagonal, andkh(xi,x) is a generalized product kernel function (Racine and Li, 2004) with bandwidth h thatadmits both continuous and discrete variables.3 We determine optimal bandwidths using least-squares cross-validation, which selects the bandwidth by minimizing the following criterionfunction
minh
n
∑i=1
[gi− m−i(xi)]2 (4)
where m−i(xi) is the leave-one-out estimate of m(xi). Standard errors for the partial effectsfrom the local-linear least-squares estimator are obtained using a wild bootstrap.
The intuition for the local-linear estimator is that δ(x) is obtained from a locally weightedlinear regression of gi on xi. The generalized product kernel function, Kh(x), serves as thelocal weighting function, assigning more weight to observations close to x, and less weight toobservations further from x. See Maasoumi et al. (2007), Henderson (2010), and Henderson etal. (2012) for recent examples of applications using the local-linear least-squares estimator inan empirical growth setting.
We use the nonparametric test for variable relevance proposed by Lavergne and Vuong(2000) to determine whether or not human capital, as measured by mean years of schooling, isa variable that belongs in Eq. (1). Specifically, Lavergne and Vuong (2000) consider a test ofthe null hypothesis
H0 : m(xi) = m(xi) (5)
in which xi is a subset of xi; in our case, xi excludes mean years of schooling. That is, we wishto test the null hypothesis that mean years of schooling does not belong in Eq. (1), against thealternative hypothesis
H1 : m(xi) 6= m(xi), (6)
that mean years of schooling is a relevant variable in Eq. (1). In order to properly test the nullhypothesis, Lavergne and Vuong (2000) propose the following test statistic
In =(n−2)!
n!
n
∑i=1
n
∑j=1
ui f−i(xi)u j f− j(x j)kh(xi,x j) (7)
in which ui = gi− m−i(xi) is an estimate of the residuals from the leave-one-out first stage
3Partial effects for discrete variables are obtained separately as a counterfactual change in the estimated regres-sion function as the discrete variables switches from the base value to another. In our application, we focus solelyon partial effects of continuous regressors.
7

restricted regression of gi on xi, f−i(·) is a leave-one-out estimate of the probability densityof the covariates, f (·), and kh(xi,x j) is a product kernel weighting function. Lavergne andVuong (2000) recommend using a rule of thumb bandwidth for variable relevance testing as itwas shown to provide robust size and power in their simulation experiments. We use a wildbootstrap to approximate the distribution of the test statistic under the null hypothesis, andreport p-values based on a standardized version of Eq. (7).
III. DataWith the exception of the education data and categorical indicators, our data are derived fromthe Penn World Table Version 7.0, (Heston et al., 2011). Our education datasets are those con-structed by Nehru et al. (1995), hereafter NSD; de la Fuente and Domenech (2002), hereafterDD; Cohen and Soto (2007), hereafter CS; Lutz et al. (2007), hereafter IIASA-VID; and Barroand Lee (2010), hereafter BL.4
Penn World Table 7.0All international growth rates are based on the Penn World Table Version 7.0 (Heston et al.,2011). The data include measures of per worker GDP growth, initial income, the investmentrate, and working-age population growth. Initial income, investment, and population growthare measured in logs. Per worker GDP growth is the average growth rate over each 5-yearperiod, derived from the chain-weighted real GDP per worker series (RGDPWOK). Initial in-come is measured as the log of real income per worker at the beginning of each 5-year period(again taken from RGDPWOK). The investment rate is the log of the average investment shareof income over each period, derived from KI in the Penn World Table. The population growthvariable is the log of the average growth rate over each 5-year period derived from the totalworking-age population (POP). Our Penn World Table 7.0 data series cover the period from1950-2005, however the time frame varies due to differences in human capital data availabil-ity. We note that in cases in which the 5-year period did not contain five complete annualobservations, we calculated the growth rates based on the available data.
Categorical variablesA regional indicator was created based on the regional country classifications of the WorldBank (available online at www.worldbank.org).5 We have chosen to use the World Bank re-gional classification system instead of other common classifications (e.g., OECD versus non-OECD) since our aim is to capture geographic similarities and other methods have a tendencyto mask relevant information or provide economic, not geographic, information. For example,an OECD/non-OECD indicator is largely based on economic similarities and thus will not cap-ture geographic or cultural similarities. Moreover, this will not identify heterogeneity between
4The Lutz et al. (2007) dataset was constructed as part of a joint research effort conducted by the InternationalInstitute for Applied Systems Analysis (IIASA) and the Vienna Institute of Demography (VID).
5We also tried using a country level indicator to control for individual country effects but found the smoothingparameter is zero, effectively separating each country into its own individual sample. The regional indicator avoidsthis complication and effectively controls for regional effects without completely dividing the sample.
8
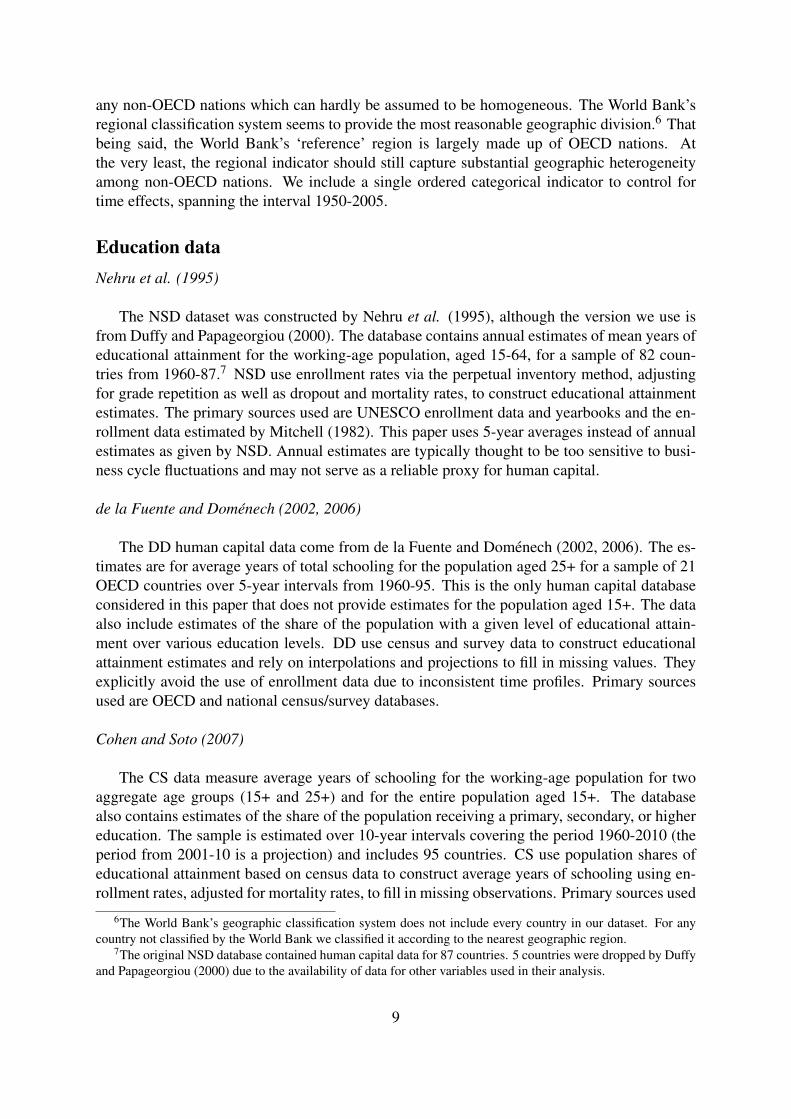
any non-OECD nations which can hardly be assumed to be homogeneous. The World Bank’sregional classification system seems to provide the most reasonable geographic division.6 Thatbeing said, the World Bank’s ‘reference’ region is largely made up of OECD nations. Atthe very least, the regional indicator should still capture substantial geographic heterogeneityamong non-OECD nations. We include a single ordered categorical indicator to control fortime effects, spanning the interval 1950-2005.
Education dataNehru et al. (1995)
The NSD dataset was constructed by Nehru et al. (1995), although the version we use isfrom Duffy and Papageorgiou (2000). The database contains annual estimates of mean years ofeducational attainment for the working-age population, aged 15-64, for a sample of 82 coun-tries from 1960-87.7 NSD use enrollment rates via the perpetual inventory method, adjustingfor grade repetition as well as dropout and mortality rates, to construct educational attainmentestimates. The primary sources used are UNESCO enrollment data and yearbooks and the en-rollment data estimated by Mitchell (1982). This paper uses 5-year averages instead of annualestimates as given by NSD. Annual estimates are typically thought to be too sensitive to busi-ness cycle fluctuations and may not serve as a reliable proxy for human capital.
de la Fuente and Domenech (2002, 2006)
The DD human capital data come from de la Fuente and Domenech (2002, 2006). The es-timates are for average years of total schooling for the population aged 25+ for a sample of 21OECD countries over 5-year intervals from 1960-95. This is the only human capital databaseconsidered in this paper that does not provide estimates for the population aged 15+. The dataalso include estimates of the share of the population with a given level of educational attain-ment over various education levels. DD use census and survey data to construct educationalattainment estimates and rely on interpolations and projections to fill in missing values. Theyexplicitly avoid the use of enrollment data due to inconsistent time profiles. Primary sourcesused are OECD and national census/survey databases.
Cohen and Soto (2007)
The CS data measure average years of schooling for the working-age population for twoaggregate age groups (15+ and 25+) and for the entire population aged 15+. The databasealso contains estimates of the share of the population receiving a primary, secondary, or highereducation. The sample is estimated over 10-year intervals covering the period 1960-2010 (theperiod from 2001-10 is a projection) and includes 95 countries. CS use population shares ofeducational attainment based on census data to construct average years of schooling using en-rollment rates, adjusted for mortality rates, to fill in missing observations. Primary sources used
6The World Bank’s geographic classification system does not include every country in our dataset. For anycountry not classified by the World Bank we classified it according to the nearest geographic region.
7The original NSD database contained human capital data for 87 countries. 5 countries were dropped by Duffyand Papageorgiou (2000) due to the availability of data for other variables used in their analysis.
9

to estimate educational attainment are the OECD’s education database, UNESCO’s StatisticalYearbook and Statistics and national agencies’ censuses. Since the data are available from Co-hen and Soto in 10-year intervals, we linearly interpolated the data to obtain 5-year intervalsin order to maintain consistency with alternative human capital databases. Regression resultsutilizing the original 10-year intervals are later reported as a robustness check.
IIASA-VID (Lutz et al. 2007)
The IIASA-VID database includes estimates of average years of schooling and proportionsof educational attainment according to age (5-year age groups) and gender for the working-agepopulation aged 15+ for a sample of 120 countries over the years 1970-2000. The database alsoincludes aggregate measures of mean educational attainment for three aggregate age groups(15+, 25+ and 65+) for males, females and both sexes together. IIASA-VID uses census andsurvey data to construct human capital stock estimates for a base year (2000) and back projectsuntil 1970 to obtain estimates of human capital based on age and gender, adjusting for mortalityand migration rates. The basic idea behind these back projections is that the stock of humancapital for each age cohort in the year 2000 is directly related to the stock of human capitalfor the previous age cohort five years prior, adjusted for mortality. For example, the stock ofhuman capital for men aged 50 in the year 2000 must be the same as the stock of human capitalfor men aged 45 in the year 1995, after adjusting for mortality rates. This demographic backprojection technique allows the researcher to obtain estimates of the human capital stock fordifferent age cohorts across both genders without relying on historical survey or census data.Another benefit of this method is that it avoids issues that arise from changes over time in themethods used for data collection. This is the only human capital dataset to utilize this approach.
Barro and Lee (2010)
The BL dataset is primarily a response to critical observations of older editions, for ex-ample Barro and Lee (2001). The dataset extends coverage of mean years of schooling datato 146 countries over 5-year intervals from 1950-2010, disaggregated by gender and age (15+and 25+). Census and survey data obtained from UNESCO and Eurostat are used to constructestimates of various levels of educational attainment. Missing observations are estimated byextrapolating backwards and forwards from census and survey data. Estimates are corrected formortality rates that are allowed to differ across different education cohorts. Preliminary testing(Barro and Lee, 2010) shows that these new estimates have successfully corrected the incon-sistencies identified in previous BL versions providing smoother time profiles for educationalattainment. Their estimated reliability ratios suggest BL is more reliable than CS, which wasshown by Cohen and Soto (2007) to be more reliable than Barro and Lee (2001).
Preliminary discussion
As can be seen from the descriptions above, there is still some dispute as to the most suitablemethods for estimating mean years of schooling. One theme emerging in the most recenteducation measures (i.e. DD, CS, IIASA-VID and BL) is a distrust of enrollment rates to serveas a reliable proxy for human capital. de la Fuente and Domenech (2006) point out numerousimplausibilities in estimates based entirely on enrollment data. Census and survey data are
10

believed to provide a more accurate picture of current educational conditions. Currently, howto properly fill in missing observations appears to be the main point of dispute. CS employ themost ‘traditional’ approach by using enrollment rates, whereas DD and IIASA-VID rely solelyon projections.
The most commonly-used dataset in growth empirics is Barro and Lee (2001), however re-cent research has argued that new, alternative education measures are empirically more relevantin explaining cross-country growth variation and tend to be more robust when compared to theBarro and Lee (2001) estimates (Barro and Lee, 2010; Lutz et al., 2007; Cohen and Soto, 2007;de la Fuente and Domenech, 2006). The NSD database, according to Cohen and Soto (2007),has not enjoyed the empirical success of the Barro and Lee (2001) dataset since it fails to makeuse of census data and in some cases their estimates do not coincide with information availablefrom censuses; see also de la Fuente and Domenech (2006) for a similar critique. Given therelease of the newest BL dataset, it is perhaps too soon to tell which of the alternative educationdatasets will prove most reliable and useful; however Savvides and Stengos (2009) name CSas the most likely competitor of Barro and Lee (2001).8 Preliminary testing (de la Fuente andDomenech, 2006; Cohen and Soto, 2007; Lutz et al., 2007) has shown that the DD, CS andIIASA-VID estimates yield qualitatively similar results and are in general jointly qualitativelydifferent from Barro and Lee (2001).
One issue that needs to be addressed is the question of comparability between different ed-ucation measures. Due to the differences in either time spans or samples of countries, differenteducation datasets will have different sample sizes. This is most notably an issue for the DDdataset. For DD, the results obtained are not necessarily directly comparable to those fromalternative, more comprehensive sources since DD does not include non-OECD nations. Inlight of our goals for this paper, differences between the samples of observations used acrossdifferent educational databases work to strengthen the generality of our results. If we find thatmean years of schooling is irrelevant across each of the different education databases, in spiteof the differences between samples of observations, we have further reassurance of the gener-ality of our results than had the subsamples of observations been the same. We use a varietyof subsamples of observations with each education database in order to ensure that our resultsdo not depend on the observations in the sample or the education database used to proxy forhuman capital.
We calculate the sample correlations between educational attainment measures to obtaininitial insights into how similar (or different) alternative attainment measures are. We firstcalculate the sample correlation matrix for all five education datasets for a consistent sample ofobservations. The sample spans the period from 1970-85 and has a total of 84 observations. Wefind the highest correlations are between CS and DD (0.93), DD and IIASA-VID (0.84), andCS and IIASA-VID (0.76). The lowest correlations are between IIASA-VID and NSD (0.26)and DD and NSD (0.29). In general, NSD is not highly correlated with any of the alternativedatasets. We find, however, that these low correlations disappear once we remove DD from thesample and redefine our consistent sample across the remaining four datasets, yielding a newsample of 256 observations spanning the period 1970-85. The highest correlations are betweenBL and CS (0.93) and CS and IIASA-VID (0.93), yet the lowest correlation is between IIASA-VID and NSD (0.84). We no longer see such dramatic differences in sample correlations across
8Savvides and Stengos note, in particular, that DD and NSD are not adequate human capital sources since theyonly cover a sample of OECD nations and end in 1987, respectively. They make no mention of the IIASA-VIDdatabase.
11

TABLE 2Parametric estimates for schooling
Educational attainment database
Parametric estimator BL CS DD IIASA-VID NSD
Pooled OLS -0.0017 -0.0008 00075 0.0025 -0.00280.0018 0.0017 0.0064 0.0024 0.0024
Fixed Effects -0.0160 -0.0013 -0.0049 -0.0227 -0.00400.0043 0.0044 0.0313 0.0077 0.0067
Between 0.0073 0.0009 -0.0103 0.0034 0.00090.0028 0.0023 0.0079 0.0034 0.0026
First Differences -0.0361 -0.0268 0.0627 -0.0623 -0.01160.0126 0.0131 0.0767 0.0183 0.0159
Notes: Table reports coefficient estimates and standard errors for schoolingonly. Statistically significant coefficients at the 5% level are emphasized inbold.
the remaining datasets. Restricting our sample to 546 observations spanning 1970-2000 foronly BL, CS and IIASA-VID as these are the most comprehensive education datasets, we findthat each of the three pairwise sample correlations are between 0.92 and 0.94. We concludethat for relatively small samples that are restricted to a subset of developed countries, there aresubstantial differences in correlation across each of the education datasets, but for relativelylarge samples that include both developed and developing countries, these datasets are highlycorrelated.
IV. Baseline sample results
Parametric modelsPrior to estimating our nonparametric regressions, we first summarize the results from severalstandard parametric panel data specifications. Specifically, we consider a simple pooled OLSestimator, the fixed effects (within) estimator, the between estimator, and the first differencesestimator. The purpose of estimating parametric regression specifications is to verify that ourdata provide estimates that are consistent with previous empirical research as well as illustratethe sensitivity of typical growth regressions to the estimation procedure. Table 2 containsestimated coefficients for schooling from each of the parametric specifications.
We find the sign and significance of education to be, in part, dependent on the estima-tion procedure. In many cases, we see educational attainment is statistically insignificant, ornegative and significant (Islam, 1995). In terms of population growth, investment, and initialincome, we find that the (unreported) coefficient estimate on each regressor typically takes theexpected magnitude and sign, as well as statistical significance.
12

Nonparametric partial effectsWe now turn to our nonparametric regression model estimated using local-linear least-squares.Table 3 presents the estimates of the partial effects along with their corresponding wild boot-strapped standard error in parentheses.9 Each nonparametric specification includes unorderedand ordered categorical indicators to control for region and time effects. Since nonparamet-ric estimation provides partial effects (and therefore standard errors) for each observation, wesummarize the partial effects for each regressor at the 25th, 50th, and 75th percentiles. Weemphasize that this exercise is analogous to performing t-tests of parameter significance in astandard linear model at each of the three fixed points, and that general statistical insignificanceof the partial effects for any regressor suggests that the regressor is not a statistically significantdeterminant of growth rates. We highlight statistically significant partial effects at the 5% levelin bold.
Before presenting the regression results, we point out that Table 3 shows that there aresubstantial differences between the sample sizes depending on which human capital datasetis included in the regression. The largest datasets are BL, CS and IIASA-VID, spanning theperiods 1950-2005, 1960-2005, and 1970-2000, with 1,376, 921, and 764 observations, re-spectively. DD spans the interval 1960-95 and contains the smallest number of observations,161, while the NSD dataset is of moderate size, spanning the interval 1960-85 and containing478 observations. The number of observations available with each dataset is important for anumber of reasons, but most importantly the following. First, the larger human capital datasetscontain observations for a larger number of non-OECD nations (recall DD only contains OECDnations), and over a longer time horizon. It is important to recognize that data quality likelydiminishes with these larger samples. Second, the nonparametric methods we use to assess therobustness of schooling are more reliable with larger sample sizes - it is important to bear inmind the smaller sample size when interpreting the results from the DD dataset.
Table 3 reveals that initial income is generally negative and statistically significant only atthe 25th percentile for each specification. The only exceptions are BL for which initial incomeis not significant at the reported intervals, and for DD in which initial income is negative andsignificant at both the 25th and 50th percentiles. Henderson et al. (2012) find similar resultsfor initial income in a nonparametric growth setting. We find that physical capital investmentis positive with a magnitude that is similar to estimated coefficients in the parametric models,and is generally statistically significant at the 50th and 75th percentiles. Population growth isgenerally negative and statistically significant across each of the five estimated growth regres-sions, and is consistent with our a priori expectations. Finally, Table 3 shows that schooling isstatistically insignificant at each reported percentile for every education dataset. That is, we donot find any evidence that the partial effects (at the quartiles) of mean years of schooling on theeconomic growth rate are statistically significant for any of the datasets under consideration.We note that the R2, defined as the square of the sample correlation between the observed andfitted growth rates, is generally around 0.6, suggesting that the nonparametric growth modelis capable of explaining substantially more of the variation in growth rates compared to thestandard linear parametric setup (R2 ≈ 0.28), regardless of which education measure is used.
9The estimates of the standard errors for each of the models estimated in this paper are obtained via 399 repli-cations of a wild bootstrap. We utilize a wild bootstrap as it is robust to heteroskedasticity that would otherwiserender a standard residual bootstrap invalid for statistical inference (Cameron and Trevedi, 2005).
13

TAB
LE
3Su
mm
ary
ofpa
rtia
leffe
cts
and
stan
dard
erro
rsfr
omth
elo
cal-
linea
rre
gres
sion
mod
elfo
rth
eba
selin
esa
mpl
e
Edu
catio
nala
ttain
men
tdat
abas
e
BL
CS
DD
IIA
SA-V
IDN
SD
Vari
able
Q1
Q2
Q3
Q1
Q2
Q3
Q1
Q2
Q3
Q1
Q2
Q3
Q1
Q2
Q3
Initi
alIn
com
e-0
.008
8-0
.004
00.
0005
-0.0
106
-0.0
046
-0.0
002
-0.0
243
-0.0
221
-0.0
189
-0.0
048
-0.0
027
-0.0
004
-0.0
125
-0.0
048
0.00
030.
0098
0.00
280.
0039
0.00
500.
0042
0.00
350.
0062
0.00
850.
0110
0.00
240.
0025
0.00
160.
0053
0.00
300.
0025
Inve
stm
ent
0.01
130.
0191
0.02
710.
0091
0.01
670.
0223
0.01
800.
0258
0.02
860.
0088
0.01
850.
0268
0.01
370.
0212
0.02
810.
0081
0.00
770.
0067
0.00
810.
0088
0.00
760.
0090
0.00
420.
0044
0.01
150.
0080
0.00
910.
0066
0.00
520.
0065
Popu
latio
nG
row
th-0
.050
1-0
.033
1-0
.012
6-0
.061
9-0
.042
2-0
.024
1-0
.042
8-0
.022
1-0
.016
1-0
.049
5-0
.036
6-0
.015
4-0
.045
5-0
.035
1-0
.017
00.
0136
0.01
510.
0142
0.01
860.
0061
0.01
020.
0145
0.01
080.
0134
0.00
920.
0239
0.00
820.
0129
0.01
000.
0136
Scho
olin
g-0
.008
00.
0024
0.01
41-0
.005
90.
0016
0.00
77-0
.004
5-0
.000
80.
0012
-0.0
056
0.00
110.
0075
-0.0
084
-0.0
024
0.00
110.
0108
0.01
100.
0097
0.00
510.
0071
0.00
590.
0108
0.00
960.
0088
0.00
510.
0049
0.00
420.
0053
0.00
490.
0032
R2
0.67
040.
5816
0.74
730.
5590
0.59
07Sa
mpl
eSi
ze1,
376
921
161
764
478
Sam
ple
Peri
od19
50-2
005
1960
-200
519
60-9
519
70-2
000
1960
-85
Not
es:
Tabl
ere
port
spa
rtia
leff
ects
atth
e25
th,5
0th,
and
75th
perc
entil
esal
ong
with
boot
stra
pped
stan
dard
erro
rs.S
tatis
tical
lysi
gnifi
cant
part
iale
ffec
tsat
the
5%le
vela
reem
phas
ized
inbo
ld.
14
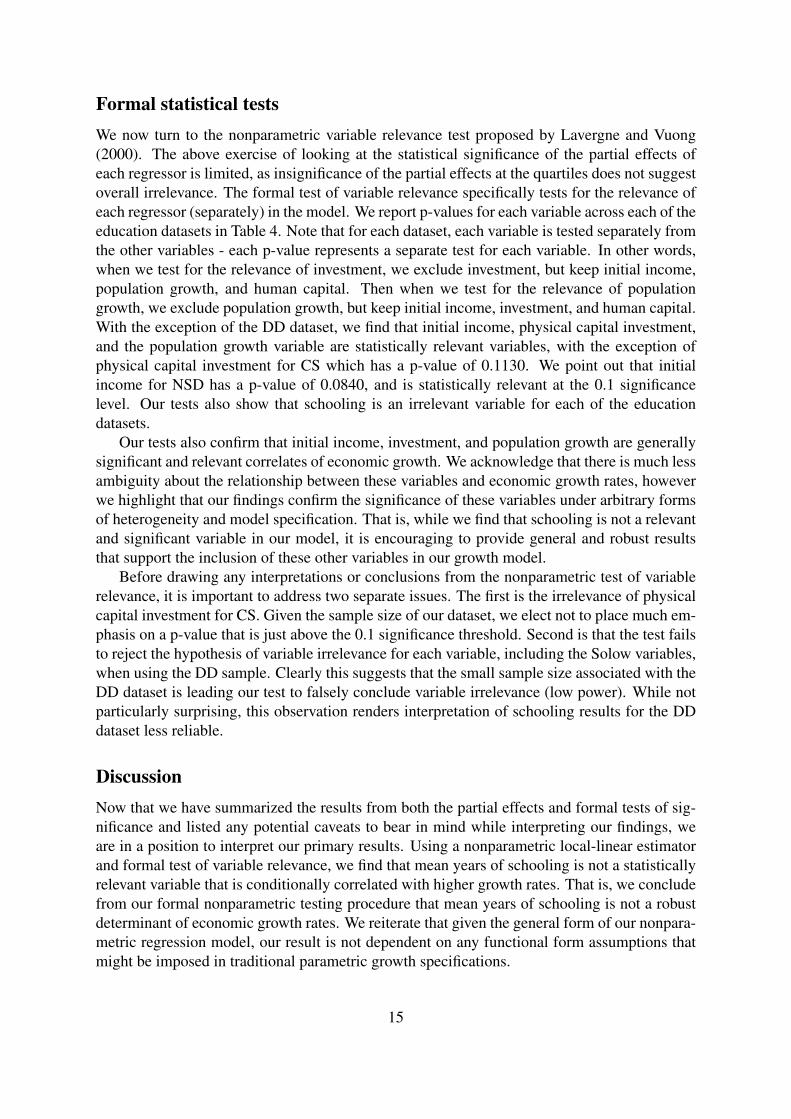
Formal statistical testsWe now turn to the nonparametric variable relevance test proposed by Lavergne and Vuong(2000). The above exercise of looking at the statistical significance of the partial effects ofeach regressor is limited, as insignificance of the partial effects at the quartiles does not suggestoverall irrelevance. The formal test of variable relevance specifically tests for the relevance ofeach regressor (separately) in the model. We report p-values for each variable across each of theeducation datasets in Table 4. Note that for each dataset, each variable is tested separately fromthe other variables - each p-value represents a separate test for each variable. In other words,when we test for the relevance of investment, we exclude investment, but keep initial income,population growth, and human capital. Then when we test for the relevance of populationgrowth, we exclude population growth, but keep initial income, investment, and human capital.With the exception of the DD dataset, we find that initial income, physical capital investment,and the population growth variable are statistically relevant variables, with the exception ofphysical capital investment for CS which has a p-value of 0.1130. We point out that initialincome for NSD has a p-value of 0.0840, and is statistically relevant at the 0.1 significancelevel. Our tests also show that schooling is an irrelevant variable for each of the educationdatasets.
Our tests also confirm that initial income, investment, and population growth are generallysignificant and relevant correlates of economic growth. We acknowledge that there is much lessambiguity about the relationship between these variables and economic growth rates, howeverwe highlight that our findings confirm the significance of these variables under arbitrary formsof heterogeneity and model specification. That is, while we find that schooling is not a relevantand significant variable in our model, it is encouraging to provide general and robust resultsthat support the inclusion of these other variables in our growth model.
Before drawing any interpretations or conclusions from the nonparametric test of variablerelevance, it is important to address two separate issues. The first is the irrelevance of physicalcapital investment for CS. Given the sample size of our dataset, we elect not to place much em-phasis on a p-value that is just above the 0.1 significance threshold. Second is that the test failsto reject the hypothesis of variable irrelevance for each variable, including the Solow variables,when using the DD sample. Clearly this suggests that the small sample size associated with theDD dataset is leading our test to falsely conclude variable irrelevance (low power). While notparticularly surprising, this observation renders interpretation of schooling results for the DDdataset less reliable.
DiscussionNow that we have summarized the results from both the partial effects and formal tests of sig-nificance and listed any potential caveats to bear in mind while interpreting our findings, weare in a position to interpret our primary results. Using a nonparametric local-linear estimatorand formal test of variable relevance, we find that mean years of schooling is not a statisticallyrelevant variable that is conditionally correlated with higher growth rates. That is, we concludefrom our formal nonparametric testing procedure that mean years of schooling is not a robustdeterminant of economic growth rates. We reiterate that given the general form of our nonpara-metric regression model, our result is not dependent on any functional form assumptions thatmight be imposed in traditional parametric growth specifications.
15

TABLE 4Significance test p-values for baseline sample
Educational attainment database
Variable BL CS DD IIASA-VID NSD
Initial Income 0.0000 0.0280 0.8010 0.0000 0.0840Investment 0.0050 0.1130 0.7960 0.0400 0.0190Population Growth 0.0000 0.0050 0.1540 0.0000 0.0000Schooling 0.2250 0.6080 0.6510 0.3230 0.3860
Notes: Table reports p-values from the Lavergne and Vuong (2000)tests of the null hypothesis that each of the four variables given in thefirst column are individually irrelevant variables in our baseline sam-ple. Columns denote which measure of education was included in themodel to proxy for human capital. p-values from tests rejecting the nullhypothesis at the 5% level are emphasized in bold.
There are several possible explanations for the irrelevance of education. First, there isalways the inherent danger of an omitted variable bias. While the nonparametric techniquesexploited here are robust to functional form misspecification, they are not robust to omittedvariable bias. Reasonable economic theory may suggest the relevance of additional growthdeterminants not considered here. We note that our nonparametric methods do not allow forthe simultaneous inclusion of any and all arbitrary growth determinants one can conjure upsince nonparametric estimation requires extraordinarily large sample sizes to achieve the samelevel of reliability as correctly specified parametric models. For a class of linear models thatdo not account for nonlinearities as does the nonparametric framework, yet incorporate a widerange of potential growth determinants, see the Bayesian Model Averaging (BMA) literature(Fernandez et al., 2001; Eicher et al., 2007; Durlauf et al., 2008; Eicher et al., 2011).
Second, as was suggested by several authors (Krueger and Lindahl, 2001; Pritchett, 2001)and in part led to the estimation of several new human capital databases in recent years (de laFuente and Domenech, 2006; Cohen and Soto, 2007; Lutz et al., 2007; Barro and Lee, 2010),there may be potentially large distortions of the estimates due to measurement error. As onemight expect, the reliability of data obtained from developing nations may sometimes be lowand lack informational content, which may cause severe damage to the regression estimates.Krueger and Lindahl (2001) suggest using samples of countries in which the reliability of thedata is greater. It is worthwhile to point out that this is partially addressed via the DD sampleand subsequent OECD regression estimates.
Third, years of schooling derived from enrollment rates and census data may in fact providepoor proxies for the stock of human capital within a particular nation. The level of formaleducation may have little or no significance for the productivity of workers when compared tovocational education, on the job training, or inherent ability. Another possibility is that the levelof formal education may affect productivity among certain age cohorts more than others. Forexample, high-school and college graduates may rely more heavily on their textbook knowledgeduring their first years in the labor force and depend more on the skills they have acquired onthe job after several years. Thus, it may be the case that aggregate human capital measures areinsignificant while there still exists a positive impact of schooling on growth.
16

Fourth, as emphasized by Topel (1999) and Krueger and Lindahl (2001), there is substantialevidence that the time span over which years of schooling is measured matters greatly as therecan be little change in a country’s average level of schooling in a very short period of time.Thus any estimates of the change in education over shorter time periods (e.g. 5-year intervals)are partly changes associated with measurement errors. When controlling for the change inmean years of schooling over longer time spans, for example 20 years, they find substantialreturns to education, suggesting the presence of large externalities to education. We explorethis hypothesis in subsequent sections by extending the interval over which our regressionmodel is estimated, and explore the effect of 5-, 10- and 20-year lagged schooling on economicgrowth.
Fifth, we point out that the results may be highly dependent on the sample of countriesincluded in the regression (Temple, 1998). To explore the effect that different samples may haveon our primary results, we consider several alternative segmentations of our initial databases.
V. Robustness checksIn this section, we summarize a battery of robustness checks aimed at dissecting each educa-tional attainment database, controlling for the sample of countries included in the regression,and assessing the reliability of econometric techniques in order to determine whether or notthe results presented in the previous section are robust. Specifically, we first re-estimate thenonparametric regression model and perform the variable relevance test using a subsample ofobservations with outliers removed, use a nonparametric median regression model, and con-sider an alternative version of the BL dataset that has been corrected for systematic measure-ment errors (Portela et al., 2010) to fully explore the effect of outliers on our primary results.We further explore the robustness of our primary results by investigating the effect of laggededucation on growth rates. We then use all obvious educational attainment subsamples (e.g.OECD/non-OECD samples, male/female samples, etc.) in order to assess whether or not thesignificance of schooling rests on any particular subgroup. Finally, we consider a consistentsample of observations across each dataset, use a balanced panel, and employ a cross-sectionalspecification. The results are summarized in Table 5.
We mention that examination of the statistical significance of the partial effects from thelocal-linear regression models corresponding to each of the robustness checks detailed belowyields insignificance (at the quartiles) for the partial effects for the majority of the subsamples.To be clear, the partial effects for each of the subsamples are predominantly insignificant -only in several sporadic cases do we find statistical significance for one of the reported partialeffects for a particular education database. Hence, examination of the statistical significance ofthe partial effects yields a conclusion consistent with that drawn from the Lavergne and Vuong(2000) test of variable relevance for each of the following subsamples or specifications. In whatfollows, we report only the results from the Lavergne and Vuong (2000) test.10
Outlier sensitivityThe goal of our first set of robustness checks is to determine whether or not our primary result isrobust to the exclusion of outliers. Temple (1998, 2000), for example, emphasizes the potential
10Unreported regression results are available upon request.
17

TABLE 5Significance test p-values for robustness checks
Educational attainment database
Robustness check BL CS DD IIASA-VID NSD
Outlier sensitivityOutlier removal 0.1960 0.6280 0.6310 0.3130 0.3880Nonparametric LAD 0.0010 0.3193 0.5886 0.0280 0.8218Portela et al. (2010) 0.6170
Lagged schooling5-year lag 0.5950 0.5810 0.8180 0.5890 0.479010-year lag 0.7160 0.5650 0.9410 0.5710 0.430020-year lag 0.4380 0.2830 0.7570 0.1390 0.7030
Alternative samplesOECD nations 0.6950 0.8970 0.6250 0.5500 0.8840non-OECD nations 0.1990 0.6430 0.5960 0.3560Males pooled 0.2340Males OECD 0.5910Males non-OECD 0.5020Females pooled 0.2020 0.5760Females OECD 0.6650 0.5330Females non-OECD 0.1990 0.8070Age 25+ pooled 0.5160 0.5430 0.4370Age 25+ OECD 0.7330 0.8620 0.5580Age 25+ non-OECD 0.5230 0.5790 0.6760Age 25+ males pooled 0.2750Age 25+ males OECD 0.6300Age 25+ males non-OECD 0.5090Age 25+ females pooled 0.4260 0.9990Age 25+ females OECD 0.7130 0.5400Age 25+ females non-OECD 0.4100 0.9990
Alternative specifications10-year intervals 0.3240 0.6540 0.6600 0.4570 0.2130Small consistent PWT sample 0.9160 0.9080 0.9200 0.9940Large consistent PWT sample 0.6530 0.7830 0.5070African nations 0.3770 0.4850 0.1470 0.1410non-African nations 0.6320 0.6290 0.2410 0.3710Balanced panel 0.6310 0.5310 0.3150 0.4230 0.4070Maasoumi et al. (2007) dataset 0.1850Hall and Jones (1999) transformation 0.3540 0.5100 0.7440 0.5080 0.1790Nonparametric cross-section 0.0960 0.1820 0.4750 0.0250 0.0890
Notes: Table reports p-values from the Lavergne and Vuong (2000) test of the null hy-pothesis that education is an irrelevant regressor for each robustness check and the relevanteducation datasets. p-values from tests rejecting the null hypothesis at the 5% level areemphasized in bold.
impact of outliers on growth regression estimates. Temple (2000) stresses the importance of
18

outlier detection and the use of econometric techniques that are robust to the presence of outliersin order to obtain more precise and reliable estimates. Our nonparametric approach may besensitive to the presence of outliers since nonparametric methods rely on local weighting thatdepends on the relative distance between observations. An increase in the relative distancebetween observations caused by the presence of outliers can potentially influence the estimatesobtained from the nonparametric model.
In our first robustness exercise, we use a minimum covariance determinant test and estima-tor to detect outliers present in our data (Hardin and Rocke, 2004), and proceed by re-runningthe Lavergne and Vuong (2000) variable relevance test on each human capital dataset with out-liers removed.11 The top section of Table 5 shows that the p-values for the test clearly indicatethat mean years of schooling is not a relevant variable, even after potential outliers have beenremoved from the sample.
The second robustness test aimed at assessing the effect outliers may have on our primaryresult is to run a variable relevance test using a nonparametric least absolute deviation (median)regression model.12 It is well known that mean regression models are potentially sensitive tooutliers, whereas median regression models are less sensitive. Testing for relevance of school-ing using the median regression model provides one important method of assessing whether oureconometric procedure yields robust conclusions as to the relevance of mean years of school-ing in our model. We find that while using the nonparametric least absolute deviation model,we fail to reject the null hypothesis that schooling is an irrelevant regressor for three of theschooling datasets. The test shows that schooling is a relevant variable for both the BL andIIASA-VID samples. However, it is important to note here that the partial effects are neitherstatistically nor economically significant for any of the median regression models.
Our final robustness check assessing the effect of outliers on our primary test results is to usethe measurement error corrected version of the BL dataset (Barro and Lee, 2001) constructedby Portela et al. (2010). They argue that systematic measurement error in the BL dataset leadsto underestimates of mean years of schooling in non-census years - i.e. outliers. They correctfor this error using predicted education levels from a multivariate regression model. As can beseen from Table 5, we fail to find relevance of education while using the Portela et al. (2010)correction.
We conclude from this section that our conclusions regarding mean years of schooling donot appear to be sensitive to the presence of outliers that may exist in our primary sample.
Lagged schoolingOur second round of robustness checks investigates the potential long run impact of schoolingon economic growth. Specifically, we consider using 5-, 10-, and 20-year lags of schooling inplace of our schooling variables in the baseline models. Lagging schooling by 5, 10, and 20years gives an indication of how well past levels of schooling translate into increased growthrates. It is well understood that average years of education change gradually over time, and thata change in the average level of schooling may be slow to manifest itself in improved growthrates.
11See Hartarska et al. (2010) for a detailed discussion on the use of the minimum covariance determinantestimator (in a cross-sectional setting) for performing robust nonparametric regression.
12We acknowledge that the Lavergne and Vuong (2000) test is theoretically proven for the mean regressionmodel, so we use a test following Zheng (1998) to test for variable relevance in the median regression case.
19

The second section of Table 5 shows that none of the mean years of schooling measuresappear to be relevant variables in any of the lagged human capital specifications. We acknowl-edge that the p-value for the IIASA-VID dataset measured as a 20-year lag is relatively lowcompared to the other p-values on lagged measures of schooling. This robustness test providesfurther evidence for our primary result that mean years of schooling is not a relevant variablein our model.
Alternative samplesWe now turn to a variety of different education subsets available within the five databasesconsidered here. The third part of Table 5 reports p-values from the Lavergne and Vuong(2000) test for each of the education measurements. We first divide the baseline sample intoseparate groups based on OECD status to determine whether or not mean years of schoolinghas a different effect on OECD nations than non-OECD. Focusing solely on OECD nationsfor all of the datasets also allows us to restrict our sample to a smaller set of countries forwhich the data are potentially more reliable. It is clear from the reported p-values that noneof the available databases show signs of variable relevance for either the OECD or non-OECDsamples.
We next consider mean years of schooling measures for males and females separately, forthe full sample of countries, OECD countries, and non-OECD countries. Barro (2001), forexample, considers differences in the impact of education on growth based on gender, in partbecause of different degrees of gender discrimination embedded in different countries. Table5 shows that our primary result that mean years of schooling is irrelevant is robust, and wefail to uncover any statistical relevance of mean years of schooling in our growth model whenconsidering education of males and females separately.
Finally, we reconsider all of our previous subsamples of OECD and non-OECD nations,measured over the total population, males, and females, but for the population aged 25 andabove, instead of aged 15 and above. Clearly there may be significant differences in the relationbetween schooling and growth when schooling is measured over a younger or older working-age population. Regardless of the economic rationale for considering these samples separately,it is clear from Table 5 that mean years of schooling for the population aged 25 and above isnot a relevant variable.
Alternative specificationsWe finally consider a variety of alternative model specifications that may yield some insightinto our finding that mean years of schooling is not a robust and relevant regressor in ournonparametric growth model. We first consider a panel dataset that has been constructed over10-year intervals instead of 5-year intervals as in our primary sample. The reason for this is two-fold. First, the Cohen and Soto (2007) dataset is originally measured over 10-year intervals, soin the interest of fairness to each education dataset, it is important to consider the Cohen andSoto (2007) (and others) dataset in its original embodiment. Second, measurement error has apotentially weaker impact on the regression estimates as the time interval over which the dataare averaged increases, so consideration of a 10-year averaged panel may unearth some signsof variable relevance that may be masked by measurement error in the 5-year panel setting.
20

Yet, Table 5 clearly shows that we do not identify any statistical relevance when averaging thedata over 10-year intervals.
We next construct two datasets that maintain a consistent sample of observations across allof the education databases. We consider this robustness test in order to qualitatively test eachof the education databases against each other. The small consistent sample of observations isconstructed based on the four largest datasets (i.e. we exclude DD because of insufficient data),which limits our number of pooled country and time observations to 256. The large consistentsample of observations excludes NSD, and is based on BL, CS and IIASA-VID only. The largeconsistent sample contains 546 pooled country and time observations. As shown in Table 5,maintaining a consistent sample of observations across each of the schooling databases doesnot alter our primary result that education is irrelevant.
Our next robustness checks are to construct a balanced panel for each dataset, and to con-sider Sub-Saharan Africa and non Sub-Saharan Africa separately. We investigate whether bal-ancing the panel alters our primary conclusions that mean years of schooling is irrelevant, andas shown in Table 5, our conclusion is reaffirmed. Our rationale for considering African andnon-African nations separately stems from recent research suggesting that there are fundamen-tal differences in the growth process when comparing Africa to the rest of the world (Masanjalaand Papageorgiou, 2008). Our test of variable relevance fails to uncover statistical relevance ofeducation for either the African or non-African subsamples.
In order to jointly assess whether or not our results are robust to alternative Penn WorldTable growth rate data and an alternative sample of observations, we estimate the baselineregression model using the data from Maasoumi et al. (2007). The growth rate data comefrom the Penn World Table version 5.6 and the World Bank’s World Development Indicatorsdatabase while the human capital data come from Barro and Lee (2001). Table 5 shows that wefail to find any statistical relevance of education using this alternative dataset.
Our penultimate robustness check is to apply the human capital transformation applied byHall and Jones (1999) to test whether or not the educational measures show statistical rele-vance when weighted by a rate of return for each level of educational attainment. We find thatregardless of the intuitive appeal of this approach, this data transformation fails to uncover anyrelevance for the transformed education variable. We conclude that mean years of schoolingfails to adequately proxy for human capital even when considering a rate of return for eachlevel of educational attainment.
The final robustness check we consider with our mean years of schooling data is to estimatea nonparametric cross-sectional specification. It is well understood that cross-sectional modelscan provide relatively robust estimates of the model parameters (Durlauf et al., 2005), sincecross-sectional datasets are less influenced by measurement error because they are constructedover larger time horizons. We find that education in the BL and NSD cross-sections is statis-tically relevant at the 10% significance level, and education in the IIASA-VID cross-sectionis relevant at the 5% level. Hence, the results found using the Lavergne and Vuong (2000)variable relevance test suggests that, at least for these three datasets, we cannot reject meanyears of schooling as a relevant variable in our regression. While this result is encouraging, itis important to analyze the partial effects and their statistical significance in order to determinewhether or not the effects of mean years of schooling in the cross-sectional regressions areconsistent with prior expectations. We find for the BL dataset, the partial effects are positiveand statistically significant taking a mean value of 0.0095, however the magnitude is slightlysmaller than we might expect. We did not find any statistical significance for any of the other
21

cross-sectional datasets. It is important to keep in mind that the sample size (approximately90 observations, depending on the database) is not large enough to guarantee reliability of theresults. Therefore, since we find mixed evidence regarding the relevance of education as aregressor in our nonparametric cross-section model, and little evidence that the partial effectsare statistically significant in the nonparametric local-linear regression, we cannot overturn ourprimary result. However, we acknowledge that the BL data show some signs of promise in thecross-sectional model.
Human capital qualityHaving exhausted each of our mean years of schooling databases and having failed to find anystrong evidence that mean years of school is relevant, we now turn to an alternative measure ofhuman capital: human capital quality constructed from international test scores. We considerthe measure of human capital quality constructed by Hanushek and Kimko (2000), becauserecent years have seen much discussion focusing on the quality of human capital (Hanushekand Woßmann, 2008), instead of mean years of schooling. The Hanushek and Kimko (2000)data come from international test scores, and are available for a complete cross-section of 75countries spanning the period 1960-90. Hanushek and Kimko (2000) construct two measures:QL1 and QL2. QL1 is standardized to the world mean score, and QL2 is standardized to themean score from the United States. We consider the log of both measures for two additionalcross-sectional robustness checks.
The p-values for QL1 and QL2 from the Lavergne and Vuong (2000) relevance test are0.0640 and 0.0750, respectively. We find for QL1 that the local-linear partial effects are positiveand statistically significant at the 5% level at the mean, 25th, 50th, and 75th percentiles. Whilethis result seems to mirror the BL cross-sectional result, we point out that the partial effects areof much larger magnitude when using the Hanushek and Kimko (2000) data. The partial effectsare 0.0204, 0.0320, and 0.0380 at the 25th, 50th, and 75th percentiles. All partial effects for theother regressors have magnitude, sign, and significance consistent with a priori expectations.We obtain similar partial effect results for the QL2 measure. Therefore, the human capitalquality data appear to perform admirably in our nonparametric model.
We caution, however, that these results are based on a nonparametric cross-sectional model,and 75 observations may not be large enough to obtain fully reliable results. We emphasizethat the model provides results completely consistent with prior expectations, and appears tooutperform each of the mean years of schooling datasets. At the very least, this exercise seemsto suggest that further research into quality measures or cognitive ability may prove fruitful.
VI. ConclusionWhile there is undeniably ample intuition and theoretical support for the importance of humancapital in growth specifications, we fail to find robust empirical support for the inclusion ofhuman capital as proxied by mean years of schooling in our baseline growth regression spec-ification. While the previous empirical growth literature has failed to reach a consensus as tothe significance and relevance of educational attainment in growth models, we point out thatmuch of the discrepancy can be attributed to differences in model specification and humancapital measurement. Using five leading educational attainment databases in conjunction with
22

nonparametric econometric techniques that are robust to functional form misspecification, andemploying a barrage of robustness checks addressing concerns over both data structure andmeasurement, we fail to find adequate empirical support for the statistical significance of meanyears of schooling. Rather, we find that, in general, estimates of the impact of mean years ofschooling bear little statistical significance in terms of the estimated partial effects and a formalnonparametric test of variable relevance (Lavergne and Vuong, 2000).
Our results have several implications. First, we find robust evidence that previous empiricalresults identifying positive economic effects of educational attainment are most likely due tofunctional form misspecification. Second, we provide evidence that outliers and differencesin the sample of observations are not the cause of our primary finding that educational at-tainment is a statistically irrelevant variable. Third, our finding that educational achievementshows relevance and statistical significance while educational attainment does not suggests thateducational attainment may not adequately represent human capital in a growth regression.
Our results naturally lead us to the following question. What should be done in order toadequately represent and model human capital in growth regressions? There are several pos-sible answers to this question. First, it is plausible that the models considered here failed toinclude variables measuring all significant determinants of economic growth. Re-examinationof additional potential growth determinants, perhaps through a nonparametric lens, may revealadditional variables that significantly influence the growth process and therefore resolve anyomitted variable problem. Second, further research into alternative measures of human capitalmay be warranted. Our nonparametric models show that the practical consequences of usingdifferent education databases are modest, contrary to the findings of previous research (de laFuente and Domenech, 2002; Cohen and Soto, 2007; Lutz et al., 2007). This suggests hu-man capital may not be adequately represented by mean years of schooling, thereby providingsupport for theories speculating as to the quality of years of schooling obtained in any givencountry relative to other countries, and whether or not vocational training has a greater effecton economic growth than formal years of schooling.
Additional research has focused on the quality of human capital (Woßmann, 2002) andthe effect of cognitive skills on economic growth (Hanushek and Kimko, 2000; Hanushek andWoßmann, 2008). Our nonparametric cross-sectional exploration of the Hanushek and Kimko(2000) data shows a significant and robust effect of human capital quality on economic growthrates. Recently developed techniques, such as sophisticated projection techniques developedthrough the construction of existing education databases, might be applied to measure changesin mean education achievement, to help develop these data into larger and more widely avail-able datasets.
References[1] Barro, R. J. (1991). ‘Economic growth in a cross-section of countries’, Quarterly Journal
of Economics, Vol. 106, pp. 407-443.
[2] Barro, R. J. (2001). ‘Human capital and growth’, American Economic Review: Papersand Proceedings, Vol. 91, pp. 12-17.
[3] Barro, R. J. and Lee, J. (1993). ‘International comparisons of educational attainment’,Journal of Monetary Economics, Vol. 32, pp. 363-394.
23

[4] Barro, R. J. and Lee, J. (1996). ‘International measures of schooling years and schoolingquality’, American Economic Review: Papers and Proceedings, Vol. 86, pp. 218-223.
[5] Barro, R. J. and Lee, J. (2001). ‘International data on educational attainment: updates andimplications’, Oxford Economic Papers, Vol. 3, pp. 541-563.
[6] Barro, R. J. and Lee, J. (2010). ‘A new data set of educational attainment in the world,1950-2010’, NBER Working Paper 15902.
[7] Bils, M. and Klenow, P. J. (2000). ‘Does schooling cause growth?’, American EconomicReview, Vol. 90, pp. 1160-1183.
[8] Cameron, C. A. and Trivedi, P. K. (2005). Microeconometrics: Methods and Applications,Cambridge University Press, New York, NY.
[9] Cohen, D. and Soto, M. (2007). ‘Growth and human capital: good data, good results’,Journal of Economic Growth, Vol. 12, pp. 51-76.
[10] de la Fuente, A. and Domenech, R. (2002). ‘Educational attainment in the OECD, 1960-1995’, CEPR DP 3390.
[11] de la Fuente, A. and Domenech, R. (2006). ‘Human capital in growth regressions: howmuch difference does data quality make?’, Journal of the European Economic Associa-tion, Vol. 4, pp. 1-36.
[12] Duffy, J. and Papageorgiou, C. (2000). ‘The specification of the aggregate productionfunction: a cross-country empirical investigation’, Journal of Economic Growth, Vol. 5,pp. 83-116.
[13] Durlauf, S. N. and Johnson, P. A. (1995). ‘Multiple regimes and cross-country growthbehavior’, Journal of Applied Econometrics, Vol. 10, pp. 365-384.
[14] Durlauf, S. N., Johnson, P. A. and Temple, J. R. W. (2005). ‘Growth econometrics’, Hand-book of Economic Growth, Vol. 1, pp. 555-677.
[15] Durlauf, S. N., Kourtellos, A. and Minkin, A. (2001). ‘The local Solow growth model’,European Economic Review, Vol. 45, pp. 928-960.
[16] Durlauf, S. N., Kourtellos, A. and Tan, C. M. (2008). ‘Are any growth theories robust?’,Economic Journal, Vol. 118, pp. 329-346.
[17] Eicher, T. S., Papageorgiou, C. and Raftery, A. E. (2011). ‘Default priors and predic-tive performance in Bayesian model averaging, with application to growth determinants’,Journal of Applied Econometrics, Vol. 26, pp. 30-55.
[18] Eicher, T. S., Papageorgiou, C. and Roehn, O. (2007). ‘Unraveling the fortunes of thefortunate: an iterative Bayesian model averaging (IBMA) approach’, Journal of Macroe-conomics, Vol. 29, pp. 494-514.
[19] Fernandez, C., Ley, E. and Steel, M. F. J. (2001). ‘Model uncertainty in cross-countrygrowth regressions’, Journal of Applied Econometrics, Vol. 16, pp. 563-576.
24

[20] Gemmell, N. (1996). ‘Evaluating the impacts of human capital stocks and accumulationon economic growth: some new evidence’, Oxford Bulletin of Economics and Statistics,Vol. 58, pp. 9-28.
[21] Hall, R. E. and Jones, C. I. (1999). ‘Why do some countries produce so much more outputper workers than others?’, Quarterly Journal of Economics, Vol. 114, pp. 83-116.
[22] Hanushek, E. A. and Kimko, D. D. (2000). ‘Schooling, labor-force quality, and the growthof nations’, American Economic Review, Vol. 90, pp. 1184-1208.
[23] Hanushek, E. A. and Woßmann, L. (2008). ‘The role of cognitive skills in economicdevelopment’, Journal of Economic Literature, Vol. 46, pp. 607-668.
[24] Hardin, J. and Rocke, D. M. (2004). ‘Outlier detection in the multiple cluster settingusing the minimum covariance determinant estimator’, Computational Statistics and DataAnalysis, Vol. 44, pp. 625-638.
[25] Hartarska, V., Parmeter, C. F., Nadolynak, D. and Zhu, B. (2010). ‘Economies of scopefor microfinance: differences across output measures’, Pacific Economic Review, Vol. 15,pp. 464-481.
[26] Henderson, D. J. (2010). ‘A test for multimodality of regression derivatives with an appli-cation to nonparametric growth regressions’, Journal of Applied Econometrics, Vol. 25,pp. 458-480.
[27] Henderson, D. J., Papageorgiou, C. and Parmeter, C. F. (2012). ‘Growth empirics withoutparameters’, Economic Journal, Vol. 122, pp. 125-154.
[28] Heston, A., Summers, R. and Aten, B. (2011). ‘Penn World Table Version 7.0’, Technicalreport, Center for International Comparisons of Production, Income and Prices at theUniversity of Pennsylvania.
[29] Islam, N. (1995). ‘Growth empirics: a panel data approach’, Quarterly Journal of Eco-nomics, Vol. 110, pp. 1127-1170.
[30] Kalaitzidakis, P., Mamuneas, T. P., Savvides, A. and Stengos, T. (2001). ‘Measures ofhuman capital and nonlinearities in economic growth’, Journal of Economic Growth, Vol.6, pp. 229-254.
[31] Krueger, A. and Lindahl, M. (2001). ‘Education for growth? Why and for whom?’, Jour-nal of Economic Literature, Vol. 39, pp. 1101-1136.
[32] Lavergne, P. and Vuong, Q. (2000). ‘Nonparametric significance testing’, EconometricTheory, Vol. 16, pp. 576-601.
[33] Liu, Z. and Stengos, T. (1999). ‘Non-linearities in cross country growth regressions: asemiparametric approach’, Journal of Applied Econometrics, Vol. 14, pp. 527-538.
[34] Lutz, W., Goujon, A., Samir, K. C. and Sanderson, W. (2007). ‘Reconstruction of popu-lations by age, sex, and level of educational attainment for 120 countries for 1970-2000’,Vienna Yearbook of Population Research, pp. 193-235.
25

[35] Maasoumi, E., Racine, J. S. and Stengos, T. (2007). ‘Growth and convergence: a profileof distribution dynamics and mobility’, Journal of Econometrics, Vol. 136, pp. 483-508.
[36] Mankiw, N. G., Romer, D. and Weil, D. N. (1992). ‘A contribution to the empirics ofeconomic growth’, Quarterly Journal of Economics, Vol. 107, pp. 407-437.
[37] Masanjala, W. H. and Papageorgiou, C. (2008). ‘Rough and lonely road to prosperity:a reexamination of the sources of growth in Africa using Bayesian model averaging’,Journal of Applied Econometrics, Vol. 23, pp. 671-682.
[38] Mincer, J. (1974). Schooling, Experience, and Earnings, Columbia University Press, NewYork, NY.
[39] Minier, J. (2007). ‘Nonlinearities and robustness in growth regressions’, American Eco-nomic Review: Papers and Proceedings, Vol. 97, pp. 388-392.
[40] Mitchell, B. R. (1982). International Historical Statistics, Africa and Asia, Second Edi-tion, New York University Press, New York, NY.
[41] Nehru, V., Swanson, E. and Dubey, A. (1995). ‘A new database on human capital stockin developing and industrial countries: sources, methodology and results’, Journal ofDevelopment Economics, Vol. 46, pp. 379-401.
[42] Nonneman, W. and Vanhoudt, P. (1996). ‘A further augmentation of the Solow model andthe empirics of economics growth for OECD countries’, Quarterly Journal of Economics,Vol. 11, pp. 943-953.
[43] Portela, M., Alessie, R. and Teulings, C. (2010). ‘Measurement error in education andgrowth regressions’, Scandinavian Journal of Economics, Vol. 112, pp. 618-639.
[44] Pritchett, L. (2001). ‘Where has all the education gone?’, World Bank Economic Review,Vol. 15, pp. 367-391.
[45] Pritchett, L. (2006). ‘Does learning to add up add up? The returns to schooling in aggre-gate data’, Handbook of the Economics of Education, Vol. 1, pp. 635-695.
[46] Racine, J. S. and Li, Q. (2004). ‘Nonparametric estimation of regression functions withboth categorical and continuous data’, Journal of Econometrics, Vol. 119, pp. 99-130.
[47] Sala-i-Martin, X., Doppelhofer, G. and Miller, R. I. (2004). ‘Determinants of long-termgrowth: a Bayesian averaging of classical estimates (BACE) approach’, American Eco-nomic Review, Vol. 94, pp. 813-835.
[48] Savvides, A. and Stengos, T. (2009). Human Capital and Economic Growth, StanfordUniversity Press, Stanford, CA.
[49] Schoellman, T. (2012). ‘Education quality and development accounting’, Review of Eco-nomic Studies, Vol. 79, pp. 388-417.
[50] Sianesi, B. and Van Reenen, J. (2003). ‘The returns to education: macroeconomics’, Jour-nal of Economic Surveys, Vol. 17, pp. 157-200.
26

[51] Temple, J. R.W. (1998). ‘Robustness tests of the augmented Solow model’, Journal ofApplied Econometrics, Vol. 13, pp. 361-375.
[52] Temple, J. R. W. (2000). ‘Growth regressions and what the textbooks don’t tell you’,Bulletin of Economic Research, Vol. 52, pp. 181-205.
[53] Temple, J. R. W. (2001). ‘Generalizations that aren’t? Evidence on education and growth’,European Economic Review, Vol. 45, pp. 905-918.
[54] Topel, R. (1999). ‘Labor markets and economic growth’, Handbook of Labor Economics,Vol. 3C, pp. 2943-2984.
[55] Woßmann, L. (2002). Schooling and the Quality of Human Capital, Springer, Berlin.
[56] Zheng, J. X. (1998). ‘A consistent nonparametric test of parametric regression modelsunder conditional quantile restrictions’, Econometric Theory, Vol. 14, pp. 123-138.
27