does donor support to public financial management … · financial management reforms in developing...
TRANSCRIPT
Does donor support to public financial management reforms in developing countries work?
An analytical study of quantitative
cross-country evidence
Paolo de Renzio, Matt Andrews and Zac Mills
Overseas Development Institute
Working Paper 329Results of ODI research presented in preliminary form for discussion
and critical comment
ODI at 50: advancing knowledge, shaping policy, inspiring practice • www.odi.org.uk/50years
Working Paper 329
Does donor support to public financial management reforms in developing countries work?
An analytical study of quantitative
cross-country evidence
Paolo de Renzio, Matt Andrews and Zac Mills
April 2011
Overseas Development Institute 111 Westminster Bridge Road
London SE1 7JD www.odi.org.uk
* Disclaimer: The views presented in this paper are those of the authors and do not necessarily represent the views of ODI.
ii
Notes and acknowledgements
This analytical study of quantitative cross-country evidence on public financial management (PFM) in developing countries is part of a broader joint evaluation, initiated by the evaluation departments of the Danish International Development Agency (Danida), the Swedish Agency for International Development Cooperation (Sida), the UK Department for International Development (DFID) and the African Development Bank (AfDB), in consultation with the Organisation for Economic Co-operation and Development’s Development Assistance Committee (OECD-DAC) Evaluation Network. It was carried out between March and September 2010 by a team formed of Paolo de Renzio (University of Oxford and Overseas Development Institute (ODI), team leader), Zac Mills (independent consultant) and Matt Andrews (Harvard University).
The authors would like to thank the members of the joint evaluation’s Management Group, Ed Hedger, Greg Smith and Hafsa Mahtab at ODI, Joachim Wehner at the London School of Economics and Political Science, who reviewed a draft of the study, participants at a World Bank seminar and donor officials who provided data and information.
ISBN 978 1 907288 36 4 Working Paper (Print) ISSN 1759 2909 ODI Working Papers (Online) ISSN 1759 2917 © Overseas Development Institute 2011 Readers are encouraged to quote or reproduce material from ODI Working Papers for their own publications, as long as they are not being sold commercially. As copyright holder, ODI requests due acknowledgement and a copy of the publication.
iii
Contents
Notes and acknowledgements ii Contents iii Figures and tables iv Acronyms v Executive summary vii
1. Background, objectives and analytical approach 1 2. Literature review and previous findings 3 3. Key variables and data collection 7
3.1 Data on PFM systems 7 3.2 Data on donor support to PFM reforms 11 3.3 Other variables 13
4. Results of the analysis: PEFA large-N sample 15 5. Results of the analysis: HIPC medium-N sample 22 6. Conclusions and implications for overall evaluation 24
References 27 Appendix 1: List of PEFA Countries 29 Appendix 2: List of HIPC/PEFA countries 30 Appendix 3: PFM clusters 31 Appendix 4: HIPC/PEFA indicators 32 Appendix 5: Donor data request form 33 Appendix 6: List of variables and summary statistics 34
iv
Figures and tables Figure 1: Distribution of overall average PEFA scores 8Figure 2: Average PEFA scores by PFM cluster 9Figure 3: Total donor PFM support, 1995-2008 12Figure 4: Average PEFA scores and key explanatory factors (bivariate scatter plots) 15Figure 5: PEFA large-N regression residuals 25 Table 1: Quality of PFM systems across 19 African HIPCs, 2001-2010 10Table 2: Other independent variables included in the PEFA large-N analysis 14Table 3: Preliminary regressions by groups of variables 16Table 4: Determinants of the quality of PFM systems 17Table 5: Partial regression results (robustness checks with sample changes) 19Table 6: Partial regression results (PEFA scores by type of PFM process) 21Table 7: The determinants of the quality of PFM systems in 19 African HIPCs, 2001-2010 22
v
Acronyms ADB Asian Development Bank AfDB African Development Bank CPIA Country Policy and Institutional Assessment (World Bank) CRS Creditor Reporting System (OECD-DAC) DAC Development Assistance Committee (OECD) Danida Danish International Development Agency DFID Department for International Development (UK) EC European Commission ECA Europe and Central Asia GBS General Budget Support GDP Gross Domestic Product HDR Human Development Report HIPC Heavily Indebted Poor Countries Initiative IADB Inter-American Development Bank ICE Imputation by Chained Equations IDA International Development Association IFMIS Integrated Financial Management Information System IMF International Monetary Fund LAC Latin America and Caribbean LIC Low-Income Country LSE London School of Economics MIC Middle-Income Country MTEF Medium-Term Expenditure Framework ODA Official Development Assistance ODI Overseas Development Institute OECD Organisation for Economic Co-operation and Development OLS Ordinary Least Squares PCA Principal Component Analysis PEFA Public Expenditure and Financial Accountability PFM Public Financial Management PPP Purchasing Power Parity PRSC Poverty Reduction Support Credit PRSP Poverty Reduction Strategy Paper PSR Public Sector Reform Sida Swedish Agency for International Development Cooperation SSA Sub-Saharan Africa UK United Kingdom US United States USAID US Agency for International Development WDI World Development Indicators WEO World Economic Outlook WLS Weighted Least Squares

vi
vii
Executive summary This study is part of a broader evaluation of donor support to public financial management (PFM) reforms in developing countries. It brings together available quantitative evidence on the quality of PFM systems, to assess the factors that are associated with and may have determined cross-country differences and variations over time, with a particular focus on the impact of donor support to PFM reforms. The bulk of the analysis draws on data from Public Expenditure and Financial Accountability (PEFA) assessments in 100 countries, data on donor support to PFM reforms collected directly from some of the donor agencies most active in this area and a large dataset on other economic/social, political/institutional and aid-related variables identified as relevant from previous research. A number of findings from the cross-country econometric analysis are relevant for the evaluation, and for broader donor approaches and policies on PFM reforms. They can be summarised as follows:
• Economic factors are most important in explaining differences in the quality of PFM systems. Aid-related factors, on the other hand, have more limited explanatory power. As a consequence, PFM systems are more likely to improve in response to changing economic circumstances rather than to donor efforts.
• More specifically, countries with higher levels of per capita income, with larger populations and better recent economic growth records, are characterised by better quality PFM systems. On the other hand, state fragility, defined as being in a conflict or post-conflict situation, has a negative effect on the quality of PFM systems.
• Interestingly for the purposes of the evaluation, donor PFM support is also positively and significantly associated with quality of PFM systems. On average, countries that received more PFM-related technical assistance have better PFM systems. However, the association is very weak: an additional $40-50 million per year would correspond to a half-point increase in the average PEFA score (equivalent to, say, a change from ‘C’ to ‘C+’ in PEFA indicators).
• These results remained consistent through a number of robustness checks and model changes. Interesting additional results come from using more recent data or focusing on low-income countries only. In these cases, the share of total aid provided as general budget support (GBS) is also positively and significantly associated with better PFM quality. In other words, aid modalities, and not just direct support to PFM reforms, contribute to explaining differences in the quality of PFM systems in some of the poorer countries where most donor efforts are concentrated.
• Finally, different aspects of donor support differ in their relationship with more specific PFM processes. A longer period of donor engagement, for example, is associated with better performance in upstream, de jure and concentrated processes. This may owe to donors’ historical tendency to pay more attention to these simpler reform areas, but could also reflect the fact that downstream, de facto and de-concentrated processes take longer to improve.
• The level of donor PFM support is also associated more strongly with scores for de jure and concentrated PFM processes, again highlighting how donor PFM support seems to focus more on rules, procedures and specific actors within government. Results are reversed when it comes to upstream vs. downstream processes. Here, the association is stronger with downstream processes, possibly highlighting the large amounts of funding devoted to Integrated Financial Management Information System (IFMIS) projects, a typical downstream PFM reform.
At the same time, these results suffer from a number of serious limitations and challenges, including the following:
• Data quality remains an issue, especially when it comes to information about donor PFM support. Given limitations in the information provided by donors, we focused on yearly disbursements for PFM-related activities. This gives undue weight to large projects such as IFMIS introduction, at the expense of ‘softer’ interventions. We also focused on data post-2002,
viii
for which availability is much greater. This means we cannot capture earlier donor PFM support, from a time when the foundations for PFM reforms were laid in some of the countries included in our sample.
• While the positive and significant relationship between donor PFM support (and GBS as a share of total aid in certain cases) on the one hand and quality of PFM systems on the other is particularly encouraging for the purposes of the evaluation, it clearly cannot be interpreted as causal, given the nature of the data. It could merely reflect the fact that donors tend to provide more PFM-related assistance (and more GBS) to countries that have already achieved certain success in improving the quality of their PFM systems. Despite various attempts to tackle this issue, we could not prove the direction of causality.
• Assessing the impact of donor support on PFM reforms requires tracking the quality of PFM systems over time. Given the lack of sufficient time series data, the analysis assumes that a higher PEFA score today is a valid proxy for past reform success. However, its findings are only partly confirmed by evidence from a smaller dataset looking at changes in PFM systems over the past decade in 19 African countries.
These limitations and challenges point to the need to interpret the results of the analysis presented in this paper with a great deal of caution. Moreover, they highlight the need to complement these quantitative findings with in-depth qualitative research at country level, explaining not only if and when donor PFM support has had an impact on PFM systems, but also why and how it did. Nevertheless, case study countries can and should be selected taking into account some of the insights provided in this paper.
1
1. Background, objectives and analytical approach This analytical study is part of a broader evaluation aimed at answering two sets of questions:
1. Where and why do PFM reform efforts succeed? 2. Where and how does external support to PFM reform efforts contribute most effectively to their
success? More specifically, the present study brings together all available quantitative evidence on the quality of PFM systems across countries and over time, to assess factors that are associated with and may have determined cross-country differences and variations over time. One key issue relates to how best to use available methodological tools to analyse existing quantitative data, in order to provide at least tentative or partial answers to the two evaluation questions. On the one hand, the analysis aims to assess what country characteristics are associated with, or can be considered causes of, successful PFM reform efforts. On the other hand, it needs to focus more specifically on the contribution to such success of donor support to PFM reforms. Therefore, for question (1), the focus needs to be on contextual factors and conditions (economic, political, etc.) that can be used as independent variables, so as to assess their association/correlation with variations in the dependent variable (the quality of PFM systems) across countries and over time. For question (2) a somewhat narrower approach is needed, to isolate the more specific impact of donor support to PFM reforms, while holding other factors constant. In order to address these issues, while taking into account the scarce availability of data, the study focuses on two types of analysis. The first type (henceforth PEFA large-N) applies econometric techniques using the full cross-country dataset from Public Expenditure and Financial Accountability (PEFA) assessments as the dependent variable, covering 100 countries (see Appendix 1). This large-N analysis takes advantage of the wider coverage and availability of cross-sectional PEFA data. It focuses on cross-country variation, and is based on two assumptions that are quite strong and that need to be kept in mind when interpreting the results. First, that the PEFA methodology is a good way to assess and measure the quality of PFM systems. While PEFA indicators have been designed to assess countries’ compliance with ‘good international practices’ (PEFA Secretariat, 2005: 5), there is evidence that ‘good public financial management means different things in different countries’ (Andrews, 2009: 7). Second, that a higher PEFA score today is a valid proxy for past reform success. Given the lack of sufficient time series data to assess changes over time, cross-country variation is assumed to depend mostly on the outcomes of recent PFM reform efforts, rather than on better initial conditions or other contextual factors. Multivariate regression techniques, designed to best fit the nature of the variables and the underlying model, are utilised to test the impact and significance of various factors on the quality of PFM systems across countries. For most of the explanatory factors, data refer to 2002-2006, to take into account possible lags in their effects and to address some of the limitations in the cross-country data. The second type of analysis (henceforth HIPC medium-N) relies on the much more limited data that track changes in the quality of PFM systems over time. A smaller dataset was collated using Heavily Indebted Poor Countries (HIPC)1 and PEFA assessments for 19 countries in Sub-Saharan Africa (see Appendix 2),2
1 The HIPC initiative promoted a series of Assessments and Action Plans (AAPs) meant to track changes in the quality of PFM systems and to identify necessary reforms for their improvement. For further details, see IDA/IMF (2003).
including countries where repeat PEFA assessments have been carried out, in order to build a panel dataset that covers the period from 2001 to the most recent PEFA assessment. Given that such a medium-N sample is too small for any econometric treatment, simpler analytical methods are utilised, highlighting country clusters and relevant and interesting patterns or configurations of factors
2 For details of the method used to compile the dataset, see de Renzio and Dorotinsky (2007).
2
associated with PFM reform success, and verifying and validating the findings from the PEFA large-N analysis. Combining these two different kinds of analysis is the best possible way of using available data to shed some light on the evaluation questions in ways that go beyond the country-specific (but much more detailed) evidence that the case studies can generate. At the same time, it should be stressed that the findings from this study are limited to broad correlations and identification of relevant patterns, rather than strong and specific causal linkages. Nevertheless, we believe the study makes an important contribution that not only advances quantitative work on this subject but also can nicely complement more in-depth qualitative case studies.
3
2. Literature review and previous findings3
In recent years, donor-supported PFM reform programmes have covered a range of initiatives aimed at strengthening the rules and procedures that underpin the budget process in aid-recipient countries. These have typically focused on a number of standard interventions, including improving the comprehensiveness of budget operations, building better links between annual allocations, medium-term policy objectives and performance indicators and computerising budget management and expenditure controls (World Bank, 2008; IMF, 2007). What has changed over time is the scale of resources invested and the number of actors involved. A recent World Bank evaluation of public sector reform (PSR) programmes (World Bank, 2008), which include support to budget reforms, shows that the number of World Bank-financed projects with a substantive PSR component quadrupled between the early 1990s and 2005. This was an increase from less than 10% to more than 20% of total projects.4
Data from the OECD-DAC’s database including all donors shows an even starker increase in committed funds for activities related to public sector financial management, which grew more than 10-fold, from $85.1 million in 1995 to $930.6 million in 2007. During the same period, the number of donor agencies involved in providing technical assistance in the PFM area rose to over 25 (IMF, 2007: 22).
Given such interest and investment, it is somewhat puzzling that so little evidence and analysis exist on the comparative performance of PFM systems across countries and over time, on the factors that underpin successful PFM reforms and on the role donor agencies can play in PFM reform processes in developing countries. One of the key reasons for this, inevitably, is lack of available comparative data. As is shown below, efforts to assess the quality of PFM systems using standardised methodologies started only about a decade ago, when HIPC assessments were launched. In recent years, however, the introduction of the PEFA methodology and the gradual expansion in its use has provided researchers with more and better data to start addressing the evaluation questions. There have been only two cross-country comparative analyses of PEFA assessment data so far, looking at the performance of PFM systems both across different areas of budget management and across countries. General analysis by de Renzio (2009a) of 57 PEFA assessments highlights how average indicator scores tend to deteriorate the further one moves through the budget cycle (from formulation to execution, reporting and scrutiny). Drawing on a dataset of disaggregated PEFA scores for 31 African countries, Andrews (2010) investigates patterns or ‘themes’ in performance across PFM process areas. He reorganises the 73 PEFA indicator dimensions into clusters against the budget cycle. His first finding is consistent with that of de Renzio (2009a) for a wider span of countries. Average PEFA scores decline in the progression from upstream budget formulation to downstream financial management and accountability processes. On average, formal budget preparation and legislative budget review score most strongly, with external audit and legislative audit analysis shown to be among the weakest processes. The implication is that budgets are ‘better made than they are executed.’ Other interesting findings come from further distinctions that Andrews (2010) makes among PEFA indicators. First, he distinguishes PFM reforms linked to legislation, processes and procedures (i.e. de jure reforms) from those linked to the implementation or establishment of new practices (i.e. de facto reforms), finding that average scores for de jure dimensions are consistently higher than for de facto ones. In other words, improvements in budget practices lag behind reforms in budget laws and processes. Second, he contrasts the performance of PFM process areas involving small groups of ‘concentrated’ actors with processes that engage broader sets of ‘de-concentrated’ actors. Out of the total 64 disaggregated ‘budget cycle’ dimensions (excluding therefore those linked to budget outcomes), 26 are limited to concentrated actors such as the budget department or debt management unit. The remaining 38 dimensions relate to actors such as line ministries or parliament. The evidence 3 Parts of this section draw on a recent review in Hedger and de Renzio (2010). 4 For Sub-Saharan Africa, the proportion reaches 37%.
4
shows that countries score higher against the first set of measures, suggesting that actor concentration is associated with better functioning of PFM systems. As far as cross-country comparisons are concerned, statistical analysis carried out by de Renzio (2009a) highlights some interesting cross-country patterns. For example, countries that are richer and more democratic have better-quality PFM systems, whereas countries in Sub-Saharan Africa and South Asia perform worse on average. However, these binary associations are not necessarily significant from a statistical point of view, as for each country the overall average PEFA score may be determined by a number of these factors and categories interacting contemporaneously. Analysed through multivariate regressions, in fact, the only variables associated with significant changes in PEFA scores are income level and aid dependency. Even these findings are ambiguous. It is not surprising that higher income levels are significantly associated with higher-quality PFM systems. But it is not clear that income level per se is the driver of better PFM performance, rather than other variables often highly correlated with income, such as education levels or share of government revenues that accrues to taxes rather than rents. The positive association with aid dependency, apart from the very small coefficient, may in fact reflect a reverse causality, whereby countries with better budget institutions receive more aid. In his analysis of PFM performance across 31 African countries, Andrews (2010) uses a slightly different set of explanatory variables: 1) level of income and income growth; 2) degree of country stability or fragility; 3) dependence on ‘rents’ as major revenue sources; 4) length of uninterrupted reform periods; and 5) type of administrative heritage. By organising the 31 countries into five separate PFM ‘performance leagues’ according to their average PEFA scores, Andrews investigates the influence of each contextual variable on PFM system strength. His findings reveal the following trends:
1. The economic growth rate has a stronger association with higher quality PFM than the absolute level of income. In fact, some low-income but relatively fast-growing African countries feature in the highest PFM performance league.
2. Country stability appears conducive to PFM progress. Fragile states – identified using an International Monetary Fund (IMF) classification – dominate the lowest league of PFM performance. These display particular weaknesses in strategic budgeting, budget transparency, budget execution and internal control.
3. ‘Rentier’ states (i.e. those that accrue most revenue from external sources, including natural resources, trade taxes and donor funding) tend to have weaker PFM systems compared with ‘fiscal states’ (i.e. those that collect a majority of their revenues from domestic citizens).
4. Countries with a poverty reduction strategy paper (PRSP)5
5. The evidence on administrative heritage is ambiguous, except for the downstream external accountability dimension, whereby Francophone countries tend to score lower against the PEFA indicators when compared with Anglophone ones.
for more than three years achieve higher PEFA scores in almost all PFM process areas. The existence of a PRSP is used as a proxy measure for broad reform commitment, as it may ‘lock in’ pro-developmental policy choices and reform programmes.
The two studies by Andrews and de Renzio are useful for shedding some initial light on the factors that may influence the quality of PFM systems across countries, but say little about the role and influence of donors and donor assistance. Therefore, we looked at the broader literature on aid effectiveness, in particular at cross-country studies assessing the impact of foreign aid on recipient country governance. Again, just a handful of papers look specifically at the effect of aid dependence and aid fragmentation on measures of the strength of institutions. Using different possible measures of state capacity, from indicators of bureaucratic quality to taxation efforts, Knack (2001) and Brautigam and Knack (2004) find that higher levels of aid dependence are indeed associated with declines in the quality of governance and in tax revenues as a share of gross domestic product (GDP):
5 A PRSP is a comprehensive development plan many African countries formulated to gain access to debt relief after 1997.
5
‘The way large amounts of aid are delivered can weaken institutions rather than build them. This can happen through the high transaction costs that accompany aid, the fragmentation that multiple donor projects and agendas promote, problems of “poaching,” obstruction of opportunities to learn, and the impact of aid on the budget process. Less directly, but just as important, high levels of aid can create incentives that make it more difficult to overcome the collective action problems involved in building a more capable and responsive state’ (Brautigam and Knack. 2004: 260-261).
These findings are supported by evidence in Moss et al. (2006), who emphasise how heavy reliance on external funding sources can generate an ‘aid institutions paradox’ whereby, as aid increases, the recipient government’s accountability relationship with its citizens is weakened. Further evidence and tests provided by Ear (2007) also confirm the negative impact of aid on governance, even if just the technical cooperation component of aid is considered. The impact of aid dependency on revenue generation is slightly more controversial. Cross-country analysis presented in Moss et al. (2006) and Remmer (2004) presents further evidence in support of the argument that ‘high levels of aid dependence have failed to create strong incentives for governments to marshal new resources or developmental aims: instead, aid has simultaneously fostered the growth of government spending and the reduction of revenue effort’ (Remmer, 2004: 88). On the other hand, some case study evidence shows that, under specific circumstances, aid flows are associated with a growth in domestic revenues (Fagernas and Roberts, 2004; Pack and Pack, 1990). Finally, Knack and Rahman (2007) argue that it is not just the level of aid dependence that causes institutional deterioration, but also the degree of fragmentation of donor interventions, determined by how many donors are present in a recipient country and by their share of the total aid the country receives. Most of the literature mentioned above uses an aggregate measure of aid dependence as the main independent variable, without recognising that foreign aid comes in many different forms and guise, which may have differential impacts on institutions. The only two more specific findings relate to technical cooperation and to aid fragmentation. In other words, it is important to keep in mind that the ‘quality’ of aid may be as important as its ‘quantity’ in determining its impact on governance and institutions in recipient countries. What about the more specific component of aid that this study aims to look at? At present, there are no comprehensive studies looking at the impact of donor support to PFM reforms on the quality of PFM systems. The only existing comprehensive evaluation of this kind of support is included in the World Bank evaluation mentioned above (Wescott, 2009; World Bank, 2008). The evaluation finds that ‘about two thirds of all countries that borrowed for financial management showed improvement in this area,’ with PFM being ‘the most consistent area of improvement in the case studies’ when compared with other aspects of PSR (World Bank, 2008: xv). More specifically, using Country Policy and Institutional Assessment (CPIA) data as a yardstick for improvements in the quality of budget institutions, the evaluation finds that 64% of countries that received any support for PFM reform programmes saw their CPIA PFM indicator score increase, compared with 32% for countries that did not receive such support (Wescott, 2009: 147). On the other hand, the evaluation also notes a number of problems with the way donors provide support to PFM reforms. For example, it notes how heavy donor involvement often leads to a situation whereby ‘expectations and objectives [of budget reforms] tend to be more ambitious and global, reflecting the donors’ list of things that need fixing rather than the government’s list of things it is ready to do’ (World Bank, 2008: 40). The insistence on ‘a full array of public reforms,’ the evaluation observes, means that ‘[World Bank] staff often lack the time and resources to develop a fully tailored product. So the result is likely to be one size fits all, off the shelf’ (2008: 41). In summary, the existing literature on the determinants of PFM quality across the developing world, the impact of foreign aid on governance and donor support to PFM reforms is quite scarce. Nevertheless, it provides a useful background and some interesting elements for our analysis and identifies a number of variables that need to be included in our models. In terms of general country characteristics, it offers preliminary evidence on the importance of, for example, levels of income and income growth, strength of democratic institutions, government revenue sources, political stability and administrative heritage in shaping the quality of PFM systems. When looking at the influence of foreign aid, it highlights the

6
role not only of overall aid dependency levels but also of aid fragmentation in affecting governance standards in aid-recipient countries. Important statistical issues linked to omitted variables and the possibility of reverse causation are also mentioned as issues to be considered in further research. Our study aims to build on these initial findings by taking advantage of larger datasets that are becoming available. The next section therefore turns to issues of definition and measurement.
7
3. Key variables and data collection The dataset compiled to carry out the analysis includes three sets of variables: 1) data on PFM systems (dependent variable); 2) data on donor support to PFM reforms (main independent variable); and 3) data on other independent and control variables. These are described in detail below.
3.1 Data on PFM systems Sources of information and cross-country data to reliably assess and compare the quality of PFM systems across countries and over time are very limited. For the large-N cross-country analysis, the two datasets we considered were the World Bank’s CPIA and the indicators developed by the PEFA Secretariat. CPIA indicator 13 is produced by the World Bank as part of an annual internal performance rating exercise. It measures ‘Quality of Budgetary and Financial Management’ along three dimensions: 1) comprehensive and credible budgeting linked to policy priorities; 2) effective financial management systems; and 3) timely and accurate accounting and fiscal reporting. The indicator ranks about 75 countries on a six-point scale (1-6). Despite its relevance and coverage, it suffers from two main drawbacks. First, its single numerical value provides very limited detail and information on PFM system performance. And second, there is anecdotal evidence of CPIA ratings being based on subjective judgement and affected by lending decisions, which introduces important measurement errors (see Arndt, 2008). We opted instead for the use of PEFA data. The PEFA Performance Measurement Framework for PFM (PEFA 2005) is the most comprehensive attempt thus far to construct a framework to assess the quality of budget systems and institutions. It comprises 28 indicators which assess institutional arrangements at all stages of the budget cycle, together with cross-cutting dimensions and indicators of budget credibility. It also includes three additional indicators on donor practices. The dataset we worked with included the results of national-level assessments for 107 countries and territories. Of these, 7 countries were subsequently excluded from our sample: Kosovo and the Palestinian Territories, because they are territories and not states, limiting the availability of other relevant data; Tuvalu, because an important amount of other necessary data was not available; Norway, because it is a clear outlier, being a high-income country; and Bangladesh, Gabon and Nicaragua, because the PEFA assessments had too many missing indicators. The overall sample therefore includes data for 100 countries.6
Two-thirds of the assessments were carried out between 2008 and 2009. Only 42 of the 100 assessment reports have been made publicly available; 24 are still considered to be at draft stage.
In order to transform PEFA scores into the dependent variable to be used in our large-N analysis, we followed a series of steps. First, we considered only indicators PI-5 to PI-28, as indicators PI-1 to PI-4 cover PFM system outcomes and performance and not the quality of PFM systems per se. Second, for multidimensional indicators, we used sub-indicator/dimension scores rather than summary indicator scores in order to fully exploit the information contained in the PEFA scores. This also allowed us to avoid the downward bias introduced by the M1 scoring methodology, whereby summary indicators are based on the lowest scoring dimension, or ‘weakest link.’ Third, we converted the letter scores included in PEFA reports into numerical scores, with higher scores denoting better performance (from A=4 to D=1). Fourth, and finally, we constructed our dependent variable in three different ways:
1. As an overall simple average of the 64 numerical scores that include all sub-indicators/ dimensions for indicators PI-5 to PI-28;
6 A full list is included in Appendix 1, alongside the year in which the assessment was carried out and the status of the report.
8
2. As averages of numerical scores for sub-indicators/dimensions in each of six clusters of indicators grouped by phase of the budget cycle.7
3. As individual scores for each of the 64 sub-indicators/dimensions in indicators PI-5 to PI-28. This generates a panel-type dataset of 64 dimensions*100 countries.
This generates six sub-indices that will be used separately as dependent variables;
It could be argued that these un-weighted averages are too simplistic an indicator to allow for cross-country comparisons. The PEFA Secretariat has also warned about a number of issues regarding aggregating PEFA scores and comparing them across countries (PEFA Secretariat, 2009). In order to check that values for the variable we constructed did not suffer from substantial biases, we used two procedures, one statistical and one substantive. For the statistical one, we imputed values for missing observations and applied Principal Component Analysis (PCA) to both the overall and the cluster averages. PCA is a statistical technique designed to detect the underlying structure of a number of related variables, and to reduce their number through the creation of a new variable (or variables) that reflect that structure.8
In our case, it generated an alternative ‘summary’ PEFA score based on the information included in the 64 underlying dimensions. The substantive procedure was based on the creation of a number of more parsimonious indices, taking into account only sub-indicators/ dimensions that donor assistance tends to focus on more directly, such as those linked to medium-term expenditure frameworks (MTEFs), budget classification, internal controls, etc. In both cases, the resulting variables were very highly correlated with the overall average scores (> 0.95). We believe that this provides sufficient evidence that the overall averages used in our analysis in fact capture relevant aspects of the quality of PFM systems and do not suffer from major biases. Finally, we think the sample size is large enough to reduce the risk of invalid comparisons.
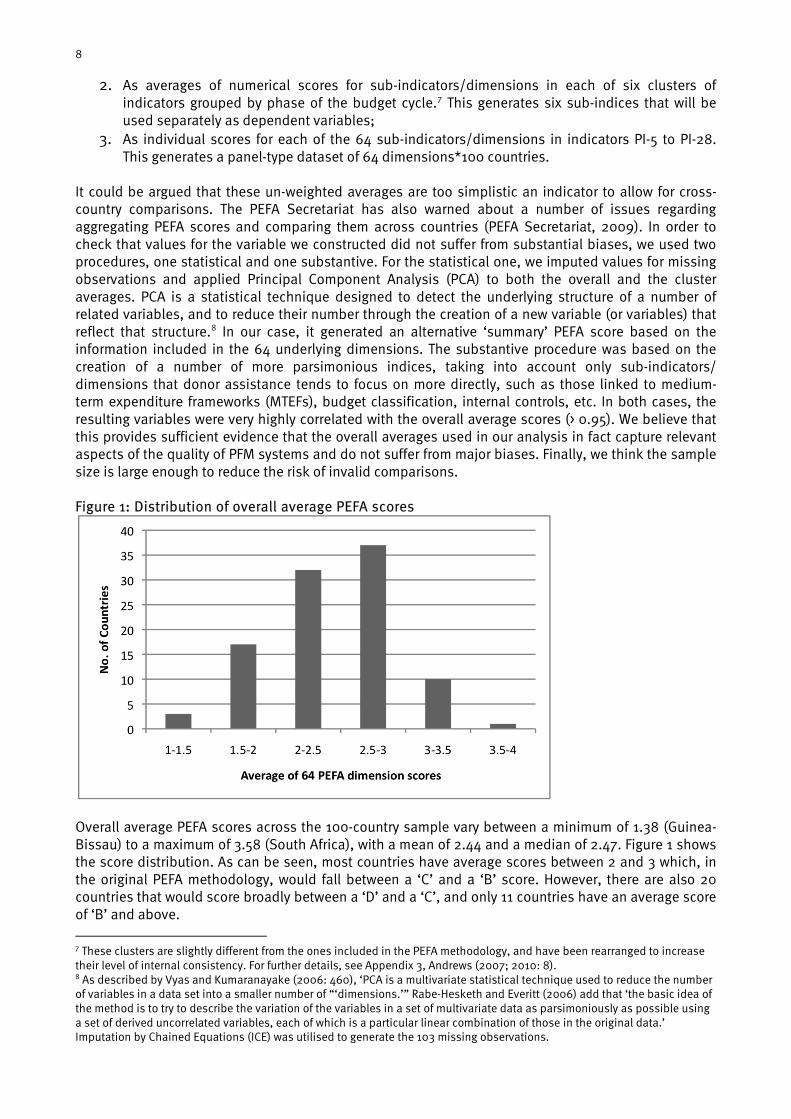
Figure 1: Distribution of overall average PEFA scores
Overall average PEFA scores across the 100-country sample vary between a minimum of 1.38 (Guinea-Bissau) to a maximum of 3.58 (South Africa), with a mean of 2.44 and a median of 2.47. Figure 1 shows the score distribution. As can be seen, most countries have average scores between 2 and 3 which, in the original PEFA methodology, would fall between a ‘C’ and a ‘B’ score. However, there are also 20 countries that would score broadly between a ‘D’ and a ‘C’, and only 11 countries have an average score of ‘B’ and above.
7 These clusters are slightly different from the ones included in the PEFA methodology, and have been rearranged to increase their level of internal consistency. For further details, see Appendix 3, Andrews (2007; 2010: 8). 8 As described by Vyas and Kumaranayake (2006: 460), ‘PCA is a multivariate statistical technique used to reduce the number of variables in a data set into a smaller number of “‘dimensions.’” Rabe-Hesketh and Everitt (2006) add that ‘the basic idea of the method is to try to describe the variation of the variables in a set of multivariate data as parsimoniously as possible using a set of derived uncorrelated variables, each of which is a particular linear combination of those in the original data.’ Imputation by Chained Equations (ICE) was utilised to generate the 103 missing observations.
9
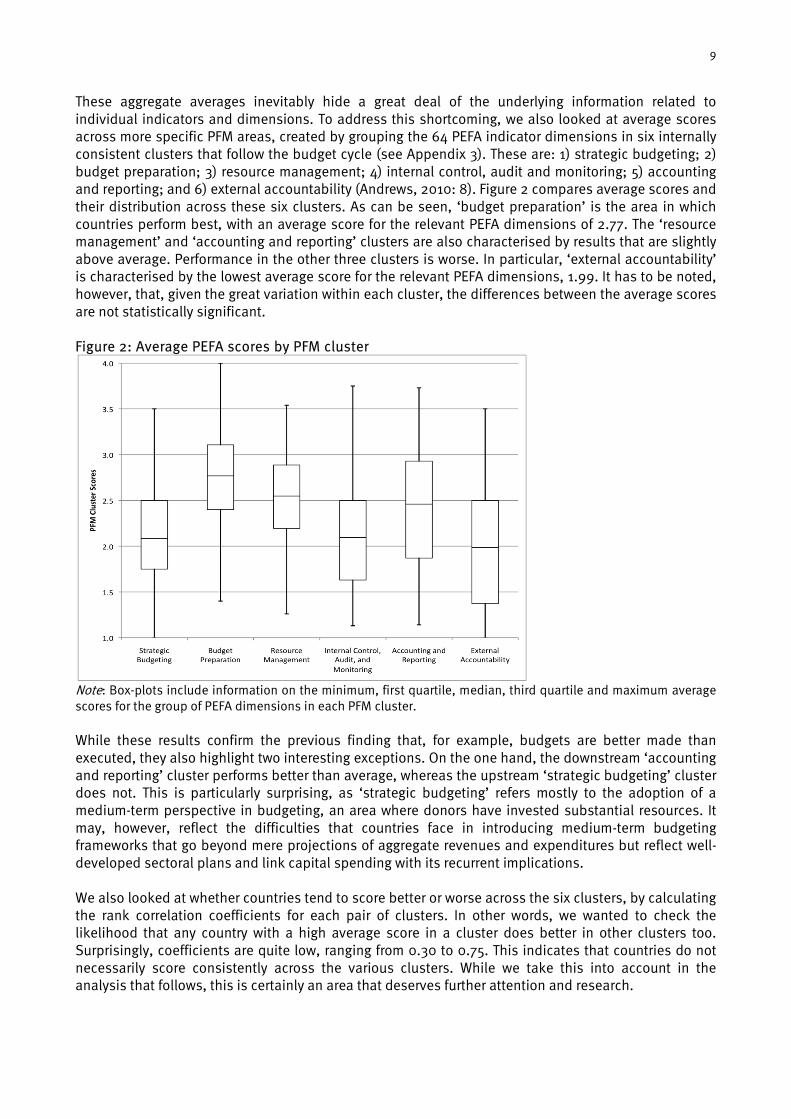
These aggregate averages inevitably hide a great deal of the underlying information related to individual indicators and dimensions. To address this shortcoming, we also looked at average scores across more specific PFM areas, created by grouping the 64 PEFA indicator dimensions in six internally consistent clusters that follow the budget cycle (see Appendix 3). These are: 1) strategic budgeting; 2) budget preparation; 3) resource management; 4) internal control, audit and monitoring; 5) accounting and reporting; and 6) external accountability (Andrews, 2010: 8). Figure 2 compares average scores and their distribution across these six clusters. As can be seen, ‘budget preparation’ is the area in which countries perform best, with an average score for the relevant PEFA dimensions of 2.77. The ‘resource management’ and ‘accounting and reporting’ clusters are also characterised by results that are slightly above average. Performance in the other three clusters is worse. In particular, ‘external accountability’ is characterised by the lowest average score for the relevant PEFA dimensions, 1.99. It has to be noted, however, that, given the great variation within each cluster, the differences between the average scores are not statistically significant. Figure 2: Average PEFA scores by PFM cluster
Note: Box-plots include information on the minimum, first quartile, median, third quartile and maximum average scores for the group of PEFA dimensions in each PFM cluster. While these results confirm the previous finding that, for example, budgets are better made than executed, they also highlight two interesting exceptions. On the one hand, the downstream ‘accounting and reporting’ cluster performs better than average, whereas the upstream ‘strategic budgeting’ cluster does not. This is particularly surprising, as ‘strategic budgeting’ refers mostly to the adoption of a medium-term perspective in budgeting, an area where donors have invested substantial resources. It may, however, reflect the difficulties that countries face in introducing medium-term budgeting frameworks that go beyond mere projections of aggregate revenues and expenditures but reflect well-developed sectoral plans and link capital spending with its recurrent implications. We also looked at whether countries tend to score better or worse across the six clusters, by calculating the rank correlation coefficients for each pair of clusters. In other words, we wanted to check the likelihood that any country with a high average score in a cluster does better in other clusters too. Surprisingly, coefficients are quite low, ranging from 0.30 to 0.75. This indicates that countries do not necessarily score consistently across the various clusters. While we take this into account in the analysis that follows, this is certainly an area that deserves further attention and research.
10
Finally, we checked to see whether missing observations could be the source of any important biases. As indicated above, we excluded from the analysis three countries for which there were too many missing observations. While about half of the countries in our sample have some PEFA dimension that was not scored, in the great majority of cases this is limited to fewer than 5 of the 64 PEFA dimensions we considered. Only 2 countries have more than 10 missing observations (Macedonia and Gambia). About half of the missing observations are because PEFA assessments had a more limited scope and did not cover the full set of indicators; less than a third are because there was a lack of sufficient information to justify a specific rating. As far as specific indicators are concerned, the two indicators with the most missing observations (more than 15) are indicator PI-8 on transfers to sub-national governments and indicator PI-15 on tax collection. Otherwise, missing observations are quite evenly spread across the full range of indicators. Furthermore, countries with a higher number of missing observations are not significantly different from the rest of the sample in terms of their levels of income, region or any other relevant characteristic. In summary, we do not think that, after excluding countries with very incomplete assessments, missing observations constitute a serious measurement problem that could undermine the analysis that will follow. For the second part of our analysis, focused on a medium-N sample of African HIPC countries, our aim was to address one of the main weaknesses of the PEFA dataset. While more than 150 assessments have been carried out since 2005, these provide only a snapshot of PFM system performance across countries.9 Interestingly, however, PEFA indicators can be mapped at least partially onto existing previous assessments, helping to extend their time series to more recent years. For the medium-N analysis, therefore, we combined PEFA data with data resulting from another methodology for assessing the quality of PFM systems, developed jointly by the IMF and the World Bank to test the systems in countries qualifying for debt relief under the HIPC Initiative. These HIPC Assessments were carried out in 2001 and 2004 in 23 countries10 and scored country systems against benchmarks for 15 indicators covering all stages of the budget cycle.11 Despite the limitations of this methodology,12 it constitutes the only codified ‘historical’ evidence that allows for a consistent tracking of the quality of PFM systems over time. On this basis, we compiled a small panel dataset that tracks changes in 11 indicators of PFM quality for 19 countries in Sub-Saharan Africa, many of which have also had two PEFA assessments (see Table 1). The dataset covers the period from 2001 to the most recent PEFA for each country, and groups indicators in three clusters: 1) transparency and comprehensiveness (INFO); 2) linking budgets, policies and plans (POL); and 3) control, oversight and accountability (CTRL).13
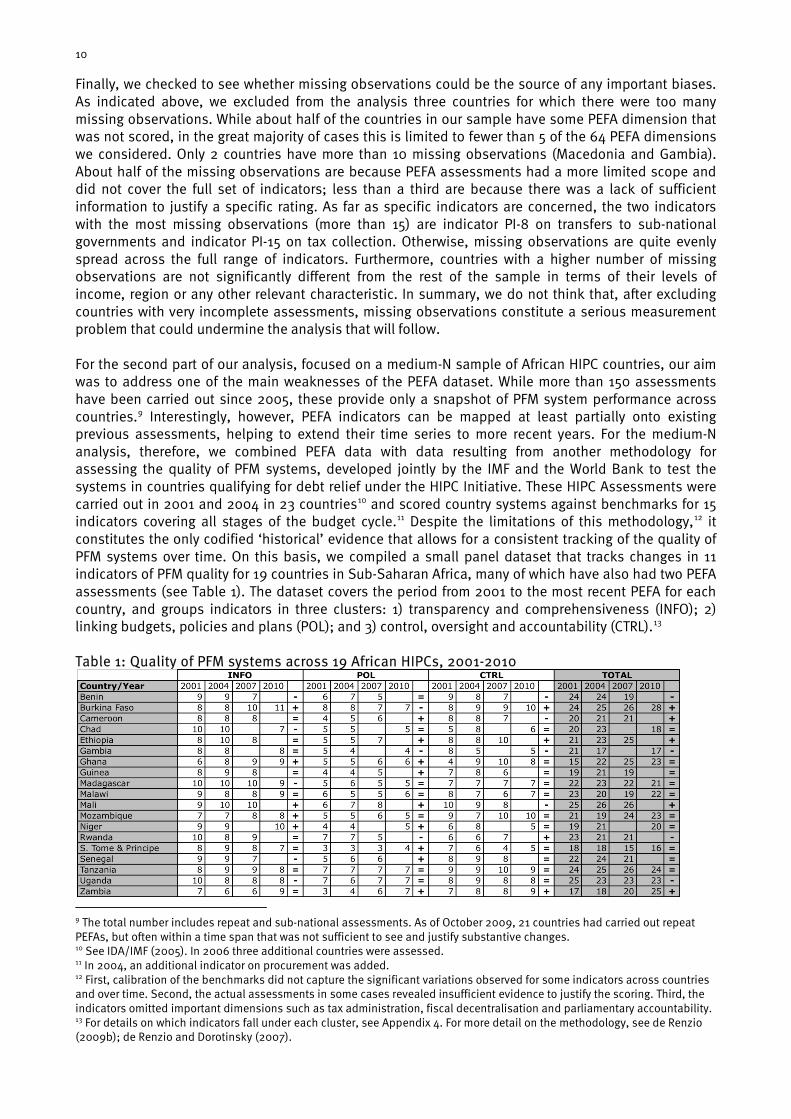
Table 1: Quality of PFM systems across 19 African HIPCs, 2001-2010
9 The total number includes repeat and sub-national assessments. As of October 2009, 21 countries had carried out repeat PEFAs, but often within a time span that was not sufficient to see and justify substantive changes. 10 See IDA/IMF (2005). In 2006 three additional countries were assessed. 11 In 2004, an additional indicator on procurement was added. 12 First, calibration of the benchmarks did not capture the significant variations observed for some indicators across countries and over time. Second, the actual assessments in some cases revealed insufficient evidence to justify the scoring. Third, the indicators omitted important dimensions such as tax administration, fiscal decentralisation and parliamentary accountability. 13 For details on which indicators fall under each cluster, see Appendix 4. For more detail on the methodology, see de Renzio (2009b); de Renzio and Dorotinsky (2007).
11
Note: Numerical scores are based on methodology described in de Renzio and Dorotinsky (2007). ‘2007’ denotes PEFA assessments carried out in 2005-2007. ‘2010’ denotes PEFA assessments carried out in 2008-2010. Source: IDA/IMF (2005) and PEFA assessments. Based on authors’ calculations. What the results show is that only 5 of the 19 countries (Burkina Faso, Cameroon, Ethiopia, Mali and Zambia) for which historical data are available saw an uncontroversial improvement in the quality of their PFM systems as measured by the subset of HIPC indicators. Four countries saw their PFM quality deteriorate (Benin, Gambia, Rwanda and Uganda). For the other 10 countries, it is more difficult to detect a clear trend. Ghana, for example, recorded impressive improvements between 2001 and 2007, to then suffer a slight worsening of its overall score in 2010. Mozambique’s overall score improved over the whole period, but has seen some considerable fluctuations. Tanzania has performed consistently among the best in the 19-country sample, but has seen a slide recently. In terms of performance across the three different clusters, most improvements happened in linking budgets, policies and plans, where nine countries increased their score. The area where the least progress was made was control, oversight and accountability. The correlation with the overall PEFA averages used for the large-N sample is quite high (0.76), which ensures broad consistency between the two scoring methods. At the same time, there are some considerable differences. For example, overall PEFA scores for Rwanda, Malawi and Mozambique are considerably higher using the 64 dimensions average than the subset of indicators that can be mapped back onto the previous HIPC assessments. These results therefore need to be taken with some caution, probably as describing broad (albeit somewhat incomplete) trends rather than specific changes in the quality of PFM systems.
3.2 Data on donor support to PFM reforms Detailed and reliable data on donor support to PFM reforms are also difficult to find. The OECD-DAC Creditor Reporting System (CRS) database, the main global source of data on detailed aid flows, includes a sub-sector purpose code for ‘public sector financial management’ (15120). This includes information on donor commitments and disbursements for aid activities in support of PFM reforms, going back to 1995 for commitments but only to 2002 for disbursements. Despite its apparent relevance as a source for data on donor support to PFM reforms, the quality, reliability and comprehensiveness of CRS data are highly questionable. Analysis of the underlying ‘micro data’ (i.e. the specific entries submitted by donor agencies) reveals not only that a number of activities included should not be classified as support to PFM reforms, but also that many activities that should be included under this classification are omitted. In other cases, the available details do not allow for verification of the relevance of the aid activity for PFM reforms. This is especially true for multilateral agencies, such as the European Commission (EC) or the World Bank, which are not full DAC members and therefore have more limited reporting obligations. These limitations constituted a serious challenge in the study. A substantive effort was therefore put into first-hand collection of donor data. To facilitate the task, we targeted a subset of 13 donor agencies that are particularly active in the field of PFM reforms. These included the members of the Management Group (Sida, Danida, DFID and AfDB), plus the Dutch, Norwegian and French aid agencies, the EC, the World Bank, the IMF, the US Agency for International Development (USAID) and the Asian and Inter-American Development Banks (ADB and IADB). While this sample does not ensure full coverage of data on donor support for PFM reforms, we believe it provides a good picture and a suitable proxy for the amount of support provided to PFM reforms.14
Each agency was sent a data request form (Appendix 5) and asked to provide information about actual disbursements for technical assistance and other activities related to PFM reform support over the period 1995-2008. While limited information was requested for the 100 countries in the PEFA large-N 14 In fact, these donor agencies collectively provide more than 90% of total donor commitments for ‘public sector financial management’ as recorded in the CRS database for the period 1995-2008.

12
sample, we asked for more detailed data for the medium-N sample of countries included in the HIPC/PEFA panel dataset (such as PFM focus area, main inputs provided, etc.). Of the 13 agencies contacted, 10 replied, with varying degrees of completeness.15 Unfortunately, no agency provided the more detailed information requested for the HIPC medium-N sample, which inevitably limited the depth of our analysis. For the three missing agencies,16
we looked at information available on public websites or went through the micro data in their entries in the CRS database, selecting only the activities that could be identified as related directly to PFM reforms.
In a number of cases, we had to make some judgement calls. Some agencies, for example (such as the World Bank, AfDB and Danida), classify general budget support operations as PFM interventions. This greatly distorted the data, as we were looking for a measure of direct support to PFM reforms. Budget support, while it can strengthen PFM systems indirectly, is aimed mainly at financing general government operations. We therefore decided either to exclude these operations or to include only the share that was indicated as directly associated with PFM reform initiatives, where this information was available. In other dubious cases, we simply trusted the data provided by donor agencies. The yearly average of donor disbursements in each country was then included in our dataset as the main independent variable, based on the hypothesis that higher amounts of technical assistance should be associated with better quality PFM systems.17 There are a number of issues with this approach. For example, data may be driven by large projects, such as the introduction of Integrated Financial Management Information Systems (IFMISs), which require substantial hardware investments, at the expense of ‘softer’ interventions that might affect PFM quality at a lower cost, as in the case of MTEFs. Given the greatly improved availability of disbursement data from 2002 on, we used mostly the sum of PFM-related disbursements over the period 2002-2006. While this makes sense in a number of ways, it also introduces a further potential source of bias in our data. On the one hand, focusing on recent donor PFM support means we are more likely to capture more direct effects on aspects of the PFM system that are part of the same consensus that is behind the construction of the PEFA methodology.18
On the other hand, our data do not include enough information on earlier donor PFM support, when the foundations for PFM reforms were laid in some countries included in our sample.
Figure 3: Total donor PFM support, 1995-2008
15 Data for Danida and French aid were in the end excluded as information was not sufficient. 16 EC, USAID and ADB. 17 This goes against some of the more general findings in the literature about the negative effects of overall aid dependency, based on the assumption that technical assistance targeted at specific reforms does not suffer from the same drawbacks. 18 Unfortunately, this may also generate a statistical problem of endogeneity. However, 2002-2006 is the period preceding the time when most PEFA assessments were carried out, allowing us to address at least partly the issue of reverse causation (more on this below).

13
According to the data we collected, overall donor funding for PFM-related activities increased from around $60 million in 1995 to more than $400 million in 2008 (Figure 3). The largest recipients of technical assistance in support of PFM reforms between 2002 and 2006 were Afghanistan ($33.2 million per year) and Morocco ($25.1 million per year). In Afghanistan’s case, the bulk of the funding came from ADB, the World Bank and DFID, to a diverse set of PFM-related activities. In Morocco, PFM support is linked mostly to a series of World Bank loans for public administration reform, aimed at improving the effectiveness of public resource management. Other countries that received more than $15 million per year over the same period are Indonesia, Tanzania and Mozambique. At the other end of the scale, the group of countries that received the smallest amounts (i.e. less than $10,000 per year) in donor support to PFM reforms over the same period include mostly small island states (St. Lucia, St. Kitts and Nevis, Kiribati and the Seychelles) and Belize.19
The World Bank and DFID were the two donors, among those surveyed, that provided the largest total amounts in support of PFM reforms.
Interestingly, the correlation between our data on donor PFM support and data taken from the CRS database is a low 0.23. Given the effort that went into ensuring the reliability of the data we collected, we think this is probably a reflection of the poorer quality of CRS data, something which should be taken into account in further analyses and which highlights the need for donor agencies to increase the comprehensiveness and reliability of their CRS reporting. Apart from direct support to PFM reforms, some additional variables were included in the dataset to capture other aspects of donors’ impact on PFM systems in recipient countries. These are:
1. A variable capturing the share of total aid being channelled through programme aid modalities (general budget support and sector programmes) calculated from CRS data, with the hypothesis that higher shares of programme aid are positively correlated with the quality of PFM systems;
2. A variable looking at the length of donor engagement on PFM issues in each country, measured as the number of years passed since the first World Bank project in support of PFM reforms. The underlying hypothesis in this case is that longer engagement should be associated with better quality of PFM systems;
3. Dummy variables for the presence of an IMF programme and a World Bank poverty reduction support credit (PRSC), in order to capture the presence of PFM-related conditionalities, hypothesising a positive impact of PFM-related conditionalities on the quality of PFM systems;
4. An index of overall aid fragmentation calculated from DAC data, with the hypothesis that higher fragmentation impacts negatively on the quality of PFM systems.20
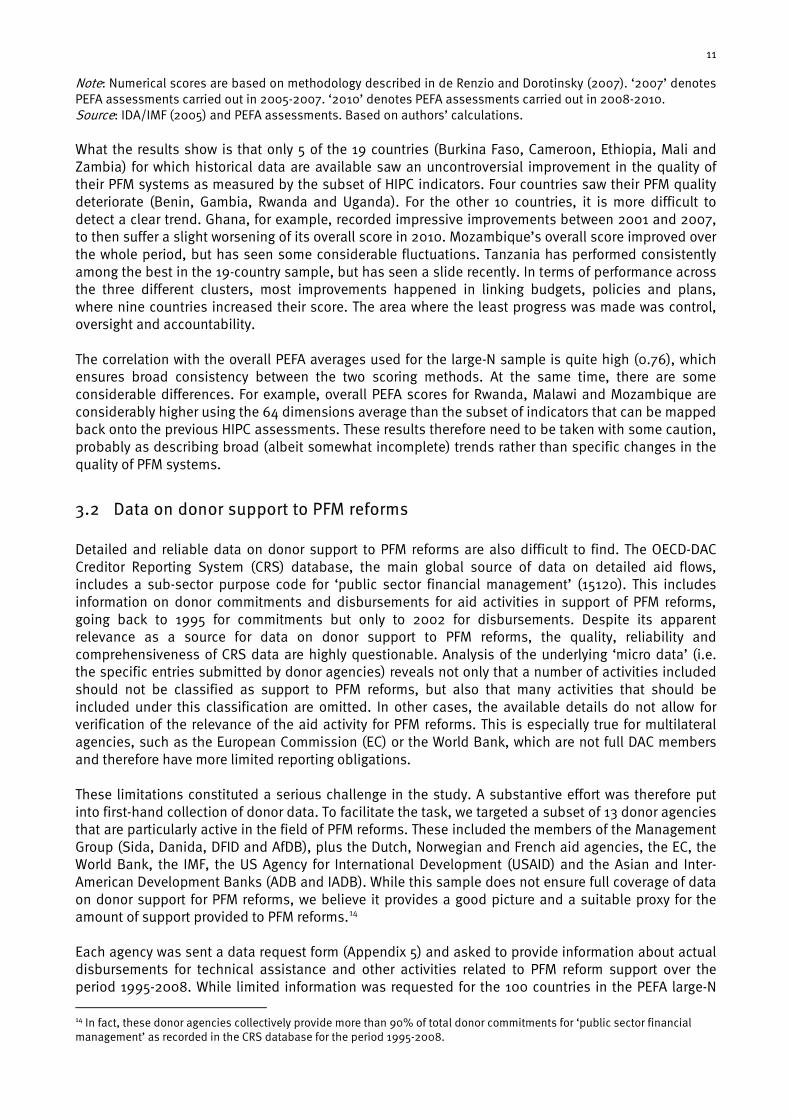
3.3 Other variables Apart from the two main variables of interest – ‘quality of PFM systems’ (dependent variable) and ‘donor support for PFM reforms’ (independent variable) – a number of other independent variables were included in the analysis. They represent other factors that can be hypothesised as having an influence on the level and change of the dependent variable, including those that the previous empirical analyses summarised above also identified as relevant factors. For ease of reference, Table 2 summarises these variables, distinguishing between economic/social and political/institutional variables and specifying the hypothesised impact on the quality of PFM systems.
19 It could be argued that per capita figures, or more generally figures adjusted for country size, provide a better indication of donor PFM investments. We nevertheless think it makes more sense to focus on overall figures at this point, and to control for country size in the analysis. 20 See Knack and Rahman (2007), both to see how the index is calculated and for the main arguments behind the hypothesis.
14
Table 2: Other independent variables included in the PEFA large-N analysis Variable Effect* Detailed hypothesis/References Economic/social variables GDP per capita + Richer countries have better government capacity and a better-educated population
which will hold government accountable for how it manages public finances. See de Renzio (2009a)
Recent GDP growth + Economic performance and increasing resources allow for increasing fiscal and reform space necessary for PFM reforms. See Andrews (2010)
Aid dependency - Aid dependency worsens governance standards and distorts incentives for reform. See Brautigam and Knack (2004); Knack (2002)
Resource dependency
- The ‘resource curse’ means that dependence on natural resource revenues undermines PFM and other governance reform prospects. See Andrews (2010); de Renzio et al. (2009)
Population ? There could be economies of scale in investing in PFM systems in larger countries; otherwise, public finances might be easier to manage in smaller countries. See de Renzio (2009a)
Adult literacy + In countries with a better educated population, government will have better capacity and citizens will hold government accountable. See Kaufmann et al. (1999)21
Trade openness
+ Open economies need to be better managed, and are more exposed to external pressure for better economic management. See Busse et al. (2007); Treisman (2000)
Technological diffusion
+ Electric power consumption, telephone subscriptions and use of personal computers and the internet all make it easier for governments to adopt PFM reforms and for citizens to hold government accountable. See Kakabadse et al. (2003)
Political/institutional variables Administrative heritage
? Inherited budget systems affect present-day PFM quality. See Andrews (2010); La Porta et al. (1999)
Democracy + In democratic regimes, citizens will hold government accountable and demand better management of public resources. See Rivera-Batiz (2002); Wehner and de Renzio (2010)
State fragility/conflict
- Countries in fragile or in conflict/post-conflict situations have more difficulties in carrying out PFM reforms. Capacity is very weak, informality is predominant and political will is lacking. See Andrews (2010)
Regional dummies ? Regional dummies capture other country characteristics, such as geography and culture, which may affect PFM reforms.
Note: * Expected sign of the regression coefficient. Question marks denote cases where this is not clear, or where the variable is categorical. While measuring most of the variables included in Table 2 is not problematic, for ‘democracy’ and ‘state fragility’ measurement is less straightforward. A number of alternative measures of democracy exist, and debate around their usefulness is very much alive.22 We settled for one of the most commonly utilised measures, that of Freedom House, but also checked whether our results changed when other indicators were used instead. For state fragility, we decided to use a dummy variable recording the presence of UN peacekeepers in the country since 1995, therefore equating state fragility with a conflict or post-conflict situation.23
Appendix 6 reports further details on measures utilised and summary statistics for all variables. We were unable to include in our analysis a number of other potentially relevant variables, related, for example, to levels of corruption and government tax effort. This was because data sources (e.g. the International Country Risk Group) did not cover a sufficient number of countries.
21 Kaufmann et al. (1999) note the correlation between adult literacy and governance, but argue that the causal link goes from the latter to the former. 22 See, for example, Cheibub et al. (2010); Munck (2009). 23 Other definitions of fragility, such as those used by the World Bank or in the State Fragility Index produced by the Polity IV Project, are in our view too broad to capture the key elements of fragility in which we are interested.
15
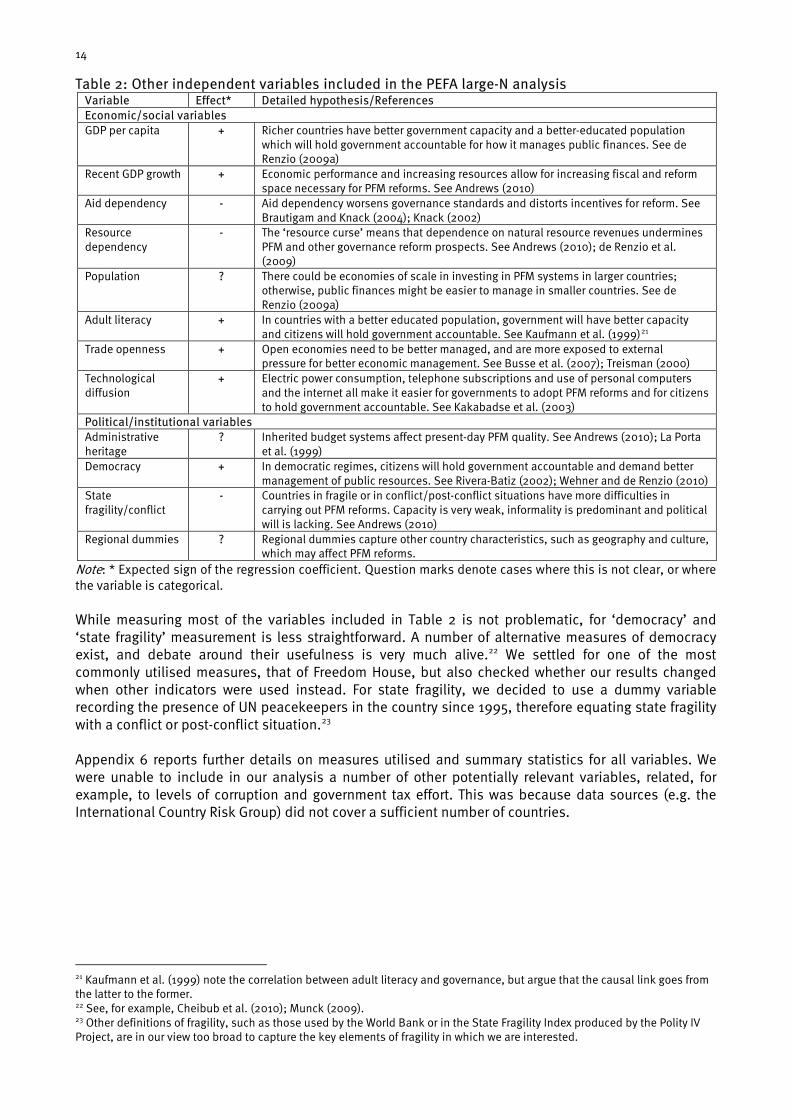
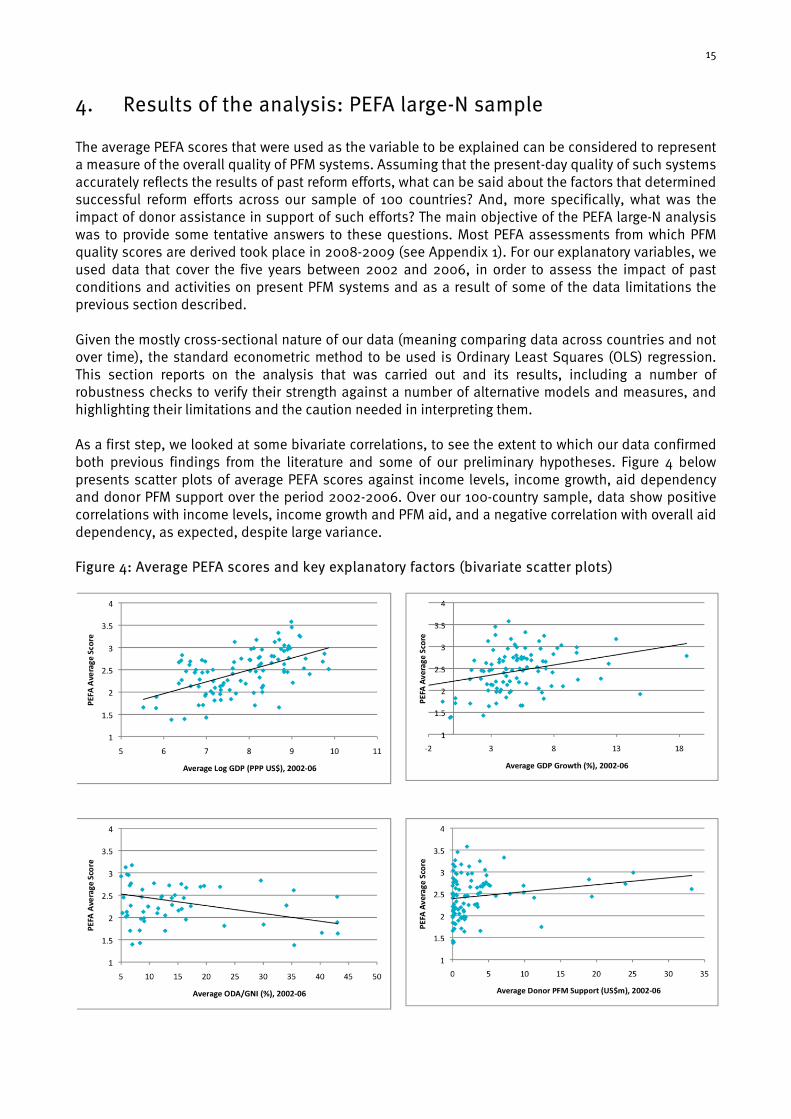
4. Results of the analysis: PEFA large-N sample The average PEFA scores that were used as the variable to be explained can be considered to represent a measure of the overall quality of PFM systems. Assuming that the present-day quality of such systems accurately reflects the results of past reform efforts, what can be said about the factors that determined successful reform efforts across our sample of 100 countries? And, more specifically, what was the impact of donor assistance in support of such efforts? The main objective of the PEFA large-N analysis was to provide some tentative answers to these questions. Most PEFA assessments from which PFM quality scores are derived took place in 2008-2009 (see Appendix 1). For our explanatory variables, we used data that cover the five years between 2002 and 2006, in order to assess the impact of past conditions and activities on present PFM systems and as a result of some of the data limitations the previous section described. Given the mostly cross-sectional nature of our data (meaning comparing data across countries and not over time), the standard econometric method to be used is Ordinary Least Squares (OLS) regression. This section reports on the analysis that was carried out and its results, including a number of robustness checks to verify their strength against a number of alternative models and measures, and highlighting their limitations and the caution needed in interpreting them. As a first step, we looked at some bivariate correlations, to see the extent to which our data confirmed both previous findings from the literature and some of our preliminary hypotheses. Figure 4 below presents scatter plots of average PEFA scores against income levels, income growth, aid dependency and donor PFM support over the period 2002-2006. Over our 100-country sample, data show positive correlations with income levels, income growth and PFM aid, and a negative correlation with overall aid dependency, as expected, despite large variance. Figure 4: Average PEFA scores and key explanatory factors (bivariate scatter plots)

16
We then turned our attention to multivariate analysis, to understand how these and other variables identified jointly affected PFM quality. We first ran a series of exploratory regressions using sub-groups of variables to establish which economic, political and aid-related variables were significantly associated with changes in the quality of PFM systems and should be kept in subsequent stages of the analysis. Table 3 shows the results. Table 3: Preliminary regressions by groups of variables
Dependent variable PEFA average score
Economic/social variables
Political/institutional variables
Aid-related variables
GDP per capita (log) 0.32*** Recent GDP growth 0.04*** Population (log) 0.08** Resource dependency - 0.37*** Adult literacy 0.001 Trade openness - 0.002** Technological diffusion Electricity
Computers 0.00 0.00
Observations 94 R-squared 0.57 Administrative heritage British colony
French colony -0.15
- 0.26*
Democracy -0.04 State fragility - 0.38*** Regional dummies SSA
LAC ECA
- 0.07 0.09
0.31**
Observations 100 R-squared 0.33 Aid dependency - 0.02*** PFM support 0.24*** Aid fragmentation 0.17 GBS as % of total ODA 0.24 IMF programme 0.02 World Bank PRSC 0.14 Length of donor engagement
-0.003
Observations 97 R-squared 0.25
Note: OLS regressions. Only coefficients are reported. * Significant at 10%; ** significant at 5%; *** significant at 1%. Among technological diffusion variables, we dropped telephone subscriptions and internet users, as they were highly correlated with the others. GBS = general budget support; ODA = official development assistance. Economic and social variables are the ones that explain a larger part of the variation in the quality of PFM systems (shown by a higher R-squared value of 0.57), and most of their coefficients have the expected sign. Higher levels of GDP per capita and of recent economic growth are associated positively and significantly with better PFM systems, as is size of the country’s population, whereas natural resource revenue dependency and trade openness have negative coefficients. While this result confirms the standard ‘resource curse’ hypothesis, linking resource-dependent countries with worse governance standards, the sign for the trade openness variable is not in the expected direction. At this preliminary stage, however, it is not worth advancing further explanations, as results might be driven by omitted variables. Among political and institutional variables, those with a significant coefficient (apart from the Eastern European regional dummy) are the dummies for former French colonies and for conflict-affected states, both with negative coefficients that confirm the findings of previous research. The level of democracy also comes close to standard significance levels, also with the expected sign.24
24 The negative sign is because Freedom House classifies stronger democracies with lower values of the variable.
Aid-related variables, in this preliminary phase of the analysis, explain only a quarter of the differences in the quality of PFM systems (R-squared=0.25). Results highlight the negative and significant association between overall level of aid dependency and PFM quality and, interestingly, a positive and

17
significant one of donor PFM support. Another variable that comes very close to standard levels of statistical significance, namely, the presence of a PRSC, also has the expected positive coefficient. In the following step, we built the main model to be used for our analysis by bringing together the variables that were shown to be significant in the exploratory regressions, plus a few others of specific importance, such as some of the key aid variables, regional dummies (to control for various regional characteristics) and the level of democracy, covering the period 2002-2006. Table 4 shows the results, first using standard OLS regression, but also using Weighted Least Squares (WLS) to address issues of heteroskedasticity, which persisted even when we used the robust standard errors option. Some of the key results from the preliminary regressions also hold in the comprehensive model. Once again, higher levels of income, income growth and population are associated significantly with better quality PFM systems. Countries that are richer and larger and have had a good economic growth record in recent years are also more successful at reforming and improving their PFM systems. More specifically, countries with double the income per capita can be expected to have an average PEFA score almost half a point higher, holding other factors constant. Similarly, countries that are poorer and have worse recent performance in terms of economic growth will also be characterised by PFM systems of lower quality. Donor support to PFM reforms retains a positive (although slightly less significant) coefficient. However, its low value indicates that very large injections of technical assistance would be coupled with only a small increase in PEFA average scores. According to the analysis, an additional $40-50 million per year in PFM assistance (that is, more than doubling the amount received by the country that has received the most in recent years, Afghanistan) would be associated with just a half-point change in the overall PEFA average score, holding other factors constant. Finally, the presence of peacekeepers as a proxy for state fragility maintains its significant negative association with PFM quality, highlighting the importance of political stability for PFM improvements. Table 4: Determinants of the quality of PFM systems
Dependent variable PEFA average score
OLS WLS
GDP per capita (log) 0.44*** 0.45*** Recent GDP growth 0.02** 0.02* Population (log) 0.08** 0.08*** Resource dependency - 0.19 -0.19 Trade openness - 0.001 -0.001 French colony - 0.09 -0.09 Democracy - 0.02 -0.01 State fragility -0.22** -0.21* Aid dependency - 0.01 0.01 PFM support 0.01** 0.01* GBS as % of total ODA 0.76 0.71 Length of donor engagement 0.01 0.01 SSA dummy 0.11 0.10 LAC dummy 0.02 0.009 ECA dummy 0.17 0.15 Observations 93 93 R-squared 0.68 0.68
Note: Only coefficients are reported. * Significant at 10%; ** significant at 5%; *** significant at 1%. SSA = Sub-Saharan Africa; LAC = Latin America and Caribbean; ECA = Europe and Central Asia. These initial results shed some light on the factors that drive differences in cross-country PFM performance. For the purposes of the overall evaluation, the positive and significant relationship with PFM-related technical assistance is particularly encouraging, though it clearly cannot be interpreted as a causal. It could merely reflect the fact that donors tend to provide more PFM-related assistance to countries that have already achieved a certain success in improving the quality of their PFM systems. The issue of endogeneity also needs to be taken into account in interpreting the relationship between income levels and PFM quality. We come back to this problem below.
18
In order to better understand the nature of the possible impact of donor PFM support on average PEFA scores, we introduced some interaction terms in the basic model. These were aimed at testing whether donor PFM support was in some way linked to the presence of higher levels of programme aid or of conditionalities linked to IMF or World Bank programmes. None of these interaction terms reached conventional significance levels, however. We then used the same model to explain variation not in the overall PEFA average score, but in each one of the six PFM cluster scores linked to the different phases of the budget cycle. While there are inevitably differences in the results (some of which are more difficult to interpret), the overall trends did not change dramatically. Some results are worth highlighting: 1) donor PFM support retains a positive and significant association with average PEFA scores in most of the six PFM clusters; 2) coefficients for income levels and growth maintain their positive sign and significance in most clusters, except for ‘strategic budgeting’; 3) in ‘strategic budgeting’, GBS as a share of total aid becomes significant, possibly indicating that successful medium-term budget projections are more successful in countries where donors channel more of their aid through government channels25; and 4) ‘external accountability’ scores in former French colonies and in Latin American countries (which are all former Spanish or Portuguese colonies) are significantly lower.26
A series of robustness checks were then carried out to address a number of issues related to the data and nature of our variables, and to check for consistency with the results obtained in our main model. First, we looked at the possibility of measurement errors biasing our results by repeating the analysis using alternative measures for a number of our variables, such as democracy, state fragility and use of aid modalities. For democracy, we used both Freedom House and Polity IV as sources of data to assess whether strength of democratic institutions had any effect on PFM quality. Similarly, we looked at different existing indices of state fragility, and expanded our definition of programme aid to include both GBS and sector programmes. In all cases, our results were not affected. Interestingly, however, when we substituted the PFM support variable we constructed from donor data with similar data from the CRS database, the statistical significance of the coefficient vanished. This is not surprising, given the low correlation between the two variables reported above. We interpret this as a further confirmation of the worse quality of the information contained in the CRS database. Second, we ran an identical set of regressions using data for our explanatory variables averaged over the period 2004-2008 rather than 2002-2006, to test whether our results were dependent on the time period considered. Again, the overall story holds, with the additional finding that, over this more recent period, the share of GBS in total aid flows is also significantly and positively associated with quality of PFM systems. Rather than provide evidence in support of the positive impact of budget support, however, this might more simply reflect the increasing importance of GBS as an aid modality in recent years, and the fact that donor agencies reward countries with better PFM systems by shifting more of their aid to directly support the government budget. Third, the conversion of PEFA scores from letter to numerical scores and their subsequent averaging means we treated a variable that is ordinal in nature as if it were a continuous variable. Using OLS with an ordinal dependent variable is known to lead to biased results. One of the statistical techniques that correct for this problem is ordered logit regression. For this purpose, we used individual PEFA dimension scores, rather than averages, as our dependent variable (as in Andrews 2010). This allowed us also to assess whether countries scored higher on de jure rather than de facto, upstream rather than downstream and concentrated rather than de-concentrated PFM processes, testing the findings reported in Andrews (2010) for a larger sample of countries. These differences prove to be significant, confirming the results of past research that countries make budgets better than they execute them,
25 It should also be noted, however, that the R-squared statistic for the ‘strategic budgeting’ regression is the lowest of the six clusters (0.29), indicating that other variables might explain variations in this PFM cluster better. 26 This result can be interpreted in two different ways: either external audit is really less effective in countries with a civil law (as opposed to a common law) legal background, or the PEFA methodology is not designed to assess the external audit systems prevalent in civil law countries, having been conceived with a common law, Westminster-style government in mind.
19
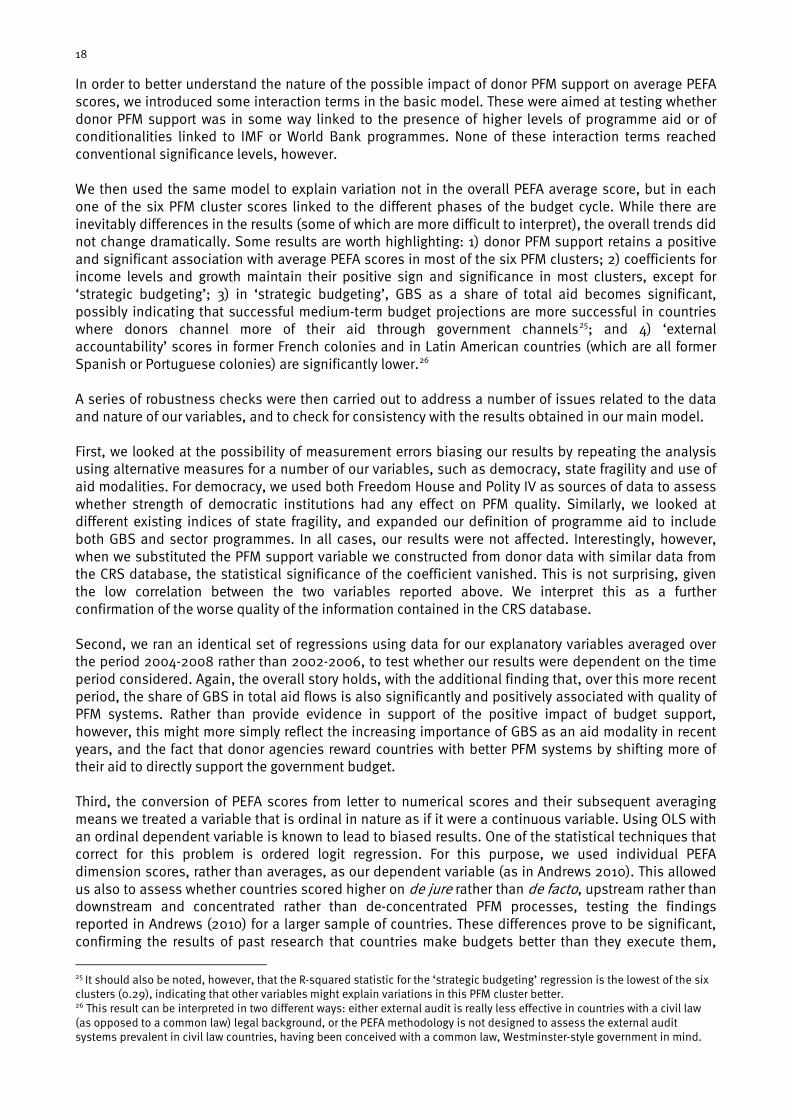
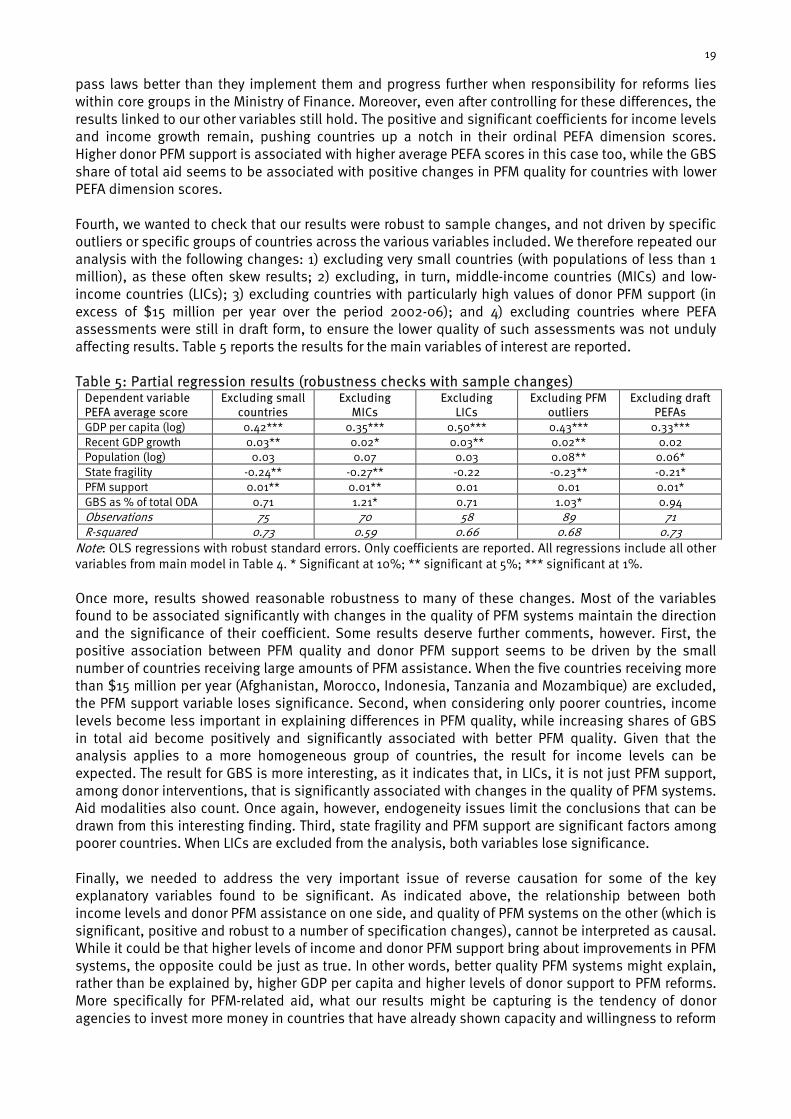
pass laws better than they implement them and progress further when responsibility for reforms lies within core groups in the Ministry of Finance. Moreover, even after controlling for these differences, the results linked to our other variables still hold. The positive and significant coefficients for income levels and income growth remain, pushing countries up a notch in their ordinal PEFA dimension scores. Higher donor PFM support is associated with higher average PEFA scores in this case too, while the GBS share of total aid seems to be associated with positive changes in PFM quality for countries with lower PEFA dimension scores. Fourth, we wanted to check that our results were robust to sample changes, and not driven by specific outliers or specific groups of countries across the various variables included. We therefore repeated our analysis with the following changes: 1) excluding very small countries (with populations of less than 1 million), as these often skew results; 2) excluding, in turn, middle-income countries (MICs) and low-income countries (LICs); 3) excluding countries with particularly high values of donor PFM support (in excess of $15 million per year over the period 2002-06); and 4) excluding countries where PEFA assessments were still in draft form, to ensure the lower quality of such assessments was not unduly affecting results. Table 5 reports the results for the main variables of interest are reported. Table 5: Partial regression results (robustness checks with sample changes)
Dependent variable PEFA average score
Excluding small countries
Excluding MICs
Excluding LICs
Excluding PFM outliers
Excluding draft PEFAs
GDP per capita (log) 0.42*** 0.35*** 0.50*** 0.43*** 0.33*** Recent GDP growth 0.03** 0.02* 0.03** 0.02** 0.02 Population (log) 0.03 0.07 0.03 0.08** 0.06* State fragility -0.24** -0.27** -0.22 -0.23** -0.21* PFM support 0.01** 0.01** 0.01 0.01 0.01* GBS as % of total ODA 0.71 1.21* 0.71 1.03* 0.94 Observations 75 70 58 89 71 R-squared 0.73 0.59 0.66 0.68 0.73
Note: OLS regressions with robust standard errors. Only coefficients are reported. All regressions include all other variables from main model in Table 4. * Significant at 10%; ** significant at 5%; *** significant at 1%. Once more, results showed reasonable robustness to many of these changes. Most of the variables found to be associated significantly with changes in the quality of PFM systems maintain the direction and the significance of their coefficient. Some results deserve further comments, however. First, the positive association between PFM quality and donor PFM support seems to be driven by the small number of countries receiving large amounts of PFM assistance. When the five countries receiving more than $15 million per year (Afghanistan, Morocco, Indonesia, Tanzania and Mozambique) are excluded, the PFM support variable loses significance. Second, when considering only poorer countries, income levels become less important in explaining differences in PFM quality, while increasing shares of GBS in total aid become positively and significantly associated with better PFM quality. Given that the analysis applies to a more homogeneous group of countries, the result for income levels can be expected. The result for GBS is more interesting, as it indicates that, in LICs, it is not just PFM support, among donor interventions, that is significantly associated with changes in the quality of PFM systems. Aid modalities also count. Once again, however, endogeneity issues limit the conclusions that can be drawn from this interesting finding. Third, state fragility and PFM support are significant factors among poorer countries. When LICs are excluded from the analysis, both variables lose significance. Finally, we needed to address the very important issue of reverse causation for some of the key explanatory variables found to be significant. As indicated above, the relationship between both income levels and donor PFM assistance on one side, and quality of PFM systems on the other (which is significant, positive and robust to a number of specification changes), cannot be interpreted as causal. While it could be that higher levels of income and donor PFM support bring about improvements in PFM systems, the opposite could be just as true. In other words, better quality PFM systems might explain, rather than be explained by, higher GDP per capita and higher levels of donor support to PFM reforms. More specifically for PFM-related aid, what our results might be capturing is the tendency of donor agencies to invest more money in countries that have already shown capacity and willingness to reform
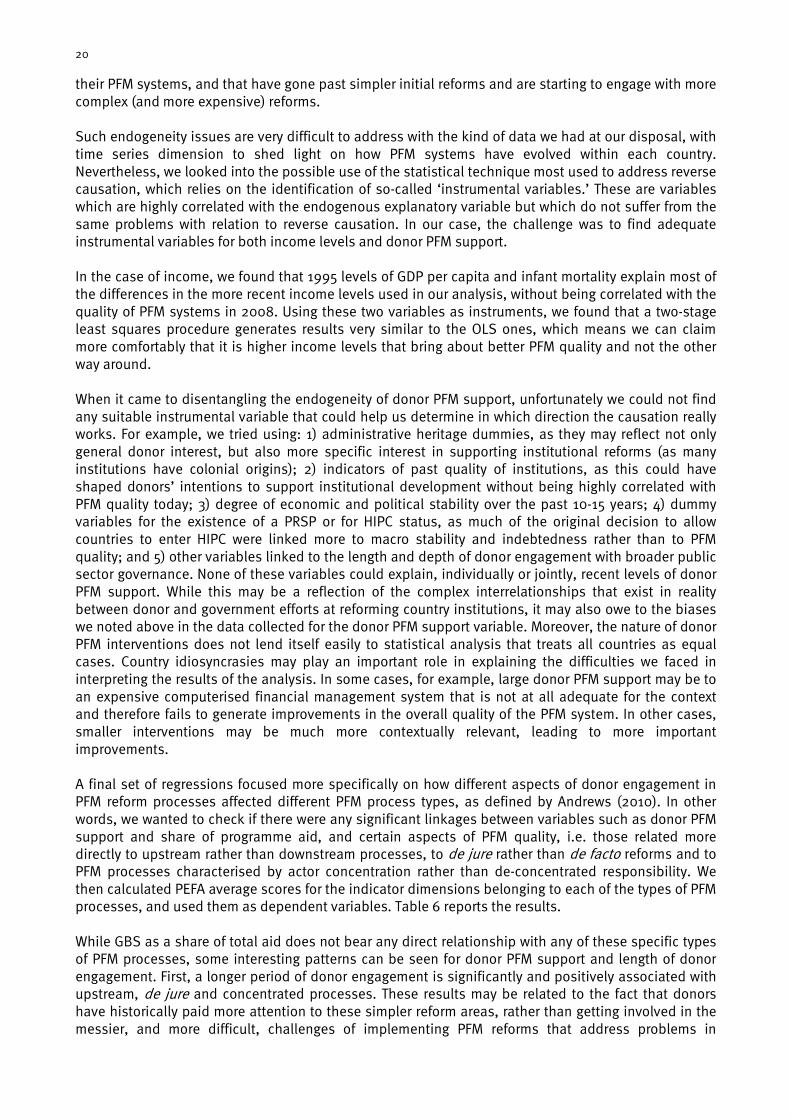
20
their PFM systems, and that have gone past simpler initial reforms and are starting to engage with more complex (and more expensive) reforms. Such endogeneity issues are very difficult to address with the kind of data we had at our disposal, with time series dimension to shed light on how PFM systems have evolved within each country. Nevertheless, we looked into the possible use of the statistical technique most used to address reverse causation, which relies on the identification of so-called ‘instrumental variables.’ These are variables which are highly correlated with the endogenous explanatory variable but which do not suffer from the same problems with relation to reverse causation. In our case, the challenge was to find adequate instrumental variables for both income levels and donor PFM support. In the case of income, we found that 1995 levels of GDP per capita and infant mortality explain most of the differences in the more recent income levels used in our analysis, without being correlated with the quality of PFM systems in 2008. Using these two variables as instruments, we found that a two-stage least squares procedure generates results very similar to the OLS ones, which means we can claim more comfortably that it is higher income levels that bring about better PFM quality and not the other way around. When it came to disentangling the endogeneity of donor PFM support, unfortunately we could not find any suitable instrumental variable that could help us determine in which direction the causation really works. For example, we tried using: 1) administrative heritage dummies, as they may reflect not only general donor interest, but also more specific interest in supporting institutional reforms (as many institutions have colonial origins); 2) indicators of past quality of institutions, as this could have shaped donors’ intentions to support institutional development without being highly correlated with PFM quality today; 3) degree of economic and political stability over the past 10-15 years; 4) dummy variables for the existence of a PRSP or for HIPC status, as much of the original decision to allow countries to enter HIPC were linked more to macro stability and indebtedness rather than to PFM quality; and 5) other variables linked to the length and depth of donor engagement with broader public sector governance. None of these variables could explain, individually or jointly, recent levels of donor PFM support. While this may be a reflection of the complex interrelationships that exist in reality between donor and government efforts at reforming country institutions, it may also owe to the biases we noted above in the data collected for the donor PFM support variable. Moreover, the nature of donor PFM interventions does not lend itself easily to statistical analysis that treats all countries as equal cases. Country idiosyncrasies may play an important role in explaining the difficulties we faced in interpreting the results of the analysis. In some cases, for example, large donor PFM support may be to an expensive computerised financial management system that is not at all adequate for the context and therefore fails to generate improvements in the overall quality of the PFM system. In other cases, smaller interventions may be much more contextually relevant, leading to more important improvements. A final set of regressions focused more specifically on how different aspects of donor engagement in PFM reform processes affected different PFM process types, as defined by Andrews (2010). In other words, we wanted to check if there were any significant linkages between variables such as donor PFM support and share of programme aid, and certain aspects of PFM quality, i.e. those related more directly to upstream rather than downstream processes, to de jure rather than de facto reforms and to PFM processes characterised by actor concentration rather than de-concentrated responsibility. We then calculated PEFA average scores for the indicator dimensions belonging to each of the types of PFM processes, and used them as dependent variables. Table 6 reports the results. While GBS as a share of total aid does not bear any direct relationship with any of these specific types of PFM processes, some interesting patterns can be seen for donor PFM support and length of donor engagement. First, a longer period of donor engagement is significantly and positively associated with upstream, de jure and concentrated processes. These results may be related to the fact that donors have historically paid more attention to these simpler reform areas, rather than getting involved in the messier, and more difficult, challenges of implementing PFM reforms that address problems in
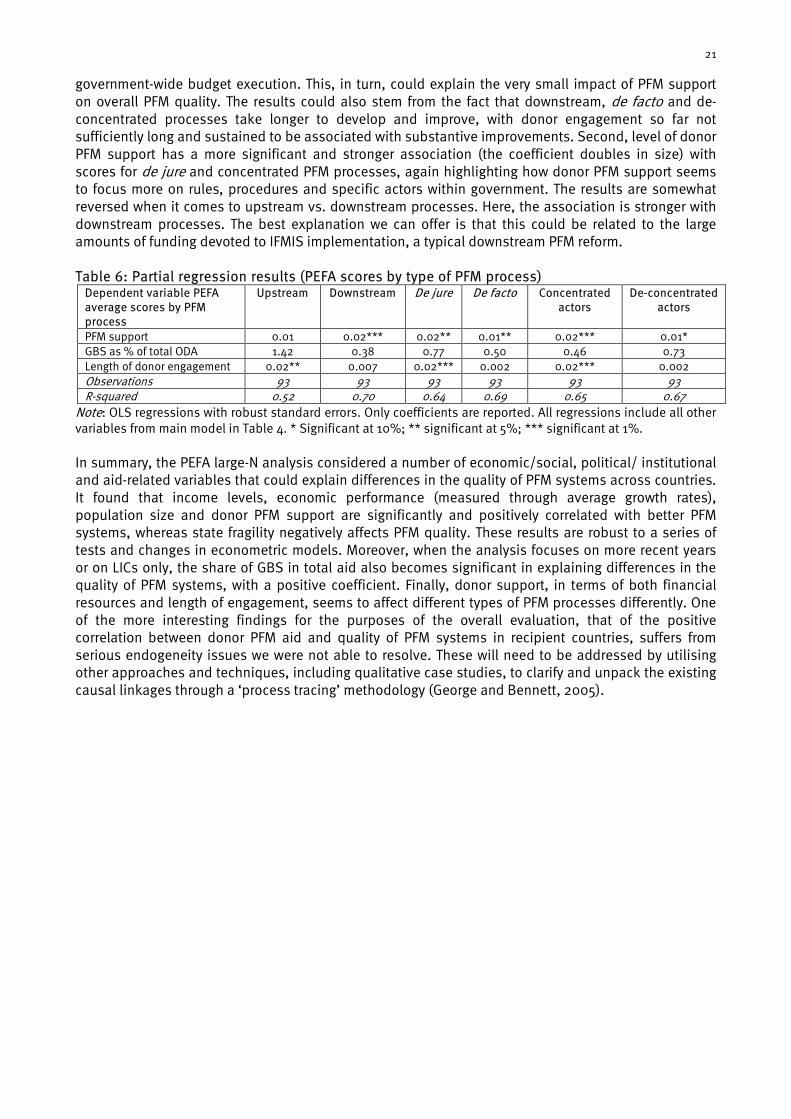
21
government-wide budget execution. This, in turn, could explain the very small impact of PFM support on overall PFM quality. The results could also stem from the fact that downstream, de facto and de-concentrated processes take longer to develop and improve, with donor engagement so far not sufficiently long and sustained to be associated with substantive improvements. Second, level of donor PFM support has a more significant and stronger association (the coefficient doubles in size) with scores for de jure and concentrated PFM processes, again highlighting how donor PFM support seems to focus more on rules, procedures and specific actors within government. The results are somewhat reversed when it comes to upstream vs. downstream processes. Here, the association is stronger with downstream processes. The best explanation we can offer is that this could be related to the large amounts of funding devoted to IFMIS implementation, a typical downstream PFM reform. Table 6: Partial regression results (PEFA scores by type of PFM process)
Dependent variable PEFA average scores by PFM process
Upstream Downstream De jure De facto Concentrated actors
De-concentrated actors
PFM support 0.01 0.02*** 0.02** 0.01** 0.02*** 0.01* GBS as % of total ODA 1.42 0.38 0.77 0.50 0.46 0.73 Length of donor engagement 0.02** 0.007 0.02*** 0.002 0.02*** 0.002 Observations 93 93 93 93 93 93 R-squared 0.52 0.70 0.64 0.69 0.65 0.67
Note: OLS regressions with robust standard errors. Only coefficients are reported. All regressions include all other variables from main model in Table 4. * Significant at 10%; ** significant at 5%; *** significant at 1%. In summary, the PEFA large-N analysis considered a number of economic/social, political/ institutional and aid-related variables that could explain differences in the quality of PFM systems across countries. It found that income levels, economic performance (measured through average growth rates), population size and donor PFM support are significantly and positively correlated with better PFM systems, whereas state fragility negatively affects PFM quality. These results are robust to a series of tests and changes in econometric models. Moreover, when the analysis focuses on more recent years or on LICs only, the share of GBS in total aid also becomes significant in explaining differences in the quality of PFM systems, with a positive coefficient. Finally, donor support, in terms of both financial resources and length of engagement, seems to affect different types of PFM processes differently. One of the more interesting findings for the purposes of the overall evaluation, that of the positive correlation between donor PFM aid and quality of PFM systems in recipient countries, suffers from serious endogeneity issues we were not able to resolve. These will need to be addressed by utilising other approaches and techniques, including qualitative case studies, to clarify and unpack the existing causal linkages through a ‘process tracing’ methodology (George and Bennett, 2005).
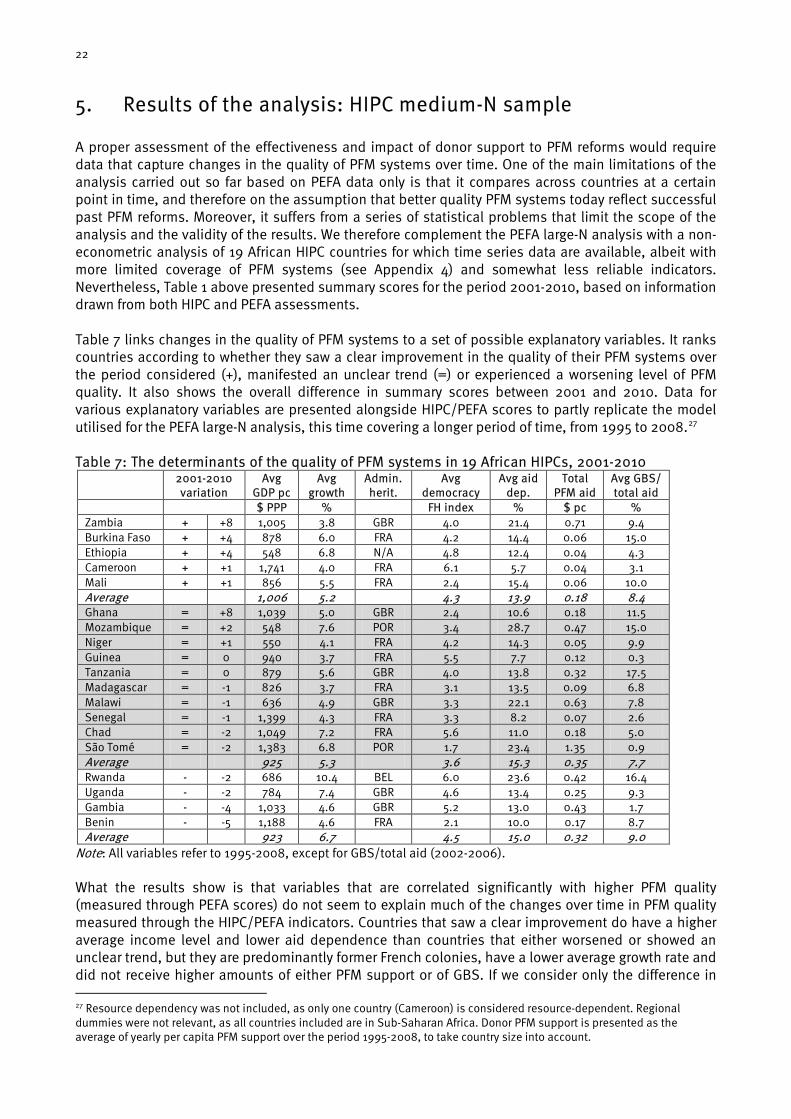
22
5. Results of the analysis: HIPC medium-N sample A proper assessment of the effectiveness and impact of donor support to PFM reforms would require data that capture changes in the quality of PFM systems over time. One of the main limitations of the analysis carried out so far based on PEFA data only is that it compares across countries at a certain point in time, and therefore on the assumption that better quality PFM systems today reflect successful past PFM reforms. Moreover, it suffers from a series of statistical problems that limit the scope of the analysis and the validity of the results. We therefore complement the PEFA large-N analysis with a non-econometric analysis of 19 African HIPC countries for which time series data are available, albeit with more limited coverage of PFM systems (see Appendix 4) and somewhat less reliable indicators. Nevertheless, Table 1 above presented summary scores for the period 2001-2010, based on information drawn from both HIPC and PEFA assessments. Table 7 links changes in the quality of PFM systems to a set of possible explanatory variables. It ranks countries according to whether they saw a clear improvement in the quality of their PFM systems over the period considered (+), manifested an unclear trend (=) or experienced a worsening level of PFM quality. It also shows the overall difference in summary scores between 2001 and 2010. Data for various explanatory variables are presented alongside HIPC/PEFA scores to partly replicate the model utilised for the PEFA large-N analysis, this time covering a longer period of time, from 1995 to 2008.27
Table 7: The determinants of the quality of PFM systems in 19 African HIPCs, 2001-2010 2001-2010
variation Avg
GDP pc Avg
growth Admin. herit.
Avg democracy
Avg aid dep.
Total PFM aid
Avg GBS/ total aid
$ PPP % FH index % $ pc % Zambia + +8 1,005 3.8 GBR 4.0 21.4 0.71 9.4 Burkina Faso + +4 878 6.0 FRA 4.2 14.4 0.06 15.0 Ethiopia + +4 548 6.8 N/A 4.8 12.4 0.04 4.3 Cameroon + +1 1,741 4.0 FRA 6.1 5.7 0.04 3.1 Mali + +1 856 5.5 FRA 2.4 15.4 0.06 10.0 Average 1,006 5.2 4.3 13.9 0.18 8.4 Ghana = +8 1,039 5.0 GBR 2.4 10.6 0.18 11.5 Mozambique = +2 548 7.6 POR 3.4 28.7 0.47 15.0 Niger = +1 550 4.1 FRA 4.2 14.3 0.05 9.9 Guinea = 0 940 3.7 FRA 5.5 7.7 0.12 0.3 Tanzania = 0 879 5.6 GBR 4.0 13.8 0.32 17.5 Madagascar = -1 826 3.7 FRA 3.1 13.5 0.09 6.8 Malawi = -1 636 4.9 GBR 3.3 22.1 0.63 7.8 Senegal = -1 1,399 4.3 FRA 3.3 8.2 0.07 2.6 Chad = -2 1,049 7.2 FRA 5.6 11.0 0.18 5.0 São Tomé = -2 1,383 6.8 POR 1.7 23.4 1.35 0.9 Average 925 5.3 3.6 15.3 0.35 7.7 Rwanda - -2 686 10.4 BEL 6.0 23.6 0.42 16.4 Uganda - -2 784 7.4 GBR 4.6 13.4 0.25 9.3 Gambia - -4 1,033 4.6 GBR 5.2 13.0 0.43 1.7 Benin - -5 1,188 4.6 FRA 2.1 10.0 0.17 8.7 Average 923 6.7 4.5 15.0 0.32 9.0
Note: All variables refer to 1995-2008, except for GBS/total aid (2002-2006). What the results show is that variables that are correlated significantly with higher PFM quality (measured through PEFA scores) do not seem to explain much of the changes over time in PFM quality measured through the HIPC/PEFA indicators. Countries that saw a clear improvement do have a higher average income level and lower aid dependence than countries that either worsened or showed an unclear trend, but they are predominantly former French colonies, have a lower average growth rate and did not receive higher amounts of either PFM support or of GBS. If we consider only the difference in 27 Resource dependency was not included, as only one country (Cameroon) is considered resource-dependent. Regional dummies were not relevant, as all countries included are in Sub-Saharan Africa. Donor PFM support is presented as the average of yearly per capita PFM support over the period 1995-2008, to take country size into account.
23
score between 2001 and 2010, rather than the scores in the various assessments, the picture changes again. In this case, countries whose 2010 score is higher than the 2001 one did receive higher amounts of GBS, but they have lower average incomes, economic growth rates and per capita PFM support. Moreover, many of these differences across country groups are not likely to be significant, given the high levels of within-group variance. The better-performing group includes countries with income levels that range from $1,741 (Cameroon) to $548 (Ethiopia), and with levels of per capita donor PFM support that vary between $0.71 (Zambia) and $0.04 (Ethiopia and Cameroon) per year. Similarly, the group of countries that saw a decline in the quality of their PFM system includes both Rwanda and Gambia, which received one of the highest and one of the lowest levels of GBS as a share of total aid, and Uganda and Benin, which score very differently with regard to the strength of their democratic institutions. In other words, what the HIPC medium-N analysis shows is that the results from the PEFA large-N analysis need to be taken with some caution. Some of the differences that exist between present PFM quality and reform history need to be taken into account when interpreting results, even though the much smaller sample clearly does not permit the conducting of a similarly detailed analysis. Similarly, the lack of more detailed information on PFM support in donor responses to our data request prevented a more in-depth analysis of how specific PFM-related activities funded by donors may have influenced PFM reform outcomes, in either general or specific PFM areas. The best the HIPC medium-N analysis can do given the existing constraints, as we argue in the conclusions, is to guide the choice of case study countries that can provide more detailed comparative insights into the dynamics of PFM reforms, in order to better explain their successes and failures.
24
6. Conclusions and implications for overall evaluation This study brought together available quantitative evidence on the quality of PFM systems across a large number of countries, with the aim of assessing the factors that are associated with and may have determined cross-country differences and variations over time. In order to operationalise and measure the quality of PFM systems, we drew on two main sources: a cross-country dataset of PEFA assessments carried out worldwide in more than 100 countries; and a more limited panel dataset based on a combination of HIPC and PEFA indicators, covering 19 African countries over the period 2001-2010. A specific aim of the study was to investigate the effectiveness and impact of donor PFM support on the quality of PFM systems in recipient countries. For this purpose, and given the scarcity and lack of reliability of existing data, we devoted substantial resources to the compilation of a new dataset, gathering information on donor activities in support of PFM reforms over the period 1995-2008. Finally, we included in the analysis a series of economic/social, political/institutional and aid-related variables that were identified as potentially having a influence on PFM quality and reforms. The first phase of the analysis focused on the use of econometric techniques to identify the key variables that were associated significantly with changes in the quality of PFM systems. Results largely confirmed the findings of previous research. Among the different sets of factors considered, economic and social ones explain more than half the existing differences in the quality of PFM systems, whereas aid-related factors explain only a quarter of the variation. Countries with higher income levels, good recent economic performance and larger populations have better average PEFA scores. State fragility, defined as countries being in a conflict or post-conflict situation and measured through the presence of peacekeeping forces, is associated negatively with quality of PFM systems. More interestingly, the analysis found a significant and positive association, albeit with a very small coefficient, between donor PFM support and average PEFA scores. If more recent data are used, or when the analysis focuses on LICs only, the share of total aid provided as GBS is also associated positively with better PFM quality. These results survived a number of robustness checks. Moreover, if looking at both financial resources and length of engagement with PFM reforms, higher donor support is associated more strongly with improvements in de jure and concentrated PFM processes. Substantive investments in IFMIS systems, however, seem to have had a positive (albeit limited) impact on the quality of PEFA dimensions related to budget execution. The impact of donor PFM support on PEFA scores cannot be proven, however, given that the cross-sectional nature of available data does not exclude reverse causation, or the possibility that it could be countries with higher PEFA scores that receive more PFM-related assistance, rather than the other way around. Results may also reflect biases in the data themselves, given limitations in the data collection process. In this sense, improvements in PEFA scores may in fact bear little relation to donor PFM support, and may reflect instead isomorphic tendencies, a hypothesis supported by the fact that de jure PEFA dimensions score consistently better than de facto ones. Various attempts were made to find adequate instrumental variables that could untangle the direction of causation, without success. The problem of endogeneity has been widely noted and discussed in the literature linking foreign aid and institutions.28
Acemoglu (2005) is generally pessimistic about the possibility of identifying causal relationships in comparative political economy, and argues that robust non-causal relationships nevertheless are of value to advancements in theoretical analysis and policymaking. In our case, as argued below, the positive and significant association between PEFA scores and donor PFM support provides an interesting basis for the country case studies that will complement the analysis carried out in this paper.
28 See Alesina and Weder (2002); Brautigam and Knack (2004); Ear (2007); Knack (2001); Rajan and Subramanian (2007); Svensson (2000); and Tavares (2003).
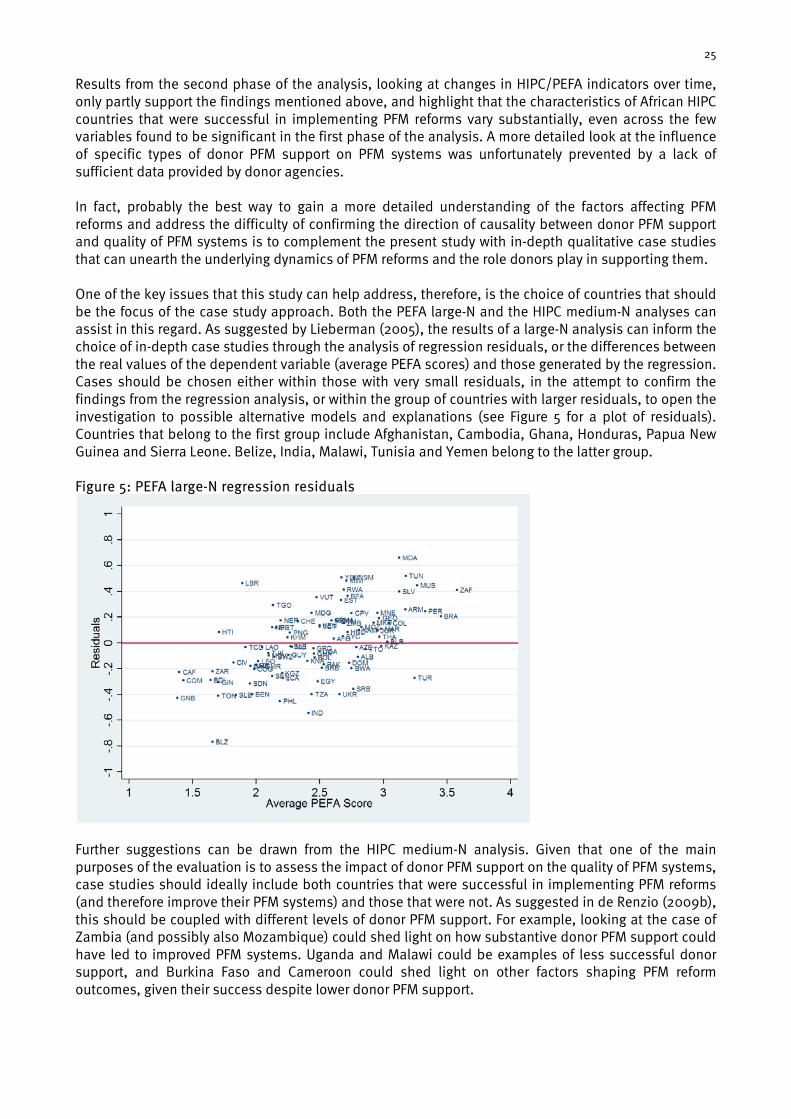
25
Results from the second phase of the analysis, looking at changes in HIPC/PEFA indicators over time, only partly support the findings mentioned above, and highlight that the characteristics of African HIPC countries that were successful in implementing PFM reforms vary substantially, even across the few variables found to be significant in the first phase of the analysis. A more detailed look at the influence of specific types of donor PFM support on PFM systems was unfortunately prevented by a lack of sufficient data provided by donor agencies. In fact, probably the best way to gain a more detailed understanding of the factors affecting PFM reforms and address the difficulty of confirming the direction of causality between donor PFM support and quality of PFM systems is to complement the present study with in-depth qualitative case studies that can unearth the underlying dynamics of PFM reforms and the role donors play in supporting them. One of the key issues that this study can help address, therefore, is the choice of countries that should be the focus of the case study approach. Both the PEFA large-N and the HIPC medium-N analyses can assist in this regard. As suggested by Lieberman (2005), the results of a large-N analysis can inform the choice of in-depth case studies through the analysis of regression residuals, or the differences between the real values of the dependent variable (average PEFA scores) and those generated by the regression. Cases should be chosen either within those with very small residuals, in the attempt to confirm the findings from the regression analysis, or within the group of countries with larger residuals, to open the investigation to possible alternative models and explanations (see Figure 5 for a plot of residuals). Countries that belong to the first group include Afghanistan, Cambodia, Ghana, Honduras, Papua New Guinea and Sierra Leone. Belize, India, Malawi, Tunisia and Yemen belong to the latter group. Figure 5: PEFA large-N regression residuals
Further suggestions can be drawn from the HIPC medium-N analysis. Given that one of the main purposes of the evaluation is to assess the impact of donor PFM support on the quality of PFM systems, case studies should ideally include both countries that were successful in implementing PFM reforms (and therefore improve their PFM systems) and those that were not. As suggested in de Renzio (2009b), this should be coupled with different levels of donor PFM support. For example, looking at the case of Zambia (and possibly also Mozambique) could shed light on how substantive donor PFM support could have led to improved PFM systems. Uganda and Malawi could be examples of less successful donor support, and Burkina Faso and Cameroon could shed light on other factors shaping PFM reform outcomes, given their success despite lower donor PFM support.
26
In summary, evaluating the effectiveness of donor support to PFM reforms in developing countries is still largely unfinished business. While this study has used existing quantitative data to identify some preliminary trends and interesting associations, further work is needed. More quantitative research will need to be carried out as new and better data become available (for example on the quality of PFM systems, on donor support to PFM reforms and on governments’ own efforts to strengthen PFM systems), to further test some of the findings presented above. Qualitative case studies will be fundamental, too, to complement and address the many shortcomings of quantitative analysis, most notably the difficulties in explaining not only if and when donor PFM support has had an impact on PFM systems, but also why and how it has, taking into account the differences in country context in which PFM reforms take place.
27
References Acemoglu, D. (2005) ‘Constitutions, Politics, and Economics: A Review Essay on Persson and Tabellini's
The Economic Effects of Constitutions.’ Journal of Economic Literature 43(4) 1025-1048. Alesina, A. and Weder, B. (2002) ‘Do Corrupt Governments Receive Less Foreign Aid?’ American
Economic Review 92(4): 1126-1137. Andrews, M. (2007) ‘What Would an Ideal PFM System Look Like?’ In A. Shah (ed.) Budgeting and
Budgetary Institutions. Washington, DC: World Bank. Andrews, M. (2009) ‘Good Government Means Different Things in Different Countries.’ Governance
23(1): 7-35. Andrews, M. (2010) ‘How Far Have Public Financial Management Reforms Come in Africa?’ Faculty
Research Working Paper RWP10-018. Cambridge, MA: Harvard Kennedy School. Arndt, C. (2008) ‘The Politics of Governance Ratings.’ International Public Management Journal 11(3):
275-297. Brautigam, D. and Knack, S. (2004) ‘Foreign Aid, Institutions, and Governance in Sub-Saharan Africa.’
Economic Development and Cultural Change 52(2): 255-286. Busse, M., Borrmann, S. Fischer and Gröning, S. (2007) Institutions, Governance and Trade. Hamburg:
Hamburg Institute of International Economics. Cheibub, J.A., Gandhi, J. and Vreeland, J.R. (2010) ‘Democracy and Dictatorship Revisited.’ Public
Choice 143(1-2): 67-101. de Renzio, P. (2009a) ‘Taking Stock: What Do PEFA Assessments Tell Us about PFM Systems Across
Countries?’ Working Paper 302. London: ODI. de Renzio, P. (2009b) ‘Assessing Budget Institutions and Budget Reforms in Developing Countries:
Overview of Theoretical Approaches and Empirical Evidence. Approach & Methodology for the Evaluation of Donor Support to Public Finance Management (PFM) Reform in Developing Countries. Part A.’ Oxford: Fiscus.
de Renzio, P. and Dorotinsky, W. (2007) ‘Tracking Progress in the Quality of PFM Systems in HIPCs: An Update on Past Assessments Using PEFA Data.’ Washington, DC: PEFA Secretariat.
de Renzio, P., Gomez, P. and Sheppard, J. (2009) ‘Budget Transparency and Development in Resource-Dependent Countries.’ International Social Science Journal 57(13): 57-69.
Ear, S. (2007) ‘Does Aid Dependence Worsen Governance?’ International Public Management Journal 10(3): 259-286.
Fagernas, S. and Roberts, J. (2004) ‘Fiscal Impact of Aid: A Survey of Issues and Synthesis of Country Studies of Malawi, Uganda and Zambia.’ ESAU Working Paper 11. London: ODI.
George, A. L. and Bennett, A. (2005) Case Studies and Theory Development in the Social Sciences. Cambridge, MA: MIT Press.
Hedger, E. and de Renzio, P. (2010) ‘What Do Public Financial Management Assessments Tell Us about PFM Reform?’ Background Note. London: ODI.
IDA/IMF (International Development Association/International Monetary Fund) (2003) ‘Country Assessment and Action Plan (AAP) for HIPCs: Questionnaire, Benchmarks, Explanations, Standard Tables.’ Washington, DC: IDA/IMF.
IDA/IMF (International Development Association/International Monetary Fund) (2005) ‘Update on the Assessments and Implementation of Action Plans to Strengthen Capacity of HIPCs to Track Poverty-Reducing Public Spending.’ Washington, DC: IDA/IMF.
IMF (International Monetary Fund) (2007) ‘Fiscal Policy Response to Scaled-Up Aid: Strengthening Public Financial Management.’ Washington, DC: IMF.
IMF (International Monetary Fund) (2010) ‘Budget Institutions and Fiscal Performance in Low-Income Countries.’ Working Paper WP/10/80. Washington, DC: IMF.
Kakabadse, A., Kakabadse, N.K. and Kouzmin, A. (2003) ‘Reinventing the Democratic Governance Project through Information Technology? A Growing Agenda for Debate.’ Public Administration Review 63(1): 44-60.
Kaufmann, D., Kraay, A. and Zoido-Lobatón, P. (1999) ‘Governance Matters.’ Policy Research Working Paper 2196. Washington, DC: World Bank.
28
Knack, S. (2001) ‘Aid Dependence and the Quality of Governance: Cross-Country Empirical Tests.’ Southern Economic Journal 68(2): 310-329.
Knack, S. and Rahman, A. (2007) ‘Donor Fragmentation and Bureaucratic Quality.’ Journal of Development Economics 83(1): 176-197.
La Porta, R., Lopez-de-Silanes, F., Shleifer, A. and Vishny, R. (1999) ‘The Quality of Government.’ Journal of Law, Economics, and Organization 15(1): 222-279.
Lieberman, E.S. (2005) ‘Nested Analysis as a Mixed-Method Strategy for Comparative Research.’ American Political Science Review 99(3): 435-452.
Moss, T., Pettersson, G. and van der Walle, N. (2006) ‘An Aid-Institutions Paradox? A Review Essay on Aid Dependency and State Building in Sub-Saharan Africa.’ Working Paper 74. Washington, DC: CGD.
Munck, G. (2009) Measuring Democracy: A Bridge between Scholarship and Politics. Baltimore, MD: Johns Hopkins University Press.
Pack, H. and Pack, J.R. (1990) ‘Is Foreign Aid Fungible? The Case of Indonesia.’ The Economic Journal 100(399): 188-194.
PEFA (Public Expenditure and Financial Accountability) Secretariat (2005) ‘Public Financial Management Performance Measurement Framework.’ Washington, DC: PEFA Secretariat.
PEFA (Public Expenditure and Financial Accountability) Secretariat (2009) ‘Issues in Comparison and Aggregation of PEFA Assessment Results Over Time and Across Countries.’ Washington, DC: PEFA Secretariat.
Rabe-Hesketh, S. and Everitt, B.S. (2007) A Handbook of Statistical Analyses Using Stata. 4th edition. Boca Raton, FL: Chapman and Hall.
Rajan, R. and Subramanian, A. (2007) ‘Does Aid Affect Governance?’ American Economic Review 97(2): 322-327.
Remmer, K.L. (2004) ‘Does Foreign Aid Promote the Expansion of Government?’ American Journal of Political Science 48(1): 77-92.
Rivera-Batiz, F.L. (2002) ‘Democracy, Governance and Economic Growth: Theory and Evidence.’ Review of Development Economics 6(2): 225-247.
Svensson, J. (2000) ‘Foreign Aid and Rent-Seeking.’ Journal of International Economics 51(2): 437-461. Tavares, J. (2003) ‘Does Foreign Aid Corrupt?’ Economics Letters 79(1): 99-106. Treisman, D. (2000) ‘The Causes of Corruption: A Cross-National Study.’ Journal of Public Economics
76(3): 399-457. Vyas, S. and Kumaranayake, L. (2006) ‘Constructing Socio-Economic Status Indices: How to Use
Principal Components Analysis.’ Health Policy and Planning 21(6): 459-468. Wehner, J. and de Renzio, P. (2010) ‘Citizens, Legislators, and Executive Disclosure: The Political
Determinants of Fiscal Transparency.’ Unpublished manuscript. London: LSE. Wescott, C.G. (2009) ‘World Bank Support for Public Financial Management and Procurement: From
Theory to Practice.’ Governance 22(1): 139-153. World Bank (2008) ‘Public Sector Reform: What Works and Why? An IEG Evaluation of World Bank
Support.’ Washington, DC: World Bank Independent Evaluation Group.
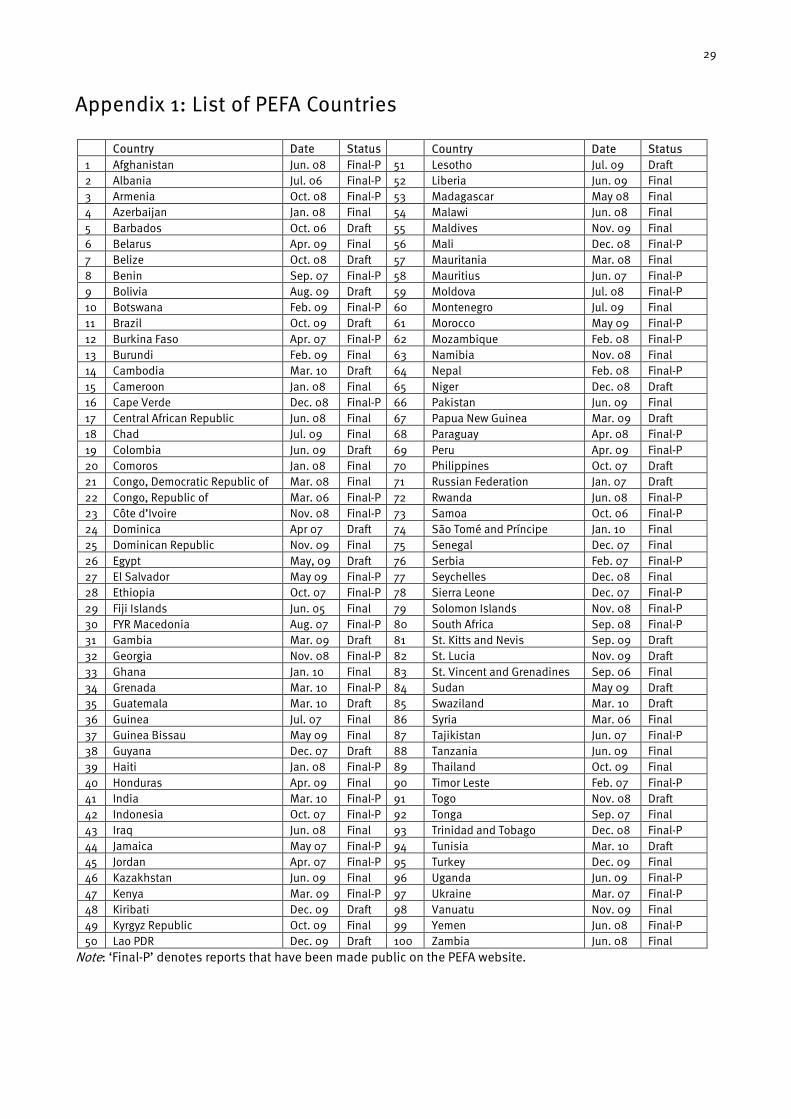
29
Appendix 1: List of PEFA Countries
Country Date Status Country Date Status 1 Afghanistan Jun. 08 Final-P 51 Lesotho Jul. 09 Draft 2 Albania Jul. 06 Final-P 52 Liberia Jun. 09 Final 3 Armenia Oct. 08 Final-P 53 Madagascar May 08 Final 4 Azerbaijan Jan. 08 Final 54 Malawi Jun. 08 Final 5 Barbados Oct. 06 Draft 55 Maldives Nov. 09 Final 6 Belarus Apr. 09 Final 56 Mali Dec. 08 Final-P 7 Belize Oct. 08 Draft 57 Mauritania Mar. 08 Final 8 Benin Sep. 07 Final-P 58 Mauritius Jun. 07 Final-P 9 Bolivia Aug. 09 Draft 59 Moldova Jul. 08 Final-P 10 Botswana Feb. 09 Final-P 60 Montenegro Jul. 09 Final 11 Brazil Oct. 09 Draft 61 Morocco May 09 Final-P 12 Burkina Faso Apr. 07 Final-P 62 Mozambique Feb. 08 Final-P 13 Burundi Feb. 09 Final 63 Namibia Nov. 08 Final 14 Cambodia Mar. 10 Draft 64 Nepal Feb. 08 Final-P 15 Cameroon Jan. 08 Final 65 Niger Dec. 08 Draft 16 Cape Verde Dec. 08 Final-P 66 Pakistan Jun. 09 Final 17 Central African Republic Jun. 08 Final 67 Papua New Guinea Mar. 09 Draft 18 Chad Jul. 09 Final 68 Paraguay Apr. 08 Final-P 19 Colombia Jun. 09 Draft 69 Peru Apr. 09 Final-P 20 Comoros Jan. 08 Final 70 Philippines Oct. 07 Draft 21 Congo, Democratic Republic of Mar. 08 Final 71 Russian Federation Jan. 07 Draft 22 Congo, Republic of Mar. 06 Final-P 72 Rwanda Jun. 08 Final-P 23 Côte d’Ivoire Nov. 08 Final-P 73 Samoa Oct. 06 Final-P 24 Dominica Apr 07 Draft 74 São Tomé and Príncipe Jan. 10 Final 25 Dominican Republic Nov. 09 Final 75 Senegal Dec. 07 Final 26 Egypt May, 09 Draft 76 Serbia Feb. 07 Final-P 27 El Salvador May 09 Final-P 77 Seychelles Dec. 08 Final 28 Ethiopia Oct. 07 Final-P 78 Sierra Leone Dec. 07 Final-P 29 Fiji Islands Jun. 05 Final 79 Solomon Islands Nov. 08 Final-P 30 FYR Macedonia Aug. 07 Final-P 80 South Africa Sep. 08 Final-P 31 Gambia Mar. 09 Draft 81 St. Kitts and Nevis Sep. 09 Draft 32 Georgia Nov. 08 Final-P 82 St. Lucia Nov. 09 Draft 33 Ghana Jan. 10 Final 83 St. Vincent and Grenadines Sep. 06 Final 34 Grenada Mar. 10 Final-P 84 Sudan May 09 Draft 35 Guatemala Mar. 10 Draft 85 Swaziland Mar. 10 Draft 36 Guinea Jul. 07 Final 86 Syria Mar. 06 Final 37 Guinea Bissau May 09 Final 87 Tajikistan Jun. 07 Final-P 38 Guyana Dec. 07 Draft 88 Tanzania Jun. 09 Final 39 Haiti Jan. 08 Final-P 89 Thailand Oct. 09 Final 40 Honduras Apr. 09 Final 90 Timor Leste Feb. 07 Final-P 41 India Mar. 10 Final-P 91 Togo Nov. 08 Draft 42 Indonesia Oct. 07 Final-P 92 Tonga Sep. 07 Final 43 Iraq Jun. 08 Final 93 Trinidad and Tobago Dec. 08 Final-P 44 Jamaica May 07 Final-P 94 Tunisia Mar. 10 Draft 45 Jordan Apr. 07 Final-P 95 Turkey Dec. 09 Final 46 Kazakhstan Jun. 09 Final 96 Uganda Jun. 09 Final-P 47 Kenya Mar. 09 Final-P 97 Ukraine Mar. 07 Final-P 48 Kiribati Dec. 09 Draft 98 Vanuatu Nov. 09 Final 49 Kyrgyz Republic Oct. 09 Final 99 Yemen Jun. 08 Final-P 50 Lao PDR Dec. 09 Draft 100 Zambia Jun. 08 Final
Note: ‘Final-P’ denotes reports that have been made public on the PEFA website.
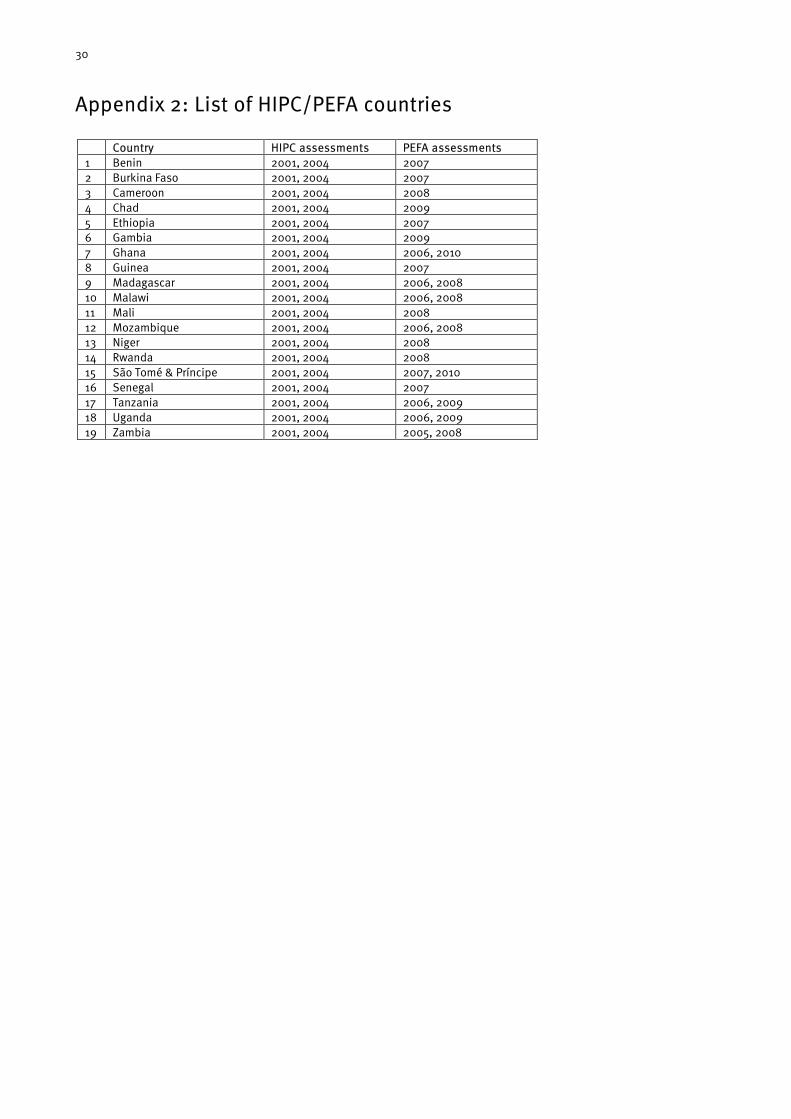
30
Appendix 2: List of HIPC/PEFA countries
Country HIPC assessments PEFA assessments 1 Benin 2001, 2004 2007 2 Burkina Faso 2001, 2004 2007 3 Cameroon 2001, 2004 2008 4 Chad 2001, 2004 2009 5 Ethiopia 2001, 2004 2007 6 Gambia 2001, 2004 2009 7 Ghana 2001, 2004 2006, 2010 8 Guinea 2001, 2004 2007 9 Madagascar 2001, 2004 2006, 2008 10 Malawi 2001, 2004 2006, 2008 11 Mali 2001, 2004 2008 12 Mozambique 2001, 2004 2006, 2008 13 Niger 2001, 2004 2008 14 Rwanda 2001, 2004 2008 15 São Tomé & Príncipe 2001, 2004 2007, 2010 16 Senegal 2001, 2004 2007 17 Tanzania 2001, 2004 2006, 2009 18 Uganda 2001, 2004 2006, 2009 19 Zambia 2001, 2004 2005, 2008
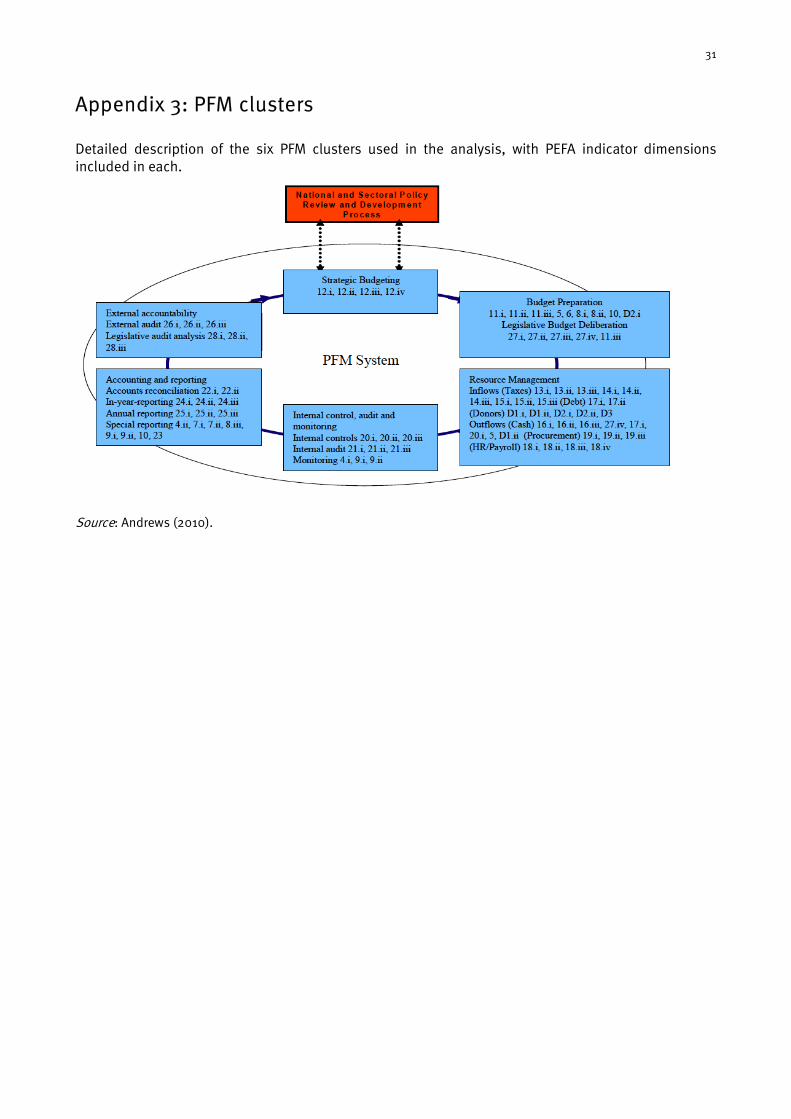
31
Appendix 3: PFM clusters Detailed description of the six PFM clusters used in the analysis, with PEFA indicator dimensions included in each.
Source: Andrews (2010).
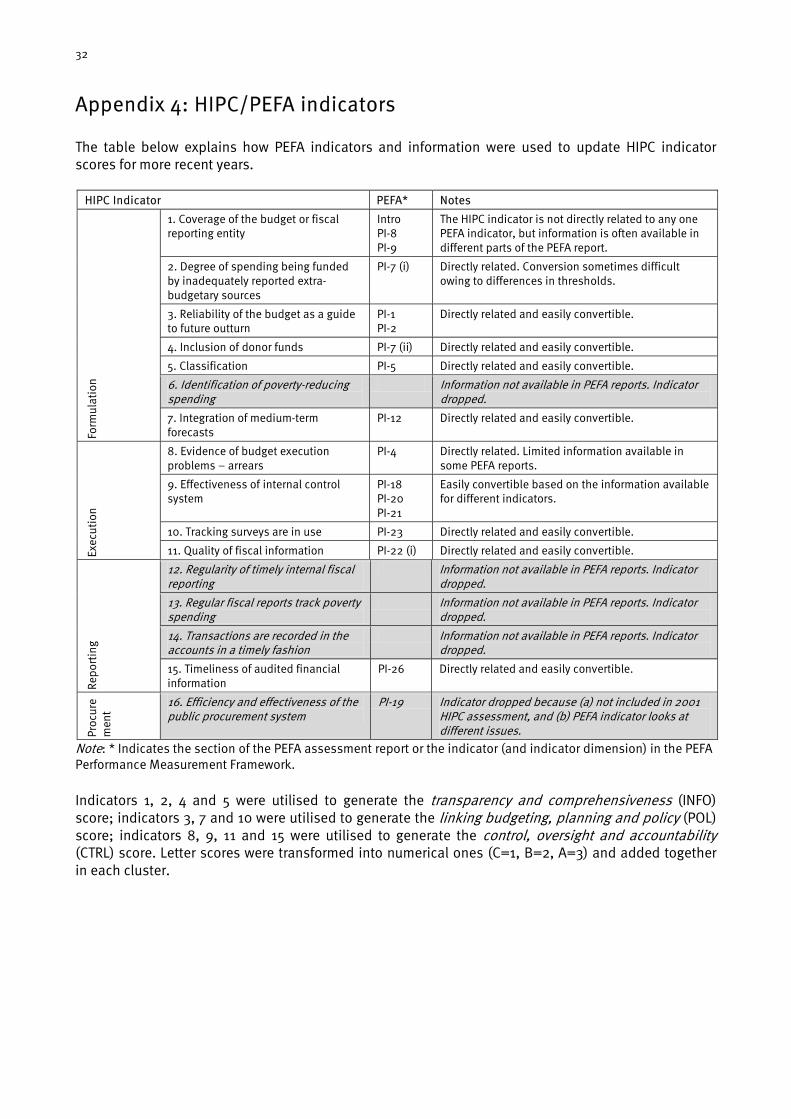
32
Appendix 4: HIPC/PEFA indicators The table below explains how PEFA indicators and information were used to update HIPC indicator scores for more recent years.
HIPC Indicator PEFA* Notes
Form
ulat
ion
1. Coverage of the budget or fiscal reporting entity
Intro PI-8 PI-9
The HIPC indicator is not directly related to any one PEFA indicator, but information is often available in different parts of the PEFA report.
2. Degree of spending being funded by inadequately reported extra-budgetary sources
PI-7 (i) Directly related. Conversion sometimes difficult owing to differences in thresholds.
3. Reliability of the budget as a guide to future outturn
PI-1 PI-2
Directly related and easily convertible.
4. Inclusion of donor funds PI-7 (ii) Directly related and easily convertible.
5. Classification PI-5 Directly related and easily convertible.
6. Identification of poverty-reducing spending
Information not available in PEFA reports. Indicator dropped.
7. Integration of medium-term forecasts
PI-12 Directly related and easily convertible.
Exec
utio
n
8. Evidence of budget execution problems – arrears
PI-4 Directly related. Limited information available in some PEFA reports.
9. Effectiveness of internal control system
PI-18 PI-20 PI-21
Easily convertible based on the information available for different indicators.
10. Tracking surveys are in use PI-23 Directly related and easily convertible.
11. Quality of fiscal information PI-22 (i) Directly related and easily convertible.
Repo
rtin
g
12. Regularity of timely internal fiscal reporting
Information not available in PEFA reports. Indicator dropped.
13. Regular fiscal reports track poverty spending
Information not available in PEFA reports. Indicator dropped.
14. Transactions are recorded in the accounts in a timely fashion
Information not available in PEFA reports. Indicator dropped.
15. Timeliness of audited financial information
PI-26 Directly related and easily convertible.
Proc
ure
men
t
16. Efficiency and effectiveness of the public procurement system
PI-19 Indicator dropped because (a) not included in 2001 HIPC assessment, and (b) PEFA indicator looks at different issues.
Note: * Indicates the section of the PEFA assessment report or the indicator (and indicator dimension) in the PEFA Performance Measurement Framework. Indicators 1, 2, 4 and 5 were utilised to generate the transparency and comprehensiveness (INFO) score; indicators 3, 7 and 10 were utilised to generate the linking budgeting, planning and policy (POL) score; indicators 8, 9, 11 and 15 were utilised to generate the control, oversight and accountability (CTRL) score. Letter scores were transformed into numerical ones (C=1, B=2, A=3) and added together in each cluster.
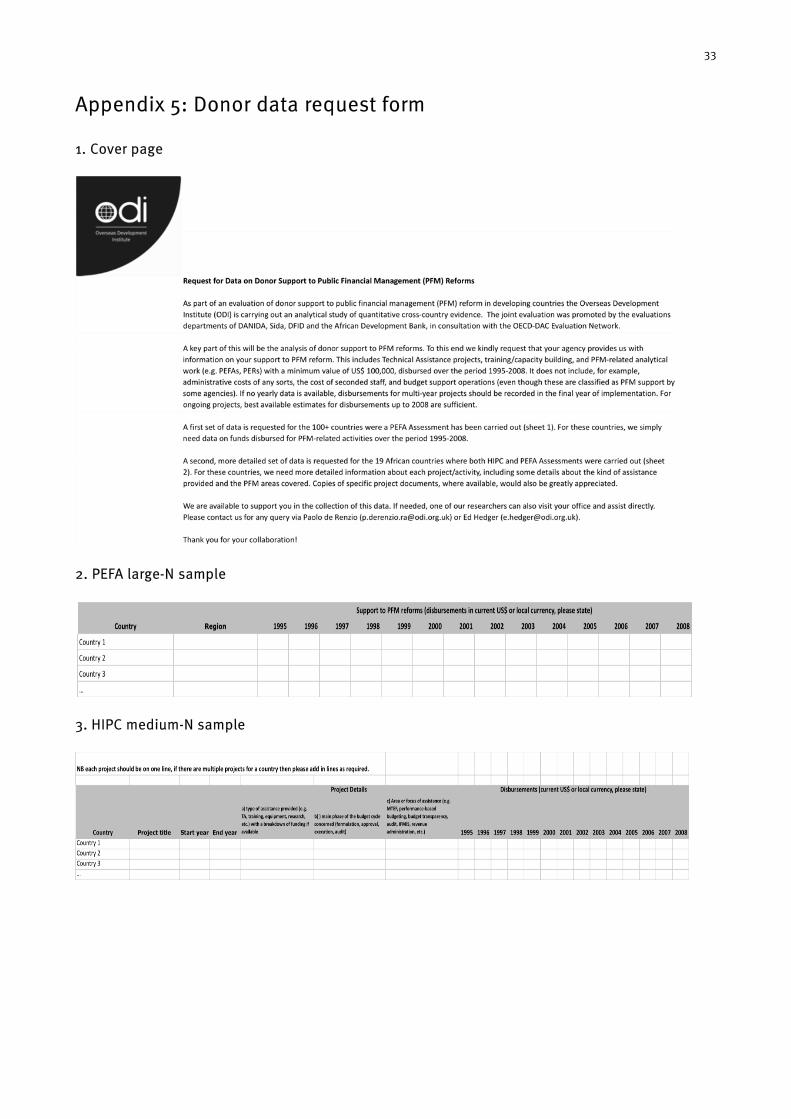
33
Appendix 5: Donor data request form 1. Cover page
2. PEFA large-N sample
3. HIPC medium-N sample
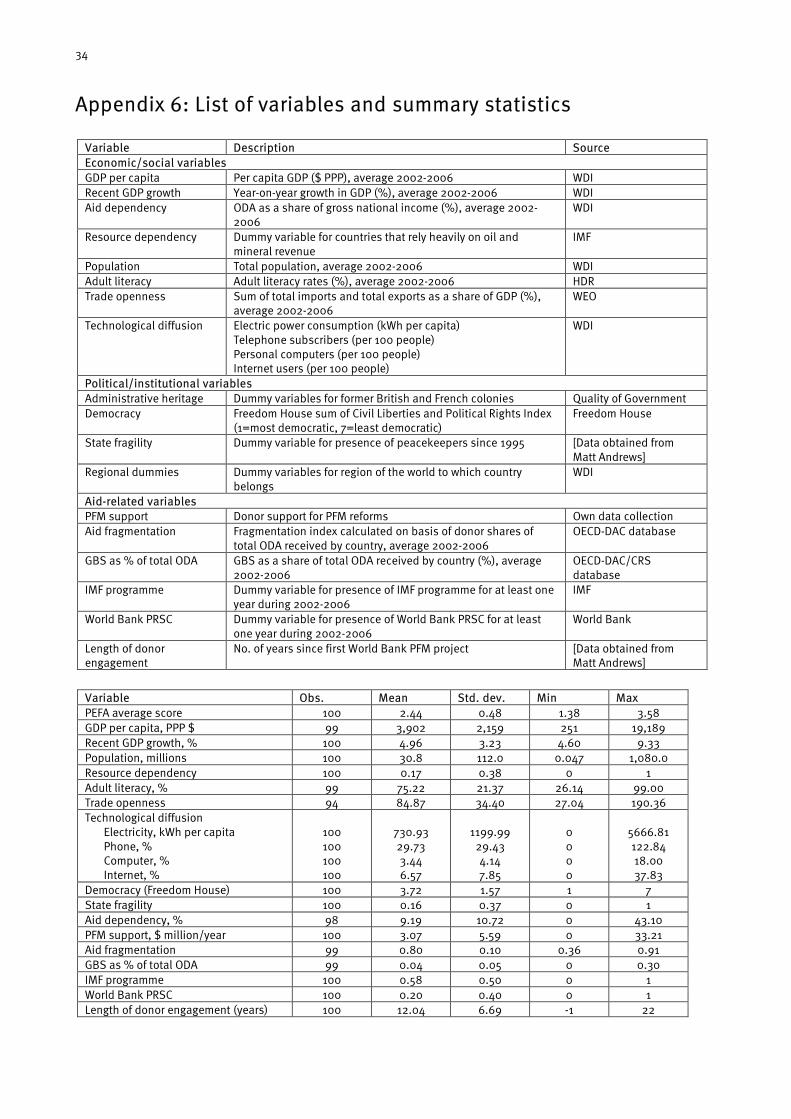
34
Appendix 6: List of variables and summary statistics
Variable Description Source Economic/social variables GDP per capita Per capita GDP ($ PPP), average 2002-2006 WDI Recent GDP growth Year-on-year growth in GDP (%), average 2002-2006 WDI Aid dependency ODA as a share of gross national income (%), average 2002-
2006 WDI
Resource dependency Dummy variable for countries that rely heavily on oil and mineral revenue
IMF
Population Total population, average 2002-2006 WDI Adult literacy Adult literacy rates (%), average 2002-2006 HDR Trade openness Sum of total imports and total exports as a share of GDP (%),
average 2002-2006 WEO
Technological diffusion Electric power consumption (kWh per capita) Telephone subscribers (per 100 people) Personal computers (per 100 people) Internet users (per 100 people)
WDI
Political/institutional variables Administrative heritage Dummy variables for former British and French colonies Quality of Government Democracy Freedom House sum of Civil Liberties and Political Rights Index
(1=most democratic, 7=least democratic) Freedom House
State fragility Dummy variable for presence of peacekeepers since 1995 [Data obtained from Matt Andrews]
Regional dummies Dummy variables for region of the world to which country belongs
WDI
Aid-related variables PFM support Donor support for PFM reforms Own data collection Aid fragmentation Fragmentation index calculated on basis of donor shares of
total ODA received by country, average 2002-2006 OECD-DAC database
GBS as % of total ODA GBS as a share of total ODA received by country (%), average 2002-2006
OECD-DAC/CRS database
IMF programme Dummy variable for presence of IMF programme for at least one year during 2002-2006
IMF
World Bank PRSC Dummy variable for presence of World Bank PRSC for at least one year during 2002-2006
World Bank
Length of donor engagement
No. of years since first World Bank PFM project [Data obtained from Matt Andrews]
Variable Obs. Mean Std. dev. Min Max PEFA average score 100 2.44 0.48 1.38 3.58 GDP per capita, PPP $ 99 3,902 2,159 251 19,189 Recent GDP growth, % 100 4.96 3.23 4.60 9.33 Population, millions 100 30.8 112.0 0.047 1,080.0 Resource dependency 100 0.17 0.38 0 1 Adult literacy, % 99 75.22 21.37 26.14 99.00 Trade openness 94 84.87 34.40 27.04 190.36 Technological diffusion
Electricity, kWh per capita Phone, % Computer, % Internet, %
100 100 100 100
730.93 29.73 3.44 6.57
1199.99
29.43 4.14 7.85
0 0 0 0
5666.81 122.84 18.00 37.83
Democracy (Freedom House) 100 3.72 1.57 1 7 State fragility 100 0.16 0.37 0 1 Aid dependency, % 98 9.19 10.72 0 43.10 PFM support, $ million/year 100 3.07 5.59 0 33.21 Aid fragmentation 99 0.80 0.10 0.36 0.91 GBS as % of total ODA 99 0.04 0.05 0 0.30 IMF programme 100 0.58 0.50 0 1 World Bank PRSC 100 0.20 0.40 0 1 Length of donor engagement (years) 100 12.04 6.69 -1 22

Overseas Development Institute111 Westminster Bridge RoadLondon SE1 7JDUK
Tel: +44 (0)20 7922 0300Fax: +44 (0)20 7922 0399Email: [email protected]: www.odi.org.uk
ISBN 978 1 907288 36 4Working Paper (Print) ISSN 1759 2909ODI Working Papers (Online) ISSN 1759 2917