does corporate social responsibility (csr) create ... paper... · does corporate social...
TRANSCRIPT
Does corporate social responsibility (CSR) create shareholder value?
Exogenous shock-based evidence from the Indian Companies Act 2013
Hariom Manchiraju
Assistant Professor
Department of Accounting
Indian School of Business
Hyderabad, Telangana, India 500032
Email: [email protected]
Shivaram Rajgopal
Roy Bernard Kester and T.W. Byrnes Professor of
Accounting and Auditing
Columbia Business School,
610 Uris Hall, 3022 Broadway, NY, NY 10027
Email: [email protected]
Comments welcome
March 2, 2016
ABSTRACT:
In 2013, a new law required Indian firms, which satisfied certain profitability, net worth and size
thresholds, to spend at least 2% of their net income on CSR. We exploit this natural experiment to isolate
the shareholder value implications of CSR activities. Using an event study approach coupled with a
regression discontinuity design as the identification strategy, we find that the law, on average, caused a
significant drop in the stock price of firms forced to spend money on CSR, consistent with the idea that
firms voluntarily choose CSR levels to maximize firm value. However, firms with greater agency costs
and advertisement spending are not negatively affected by the mandatory CSR rule. Our results
potentially clarify the direction of causality underlying decades of mixed findings on the association
between CSR and firm value.
We thank an anonymous referee, Doug Skinner (the editor), Yakov Amihud, Bernie Black, Sanjay
Kallapur, Simi Kedia, Yongtae Kim, Stephanie Larocque (AAA annual meetings discussant), Suresh
Radhakrishnan, Srini Rangan, K.R.Subramanyam, Stephan Zeume (MIT ASIA conference discussant),
Hao Zhang, and workshop participants at 2015 MIT Asia Conference in Accounting, 2015 AAA
conference and the Indian School of Business for helpful comments. We also thank Ranjan Nayak and
Aadhaar Verma for providing excellent research assistance. Finally, we thank our respective schools for
financial support.

1
Does corporate social responsibility (CSR) create shareholder value? Exogenous shock-
based evidence from the Indian Companies Act 2013
1. INTRODUCTION
Corporate social responsibility (CSR) is now mandatory in India. According to clause 135 of the
Companies Act (mandatory CSR rule, hereafter) passed by the Indian Parliament in 2013, if during any
fiscal year, certain profitability, net worth and size thresholds are met, a firm is required to spend 2% of
its average net profits of the last three years on CSR activities.1 A legislative mandate forcing
corporations to spend funds on CSR activities is perhaps the first of its kind in the world. We exploit this
natural experiment to isolate the impact of CSR on shareholder value.
There are two competing theoretical views on whether CSR affects shareholder value. The
“shareholder expense” view, advocated most notably by Milton Friedman (1970), asserts that “the social
responsibility of business is to increase its profits” and hence argues that CSR destroys shareholder value.
Under Friedman’s framework, CSR activities of a firm can only be viewed as a manifestation of moral
hazard towards the shareholder. The contrasting view, labeled here as the “stakeholder value
maximization” view, following the “doing well by doing good” theory advanced in the management
literature, argues that strategic CSR spending can increase firm value. The intuition is that a firm’s self-
interested focus on stakeholders’ interests increases stakeholders’ willingness to support the firm’s
operations in several ways (Kitzmueller and Shimshack 2012).
Existing empirical evidence on whether CSR creates shareholder value is inconclusive despite
nearly four decades of research efforts, partly because these studies are clouded by methodological
concerns such as potential endogeneity, reverse causality or omitted variable problems (Margolis,
1 As per the mandatory CSR rule, if during any fiscal year, a firm has either (1) a net worth of Indian Rupees (INR)
5,000 million (about U.S. $83 million) or more; or (2) sales of INR 10,000 million (about U.S. $167 million) or
more; or (3) net profit of INR 50 million (about U.S. $0.83 million) or more, it is required to spend 2% of its average
net profits of the last three years on CSR related activities. An exchange rate of 60INR = 1US$ is assumed for these
conversion of INR to US$.

2
Elfenbein, and Walsh, 2009).2 For instance, the choice to conduct CSR is voluntary and assuming firms
spend their optimal level of CSR, on average, there ought to be no association between future firm
performance and CSR in the cross-section. Hence, it is difficult to ascertain whether the observed
associations between CSR and firm performance are causal in nature or are merely attributable to model
misspecification due to the influence of unobserved firm level heterogeneity related to CSR (Himmelberg,
Hubbard and Palia 1999). Second, as highlighted by Hong, Kubik and Scheinkman (2012), reverse
causality might drive the results as firms that are doing well, and are hence less financially constrained,
might be the ones incurring expenditure on CSR activities. Hence, firm performance could cause higher
future CSR, as opposed to the other way around. Several extant studies suffer from this limitation, as
pointed out by Margolis, Elfenbein and Walsh. (2009). Third, as Lys, Naughton and Wang (2015)
suggest, CSR might merely signal future profits, as opposed to causing them. In sum, the correlation
between CSR and firm value or firm performance, documented by hundreds of earlier studies, albeit
interesting, does not necessarily warrant a causal interpretation.
To overcome these inferential problems, one would ideally like to find an exogenous experiment
in which firms are randomly assigned to spend money on CSR or not. This would allow us to compare
the outcomes of the treated firms with those of the non-treated firms and to hence attribute any
differences in outcomes to their CSR spending. Remarkably, a fairly close version of that ideal
experiment exists. The mandatory CSR rule of the Indian Companies Act represents an exogenous shock
in the sense that it assigns firms to two groups: (i) firms that are mandatorily affected by these new CSR
rule (treatment group); and (ii) firms that are not impacted by the CSR rule (control group).3 Comparing
the stock returns of treatment group to those of control group (controlling for other firm attributes that are
2 For reviews of the literature on CSR, see Griffin and Mahon (1997), Orlitzky and Benjamin (2001), Orlitzky,
Schmidt and Rynes. (2003), Margolis and Walsh (2003), Margolis, Elfenbein, and Walsh (2009) and Kitzmueller
and Shimshack (2012). 3 There is randomness in the sense that the profitability/net worth/ size thresholds need not have been the numbers
eventually chosen by the lawmakers. Ex-ante, firms had no choice to fall in the affected or unaffected categories
demarcated by the profitability, net worth and size thresholds prescribed by the Indian Companies Act.
3
likely to affect returns) around the events that changed the probability of the passage of the Act can thus
provide a reliable basis for causal inference.4
Ex-ante, it is difficult to predict the impact of the mandatory CSR rule on shareholder value. In
situations where firms spend sub-optimally on CSR or where CSR activities are not aligned with the
shareholder’s interests (as suggested by Friedman, 1970; Tirole, 2001; Benabou and Tirole, 2010; and
Cheng, Hong, and Shue, 2013), the new mandatory CSR rule, via its increased reporting and governance
requirements, will likely force firms to redirect their CSR spending to maximize firm value, leading thus
to an increase in the shareholder value of firms affected by the rule. However, if firms choose CSR to
maximize their firm value, imposing binding legal constraints on their CSR choices will lead to declines
in their shareholder values (Demsetz and Lehn 1985). For example, if at equilibrium, a firm’s marginal
benefits of CSR are lower than the marginal costs of CSR, then the firm will not spend on CSR. In such a
case, imposing a rule to spend 2% of its profits on CSR will only lead to a reduction of shareholder value.
To test these predictions, we employ a regression discontinuity design (RDD). A RDD typically
compares outcomes just above and just below a discontinuous threshold, and attributes any differences in
the outcome variable to the intervention that creates the discontinuity, assuming that but for the
intervention firms above and below the threshold are similar.5 In this paper, the discontinuity arises
because, around the INR 50 million profit threshold exogenously determined by the Companies Act 2013,
a minor change in net income leads to a discrete change (i.e., a discontinuity) in the application of CSR
rule and thereby classifies firms as AFFECTED (those who are required to comply with CSR rule) and
UNAFFECTED (those who are not required to comply with CSR rule). Intuitively, there is no reason to
expect systematic differences in a firm with a net income of INR 51 million and another with a net
income of INR 49 million. Hence any differences in the cumulative abnormal returns (CAR) around the
4 Atanasov and Black (2014), in the survey of 863 studies examining the effect of governance on firm value, argue
that credible inference strategies usually rely on “shocks” to governance. In contrast, only a few recent papers rely
on instrumental variables to address the causality problem (e.g., Cheng, Ioannou, and Serafeim, 2011; Deng, Kang
and Low 2013). 5 See Imbens and Lemieux (2008), Lee and Lemieux (2010) and Robert and Whited (2013) for recent overviews on
the RDD methodology and surveys of RDD applications in the economics and finance literature.

4
significant CSR event dates (the outcome variable in our setting) for firms that are just above the
threshold and have to comply with the CSR requirement with those that are just below the cutoff and did
not have to comply, can be attributed to the CSR rule, thereby drawing reliable causal inferences on the
effect of CSR on firm value.
Our main finding is that around the significant events that led to the passage of the CSR rule, the
CAR for the AFFECTED firms is lower than the CAR for UNAFFECTED firms, suggesting a negative
relation between mandatory CSR and shareholder value. These results are not affected by the possibility
that potential treatment firms might have managed their profits/ book value/ sales right below the cutoff to
escape having to comply the law. Further, our results are robust to both non-parametric and parametric
techniques of estimating the treatment effect. This finding is consistent with the view that imposing
binding legal constraints on firms’ CSR choices will lead to a decline in their shareholder value.
We then perform four cross-sectional analyses to identify conditions under which the mandatory
CSR rule is likely to affect firm value differentially. These predictions are motivated by the “stakeholder
value maximization” perspective of the management literature. Specifically, we examine whether the
impact of CSR on shareholder value depends on the firm’s agency costs faced by the firm, the firm’s
political connections, its advertisement spending, and its affiliation to a highly polluting industry. We
find that the CAR for the AFFECTED firms is less negative if such firms are affiliated with business
groups. Firms belonging to business groups, in the Indian context, face high levels of agency costs
(Bertrand, Mehta and Mullainathan, 2002). 6 We argue that agency costs associated with CSR spending
will reduce due to the increased reporting and governance requirements imposed by the mandatory CSR
rule. Hence, the decrease in firm value caused by the mandatory CSR rule is offset by gains resulting
from reduction in agency costs. We also find that the CAR for the AFFECTED firms is less negative if
such firms advertise. This is consistent with Servaes and Tamayo (2013) who argue that CSR and firm
value are positively related for firms with high consumer awareness, as proxied by advertising
6 The agency costs arises in the business groups as a business groups can act as a structure that facilitates
“tunneling” of funds from minority outside shareholders to group insiders.
5
expenditure. We find no cross-sectional variation in the stock price reactions to the mandatory CSR rule
for AFFECTED and UNAFFECTED firms when we partition firms based on political connectedness or
on affiliation to a polluting industry.
While inferences based on RDD are shown to be more credible than those drawn from other
identification strategies (Lee and Lemieux, 2008), these inferences are valid for the sub-sample around
the thresholds and are not necessarily generalizable once we move away from these thresholds. To
broaden the scope of our study, we look at all the firms listed on the National Stock Exchanges of India
with available accounting and stock return data. We find that the negative relation between the
mandatory CSR rule and firm value exists even in the full sample.
We also examine whether the mandatory CSR rule affects the long term value for the affected
firms using Tobin’s Q ratio as a measure of firm value. If investors believe that mandatory CSR activities
hurt firm value, then the Tobin’ q ratio of the affected firms should decline more, relative to that of
unaffected firms, in the years when the likelihood of the passage of mandatory CSR rule increased.
Consistent with our expectations, we find that in the years 2011 and 2013, there is a greater decline in the
Tobin’s q ratio of the AFFECTED firms, relative to the Tobin’s Q ratio of the benchmark UNAFFECTED
firms.
Overall, our results suggest that, on average, the mandatory CSR rule imposes statistically
significant net costs on firms that are required to comply with this regulation, leading to declines in
shareholder value. These costs can arise due to a variety of factors including increased pressure from the
Government on businesses to pick up the tab for social activities prescribed the new CSR law, increased
compliance costs associated with reporting and monitoring CSR activities or the use of scarce managerial
time and effort in these activities that do not add to shareholder value. However, under certain situations
such as in the presence of agency costs and advertisement spending, mandatory CSR spending can be
valuable to the shareholders.
We make several contributions to the literature. Our primary contribution is to present clean
evidence on the impact of CSR spending on firm value using a natural experiment. Using multiple
6
identification strategies such as an event study and regression discontinuity design, we document a
negative relation between mandatory CSR and shareholder value. What distinguishes our study from the
vast prior literature in this area is that while a majority of prior studies consider voluntary CSR, to the
best of our knowledge, we are the first to examine the impact of an exogenous shock mandating CSR
spending.7 The shock enables us to compare otherwise similar firms where one set is assigned to spend
funds on CSR whereas the other set is not.
Our study also suggests that there ought to be no association between such outcomes and CSR
given that firms on average, pick CSR levels optimally to maximize firm value. Consistent with
Himmelberg, Hubbard and Palia (1999), studies that find an association between corporate outcomes
(e.g., higher operating performance, lower cost of capital or lower earnings management) and CSR need
to grapple with the possibility that are confounded by omitted variables.
Finally our study complements prior research that examines the effect of firm-specific
characteristics on the relationship between CSR and shareholder value (e.g. Servaes and Tamayo 2013; Di
Giuli and Kostovetsky 2014). We show that firms with greater agency costs and advertisement spending
are not negatively affected by the mandatory CSR rule because CSR is potentially beneficial in these
settings.
2. BACKGROUND OF THE COMPANIES ACT 2013
India’s Companies Act, 2013 was enacted on 29th August 2013. This legislation attempts to
overhaul a nearly sixty year old Indian corporate law framework to bring it in line with global best
practices and aims to provide a healthy regulatory environment for the businesses to grow. A unique
feature of this Act is clause 135 that if in any given year, a firm that has either (1) a net worth of
Indian Rupees (INR) 5,000 million (about U.S. $83 million) or more; (2) sales of INR 10,000 million
(about U.S. $167 million) or more; or (3) a net profit of INR 50 million (about U.S. $0.83 million) or
7 Several papers (e.g. Hung and Wang 2014) examine the effect of mandatory disclosures of CSR activities (not
spending) on shareholder value.

7
more, is required to spend 2% of its average net profits of the last three years on CSR activities. For
example, the rule implies that if in the year 2012, a firm meets any of the three criteria; it has to spend 2%
of the average profits for 2010, 2011, and 2012. Similar to Iliev (2010), in the context of section 404 of
the Sarbanes Oxley Act, these numerical thresholds help us disentangle the contribution of the CSR rule
from other requirements of the Companies Act 2013 (e.g. enhanced corporate governance and disclosure
norms, greater accountability of management and auditors; stricter enforcement, protection for minority
shareholders, etc.) that apply to all listed firms, regardless of these dollar cutoffs.
The passage of Companies Act 2013 is a culmination of several years of effort. It was first
introduced in the Lok Sabha (lower house of the Indian parliament), on 3rd August 2009 as the Companies
Bill, 2009 (Bill, hereafter). This version of the Bill was referred to the Parliamentary Standing
Committee on Finance, which submitted its report on 31st August 2010. Keeping in view the
recommendations made by the finance committee, a revised Bill was prepared and the original Bill was
withdrawn. The new Bill was introduced in the Lok Sabha on 14th December, 2011. The Bill was again
referred to the Finance Committee on 5th January, 2012 as certain new provisions, which had not been
referred earlier to the committee, were included in this new Bill. The finance committee submitted its
report on 26th June 2012. The Lok Sabha subsequently approved the Bill on 18th December 2012 and
labeled it as the Companies Bill, 2012. The Companies Bill, 2012 was then considered and approved by
the Rajya Sabha (upper house of the Indian parliament) on 8th August 2013 as The Companies Bill, 2013.
It received the President’s assent on 29th August 2013 and has now become law.
Surprisingly, the Bill, in its original form, had no clause on CSR. The Finance Committee
introduced the notion of mandatory CSR for the first time in its report dated 31st August 2010. Anecdotal
evidence and reports in the popular press suggest that the Finance Committee, perhaps anticipating
popular backlash that might result from a very progressive pro-business bill, inserted several new clauses
to make the bill slightly more pro-development. The proposal mandating CSR spending was among these
clauses and noted that:

8
“every company having [(net worth of rupees 500 crore or more, or turnover of rupees 1000 crore
or more)] or [a net profit of rupees 5 crore or more during a year] shall be required to formulate a CSR
Policy to ensure that every year at least 2% of its average net profits during the three immediately
preceding financial years shall be spent on CSR activities as may be approved and specified by the
company.”
Murli Deora, the Minister of Corporate Affairs (the ministry that crafted the Companies Bill,
2009), acknowledged that there was an argument as to whether the Government should mandate anything,
but the Ministry enthusiastically adopted the Finance Committee’s mandatory CSR proposal. The
proposal of mandatory CSR attracted a lot of criticism from various companies who argued that what they
spend on community welfare, education, health, development and environmental activism is for them to
decide. Azim Premji, the Chairman of Wipro Ltd. opposes mandatory CSR and argues that "my worry is
the stipulation should not become a tax at a later stage ... Spending two per cent on CSR is a lot,
especially for companies that are trying to scale up in these difficult times. It must not be imposed." He
also felt that a distinction should be made between personal philanthropy and CSR, which is a company
activity.8 Due to these criticisms, the Ministry of Corporate Affairs announced on 28th February 2011 that
it is considering making only the disclosure of CSR spending mandatory, and that the CSR spending as
such will be voluntary. However, eventually, the Ministry of Corporate Affairs resisted the pressure from
corporate houses and went ahead with the mandatory CSR rule. Such resistance also suggests that reverse
causality (from firm value to the implementation of the law) is highly unlikely.
While the term “CSR” itself is not defined in the Act, Schedule VII of the Companies Act, quoted
below, requires CSR activities of the firm to focus on at least one of the following areas: (i) eradicating
extreme hunger and poverty; (ii) promotion of education; (iii) promoting gender equality and empowering
women; (iv) reducing child mortality and improving maternal health; (v) combating HIV, AIDS, malaria
and other diseases; (vi) ensuring environmental sustainability; (vii) employment-enhancing vocational
skills; (viii) social business projects; (ix) contribution to the Prime Minister’s National Relief Fund or any
8 http://businesstoday.intoday.in/story/azim-premji-aima-convention-corporate-social-responsibility/1/198960.html

9
other fund set up by the Central Government or the state governments for socioeconomic development,
and relief and funds for the welfare of the scheduled castes, the scheduled tribes, other backward classes,
minorities and women; and (x) such other matters as may be prescribed.
The CSR rule also provides some guidance on the enforcement mechanism needed to achieve the
CSR goals. Specifically, it requires a firm to make changes within its board of directors and create a CSR
committee consisting of three or more directors, at least one of which must be an independent director.
The CSR committee is expected to devise, recommend, and monitor CSR activities, and the amounts
spent on such activities. The new rule also requires that a firm must (i) publicly disclose an official policy
on its CSR activities and document CSR activities implemented during the year in its annual report; and
(ii) give preference to local areas where they operate. While a company is not subject to liability for
failing to spend on CSR, a company and its officers are subject to liability for not explaining such a
failure in the annual report of the board of directors.9
Overall, the mandatory CSR rule of the Companies Act, 2013 is a unique regulation as it may be
the first time in the world that a country has mandated expenditures for the public good, rather than
simply tax companies or leave them to conduct CSR activities on their own. According to Ernst &
Young, these provisions would generate over U.S. $2.5 billion of CSR spending annually. While the
country, which is home to the largest concentration of poverty on the planet, can certainly benefit from
this large inflow of funds in socially responsible activities, the question remains whether this mandatory
CSR improves or hurts shareholder value.
3. RELATED LITERATURE AND HYPOTHESES
Does CSR affect firm value? Existing theoretical literature on this question can be categorized in
two opposing views: (i) shareholder expense view; and (ii) stakeholder value maximization view.
9 Failure to explain is punishable by a fine on the company of not less than INR 50,000 (about U.S. $833) and up to
INR 25 lakhs (about U.S. $41,667). Further, officers who default on the reporting provision could be subject to up to
three years in prison and/or fines of not less than INR 50,000 rupees (about U.S. $833) and as high as INR 5 lakh
(about U.S. $8,333).

10
The shareholder expense view follows Milton Friedman’s (1970) assertion that “the social
responsibility of business is to increase its profits.” Friedman’s fundamental criticism of CSR is that it
involves managers spending shareholders’ money and “in effect imposing taxes, on one hand, and
deciding how the tax proceeds shall be spent, on the other.” He also considers CSR a drain on firm’s
valuable resources that should otherwise be utilized for shareholders value maximization.10
In contrast to the shareholder expense view, Freeman’s (1984) stakeholder theory argues that a
firm should consider the interests of everyone who substantially affects (or is affected by) the welfare of
the firm. Thus, social, environmental or ethical preferences of stakeholders can induce CSR activities
(Baron 2001; McWilliams and Siegal 2001). Such strategically motivated CSR activities can be
profitable and the management literature terms this thesis as “doing well by doing good.” 11 Following
this stakeholder view, studies have documented that a high commitment to CSR activities is associated
with attracting and retaining higher quality employees (Greening and Turban, 2000), improving the
effectiveness of the marketing of products and services (Fombrun, 2005), increasing demand for products
and services (Navarro, 1988), providing superior access to valuable resources (Cochran and Wood, 1984),
generating moral capital or goodwill that tempers punitive actions by regulatory agencies during a
negative event (i.e. an insurance effect) and thereby preserves firm value (Godfrey 2005).
The economics based reasoning for profitable CSR is that these activities reduce transaction costs
with stakeholders and provide net benefits to the firm. The theory of the firm, as advanced by Coase
(1937) and expanded by Jensen and Meckling (1976), among others, views a firm as a nexus of contracts
(both explicit and implicit) between shareholders and other stakeholders in which each group of
stakeholders supplies the firm with critical resources. Firms that undertake CSR activities tend to develop
10 Consider the following except from Business Week, 2005 which follows Friedman’s intuition: “It’s 8:30am on a
Friday in July, and Carol B. Tomé is starting to sweat. The chief financial officer of Home Depot Inc. isn’t getting
ready to face a firing squad of investors or unveil troubled accounting at the home improvement giant. Instead, she
and 200 other Home Depot employees are helping to build a playground replete with swings, slides, and a jungle
gym at a local girls’ club in hardscrabble Marietta, Ga. … Is this any way to build shareholder value at Home Depot,
where the stock has been stuck near $43, down 35% from its all-time high?” 11 Benabou and Tirole (2010), Margolis, Elfenbein, and Walsh (2009) and Kitzmueller and Shimshack (2012) are
some papers that review this literature on “doing well by doing good.”

11
a reputation for keeping their commitments associated with the implicit contracts. Consequently,
stakeholders of these firms are more likely to contribute resources and effort to the firm and accept less
favorable explicit contracts (compared to stakeholders of firms with no or low levels of CSR activities).
The empirical evidence on the direct effect of CSR on firm value is mixed. Margolis, Elfenbein,
and Walsh (2009), in their influential meta-analysis of this body of work comprising roughly 167 studies,
find that some studies document a positive effect when regressing firm’s financial performance (either
accounting based ROA or stock returns) on corporate goodness while others find a negative effect. The
average effect across these studies is a small positive increase in firm performance. More recently,
Dhaliwal, Oz and Yang (2011) find that the voluntary disclosure of CSR activities leads to a reduction in
the firm’s cost of capital, while attracting institutional investors and broader analyst coverage. Servaes
and Tamayo (2013) find that CSR activities and firm value are positively related for firms with high
customer awareness, but not for firms with low customer awareness. In contrast, Di Giuli and
Kostovetsky (2014) find that Democrat-leaning firms are associated with more CSR policies than
Republican-leaning firms, and increases in firm CSR ratings are associated with negative future stock
returns and declines in ROA. This finding suggests that CSR activities that are motivated by the political
affiliation of stakeholders come at the expense of firm value.
While, the discussion so far focuses on how voluntary CSR can be costly or beneficial to
shareholders, we have to also consider the implications of mandatory CSR in India as imposed by the
Companies Act. There are several reasons why mandatory CSR activities and their disclosure may not
benefit, and might even harm, shareholders. If indeed Friedman’s view of CSR is descriptively valid and
firms optimally choose not to spend on CSR, imposing binding legal constraints on their CSR choices
will lead to declines in their values. Further, once CSR spending and its reporting becomes mandatory,
the Government may find it easier to pressure businesses to pick up the tab for social activities that it
ought to have undertaken. It is also conceivable that the Government might start dictating how the CSR

12
money should be spent, thereby limiting a firm’s flexibility in coming up with its CSR policies.12 Further,
various interest groups may find it easier to lobby management to advance their environment and social
goals. Finally, mandatory CSR also comes with compliance related costs such as administrative costs
associated with reporting information and board monitoring CSR activities.
While a new regulation might often impose net costs on shareholders, there can also be situations
where a regulation is in fact beneficial.13 In the pre-mandatory CSR period, managers might be reluctant
to spend on CSR or spend sub-optimally because of pressures to achieve short term earnings targets.
However, with mandatory CSR required by the law, managers might now be able to nurture their relations
with various stakeholders that might pay off in the long run. It is also possible that managers might
devote funds to CSR to satisfy their own social preferences. Increased reporting and governance
requirements imposed by the law will make firms redirect their CSR spending to maximize firm value.
Finally, as discussed earlier, firms might use CSR activities as a signal of their commitment towards their
implicit contracts. With the mandatory CSR rule, a firm’s CSR policies become more formalized and
visible, thereby strengthening the signal of such commitment. Hence, the terms of the firms’ explicit
contracts might become more favorable to the firm.
In summary, there are several ways in which CSR can either have a positive or negative impact
on firm value, thereby making this issue an intriguing empirical question. Based on this discussion our
first hypothesis is:
H1: The mandatory CSR rule affects firm value.
We next hypothesize conditions under which mandatory CSR rule is likely to affect firm value
differentially. Motivated by prior work on CSR, we consider whether the impact of CSR on shareholder
12 For instance, the Indian state of Chattisgarh was considering an additional requirement that the CSR money
should be directed to Chief Minister’s fund. Source: http://www.thehindu.com/todays-paper/chhattisgarh-wants-
mandatory-csr-spends-to-go-to-cm-fund/article5132833.ece 13 For example Chhaochharia and Grinstein (2007) find that certain governance related provisions of Sarbanes Oxley
Act led to increase in firm value. Black and Khanna (2007) find that the governance reforms (Clause 49) introduced
in India are associated with positive stock market reaction. Similarly Black and Kim (2012) find that the 1999
Korean governance reforms also led to increase in firm value for the affected firms.
13
value varies depending on the firm’s agency problems, its political connections, its advertisement
spending, and its affiliation to a highly polluting industry.
Under Friedman’s framework, CSR activities of a firm can only be viewed as a manifestation of
moral hazard towards shareholders. The pursuit of doing good may give corporate executives a higher
feeling of satisfaction or positive public recognition (such as various CSR awards). A firm’s CSR
activities may be driven by a manager’s own social preferences. It may also represent efforts of an
entrenched manager to establish overly friendly relationship with specific stakeholders in order to
reinforce his entrenchment strategy (Pagano and Volpin 2005; Surroca and Tribo 2008; Cronqvist,
Heyman, Nilson, Svaleryd and Valchos 2009). In all these case, benefits that other stakeholders obtain
from CSR activities come at the expense of shareholder wealth, resulting in a wealth transfer from
shareholders to other stakeholders. To the extent the increased reporting and governance requirements
imposed by the mandatory CSR rule make firms redirect their CSR spending to maximize firm value,
either by preventing managers from using CSR as an entrenchment device or as a means to satisfy their
own social preferences, firm values will increase after the passage of the CSR rule as agency costs are
reduced. Hence, our hypothesis is:
H2a: The negative (positive) effect of mandatory CSR rule on firm value is lower (higher) among firms
with high agency costs.
Next, we consider the impact on political connectedness of a firm on the relation between CSR
and firm value. Faccio (2006) suggests that political connections can be of value to a firm in several ways
including preferential treatment by government-owned enterprises (such as banks or raw material
producers), lower taxation, preferential treatment in competition for government contracts, relaxed
regulatory oversight of the company in question, or stiffer regulatory oversight of its rivals. However, as
pointed by Shleifer and Vishny (1994), politicians themselves will extract at least some of the rents
generated by connections, and firm value will be enhanced only when the marginal benefits of the
connections outweigh their marginal costs. CSR spending might constitute a potential mechanism via
which a firm can satisfy the preferences of politicians and increase its ability to conduct business with the

14
government and other entities with their political connections. Consistent with this argument, Di Giuli
and Kostovetsky (2014) find that companies with Democrat CEOs and companies headquartered in
Democrat states have higher CSR ratings than companies with Republican CEOs or headquartered in
Republican states.
The importance of political connections assumes greater importance in the context of India where
the Government regulation is high, corruption is accepted as a ground reality and enforcement
mechanisms are unpredictable (Khanna and Palepu 2000). Consequently, CSR activities can become an
important part of corporate strategy to enhance these political ties. For example, in his inaugural
Independence Day speech, the Prime Minister of India recently urged corporations to take up building
toilets in schools as a priority under their CSR policies. Within four days, companies announced over
INR 200 crore (US$ 33.33 million) contributions for Government's "Swachh Bharat” (Clean India)
campaign.14 To the extent firms can use CSR as a mechanism to enhance their political ties, CSR can be
valuable. Therefore, we hypothesize that:
H2b: The negative (positive) effect of mandatory CSR rule on firm value is lower (higher) among firms
that are politically connected.
The marketing and management literatures suggests that CSR activities of a firm can attract
customers. Fisman, Heal, and Nair (2008), in their model, argue that consumers realize that only firms
that care about product quality are willing to invest in CSR activities because purely profit-oriented firms
(that can compromise on quality) find these investments to be “too expensive.” By engaging in CSR,
firms are able to identify themselves as the ones selling better quality products. Further, socially
responsible consumers (e.g. “green” consumers) are more likely to buy and some are even willing to pay
more for products of CSR firms (Navarro 1988; Sen and Bhattacharya 2001). Servaes and Tamayo
(2013) find that CSR and firm value are positively related for firms with high consumer awareness, as
14 http://timesofindia.indiatimes.com/india/Modis-Swachh-Bharat-call-gets-Rs-200-crore-from-TCS-
Bharti/articleshow/40384230.cms

15
proxied by advertising expenditure. They argue that a necessary condition for CSR to modify consumer
behavior and hence affect firm value is consumer awareness of the firm’s CSR activities. Advertising
expenditure enhances a firm’s information environment, thereby increasing the firm’s potential
customers’ awareness about the firm, its products, and practices (including CSR). This, in turn, is likely
to increase the chances of a consumer identifying with the product, thereby enhancing revenue and
eventually firm value. Following this logic, we hypothesize that:
H2c: The negative (positive) effect of mandatory CSR rule on firm value is lower (higher) among firms
with high levels of advertisement expenditure.
Finally, we investigate whether the negative effect associated with the mandatory CSR rule is
relatively strong among firms in polluting industries. Once CSR becomes mandatory, environmental
activist groups and local communities can pressure these firms to spend on green technologies or
environmental controls. While these investments can benefit the overall environment, they typically tend
to fetch limited firm-specific benefits. Hence, we hypothesize that:
H2d: The negative (positive) effect of mandatory CSR rule on firm value is higher (lower) among firms
that are in high polluting industries.
4. RESEARCH DESIGN AND DATA
4.1 Basic set up of a regression discontinuity design
To establish the causal effect of mandatory CSR rule on shareholder value, we employ a
regression discontinuity design (RDD). We first lay out the basic intuition of the RDD. This technique
was first introduced by Thistlethwaite and Campbell (1960) in a study that examined the impact of merit
awards on future academic outcomes of students. In their setting, students with test scores, R, greater
than or equal to a cutoff value c received an award, and those with scores below the cutoff did not receive
an award. This process of granting merit awards generates a sharp discontinuity in the treatment variable
(which is receiving the award, in this case) as a function of the rating variable (which is test score, in this
15 The rating variable is also referred to as forcing variable or the assignment variable in the literature.
16
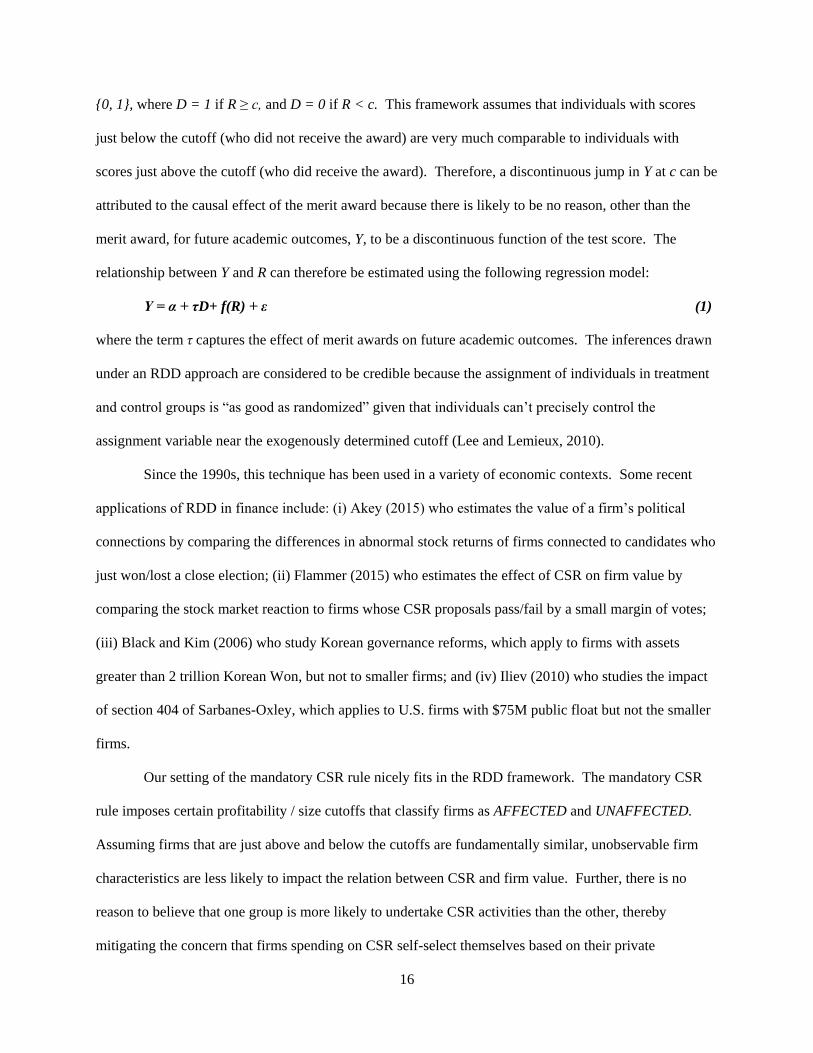
{0, 1}, where D = 1 if R ≥ c, and D = 0 if R < c. This framework assumes that individuals with scores
just below the cutoff (who did not receive the award) are very much comparable to individuals with
scores just above the cutoff (who did receive the award). Therefore, a discontinuous jump in Y at c can be
attributed to the causal effect of the merit award because there is likely to be no reason, other than the
merit award, for future academic outcomes, Y, to be a discontinuous function of the test score. The
relationship between Y and R can therefore be estimated using the following regression model:
Y = α + τD+ f(R) + ε (1)
where the term τ captures the effect of merit awards on future academic outcomes. The inferences drawn
under an RDD approach are considered to be credible because the assignment of individuals in treatment
and control groups is “as good as randomized” given that individuals can’t precisely control the
assignment variable near the exogenously determined cutoff (Lee and Lemieux, 2010).
Since the 1990s, this technique has been used in a variety of economic contexts. Some recent
applications of RDD in finance include: (i) Akey (2015) who estimates the value of a firm’s political
connections by comparing the differences in abnormal stock returns of firms connected to candidates who
just won/lost a close election; (ii) Flammer (2015) who estimates the effect of CSR on firm value by
comparing the stock market reaction to firms whose CSR proposals pass/fail by a small margin of votes;
(iii) Black and Kim (2006) who study Korean governance reforms, which apply to firms with assets
greater than 2 trillion Korean Won, but not to smaller firms; and (iv) Iliev (2010) who studies the impact
of section 404 of Sarbanes-Oxley, which applies to U.S. firms with $75M public float but not the smaller
firms.
Our setting of the mandatory CSR rule nicely fits in the RDD framework. The mandatory CSR
rule imposes certain profitability / size cutoffs that classify firms as AFFECTED and UNAFFECTED.
Assuming firms that are just above and below the cutoffs are fundamentally similar, unobservable firm
characteristics are less likely to impact the relation between CSR and firm value. Further, there is no
reason to believe that one group is more likely to undertake CSR activities than the other, thereby
mitigating the concern that firms spending on CSR self-select themselves based on their private
17
information about future profitability, as suggested by Lys, Naughton and Wang (2015). Therefore, any
differences in the stock market reaction around key events related to the passage of mandatory CSR rule,
as measured by CAR, for the two groups of firms ( i.e. AFFECTED and UNAFFECTED) can thus be
attributed to the mandatory CSR rule that creates the discontinuity.
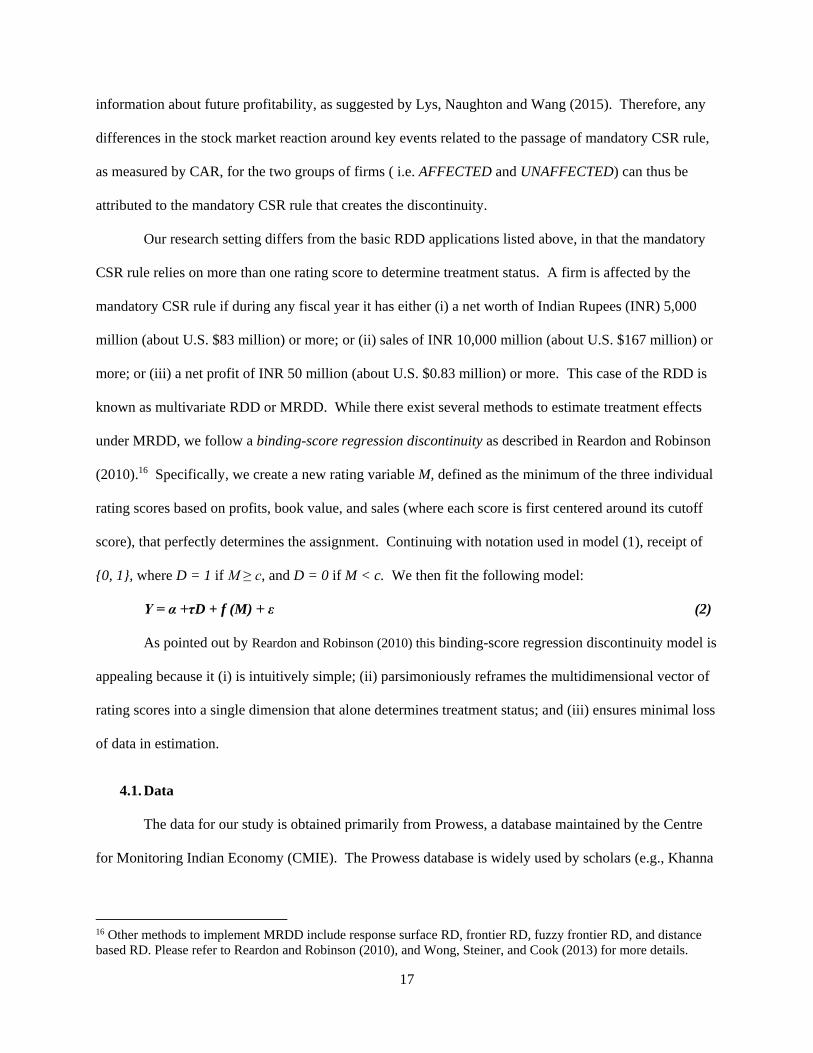
Our research setting differs from the basic RDD applications listed above, in that the mandatory
CSR rule relies on more than one rating score to determine treatment status. A firm is affected by the
mandatory CSR rule if during any fiscal year it has either (i) a net worth of Indian Rupees (INR) 5,000
million (about U.S. $83 million) or more; or (ii) sales of INR 10,000 million (about U.S. $167 million) or
more; or (iii) a net profit of INR 50 million (about U.S. $0.83 million) or more. This case of the RDD is
known as multivariate RDD or MRDD. While there exist several methods to estimate treatment effects
under MRDD, we follow a binding-score regression discontinuity as described in Reardon and Robinson
(2010).16 Specifically, we create a new rating variable M, defined as the minimum of the three individual
rating scores based on profits, book value, and sales (where each score is first centered around its cutoff
score), that perfectly determines the assignment. Continuing with notation used in model (1), receipt of
{0, 1}, where D = 1 if M ≥ c, and D = 0 if M < c. We then fit the following model:
Y = α +τD + f (M) + ε (2)
As pointed out by Reardon and Robinson (2010) this binding-score regression discontinuity model is
appealing because it (i) is intuitively simple; (ii) parsimoniously reframes the multidimensional vector of
rating scores into a single dimension that alone determines treatment status; and (iii) ensures minimal loss
of data in estimation.
4.1. Data
The data for our study is obtained primarily from Prowess, a database maintained by the Centre
for Monitoring Indian Economy (CMIE). The Prowess database is widely used by scholars (e.g., Khanna
16 Other methods to implement MRDD include response surface RD, frontier RD, fuzzy frontier RD, and distance
based RD. Please refer to Reardon and Robinson (2010), and Wong, Steiner, and Cook (2013) for more details.

18
and Palepu 2000; Bertrand, Mehta, and Mullainathan 2002; Gopalan, Nanda, and Seru 2007) to conduct
large sample studies on Indian firms. Our sample comprises of firms with non-missing data on total
assets, sales, net income, book value of equity, and market capitalization. We also require a firm to have
stock return data around key event dates related to the passage of the Companies Act. These data
restrictions yield a sample of 2,120 unique firms. We hand collect the data on CSR from the annual
reports of these firms. To keep the data collection effort manageable, we gather detailed information on
the nature of CSR activities as well as the amount spent on CSR for the year 2012 - the most recent fiscal
year before the passage of the Companies Act. For the years 2008-2011 when the Act was under various
stages of deliberations, we just record whether a firm spends on CSR or not.
Table 1 describes the composition of our sample. During 2012, in a full sample of 2,120 firms,
1,237 (58%) firms meet the profitability/size/net worth thresholds mentioned in the Companies Act and
hence are likely to be affected by the CSR norms in future. The remaining 883 firms (41%) in our sample
are not affected by the CSR rule. We label these two groups of firms as AFFECTED, and
UNAFFECTED. Of these AFFECTED firms, 458 firms currently spend funds on CSR whereas 779 firms
do not spend anything on CSR. Panel A presents the descriptive statistics on the amount of CSR spent by
the AFFECTED firms. The median amount spent on CSR is INR 3.02 million (approx. $50,333) which is
roughly 0.37% of the average of last three years net income. The 75th percentile for CSR spending as a
proportion of net income is 1.31%. These statistics suggest that a majority of firms currently do not
spend funds on CSR and those that do, spend well below the proposed 2% level.
Panel B provides details on the type of CSR activity undertaken by these firms. We hand-collect
this information from the annual report or CSR reports of these firms. Almost all of these firms undertake
multiple CSR related activities. The most common areas where firms focus their CSR spending are
related to community welfare, education, environment, and health care. These areas of spending are
mostly in line with the type of CSR activities listed in the mandatory CSR rule. Panel C presents the
industry wise distribution of our sample. Business services, chemicals, construction, textile, and
wholesale industries have the largest presence among the AFFECTED firms.

19
5. RESULTS
5.1. RDD estimate of the effect of mandatory CSR on firm value
5.1.1. Verifying assumptions underlying RDD
To implement the RDD, we focus on firms that are just below and just above the cutoff.
Specifically, we select firms whose binding score rating variable M (as defined in section 4.1) ranges
between -0.50 to + 0.50. Hereafter, we refer to this subsample as the RDD sample. Consistent with the
best practices recommended by Lee and Lemieux (2008), we begin by testing two crucial assumption of
RDD. The first assumption is that individuals can’t precisely manipulate the rating variable and hence
can’t select themselves into the treatment and control groups. For example, if firms systematically
manage earnings downwards to report earnings below INR 50 million and avoid the compliance with the
mandatory CSR rule, then inferences based on RDD would be invalid because the assignment of firms in
the treatment and control groups is not as good as randomized. To examine this possibility, we graph the
frequency of firms around the profits, book value, and sales cut offs prescribed in the CSR rule for the
year 2009 and the year 2013. In the year 2009 there was no information about the mandatory CSR rule,
whereas in the year 2013 the guidelines for mandatory CSR were well known. Any abnormal jump
(drop) in the frequency of firms just to the left (right) of the cutoff in the year 2013, relative to the year
2009 would suggest that firms deliberately manipulated their profits / book value of equity/ sales to avoid
potential compliance with the mandatory CSR rule. Figures 1a – 1f show no such jumps or drops in the
frequency of firms. Further, in our setting, three different cutoffs determine the assignment into the
treatment group. Hence, the likelihood that a firm will simultaneously manipulate all the three different
thresholds to avoid compliance with the mandatory CSR rules, is relatively low.
Another important aspect of the RDD is that for this approach to work, all other factors that
determine the dependent variable (CAR in our case), must also evolve smoothly with respect to the rating
variable. If the other variables also show a discontinuity at the cutoff, then the estimated treatment effect
of the intervention will be biased. In order to test the validity of this assumption, we compare the mean
and median values of the various characteristics of AFFECTED and UNAFFECTED firms of the RDD
20
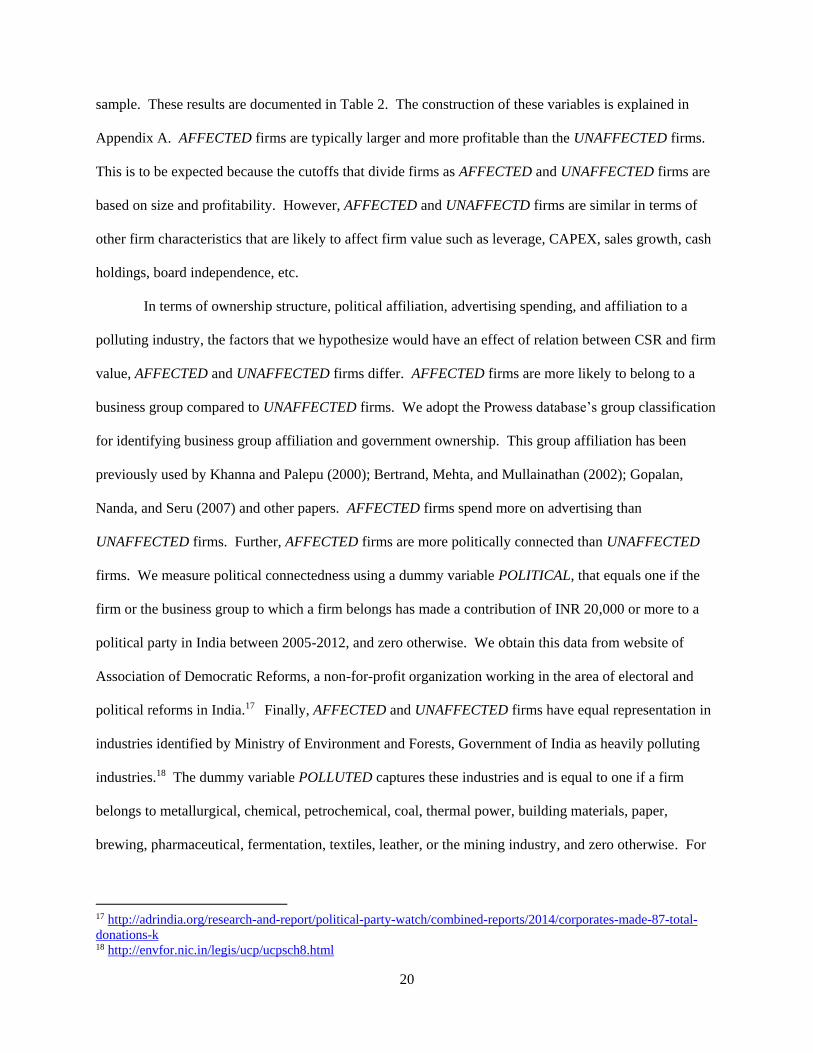
sample. These results are documented in Table 2. The construction of these variables is explained in
Appendix A. AFFECTED firms are typically larger and more profitable than the UNAFFECTED firms.
This is to be expected because the cutoffs that divide firms as AFFECTED and UNAFFECTED firms are
based on size and profitability. However, AFFECTED and UNAFFECTD firms are similar in terms of
other firm characteristics that are likely to affect firm value such as leverage, CAPEX, sales growth, cash
holdings, board independence, etc.
In terms of ownership structure, political affiliation, advertising spending, and affiliation to a
polluting industry, the factors that we hypothesize would have an effect of relation between CSR and firm
value, AFFECTED and UNAFFECTED firms differ. AFFECTED firms are more likely to belong to a
business group compared to UNAFFECTED firms. We adopt the Prowess database’s group classification
for identifying business group affiliation and government ownership. This group affiliation has been
previously used by Khanna and Palepu (2000); Bertrand, Mehta, and Mullainathan (2002); Gopalan,
Nanda, and Seru (2007) and other papers. AFFECTED firms spend more on advertising than
UNAFFECTED firms. Further, AFFECTED firms are more politically connected than UNAFFECTED
firms. We measure political connectedness using a dummy variable POLITICAL, that equals one if the
firm or the business group to which a firm belongs has made a contribution of INR 20,000 or more to a
political party in India between 2005-2012, and zero otherwise. We obtain this data from website of
Association of Democratic Reforms, a non-for-profit organization working in the area of electoral and
political reforms in India.17 Finally, AFFECTED and UNAFFECTED firms have equal representation in
industries identified by Ministry of Environment and Forests, Government of India as heavily polluting
industries.18 The dummy variable POLLUTED captures these industries and is equal to one if a firm
belongs to metallurgical, chemical, petrochemical, coal, thermal power, building materials, paper,
brewing, pharmaceutical, fermentation, textiles, leather, or the mining industry, and zero otherwise. For
17 http://adrindia.org/research-and-report/political-party-watch/combined-reports/2014/corporates-made-87-total-
donations-k 18 http://envfor.nic.in/legis/ucp/ucpsch8.html

21
these four variables, we further test if there is indeed a jump in the covariates at the cutoffs. We find no
such jumps at the cutoffs.19 These results give us comfort to proceed with the RDD estimation.
5.1.2. Univariate results
In Table 2, we report median cumulative abnormal returns (CAR) for the AFFECTED and the
UNAFFECTED firms in the RDD subsample, around the each of the eight key legislative events related
with the passage of the Companies Act 2013, as outlined in section 2. We measure abnormal returns by
estimating the market model using two hundred trading days of return data ending 11 days before the
legislative event. The return on CNX 500 index is used as a proxy for the market return. 20 Daily
abnormal stock returns are cumulated to obtain the cumulative abnormal return (CAR) from day t-1
before the legislative event date to day t+1 after the event date.
There is no significant market reaction for the first event i.e., when the Bill was introduced for the
first time in the Lok Sabha (lower house of the Indian Parliament). This outcome is not surprising
because the initial version of the Bill contained no clause related to CSR. The insignificant result (which
is akin to a placebo test) mitigates the possibility that some unobserved firm characteristics drive the
differences in CAR for the two sub-samples.
The second and third events are very important in the context of our study because these events
had news related to only to the CSR aspect of the Companies Act. As discussed in section 2, the
parliamentary standing committee on finance vetted the initial version of the Companies Act and inserted
a mandatory CSR clause. This new rule was a totally unexpected addition to the Act. We find a
significant negative market reaction to this news for the AFFECTED (-2.3%) firms but a slightly positive
reaction for the UNAFFECTED firms (0.3%). When the Ministry of Corporate Affairs announced that it
is considering making only the disclosure of CSR and not the actual spending on CSR mandatory, we
19 We have not tabulated these results, but these are available upon request. 20 CNX 500 is a broad based benchmark of the Indian capital market. It comprises of 500 firms that represents about
96% of the free float market capitalization of the stocks listed on National Stock Exchange of India (NSE). More
details can be found at http://www.nseindia.com/products/content/equities/indices/cnx_500.htm

22
don’t observe any significant market reaction (although we expected a positive market reaction for the
AFFECTED firms around this event).
We also find a statistically significant negative reaction for the AFFECTED (-1.6%) firms when
the Lok Sabha (the lower house of the Indian Parliament) passed the Companies Act. However, the other
key events such as the re-introduction of the Bill in the Lok Sabha, the passage of this Bill in the Rajya
Sabha (the upper house of the Indian Parliament), and the Presidential assent to the Bill are associated
with a statistically insignificant market reaction for the AFFECTED firms. Overall, these results provide
initial evidence of a negative impact of mandatory CSR on shareholder value.
5.1.3. Graphical analysis
Graphs provide a transparent way of showing how the treatment effect is identified in a RDD
framework. Hence, for each of the eight event dates outlined previously, we plot the stock market
reaction for firms in the RDD sample. On the X-axis is the binding score rating variable (M, in this case)
which is ranges from -0.50 to 0.50. On the Y axis is the three day cumulative abnormal return (CAR)
around the event date. Following, Lee and Lemieux (2008) we divide the rating variable M into a number
of bins. The average value of the outcome variable, CAR, is then calculated for each bin and plotted
against the mid-points of the bin. In this approach, choosing the width of the bin becomes crucial. The
bandwidth has to be wide enough to have precise enough estimates that would give smooth plots on either
side of the cutoff value, yet at the same time, narrow enough to make the jump around the cutoff value
clear. To enhance the visual impact of the graph, local polynomial regressions are estimated on both
sides of the cutoff and fitted values of Y are super-imposed on the plot. The jump (or drop) in the fitted
curve at the cutoff point captures the treatment effect.
We use the RDPLOT and RDROBUST commands of STATA, developed in Calonico, Cattaneo,
and Titiunik (2014) to generate these graphs and to determine the treatment effect. Figures 2(a) through
(2h) relate to each of the eight event dates. In all these graphs, we assume the relationship between CAR
and M to be that of a third order polynomial function. The number of bins used to determine the
23
treatment effect is determined by a mimicking variance evenly spaced method using spacing estimators
(default option). Hence, the number of bins in each graph varies slightly.21 For the sake of parsimony,
we describe only two graphs in the text. Graph 2(a) relates to the event date August 03, 2009. There are
13 bins on each side of the cutoff. Third order polynomial regressions are estimated on both sides of the
cutoff and fitted values of CAR are superimposed on the plot. There is no significant jump or drop at the
cutoff point suggesting that average CAR for the AFFECTED and UNAFFECTED firms on this date is
statistically indistinguishable. Graph 2(b) relates to the event date August 31, 2010. There are 14 bins on
each side of the cutoff. At the cutoff point, the fitted curve on the right is significantly lower that the
fitted curve to the left. The only difference near the cutoff is that firms to the right of zero are
AFFECTED by CSR rule whereas firms to the left of zero are UNAFFECTED. Hence, this discontinuous
drop in the fitted curve (that captures firm value) at the threshold can be attributed to the mandatory CSR
rule which imposes the cutoff and creates the discontinuity.
The magnitude of the treatment effect, as reflected in these graphs, is summarized in Table 4.
There is a significant negative market reaction around August 31, 2010, the date when the parliamentary
standing committee on finance inserted a mandatory CSR clause in the Companies Act. The CAR for
AFFECTED firms is 2.6% lower than the UNAFFECTED firms. Similarly, there is a significant negative
market reaction around December 18, 2012, the date when the Lok Sabha (lower house of the Indian
Parliament) passed the Companies Act. The CAR for AFFECTED firms is 1.9% lower than the
UNAFFECTED firms. We do not find a statistically significant difference in the market reaction for
AFFECTED and UNAFFECTED firms for other events.
5.1.4. Parametric estimation
We expand the basic RDD framework to incorporate other factors that affect stock market
reaction and estimate the following regression equation:
���������∗ ��������+��∗ ��������+����^� +
21 Our results are robust to the choice of number of bins, polynomial order (1-4), and kernel (triangular or
rectangular) for local polynomial regression models.

24
�����+�����������+ � (3
This pooled regression is estimated over all the event dates. The dependent variable CAR is the
�� which captures the differential stock market reaction for the AFFECTED firms relative to the
UNAFFECTED firms on a given event date. The overall differential market reaction for the AFFECTED
���. The ��coefficients capture the nonlinearity in the relationship between CAR and the rating variable
�� coefficients reflects the relationship between CAR and the three rating scores R based on profits, book
coefficient captures the differential relationship between the binding score rating variable M and CAR in
the AFFECTED firms. These terms are included in the model following standard RDD practices, as
suggested in Lee and Lemieux (2008).
The regression model includes several control variables. Following Fama and French (1992), we
include firm size and book-to market ratio in the model and expect negative and positive coefficients on
these variables respectively. The mandatory CSR rule is a part of an overall Companies Act 2013. We
control for three important provisions of this Act that relate to board independence and audit quality
(proxied by a Big 4 auditor), and enhanced creditor rights (proxied by leverage). These regulatory
requirements can either impose additional costs on the firms or result in benefits due to better monitoring.
Hence, we do not make any predictions about the expected sign of coefficients on these variables. We
acknowledge that capturing all the provisions of the Companies Act that are value relevant is difficult and
hence there are genuine concerns about omitted correlated variables. However, it is important to
emphasize, that except for the mandatory CSR rule, all the provisions of the Companies Act 2013 apply
to all firms uniformly, regardless of whether they fall in the AFFECTED or UNAFFECTED categories.
Hence, the differential stock price reactions for these three categories of firms can potentially be
attributed to the mandatory CSR rule.
We also include dummy variables in the model that indicate whether a firm belongs to a business
group, is foreign owned, or is Government owned. These ownership structures, especially in the context
of India, can affect firm performance and governance (Khanna and Palepu 2000; Bertrand, Mehta, and
Mullainathan 2002; Gopalan, Nanda, and Seru 2007) and hence could also affect the market reaction to
25
the mandatory CSR rule. Finally, we include industry dummy variables to overcome the problem
associated with cross-sectional correlations in the individual firm returns that will arise given that the
event period is common to all firms in our sample. Event time dummies are also included to control for
firm-invariant time specific effects.
Table 5 presents the results from estimating equation (3). Column (1) reports results from the
estimation of reduced form model without control variables, column (2) shows results from the full model
with control variables, and column (3) enhances the model in column (2) by introducing firm fixed
�2, and �6 are negative and statistically significant suggesting that AFFECTED firms experienced a
negative stock market reaction when the Parliamentary Standing Committee on Finance inserted a
mandatory CSR clause in the initial version of the Companies Act, and the Bill was passed in the Lok
��coefficients are insignificant suggesting that there is no nonlinearity in the relationship between CAR
and the binding score rating variable M. Further, the rating score M is also not differentially associated
�1and �2 coefficients are also insignificant indicating that the three individual rating scores R, based on
profits and book value that separate the firms as AFFECTED and UNAFFECTED, are unrelated with
�3 coefficient is significant and negative suggesting that the farther the firm is from the sales based cutoff
for the applicability of mandatory CSR rule, the more negative is the CAR. In terms of control variables,
none of these is significantly associated with CAR. This is to be expected because RDD assumes that the
treatment and control firms are all but similar except for the intervention that creates the discontinuity.
Collectively, our results suggest that the mandatory CSR rule has a negative impact on the equity
value of the AFFECTED firms. In terms of economic significance of these results, overall we find that
��� in column 1) lower than the CAR for UNAFFECTED firms. Given that the mandatory CSR rule
directs that a firm has to spend 2% of its profits on CSR, diverting 2% of profits away from the positive
22 Tax deductibility of CSR expenses was unclear at the time the mandatory CSR rule was being debated in
Parliament (Chugh, 2014) http://archive.financialexpress.com/story-print/1231302. If mandatory CSR is not tax
deductible then under the shareholder expense view of CSR, diverting 2% of profits away from the positive NPV
projects of a firm should theoretically reduce the firm value by around 2%. If this expense is tax deductible then
reduction in the firm value will be around 1.4% (assuming a 30% tax rate).
26
��� is not statistically different from the theoretical prediction of 2% reduction in firm value at
conventional significance levels. Our interviews with Chief Financial Officers (CFOs) of several large
Indian firms in the treatment sample reveal that, in addition to the direct cash flow effects of mandatory
CSR rule, the stock market reaction might potentially capture indirect costs such as (i) the diversion of
scarce managerial time and effort to comply with regulation; (ii) the possibility of greater government
intervention in determining where the CSR money should be spent; (iii) the dilution of the benefits of
strategic CSR spending by channeling funds from say CSR aimed at recruiting talented employees to
CSR that does not fetch benefits to the firm; and (iv) potential diversion of funds provisioned for the CSR
activities to trusts owned by the promoters or the insiders of the firm.
5.1.5. Cross sectional variation
Next, we focus on the cross-sectional variation in the market reaction to the mandatory CSR rule
for the AFFECTED firms. Specifically, we examine four dimensions – business group affiliation (our
proxy for agency costs), political connectedness, consumer awareness, and environmental impact—
hypothesized by prior work to affect the efficacy of CSR spending. To test these predictions we expand
model (3) and estimate the following specification
���������∗ �������� +���������∗ ��������∗ ���������
����^� + �����+�����������+ �
(4)
In particular, we estimate four different versions of this model where VARIATION refers to BG
(the business group affiliation), POLITICAL (political connectedness), AD (advertisement intensity), and
POLLUTED (affiliation to a highly polluting industry), respectively. Other terms of the model are same
as previously described for model (3).
Results from estimating the model (4) are tabulated in Table 6. In column (1), we consider the
impact of business group affiliation (our proxy for agency costs) on the relation between CSR spending
�� coefficients suggesting that the negative relation between CSR and shareholder value is mitigated in
�� coefficient is positive and significant on some event dates while it is negative and significant on other

27
event dates. These inconsistent signs make it difficult for us to draw any meaningful inferences on the
�� coefficients, suggesting that a firm’s advertisement spending mitigates the negative relation between
�� coefficients suggesting that negative relation between CSR spending and shareholder value is more
pronounced in firms that belong to a highly polluting industry. For brevity, we do not report and discuss
the coefficient estimates on control variables for this table.
5.2. Generalizability of results on a broader sample
While the inferences based on RDD are considered to be highly credible, they come at a cost.
These inferences are valid for only the sub-sample of firms that are very near the thresholds creating the
discontinuity. However, these inferences might not be generalizable once we move away from these
thresholds. To broaden the scope of our study, we look at all the firms listed on the National Stock
Exchanges of India with available accounting and stock return data and we estimate a modified version
model (3) on the full sample. Specifically we estimate
���������∗ ��������+�����������+ �
(5)
The results from estimating model (5) are presented in Table 7. Column (1) shows results of
estimating the model without firm fixed effects, and column (2) shows results from estimating the full
�� coefficients are negative and significant in all but one event suggesting that AFFECTED firms
experienced a negative stock market reaction, compared to the UNAFFECTED firms on these dates.
These results suggest that the negative effect of mandatory CSR rule on shareholder value is not just
limited to the RDD subsample. They are seen in the much broader sample as well.
5.3. Analysis using Tobin’s Q as a measure of firm value
While the previous sub-sections looked at announcement period returns, in this section, we
consider the effect of the mandatory CSR rule on firm value in the longer run, as proxied by Tobin’s Q
ratio, using the RDD based sample discussed earlier. We assess whether the mandatory CSR rule leads to
a decline in value for the AFFECTED firms, right at the time the rule was adopted. If investors consider

28
CSR activities to be detrimental to firm value, then the value of AFFECTED firms should decline, relative
to that of UNAFFECTED firms, in the years when the likelihood of the passage of mandatory CSR rule
increased, controlling for other factors that affect firm value. We estimate the following equation to test
this prediction:
�= �+��������∗ ��������+��∗ ��������+����^� +
�����+���△��������+ � (6)
Following prior research on firm value and governance (e.g. Black and Kim 2012; Ahern and
Dittmar 2012), we use Tobin’s Q as our main measure of firm value. Tobin’s Q is calculated as the sum
of total assets and market value of equity less common book equity, divided by total assets. We consider
the natural log of Tobin’s Q to address the skewness in non-logged values and use a changes
specification. Our CAR results indicate that the most important event dates in our study are in the fiscal
year 2011 and 2013. Hence we expect negative coefficients on the interaction terms of the following
dummy variables: YEAR2011*AFFECTED, and YEAR2013*AFFECTED. We make no predictions about
the signs of coefficients for other interaction terms. We further control for firm specific characteristics
such as size, leverage, growth opportunities, profitability, liquidity, ownership structure, board
independence, and the presence of Big 4 auditor, that are known to affect firm value.
Table 8 presents results from our analysis of changes in Tobin’s Q ratio. Panel A shows
univariate results and indicates that over the time period 2010-2013, the mean (median) decline in the
Tobin’s Q of AFFECTED firms is 4.8% (13.7%). Panel B shows the results from estimating model (6).
While column 1 shows the estimation results with industry fixed effects, column 2 includes firm fixed
effects. Across all these columns, the coefficients on the interaction terms YEAR2011*AFFETCED and
YEAR2013*AFFECTED are negative and significant. Similar to previously documented results, the
economic magnitude of these coefficients is much larger than expected. The sign on coefficient estimates
for the firm-specific control variables are consistent with prior research (e.g. Black and Kim 2012).
Specifically, we find that leverage and liquidity are positively associated with Tobin’s q ratio, whereas
firm size and business group affiliation (proxy for agency costs) are negatively associated with Tobin’s q

29
ratio. Overall, the results of this section indicate that during the years 2011 and 2013, which coincide
with a greater likelihood of the passage of the mandatory CSR rules, firms affected by the mandatory
CSR rule experienced a decline in the Tobin’s Q ratio, relative to the unaffected firms.
5.4. Additional tests and robustness checks
In our additional analysis, we test whether the impact of mandatory CSR rule on shareholder
value varies depending on the financial reporting quality of a firm. It can be argued that official guidance
related to the implementation of the mandatory CSR rule is still emerging and not fully finalized. For
example, the Companies Act does not define CSR; rather the Act lays out a list of possible activities that
would be considered CSR. Further, the mandatory CSR rule is a “comply or explain” rule. Hence firms
can potentially game the system and meet the requirements by changing their reporting techniques or by
reclassifying activities they are already undertaking as CSR activities. If that is the case, the market
reaction for firms that are more likely to be window dressers is likely to be different from the market
reaction for other firms. We classify firms with a higher value of discretionary accruals (either signed or
unsigned), calculated following the modified Jones (1991) model and/or higher frequency of related party
transactions (as suggested by Bertrand, Mehta, and Mullainathan, 2002), as the ones that are more likely
to window-dress. Our un-tabulated results show that there is no cross sectional variation in the stock
price reaction for the AFFECTED, and UNAFFECTED firms depending on the level of discretionary
accruals and/or frequency of related party transactions.
We also conduct several robustness tests to assess the sensitivity of our results. In the event study
/ CAR analysis we obtain similar results if we: (i) use buy-and-hold returns for the event window instead
of summing daily abnormal returns; (ii) use COSPI index and MSCI emerging market index instead of
CNX500 index as the proxy for market returns while estimating the market model to calculate abnormal
returns23; (iii) use market adjusted returns to capture abnormal returns instead of using the market model;
(iv) change the event window to (-5,+5), (-2,+2), or (0,+2) instead of (-1,+1) while calculating cumulative
23 COSPI is the CMIE’s Overall Share Price Index (COSPI) that comprises of all the stocks in the CMIE universe.
30
abnormal returns; and (v) exclude the outliers instead of winsorizing them at 1% and 99%. We also
obtain similar results in Table 8 if we estimate the regressions on a balanced panel where the same
number of firms are present throughout the event period.
6. CONCLUSION
This paper examines the effect of CSR activities on shareholder value. Our identification comes
from a natural experiment consisting of a unique regulatory change in India that makes it mandatory for
firms to spend 2% of their profits on CSR if their profits/ book value / sales exceed certain threshold.
This natural experiment enables us to identify how stock market participants, in aggregate, view the
average effect of mandatory CSR activities on shareholder value.
We find that the cumulative abnormal return (CAR) around key events leading to the passage of
the mandatory CSR rule is negative for firms affected by this regulation. We also find that compared to
firms unaffected by the mandatory rule, firms affected by the mandatory CSR rule experience a greater
decline in Tobin’s q ratio in the years when the likelihood of the passage of mandatory CSR rule
increased. Overall, our evidence suggests that mandatory CSR activities can impose social burdens on
business activities at the expense of shareholders. Our findings also indicate that firms, left to their own
devices, choose their optimal level of CSR spending designed to maximize their firm value. Hence,
future research might want to be cautious about drawing causal inferences from associations of corporate
outcomes and CSR spending.
Like any study that exploits an exogenous shock set in a particular institutional context, our
setting suffers from potential limitations. First, the treatment studied is a mandatory requirement to invest
in CSR to the tune of 2% of profits and, failing that, to explain non-compliance. Given the comply-or-
explain nature of the law, we may have effectively documented the effect of having to explain why the
firm does not comply. Second, voluntary CSR may be different in nature relative to the effects from the
CSR activities prescribed by the Indian Companies Act 2013. Third, it’s possible that there is value to
requiring CSR expenditures, but the 2% requirement is too onerous, or that it is not high enough.

31
While the findings of this study are specific to India, they are potentially relevant to the policy
debate of other emerging economies which are experiencing unprecedented CSR initiatives by their
regulators due to concerns related to unequal economic growth and environmental abuses. An important
caveat of our study is that our analysis does not explore the social welfare implications of the mandatory
CSR rule. Therefore, our study is not a verdict on regulatory reforms related to CSR, which is inherently
a social welfare decision and involves numerous stakeholders, apart from shareholders. Whether
mandatory CSR achieved its objective of social welfare is an important question we intend to study in
future work.
32
REFERENCES
Ahern, K.R., Dittmar, A.K. 2012. The changing of the boards: the impact on firm valuation of mandated
female board representation. The Quarterly Journal of Economics, 127, 137-197.
Akey, P., 2015. Valuing changes in political networks: evidence from campain contributions to close
congressional elections. The Review of Financial Studies forthcoming.
Atanasov, V., Black, B. 2014. Shock-based causal inference in corporate finance research. Available at
http://ssrn.com/abstract=1718555.
Baron, D.P. 2001. Private politics, corporate social responsibility, and integrated strategy. Journal of
Economics and Management Strategy, 10, 7-45.
Benabou, R., Tirole, J. 2010. Individual and corporate social responsibility. Economica, 77, 1-19.
Bertrand, M., Mehta, P., Mullainathan, S. 2002. Ferreting out tunneling: an application to Indian business
groups. Quarterly Journal of Economics, 117, 121-148.
Black, B.S., Khanna, V.S. 2007. Can corporate governance reforms increase firm market values? Event
study evidence from India. Journal of Empirical Legal Studies, 4, 749-796.
Black, B.S., Kim, W. 2006. The effect of board structure on firm value: A multiple identification
strategies approach using Korean data. Journal of Financial Economics, 104, 203-226.
Calonico, S., Cattaneo, M. D., Titiunik, R. 2014a. Robust nonparametric confidence intervals for
regression-discontinuity designs. Econometrica 82, 2295–2326.
Calonico, S., Cattaneo, M. D., Titiunik, R. 2014b. Robust data-driven inference in the regression-
discontinuity design. The Stata Journal 14(4), 909-946.
Cheng, B., Ioannou, I., Serafeim,G. 2014. Corporate social responsibility and access to finance. Strategic
Management Journal, 35, 1-23.
Cheng, H., Hong, H., Shue, K., 2013. Do managers do good with other peoples money? Available at
SSRN:http://ssrn.com/abstract=1962120
Chugh, R. 2014. Tax twists in CSR spends. Financial Express. Available at
http://archive.financialexpress.com/story-print/1231302.
Coase, R.H. 1937. The nature of the firm. Economica 4, 386-405.
Cochran, P.L., Wood, R.A. 1984. Corporate social responsibility and financial performance. Academy of
management Journal, 27, 42-56.
Cronqvist, H., Heyman, F., Nilson, M., Svaleryd, H., Valchos, J. 2009. Do entrenched managers pay their
workers more? The Journal of Finance 64, 309-339.
Demsetz H., Lehn, K. 1985. The structure of corporate ownership: Causes and consequences. Journal of
Political Economy, 93, 1155–1177.

33
Deng, X., Kang, J., Low, B.S. 2013. Corporate social responsibility and stakeholder value maximization:
Evidence from mergers. Journal of Financial Economics 110, 87-109.
Dhaliwal, D.S., Li, O.Z., Tsang, A., Yang, Y.G. 2011. Voluntary nonfinancial disclosure and the cost of
equity capital: The initiation of corporate social responsibility reporting. The Accounting Review, 86, 59-
100.
Di Giuli.A., and Kostovetsky, L. 2014. Are red or blue companies more likely to go green? Politics and
corporate social responsibility. Journal of Financial Economics 111, 158-180.
Faccio, M. 2006. Politically connected firms. The American Economic Review, 96, 369-386.
Fama, E.F., French, K.R. 1992. The cross‐section of expected stock returns. The Journal of Finance, 47,
427-465.
Fisman, R., Heal, G., Nair, V.B. 2008. A model of corporate philanthropy. Working paper, Columbia
University.
Flammer, C., 2015. Does corporate social responsibility lead to superior financial performance? A
regression discontinuity approach. Management Science forthcoming.
Fombrun, C.J. 2005. Building corporate reputation through CSR initiatives: Evolving standards.
Corporate Reputation Review, 8, 7–11.
Freeman, R.E. 1984. Strategic management: A stakeholder approach. Boston: Pittman-Ballinger
Friedman, M. 1970. The social responsibility of business is to increase its profits. The New York Times,
September 13, 32-33 & 122&126
Godfrey, P.C. 2005. The relationship between corporate philanthropy and shareholder wealth: A risk
management perspective. Academy of Management Review 30, 777-798.
Gopalan, R., Nanda, V., Seru, A. 2007. Affiliated firms and financial support: Evidence from Indian
business groups. Journal of Financial Economics 86, 759-795.
Greening, D.W., Turban, D.B. 2000. Corporate social performance as a competitive advantage in
attracting a quality workforce. Business & Society 39, 254-280.
Griffin, J.J., Mahon, J.F. 1997. The corporate social performance and corporate financial performance
debate twenty-five years of incomparable research. Business & Society, 36, 5-31.
Himmelberg, C.P., Hubbard, R.G, and Palia, D. 1999. Understanding the determinants of managerial
ownership and the link between ownership and performance. Journal of Financial Economics 53, 353-
384.
Hong, H., Kubik, J.D., Scheinkman, J.A. 2012. Financial constraints on corporate goodness. Available at
http://ssrn.com/abstract=1734164
Hung, M., and Wang, Y. "Mandatory CSR disclosure and shareholder value: evidence from china.”
Available at http://ssrn.com/abstract=2206877.

34
Iliev, P. 2010. The effect of SOX Section 404: Costs, earnings quality, and stock prices. The Journal of
Finance 65, 1163-1196.
Imbens, G.W., Lemieux, T. 2008. Regression discontinuity designs: A guide to practice. Journal of
Econometrics 142, 615-635.
Jensen, M.C., Meckling, W.H. 1976. Theory of the firm: Managerial behavior, agency costs, and
ownership structure. Journal of Financial Economics, 3, 305–360.
Khanna, T., Palepu, K. 2000. Is group affiliation profitable in emerging markets? An analysis of
diversified Indian business groups. The Journal of Finance 55, 867-891.
Kitzmueller, M., Shimshack, J. 2012. Economic perspectives on corporate social responsibility. Journal of
Economic Literature 50, 51-84.
Lee, D.S., 2008. Randomized experiments from non-random selection in U.S. House elections. Journal of
Econometrics 142, 675-697.
Lee, D.S., Lemieux, T. 2010. Regression Discontinuity Designs in Economics. Journal of Economic
Literature 48, 281-355.
Lys, T. Z., Naughton, J. P., Wang, C. 2015. Signaling through corporate accountability reporting. Journal
of Accounting and Economics. 60(1): 56-72.
Margolis, J.D., Elfenbein, H.A., Walsh, J.P. 2009. Does it pay to be good…and does it matter? A meta-
analysis of the relationship between corporate social and financial performance. Available
http://ssrn.com/abstract=1866371
Margolis, J.D., Walsh. J.P. 2003. Misery loves companies: Rethinking social initiatives by business.
Administrative Science Quarterly 48, 68-305.
McWilliams A., Siegel D.S. 2001. Corporate social responsibility: A theory of the firm perspective.
Academy of Management Review, 26, 117-127.
Navarro P, 1998. Why do corporations give to charity? The Journal of Business, 61, 65-93
Nichols A., 2007. Causal inference with observational data. The Stata Journal 7, 507-541.
Orlitzky, M., Benjamin, J.D, 2001. Corporate social performance and firm risk: A meta-analytic review.
Business & Society 40, 369-396.
Orlitzky, M., Schmidt, F.L., Rynes, S.L. 2003. Corporate social and financial performance: A meta-
analysis. Organization studies 24, 403-441.
Pagano, M., Volpin, P.F. 2005. The political economy of corporate governance. American Economic
Review, 95 1005-1030.
Reardon, S.F., Robinson, J.P. 2012. Regression discontinuity designs with multiple rating-score variables. Journal of Research on Educational Effectiveness 5(1), 83-104

35
Reinhardt, F.L., Stavins, R.N., Vietor, R.H.K. 2008. Corporate social responsibility through an economic
lens. Review of Environmental Economics and Policy 2, 219-239.
Roberts, M.R., Whited, T.M. 2012. Endogeneity in empirical corporate finance. Available at SSRN:
http://ssrn.com/abstract=1748604
Sen, S., Bhattacharya, C.B. 2001. Does doing good always lead to doing better? Consumer reactions to
corporate social responsibility. Journal of marketing Research 38, 225-243.
Servaes, H., Tamayo, A. 2013. The impact of corporate social responsibility on firm value: The role of
customer awareness. Management Science 59, 1045-1061.
Shleifer, S., Vishny, R.W. 1994. Politicians and firms. The Quarterly Journal of Economics, 109, 995-
1025.
Stein, J. C. 1988. Takeover threats and managerial myopia. Journal of Political Economy 96(1): 61-80.
Surroca, J., Tribó, J.A. 2008. Managerial entrenchment and corporate social performance. Journal of
Business Finance & Accounting 35, 748-789.
Thistlethwaite, D.L., Campbell, D.T., 1960. Regression discontinuity analysis-: an alternate to the ex-post
facto experiment. Journal of Educational Psychology, 51(6)- 309-317.
Tirole, J., 2001. Corporate governance. Econometrica 69, 1-35.
Wong,V.C., Steiner,P.M., Cook.T.D. 2013. Analyzing regression-discontinuity designs with multiple
assignment variables: a comparative study of four estimation methods. Journal of Educational and
Behavioral Statistics 38(2), 107-141.

36
Appendix A: Variable definitions
AFFECTED indicator variable that equals one if the firm is required to spend on CSR activities
under the new mandatory CSR rule of the Companies Act 2013
UNAFFECTED indicator variable that equals one if the firm is not affected by the new mandatory
CSR rule, and zero otherwise
CAR Cumulative abnormal returns where we measure abnormal returns by estimating the
market model using two hundred trading days of return data ending 11 days before
key legislative events related to the passage of the Companies Act 2013. The return
on National Stock Exchange’s CNX 500 index is used as a proxy for the market
return. Daily abnormal stock returns are cumulated to obtain the cumulative
abnormal return (CAR) from day t-1 before the legislative event date to day t+1 after
the event date.
Tobin’s Q (book value of total assets + market value of equity -common book equity)/ total
assets
SIZE natural log of the market value of equity ( market value of equity = stock price at the
end of fiscal year * number of shares outstanding)
BM ratio of book value of equity to the market value of equity
LEV long term debt (including its current portion) divided by total assets at the end of
year
SGROWTH sales growth defined as (salest – salest-1)/salest-1
ROA income from continuing operations divided by the total assets at the end of year
CAPEX Capital expenditure during the year / total assets at the end of year
CASH Cash and marketable securities at the end of year / total assets at the end of year
BG Indicator variable that equals one if the firm belongs to a business group as defined
by the Prowess database, and zero otherwise
MNC indicator variable that equals one if the firm is a subsidiary of multinational
corporation, and zero otherwise
GOVT_OWNED indicator variable that equals one if the firm is a owned by the central or a state
Government, and zero otherwise
BOARD_INDPENDENCE number of independent directors on the board / total number of directors on the
board
BIG4 indicator variable that equals one if the firm engages a Big 4 auditor, and zero
otherwise
AD advertisement expenses divided by the sales during the year
POLITICAL indicator variable that equals one if the firm or the business group to which a firm
belongs has made a contribution of INR20,000 or more to a political party in India
between 2005-2012, and zero otherwise.
POLLUTED indicator variable that equals one if the firm belongs to an industry identified by
ministry of environment and forests, Government of India as heavily polluting
industries, and zero otherwise

37
Figure 1: Did firms manipulate profits, book value, or sales to avoid mandatory CSR compliance?
Figure 1a Figure 1b
Figure 1c
Figure 1d
Figure 1e
Figure 1f
Graphs 1a and 1b plot the frequency distribution of firms around the INR50 million profit cutoff; graphs 1c and 1d
plot the frequency distribution of firms around the INR5,000 million book value cutoff; and graphs 1e and 1f plot
the frequency distribution of firms around the INR10,000 million sales cutoff. These profit, book value and sales
cutoffs are imposed by the mandatory CSR rule. Firms with profit, book value, or sales above these cutoffs are
affected by this law and are required to spend on CSR. Graphs to the left (a, c, and e) are based on valued on
08/03/2009, when the information about mandatory CSR rule was unknown, whereas the graphs to the right (b, d,
and f) are based on valued on 08/29/2013, when the information about mandatory CSR rule was known.
05
01
00
150
Fre
que
ncy
-50 0 50 100 150Profit
Distribution of firms around INR 500 million profit cutoff on 08/03/2009
05
01
00
150
Fre
que
ncy
-50 0 50 100 150Profit
Distribution of firms around INR 500 million profit cutoff on 08/29/2013
02
04
06
0
Fre
que
ncy
2000 3000 4000 5000 6000 7000 8000Book value
Distribution of firms around INR 5,000 million book value cutoff on 08/03/2009
02
04
06
0
Fre
que
ncy
2000 3000 4000 5000 6000 7000 8000Book value
Distribution of firms around INR 5,000 million book value cutoff on 08/29/2013
01
02
03
04
0
Fre
que
ncy
5000 7500 10000 12500 15000Sales
Distribution of firms around INR 10,000 million sales cutoff on 08/03/2009
01
02
03
04
0
Fre
que
ncy
5000 7500 10000 12500 15000Sales
Distribution of firms around INR 10,000 million sales cutoff on 08/29/2013

38
Figure 2: CAR around significant CSR events for the RDD sample
Figure 2a Figure 2b
Figure 2c
Figure 2d
Figure 2e
Figure 2f
-.01
-.00
5
0
.00
5.0
1.0
15
-.5 0 .5
Sample average within bin 3th order global polynomial
3 day CAR around 08/03/2009
-.03
-.02
-.01
0
.01
-.5 0 .5
Sample average within bin 3th order global polynomial
3 day CAR around 08/31/2010
-.01
-.00
5
0
.00
5.0
1.0
15
-.5 0 .5
Sample average within bin 3th order global polynomial
3 day CAR around 02/28/2011
-.01
-.00
5
0
.00
5.0
1
-.5 0 .5
Sample average within bin 3th order global polynomial
3 day CAR around 12/14/2011
-.01
0
.01
.02
-.5 0 .5
Sample average within bin 3th order global polynomial
3 day CAR around 06/26/2012
-.02
-.01
0
.01
.02
-.5 0 .5
Sample average within bin 3th order global polynomial
3 day CAR around 12/18/2012
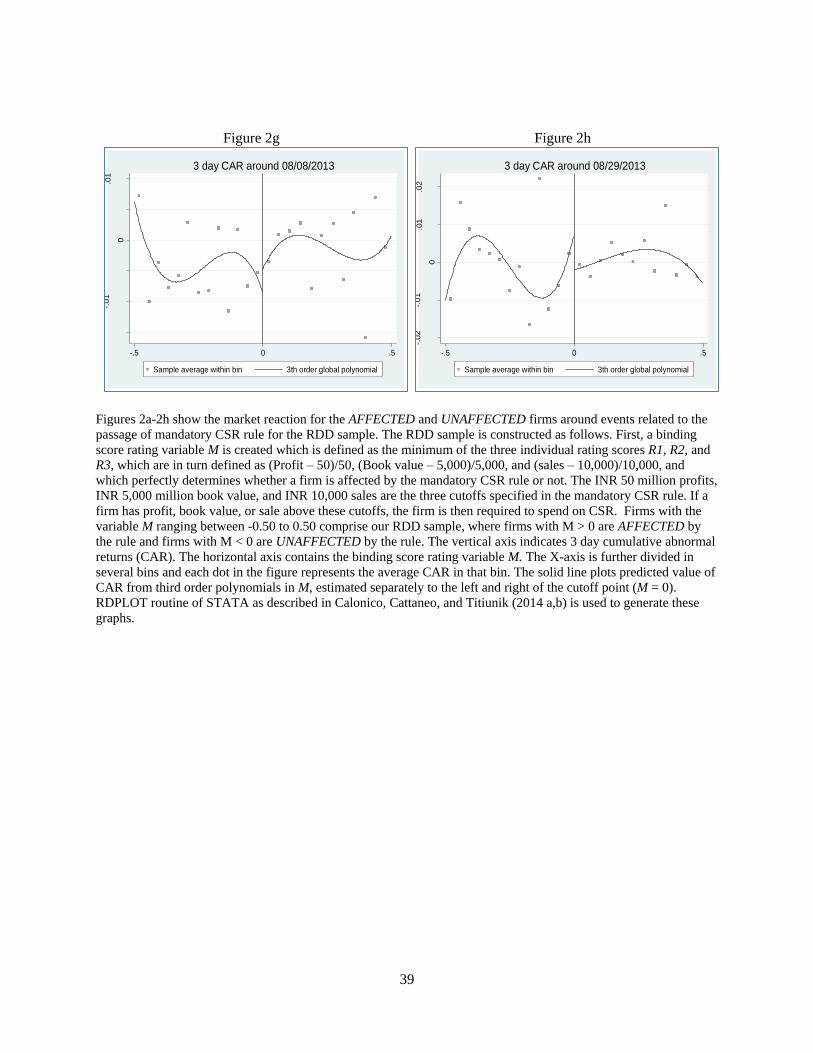
39
Figure 2g
Figure 2h
Figures 2a-2h show the market reaction for the AFFECTED and UNAFFECTED firms around events related to the
passage of mandatory CSR rule for the RDD sample. The RDD sample is constructed as follows. First, a binding
score rating variable M is created which is defined as the minimum of the three individual rating scores R1, R2, and
R3, which are in turn defined as (Profit – 50)/50, (Book value – 5,000)/5,000, and (sales – 10,000)/10,000, and
which perfectly determines whether a firm is affected by the mandatory CSR rule or not. The INR 50 million profits,
INR 5,000 million book value, and INR 10,000 sales are the three cutoffs specified in the mandatory CSR rule. If a
firm has profit, book value, or sale above these cutoffs, the firm is then required to spend on CSR. Firms with the
variable M ranging between -0.50 to 0.50 comprise our RDD sample, where firms with M > 0 are AFFECTED by
the rule and firms with M < 0 are UNAFFECTED by the rule. The vertical axis indicates 3 day cumulative abnormal
returns (CAR). The horizontal axis contains the binding score rating variable M. The X-axis is further divided in
several bins and each dot in the figure represents the average CAR in that bin. The solid line plots predicted value of
CAR from third order polynomials in M, estimated separately to the left and right of the cutoff point (M = 0).
RDPLOT routine of STATA as described in Calonico, Cattaneo, and Titiunik (2014 a,b) is used to generate these
graphs.
-.01
5-.
01
-.00
5
0
.00
5.0
1
-.5 0 .5
Sample average within bin 3th order global polynomial
3 day CAR around 08/08/2013
-.02
-.01
0
.01
.02
-.5 0 .5
Sample average within bin 3th order global polynomial
3 day CAR around 08/29/2013

40
Table 1: Sample description
Panel A: CSR spending
N = 458 Mean Median SD P25 P75
CSR spending (INR million) 49.30 3.02 200.89 0.53 14.39
CSR spending /average last three years profits (%) 1.22 0.37 2.31 0.07 1.27
Panel B: CSR activity undertaken
CSR activity N %
Community welfare 242 52.84%
Education 212 46.29%
Environment 191 41.70%
Healthcare 178 38.86%
Rural development 44 9.61%
Women empowerment 37 8.08%
Children health 35 7.64%
Donations 31 6.77%
Disaster relief 25 5.46%
Sports 12 2.62%
Support for physically challenged 9 1.97%
Panel C: Industry wise distribution
Industry UNAFFECTED AFFECTED TOTAL %
Automobiles and Truck 21 78 99 4.67%
Banking 43 72 115 5.42%
Business Services 84 88 172 8.11%
Chemicals 57 100 157 7.41%
Construction 36 102 138 6.51%
Construction Material 14 35 49 2.31%
Consumer Goods 19 32 51 2.41%
Electrical Equipment 19 33 52 2.45%
Food Products 25 53 78 3.68%
Machinery 26 59 85 4.01%
Non-Metallic and Industrial 20 33 53 2.50%
Pharmaceutical Products 44 63 107 5.05%
Steel Works 27 67 94 4.43%
Textiles 71 58 129 6.08%
Trading 86 40 126 5.94%
Wholesale 100 40 140 6.60%
Other industries with < 2% frequency 191 284 475 22.41%
Total 883 1,237 2,120 100.00%
41.65% 58.35% 100.00%
Our full sample consists of 2,120 unique firms over the period 2009-2013. In this table we present descriptive
statistics on, amount spent on CSR, the type of CSR activity undertaken by sample firms, and industry wide
distribution in the year 2012.

41
Table 2: Descriptive statistics for the RDD sample
UNAFFECTED (1)
N = 178
AFFECTED (2)
N = 303
Difference
in mean
Difference in
median
Mean Median SD Mean Median SD [2] – [1] [3] – [2]
ASSETS(INR, billions) 4.2952 2.3016 6.4647 13.7487 9.3235 17.5889 9.4534*** 7.0219***
ROA 0.0099 0.0152 0.0691 0.0363 0.0326 0.0683 0.0265*** 0.0174***
BM 3.9943 2.3528 5.3227 3.1446 1.9160 5.7698 -0.8497 -0.4368***
LEV 0.5190 0.5535 0.2277 0.4898 0.5228 0.2251 -0.0291 -0.0307
CAPEX 0.0447 0.0133 0.0735 0.0497 0.0249 0.0630 0.0049 0.0116
SGROWTH 0.0739 0.0009 0.5143 0.0848 0.0013 0.4229 0.0109 0.0004
CASH 0.0554 0.0231 0.0948 0.0595 0.0292 0.0975 0.0042 0.0061
BOARD_INDPENDENCE 0.4551 0.4545 0.1208 0.4689 0.4545 0.1171 0.0139 0.0000
BIG4 0.0449 0.0000 0.2078 0.0924 0.0000 0.2901 0.0475* 0.0000*
BG 0.1348 0.0000 0.3425 0.3366 0.0000 0.4733 0.2018*** 0.0000***
GOVT_OWNED 0.0056 0.0000 0.0750 0.0033 0.0000 0.0574 -0.0023 0.0000
MNC 0.0112 0.0000 0.1057 0.0264 0.0000 0.1606 0.0152 0.0000
AD 0.0017 0.0000 0.0068 0.0051 0.0000 0.0160 0.0034*** 0.0000***
POLITICAL 0.0169 0.0000 0.1291 0.0594 0.0000 0.2368 0.0426** 0.0000**
POLLUTED 0.4775 0.0000 0.5009 0.4719 0.0000 0.5000 -0.0056 0.0000
This table reports the mean, median, and standard deviation of various firm characteristics for the AFFECTED and
UNAFFECTED firms in the year 2012, for the RDD sample. The RDD sample is constructed as follows. First, a
binding score rating variable M is created which is defined as the minimum of the three individual rating scores R1,
R2, and R3, which are in turn defined as (Profit – 50)/50, (Book value – 5,000)/5,000, and (sales – 10,000)/10,000,
and which perfectly determines whether a firm is affected by the mandatory CSR rule or not. The INR 50 million
profits, INR 5,000 million book value, and INR 10,000 sales are the three cutoffs specified in the mandatory CSR
rule. If a firm has profit, book value, or sale above these cutoffs, the firm is then required to spend on CSR. Firms
with the variable M ranging between -0.50 to 0.50 comprise our RDD sample, where firms with M > 0 are
AFFECTED by the rule and firms with M < 0 are UNAFFECTED by the rule. The significance of differences in
means and medians are evaluated based on the t-test and Wilcoxon test, respectively (p-values for the t-statistics and
Z-statistics are two-tailed).

42
Table 3: Market reaction – univariate results based on RDD sample
Event Date Event description UNAFFECTED (1)
N = 178
AFFECTED (2)
N = 303
Difference
(2)-(1)
1 03 Aug 2009 The Bill is introduced in the Lok Sabha (lower house of parliament).
There is no mention of CSR is this version of the Bill.
0.003 0.001 -0.001
2 31 Aug 2010 The standing committee on finance submits its report and introduces a
clause on mandatory CSR in the Bill.
0.003*** -0.023*** -0.026***
3 28 Feb 2011 The Ministry of Corporate Affairs suggests that it is considering to make
only the disclosure and not the spending on CSR mandatory
-0.002 0.004 0.006
4 14 Dec 2011 The Bill is re-introduced in the Lok Sabha with a mandatory CSR clause -0.001 -0.001 0.000
5 26 Jun 2012 The standing committee on finance submits its report.
0.002*** 0.001* -0.001
6 18 Dec 2012 The Bill is passed in Lok Sabha with mandatory CSR clause
0.006*** -0.016*** -0.021***
7 08 Aug 2013 The Bill is passed in Rajya Sabha (higher house of parliament) with
mandatory CSR clause
-0.005** -0.006 -0.001
8 29 Aug 2013 The President of India signs the Bill
-0.004 -0.003 0.001
∑ Median CAR for all eight events 0.002 -0.043*** -0.043***
This table reports median 3 day CAR around the key legislative events for the two subgroups of our sample i.e. UNAFFECTED, and AFFECTED firms in the
RDD sample. We measure abnormal returns by estimating the market model using two hundred trading days of return data ending 11 days before key legislative
events related to the passage of the Companies Act 2013. The return on National Stock Exchange’s CNX 500 index is used as a proxy for the market return.
Daily abnormal stock returns are cumulated to obtain the cumulative abnormal return (CAR) from day t-1 before the legislative event date to day t+1 after the
event date. The RDD sample is constructed as follows. First, a binding score rating variable M is created which is defined as the minimum of the three individual
rating scores R1, R2, and R3, which are in turn defined as (Profit – 50)/50, (Book value – 5,000)/5,000, and (sales – 10,000)/10,000, and which perfectly
determines whether a firm is affected by the mandatory CSR rule or not. The INR 50 million profits, INR 5,000 million book value, and INR 10,000 sales are the
three cutoffs specified in the mandatory CSR rule. If a firm has profit, book value, or sale above these cutoffs, the firm is then required to spend on CSR. Firms
with the variable M ranging between -0.50 to 0.50 comprise our RDD sample, where firms with M > 0 are AFFECTED by the rule and firms with M < 0 are
UNAFFECTED by the rule. The significance of median and the difference in median values for the two subgroups is tested using Wilcoxson test. ***, **, and *
denote significance at 1%, 5%, and 10% level (two-tailed), respectively.

43
Table 4: Market reaction – summary of graphical analysis using RDD
Dependent variable = CAR
Coefficient z-statistics Observations
03 Aug 2009 (EVENT 1) 0.004 (0.239) 480
31 Aug 2010 (EVENT 2) -0.026*** (-3.326) 517
28 Feb 2011 (EVENT 3) -0.001 (-0.138) 556
14 Dec 2011 (EVENT 4) 0.002 (0.193) 543
26 Jun 2012 (EVENT 5) 0.003 (0.301) 514
18 Dec 2012 (EVENT 6) -0.019** (-1.936) 536
08 Aug 2013 (EVENT 7) 0.004 (0.345) 491
29 Aug 2013 (EVENT 8) -0.007 (-0.646) 481
This table summarizes the difference in the market reaction for the AFFECTED and UNAFFECTED firms around
events related to the passage of mandatory CSR rule, as shown in figures 2a-2g. The market reaction is measured as
the 3 day cumulative abnormal return CAR. We measure abnormal returns by estimating the market model using
two hundred trading days of return data ending 11 days before key legislative events related to the passage of the
Companies Act 2013. The return on National Stock Exchange’s CNX 500 index is used as a proxy for the market
return. Daily abnormal stock returns are cumulated to obtain the cumulative abnormal return (CAR) from day t-1
before the legislative event date to day t+1 after the event date. As described previously in figures 2a-2g, the
dependent variable CAR is plotted over the variable M for the RDD sample. The RDD sample is constructed as
follows. First, a binding score rating variable M is created which is defined as the minimum of the three individual
rating scores R1, R2, and R3, which are in turn defined as (Profit – 50)/50, (Book value – 5,000)/5,000, and (sales –
10,000)/10,000, and which perfectly determines whether a firm is affected by the mandatory CSR rule or not. The
INR 50 million profits, INR 5,000 million book value, and INR 10,000 sales are the three cutoffs specified in the
mandatory CSR rule. If a firm has profit, book value, or sale above these cutoffs, the firm is then required to spend
on CSR. Firms with the variable M ranging between -0.50 to 0.50 comprise our RDD sample, where firms with M >
0 are AFFECTED by the rule and firms with M < 0 are UNAFFECTED by the rule. The dependent variable CAR is
estimated as a third order polynomial in M, separately on the both sides of the cutoff (i.e. where M = 0) and locally
over several bins and suggested by Calonico, Cattaneo, and Titiunik (2014). The jump (or drop) in the fitted curve at
the cutoff point captures the treatment effect and is documented in this table. Operationally, RDROBUST routine of
STATA as described Calonico, Cattaneo, and Titiunik (2014 a,b) is used to generate these estimates. ***, **, and *
denote significance at 1%, 5%, and 10% level (two-tailed), respectively.

44
Table 5: Market reaction –parametric estimation of RDD
Dependent variable =
CAR
(1) (2) (3)
c
o
ef
t
s
t
a
t
c
o
ef
t
s
t
a
t
c
o
ef
t
s
t
a
t
EVENT 1*AFFECTED τ
1
0.
0
0
3
1
.
5
9
1
0.
0
0
2
0
.
9
8
4
-
0.
0
0
0
-
0
.
0
3
8
EVENT 2*AFFECTED τ
2
-
0.
0
2
2
*
*
*
-
1
4
.
1
7
4
-
0.
0
2
3
*
*
*
-
9
.
4
7
4
-
0.
0
2
5
*
*
*
-
5
.
3
0
1
EVENT 3*AFFECTED τ
3
0.
0
0
0
0
.
2
5
8
0.
0
0
1
0
.
4
9
1
-
0.
0
0
4
-
0
.
7
7
2
EVENT 4*AFFECTED τ
4
-
0.
0
0
3
-
1
.
5
7
1
-
0.
0
0
3
-
1
.
0
9
0
-
0.
0
0
8
-
1
.
5
0
8
EVENT 5*AFFECTED τ
5
-
0.
0
0
4
*
*
-
2
.
4
7
9
-
0.
0
0
4
*
-
1
.
7
0
9
-
0.
0
0
6
-
1
.
2
0
2
EVENT 6*AFFECTED τ
6
-
0.
0
1
6
*
*
*
-
9
.
5
9
7
-
0.
0
1
5
*
*
*
-
6
.
2
7
5
-
0.
0
1
8
*
*
*
-
3
.
4
9
4
EVENT 7*AFFECTED τ
7
0.
0
0
1
0
.
5
3
9
-
0.
0
0
0
-
0
.
1
6
8
-
0.
0
0
4
-
0
.
7
4
9
EVENT 8*AFFECTED τ
8
-
0.
0
-
0
.
-
0.
0
-
0
.
-
0.
0
-
0
.

45
0
0
0
4
8
0
1
2
7
2
0
3
5
7
1
M*AFFECTED δ -
0.
0
1
4
-
0
.
5
1
5
-
0.
0
0
5
-
0
.
1
7
3
-
0.
0
6
1
-
1
.
5
0
1
M β
1
0.
0
1
1
0
.
6
2
3
0.
0
0
4
0
.
2
2
7
0.
0
3
9
1
.
4
1
6
M*M β
2
0.
0
0
9
0
.
4
2
2
0.
0
0
2
0
.
0
7
6
0.
0
6
3
1
.
6
0
1
M*M*M β
3
-
0.
0
2
8
-
1
.
1
8
9
-
0.
0
2
1
-
0
.
7
4
1
-
0.
0
4
6
-
0
.
8
7
8
R1 γ
1
0.
0
0
0
0
.
8
4
9
0.
0
0
0
0
.
6
7
1
0.
0
0
0
0
.
4
7
0
R2 γ
2
0.
0
0
0
1
.
4
1
2
0.
0
0
0
0
.
3
6
4
-
0.
0
0
1
-
0
.
4
5
3
R3 γ
3
0.
0
0
1
1
.
2
0
7
0.
0
0
1
1
.
0
1
3
-
0.
0
0
9
*
*
*
-
2
.
6
2
5
SIZE �
1
0.
0
0
1
0
.
7
6
2
0.
0
0
4
0
.
7
8
5
BM �
2
-
0.
0
0
0
-
1
.
3
6
7
-
0.
0
0
0
-
1
.
0
5
5
LEV �
3
-
0.
0
0
4
-
1
.
4
4
0
-
0.
0
0
0
-
0
.
0
0
5

46
ROA �
4
-
0.
0
0
2
-
0
.
2
6
8
-
0.
0
0
4
-
0
.
1
7
6
CAPEX �
5
-
0.
0
0
0
-
0
.
0
5
1
0.
0
0
4
0
.
4
1
8
SGROWTH �
6
-
0.
0
0
1
-
1
.
1
1
1
-
0.
0
0
1
-
0
.
5
0
6
CASH �
7
-
0.
0
0
1
-
0
.
1
4
1
-
0.
0
1
1
-
0
.
7
2
3
BOARD_INDPENDENCE �
8
0.
0
1
0
*
*
*
5
.
4
5
9
-
0.
0
0
7
-
0
.
5
8
6
BIG4 �
9
0.
0
0
0
0
.
0
7
1
0.
0
1
1
1
.
2
0
7
BG �
1
0
0.
0
0
3
1
.
1
5
9
-
0.
0
0
2
-
0
.
2
4
0
GOVT_OWNED �
1
1
-
0.
0
1
7
*
*
*
-
3
.
4
7
4
MNC �
1
2
-
0.
0
0
3
-
1
.
0
9
8
0.
0
0
2
0
.
5
0
9
AD �
1
3
-
0.
0
2
2
-
0
.
5
6
0
0.
0
3
0
0
.
1
8
3

47
POLITICAL �
1
4
0.
0
0
6
1
.
4
2
8
POLLUTED �
1
5
-
0.
0
0
1
-
0
.
1
0
9
�=18�� = 0 F-stat (p-value) 9.
7
3
*
*
*
(
0.
0
0
)
4.
7
2
*
*
(
0.
0
3
)
4.
4
4
*
*
(
0.
0
3
)
�=18�� = 2% F-stat (p-value) 2.
6
6
(
0.
1
0
)
1.
3
6
(
0.
2
4
)
2.
2
3
(
0.
1
3
)
Event FE Y
e
s
Y
e
s
Y
e
s
Industry FE N
o
Y
e
s
N
o
Firm FE N
o
N
o
Y
e
s
Observations 4,
1
1
8
3,
8
0
7
3,
8
0
7
R2 0.
0
5
0
0.
0
6
8
0.
3
5
4
This table presents the results from estimating model (3) ���������∗ ��������+��∗ ��������+����^� +
�����+�����������+ �
The dependent variable is the 3 day cumulative abnormal return CAR. We measure abnormal returns by estimating
the market model using two hundred trading days of return data ending 11 days before key legislative events related
to the passage of the Companies Act 2013. The return on National Stock Exchange’s CNX 500 index is used as a
proxy for the market return. Daily abnormal stock returns are cumulated to obtain the cumulative abnormal return
(CAR) from day t-1 before the legislative event date to day t+1 after the event date. The estimation is restricted to

48
the RDD sample. The RDD sample is constructed as follows. First, a binding score rating variable M is created
which is defined as the minimum of the three individual rating scores R1, R2, and R3, which are in turn defined as
(Profit – 50)/50, (Book value – 5,000)/5,000, and (sales – 10,000)/10,000, and which perfectly determines whether a
firm is affected by the mandatory CSR rule or not. The INR 50 million profits, INR 5,000 million book value, and
INR 10,000 sales are the three cutoffs specified in the mandatory CSR rule. If a firm has profit, book value, or sale
above these cutoffs, the firm is then required to spend on CSR. Firms with the variable M ranging between -0.50 to
0.50 comprise our RDD sample, where firms with M > 0 are AFFECTED by the rule and firms with M < 0 are
UNAFFECTED by the rule. Control variables are defined in Appendix A. The t-statistics are based on robust
standard errors clustered at firm and event level. ***, **, and * denote significance at 1%, 5%, and 10% level (two-
tailed), respectively.

49
Table 6: Market reaction – cross sectional analysis of the RDD sample
Dependent variable = CAR
(1) (2) (3) (4)
VARIAT
ION =
BG
VARIA
TION
=
POLITI
CAL
VARIAT
ION =
AD
VARIA
TION
=
POLL
UTED
co
ef
ts
ta
t
co
ef
ts
ta
t
coe
f
ts
ta
t
co
ef
t
s
t
a
t
EVENT 1*AFFECTED τ
1
0.0
02
1.
1
0
1
0.
00
3
1.
4
2
2
0.0
02
0.
7
5
4
0.
00
4
1
.
4
9
1
EVENT 2*AFFECTED τ
2
-
0.0
30
**
*
-
1
5.
2
5
8
-
0.
02
5*
**
-
1
0.
8
1
0
-
0.0
26*
**
-
1
1.
4
1
6
-
0.
02
2*
**
-
8
.
2
2
5
EVENT 3*AFFECTED τ
3
0.0
00
0.
2
0
1
0.
00
1
0.
6
1
8
0.0
02
0.
7
9
0
-
0.
00
0
-
0
.
0
4
5
EVENT 4*AFFECTED τ
4
-
0.0
01
-
0.
3
1
4
-
0.
00
2
-
0.
9
8
5
-
0.0
05*
*
-
2.
1
1
7
-
0.
00
3
-
0
.
9
9
5
EVENT 5*AFFECTED τ
5
-
0.0
04
**
-
2.
1
-
0.
00
3
-
1.
5
-
0.0
04*
-
1.
7
-
0.
00
1
-
0
.
5

50
8
2
5
9
1
6
4
1
EVENT 6*AFFECTED τ
6
-
0.0
22
**
*
-
1
0.
5
5
9
-
0.
01
7*
**
-
7.
4
0
0
-
0.0
17*
**
-
6.
9
2
3
-
0.
01
7*
**
-
6
.
1
4
1
EVENT 7*AFFECTED τ
7
0.0
01
0.
6
4
9
0.
00
1
0.
2
3
8
0.0
01
0.
3
5
1
0.
00
0
0
.
0
5
9
EVENT 8*AFFECTED τ
8
0.0
00
0.
0
6
8
-
0.
00
0
-
0.
2
1
2
-
0.0
01
-
0.
2
3
7
-
0.
00
1
-
0
.
2
3
5
EVENT 1*AFFECTED*VARIATION μ
1
0.0
01
0.
2
8
6
-
0.
01
5*
**
-
2.
8
1
7
0.0
02*
*
2.
1
8
9
-
0.
00
4*
**
-
4
.
2
8
1
EVENT 2*AFFECTED*VARIATION μ
2
0.0
23
**
*
8.
3
2
1
0.
03
4*
**
6.
5
1
8
0.0
06*
**
4.
5
9
7
-
0.
00
4*
**
-
4
.
8
3
2
EVENT 3*AFFECTED*VARIATION μ
3
0.0
04
1.
5
4
0
-
0.
00
3
-
0.
5
5
5
-
0.0
01
-
0.
9
4
4
0.
00
3*
*
2
.
3
7
6
EVENT 4*AFFECTED*VARIATION μ
4
-
0.0
04
-
1.
5
9
2
-
0.
00
7
-
1.
4
1
8
0.0
06*
**
7.
0
7
5
0.
00
0
0
.
1
2
7
EVENT 5*AFFECTED*VARIATION μ
5
0.0
02
0.
5
8
7
-
0.
01
-
2.
6
0.0
00
0.
3
7
9
-
0.
00
-
6
.
2

51
1*
**
3
2
6*
**
0
4
EVENT 6*AFFECTED*VARIATION μ
6
0.0
19
**
*
7.
0
6
5
0.
02
1*
**
4.
8
1
5
0.0
04*
**
4.
5
0
9
0.
00
3*
**
2
.
8
9
6
EVENT 7*AFFECTED*VARIATION μ
7
-
0.0
03
-
1.
1
8
5
-
0.
01
4*
**
-
2.
8
5
2
-
0.0
02*
**
-
2.
7
6
3
-
0.
00
1
-
1
.
1
4
3
EVENT 8*AFFECTED*VARIATION μ
8
-
0.0
01
-
0.
3
4
2
-
0.
00
2
-
0.
4
0
4
0.0
00
0.
1
6
8
-
0.
00
0
-
0
.
0
7
8
M*AFFECTED δ -
0.0
06
-
0.
2
0
9
-
0.
00
6
-
0.
2
0
0
-
0.0
05
-
0.
1
7
6
-
0.
00
4
-
0
.
1
5
0
M β
1
0.0
06
0.
3
2
6
0.
00
4
0.
2
3
8
0.0
04
0.
2
2
9
0.
00
4
0
.
2
1
5
M*M β
2
0.0
02
0.
0
8
9
0.
00
2
0.
1
0
2
0.0
02
0.
0
7
2
0.
00
1
0
.
0
4
9
M*M*M β
3
-
0.0
26
-
0.
9
4
1
-
0.
02
0
-
0.
7
3
3
-
0.0
20
-
0.
7
4
4
-
0.
02
1
-
0
.
7
7
4
R1 γ
1
0.0
00
0.
3
6
3
0.
00
0
0.
7
1
6
0.0
00
0.
6
5
8
0.
00
0
0
.
6

52
5
3
R2 γ
2
0.0
00
0.
0
3
6
0.
00
0
0.
3
8
2
0.0
00
0.
2
8
5
0.
00
0
0
.
3
9
6
R3 γ
3
0.0
01
0.
8
7
0
0.
00
1
0.
9
5
4
0.0
01
0.
9
9
4
0.
00
1
1
.
0
8
3
Controls Ye
s
Y
es
Ye
s
Y
es
Event FE Ye
s
Y
es
Ye
s
Y
es
Industry FE Ye
s
Y
es
Ye
s
Y
es
Firm FE No N
o
No N
o
�=18�� = 0 F-stat (p-value) 3.4
1*(
0.0
6)
0.
00
(0.
96
)
4.5
8**
(0.
03)
1.
25
(0.
26
)
Observations 3,8
07
3,
80
7
3,8
07
3,
80
7
R2 0.0
88
0.
08
0
0.0
71
0.
07
0
This table presents the results from estimating model (4) ���������∗ �������� +���������∗ ��������∗ ��������� +��∗ ��������+����^� +
�����+�����������+ �
The dependent variable is the 3 day cumulative abnormal return CAR. We measure abnormal returns by estimating the market model using two hundred trading
days of return data ending 11 days before key legislative events related to the passage of the Companies Act 2013. The return on National Stock Exchange’s
CNX 500 index is used as a proxy for the market return. Daily abnormal stock returns are cumulated to obtain the cumulative abnormal return (CAR) from day t-
1 before the legislative event date to day t+1 after the event date. The estimation is restricted to the RDD sample. The RDD sample is constructed as follows.
First, a binding score rating variable M is created which is defined as the minimum of the three individual rating scores R1, R2, and R3, which are in turn defined
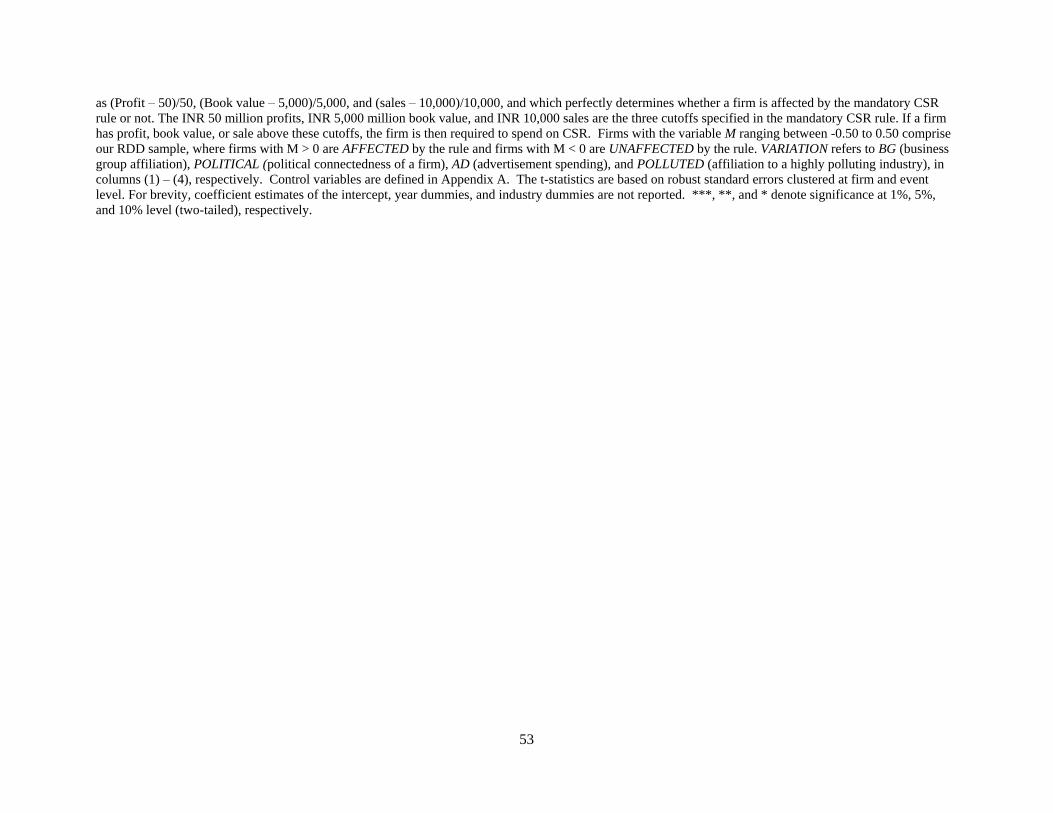
53
as (Profit – 50)/50, (Book value – 5,000)/5,000, and (sales – 10,000)/10,000, and which perfectly determines whether a firm is affected by the mandatory CSR
rule or not. The INR 50 million profits, INR 5,000 million book value, and INR 10,000 sales are the three cutoffs specified in the mandatory CSR rule. If a firm
has profit, book value, or sale above these cutoffs, the firm is then required to spend on CSR. Firms with the variable M ranging between -0.50 to 0.50 comprise
our RDD sample, where firms with M > 0 are AFFECTED by the rule and firms with M < 0 are UNAFFECTED by the rule. VARIATION refers to BG (business
group affiliation), POLITICAL (political connectedness of a firm), AD (advertisement spending), and POLLUTED (affiliation to a highly polluting industry), in
columns (1) – (4), respectively. Control variables are defined in Appendix A. The t-statistics are based on robust standard errors clustered at firm and event
level. For brevity, coefficient estimates of the intercept, year dummies, and industry dummies are not reported. ***, **, and * denote significance at 1%, 5%,
and 10% level (two-tailed), respectively.
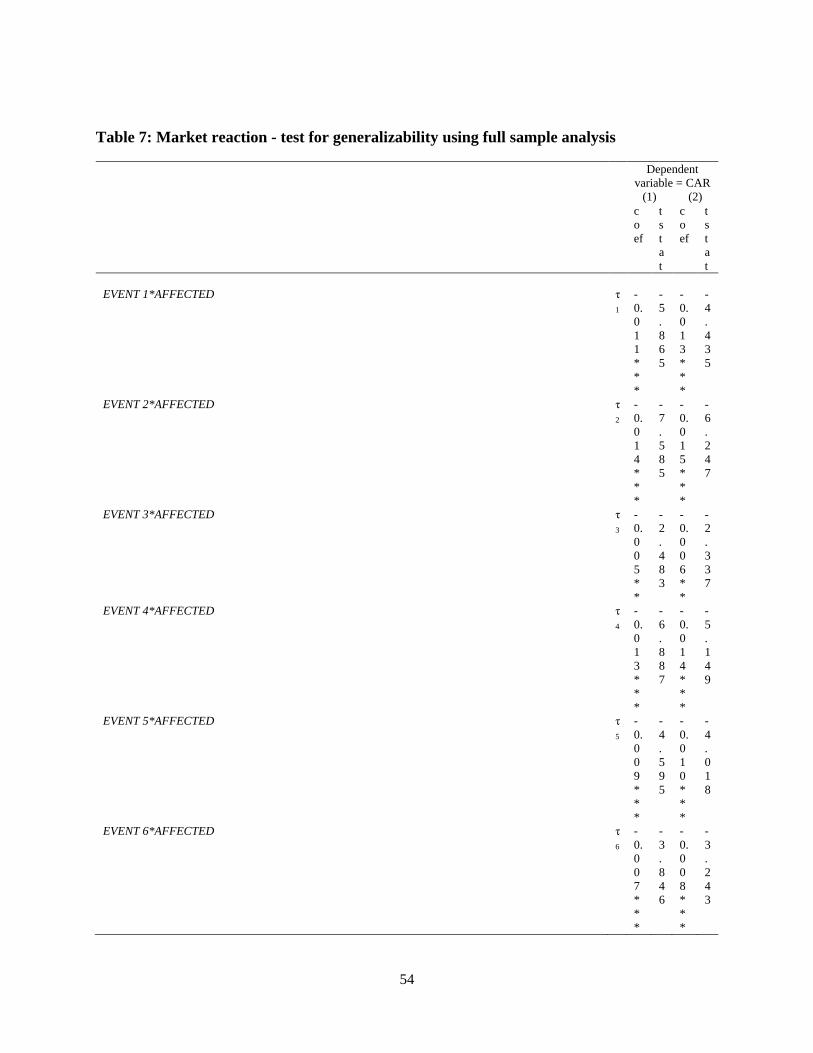
54
Table 7: Market reaction - test for generalizability using full sample analysis
Dependent
variable = CAR
(1) (2)
c
o
ef
t
s
t
a
t
c
o
ef
t
s
t
a
t
EVENT 1*AFFECTED τ
1
-
0.
0
1
1
*
*
*
-
5
.
8
6
5
-
0.
0
1
3
*
*
*
-
4
.
4
3
5
EVENT 2*AFFECTED τ
2
-
0.
0
1
4
*
*
*
-
7
.
5
8
5
-
0.
0
1
5
*
*
*
-
6
.
2
4
7
EVENT 3*AFFECTED τ
3
-
0.
0
0
5
*
*
-
2
.
4
8
3
-
0.
0
0
6
*
*
-
2
.
3
3
7
EVENT 4*AFFECTED τ
4
-
0.
0
1
3
*
*
*
-
6
.
8
8
7
-
0.
0
1
4
*
*
*
-
5
.
1
4
9
EVENT 5*AFFECTED τ
5
-
0.
0
0
9
*
*
*
-
4
.
5
9
5
-
0.
0
1
0
*
*
*
-
4
.
0
1
8
EVENT 6*AFFECTED τ
6
-
0.
0
0
7
*
*
*
-
3
.
8
4
6
-
0.
0
0
8
*
*
*
-
3
.
2
4
3
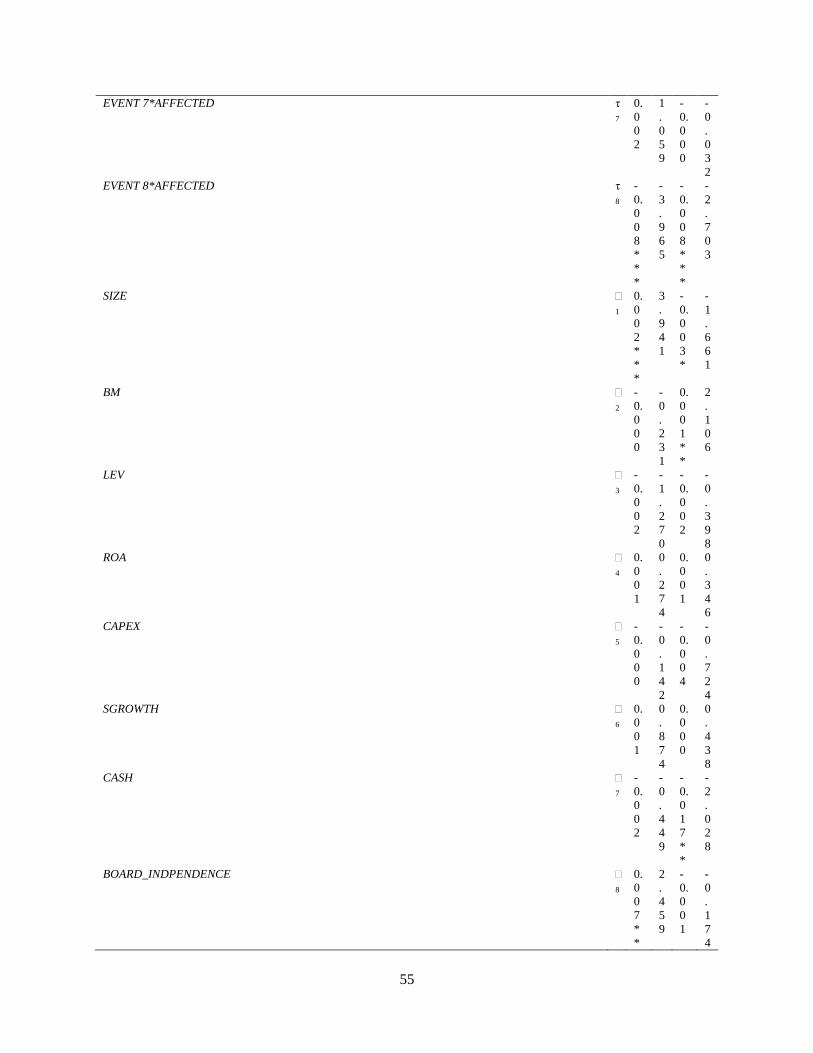
55
EVENT 7*AFFECTED τ
7
0.
0
0
2
1
.
0
5
9
-
0.
0
0
0
-
0
.
0
3
2
EVENT 8*AFFECTED τ
8
-
0.
0
0
8
*
*
*
-
3
.
9
6
5
-
0.
0
0
8
*
*
*
-
2
.
7
0
3
SIZE �
1
0.
0
0
2
*
*
*
3
.
9
4
1
-
0.
0
0
3
*
-
1
.
6
6
1
BM �
2
-
0.
0
0
0
-
0
.
2
3
1
0.
0
0
1
*
*
2
.
1
0
6
LEV �
3
-
0.
0
0
2
-
1
.
2
7
0
-
0.
0
0
2
-
0
.
3
9
8
ROA �
4
0.
0
0
1
0
.
2
7
4
0.
0
0
1
0
.
3
4
6
CAPEX �
5
-
0.
0
0
0
-
0
.
1
4
2
-
0.
0
0
4
-
0
.
7
2
4
SGROWTH �
6
0.
0
0
1
0
.
8
7
4
0.
0
0
0
0
.
4
3
8
CASH �
7
-
0.
0
0
2
-
0
.
4
4
9
-
0.
0
1
7
*
*
-
2
.
0
2
8
BOARD_INDPENDENCE �
8
0.
0
0
7
*
*
2
.
4
5
9
-
0.
0
0
1
-
0
.
1
7
4

56
BIG4 �
9
0.
0
0
1
0
.
5
6
9
0.
0
0
5
0
.
9
7
4
BG �
1
0
0.
0
0
9
*
*
*
2
.
7
7
8
0.
0
0
6
*
1
.
6
8
4
GOVT_OWNED �
1
1
0.
0
0
1
0
.
3
2
9
0.
0
0
7
0
.
4
0
5
MNC �
1
2
-
0.
0
0
1
-
1
.
5
6
9
0.
0
0
1
0
.
0
4
3
AD �
1
3
-
0.
0
0
4
-
0
.
1
7
0
0.
0
5
5
0
.
9
3
2
POLITICAL �
1
4
0.
0
2
0
*
*
*
4
.
0
3
1
POLLUTED �
1
5
0.
0
1
9
*
*
2
.
1
8
0
�=18�� = 0 F-stat (p-value) 1
8.
3
5
*
*
*
(0
.0
0)
3
2.
2
4
*
*
*
(0
.0
0)
�=18�� = 2% F-stat (p-value) 8.
7
6
*
*
*
(0
.0
0)
1
8.
2
7
*
*
*

57
(0
.0
0)
Event FE Y
es
Y
es
Industry FE Y
es
N
o
Firm FE N
o
Y
es
Observations 1
3,
9
3
1
1
3,
9
3
1
R2 0.
0
6
7
0.
2
2
5
This table presents the results from estimating model (5) ���������∗ ��������+�����������+ �
The dependent variable is the 3 day cumulative abnormal return CAR. We measure abnormal returns by estimating
the market model using two hundred trading days of return data ending 11 days before key legislative events related
to the passage of the Companies Act 2013. The return on National Stock Exchange’s CNX 500 index is used as a
proxy for the market return. Daily abnormal stock returns are cumulated to obtain the cumulative abnormal return
(CAR) from day t-1 before the legislative event date to day t+1 after the event date. The estimation is based on the
full sample. Control variables are defined in Appendix A. The t-statistics are based on standard errors clustered at
firm and event level. For brevity, coefficient estimates of the intercept, year dummies, and industry dummies are not
reported. ***, **, and * denote significance at 1%, 5%, and 10% level (two-tailed), respectively.

58
Table 8: Changes in Tobin’s Q for the RDD sample
Panel A: Univariate tests
∆ Ln(Q)
UNAFFECTED (1) AFFECTED (2) Difference in mean Difference in median
Year Mean Median Mean Median (2) – (1) (2) – (1)
2010 0.203 0.227 0.218 0.243 0.015 0.015
2011 -0.036 -0.030 -0.074 -0.128 -0.038** -0.098***
2012 -0.010 -0.001 0.025 0.042 0.036** 0.044**
2013 -0.065 -0.062 -0.125 -0.160 -0.061*** -0.098***
Panel B: Regression analysis
Dependent
variable = ∆Ln(Q)
(1) (2)
c
o
ef
t
s
t
a
t
c
o
ef
t
s
t
a
t
YEAR 2010*AFFECTED τ
1
-
0.
0
0
1
-
0
.
0
3
6
-
0.
0
3
7
-
1
.
1
7
0
YEAR 2011*AFFECTED τ
2
-
0.
0
6
2
*
*
*
-
3
.
3
9
5
-
0.
1
1
5
*
*
*
-
3
.
4
1
2
YEAR 2012*AFFECTED τ
3
0.
0
0
0
0
.
0
2
9
0.
0
0
1
0
.
0
3
0
YEAR 2013*AFFECTED τ
4
-
0.
0
7
2
*
*
*
-
4
.
0
9
3
-
0.
0
8
1
*
*
-
2
.
1
9
1
M*AFFECTED δ -
0.
0
5
4
-
0
.
4
2
6
0.
1
1
7
0
.
3
5
1
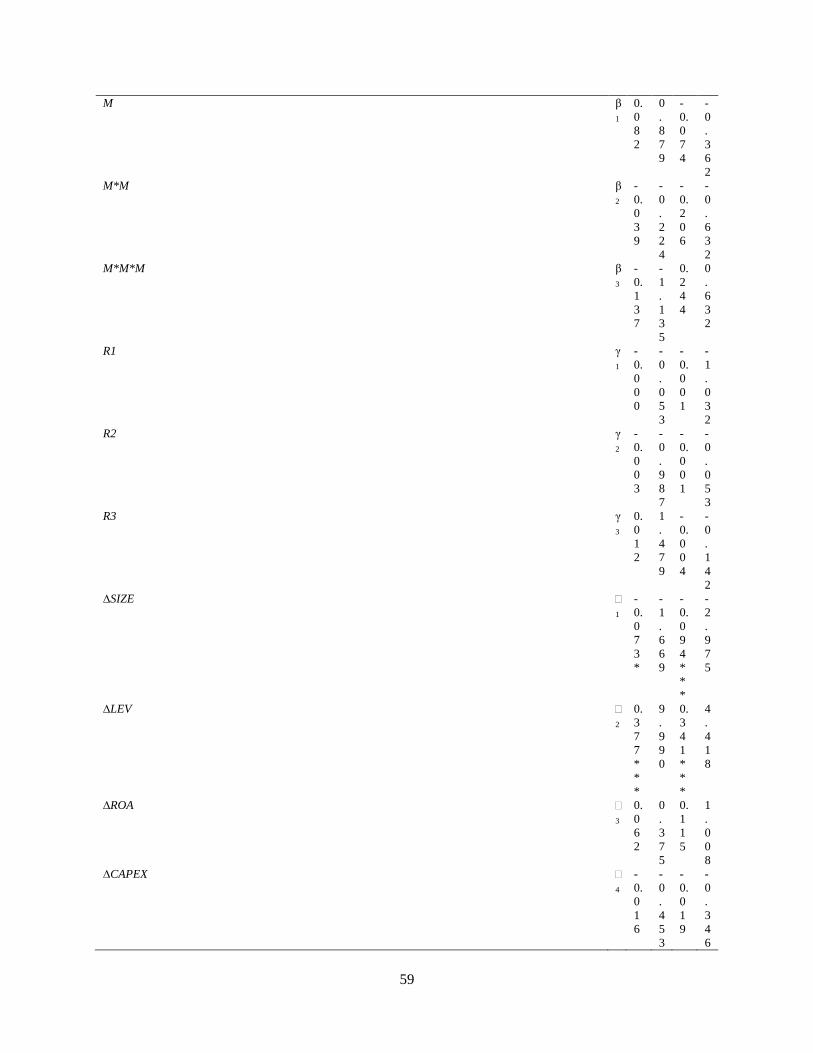
59
M β
1
0.
0
8
2
0
.
8
7
9
-
0.
0
7
4
-
0
.
3
6
2
M*M β
2
-
0.
0
3
9
-
0
.
2
2
4
-
0.
2
0
6
-
0
.
6
3
2
M*M*M β
3
-
0.
1
3
7
-
1
.
1
3
5
0.
2
4
4
0
.
6
3
2
R1 γ
1
-
0.
0
0
0
-
0
.
0
5
3
-
0.
0
0
1
-
1
.
0
3
2
R2 γ
2
-
0.
0
0
3
-
0
.
9
8
7
-
0.
0
0
1
-
0
.
0
5
3
R3 γ
3
0.
0
1
2
1
.
4
7
9
-
0.
0
0
4
-
0
.
1
4
2
∆SIZE �
1
-
0.
0
7
3
*
-
1
.
6
6
9
-
0.
0
9
4
*
*
*
-
2
.
9
7
5
∆LEV �
2
0.
3
7
7
*
*
*
9
.
9
9
0
0.
3
4
1
*
*
*
4
.
4
1
8
∆ROA �
3
0.
0
6
2
0
.
3
7
5
0.
1
1
5
1
.
0
0
8
∆CAPEX �
4
-
0.
0
1
6
-
0
.
4
5
3
-
0.
0
1
9
-
0
.
3
4
6

60
∆SGROWTH �
5
0.
0
2
2
0
.
9
4
3
0.
0
1
4
0
.
6
5
0
∆CASH �
6
0.
2
0
0
*
*
2
.
1
1
0
0.
2
1
0
*
*
2
.
0
3
5
∆BOARD_INDPENDENCE �
7
0.
0
6
1
*
*
*
2
.
6
5
2
0.
0
8
2
0
.
9
8
2
BIG4 �
8
0.
0
1
6
1
.
2
2
1
0.
0
2
3
0
.
4
8
8
BG �
9
-
0.
0
1
2
-
1
.
1
3
0
-
0.
0
9
1
*
*
-
2
.
1
5
1
GOVT_OWNED �
1
0
-
0.
0
2
7
-
0
.
3
3
4
MNC �
1
1
0.
0
3
4
1
.
3
3
6
0.
0
8
6
0
.
5
1
5
∆AD �
1
2
1.
2
3
4
*
1
.
9
1
3
2.
0
1
5
1
.
3
9
7
POLITICAL �
1
3
-
0.
0
0
6
-
0
.
3
3
1
POLLUTED �
1
4
0.
0
6
7
0
.
8
2
3
�=18�� = 0 F-stat (p-value) 4.
4
0
5.
0
9
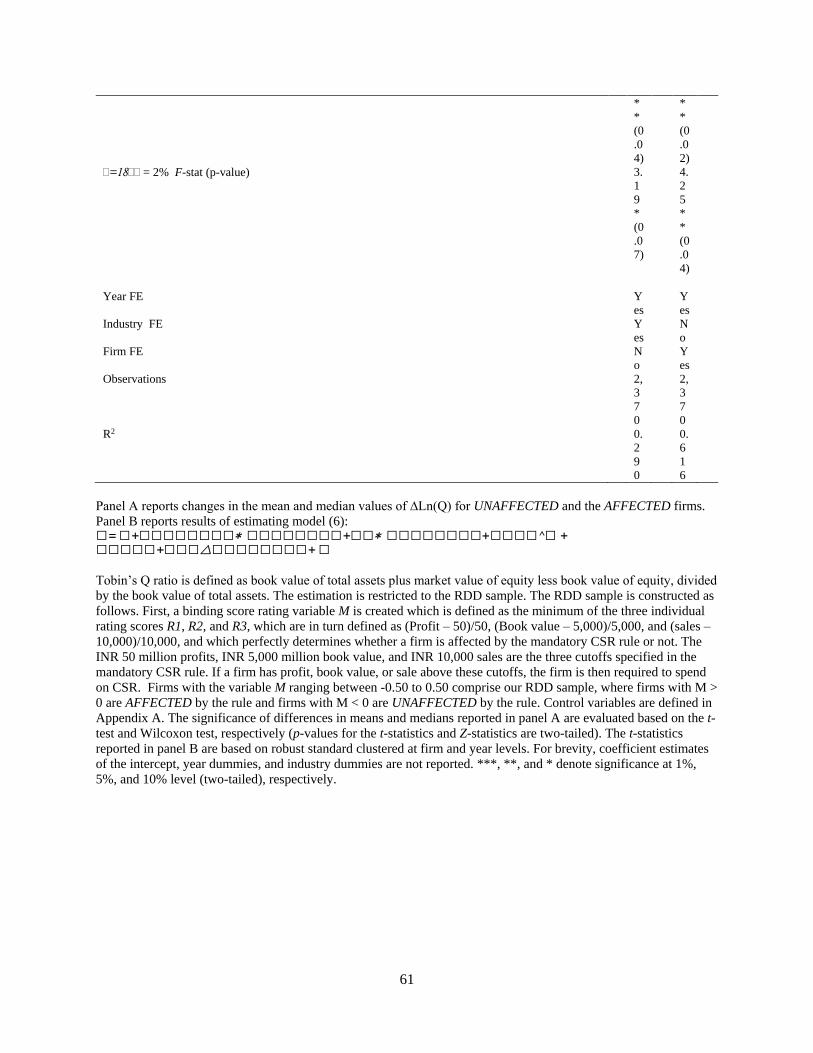
61
*
*
(0
.0
4)
*
*
(0
.0
2)
�=18�� = 2% F-stat (p-value) 3.
1
9
*
(0
.0
7)
4.
2
5
*
*
(0
.0
4)
Year FE Y
es
Y
es
Industry FE Y
es
N
o
Firm FE N
o
Y
es
Observations 2,
3
7
0
2,
3
7
0
R2 0.
2
9
0
0.
6
1
6
Panel A reports changes in the mean and median values of ∆Ln(Q) for UNAFFECTED and the AFFECTED firms.
Panel B reports results of estimating model (6): �= �+��������∗ ��������+��∗ ��������+����^� +
�����+���△��������+ �
Tobin’s Q ratio is defined as book value of total assets plus market value of equity less book value of equity, divided
by the book value of total assets. The estimation is restricted to the RDD sample. The RDD sample is constructed as
follows. First, a binding score rating variable M is created which is defined as the minimum of the three individual
rating scores R1, R2, and R3, which are in turn defined as (Profit – 50)/50, (Book value – 5,000)/5,000, and (sales –
10,000)/10,000, and which perfectly determines whether a firm is affected by the mandatory CSR rule or not. The
INR 50 million profits, INR 5,000 million book value, and INR 10,000 sales are the three cutoffs specified in the
mandatory CSR rule. If a firm has profit, book value, or sale above these cutoffs, the firm is then required to spend
on CSR. Firms with the variable M ranging between -0.50 to 0.50 comprise our RDD sample, where firms with M >
0 are AFFECTED by the rule and firms with M < 0 are UNAFFECTED by the rule. Control variables are defined in
Appendix A. The significance of differences in means and medians reported in panel A are evaluated based on the t-
test and Wilcoxon test, respectively (p-values for the t-statistics and Z-statistics are two-tailed). The t-statistics
reported in panel B are based on robust standard clustered at firm and year levels. For brevity, coefficient estimates
of the intercept, year dummies, and industry dummies are not reported. ***, **, and * denote significance at 1%,
5%, and 10% level (two-tailed), respectively.