does certification work in emerging markets? evidence from ... · does certification work in...
TRANSCRIPT

Does Certification Work in Emerging Markets? Evidence from the Indian IPO Market
Chandrasekhar Krishnamurti,a Tiong Yang Thongb* and S.R. Vishwanathc
a Department of Finance, Auckland University of Technology, Auckland 1142, NZ b Department of Finance, Singapore Management University
c Institute of Management Technology, Nagpur, India
Abstract
There is inconclusive evidence regarding the economic value of certification in the
context of IPOs in developed markets. Using a natural experiment of regulator mandated
IPO grading requirement, we examine the effects of third-party certification in the Indian
IPO market. This unique setting allows us to address the broader issue of whether
certification is more valuable in emerging markets with institutional voids. We document
mixed evidence regarding the impact of IPO grading exercise on the information
environment. Underpricing is unaffected by the grading process. However, stock price
informativeness as proxied by idiosyncratic volatility increases significantly due to IPO
grading process. Using a pseudo grading process we find that the grades are not
mechanically derivable from publicly available information. Overall, our evidence is
consistent with the view that credit rating agencies in emerging markets can potentially
supply useful information of relevance to both retail and institutional investors.
JEL Classification: G12, G14, and G32. Key words: Price Informativeness, IPO Grading, Idiosyncratic volatility, Certification ____________________________ * Corresponding author. Tel: +65 6828 0553; fax: +65 6828 0427 E-mail address: [email protected]
1
1.0 Introduction Despite two decades of research, empirical evidence regarding the impact of certification
on pricing in the U.S. market is contradictory. While some researchers posit a beneficial
impact of certification, others find the exactly opposite effect.1 But the IPO market in
U.S. is dominated by institutions and therefore the value of certification is relatively less
important. This leads us to the question as to when certification will be valuable. Khanna
and Palepu (2000) point out that emerging markets such as India have institutional voids
in their capital markets. So the natural question is whether certification would be a
valuable device in Indian IPO markets. We deal with this important issue utilizing the
natural experiment of regulatory change in the Indian IPO market. Effective from May 1,
2007, the Indian regulator mandated ‘grading’ of IPOs by credit rating agencies. We use
this unique setting to address the broader issue of whether certification is useful in
markets with institutional voids.
We motivate the paper by drawing upon several distinguishing factors that
differentiate Indian capital markets from the advanced markets of the west. First, there
are substantial institutional voids in Indian capital markets. As a consequence, investors
are not as well protected as compared to their counterparts in developed markets.
Second, the IPO market is characterized by considerable participation by retail investors
many of whom are financially illiterate. Third, most issues are oversubscribed several
times over and therefore lead managers need to ration the allocation of shares. Finally,
in the long-run the secondary market liquidity of IPOs reduces substantially leaving
1While Lee and Wahal (2004) and Loughran and Ritter (2002) find a positive effect of certification due to venture capitalist affiliation and underwriter reputation, Barry et. al. (1990) and Carter, dark, and Singh (1997) document the exactly opposite effect.

2
investors without an exit option. Summing up, the current state of IPO market does not
inspire investor confidence. In this context, it is relevant to examine whether certification
of IPOs can improve the market quality in India.
While rating of debt is a common practice, rating of equity (IPO) issues is not
prevalent elsewhere. The apparent intent of this new regulation is to protect retail
investors. Ostensibly, the retail investors will now have access to information regarding
the quality of the issue before they commit their funds. This move has raised
controversies in the Indian financial press. While proponents argue that the move will
increase the information availability and possibly eliminate low quality issues.
Opponents posit that the move imposes additional costs and delays especially on small
firms. Therefore, an empirical examination of the relevance of IPO grading is warranted.
The critical issues that can be potentially examined in this setting are as follows:
• Did the information environment improve in the post-grading period?
• Did low quality IPOs withdraw from the market?
• Were IPOs better priced in the post-grading period?
• Did the variability in subscription levels increase in the post-grading period?
We take a two-pronged approach to empirically examine the effect of IPO grading
on Indian capital markets. First, we examine whether IPO grading has improved the
information environment obtaining in the Indian markets. Second, we examine whether
IPO grades have an economic impact (informational value). The regulator in imposing
this new requirement presumes the absence of adequate of information available to retail
investors regarding forthcoming IPO issues. We question this presumption. We argue
that issue prospectuses are now freely (electronically) available to potential investors.
3
Furthermore, the financial press publishes recommendations regarding the IPOs. Thus
the central issue is whether grades provided by rating agencies are more credible as
compared to those provided by others. A brief preview of our results is presented below.
The evidence regarding the impact of IPO grading on the information
environment is mixed. The IPO certification process did not result in lower underpricing
as expected. IPO grading is associated with an improvement in the informativeness of
stock prices as depicted by idiosyncratic volatility. In general, IPOs were priced at a
higher level during the post-grading period.
The evidence with respect to economic impact of IPO grades is likewise mixed.
Actual IPO grades have no influence on the extent of underpricing. IPO grades
significantly positively subscription levels of both retail and institutional investors. An
interesting finding from our study is that the process of grading improves the
informativeness of stock prices but actual grades bear no relationship to stock price
informativeness.
The rest of the paper is structured as follows. In the next section, we describe the
background regarding the IPO grading process in India and draw out the testable
implications. In section 3, we explain our data collection procedure and describe our
sample characteristics. Section 4 contains our empirical results regarding the impact of
IPO grading process on the information environment. Section 5 deals with the economic
impact of the actual IPO grades. Section 6 describes our attempt to see if investors are in
a position to infer IPO grades from publicly available information. The final section
contains our conclusions.

4
2.0 Background and Testable Implications
2.1 Regulatory Framework In March 2007 the Securities Exchange Board of India (SEBI), the securities market
regulator in India, ruled that all initial public offerings (IPO) entering the capital market
must get a compulsory grading from one of the credit rating agencies2. The move was
aimed at allowing only bona fide companies to raise capital and prevent fly-by-night
operators from accessing the capital market. Mandatory IPO grading was to be effective
from May 1, 2007.
IPO grade is the rating assigned by a Credit Rating Agency (CRA) registered with
SEBI, to the IPO of equity shares or any other security which may be converted into or
exchanged with equity shares at a later date. The grade represents a relative assessment
of the fundamentals of that issue in relation to the other listed equity securities in India.
Such grading is generally assigned on a five-point point scale with a higher score
indicating stronger fundamentals and vice versa as below.
IPO grade 1: Poor fundamentals IPO grade 2: Below-average fundamentals IPO grade 3: Average fundamentals IPO grade 4: Above-average fundamentals IPO grade 5: Strong fundamentals
IPO grading can be done either before filing the draft offer documents with SEBI
or thereafter. However, the Prospectus/Red Herring Prospectus, as the case may be, must
contain the grade/s given to the IPO by all CRAs approached by the company for grading
such IPO. Interestingly, IPO grades were not assessed taking into account the price at
which the IPO was to be issued.
2 There are four credit rating agencies in India: CRISIL, CARE, ICRA and Fitch.
5
Under the regulation, companies rather than investor-protection fund would bear
the costs of the grading process. The cost of grading each issue is approximately Rs
500,000 and takes around 3-4 weeks. Grading of IPOs was introduced earlier as an
optional measure by SEBI as part of its initiatives aimed at protecting investors’ interests.
In March 2007 about 15 companies had completed grading with three major credit rating
agencies- ICRA, CRISIL and CARE3. Those that did, interestingly, received a lukewarm
response on the exchanges.
According to CRISIL, one of the top credit rating agencies in India, IPO grading
represents an independent relative assessment of fundamentals of the equity based on the
following:
a. Business Prospects. This comprises i. Industry prospects ii. Company prospects - the alignment between industry opportunities, the company's strategy and its capabilities.
b. Financial Prospects - This includes a rigorous assessment of accountingquality using advanced tools devised by CRISIL Research
c. Management quality - An assessment of the ability of the management tohandle uncertainty in terms of capitalizing on future business opportunity and mitigating the impact of contingencies
d. Corporate governance - An evaluation of the company's governancearchitecture to determine if it is structured such that the risks and rewards ofbusiness are equally available to all shareholders in keeping with the basic tenets of a joint-stock company.
2.2 Pros and Cons of IPO Grading4
Although the move by the Indian regulator to mandate IPO grading is driven by the
overarching necessity to provide small investors with protection, it has not met with
widespread support from the market participants and the financial press. We summarize
below the arguments advanced by both proponents and detractors of the move. 3 Our sample starts from January 1, 2006 and includes the period when firms could voluntarily get their issues graded. 4 We heavily draw upon the work of Jain and Sharma (2008) in developing the arguments in this subsection.
6
The proponents argue that IPO grading is beneficial due to the following reasons:
reduction of information asymmetry, decrease of information overload, independent
expert appraisal of firm fundamentals, provision of meaningful information to
support investment decision, and deterrence of low quality issues. We expand on
these factors below:
Reduction of Information Asymmetry: Most firms that make IPOs are not well-known.
Thus there exists considerable information asymmetry regarding the operations, viability
and future prospects of such firms. Through certification via the IPO grading process,
information asymmetry is sought to be reduced. It is expected that other things being
equal, this reduction in information asymmetry will be accompanied by a reduction in
risk and a consequent reduction in the required rate of return. At the core of this
approach, is the implicit assumption that more information is always preferred to less
information.
Decrease of Information Overload: In the context of the Indian IPO market, information
disclosures have increased substantially such that investors may now face a deluge of
information. This information overload may have the adverse effect of creating
difficulties for rationally processing huge amounts of data in order to arrive at the
investment decision. In this environment, by certifying the quality of the issue, the credit
rating agencies are aiding the investor by reducing the burden of information overload.
Independent Expert Appraisal of Fundamentals: Another possible benefit of the IPO
grading exercise is the appraisal of fundamentals of the issuing firm. Although,
investment bankers are charged with the responsibility of conducting due diligence to
certify the veracity of financial and other critical information provided in the issue

7
prospectus, there exists the issue of conflict of interest. Thus it is argued that investors
would be better served by an independent agency that evaluates the fundamentals of the
firm.
Provision of Meaningful Information: In mandating IPO grading, the approach of SEBI
seems to have shifted from information disclosure to meaningful information disclosure.
The IPO grading exercise essentially entrusts the credit rating agencies with the task of
deriving significant information from a host of subjective factors deemed essential for
investment decision. Thus the credit rating agencies are expected to perform the role of
information processing intermediaries. Given the lack of financial literacy of the average
Indian investor, IPO grading could potentially be an useful exercise.
Deterrence of low quality issues: Firms without track record or credibility, when they try
to access the market for finance, will now face an additional layer of scrutiny. Thus the
lowest quality of issuers might find the going tough and withdraw from the IPO market.
Thus the IPO investors, composed largely of retail investors are precluded from potential
investments in low quality, high risk firms. Thus the weeding out of unviable securities
is another potential fallout of the IPO grading regulation.
The detractors of the move to grade IPOs raise objections that may be categorized
into three groups: viability of the grading process, inherent bias against SMEs, and
credibility of rating agencies. We expand on these arguments below.
Viability of the grading process: The opponents of the IPO grading process argue that
the concept of rating as applied to debt instruments cannot be directly imported to equity
issues. While debt issues are typically rated in terms of downside risk, any rating of
equity necessitates an assessment of the upside potential to the investor. Thus the

8
principal thrust here is the conceptual objection to the fundamental process of rating
equity. Another objection to the rating proposal stems from the inherent subjectivity.
Since the specific methodologies employed by different rating agencies could be different,
it would be difficult if not impossible to assign grades in an objective manner.
Furthermore, the grading process does not take into account the price at which the issue is
to be made. This renders the entire process futile since price is the most significant factor
affecting the viability of a potential investment. For instance, an issue with a low grade
may turn out to be an attractive investment if offered at a low price. Finally,
encapsulation of all relevant information into a single numerical grade is too simplistic to
be of use to investors.
Inherent bias against SMEs: The mandatory grading process entails an additional fixed
compliance cost that includes grading fees and costs of disclosure in addition to the
underwriting and marketing fee payable to investment bankers. These costs are likely to
be a higher percentage of issue proceeds for small and medium sized enterprises.
Furthermore, small firms as compared to large firms are most likely seen to highly risky
and this inherent bias is likely to work against them. At the extreme, the grading
stipulation is likely to wipe out the IPO exit option for promising SMEs. The unviability
of the exit option is likely to render venture capital investments in small high enterprises
unattractive with deeper repercussions for capital formation and economic growth.5
Credibility of rating agencies: The move to mandate IPO grading, presupposes the
credibility of rating agencies. This presumption is questionable on three counts. First,
5 According to Reserve Bank of India reports (several issues) SMEs contribute up to 40% of industrial production in India.
9
the oligopolistic structure of rating agencies raises serious concerns of credibility. 6
Second, since rating agencies offer ancillary services, there exists considerable scope for
abuse in terms of compromising grading obligations for selling these services. Third, the
lack of responsibility and concomitant liability raises a serious question regarding the
credibility of the exercise. Since rating agencies are prone to using the standard
disclaimers thus precluding potential legal liability, the independence and fairness
arguments are considerably weakened.
2.3 Testable Implications
Based on the arguments advanced in the previous subsection, we can draw a number of
testable implications.
First, since the underlying premise behind the IPO grading is the provision of useful
information to the naïve investor, a basic question of interest to us is whether the
information environment improved in the post-grading period. If it did, then we would
expect to see a lower level of underpricing in the post-grading period.
A second consequence of the improved information environment for Indian IPOs is
better pricing. Since one of the reasons behind the observed underpricing is information
asymmetry, any episode that results in an attenuation of the existing information
asymmetry should result in higher issue prices.
A third possible effect of the IPO grading exercise is the potential withdrawal of low
quality issues from the market. However, this issue is likely to be difficult to address due
to two reasons. First, an unambiguous assessment of quality is fraught with conceptual
and measurement problems. Second, a firm’s internal deliberations regarding making an
IPO and subsequent withdrawal taking into account the IPO grading requirement are 6 The Enron debacle comes to one’s mind in this context.
10
potentially unobservable. Hence, we do not pursue this line of enquiry further in this
paper.
Fourth, as a consequence of the IPO grading exercise, firms are likely to disseminate
more information to CRAs and the public. This is because high quality firms have
incentives to portray themselves in better light and they expect to achieve that by
augmenting the quantity and quality of information. The enhancement in the information
environment following IPO grading is likely to result in an increase in the
informativeness of stock prices.
Finally, if IPO grades have information content, then investors will use them to guide
their decision to subscribe to a given issue. This event will therefore increase the
variability of subscription levels in the post-grading period especially for retail investors.
3.0 Data and Sample Selection
Our sample includes all Indian IPOs that were issued from January 1, 2006 to December
31, 2008. We obtain our data from four different sources. SDC Platinum New Issues data
base was our source for basic issue characteristics. The website of the regulator was
utilized as the source of issue prospectuses. Bloomberg database was our source for
stock prices and trading volume. Finally, we accessed the websites of the credit rating
agencies to obtain the IPO grades.
Our overall sample is composed of 177 issues out of 54 were graded. Two of the
issues were graded by two agencies. In table 1, we show the distribution of our sample of
graded IPOs across the five grades. The sample is also broke down by the four rating
agencies. Twenty four out of fifty six, i.e. 43% of the graded issues received a grade of 3

11
signifying average fundamentals. Ten out of fifty six issues obtained a grade of 4
indicating above average fundamentals. Fourteen issues (25%) were graded 2 denoting
below average fundamentals. 14% of the issues received a grade of 1 indicating poor
fundamentals. CARE, CRISIL, and ICRA seem to have roughly equal share of the
grading business. Fitch seems to be a minor player. The above distribution also indicates
that the median and mode grade received by firms equal 3. Thus it is likely that an
investor may attribute an average grade of 3 for ungraded issues. We notice that a
substantial number of issues even in the post-May 1, 2007 period are not graded.7
In table 2, we show descriptive statistics regarding offer, firm and governance
characteristics of our entire sample and the two subsamples based on whether the issue
was graded or not. Most of the characteristics are similar for the graded and ungraded
subsamples with one notable exception. The net proceeds of graded firms are
significantly lower than that of ungraded firms. This finding implies that firms making
smaller issues have incentives to signal their quality by seeking grading.
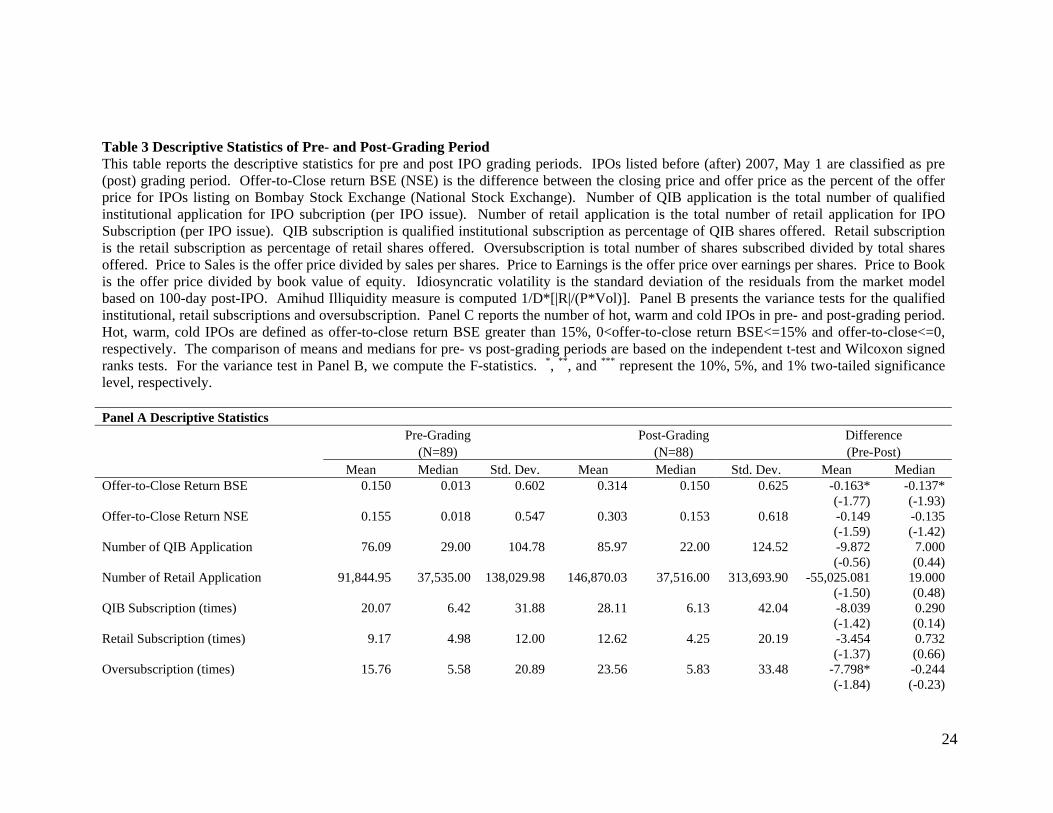
In table 3, we compare key IPO-related variables of firms during the pre- and
post- grading periods. IPOs listed before May 1, 2007 are considered pre-grading period
and those issued after that date belong to the post-grading period. The results indicate
that the initial listing returns on Bombay Stock Exchange (BSE) increase in the post-
grading period and is statistically significant at the 10% level 8 . The level of
oversubscription is also higher in the post-grading period and is statistically significant at
the 10% level. Multiples such as P/S and P/B increase substantially in the post-grading
7 Our conversations with some of the issue managers reveal that the ungraded firms received approval from SEBI prior to May 1, 2007. 8 We show results using prices from both the Bombay Stock Exchange and National Stock Exchange since both exchanges are active markets for trading the issues.
12
period. This finding indicates better pricing power for IPOs, especially those that have
valuable growth options. We find that idiosyncratic volatility increases significantly in
the post-grading period providing early evidence regarding the increase in
informativeness of stock prices.9
One of the expected outcomes of the grading process is to align the retail
investors’ demand for issues with the fundamentals of the issuing firm. If retail investors
become more discerning as a result of the grading process, then the variability in the
subscription levels should increase. In fact, this is exactly what we observe. The
standard deviation of number of retail applications per issue increases significantly in the
post-grading period. Furthermore, the variability in institutional and retail subscription
levels both increase in the post-grading period.
4.0 IPO Grading and the Information Environment
In this section, we empirically examine the issue of whether IPO grading improved the
information environment for newly issues equity securities in the Indian stock markets.
In the next section, we study the economic impact of actual IPO grades.
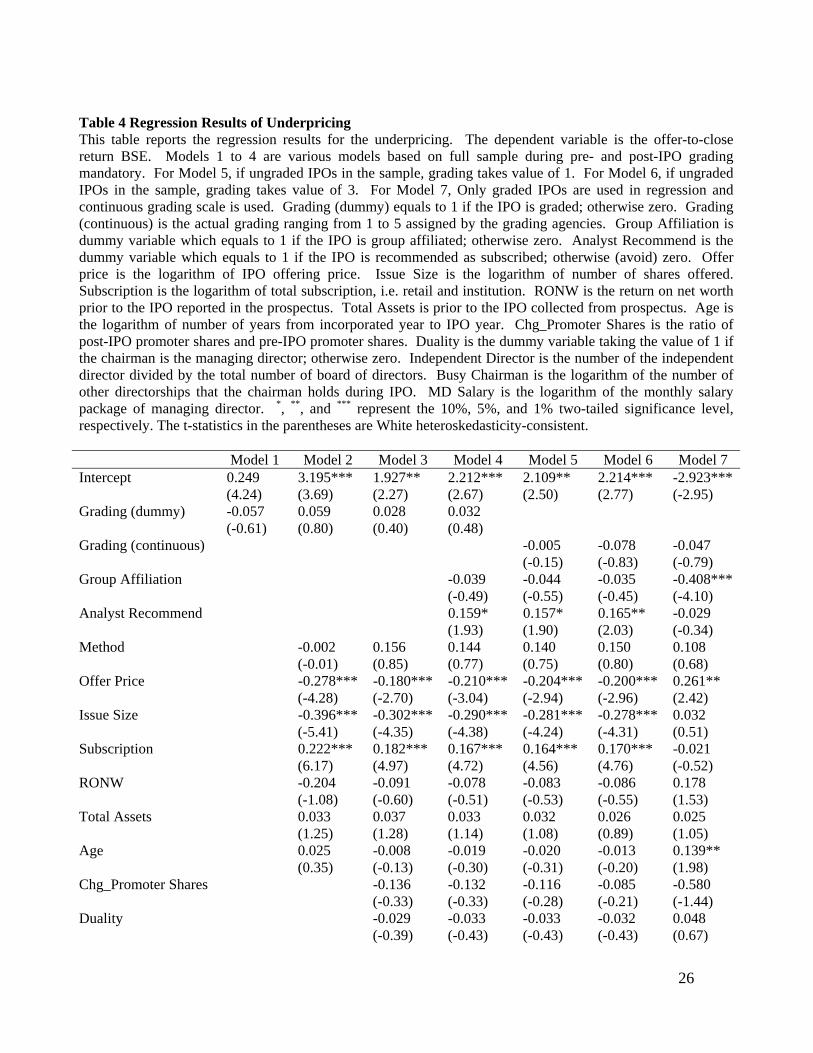
We study three variables of interest – underpricing, idiosyncratic volatility and
subscription level. Our results using underpricing as the dependent variable are shown in
table 4, models 1-4. Underpricing is measured by the initial listing return measured from
offer-to-close using stock prices from the Bombay Stock Exchange (BSE). We use a
multivariate regression framework with controls for issue, firm, and governance
characteristics. The key result from these regressions is that the grading dummy, which
9 We explore this issue in further detail in the next section.
13
takes the value of one for graded IPOs and zero for others, is not statistically significant.
This finding shows that IPO grading does not result in a decrease in underpricing.
Issues with higher offer prices experience lower listing returns. This finding is
consistent with the view that offer price acts as a quality proxy. Higher quality issues are
less underpriced, ceteris paribus. Issue size also has a negative coefficient indicating that
large issues are less underpriced consistent with the belief that size is a proxy for quality.
Neither firm characteristics nor governance features have any impact on the level of
underpricing. Subscription level has a positive and highly significant impact on
underpricing. Subscription level is a surrogate for latent demand and as such this finding
indicates that issues which elicit greater demand from investors earn higher initial
returns.
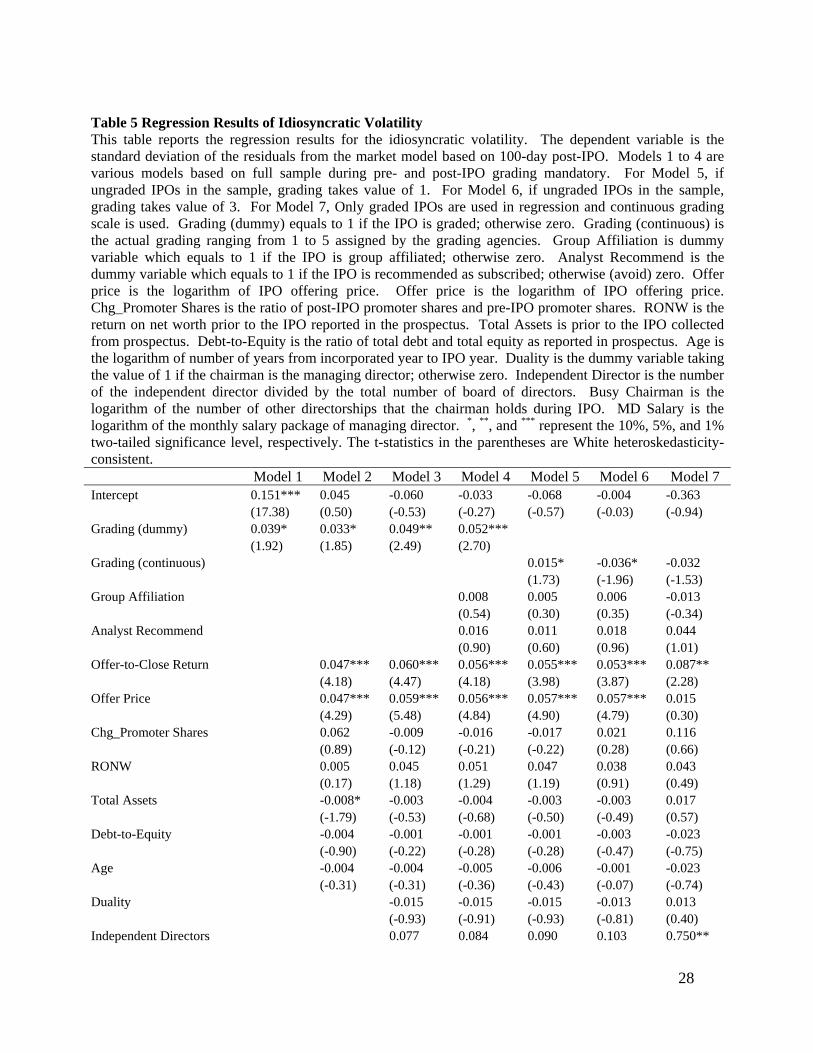
We further examine the impact of IPO grading on information environment by
using idiosyncratic volatility as the dependent variable in a multivariate setting. Our
choice of idiosyncratic volatility is based on recent empirical work by researchers such
as Durnev, Morck, and Yeung (2004). If grading improves informativeness, then we
should expect graded firms to have higher idiosyncratic volatility other things being
equal. We control for a set of variables reflecting issue, firm, and governance features as
before.
Our results are reported in table 5 (models 1-4). We find that the grading dummy
is statistically significant and positively impacts idiosyncratic volatility. In addition,
underpricing and offer price have positive significant effects on idiosyncratic volatility.
We construe this finding as support for the view that IPO grading improves the
information environment of the Indian market.

14
Another aspect of informativeness is the level of subscription by retail and
institutional investors. A key characteristic of the Indian IPO market is the extensive
participation by retail investors. Often, issues are heavily oversubscribed and market
observers have attributed excess demand to retail investor overreaction. If the IPO
grading exercise results in improving the informativeness of India’s primary markets,
then we expect excess demand to be curbed for graded issues as compared to ungraded
issues.
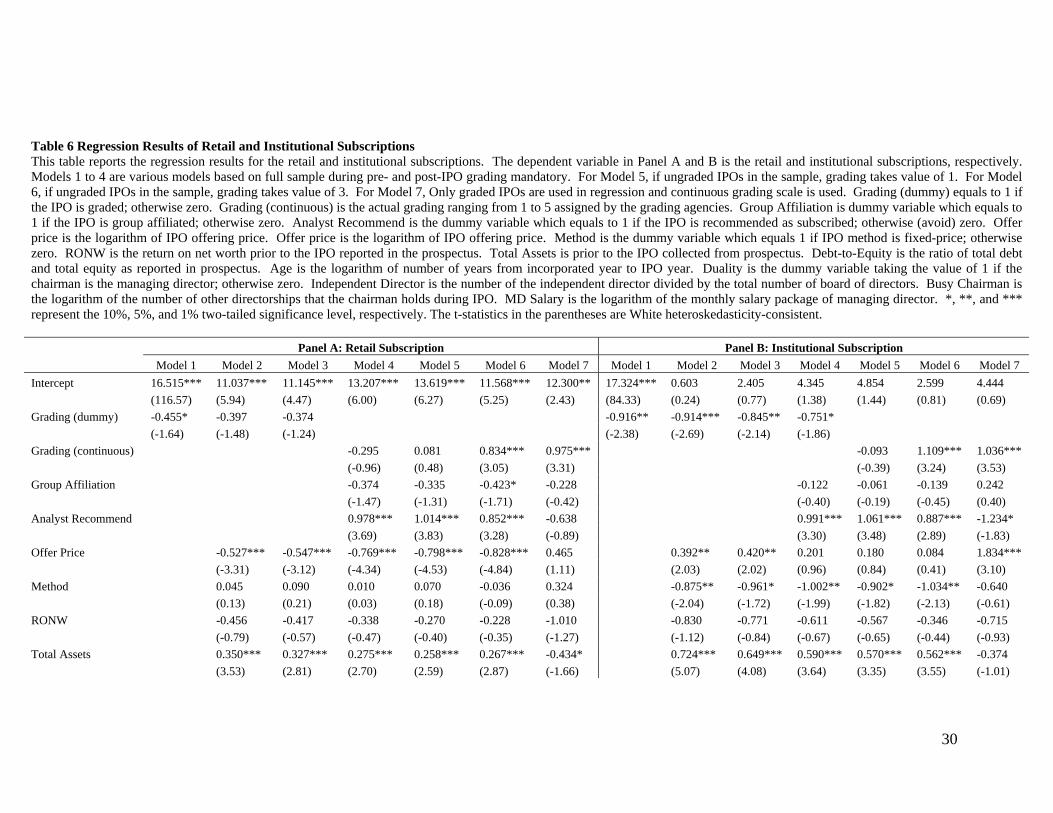
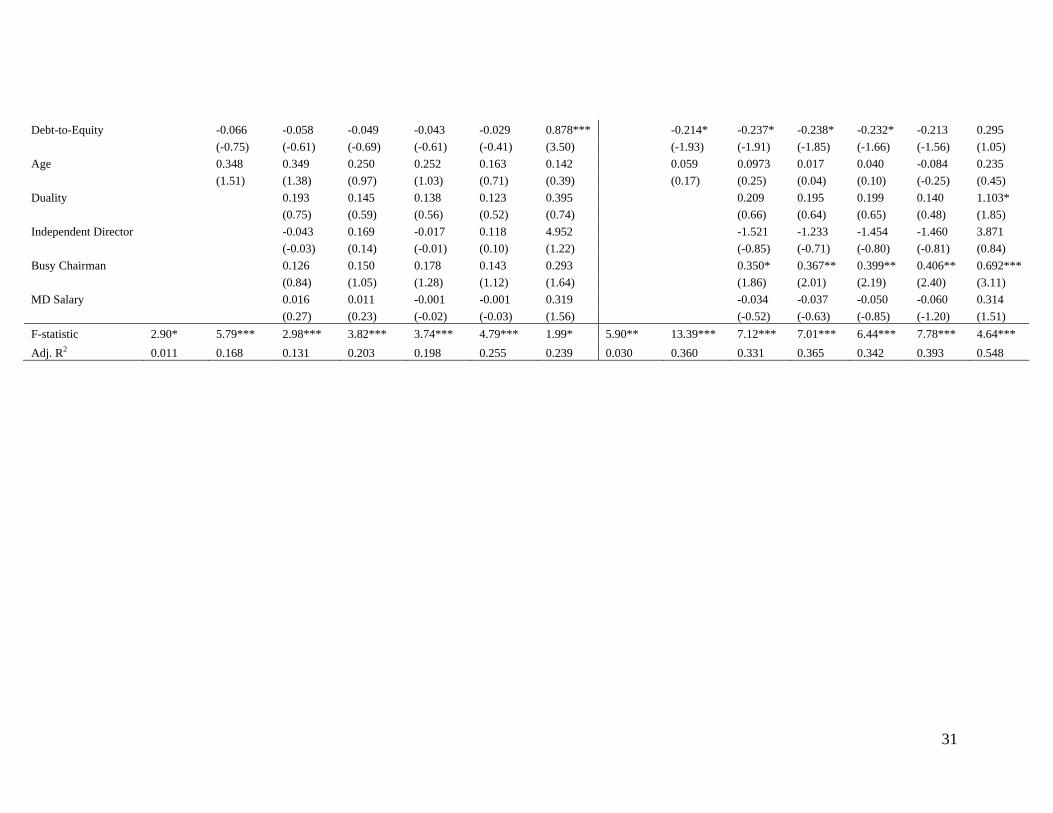
In table 6, we show empirical results using retail and institutional subscription
levels as dependent variables. In panel A, we report results of retail subscription. We
only find weak evidence (statistical significance at 10%) that grading dummy is
associated with a decrease in retail subscription levels. This result is not robust to
inclusion of control variables. Offer price enters with a negative coefficient indicating
that high offer price acts as deterrent for retail investors. Total assets have a positive and
statistically significant effect on retail subscription. This finding indicates that investors
favour IPOs of large firms ceteris paribus.
In Panel B, of table 6, we report multivariate regression results of institutional
subscription levels. The grading dummy has a negative and statistically significant
coefficient indicating that institutional subscription decreases for graded IPOs other
things being equal. This finding denotes that the informational environment of
institutional investors improves due to the grading exercise.
Summing up, we find mixed evidence regarding the impact of IPO certification
on the information environment. The IPO grading process did not reduce underpricing as
15
expected. IPO grading is associated with an improvement in the informativeness of stock
prices as measured by idiosyncratic volatility.
5.0 Economic Impact of Actual IPO Grades
In this section, we examine whether the grades assigned by the credit rating
agencies have information content. We would deem the grades to have information
content if grades have an economic impact. We gauge economic impact by observing
underpricing, idiosyncratic volatility, and subscription levels. Ostensibly, investors have
access to other sources besides IPO grades assigned by credit rating agencies. So for IPO
grades to have an economic impact, they should have greater credibility in the perception
of investors.
Models 5, 6, and 7 in tables 4, 5, and 6 contain our test results. In models 5 and 6
we include both graded and ungraded firms. In model 5, ungraded firms are assigned the
grade of one, the lowest possible grade. In model 6, we assign a grade of three to
ungraded firms. This assignment implicitly assumes that investors regard the typical
ungraded issue to be of average quality. Finally in model 7, we use only graded firms in
the estimations.
We use the variable ‘Analyst Recommend’ which is a dummy variable that takes
the value of one if the financial press recommends subscription of the issue and zero
otherwise.10 The ‘Analyst Recommend’ variable captures the impact of an alternate
credible source of rating for the issue. As such, it allows us to estimate the marginal
effect of the grade given out by the credit rating agencies. Empirical estimates of
10 We utilize the recommendations of IPOs published by Businessline, a business publication widely followed by investors.

16
multivariate regression models of underpricing, contained in table 4, show that Analyst
Recommend has a positive and statistically significant effect on underpricing.
Interestingly, Analyst Recommend is not statistically significant in model 7, when we use
only graded issues. But the grade variable is also not significant. The results indicate
that grades do not influence the underpricing of issues.
Empirical tests using idiosyncratic volatility as the dependent variable show that
IPO grades do not have a reliable effect. Thus while the process of grading improves the
information environment for Indian IPOs, the actual grades have no relationship to the
informativeness of stock prices as proxied by idiosyncratic volatility.
Finally, we examine the impact of actual grades on retail and institutional
subscription levels. Panel A of Table 6 contains the empirical results using retail
subscription as the dependent variable. IPO grade positively influences retail
subscription levels (models 6 and 7) and is statistically significant at the 1% level. In
panel B of table 6 we report results using institutional subscription as the dependent
variable. Interestingly, IPO grade also significantly positively influences institutional
subscription. Taken together, these results imply that both retail and institutional
investors pay attention to the grades released by credit rating agencies. They do seem to
have credibility in that they affect both the retail and institutional demand for issues.
The results from this section provide mixed evidence regarding the economic
impact of IPO grades. This leads us to the natural question as to whether investors can
form their own impressions using issue details provided in the prospectus and other
publicly available information. We address this important issue in the following section.
17
6.0 Can Investors’ Infer the Grades from Publicly Available Information?
In this section, we examine whether investors can infer the quality of an issue by using
publicly available information. We perform a pseudo grading exercise taking into
account financial information, firm characteristics, and governance/certification features
pertaining to the issue.
In table 7 panel A, we display some of the key variables categorized on the basis
of actual grades obtained by the firms. We notice that most of the characteristics do not
change monotonically as we move from lower to higher grades. The exceptions are age
and post-IPO percentage shareholdings of promoters.
We score each issue on the basis of financials, credibility, and
governance/certification. For financials, we consider EPS and D/E11. For credibility, we
include age and total assets. Governance/ certification is indicated by percentage of
independent directors, group affiliation, and post-IPO percentage shareholdings of
promoters. Each issue is scored on each characteristic based on whether it is above or
below the median for the overall sample. The scoring is reversed for D/E since higher
values of this variable denote lower quality. We aggregate scores based on
characteristics to first obtain financial, credibility, and governance/certification sub-
scores. We then equally weight sub-scores to obtain an overall score for each issue.
Based on the scoring scheme, issue scores will range from 0 to 3. We add one to the
overall score to make it comparable to the scoring scheme followed by credit rating
agencies.12 We label these as pseudo grades.
11 We did not consider multiples since the rating agencies did not consider issue price is assigning the grades. Furthermore, firms may be determining the issue price subsequent to obtaining the grades from the rating agencies. 12 Since none of the issues received a grade of five, we essentially have a 4 point scale.

18
In order to ascertain the efficacy of the pseudo grading process, we display the
4x4 matrix of actual versus pseudo grades. Overall, we find that 24 out of 54 issues are
mis-classified amounting to an error percentage of 44%. We tried several experiments
changing the variables and the weightings. These efforts did not result in an
improvement in classification accuracy of pseudo-grades.
Summing up, we conclude that there is no quick substitute to grades given out by
credit rating agencies. Evidently, rating agencies are using other information besides the
information provided by issuing firms in determining the grades. The non-monotonic
changes in key characteristics across the different grades indicate that a mechanical
scoring scheme cannot replicate the grading process of the rating agencies.
7.0 Conclusion
Despite the plethora of research on the U.S. IPO market, there is inconclusive evidence
regarding the economic effect of certification. Using a natural experiment of regulator
mandated IPO grading requirement, we examine the role of third-party certification in the
Indian IPO market. This unique setting lets us address the broader issue of whether
certification is more valuable in emerging markets with institutional voids. Our findings
are expected to be useful to regulators and policy makers with similar shortcomings.
We find mixed evidence regarding the impact of IPO grading exercise on the
information environment and the economic effects of actual grades. Underpricing is
unaffected by the grading process. A key result of our paper is that stock price
informativeness as proxied by idiosyncratic volatility increases significantly due to IPO
grading. However, the actual grades do not have a relationship with stock price

19
informativeness. We also document the finding that the grades are not mechanically
derived from publicly available information. Our evidence is consistent with the view
that credit rating agencies are information processing intermediaries that can potentially
supply useful information of relevance to both retail and institutional investors in an
emerging market setting.
20
References Carter, R., Dark, R., Singh, A., 1997. Underwriter reputation, initial returns, and the long- run performance of initial public offering stocks. Journal of Finance 53, 289-311. Durnev, A., Morck R., Yeung, B., 2004. Value-enhancing capital budgeting and firm- specific stock return variation. Journal of Finance 59, 65-105. Jain, T., Sharma, R., 2008. Mandatory IPO grading: Reflections from the Indian capital Markets. SSRN Working Paper. Khanna, T., Palepu, K., 2000. Is group membership profitable in emerging markets? An analysis of diversified Indian business groups. Journal of Finance 55, 867-891. Lee, P. M., Wahal, S., 2004. Grandstanding, certification and the underpricing of venture capital backed IPOs. Journal of Financial Economics 73, 375-407. Loughran. T., Ritter. J., 2002. Why don't issuers get upset about leaving money on the table in IPOs? Review of Financial Studies 15, 413-443.

21
Table 1 Grading Distribution This table presents the number of IPO firms graded by four credit rating agencies registered with Securities and Exchange Board of India (SEBI). Four registered IPO grading agencies are CARE, CRISIL, ICRA, and FITCH. The grading is assigned on a five-point scale ranging from 1 to 5. IPOs graded 1 are poor fundamentals. IPOs graded 2 are below average fundamentals. IPOs graded 3 are average fundamentals. IPOs graded 4 are above average fundamentals. IPOs graded 5 are strong fundamentals. The IPO grading mandatory started from 2007, May 1. Our sample consists of 177 IPO firms and 54 IPOs are graded from 2006 to 2008.*
Grading Scale
Grading Agency 1 2 3 4 5 Total
CARE 2 6 9 4 0 21
CRISIL 4 2 6 4 0 16
ICRA 2 6 7 1 0 16
FITCH 0 0 2 1 0 3
Total 8 14 24 10 0 56
* Two IPOs in our sample are graded by two agencies.

22
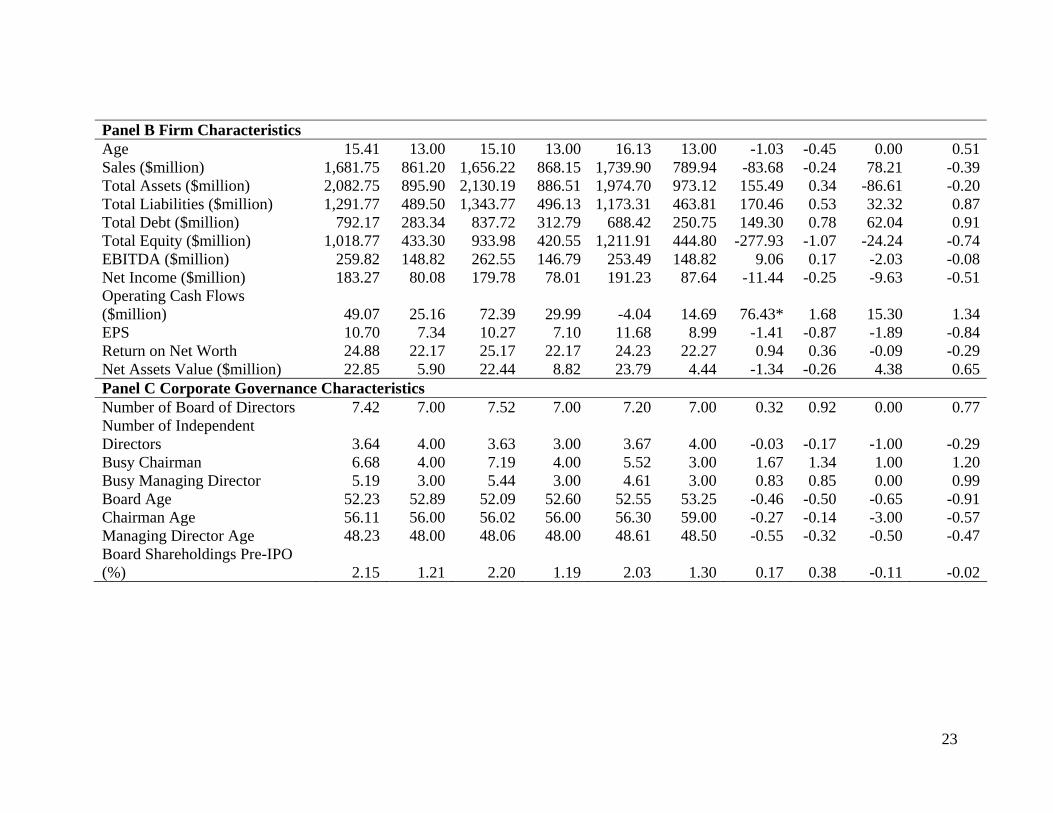
Table 2 Descriptive Statistics This table presents the offer, firm and corporate governance characteristics in Panel A, B and C, respectively. The IPO sample period is from 2006 to 2008. Shares offered is the number of shares issued to the public by the issuers. Net proceeds is the total amount excluding fees and expenses raised by the issuers. Offer price is the issuing price of the IPO shares. Low (High) file price is the lowest (highest) offer price. Offer-to-Close return BSE (NSE) is the difference between the closing price and offer price as the percent of the offer price for IPOs listing on Bombay Stock Exchange (National Stock Exchange). The number of underwriters includes lead and co-lead manager in the IPO activity. Age is the number of years from incorporating to listing year for IPO firms. Sales, total assets, total liabilities, total debt, total equity, EBITDA, net income, operating cash flows, EPS, return on net worth and net assets value are based on the most recent fiscal year ending prior to the IPO from the IPO prospectus. Number of board of directors is the total number of directors, number of independent directors is the total independent or outside directors. Busy chairman (managing director) is the multiple directorships possessed by chairman of the board (managing director). Board age is the average age of the board of directors. Chairman (managing director) age is the age of chairman of the board and managing director. Board shareholding pre-IPO is the number shares held by board of directors. The corporate governance data are retrieved from the IPO prospectus. The mean and median comparisons of ungraded and graded samples are based on the independent t-test and Wilcoxon Signed Ranks test, respectively. ***, **, and * represent significance at the 1%, 5%, and 10% levels for a two-tailed test, respectively. All Firms Ungraded Firms Graded Firms Difference (N=177) (N=123) (N=54) (Ungraded – Graded)
Mean Median Mean Median Mean Median Mean t-test Median
Wilcoxon Signed-
Rank test Panel A Offer Characteristics Shares Offered (million) 17.81 6.41 17.41 6.67 18.70 5.96 -1.29 -0.17 0.70 0.07Net Proceeds ($million) 34.39 13.29 35.39 16.16 32.11 7.85 3.27 0.17 8.31*** 2.88Offer Price 193.58 140.00 185.63 130.00 211.70 150.00 -26.08 -0.91 -20.00 -0.91Low File Price 176.60 125.00 168.13 120.00 195.89 140.00 -27.76 -1.05 -20.00 -1.09High File Price 199.55 145.00 191.49 130.00 217.93 155.00 -26.44 -0.88 -25.00 -1.04Offer-to-Close Return BSE 0.23 0.06 0.25 0.08 0.19 0.05 0.06 0.56 0.03 0.42Offer-to-Close Return NSE 0.23 0.09 0.27 0.14 0.13 0.04 0.14 1.53 0.10 1.13Number of Underwriters 1.93 2.00 1.83 2.00 2.15 2.00 -0.32 -1.39 0.00 0.72
23
Panel B Firm Characteristics Age 15.41 13.00 15.10 13.00 16.13 13.00 -1.03 -0.45 0.00 0.51Sales ($million) 1,681.75 861.20 1,656.22 868.15 1,739.90 789.94 -83.68 -0.24 78.21 -0.39Total Assets ($million) 2,082.75 895.90 2,130.19 886.51 1,974.70 973.12 155.49 0.34 -86.61 -0.20Total Liabilities ($million) 1,291.77 489.50 1,343.77 496.13 1,173.31 463.81 170.46 0.53 32.32 0.87Total Debt ($million) 792.17 283.34 837.72 312.79 688.42 250.75 149.30 0.78 62.04 0.91Total Equity ($million) 1,018.77 433.30 933.98 420.55 1,211.91 444.80 -277.93 -1.07 -24.24 -0.74EBITDA ($million) 259.82 148.82 262.55 146.79 253.49 148.82 9.06 0.17 -2.03 -0.08Net Income ($million) 183.27 80.08 179.78 78.01 191.23 87.64 -11.44 -0.25 -9.63 -0.51Operating Cash Flows ($million) 49.07 25.16 72.39 29.99 -4.04 14.69 76.43* 1.68 15.30 1.34EPS 10.70 7.34 10.27 7.10 11.68 8.99 -1.41 -0.87 -1.89 -0.84Return on Net Worth 24.88 22.17 25.17 22.17 24.23 22.27 0.94 0.36 -0.09 -0.29Net Assets Value ($million) 22.85 5.90 22.44 8.82 23.79 4.44 -1.34 -0.26 4.38 0.65Panel C Corporate Governance Characteristics Number of Board of Directors 7.42 7.00 7.52 7.00 7.20 7.00 0.32 0.92 0.00 0.77Number of Independent Directors 3.64 4.00 3.63 3.00 3.67 4.00 -0.03 -0.17 -1.00 -0.29Busy Chairman 6.68 4.00 7.19 4.00 5.52 3.00 1.67 1.34 1.00 1.20Busy Managing Director 5.19 3.00 5.44 3.00 4.61 3.00 0.83 0.85 0.00 0.99Board Age 52.23 52.89 52.09 52.60 52.55 53.25 -0.46 -0.50 -0.65 -0.91Chairman Age 56.11 56.00 56.02 56.00 56.30 59.00 -0.27 -0.14 -3.00 -0.57Managing Director Age 48.23 48.00 48.06 48.00 48.61 48.50 -0.55 -0.32 -0.50 -0.47Board Shareholdings Pre-IPO (%) 2.15 1.21 2.20 1.19 2.03 1.30 0.17 0.38 -0.11 -0.02
24
Table 3 Descriptive Statistics of Pre- and Post-Grading Period This table reports the descriptive statistics for pre and post IPO grading periods. IPOs listed before (after) 2007, May 1 are classified as pre (post) grading period. Offer-to-Close return BSE (NSE) is the difference between the closing price and offer price as the percent of the offer price for IPOs listing on Bombay Stock Exchange (National Stock Exchange). Number of QIB application is the total number of qualified institutional application for IPO subcription (per IPO issue). Number of retail application is the total number of retail application for IPO Subscription (per IPO issue). QIB subscription is qualified institutional subscription as percentage of QIB shares offered. Retail subscription is the retail subscription as percentage of retail shares offered. Oversubscription is total number of shares subscribed divided by total shares offered. Price to Sales is the offer price divided by sales per shares. Price to Earnings is the offer price over earnings per shares. Price to Book is the offer price divided by book value of equity. Idiosyncratic volatility is the standard deviation of the residuals from the market model based on 100-day post-IPO. Amihud Illiquidity measure is computed 1/D*[|R|/(P*Vol)]. Panel B presents the variance tests for the qualified institutional, retail subscriptions and oversubscription. Panel C reports the number of hot, warm and cold IPOs in pre- and post-grading period. Hot, warm, cold IPOs are defined as offer-to-close return BSE greater than 15%, 0<offer-to-close return BSE<=15% and offer-to-close<=0, respectively. The comparison of means and medians for pre- vs post-grading periods are based on the independent t-test and Wilcoxon signed ranks tests. For the variance test in Panel B, we compute the F-statistics. *, **, and *** represent the 10%, 5%, and 1% two-tailed significance level, respectively. Panel A Descriptive Statistics Pre-Grading Post-Grading Difference (N=89) (N=88) (Pre-Post) Mean Median Std. Dev. Mean Median Std. Dev. Mean Median Offer-to-Close Return BSE 0.150 0.013 0.602 0.314 0.150 0.625 -0.163*
(-1.77) -0.137* (-1.93)
Offer-to-Close Return NSE 0.155 0.018 0.547 0.303 0.153 0.618 -0.149 (-1.59)
-0.135 (-1.42)
Number of QIB Application 76.09 29.00 104.78 85.97 22.00 124.52 -9.872 (-0.56)
7.000 (0.44)
Number of Retail Application 91,844.95 37,535.00 138,029.98 146,870.03 37,516.00 313,693.90 -55,025.081 (-1.50)
19.000 (0.48)
QIB Subscription (times) 20.07 6.42 31.88 28.11 6.13 42.04 -8.039 (-1.42)
0.290 (0.14)
Retail Subscription (times) 9.17 4.98 12.00 12.62 4.25 20.19 -3.454 (-1.37)
0.732 (0.66)
Oversubscription (times) 15.76 5.58 20.89 23.56 5.83 33.48 -7.798* (-1.84)
-0.244 (-0.23)
25
Price to Sales 147.83 45.78 279.76 210.22 85.23 336.95 -62.397 (-1.34)
-39.445** (-2.31)
Price to Earnings 28.64 13.62 34.78 28.12 13.52 33.32 0.514 (0.10)
0.109 (0.72)
Price to Book 85.58 42.92 109.03 125.31 67.52 142.60 -39.728** (-2.08)
-24.596** (-2.23)
Idiosyncratic Volatility
0.140 0.117 0.095 0.184 0.161 0.120 -0.044*** (-2.69)
-0.044*** (-2.63)
Amihud Illiquidity 0.107x10⁻⁹ 0.496x10⁻¹¹ 0.868x10⁻⁹ 0.404x10⁻¹⁰ 0.615x10⁻¹¹ 0.170x10⁻⁹ 0.067 (0.71)
-0.119 (-1.23)
Panel B Test for Variance (F-statistic) – IPO Subscription Variables F-statistic P-value Number of QIB Application 1.41 0.11 Number of Retail Application 5.16*** 0.00 QIB Subscription (times) 1.74** 0.01 Retail Subscription (times) 2.83*** 0.00 Oversubscription (times) 2.57*** 0.00 Panel C Number of Hot, Warm and Cold IPOs
Pre-
Grading Post -
Grading Number of Hot IPOs (Offer-to-Close Return BSE>15%) 31 44 Number of Warm IPOs (0<Offer-to-Close Return BSE<=15%) 16 12 Number of Cold IPOs (Offer-to-Close Return BSE<=0%) 42 32
26
Table 4 Regression Results of Underpricing This table reports the regression results for the underpricing. The dependent variable is the offer-to-close return BSE. Models 1 to 4 are various models based on full sample during pre- and post-IPO grading mandatory. For Model 5, if ungraded IPOs in the sample, grading takes value of 1. For Model 6, if ungraded IPOs in the sample, grading takes value of 3. For Model 7, Only graded IPOs are used in regression and continuous grading scale is used. Grading (dummy) equals to 1 if the IPO is graded; otherwise zero. Grading (continuous) is the actual grading ranging from 1 to 5 assigned by the grading agencies. Group Affiliation is dummy variable which equals to 1 if the IPO is group affiliated; otherwise zero. Analyst Recommend is the dummy variable which equals to 1 if the IPO is recommended as subscribed; otherwise (avoid) zero. Offer price is the logarithm of IPO offering price. Issue Size is the logarithm of number of shares offered. Subscription is the logarithm of total subscription, i.e. retail and institution. RONW is the return on net worth prior to the IPO reported in the prospectus. Total Assets is prior to the IPO collected from prospectus. Age is the logarithm of number of years from incorporated year to IPO year. Chg_Promoter Shares is the ratio of post-IPO promoter shares and pre-IPO promoter shares. Duality is the dummy variable taking the value of 1 if the chairman is the managing director; otherwise zero. Independent Director is the number of the independent director divided by the total number of board of directors. Busy Chairman is the logarithm of the number of other directorships that the chairman holds during IPO. MD Salary is the logarithm of the monthly salary package of managing director. *, **, and *** represent the 10%, 5%, and 1% two-tailed significance level, respectively. The t-statistics in the parentheses are White heteroskedasticity-consistent. Model 1 Model 2 Model 3 Model 4 Model 5 Model 6 Model 7 Intercept 0.249 3.195*** 1.927** 2.212*** 2.109** 2.214*** -2.923*** (4.24) (3.69) (2.27) (2.67) (2.50) (2.77) (-2.95) Grading (dummy) -0.057 0.059 0.028 0.032 (-0.61) (0.80) (0.40) (0.48) Grading (continuous) -0.005 -0.078 -0.047 (-0.15) (-0.83) (-0.79) Group Affiliation -0.039 -0.044 -0.035 -0.408*** (-0.49) (-0.55) (-0.45) (-4.10) Analyst Recommend 0.159* 0.157* 0.165** -0.029 (1.93) (1.90) (2.03) (-0.34) Method -0.002 0.156 0.144 0.140 0.150 0.108 (-0.01) (0.85) (0.77) (0.75) (0.80) (0.68) Offer Price -0.278*** -0.180*** -0.210*** -0.204*** -0.200*** 0.261** (-4.28) (-2.70) (-3.04) (-2.94) (-2.96) (2.42) Issue Size -0.396*** -0.302*** -0.290*** -0.281*** -0.278*** 0.032 (-5.41) (-4.35) (-4.38) (-4.24) (-4.31) (0.51) Subscription 0.222*** 0.182*** 0.167*** 0.164*** 0.170*** -0.021 (6.17) (4.97) (4.72) (4.56) (4.76) (-0.52) RONW -0.204 -0.091 -0.078 -0.083 -0.086 0.178 (-1.08) (-0.60) (-0.51) (-0.53) (-0.55) (1.53) Total Assets 0.033 0.037 0.033 0.032 0.026 0.025 (1.25) (1.28) (1.14) (1.08) (0.89) (1.05) Age 0.025 -0.008 -0.019 -0.020 -0.013 0.139** (0.35) (-0.13) (-0.30) (-0.31) (-0.20) (1.98) Chg_Promoter Shares -0.136 -0.132 -0.116 -0.085 -0.580 (-0.33) (-0.33) (-0.28) (-0.21) (-1.44) Duality -0.029 -0.033 -0.033 -0.032 0.048 (-0.39) (-0.43) (-0.43) (-0.43) (0.67)

27
Independent Director -0.017 0.016 0.032 0.027 0.311 (-0.06) (0.05) (0.11) (0.092) (0.46) Busy Chairman -0.015 -0.010 -0.013 -0.013 -0.007 (-0.47) (-0.32) (-0.41) (-0.42) (-0.14) MD Salary 0.005 0.005 0.006 0.007 0.090** (0.45) (0.45) (0.56) (0.63) (2.50) F-statistic 0.32 7.83*** 3.44*** 3.21*** 3.20*** 3.27*** 2.52** Adj. R2 -0.004 0.249 0.182 0.188 0.188 0.192 0.357
28
Table 5 Regression Results of Idiosyncratic Volatility This table reports the regression results for the idiosyncratic volatility. The dependent variable is the standard deviation of the residuals from the market model based on 100-day post-IPO. Models 1 to 4 are various models based on full sample during pre- and post-IPO grading mandatory. For Model 5, if ungraded IPOs in the sample, grading takes value of 1. For Model 6, if ungraded IPOs in the sample, grading takes value of 3. For Model 7, Only graded IPOs are used in regression and continuous grading scale is used. Grading (dummy) equals to 1 if the IPO is graded; otherwise zero. Grading (continuous) is the actual grading ranging from 1 to 5 assigned by the grading agencies. Group Affiliation is dummy variable which equals to 1 if the IPO is group affiliated; otherwise zero. Analyst Recommend is the dummy variable which equals to 1 if the IPO is recommended as subscribed; otherwise (avoid) zero. Offer price is the logarithm of IPO offering price. Offer price is the logarithm of IPO offering price. Chg_Promoter Shares is the ratio of post-IPO promoter shares and pre-IPO promoter shares. RONW is the return on net worth prior to the IPO reported in the prospectus. Total Assets is prior to the IPO collected from prospectus. Debt-to-Equity is the ratio of total debt and total equity as reported in prospectus. Age is the logarithm of number of years from incorporated year to IPO year. Duality is the dummy variable taking the value of 1 if the chairman is the managing director; otherwise zero. Independent Director is the number of the independent director divided by the total number of board of directors. Busy Chairman is the logarithm of the number of other directorships that the chairman holds during IPO. MD Salary is the logarithm of the monthly salary package of managing director. *, **, and *** represent the 10%, 5%, and 1% two-tailed significance level, respectively. The t-statistics in the parentheses are White heteroskedasticity-consistent. Model 1 Model 2 Model 3 Model 4 Model 5 Model 6 Model 7 Intercept 0.151*** 0.045 -0.060 -0.033 -0.068 -0.004 -0.363 (17.38) (0.50) (-0.53) (-0.27) (-0.57) (-0.03) (-0.94) Grading (dummy) 0.039* 0.033* 0.049** 0.052*** (1.92) (1.85) (2.49) (2.70) Grading (continuous) 0.015* -0.036* -0.032 (1.73) (-1.96) (-1.53) Group Affiliation 0.008 0.005 0.006 -0.013 (0.54) (0.30) (0.35) (-0.34) Analyst Recommend 0.016 0.011 0.018 0.044 (0.90) (0.60) (0.96) (1.01) Offer-to-Close Return 0.047*** 0.060*** 0.056*** 0.055*** 0.053*** 0.087** (4.18) (4.47) (4.18) (3.98) (3.87) (2.28) Offer Price 0.047*** 0.059*** 0.056*** 0.057*** 0.057*** 0.015 (4.29) (5.48) (4.84) (4.90) (4.79) (0.30) Chg_Promoter Shares 0.062 -0.009 -0.016 -0.017 0.021 0.116 (0.89) (-0.12) (-0.21) (-0.22) (0.28) (0.66) RONW 0.005 0.045 0.051 0.047 0.038 0.043 (0.17) (1.18) (1.29) (1.19) (0.91) (0.49) Total Assets -0.008* -0.003 -0.004 -0.003 -0.003 0.017 (-1.79) (-0.53) (-0.68) (-0.50) (-0.49) (0.57) Debt-to-Equity -0.004 -0.001 -0.001 -0.001 -0.003 -0.023 (-0.90) (-0.22) (-0.28) (-0.28) (-0.47) (-0.75) Age -0.004 -0.004 -0.005 -0.006 -0.001 -0.023 (-0.31) (-0.31) (-0.36) (-0.43) (-0.07) (-0.74) Duality -0.015 -0.015 -0.015 -0.013 0.013 (-0.93) (-0.91) (-0.93) (-0.81) (0.40) Independent Directors 0.077 0.084 0.090 0.103 0.750**

29
(0.95) (1.04) (1.10) (1.25) (2.37) Busy Chairman 0.003 0.003 0.001 0.001 0.008 (0.39) (0.32) (0.15) (0.11) (0.45) MD Salary -0.005* -0.005* -0.005 -0.003 -0.018 (-1.80) (-1.75) (-1.58) (-1.20) (-0.85) F-statistic 4.75** 7.01*** 5.86*** 5.06*** 4.53*** 4.66*** 1.97* Adj. R2 0.021 0.224 0.288 0.283 0.256 0.263 0.248
30
Table 6 Regression Results of Retail and Institutional Subscriptions This table reports the regression results for the retail and institutional subscriptions. The dependent variable in Panel A and B is the retail and institutional subscriptions, respectively. Models 1 to 4 are various models based on full sample during pre- and post-IPO grading mandatory. For Model 5, if ungraded IPOs in the sample, grading takes value of 1. For Model 6, if ungraded IPOs in the sample, grading takes value of 3. For Model 7, Only graded IPOs are used in regression and continuous grading scale is used. Grading (dummy) equals to 1 if the IPO is graded; otherwise zero. Grading (continuous) is the actual grading ranging from 1 to 5 assigned by the grading agencies. Group Affiliation is dummy variable which equals to 1 if the IPO is group affiliated; otherwise zero. Analyst Recommend is the dummy variable which equals to 1 if the IPO is recommended as subscribed; otherwise (avoid) zero. Offer price is the logarithm of IPO offering price. Offer price is the logarithm of IPO offering price. Method is the dummy variable which equals 1 if IPO method is fixed-price; otherwise zero. RONW is the return on net worth prior to the IPO reported in the prospectus. Total Assets is prior to the IPO collected from prospectus. Debt-to-Equity is the ratio of total debt and total equity as reported in prospectus. Age is the logarithm of number of years from incorporated year to IPO year. Duality is the dummy variable taking the value of 1 if the chairman is the managing director; otherwise zero. Independent Director is the number of the independent director divided by the total number of board of directors. Busy Chairman is the logarithm of the number of other directorships that the chairman holds during IPO. MD Salary is the logarithm of the monthly salary package of managing director. *, **, and *** represent the 10%, 5%, and 1% two-tailed significance level, respectively. The t-statistics in the parentheses are White heteroskedasticity-consistent. Panel A: Retail Subscription Panel B: Institutional Subscription Model 1 Model 2 Model 3 Model 4 Model 5 Model 6 Model 7 Model 1 Model 2 Model 3 Model 4 Model 5 Model 6 Model 7 Intercept 16.515*** 11.037*** 11.145*** 13.207*** 13.619*** 11.568*** 12.300** 17.324*** 0.603 2.405 4.345 4.854 2.599 4.444 (116.57) (5.94) (4.47) (6.00) (6.27) (5.25) (2.43) (84.33) (0.24) (0.77) (1.38) (1.44) (0.81) (0.69) Grading (dummy) -0.455* -0.397 -0.374 -0.916** -0.914*** -0.845** -0.751* (-1.64) (-1.48) (-1.24) (-2.38) (-2.69) (-2.14) (-1.86) Grading (continuous) -0.295 0.081 0.834*** 0.975*** -0.093 1.109*** 1.036*** (-0.96) (0.48) (3.05) (3.31) (-0.39) (3.24) (3.53) Group Affiliation -0.374 -0.335 -0.423* -0.228 -0.122 -0.061 -0.139 0.242 (-1.47) (-1.31) (-1.71) (-0.42) (-0.40) (-0.19) (-0.45) (0.40) Analyst Recommend 0.978*** 1.014*** 0.852*** -0.638 0.991*** 1.061*** 0.887*** -1.234* (3.69) (3.83) (3.28) (-0.89) (3.30) (3.48) (2.89) (-1.83) Offer Price -0.527*** -0.547*** -0.769*** -0.798*** -0.828*** 0.465 0.392** 0.420** 0.201 0.180 0.084 1.834*** (-3.31) (-3.12) (-4.34) (-4.53) (-4.84) (1.11) (2.03) (2.02) (0.96) (0.84) (0.41) (3.10) Method 0.045 0.090 0.010 0.070 -0.036 0.324 -0.875** -0.961* -1.002** -0.902* -1.034** -0.640 (0.13) (0.21) (0.03) (0.18) (-0.09) (0.38) (-2.04) (-1.72) (-1.99) (-1.82) (-2.13) (-0.61) RONW -0.456 -0.417 -0.338 -0.270 -0.228 -1.010 -0.830 -0.771 -0.611 -0.567 -0.346 -0.715 (-0.79) (-0.57) (-0.47) (-0.40) (-0.35) (-1.27) (-1.12) (-0.84) (-0.67) (-0.65) (-0.44) (-0.93) Total Assets 0.350*** 0.327*** 0.275*** 0.258*** 0.267*** -0.434* 0.724*** 0.649*** 0.590*** 0.570*** 0.562*** -0.374 (3.53) (2.81) (2.70) (2.59) (2.87) (-1.66) (5.07) (4.08) (3.64) (3.35) (3.55) (-1.01)
31
Debt-to-Equity -0.066 -0.058 -0.049 -0.043 -0.029 0.878*** -0.214* -0.237* -0.238* -0.232* -0.213 0.295 (-0.75) (-0.61) (-0.69) (-0.61) (-0.41) (3.50) (-1.93) (-1.91) (-1.85) (-1.66) (-1.56) (1.05) Age 0.348 0.349 0.250 0.252 0.163 0.142 0.059 0.0973 0.017 0.040 -0.084 0.235 (1.51) (1.38) (0.97) (1.03) (0.71) (0.39) (0.17) (0.25) (0.04) (0.10) (-0.25) (0.45) Duality 0.193 0.145 0.138 0.123 0.395 0.209 0.195 0.199 0.140 1.103* (0.75) (0.59) (0.56) (0.52) (0.74) (0.66) (0.64) (0.65) (0.48) (1.85) Independent Director -0.043 0.169 -0.017 0.118 4.952 -1.521 -1.233 -1.454 -1.460 3.871 (-0.03) (0.14) (-0.01) (0.10) (1.22) (-0.85) (-0.71) (-0.80) (-0.81) (0.84) Busy Chairman 0.126 0.150 0.178 0.143 0.293 0.350* 0.367** 0.399** 0.406** 0.692*** (0.84) (1.05) (1.28) (1.12) (1.64) (1.86) (2.01) (2.19) (2.40) (3.11) MD Salary 0.016 0.011 -0.001 -0.001 0.319 -0.034 -0.037 -0.050 -0.060 0.314 (0.27) (0.23) (-0.02) (-0.03) (1.56) (-0.52) (-0.63) (-0.85) (-1.20) (1.51) F-statistic 2.90* 5.79*** 2.98*** 3.82*** 3.74*** 4.79*** 1.99* 5.90** 13.39*** 7.12*** 7.01*** 6.44*** 7.78*** 4.64*** Adj. R2 0.011 0.168 0.131 0.203 0.198 0.255 0.239 0.030 0.360 0.331 0.365 0.342 0.393 0.548

32
Table 7 Firm and Issue Characteristics Across Different IPO Grades This table presents the means and medians of form and issue characteristics of graded IPOs. 54 IPOs are graded from 2007, May 1 to 2008, December 1. Panel A reports the means and medians. Panel B presents the number of firms based on 2 by 2 matrix between the actual grading scale and the pseudo grading computed using the form and issue characteristics. P/E is price-to-earnings ratio. P/S is price-to-sale ratio. P/B is price-to-book ratio. EV/EBITDA is the economic value-added divided by earnings before interests, taxes and depreciation and amortization. Total Assets is prior to the IPO collected from prospectus. Age is the logarithm of number of years from incorporated year to IPO year. D/E is debt-to-equity ratio. EPS is earnings per share. Promoter shares pre is the promoter shareholdings prior to IPO in percentage. Promoter shares post is the promoter shareholdings post-IPO in percentage. Group Affiliation is dummy variable which equals to 1 if the IPO is group affiliated; otherwise zero. Number of Directors is the total number of board of directors during IPO. Independent Directors is the number of independent/outside directors. MD Salary is the logarithm of the monthly salary package of managing director. Panel A Mean and Median of Firm and Issue Characteristics Grading Scale 1 2 3 4 (N=7) (N=14) (N=24) (N=9) Mean Median Mean Median Mean Median Mean Median P/E 17.095 11.321 12.723 9.918 33.975 13.867 50.159 31.015P/S 80.261 85.498 50.526 42.402 215.474 89.316 726.849 649.453P/B 62.563 57.567 59.225 53.464 116.598 73.593 282.603 322.702EV/EBITDA 8.461 7.187 5.719 5.120 6.470 4.318 98.529 4.569Total Assets ($Million) 19.944 20.071 20.066 20.147 21.354 20.985 21.284 21.553Age 9.429 10.000 12.786 11.500 17.625 14.500 22.556 13.000D/E 0.758 0.504 1.019 0.872 1.418 1.222 0.430 0.353EPS 9.470 5.245 13.364 8.055 12.163 9.815 14.584 13.110Promoter Shares Pre (%) 78.883 77.580 85.532 89.220 78.113 81.535 84.366 87.900Promoter Shares Post (%) 50.080 52.110 56.250 58.260 57.300 54.815 69.028 74.400Group Affiliation 0.000 0.000 0.071 0.000 0.333 0.000 0.222 0.000Number of Directors 5.857 5.000 6.857 6.000 7.458 7.500 8.111 8.000Independent Directors 2.857 3.000 3.857 4.000 3.542 4.000 4.333 4.000MD Salary 140,714.29 60,000.00 165,785.71 112,500.00 447,030.54 200,000.00 455,198.11 233,400.00

33
Panel B Pseudo Grading (number of firms) Actual Grade
Pseudo Grade 1 2 3 4 % error 1 2 2 2 1 71.43 2 3 5 4 2 64.29 3 0 7 13 4 45.83 4 0 1 4 4 55.56