does asymmetric information drive capital structure … asymmetry between managers and all ......
TRANSCRIPT

Does Asymmetric Information Drive Capital
Structure Decisions?∗
Sreedhar T. Bharath
Department of Finance
Ross School of Business, University of Michigan
Paolo Pasquariello
Department of Finance
Ross School of Business, University of Michigan
Guojun Wu
Department of Finance
C.T. Bauer College of Business, University of Houston
First Draft: November 2004, This Draft: November 2007†
∗Sreedhar T. Bharath is at the Ross School of Business, University of Michigan, Department of Finance, Suite E7606,
Ann Arbor, MI 48109; phone: (734) 763-0485; e-mail: [email protected]. Paolo Pasquariello is at the Ross School of
Business, University of Michigan, Department of Finance, Suite E7602, Ann Arbor, MI 48109; phone: (734) 764-9286; e-mail:
[email protected]. Guojun Wu is at the C.T. Bauer School of Business, University of Houston, Department of Finance,
Houston, TX 77204; phone: (713) 743-4813; e-mail: [email protected].†We are grateful to Stewart Myers (our NBER discussant), Matt Spiegel (the editor), and three anonymous referees for
their valuable insights. We also thank Andres Almazan, Yakov Amihud, Sudip Gupta, M.P. Narayanan, Norman Schürhoff, Pei
Shao, Ivo Welch, and Jaime Zender for useful discussions, and seminar participants at the University of Michigan, Washington
University (St. Louis), the 2005 FRA conference, the 2006 NBER Corporate Finance meetings, the 2006 FIRS conference, the

Does Asymmetric Information Drive Capital Structure Decisions?
Abstract
Using a novel information asymmetry index based on measures of adverse selection de-
veloped by the market microstructure literature, we test if information asymmetry is an
important determinant of capital structure decisions, as suggested by the pecking order the-
ory. Our index relies exclusively on measures of the market’s assessment of adverse selection
risk rather than on ex ante firm characteristics. We find that information asymmetry does
affect the capital structure decisions of U.S. firms over the sample period 1973-2002. Our
findings are robust to controlling for conventional leverage factors (size, tangibility, Q ratio,
profitability), the sources of firms’ financing needs, and such firm attributes as stock return
volatility, stock turnover, and intensity of insider trading. For example, we estimate that on
average, for every dollar of financing deficit to cover, firms in the highest adverse selection
decile issue 30 cents of debt more than firms in the lowest decile. Overall, this evidence
explains why the pecking order theory is only partially successful in explaining all of firms’
capital structure decisions. It also suggests that the theory finds support when its basic
assumptions hold in the data, as it should reasonably be expected of any theory.
Keywords: Pecking Order Theory; Capital Structure; Information Asymmetry
J.E.L. Classification Code: G32.
2006 EFA meetings, the 2006 CRSP Forum, and the 2006 CAF Winter Research Conference for comments. Lastly, we thank
the Ross School of Business Dean’s Research Fund for financial support and Kenneth French and Soren Hvidkjaer for providing
financial data. All errors are ours.

1 Introduction
The problem of explaining firms’ capital structure is intensely debated in corporate finance.
One of the most popular models of corporate financing decisions in the literature is the
pecking order theory of Myers (1984). It is based on the argument in Myers and Majluf
(1984) that asymmetric information problems drive the capital structure of firms. Myers
(1984) argues that if managers know more than the rest of the market about their firm’s
value (information asymmetry), the market penalizes the issuance of securities (like equity)
whose expected payoffs are crucially related to the assessment of such value. Therefore, the
pecking order theory predicts that companies should use stock issuances to cover financing
deficits only as a last resort, after cheaper, less information-sensitive alternatives (like internal
cash, bank debt, or public debt) have been exhausted.
Tests of the pecking order theory have focused on this main prediction of the model.
Shyam-Sunder andMyers (1999) conclude that the pecking order offers a good approximation
to firms’ financing behavior. Their inference is challenged by Fama and French (2002) and
Frank and Goyal (2003). Lemmon and Zender (2004) counter this challenge by controlling for
the value of maintaining financial slack for future investment and to avoid financial distress.
Yet, Leary and Roberts (2004) incorporate financial slack in their explicit analysis of the
hierarchy of financing policies generated by the pecking order theory and do not find support
for it. In short, the existing evidence on the pecking order is mixed.
In sharp contrast to those studies, in this paper we do not seek to test the predictions of
the pecking order theory. Instead, we evaluate its core assumption, i.e., information asymme-
try as the determinant of capital structure decisions.1 As Fama and French (2005) observe,
ultimately the pecking order theory posits that information asymmetry is an important (or
perhaps even the sole) determinant of firms’ capital structure. However, no test has ever
been performed to ascertain the empirical viability of that basic assumption of the theory.
In other words, we still do not know whether information asymmetry drives firms’ capital
structure decisions. That is the specific question we address in this research. In particular,
1Accordingly, Frank and Goyal (2003, p. 237) note that “it is natural to examine firms that are commonly
thought to be particularly subject to adverse selection problems” when testing the pecking order theory.
1

we study the conformity of those decisions to the pecking order theory for different degrees of
information asymmetry. If the theory correctly describes the funding process of corporations,
we expect this conformity to be greater the higher is the estimated intensity of perceived
information asymmetry between managers and all other market participants.
The first step in our analysis is to gather information asymmetry proxies to use as cross-
sectional conditioning variables. For that purpose, we consider several measures of adverse
selection developed by the market microstructure literature. This represents an important
innovation of our study. The pecking order theory of Myers (1984) and Myers and Majluf
(1984) is based on adverse selection between firm managers and market participants. Market
microstructure measures of information asymmetry are designed to capture adverse selection
between a larger category of agents – informed traders – and the rest of the market –
uninformed traders. In other words, firm managers constitute a subset of informed traders
in the market who, in turn, constitute a subset of all traders in the market. Therefore,
market microstructure measures of information asymmetry are (imperfect) proxies for the
financial markets’ perception of the information advantage held by firm insiders and the
resulting adverse selection costs; and those costs are what ultimately affects the cost of
issuing information-sensitive securities.
Market microstructure proxies of information asymmetry are based on the notion – set
forth by an extensive theoretical literature – that market liquidity in general, and transac-
tion costs (e.g., the bid-ask spread) in particular, consist of three primary components: order
processing, inventory, and adverse selection. The latter, crucial to our analysis, compensates
liquidity providers for transacting with better-informed traders and increases with the degree
of information asymmetry. A number of studies develop statistical models to extract this
component from existing proxies for an asset’s liquidity. These models can be broken down
into three groups. Within the first group, inference about adverse selection is made from the
serial covariance properties of the time series of observed asset returns. Within the second
group, inference about adverse selection is based on the interaction between trading volume
and asset returns. Within the last group, the extent of adverse selection is gauged from the
estimation of structural models of the arrival of information-based trades.
We estimate measures of information asymmetry for each of these classes of models: the
2

adverse selection portions of both the quoted and Roll’s (1984) effective bid-ask spread (as in
George, Kaul, and Nimalendran, 1991), the return-volume coefficient of Llorente, Michaely,
Saar, and Wang (2002), and the probability of informed trading of Easley, Kiefer, O’Hara,
and Paperman (1996). Unfortunately, the often scarce availability of trade and quote data
limits these measures’ simultaneous coverage of as many companies as possible for as long
as possible in the universe of U.S. firms. This is a potentially serious limitation, for Frank
and Goyal (2003) show that inference about the pecking order theory is sensitive to firm-
year sample size. Thus, we also compute three broader measures of stock liquidity: the
price impact measure of Amihud (2002), the (Amivest) liquidity ratio of Cooper, Groth, and
Avera (1985) and Amihud, Mendelson, and Lauterbach (1997), and the reversal coefficient
of Pastor and Stambaugh (2003). At any point in time, the latter three measures are likely
to be driven by adverse selection, yet not exclusively so. To address this issue, we form an
index of adverse selection as the first principal component of either the level of or change in
all of the seven proxies described above (when available).
This index has several desirable properties. First, a burgeoning literature finds its con-
stituents to be sensitive to a wide array of potentially informative corporate events (e.g.,
earnings, dividends, M&A, bankruptcy, or takeover announcements) and firm characteristics
(e.g., opaqueness of assets, credit ratings, or ownership structure). Second, the corporate fi-
nance literature commonly measures companies’ degree of information asymmetry according
to ex ante firm characteristics (e.g., their relative size, growth opportunities, or tangibility
of their assets). Unfortunately, these measures are often inconsistent, as well as inherently
static and persistent. Our index’s constituents are instead designed to capture financial mar-
kets’ time-varying perception of the information advantage held by firm insiders. Fourth,
and unlike our index’s constituents, more dynamic proxies for adverse selection also popular
in the corporate finance literature (e.g., analyst coverage, dispersion of analysts’ forecasts,
magnitude of earnings surprises, or residual stock return volatility) have multiple, often ad
hoc interpretations. Fifth, the index displays sensible economic traits.
As important, the inference from our analysis, based on this index, is as strong as to
provide ex post validation of its use. Overall, we find that our proxies for both the extent of
and change in firm-level adverse selection help explain the capital structure decisions of U.S.
3
firms between 1973 and 2002. We begin by examining the slope coefficient in a regression
of change in debt against financing deficit (as in Shyam-Sunder and Myers, 1999) for firms
sorted each fiscal year by information asymmetry deciles from the lowest to the highest.
We find that the cross-sectional variation in the response of firms’ debt issuances to their
financing deficits is related (in a statistically and economically significant fashion) not only
to the relative severity of, but also to the change in those firms’ information asymmetry,
consistent with the pecking order theory: the greater (the increase in) a firm’s adverse
selection costs (over the previous fiscal year), the greater is the portion of its financing
deficit that firm will fund through debt in the current fiscal year. For instance, we estimate
that on average, for every dollar of financing deficit to cover, firms in the highest adverse
selection decile issue 30 cents of debt more than firms in the lowest decile. These patterns
are robust to disaggregating firms’ financing deficits into its main components (dividends,
real investments, and cash flow) and to controlling for size, tangibility, and the intensity of
insider trading – popular alternative proxies for firm-level information asymmetry – as well
as for other firm characteristics, such as Q ratio, stock return volatility, and stock turnover.
Issues with the power of these tests have been raised in the literature (e.g., Chirinko and
Singha, 2000). We address them by employing a number of alternative testing strategies
that allow us to assess more directly the importance of information asymmetry in the cross-
section of firms’ capital structure decisions. Specifically, we estimate firm fixed-effects panel
regressions of the level of (or change in) firm leverage (as in Rajan and Zingales, 1995; Frank
and Goyal, 2003) on our adverse selection index, four conventional firm characteristics (tan-
gibility, profitability, sales, and market-to-book ratio), insider trading, stock return volatility,
and turnover (or on their first differences). We find that the cross-sectional variation in firms’
capital structures is related to both the extent of and the change in our measures of firm-level
adverse selection, the more so the greater is the portion of firms’ value due to assets-in-place,
even after controlling for conventional leverage factors in the literature.
According to Myers (2001), the pecking order theory was originally conceived as a con-
ditional theory relating firms’ information differences to their capital structure decisions.
Consistent with this interpretation, our evidence i) explains why the pecking order is of-
ten found only partially successful in interpreting the whole of firms’ debt issuance choices,
4
and ii) shows that the pecking order performs better when its basic assumptions hold more
closely in the data, as it should reasonably be expected of any model.
We proceed as follows. In Section 2 we form our measure of firm-level adverse selection
and comment on its properties. In Section 3 we perform several empirical tests of the
pecking order theory conditional upon this measure and interpret our findings. We conclude
in Section 4.
2 Measuring Information Asymmetry
The problem of measuring the information asymmetry about a firm’s value, hence about
the payoffs of its securities, has been extensively analyzed in the market microstructure
literature.2 This line of research stems from Bagehot’s (1971) observation that adverse
selection due to the presence of better-informed traders in a financial market may affect its
process of price formation. It is reasonable to believe that market players in closer touch
with a firm and its business (e.g., employees, suppliers, analysts, traders) are those who
possess better information about that firm and trade on it.3 Based on this premise, market
microstructure attempts to estimate the extent of information asymmetry about a firm from
observed market data (quotes, bid-ask spreads, trades, and transaction prices). These efforts
have caught the attention of other areas of finance, for they may help researchers identify
such an intrinsically elusive concept as a firm’s information environment. This has been
especially the case in corporate finance. Notably, microstructure measures have been found
significantly sensitive to numerous important corporate events.4
2See O’Hara (1995) for an extensive review.3For example, many studies (e.g., Seyhun, 1986, 1992; Jeng, Metrick, and Zeckhauser, 1999) show that
corporate insiders earn positive abnormal returns when trading in their companies’ securities.4An incomplete list includes earnings (Lee, Mucklow, and Ready, 1993; Krinsky and Lee, 1996; Chae,
2005; Vega, 2006), M&A (Chae, 2005), bankruptcy (Serednyakov, 2002), dividend (Graham, Koski, and
Loewenstein, 2006), stock splits (Desai, Nimalendran, and Venkataraman, 1998), bond rating (Chae, 2005),
and takeover (Jennings, 1994) announcements, as well as analyst coverage (Brennan and Subrahmanyam,
1995), the opaqueness of banking firms’ assets (Flannery, Kwan, and Nimalendran, 2004), firms’ ownership
structure (Heflin and Shaw, 2000), disclosure quality (Heflin, Shaw, and Wild, 2005), credit ratings (Odders-
White and Ready, 2006), and investment sensitivity to stock price (Chen, Goldstein, and Jiang, 2007).
5

Prior microstructure work suggests a number of measures of adverse selection. Most of
these measures rely upon the notion that the intensity of asymmetric information about the
value of an asset is an important determinant of that asset’s liquidity. Yet, the concept
of liquidity – the ability to trade promptly and with little or no price impact – is also
intrinsically elusive and multifaceted (see Hasbrouck, 2005). In addition, many of these
measures are estimated with high-frequency trade and quote data, whose sparseness limits
both their time-series and cross-sectional use in corporate finance. Lastly, concordance across
these measures is often modest (e.g., Clarke and Shastri, 2001; Hasbrouck, 2005).
To address these issues, we form a composite index of adverse selection for each firm in the
COMPUSTAT database within each fiscal year between 1972 and 2002.5 The firm-level index
is based on the common cross-sectional variation of either the level of or the annual change
in four direct measures of information asymmetry (the adverse selection component of both
quoted and effective bid-ask spreads, the probability of informed trading, and the relation
between daily volume and first-order return autocorrelation) and three broader measures
of market liquidity (the liquidity ratio, the illiquidity ratio, and the reversal coefficient)
computed mostly from CRSP data. The latter three measures are more widely available
than the former four, especially over the earlier part of our sample period. Hence, they allow
us to retain as many firm-year datapoints as possible from the COMPUSTAT universe.
However, at any point in time, any of those liquidity measures may not be driven exclusively
by adverse selection. We minimize the likelihood that these measures are connected to
“noninformational” liquidity by combining them with the first four “informational” proxies
into a (level or change) index based exclusively on their first principal component. Next, we
describe each of those microstructure measures, the procedure for the construction of our
index, and the index’s basic properties.6
5Following standard practice (e.g., Frank and Goyal, 2003), we exclude financial firms (SIC 6000-6999),
regulated utilities (SIC 4900-4999), firms involved in major mergers (COMPUSTAT footnote code AB), firms
with missing book value of assets, and a small number of firms that report format codes 4, 5, or 6.6Further details on the estimation of these measures are available in a previous version of this paper at
http://papers.ssrn.com/sol3/papers.cfm?abstract_id=789725.
6

2.1 Index Constituents
Most microstructure models of asymmetric information assume that better-informed agents
use their informational advantage to profit from trading. The resulting adverse selection risk
induces market-makers to post quotes not only compensating them for holding undesired
inventory and providing liquidity, but also offsetting their expected losses versus informed
traders with gains from uninformed traders. Therefore, observed measures of market liquidity
–most notably the bid-ask spread – should depend not only on inventory, transaction, and
order-processing costs but also on adverse selection costs.7 Much research has been devoted
to estimating the adverse selection component of the bid-ask spread, yet often exclusively
from high-frequency (thus, relatively small and recent) trade and quote datasets.8 Even
daily quoted spread data is commonly available (on CRSP) only for the NASDAQ stock
market. These constraints may severely limit the scope and time horizon of our study. The
measure of Roll (1984) explicitly addresses this issue. Roll (1984) suggests that in an efficient
market trading costs induce negative serial dependence in prices, hence that the effective (i.e.,
within-quote) bid-ask spread can be estimated using return autocovariance.
In light of these considerations, we extract the firm-level adverse selection component of
both the proportional quoted and Roll’s (1984) effective bid-ask spreads over each fiscal year
in the sample. We do so by employing the estimators of that component first introduced by
George, Kaul, and Nimalendran (1991). Their basic argument is that uninformed trading
activity (e.g., due to hedging motives) moves a stock’s price (for liquidity reasons) but not
the market expectation of its future payoffs, hence generating negatively autocorrelated
stock returns; informational speculation, however, does induce a generally not instantaneous
revision of those expectations, thus generating positively autocorrelated returns. George,
Kaul, and Nimalendran (1991) show that filtering a stock’s realized returns with a measure
of its time-varying expected return allows for unbiased and efficient estimates of the adverse
selection component of that stock’s proportional spread, whether computed using actual
quotes or daily returns. Following George, Kaul, and Nimalendran (1991), we estimate the
fraction of proportional quoted and Roll’s (1984) effective spread due to adverse selection
7E.g., Copeland and Galai (1983), Glosten and Milgrom (1985), and Kyle (1985).8See Huang and Stoll (1997) and Hasbrouck (2006) for a review.
7
for each stock i over each fiscal year τ as ADiτ and RADiτ , respectively.
Market microstructure also exploits the different implications of hedging and speculation
for the interaction of stock returns and trading volume to gauge the ensuing extent of adverse
selection. In a recent study, Llorente et al. (2002) find that accounting for the intensity of
trading volume can greatly improve the cross-sectional identification and measurement of the
extent of hedging and speculation explaining stock price movements. Specifically, they show
theoretically and confirm empirically that a correspondence exists between the cross-sectional
variation in stocks’ volume-return dynamics and the relative importance of information-
driven trading in stocks’ price fluctuations. Following their methodology, we estimate their
explicit proxy for the relative importance of information asymmetry considerations among
all stocks in our sample, C2iτ . Within each fiscal year τ , the lower (higher) is the estimated
C2iτ , the lower (higher) is firm i’s degree of adverse selection.
Easley, Kiefer, and O’Hara (1996, 1997a, b), and Easley et al. (1996) develop a model
in which uninformed market participants’ perceived probability of the arrival of informed
trades (PIN) can be inferred from the trading process itself, specifically from the frequency
and magnitude of buy-sell imbalances. Intuitively, if no information event takes place, buy
and sell orders arrive randomly. Buy and sell orders instead cluster during information days.
Thus, the PIN can be estimated from the signed order flow and the greater the estimated
PINiτ (which we obtain from Easley, Hvidkjaer, and O’Hara, 2004), the greater is the
intensity of information asymmetry about firm i’s value in fiscal year τ .9
All of the above mentioned studies find that adverse selection is an important determinant
of market liquidity, when the latter is proxied by either the bid-ask spread or trading volume.
Yet, according to Hasbrouck (2005), there is “no single measure that captures all dimensions
of liquidity.”10 For instance, Kyle (1985) and Amihud and Mendelson (1980) show that
an alternative proxy for liquidity – the impact of order flow on market prices, known
as lambda – is increasing with adverse selection and inventory costs, respectively. Direct
9Those estimates (at http://www.rhsmith.umd.edu/Finance/hvidkjaer/data.htm) are for all NYSE and
AMEX stocks whose transaction data is available between 1983 and 2001 and fiscal year ends in December.10Amihud (2002, p. 35) adds that “it is doubtful that there is one single measure that captures all its
aspects.” Recently, Frieder and Martell (2005) and Lipson and Mortal (2006) use effective bid-ask spreads
to study the relation between liquidity per se and leverage for U.S. firms.
8

estimation and attribution of lambda requires transaction-level data (Hasbrouck, 1991). The
unavailability of such data over long periods of time motivates Amihud (2002) to develop a
convenient proxy for lambda, the illiquidity ratio ILLiτ , defined as the mean of the square
root of the ratio of firm i’s daily absolute stock return to the reported daily dollar volume (in
millions) over all days in fiscal year τ with nonzero volume (Hasbrouck, 2005). Amihud (2002)
shows that ILLiτ is strongly positively related to intraday estimates of lambda. Equivalently,
when a firm’s stock is liquid (either because of low adverse selection, inventory costs, or both),
large trading volumes are accompanied by small price changes. The (Amivest) liquidity ratio
LRiτ of Cooper, Groth, and Avera (1985) and Amihud, Mendelson, and Lauterbach (1997)
– computed as minus the mean of the square root of the ratio of stock i’s reported daily
dollar volume (in millions) to its absolute stock return – attempts to capture this notion.
Therefore, ceteris paribus, the greater is the extent of adverse selection around firm i in fiscal
year τ , the worse is that stock’s liquidity, and the greater are ILLiτ and LRiτ .
Lastly, Pastor and Stambaugh (2003) suggest that a stock’s liquidity can be captured by
the interaction between its returns and lagged order flow. Intuitively, since less liquid stocks
may overshoot in response to order flow, the greater is a stock’s estimated return reversal for
a given dollar volume the lower is that stock’s liquidity. Following Pastor and Stambaugh
(2003), we compute the absolute magnitude of such reversal for each stock i over each fiscal
year τ and label it as GAMiτ . Ceteris paribus, the greater is the extent of firm i’s adverse
selection during fiscal year τ , the worse is that stock’s liquidity, and the greater is GAMiτ .
2.2 Index Construction
The above methodologies generate seven measures that are conceptually positively related
to the extent of adverse selection about firm i in fiscal year τ : ADiτ , RADiτ , C2iτ , PINiτ ,
ILLiτ , LRiτ , and GAMiτ . Table 1 summarizes each of them. Table 2 reports means of fiscal
year-level Spearman rank correlations among their cross-sectionally standardized levels (in
Panel A, as Z_ADiτ , Z_RADiτ , Z_C2iτ , Z_PINiτ , Z_ILLiτ , Z_LRiτ , and Z_GAMiτ)
and year-on-year firm-level changes (in Panel B, as Z_∆ADiτ , Z_∆RADiτ , Z_∆C2iτ ,
Z_∆PINiτ , Z_∆ILLiτ , Z_∆LRiτ , and Z_∆GAMiτ). Each of the proxies’ means in Ta-
9

ble 1 is statistically significant and of the expected sign, i.e., all indicate that there is evidence
of information asymmetry in the U.S. stock market between 1972 and 2002.11 Some of these
proxies, in particular the latter three broader measures of liquidity, are likely to include an
adverse selection component as well as non-informational components. Accordingly, Table 2
shows that the standardized proxies for firm-level information asymmetry are mostly posi-
tively correlated with each other, with the sole exception of Z_RADiτ and Z_∆RADiτ .12
[Tables 1 and 2 here]This discussion motivates us to use principal components analysis to isolate the common
component of the cross-section of either the level of or annual change in our seven proxies for
firm-level adverse selection in each fiscal year of our sample. Specifically, we estimate the first
principal component of the correlation matrix of the available standardized proxies for the
extent of firm-level adverse selection in each fiscal year τ , PCA1iτ , as well as of the available
year-on-year standardized changes in such extent, ∆PCA1iτ . In both cases, the first principal
component explains on average more than 50% of the corresponding cross-sectional sample
variance. In addition, in most cases, only the first eigenvalue is significantly larger than
one. We conclude that one factor captures much of the common variation among the seven
proxies, i.e., the variation due to adverse selection. We then define a parsimonious index of
either firm-level extent of or year-on-year change in adverse selection as ASYiτ = PCA1iτ
and ∆ASYiτ = ∆PCA1iτ , respectively. This procedure ensures that we characterize firms’
relative adverse selection in a year exclusively from data (and proxies) available in that year.
Thus, by construction, the means of ASYiτ and ∆ASYiτ are at zero in each fiscal year τ
as well as over the entire sample (Table 1).13 Also by construction, the higher is ASYiτ
(∆ASYiτ), the higher is the (increase in the) severity of adverse selection problem for firm i
in fiscal year τ . Finally, we employ ASYiτ (∆ASYiτ) to rank each firm i in the sample over
each fiscal year τ into ten deciles from the lowest – lowest (change in) adverse selection risk
– to the highest – highest (change in) adverse selection risk.
11In addition, these means are consistent with estimates previously reported in the literature (e.g., Neal
and Wheatley, 1998; Hasbrouck, 2005).12Neal and Wheatley (1998) attribute the latter to the restriction, overwhelmingly rejected by their anal-
ysis, that the fractions of the bid-ask spread due to order-processing and adverse selection add to one.13However, neither the median of ASYiτ and ∆ASYiτ is exactly zero nor the standard deviation is exactly
one, since ASYiτ and ∆ASYiτ are only the first principal component of their standardized constituents.
10

2.3 Index Properties
Our index (and the ensuing rankings) has several appealing economic properties. First, each
individual component almost always enters the index with the right (i.e., positive) sign.14
Second, the index loads primarily on the four direct proxies of adverse selection described
in Section 2.1. For example, Table 2 shows that ASYiτ is most highly positively correlated
with Z_PINiτ (0.513 in Panel A), while ∆ASYiτ comoves the most with Z_∆C2iτ (0.255
in Panel B). In addition, the index loads on at least three of those proxies in each of the fiscal
years of our sample. Yet, when the cross-sectional sample coverage by some of them is less
than complete, the index can rely upon the adverse selection component of the three liquidity
proxies. Third, ASYiτ and ∆ASYiτ are similar but not identical (a statistically significant
Spearman rank correlation of 0.660); so, neither is redundant when used to characterize the
cross-sectional dispersion in (level of and fluctuations in) firm-level adverse selection over
our sample. Fourth, the sets of firms comprising each of the ASYiτ -based and ∆ASYiτ -based
deciles display sensible characteristics. Table 3 reports means of various firm-level accounting
variables (size, tangibility, Q ratio, sales, and profitability) for firms in each decile of ASYiτ
(Panel A) and ∆ASYiτ (Panel B) as well as for the full sample.15 Table 4 reports the average
percentage industry composition of each decile of ASYiτ (Panel A) and ∆ASYiτ (Panel B),
as well as of the full sample, according to the classification suggested by Kenneth French.16
[Table 3 here]
According to Table 3, firms in low adverse selection deciles (low, 2, 3) are on average
(not surprisingly) larger (in both assets and sales, in millions of year 2000 dollars) than
their counterparts in high deciles (8, 9, high), albeit less so when sorted by ∆ASYiτ than by
ASYiτ . Consistently, both the corresponding Spearman rank correlations and linear slope
coefficients (rows ρSR and bOLS in Table 3) are negative and significant for ASYiτ -based sorts
14Equivalently, the elements of the first eigenvector used to compute PCA1iτ (as well as those of the first
eigenvector for ∆PCA1iτ ) are almost always positive in each fiscal year of the sample. In addition, the
magnitude of these elements is relatively stable over time.15Following standard practice (e.g., Frank and Goyal, 2003), the balance sheet and cash flow statement
variables as a percentage of assets are Winsorized (by removing the most extreme 0.50% in either tail of the
distribution) to purge outliers and the most extremely misreported data.16See http://mba.tuck.dartmouth.edu/pages/faculty/ken.french/data_library.html.
11

and negative and insignificant for ∆ASYiτ -based sorts. Thus, firm size seems to be more
related to its (relative) level of information asymmetry than to its year-on-year fluctuations.
Firms in lower adverse selection deciles are also neither more nor less (relatively) profitable,
their assets are not less tangible, and their Q ratios are higher than for firms in high adverse
selection deciles. Table 4 also suggests that the average industry composition of the sets of
firms within each adverse selection decile is remarkably similar to the industry composition
of the universe of firms in the sample. However, when ranked for their level of adverse
selection, Manufacturing firms are more likely (ρSR and bOLS are positive and significant),
and Shops firms less likely (ρSR and bOLS are negative and significant), to fall into high
ASYiτ and ∆ASYiτ deciles.
[Table 4 here]
In short, Tables 2 to 4 indicate that our measures of firm-level adverse selection, ASYiτ
and ∆ASYiτ , i) do not systematically single out (so our ensuing inference is not driven by)
any peculiar group of firms but ii) are still consistent with many (but not all) of the ex
ante firm characteristics routinely employed by the corporate finance literature as proxies
for firms’ relative degree of information asymmetry.17 Yet, our index is able to capture the
dynamic component of the degree of information asymmetry about a firm (e.g., around the
time when its capital structure is modified), while the latter are by their nature essentially
static. For sake of comparison, in unreported analysis (available on request) we sort firms
by size into ten deciles in each of the fiscal years of our sample. We then compute the
percentage frequency by which firms move by zero, one, two, or three or more deciles of
either size, ASYiτ or ∆ASYiτ after one, three, or five years. We find that about 73% (82%)
of the firms in our sample move to a different decile of ASYiτ (∆ASYiτ ) the following year,
and more of them do so after at least three years. However, when sorting firms by size, only
31% of them move to a new size decile after one year, and 40% of them still remain in the
same decile even after five years.18
Alternatively, the information environment of a firm has been estimated by such more
dynamic proxies as residual volatility of equity (e.g., Dierkens, 1991), recent asset volatility
17Flannery, Kwan, and Nimalendran (1999), Clarke and Shastri (2001), and Alford and Jones (2003) reach
similar conclusions when analyzing many of the adverse selection measures entering ASYiτ and ∆ASYiτ .18Sorting firms by their tangibility or Q ratios generates similar results.
12
(Halov and Heider, 2004), R&D activity (Aboody and Lev, 2000), age (Berger and Udell,
1995), magnitude of earnings surprises (Barclay and Smith, 1995a, b; Hoven-Stohs and
Mauer, 1996), intensity of public announcements (Dierkens, 1991), level of institutional
ownership (Best, Hodges, and Lin, 2004), analyst coverage (Chang, Dasgupta, and Hilary,
2006), or dispersion of analysts’ earnings forecasts (Krishnaswami and Subramaniam, 1999;
Lowry, 2003; Gomes and Phillips, 2005). Unfortunately, many of these measures have several,
often conflictual or ad hoc interpretations.19 In addition, they have often been found to
inadequately proxy for the degree of information asymmetry between insiders and other
market participants.20 The majority of the components of our adverse selection index have
instead been specifically devised by the microstructure literature, on the basis of theory, to
capture the market’s perceived intensity of information asymmetry about the payoffs of a
firm’s traded securities, i.e., ultimately about that firm’s valuation. Overall, we believe these
considerations make our adverse selection index apt to test whether information asymmetry
problems affect firms’ capital structure decisions. This is what we do next.
3 Empirical Results
3.1 Debt Issuance to Cover Financing Deficits
The pecking order theory of capital structure of Myers (1984) and Myers and Majluf (1984)
predicts that firms prefer debt over equity because of information asymmetry between well-
informed managers and less-informed investors. When investment needs exceed internal
funds, they are met primarily with debt, while equity is used as a residual source of financing.
To test for the pecking order theory, Shyam-Sunder and Myers (1999) suggest to regress net
19E.g., the evidence in Diether, Malloy and Scherbina (2002), Pasquariello and Vega (2007), and Sadka
and Scherbina (2007) suggests that dispersion in analysts’ earnings forecasts (i.e., analyst disagreement) is
a better proxy for differences in opinion about a security than for information asymmetry about its issuer.20For instance, Frankel and Li (2004) and Huddart and Ke (2007) find that institutional ownership, analyst
following, financial statement informativeness, frequency of reporting of losses and R&D, or market reaction
to earnings announcements fail to explain insider trading activity and profits.
13

debt issuance (∆Diτ ) on the financing deficit (DEFiτ) as follows:
∆Diτ = α+ βDEFiτ + εiτ , (1)
where∆Diτ is long-term debt issuance minus long-term debt reduction, whileDEFiτ is given
by the accounting cash flow identity
DEFiτ = DIViτ + CAPEXiτ +∆WCiτ − CFiτ , (2)
in which DIViτ are dividend payments, CAPEXiτ are capital expenditures, ∆WCiτ is the
net change in working capital, and CFiτ is operating cash flow (after interest and taxes). All
variables are scaled by total assets, as in Frank and Goyal (2003).
According to Shyam-Sunder and Myers (1999), the strict pecking order theory implies
that the regression coefficient β should be close to one, since firms would only recur to equity
as a last resort. Myers (1984) and Myers and Majluf (1984) also describe a modified pecking
order that recognizes the trade-off between adverse selection costs and the costs of financial
distress when too much debt is issued. Under the modified version of the theory, firms may
issue equity in place of debt when faced with financing deficit to maintain both liquid assets
and debt capacity for future investments. Therefore, the estimated slope coefficient in Eq. (1)
should still be positive but may be lower than one. Regardless of this debate, most existing
tests on the pecking order do not examine a key assumption of that theory: the extent of
information asymmetry problems plaguing firms’ external funding. After all, Myers (2001)
emphasizes that the pecking order theory is a conditional theory of firms’ capital structure,
one relating information differences to financing choices. As such, we should expect the
pecking order theory to provide a relatively (more) accurate description of firms’ financing
behavior only when adverse selection costs associated with the issuance of information-
sensitive securities are “large(r).” Accordingly, the modified pecking order theory predicts
that, ceteris paribus, the regression coefficient β should be greater for firms with higher
information asymmetry. Several studies have examined this conditional relationship, e.g.,
with respect to information releases (Korajczyk, Lucas, and McDonald, 1991), the aggregate
volume of equity issuances (Bayless and Chaplinsky, 1996), or the business cycle (Choe,
Masulis, and Nanda, 1993). In this study, we test for this relationship by measuring the
severity of adverse selection costs with the adverse selection index described in Section 2.
14

We start by examining the slope coefficient β in Eq. (1) for firms sorted each fiscal year τ
into deciles according to our information asymmetry index ASYiτ . If the level of information
asymmetry in any fiscal year τ is a key driver of firms’ capital structure decisions in that
year, we expect to find an increasing and monotonic ordering of the β coefficient across the
deciles. Further, we expect the difference in the β coefficient between the highest and the
lowest deciles to be positive and significant. For economy of space, we report here only
the β coefficients for the low (1) and high (10) ASYiτ -based deciles of firms (estimated
over the entire sample, Total), their corresponding robust (heteroskedasticity-consistent)
t-statistics, and the R2 of the regression in Table 5. We assess sign and significance of
the relationship between our index and the extent of debt issuance to finance deficits by
computing Spearman rank correlations (ρSR) and linear regression coefficients (bOLS) between
the estimated β coefficients and their corresponding ASYiτ -based rankings, as well as by
estimating the coefficient for an interaction term of DEFiτ and ASYiτ (γ) in the following
augmented version of Eq. (1):
∆Diτ = α+ βDEFiτ + γDEFiτ ·ASYiτ + εiτ . (3)
Those three slope statistics (ρSR, bOLS, and γ) are also reported in Table 5.
[Table 5 here]All estimates of β are positive, smaller than one, and statistically significant at the 1%
level. Hence, the pecking order theory, in its most restrictive interpretation, provides only
a first-order approximation to the time-series variance in actual debt ratios, consistent with
the extant literature (e.g., Shyam-Sunder and Myers, 1999; Frank and Goyal, 2003). More
important, positive and statistically significant ρSR, bOLS, and γ statistics in Table 5 indicate
that the β coefficients are nearly monotonically increasing in the severity of firms’ information
asymmetry. For instance, the estimated γ = 0.021 implies that on average, for every dollar
of financing deficit to cover in a fiscal year, firms whose adverse selection index is a unit
greater than the mean that year issue 2 more cents of debt. Further, the difference between
the β coefficients at the two extreme deciles of firms (the high-low β column in Table 5) is
large (0.296) and strongly statistically significant: on average, for every dollar of financing
deficit to cover, firms in the highest ASYiτ decile issue 30 cents of debt more than firms in the
lowest ASYiτ decile. These results clearly indicate that cross-sectional variation in adverse
15

selection across firms is related to the cross-section of their capital structure decisions in a
fashion consistent with the pecking order theory: the higher the level of a firm’s information
asymmetry, the more of its financing needs are satisfied by the issuance of debt.
Perhaps, cross-sectional variation in the time-series behavior of firms’ debt ratios is related
– in a fashion consistent with the pecking order theory – not only to the level of, but also
to the change in the relative severity of information asymmetry about them over time: the
greater the increase in a firm’s adverse selection costs over the previous fiscal year, the greater
the portion of its financing deficit that firm may fund through debt in the current fiscal year.
Hence, as a further (and possibly more stringent) test of the basic tenets of the pecking order
theory, we estimate the debt-deficit regressions of Eq. (1) across deciles of U.S. firms sorted
on the basis of the relative change in their adverse selection risk from the previous fiscal year
(∆ASYiτ).21 Table 5 reports the resulting β estimates for the overall sample. Remarkably,
the ensuing inference mirrors closely the one based on ASYiτ : firms experiencing the greater
change in adverse selection risk with respect to the previous fiscal year follow the pecking
order more closely (display larger βs) in the current year.22
Lastly, we examine the cross-sectional performance of the pecking order theory (i.e., of
β of Eq. (1)) for ASYiτ - and ∆ASYiτ -based deciles of firms in three distinct time periods of
our sample: 1972-1979, 1980-1989, and 1990-2002. The resulting estimates, also reported in
Table 5, suggest that our previous inference may not uniformly apply to all three subperiods.
The estimated βs are always positive and lower than one, and the differences between the β
coefficients for the highest and lowest information asymmetry deciles of firms are large and
statistically significant in each of these subperiods. However, both the magnitude of those
differences (yet not their significance) and the extent to which the estimated β coefficients
increase across deciles (i.e., our estimates for ρSR, bOLS, and γ) decline in the 1990s. This
evidence is consistent with a trend highlighted by Frank and Goyal (2003) and Fama and
French (2005). Fama and French (2005) find that U.S. firms have been issuing more equity
more frequently over the last three decades, through mergers, private placements, convertible
debt, warrants, direct purchase plans, rights issues, and employee options, grants, and benefit
21We are indebted to Stewart Myers for recommending this line of action to us.22Similar inference ensues from sorting firms into either quintiles or terciles based on ASYiτ or ∆ASYiτ .
16

plans. For instance, they report that, between 1973 and 1982, on average 67% of the firms
in their sample issued some equity each year; this proportion rises to 74% between 1983 and
1992, and to 86% between 1993 and 2002. Accordingly, Frank and Goyal (2003) show that a
large and increasing portion of external financing took the form of equity during the 1990s.
We revisit this issue in our discussion of further tests of the pecking order theory next.
Overall, this preliminary evidence indicates that in the presence of financing needs, U.S.
firms display greater preference for debt, both statistically and economically, when plagued
with greater extent of and change in adverse selection costs – consistent with the main
assumption of the pecking order theory, albeit seemingly less so in the 1990s.
3.2 Conventional Leverage Regressions
The regression model of Eq. (1) was first introduced by Shyam-Sunder and Myers (1999) as a
test of a strict pecking order theory. Chirinko and Singha (2000) question that interpretation
by showing that equity issues can induce a negative bias in the test. The inference we
presented so far (Table 5) is based on differences in those regression coefficients across
information asymmetry deciles, rather than on their magnitude. Thus, it is potentially less
susceptible to this bias, yet only if such bias is roughly constant across deciles. Further, a
modified interpretation of the theory only requires for the pecking order to be an “excellent
first-order descriptor of corporate financing behavior” (Shyam-Sunder and Myers, 1999, p.
242), albeit not the only one. However, Chirinko and Singha (2000) also point out that if
firms follow a policy of using debt and equity in fixed proportions, in violation of the pecking
order, the estimated β coefficient may simply capture that ratio. Thus, it is of interest
to examine the empirical relevance of the main assumption of the pecking order theory
within alternative, more conventional empirical leverage specifications. Indeed, according to
Frank and Goyal (2003, p. 223), ignoring these specifications may amount to a “significant
omission,” yet their adoption may pose a “tough test for the pecking order theory.”
Rajan and Zingales (1995) survey the extant literature on factors driving leverage and
distill its key implications into a simple model relating the cross-section of firm leverage to
such conventional firm characteristics as size, tangibility, profitability, and market-to-book
17

assets ratio. We augment their model to include the extent of firm-level adverse selection
ASYiτ in the following firm fixed-effects panel regression:
Leverageiτ = a+ ui + b1ASYiτ + b2Tangibilityiτ + b3Qratioiτ
+b4Logsalesiτ + b5Profitabilityiτ + εiτ , (4)
where Logsalesiτ is the natural log of net sales (another proxy for firm size) and ui are firm
fixed effects. The literature has produced several definitions of firm leverage. Rajan and
Zingales (1995) discuss the merits and weaknesses of each. In this study we employ the
broadest and most widely adopted measure of firm i’s leverage in fiscal year τ , Leverageiτ :
the ratio of total debt to market value of assets, DMAiτ , as in Shyam-Sunder and Myers
(1999). The inference that follows is unaffected by defining leverage as the ratio of total debt
to either the book value of asset or market capitalization, as in Frank and Goyal (2003), or
by estimating Eq. (4) without firm fixed effects. If information asymmetry is an important
determinant of firms’ debt issuance decisions, whose cumulative effect is leverage, we expect
the coefficient on ASYiτ (b1) to be positive and significant. Table 6 presents the results.
[Table 6 here]
Both sign and significance of the coefficients for the conventional variables are in line with
the literature. Therefore, the inclusion of our adverse selection proxy does not supersede
their effects on leverage, as a strict interpretation of the pecking order theory would imply.
However, the coefficient on ASYiτ in the firm fixed-effects regression of Eq. (4) is positive,
large, and strongly significant in column (1) of Table 6. This estimate indicates that after
accounting for various firm characteristics, the level of market leverage of firms whose adverse
selection problems are the most severe (i.e., in the highest ASYiτ decile) is on average 172
basis points greater than for firms whose adverse selection problems are the least severe (i.e.,
in the lowest ASYiτ decile). This difference amounts to 7.5% of the mean firm-level market
leverage over our sample period. Since the dependent variable in Eq. (4) is bounded between
zero and one, we also estimate a Tobit regression. Its results, in column (2), are very similar.
Hence, the extent of firm-level adverse selection helps explain the cross-sectional variation
in firms’ capital structures – in accordance with the main assumption of the pecking order
theory – even after controlling for conventional leverage factors in the literature.
18

Frank and Goyal (2003) argue that a stronger test of the main implication of the strict
pecking order theory – namely, β = 1 in Eq. (1) – for the cross-section of firms’ financing
decisions can be constructed by running Eq. (4) in first differences. Accordingly, if adverse
selection is an important determinant of debt issuance decisions – the main assumption
of the pecking order theory – we expect greater ASYiτ to lead to higher leverage in the
cross-section of U.S. firms. Thus, we expect a positive and significant coefficient on ∆ASYiτ
in the following firm fixed-effects panel regression:
∆Leverageiτ = a+ ui + b1∆ASYiτ + b2∆Tangibilityiτ + b3∆Qratioiτ (5)
+b4∆Logsalesiτ + b5∆Profitabilityiτ + b6Leverageiτ−1 + εiτ ,
where all variables are fiscal year-on-year changes of the level variables in Eq. (4). Eq.
(5) also includes lagged leverage to account for the evidence of mean reversion in leverage
in the literature (e.g., Taggart, 1977; Marsh, 1982). These estimates are also reported in
Table 6 (column (7)). Sign and significance of the coefficients for the year-on-year changes in
the conventional variables are again in line with the literature (e.g., Frank and Goyal, 2003).
Further, the coefficient for lagged leverage is large, negative, and significant, suggesting some
mean reversion in leverage among U.S. firms. Nonetheless, even after accounting for these
considerations, the coefficient on ∆ASYiτ in the firm fixed-effects regression of Eq. (5) is
positive and strongly significant. Hence, changes in the extent of firm-level adverse selection
help explain the cross-sectional variation in changes in firms’ capital structures.
Lastly, we examine whether the extent and significance of the relationship between firm-
level adverse selection and the cross-section of firm leverage in the U.S. reported in Table 6
(b1 > 0 in columns (1), (2), and (7)) change over time, as suggested by Table 5. To that
purpose, we replace ASYiτ and ∆ASYiτ in Eqs. (4) and (5) with their interaction with
dummies for three portions of the sample period: 1972-1979 (ASYiτ ,70s and ∆ASYiτ ,70s),
1980-1989 (ASYiτ ,80s and ∆ASYiτ ,80s), and 1990-2002 (ASYiτ ,90s+ and ∆ASYiτ ,90s+). The
resulting coefficients’ estimates, in columns (3) and (8) of Table 6, are always positive and
strongly statistically significant in the 1980s and 1990s but less so in the 1970s, especially
for ∆ASYiτ . Accordingly, unreported t-tests fail to reject the null hypothesis that those
estimates do not differ across the three subperiods, with the sole exception of ∆ASYiτ ,70s.
19

Overall, these results provide strong confirmation that asymmetric information consider-
ations are important – though by no means the sole factor or uniformly so – in explaining
capital structure decisions of U.S. firms over the past three decades, consistent with the main
assumption of the pecking order theory.
3.3 Alternative Index Construction
A crucial aspect of the procedure for the construction of our information asymmetry index
is the extraction of the adverse selection component of several market measures of stock
liquidity. It is nonetheless possible that, despite our efforts, our index may still be affected
by such noninformational drivers of stock liquidity as dealers’ risk aversion or inventory.
We investigate the importance of these concerns as follows. First, we sort all firms into
terciles based on either annual standard deviation of stock returns or share turnover, from
the lowest (1) to the highest (3). Ceteris paribus, we expect risk-averse dealers to provide
less liquidity to more volatile stocks (e.g., Stoll, 1978). Higher turnover gives dealers greater
flexibility to offset their inventory, thus leading to greater stock liquidity (e.g., Jegadeesh and
Subrahmanyam, 1993). We then estimate Eq. (1) across adverse selection deciles of firms
within each of these subsets. To save space, we report (in Table 7) only the corresponding
differences in the β coefficients between the highest and the lowest deciles of information
asymmetry – as well as our tests for sign and significance of the relationship between β
coefficients and information asymmetry (ρSR, bOLS, and γ) – for sorts based on either the
level of (ASYiτ , Panel A) or change in (∆ASYiτ , Panel B) information asymmetry. Complete
estimation details are available on request. We find that the debt-deficit coefficients β
are generally increasing in adverse selection deciles – and their high-low ASYiτ -based and
∆ASYiτ -based differences both economically and statistically significant – in all of the
volatility and turnover-based terciles.23 For instance, column bOLS in Table 7 indicates
that on average, for every dollar of financing deficit to cover, firms in each turnover tercile
issue nearly 2 additional cents of debt more than firms in the same turnover decile but in
the next lower ASYiτ -based or ∆ASYiτ -based decile. Accordingly, sign and significance of
23Similar inference stems from computing stock return volatility as the annual sum of daily square returns.
20
the coefficients for ASYiτ and ∆ASYiτ in the fixed-effect regressions of Eq. (4) and (5)
are unaffected by the inclusion of both turnover and stock return volatility (or their first
differences) as additional explanatory variables to conventional leverage factors (including
firm size and tangibility, further discussed in Section 3.4), in columns (4) and (9) of Table 6.[Table 7 here]
Second, we construct a new index based exclusively on either the level of (ASY ∗iτ) or
the change in (∆ASY ∗iτ) the four most direct measures of adverse selection from the market
microstructure literature in our sample – the adverse selection portion of the quoted and
effective bid-ask spread (ADiτ and RADiτ , respectively), the interaction between trading
volume and asset returns (C2iτ), and the probability of informed trading (PINiτ) – at the
cost of smaller sample coverage. We then estimate Eq. (1) within each of the resultingASY ∗iτ -
based or ∆ASY ∗iτ -based deciles of firms and report the differences between the β coefficients
at the two extreme deciles and the corresponding slope statistics in Panels A and B of Table
A1 of the Appendix, respectively. We also estimate the conventional leverage regressions of
Section 3.2 (columns (1), (2), (4) to (7), and (9) to (11) in Table 6) using this new index, i.e.,
by replacing ASYiτ and ∆ASYiτ with ASY ∗iτ and ∆ASY ∗iτ in Eqs. (4) and (5), respectively.
The resulting estimated coefficients of interest (b1) are reported in Table A2 of the Appendix.
We find our previous inference from Tables 5 and 6 to be virtually unaffected. For instance,
i) for every dollar of financing deficit to cover, firms in the highest ASY ∗iτ decile issue 24.3
cents of debt more than firms in the lowest ASY ∗iτ decile (the high-low β column in Panel
A of Table A1), a difference similar to that stemming from the original ASYiτ -based sorts
(in Panel A of Table 5); ii) all the corresponding slope statistics indicate that the estimated
β coefficients are nearly monotonically increasing in either ASY ∗iτ (γ = $0.043 in Eq. (3))
or ASY ∗iτ -based rankings (ρSR = 0.903 and bOLS = $0.021); and iii) the coefficient on ASY ∗iτ
(b1) in Table A2 is positive and strongly statistically significant in all the specifications of
Eq. (4), as previously found for ASYiτ in Table 6. This is not surprising since the Spearman
rank correlation between the broader ASYiτ index and the first principal component of only
Z_RADiτ , Z_C2iτ , Z_ADiτ , and Z_PINiτ is high (0.772).
Lastly, we repeat the analysis of Tables 5 and 6 using each of the four most direct
market microstructure measures of adverse selection in our sample separately. For example,
in each fiscal year of our sample we sort the available firms based on either Z_C2iτ or
21

Z_∆C2iτ and estimate Eq. (1) within each Z_C2iτ -based or Z_∆C2iτ -based decile of
firms. Table A1 reports the differences between the β coefficients at the two extreme deciles
of either Z_RADiτ , Z_C2iτ , Z_ADiτ , or Z_PINiτ (Panel A), or Z_∆RADiτ , Z_∆C2iτ ,
Z_∆ADiτ , or Z_∆PINiτ (Panel B) and the corresponding slope statistics; Table A2 reports
estimates of the adverse selection coefficient b1 in Eqs. (4) and (5) after replacing ASYiτ
and ∆ASYiτ with the standardized level of or change in either RADiτ , C2iτ , ADiτ , or
PINiτ . This evidence suggests that the inference based on these measures, despite their more
limited sample coverage, is generally (although not uniformly) similar (both qualitatively and
quantitatively) to that based on the broad adverse selection index in Sections 3.1 and 3.2.
In particular, in most of the measure-specific tests in Table A1 both the estimated high-low
β coefficient differences and the slope statistics ρSR, bOLS, and γ are either economically
and statistically similar or qualitatively similar (i.e., of the same sign but not statistically
significant) to those reported in Table 5.24 Further, Table A2 indicates that in all but two of
the new sets of measure-specific regressions the relevant estimated coefficients b1 are positive
and, in most cases, strongly statistically significant as well (even after controlling for firm
size, tangibility, turnover, and stock return volatility, in columns (4) and (9)).
Overall, we conclude that i) our measure of information asymmetry has significant incre-
mental explanatory power for the cross-section of the relationship between debt issuances
and financing deficits, over and above such firm characteristics as stock return volatility and
stock liquidity; ii) the cross-sectional variation in either the level of or changes in firms’ lever-
age is related to either the extent of or changes in firm-level adverse selection; and iii) this
inference is generally robust to the procedure for the construction of our adverse selection
index and to the choice of index components.
24The sole exception is the level of PIN, Z_PINit, for which the high-low β coefficient difference and
corresponding slope statistics are negative and statistically significant. Sample coverage for PIN is much
more limited than for the other direct adverse selection proxies (see Table 1). Nonetheless, inference from
either debt-deficit regressions across firm deciles based on changes in PIN (Z_∆PINit in Panel B of Table
A1) or conventional leverage regressions (Table A2) is consistent with inference from ASYit and ∆ASYit.
22

3.4 Alternative Measures of Information Asymmetry
As previously discussed, the corporate finance literature has employed several alternative
measures of the information environment of a firm. In light of computational ease, firm
size is probably the most common conditioning variable in capital structure studies. It is
often argued that the pecking order theory should perform well for small firms since their
information costs are likely to be the largest (e.g., Frank and Goyal, 2003, p. 237). Extant
empirical evidence strongly rejects this hypothesis by showing that the coefficient β in Eq.
(1) is increasing in firm size (e.g., Frank and Goyal, 2003, Table 6). Yet, this evidence
cannot be directly attributed to the extent of firms’ adverse selection, for firm size is likely
to capture other firm characteristics as well (e.g., their reputation in debt markets or the
extent their assets are diversified). Tangibility of a firm’s assets is another common, easy to
calculate proxy for that firm’s information asymmetry problems. According to Harris and
Raviv (1991), adverse selection should be more severe, and the pecking order theory more
relevant, for firms whose assets are less tangible, i.e., more difficult to value. However, Frank
and Goyal (2003, Table 7) find that firms with more tangible assets tend to issue more debt,
a result they attribute to these firms’ intrinsically greater debt capacity.
We confirm these results in our sample. In unreported analysis, we sort firms in each
fiscal year into deciles of either size or tangibility from the lowest to the highest and estimate
the slope coefficient β in Eq. (1) for each decile. If either measure is an adequate proxy for
firm-level adverse selection and the main assumption of the pecking order theory holds, the
estimated β coefficients should be decreasing across either deciles. The differences between
the β coefficients at the two extreme size and tangibility deciles are instead positive (0.568 and
0.393, respectively) and strongly statistically significant. More important, those estimated
β coefficients are strictly increasing (e.g., ρSR = 1) in both size and tangibility rankings.
Consistently, the coefficients for sales and tangibility in the conventional leverage regressions
of Eq. (4) in Table 6 are also positive and strongly statistically significant. Yet, this evidence
cannot be interpreted as rejecting the pecking order theory since these tests are joint tests
of whether the sorting variable (size or tangibility) is capturing the cross-section of firms’
adverse selection costs as well. The evidence in Tables 5 and 6 overcomes this difficulty, for
our measure of firm-level information asymmetry (ASYiτ and ∆ASYiτ) is based exclusively
23

upon market microstructure proxies, grounded in theory, extracting the perceived intensity
of firm-level adverse selection from observed market prices and trades.
We nonetheless intend to ascertain whether firm size and tangibility supersede our in-
formation asymmetry index when testing for the pecking order theory. To that purpose, we
sort all firms into terciles of either size or tangibility in each of the fiscal years of the sample
and estimate Eq. (1) across either ASYiτ or ∆ASYiτ deciles within each size and tangibility
tercile. We report the resulting differences between β coefficients at the two extreme adverse
selection deciles of firms and slope statistics in Table 7. The latter almost uniformly indicate
that the estimated βs are nearly monotonically increasing in the extent of (and change in)
firms’ adverse selection within each size and tangibility tercile. Accordingly, the estimated
high-low ASYiτ -based (Panel A) and∆ASYiτ -based (Panel B) β differences are both positive
and statistically and economically significant for either small or large firms, or firms with
few or many tangible assets. For example, for every dollar of financing deficit to cover, firms
with highly tangible assets in the highest ASYiτ decile issue 29 cents of debt more than firms
with highly tangible assets but in the lowest ASYiτ decile. These results are consistent with
those reported in Table 6, where the coefficients for either ASYiτ or ∆ASYiτ in conventional
leverage regressions are also positive and statistically and economically significant despite
the inclusion of net sales and tangibility among the regressors. This evidence suggests that
cross-sectional variation in adverse selection is large enough – even across firms of similar
observable characteristics as size and tangibility – to relate to the cross-section of firms’ cap-
ital structure decisions in a statistically and economically significant fashion and consistent
with the pecking order theory.
The pecking order theory crucially depends on the information asymmetry between firm
managers (insiders) and markets being the friction leading to a hierarchy of financing choices
to minimize adverse selection costs of security issuance. Our market microstructure measures
(and the resulting index ASYiτ or ∆ASYiτ) are designed to capture the degree of informa-
tion asymmetry among market participants, which may arise from information asymmetry
between insiders and outsiders of the firm. Yet, as discussed earlier, these measures may also
proxy for asymmetry between a broader category of agents – informed traders – and un-
informed traders. Hence, our inference might be biased insofar as these informed traders are
24

not (related to) the insiders (managers) of the pecking order theory. To assess the relevance
of these considerations, we construct an alternative measure of adverse selection based on
the intensity of insider trading activity for each firm and in each fiscal year of the sample.
For that purpose, we collect insider trading data from the Securities and Exchange Commis-
sion (SEC) Ownership Reporting System (ORS) data file for as many firms in our sample
as possible. The SEC-ORS database contains all transactions by insiders that are subject
to disclosure according to Section 16(a) of the Securities and Exchange Act of 1934, and
is available to us only between 1978 and 2000. Following Lakonishok and Lee (2001), we
classify management as insiders and identify their purchases and sales. We use this database
to compute the extent of insider trading activity for each firm i in each fiscal year τ as one
hundred times the percentage ratio between the total volume of insider purchases and sales
and the corresponding overall trading volume, ITiτ . Intuitively, the greater this measure, the
more intense is the trading activity of firm i’s insiders in year τ , hence the greater may have
been their information advantage with respect to outsiders. Summary statistics for ITiτ (not
reported here) indicate that over the available sample period insider trading is uncommon (a
zero median), on average positive (1.39% of a firm’s annual trading volume), but only weakly
positively correlated to our information asymmetry index and most firm characteristics.
We employ this alternative proxy ITiτ as follows. First, in unreported analysis, we sort
firms in each fiscal year either into deciles of positive ITiτ from the lowest to the highest or
into a no-insider trading set (ITiτ = 0) and estimate the slope coefficient β in Eq. (1) for each
grouping. We find that i) even in absence of insider trading, firms fund 26% of their financing
deficits with debt (β = 0.262); ii) the difference between the β coefficients at the two extreme
deciles of positive ITiτ firms is weakly positive and small (0.053); and iii) none of the slope
statistics is statistically significant. Second, we sort all firms either into terciles of positive
ITiτ or into the no-insider trading set (ITiτ = 0) in each of the fiscal years of the sample
and then estimate Eq. (1) across either ASYiτ or ∆ASYiτ deciles within each ITiτ grouping.
The resulting differences between β coefficients at the two extreme adverse selection deciles
of firms – as well as the corresponding slope statistics (with the exception of ρSR) – are
always positive, large, and strongly statistically significant in Table 7 – consistent with the
pecking order theory (as in Table 5) – not only in each of the three positive-ITiτ terciles of
25

firms but also within firms with no disclosed insider trading. For instance, Panel A of Table
A2 indicates that on average, firms whose ITiτ = 0 and in the highest ASYiτ decile issue
23 cents of debt more than firms whose ITiτ = 0 but in the lowest ASYiτ decile. Third, we
include ITiτ as an additional explanatory variable in Eq. (4), and its first difference (∆ITiτ)
as an additional explanatory variable in Eq. (5). We report estimates for these amended
conventional leverage regressions in columns (5) and (10) of Table 6. The coefficients on
both level of and change in insider trading are statistically insignificant – consistent with
the evidence in Table 7 – while the inference on both ASYiτ and ∆ASYiτ is unchanged.25
We conclude that our market microstructure-based index of firm-level adverse selection
appears to capture a facet of information asymmetry not subsumed by size, tangibility, or in-
tensity of insider trading and, as such, has incremental, economically significant explanatory
power for the cross-section of firms’ financing decisions over those firm attributes.
3.5 Tobin’s Q and Information Asymmetry
In its original formulation, the pecking order theory of Myers and Majluf (1984) suggests
that firms with fewer growth opportunities (i.e., with greater assets-in-place) are more likely
to issue debt to fund their financing deficits when plagued by adverse selection problems.
Intuitively, investors deem those firms’ managers more likely to overvalue their assets-in-
place; hence those firms’s equity issuances are more likely to be undervalued. We test for
this argument in two ways. First, each fiscal year τ we sort the firms in our sample into three
terciles based on their Q ratios in that year. Consistent with the literature, we interpret
low (high) Q firms as firms with greater assets-in-place (growth opportunities). We then
estimate Eq. (1) for each of the resulting thirty Q-ASYiτ (and Q-∆ASYiτ) subsets of firms
and report the ensuing high-low β coefficient differences and corresponding slope statistics
in Panel A (Panel B) of Table 7.
Table 5 shows that over the full sample the β coefficients are nearly monotonically in-
creasing across information asymmetry rankings and the differences between β coefficients
at the extreme rankings are positive, large, and strongly statistically significant. If the above
25Similar inference is drawn by computing ITiτ only with insider sales (e.g., Lakonishok and Lee, 2001).
26

argument is correct, we should expect those differences to be larger, and the monotonic rela-
tion to be more pronounced, among firms with lower Q ratios. According to Table 7, those
firms do appear to be the most sensitive to adverse selection considerations when funding
their deficits. For instance, Panel A of Table 7 shows that for every dollar of financing deficit
to cover, firms within the lowest Q ratio tercile but in the highest adverse selection decile
issue on average nearly 60 cents of debt more than firms in the same Q ratio tercile but
the lowest adverse selection decile; that difference declines to about 40 cents and 20 cents
for firms within the medium and high Q ratio terciles. In addition, column bOLS in Table
7 indicates that on average, low Q firms fund through debt nearly 4 additional cents of
financing deficit more than firms in the same Q tercile but in the next lower ASYiτ -based
decile; the estimated bOLS coefficient is instead statistically insignificant for the medium Q
tercile, and equal to about 1 cent for the high Q tercile of firms. Similarly, the extent to
which firms whose ASYiτ is a unit greater than the mean in a fiscal year issue more debt for
every dollar of financing deficit to cover in that year (column γ in Table 7) is statistically
significantly different (at the 1% level, in unreported tests) and strictly decreasing across Q
terciles (from nearly 7 cents to less than 2 cents). Sorting firms on changes in information
asymmetry (∆ASYiτ , in Panel B of Table 7) leads to similar inference.
Eqs. (4) and (5) allow us to perform a more challenging test of the above argument.
Specifically, we test whether – conditional on both the extent of firms’ growth opportunities
and the conventional set of explanatory factors for leverage – our proxies for either the level
of or the change in adverse selection better explain the cross-section of either the level of or
the change in firm leverage. To that purpose, we augment Eq. (4) with an interaction term
of Qratioiτ and ASYiτ and Eq. (5) with an interaction term of ∆Qratioiτ and ∆ASYiτ . We
report the results of this estimation in columns (6) and (11) of Table 6. If the effect of adverse
selection on firm leverage is more pronounced for firms that have relatively more assets-in-
place (lower Q), the estimated coefficients for both interaction terms should be negative and
significant. The evidence in Table 6 strongly supports this prediction. In accordance with
Table 7, it indicates that U.S. firms’ debt issuance decisions are more sensitive to information
asymmetry considerations when assets-in-place represent a greater portion of their value (low
Q ratio), as postulated by the pecking order theory.
27

3.6 Further Robustness Tests
The basic test of the pecking order theory of Eq. (1) examines the relationship between a
firm’s debt issuances and its financing deficits. According to Shyam-Sunder and Myers (1999,
p. 224), Eq. (1) “is not an accounting identity” – since the definition of financing deficits
(DEFiτ of Eq. (2)) does not include equity issues or buybacks – but is meant to capture the
extent to which the main implication of the pecking order theory, in its strict interpretation,
holds in the data: any aggregate nonzero deficit, regardless of its source, should be funded
with debt. Thus, Shyam-Sunder and Myers (1999) aggregate the accounting data in Eq. (2)
into DEFiτ . However, the ensuing regression of Eq. (1) does not control for the possibility
that, ceteris paribus, some firms may not need any funds (and so may not issue any debt)
because they are experiencing little or no growth in their business activity. The presence of
such firms in the sample may bias our analysis toward rejection of a less strict interpretation
of the pecking order theory.
We address this issue by amending Eq. (1) to include each of the three main sources of
firms’ financing deficits – dividends, investments, and cash flow – separately (along the
lines of Frank and Goyal, 2003) as follows:
∆Diτ = α+ β1DIViτ + β2INViτ + β3CFiτ + εiτ , (6)
where INViτ = CAPEXiτ + ∆WCiτ captures a firm’s demand for funds due to its real
investments. Eq. (6) allows us to establish which of the explicitly disaggregated components
of DEFiτ is driving the cross-sectional relationship between funding needs, debt issuance,
and adverse selection found in Table 5. A strict interpretation of the pecking order theory
requires that β1 = β2 = −β3 = 1. The basic assumption of the modified version of the theoryrequires that the absolute value of each of these coefficients be increasing in the severity of
adverse selection problems plaguing the issuing firms. In particular, ceteris paribus, a firm’s
financing needs that are more directly related to the growth of its business (such as INViτ ,
its real investments) should be more likely to be funded with debt (i.e., β2 is greater) the
greater is the information asymmetry about that firm’s business.
We report the resulting differences between the estimated βn coefficients at the two
extreme adverse selection deciles of firms and the corresponding slope statistics (ρSR, bOLS,
28

and γ) in Table A1 of the Appendix. Those statistics indicate that estimates for β1, β2,
and |β3| are all nearly monotonically increasing across deciles of severity of informationasymmetry, consistent with the basic assumption of the modified version of the pecking order
theory. In particular, so is the coefficient for funding needs related to a firm’s investment
activity (INViτ), i.e., more directly related to its growth. For example, the difference between
estimated β2 in Eq. (6) for the highest and lowest adverse selection deciles of firms is always
large – 0.307 for ASYiτ -based sorts (Panel A) and 0.243 for ∆ASYiτ -based sorts (Panel B)
– and statistically significant. We conclude that information asymmetry is an important
determinant of a firm’s capital structure choice in response to each of its funding needs,
including when those needs are driven by that firm’s real investments.
4 Conclusion
We use a novel information asymmetry index– based on either the level or change in adverse
selection measures developed by the market microstructure literature – to reexamine several
popular tests of the pecking order theory. Our index relies exclusively on measures of the
market’s assessment of adverse selection risk, rather than on ex ante firm characteristics,
and displays sensible economic properties.
We find that firm-level asymmetric information considerations are important – albeit
not the sole – determinants of the cross-section of level and change in leverage of U.S. firms
over the last three decades. These findings are robust to the procedure for the construction
of our measure of adverse selection index, to the choice of its components, as well as to
controlling for conventional leverage factors (size, tangibility, Q ratio, profitability), the
sources of firms’ financing needs, and such firm attributes as stock return volatility, stock
turnover, and intensity of insider trading.
Our evidence does not corroborate a strict interpretation of the pecking order theory.
Nonetheless, it indicates that a modified pecking order theory finds the greatest support,
both statistically and economically, when its basic assumption – severe adverse selection –
holds the most in the data. Consistent with Myers (2001), we believe the latter constitutes
the theory’s most appropriate benchmark.
29

References
Aboody, D., Lev, B. (2000). Information Asymmetry, R&D and Insider Gains. Journal of
Finance, 55, 2747-2766.
Alford, A., Jones, P. (2003). A Simultaneous Equations Analysis of Forecast Accuracy, An-
alyst Following, and Trading Volume. Journal of Accounting, Auditing, and Finance, 14,
219-240.
Amihud, Y. (2002). Illiquidity and Stock Returns: Cross-Section and Time-Series Effects.
Journal of Financial Markets, 5, 31-56.
Amihud, Y., Mendelson H. (1980). Dealership Market: Market Making with Inventory. Jour-
nal of Financial Economics, 8, 311-353.
Amihud, Y., Mendelson, H., Lauterbach, B. (1997). Market Microstructure and Securities
Value: Evidence from the Tel Aviv Exchange. Journal of Financial Economics, 45, 365-390.
Bagehot, W. (1971). The Only Game in Town. Financial Analyst Journal, 27, 12-22.
Barclay, M., Smith, C. (1995a). The Maturity Structure of Debt. Journal of Finance, 50,
609-631.
Barclay, M., Smith, C. (1995b). The Priority Structure of Corporate Liabilities. Journal of
Finance, 50, 899-918.
Bayless, M., Chaplinsky, S. (1996). Is There a Window of Opportunity for Seasoned Equity
Issuance? Journal of Finance, 51, 253-278.
Berger, A., Udell, G. (1995). Relationship Lending and Lines of Credit in Small Firm Finance.
Journal of Business, 68, 351-381.
Best, R., Hodges, C., Lin, B. (2004). Does Information Asymmetry Explain the Diversifica-
tion Discount? Journal of Financial Research, 27, 235-349.
Brennan, M., Subrahmanyam, A. (1995). Investment Analysis and Price Formation in Secu-
rities Markets. Journal of Financial Economics, 38, 361-381.
30

Chae, J. (2005). Timing Information, Information Asymmetry, and Trading Volume. Journal
of Finance, 60, 413-442.
Chang, X., Dasgupta, S., Hilary, G. (2006). Analyst Coverage and Financing Decisions.
Journal of Finance, 61, 3009-3048.
Chen, Q., Goldstein, I., Jiang, W. (2007). Price Informativeness and Investment Sensitivity
to Stock Price. Review of Financial Studies, 20, 619-650.
Chirinko, R., Singha, A. (2000). Testing Static Tradeoff Against Pecking Order Models of
Capital Structure: A Critical Comment, Journal of Financial Economics 58, 417-425.
Choe, H., Masulis, R., Nanda, V. (1993). Common Stock Offerings Across the Business
Cycle, Journal of Empirical Finance 1, 3-31.
Clarke, J., Shastri, K. (2001). On Information Asymmetry Metrics. Working Paper, Univer-
sity of Pittsburgh.
Cooper, S., Groth, J., Avera, W. (1985). Liquidity, Exchange Listing, and Stock Return
Performance. Journal of Economics and Business, 37, 19-33.
Copeland, T., Galai, D. (1983). Information Effects and the Bid-Ask Spread. Journal of
Finance, 38, 1457-1469.
Desai, A., Nimalendran, M., Venkataraman, S. (1998). Changes in Trading Activity Follow-
ing Stock Splits and their Effect on Volatility and the Adverse Information Component of
the Bid-Ask Spread. Journal of Financial Research, 21, 159-183.
Dierkens, N. (1991). Information Asymmetry and Equity Issues. Journal of Financial and
Quantitative Analysis, 26, 181-199.
Diether, K., Malloy, C., Scherbina, A. (2002). Differences of Opinion and the Cross Section
of Stock Returns. Journal of Finance, 57, 2113-2141.
Easley, D., Hvidkjaer, S., O’Hara, M. (2004). Factoring Information into Returns. Working
Paper, University of Maryland.
31

Easley, D., Kiefer, N., O’Hara, M. (1996). Cream-Skimming or Profit-Sharing? The Curious
Role of Purchased Order Flow. Journal of Finance, 51, 811-833.
Easley, D., Kiefer, N., O’Hara, M., (1997a). The Information Content of the Trading Process.
Journal of Empirical Finance, 4, 159-186.
Easley, D., Kiefer, N., O’Hara, M., (1997b). One Day in the Life of a Very Common Stock.
Review of Financial Studies, 10, 805-835.
Easley, D., Kiefer, N., O’Hara, M., Paperman, J. (1996). Liquidity, Information, and Infre-
quently Traded Stocks. Journal of Finance, 51, 1405-1436.
Fama, E. and French, K. (2002). Testing Trade-Off and Pecking Order Predictions About
Dividends and Debt. Review of Financial Studies, 15, 1-33.
Fama, E. and French, K., (2005). Financing Decisions: Who Issues Stock? Journal of
Financial Economics, 76, 549-582.
Flannery, M., Kwan, S., Nimalendran, M. (2004). Market Evidence on the Opaqueness of
Banking Firms’ Assets. Journal of Financial Economics, 71, 419-460.
Frank, M., Goyal, V., (2003). Testing the Pecking Order Theory of Capital Structure. Journal
of Financial Economics, 67, 217-248.
Frankel, R., Li, X. (2004). The Characteristics of a Firm’s Information Environment and
the Information Asymmetry Between Insiders and Outsiders. Journal of Accounting and
Economics, 37, 229-259.
Frieder, L., Martell, R. (2005). On Capital Structure and the Liquidity of a Firm’s Stock,
Working Paper, Purdue University.
George, T., Kaul, G., Nimalendran, M. (1991). Estimation of the Bid-Ask Spread and Its
Components: A New Approach. Review of Financial Studies, 4, 623-656.
Glosten, L., Milgrom, P. (1985). Bid, Ask, and the Transaction Prices in a Specialist Market
with Heterogeneously Informed Traders. Journal of Financial Economics, 14, 71-100.
32
Gomes, A., Phillips, G. (2005). Why Do Public Firms Issue Private and Public Securities?
NBER Working Paper No. 11294.
Graham, J., Koski, J., Loewenstein, U. (2006). Information Flow and Liquidity Around
Anticipated and Unanticipated Dividend Announcements. Journal of Business, 79, 2301-
2336.
Halov, N., Heider, F. (2004). Capital Structure, Risk, and Asymmetric Information. Working
Paper, New York University.
Hasbrouck, J. (1991). Measuring the Information Content of Stock Trades. Journal of Fi-
nance, 46, 179-207.
Hasbrouck, J. (2005). Trading Costs and Returns for US Equities: The Evidence from Daily
Data. Working Paper, New York University.
Hasbrouck, J. (2006). Empirical Market Microstructure: The Institutions, Economics and
Econometrics of Securities Trading. Oxford University Press.
Heflin, F., Shaw, K. (2000). Blockholder Ownership and Market Liquidity. Journal of Fi-
nancial and Quantitative Analysis, 35, 621-633.
Heflin, F., Shaw, K., Wild, J. (2005). Disclosure Quality and Market Liquidity: Impact of
Depth Quotes and Order Sizes. Contemporary Accounting Research, 22, 829-865.
Hoven-Stohs, M., Mauer, D. (1996). The Determinants of Corporate Debt Maturity Struc-
ture. Journal of Business, 69, 279-312.
Huang, R., Stoll, H. (1997). The Components of the Bid-Ask Spread: A General Approach.
Review of Financial Studies, 10, 995-1034.
Huddart, S., Ke, B. (2007). Information Asymmetry and Cross-Sectional Variation in Insider
Trading. Contemporary Accounting Research, 24, 195-232.
Jegadeesh, N., Subrahmanyam, A. (1993). Liquidity Effects of the Introduction of the S&P
500 Index Futures Contract on the Underlying Stocks. Journal of Business, 66, 171-187.
33

Jeng, L., Metrick, A., Zeckhauser, R. (1999). The Profits to Insider Trading: A Performance-
Evaluation Perspective. NBER Working Paper No. 6913.
Jennings, R. (1994). Intraday Changes in Target Firms’ Share Price and Bid-Ask Quotes
Around Takeover Announcements. Journal of Financial Research, 17, 215-270.
Korajczyk, R. A., Lucas, D, MacDonald, R. (1991). The Effect of Information Releases on
the Pricing and Timing of Equity Issues. Review of Financial Studies, 4, 695-708.
Krinsky, I., Lee, J. (1996). Earnings Announcements and the Components of the Bid-Ask
Spread. Journal of Finance, 51, 1523-1535.
Krishnaswami, S., Subramaniam, V. (1999). Information Asymmetry, Valuation, and the
Corporate Spin-off Decision. Journal of Financial Economics, 53, 73-112.
Kumar, R., Sarin, A., Shastri, K. (1998). The Impact of Options Trading on the Market
Quality of the Underlying Security: An Empirical Analysis. Journal of Finance, 53, 717-732.
Kyle, P. (1985). Continuous Auctions and Insider Trading. Econometrica, 53, 1315-1336.
Lakonishok, J., Lee, I. (2001). Are Insider Trades Informative? Review of Financial Studies,
14, 79-111.
Leary, M., Roberts, M. (2004). Financial Slack and Tests of the Pecking Order’s Financing
Hierarchy, Working Paper, Duke University.
Lee, C., Mucklow, B., Ready, M. (1993). Spreads, Depths, and the Impact of Earnings
Information: An Intraday Analysis. Review of Financial Studies, 6, 345-374.
Lemmon, M., Zender, J. (2004). Debt Capacity and Tests of Capital Structure Theories.
Working Paper, University of Colorado.
Lipson, M., Mortal, S. (2006). Capital Structure Decisions and Equity Market Liquidity,
Working Paper, University of Virginia.
Llorente, G., Michaely, R., Saar, G., Wang, J. (2002). Dynamic Volume-Return Relation of
Individual Stocks. Review of Financial Studies, 15, 1005-1047.
34

Lowry, M. (2003). Why Does IPO Volume Fluctuate So Much? Journal of Financial Eco-
nomics, 67, 3-40.
Marsh, P. (1982). The Choice Between Equity and Debt: An Empirical Study. Journal of
Finance, 37, 121-144.
Myers, S. (1984). The Capital Structure Puzzle, Journal of Finance, 39, 575-592.
Myers, S. (2001). Capital Structure. Journal of Economic Perspectives, 15, 81-102.
Myers, S., Majluf, N. (1984). Corporate Financing and Investment Decisions when Firms
Have Information That Investors Do Not Have, Journal of Financial Economics, 13, 187-221.
Neal, R., Wheatley, S. (1998). Adverse Selection and Bid-Ask Spreads: Evidence from
Closed-End Funds. Journal of Financial Markets, 1, 121-149.
O’Hara, M. (1995). Market Microstructure Theory. Blackwell.
Odders-White, E., Ready, M. (2006). Credit Ratings and Stock Liquidity.Review of Financial
Studies, 19, 119-157.
Pasquariello, P., Vega, C. (2007). Informed and Strategic Order Flow in the Bond Markets.
Review of Financial Studies, 20, 1975-2019.
Pastor, L., Stambaugh, R. (2003). Liquidity Risk and Expected Stock Returns. Journal of
Political Economy, 111, 642-685.
Rajan, R. G., Zingales, L. (1995). What Do We Know About Capital Structure: Some
Evidence from International Data, Journal of Finance, 50, 1421-1460.
Roll, R. (1984). A Simple Implicit Measure of the Effective Bid-Ask Spread in an Efficient
Market. Journal of Finance, 39, 1127-1139.
Sadka, R., Scherbina, A. (2007). Analyst Disagreement, Mispricing, and Liquidity. Journal
of Finance, 62, 2367-2403.
Serednyakov, A. (2002). The Information Flows Around Bankruptcy Announcements: An
Empirical Investigation. Working Paper, University of Minnesota.
35

Seyhun, N. (1986). Insiders’ Profits, Costs of Trading, and Market Efficiency. Journal of
Financial Economics, 16, 189-212.
Seyhun, N. (1992). The Effectiveness of Insider Trading Sanctions. Journal of Law and
Economics, 35, 149-182.
Shyam-Sunder L., Myers, S. (1999). Testing Static Tradeoff Against Pecking Order Models
of Capital Structure. Journal of Financial Economics, 51, 219-244.
Stoll, H. (1978). The Supply of Dealer Services in Securities Markets. Journal of Finance,
33, 1133-1151.
Taggart, R. (1977). A Model of Corporate Financing Decisions. Journal of Finance, 32,
1467-1484.
Vega, C. (2006). Stock Price Reaction to Public and Private Information. Journal of Finan-
cial Economics, 82, 103-133.
36

Table 1: Summary statisticsSummary statistics for the information asymmetry variables defined in the text over thesample period 1972-2002.
Variable Obs. Mean Stdev Median
RADiτ 78429 0.35 0.27 0.31
C2iτ 78849 0.01 0.15 0.02
ADiτ 29233 0.85 0.16 0.90
PINiτ 12992 0.20 0.08 0.19
ILLiτ 84511 1.07 2.00 0.47
GAMiτ 78939 0.32 9.33 0.01
LRiτ 90338 -7.77 18.01 -2.08
ASYiτ 91471 0.00 1.80 0.39
MASYiτ 90965 0.00 2.08 0.81
37

Table2:Correlation
matrices
ThistablereportsSpearmanrankcorrelationsforthestandardizedinformationasymmetryvariablesdefinedinthetextover
thesampleperiod1972-2002.a,b,cdenotestatisticalsignificanceat1%,5%,and10%.
PanelA:Standardizedlevelsofinformationasymmetry.
ASY
iτZ_RADiτ
Z_C2 iτ
Z_ADiτ
Z_PINiτ
Z_ILLiτ
Z_GAMiτ
Z_LRiτ
ASY
iτ1
Z_RADiτ
0.158a
1
Z_C2 iτ
0.273a
-0.072a
1
Z_ADiτ
0.141b
0.037
-0.022
1
Z_PINiτ
0.513a
-0.246a
0.063a
-0.168
1
Z_ILLiτ
0.385a
-0.282a
0.121a
0.069c
0.675a
1
Z_GAMiτ
0.308a
-0.282a
0.122a
0.094b
0.572a
0.839a
1
Z_LRiτ
-0.065
-0.327a
0.109a
0.116a
0.657a
0.937a
0.878a
1
PanelB:Standardizedyear-on-yearchangesininformationasymmetry.
MASY
iτZ_MR
ADiτ
Z_MC
2 iτ
Z_MA
Diτ
Z_MP
INiτ
Z_MILLiτ
Z_MG
AMiτ
Z_MLRiτ
MASY
iτ1
Z_MR
ADiτ
0.244a
1
Z_MC
2 iτ
0.255a
-0.051a
1
Z_MA
Diτ
0.251a
0.132c
0.149c
1
Z_MP
INiτ
0.162a
0.002
0.009
0.175
1
Z_MILLiτ
0.238a
-0.037a
-0.001
-0.032
0.074a
1
Z_MG
AMiτ
0.203a
-0.039a
0.039a
0.100
-0.003
0.332a
1
Z_MLRiτ
0.125a
-0.030a
0.038a
0.035
0.014
0.500a
0.228a
1
38

Table 3: Accounting variables across adverse selection decilesThis table reports means of various firm characteristics for each adverse selection decile of firms over thesample period 1972-2002. ρSR and bOLS are the Spearman rank correlation and linear regression coefficient,respectively, between the corresponding variable and either the ASYiτ -based or the MASYiτ -based rankings.Panel A: ASYiτ -based deciles.
Decile Size Tangibility Q ratio Sales Profitability ITiτ
low $2,757 0.29 4.31 $2,320 -0.12 1.85
2 $2,470 0.32 2.24 $2,060 0.07 1.22
3 $798 0.31 1.90 $678 0.04 1.39
4 $1,108 0.31 2.06 $854 -0.01 1.44
5 $1,098 0.31 2.38 $844 0.03 1.35
6 $988 0.31 2.14 $748 0.00 1.27
7 $635 0.30 2.05 $516 -0.01 1.07
8 $493 0.30 1.90 $384 -0.04 1.59
9 $2,097 0.33 1.89 $1,638 0.05 1.09
high $374 0.31 1.56 $338 -0.06 1.72
Total $1,288 0.31 2.24 $1,043 -0.01 1.39
ρSR -0.673b 0.164 -0.745a -0.673b -0.127 -0.152
bOLS -$164c 0.00 -0.17b -$141b 0.00 -0.01
Panel B: MASYiτ -based deciles.
Decile Size Tangibility Q ratio Sales Profitability MITiτlow $793 0.30 3.42 $597 -0.11 -0.59
2 $1,985 0.28 2.99 $1,600 -0.03 -0.64
3 $1,725 0.31 2.11 $1,481 0.04 -0.71
4 $1,205 0.31 2.14 $1,135 0.04 -0.27
5 $1,055 0.31 1.92 $920 0.01 -0.22
6 $2,094 0.32 1.80 $1,685 0.02 -0.21
7 $1,831 0.33 1.83 $1,398 0.05 -0.10
8 $1,162 0.31 2.02 $857 0.02 -0.21
9 $968 0.31 1.87 $796 -0.01 -0.04
high $917 0.31 1.74 $723 0.00 -0.07
Total $1,293 0.31 2.24 $1,048 -0.01 -0.24
ρSR -0.188 0.467 -0.842a -0.273 0.164 0.903a
bOLS -$35 0.003c -0.15a -$37 0.01 0.07a
39
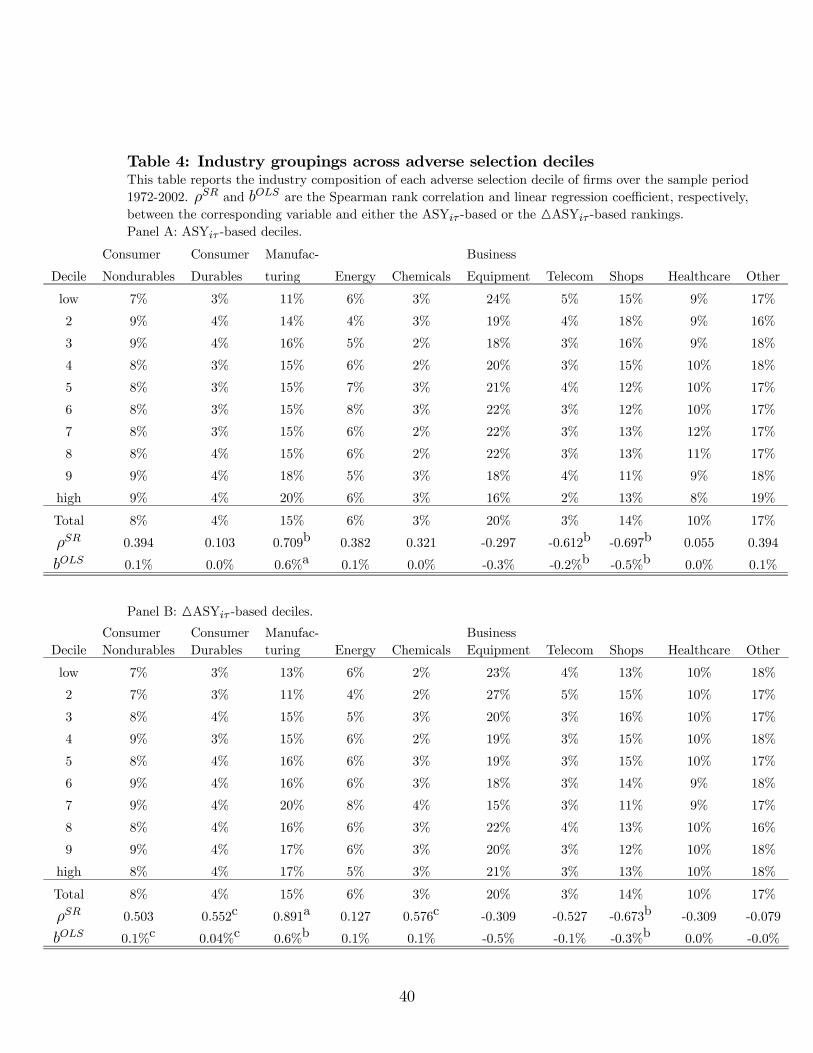
Table 4: Industry groupings across adverse selection decilesThis table reports the industry composition of each adverse selection decile of firms over the sample period1972-2002. ρSR and bOLS are the Spearman rank correlation and linear regression coefficient, respectively,between the corresponding variable and either the ASYiτ -based or the MASYiτ -based rankings.Panel A: ASYiτ -based deciles.
Consumer Consumer Manufac- Business
Decile Nondurables Durables turing Energy Chemicals Equipment Telecom Shops Healthcare Other
low 7% 3% 11% 6% 3% 24% 5% 15% 9% 17%
2 9% 4% 14% 4% 3% 19% 4% 18% 9% 16%
3 9% 4% 16% 5% 2% 18% 3% 16% 9% 18%
4 8% 3% 15% 6% 2% 20% 3% 15% 10% 18%
5 8% 3% 15% 7% 3% 21% 4% 12% 10% 17%
6 8% 3% 15% 8% 3% 22% 3% 12% 10% 17%
7 8% 3% 15% 6% 2% 22% 3% 13% 12% 17%
8 8% 4% 15% 6% 2% 22% 3% 13% 11% 17%
9 9% 4% 18% 5% 3% 18% 4% 11% 9% 18%
high 9% 4% 20% 6% 3% 16% 2% 13% 8% 19%
Total 8% 4% 15% 6% 3% 20% 3% 14% 10% 17%
ρSR 0.394 0.103 0.709b 0.382 0.321 -0.297 -0.612b -0.697b 0.055 0.394
bOLS 0.1% 0.0% 0.6%a 0.1% 0.0% -0.3% -0.2%b -0.5%b 0.0% 0.1%
Panel B: MASYiτ -based deciles.Consumer Consumer Manufac- Business
Decile Nondurables Durables turing Energy Chemicals Equipment Telecom Shops Healthcare Other
low 7% 3% 13% 6% 2% 23% 4% 13% 10% 18%
2 7% 3% 11% 4% 2% 27% 5% 15% 10% 17%
3 8% 4% 15% 5% 3% 20% 3% 16% 10% 17%
4 9% 3% 15% 6% 2% 19% 3% 15% 10% 18%
5 8% 4% 16% 6% 3% 19% 3% 15% 10% 17%
6 9% 4% 16% 6% 3% 18% 3% 14% 9% 18%
7 9% 4% 20% 8% 4% 15% 3% 11% 9% 17%
8 8% 4% 16% 6% 3% 22% 4% 13% 10% 16%
9 9% 4% 17% 6% 3% 20% 3% 12% 10% 18%
high 8% 4% 17% 5% 3% 21% 3% 13% 10% 18%
Total 8% 4% 15% 6% 3% 20% 3% 14% 10% 17%
ρSR 0.503 0.552c 0.891a 0.127 0.576c -0.309 -0.527 -0.673b -0.309 -0.079
bOLS 0.1%c 0.04%c 0.6%b 0.1% 0.1% -0.5% -0.1% -0.3%b 0.0% -0.0%
40
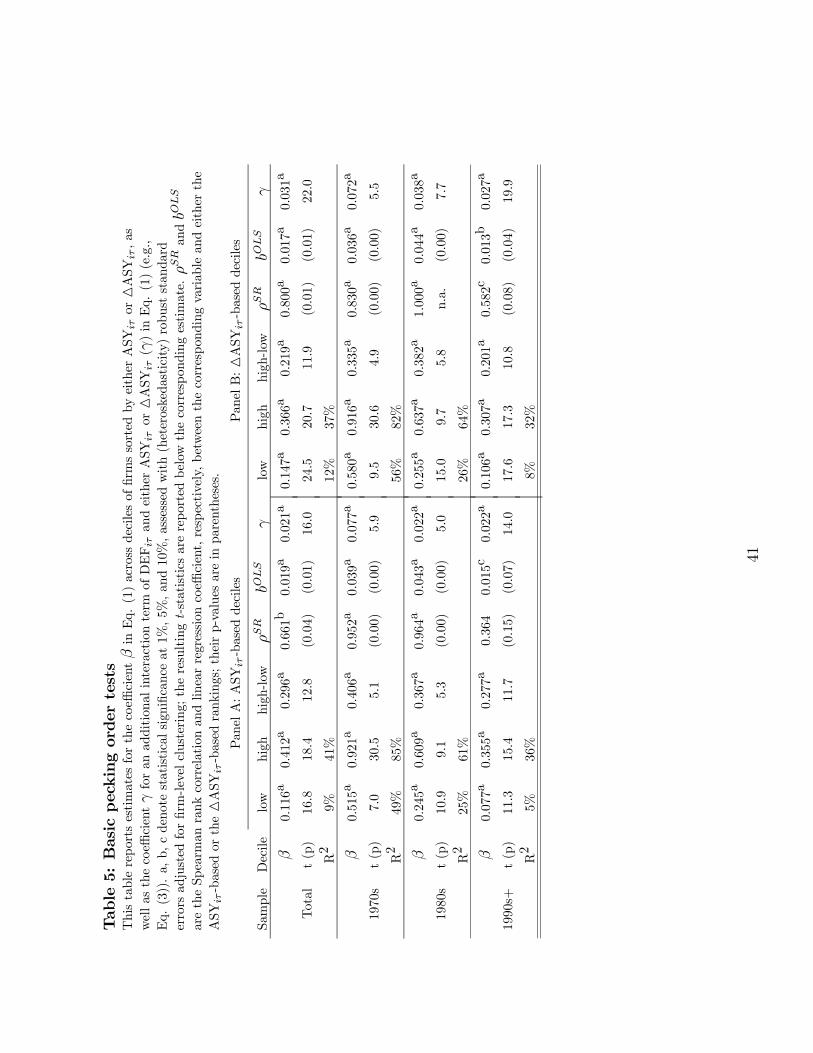
Table5:Basicpeckingordertests
ThistablereportsestimatesforthecoefficientβinEq.(1)acrossdecilesoffirmssortedbyeitherASY
iτorMA
SYiτ,as
wellasthecoefficientγforanadditionalinteractionterm
ofDEFiτandeitherASY
iτorMA
SYiτ(γ)inEq.(1)(e.g.,
Eq.(3)).a,b,cdenotestatisticalsignificanceat1%,5%,and10%,assessedwith(heteroskedasticity)robuststandard
errorsadjustedforfirm-levelclustering;theresultingt-statisticsarereportedbelow
thecorrespondingestimate.ρSRandbOLS
aretheSpearmanrankcorrelationandlinearregressioncoefficient,respectively,betweenthecorrespondingvariableandeitherthe
ASY
iτ-basedortheMA
SYiτ-basedrankings;theirp-valuesareinparentheses.
PanelA:ASY
iτ-baseddeciles
PanelB:MA
SYiτ-baseddeciles
Sample
Decile
low
high
high-low
ρSR
bOLS
γlow
high
high-low
ρSR
bOLS
γ
β0.116a
0.412a
0.296a
0.661b
0.019a
0.021a
0.147a
0.366a
0.219a
0.800a
0.017a
0.031a
Total
t(p)
16.8
18.4
12.8
(0.04)
(0.01)
16.0
24.5
20.7
11.9
(0.01)
(0.01)
22.0
R2
9%41%
12%
37%
β0.515a
0.921a
0.406a
0.952a
0.039a
0.077a
0.580a
0.916a
0.335a
0.830a
0.036a
0.072a
1970s
t(p)
7.0
30.5
5.1
(0.00)
(0.00)
5.9
9.5
30.6
4.9
(0.00)
(0.00)
5.5
R2
49%
85%
56%
82%
β0.245a
0.609a
0.367a
0.964a
0.043a
0.022a
0.255a
0.637a
0.382a
1.000a
0.044a
0.038a
1980s
t(p)
10.9
9.1
5.3
(0.00)
(0.00)
5.0
15.0
9.7
5.8
n.a.
(0.00)
7.7
R2
25%
61%
26%
64%
β0.077a
0.355a
0.277a
0.364
0.015c
0.022a
0.106a
0.307a
0.201a
0.582c
0.013b
0.027a
1990s+
t(p)
11.3
15.4
11.7
(0.15)
(0.07)
14.0
17.6
17.3
10.8
(0.08)
(0.04)
19.9
R2
5%36%
8%32%
41

Table 6: Conventional leverage regressionsThis table reports estimates for the bn coefficients from firm fixed-effects and Tobit panel regressions of Eq. (4)for Leverageiτ = DMAiτ and from fixed-effects regressions of Eq. (5) for MLeverageiτ = MDMAiτ . We do notreport the coefficient for the intercept. a, b, c denote statistical significance at 1%, 5%, and 10%, assessed with(heteroskedasticity) robust standard errors adjusted for firm-level clustering; the resulting t-statistics are reportedbelow each estimate. Estimates for coefficients related to ASYiτ , MASYiτ , ITiτ , and MITiτ are multiplied by 100.
OLS Tobit OLS OLS OLS OLS OLS OLS OLS OLS OLS
Eq. (4) (1) (2) (3) (4) (5) (6) Eq. (5) (7) (8) (9) (10) (11)
ASYiτ 0.404a 0.283a 0.374a 0.483a 0.714a MASYiτ 0.298a 0.267a 0.190a 0.252a
8.5 4.3 7.5 9.1 11.6 5.7 4.9 3.4 4.8
ASYiτ ,70s 0.301b MASYiτ ,70s 0.022
2.1 0.2
ASYiτ ,80s 0.436a MASYiτ ,80s 0.331a
5.6 3.5
ASYiτ ,90s+ 0.402a MASYiτ ,90s+ 0.321a
6.9 5.1
Turnover -0.398 MTurnover -0.365a
-1.3 -3.1
Volatility 0.061a MVolatility 0.029a
15.0 9.5
ITiτ -0.007 MITiτ 0.004
-0.7 0.7
QxASYiτ -0.116a MQxMASYiτ -0.170a
-5.4 -3.6
Tangibility 0.198a 0.184a 0.198a 0.193a 0.184a 0.197a MTangibility 0.129a 0.129a 0.125a 0.119a 0.128a
18.5 40.5 18.5 18.1 16.7 18.4 12.9 12.9 12.4 11.6 12.9
Qratio -0.009a -0.019a -0.009a -0.008a -0.008a -0.011a MQratio -0.005a -0.005a -0.005a -0.005a -0.005a
-4.1 -4.8 -4.1 -3.9 -4.0 -4.3 -5.1 5.1 -5.0 -5.0 -4.8
Logsales 0.023a 0.001a 0.023a 0.026a 0.025a 0.023a MLogsales -0.002 -0.002 0.000 -0.002 -0.001
15.4 3.4 15.4 17.0 15.8 14.9 -1.0 1.0 0.0 -1.1 -0.7
Profitability -0.012 -0.006 -0.012 -0.009 -0.012 -0.013 MProfitability -0.007 -0.007 -0.007 -0.007 -0.007
-1.5 -1.3 -1.5 -1.3 -1.5 -1.5 -1.5 1.5 -1.3 -1.5 -1.6
Leverageiτ−1 -0.487a -0.487a -0.492a -0.489a -0.485a
-74.9 -74.9 -75.0 -70.9 -72.7
Obs. 77265 77265 77265 76680 71804 77265 Obs. 61926 61926 61369 57118 61926
Overall R2 7.38% n.a.. 7.38% 9.24% 7.56% 8.04% Overall R2 7.14% 7.13% 7.59% 6.74% 7.31%
42

Table 7: Two-way sorts for pecking order testsThis table reports estimates for the difference between β coefficients in Eq. (1) for the highestand lowest information asymmetry deciles of firms based on either ASYiτ or MASYiτ , as well as thecoefficient γ for an additional interaction term of DEFiτ and either ASYiτ or MASYiτ (γ) in Eq. (1)(e.g., Eq. (3)) across subsets of firms sorted by various firm characteristics into terciles. a, b, cdenote statistical significance at 1%, 5%, and 10%, assessed with (heteroskedasticity) robust standarderrors adjusted for firm-level clustering; the resulting t-statistics are to the right of the correspondingestimate. ρSR and bOLS are the Spearman rank correlation and linear regression coefficient, respectively,between the corresponding variable and either the ASYiτ -based or the MASYiτ -based rankings.
Panel A: ASYiτ -based deciles Panel B: MASYiτ -based decileshigh-low β t-stat ρSR bOLS γ high-low β t-stat ρSR bOLS γ
low 0.458a 10.6 0.903a 0.037b 0.067a 0.350a 8.3 0.952a 0.030a 0.051a
Volatility med 0.257a 4.6 0.867a 0.026a 0.038a 0.199a 6.1 0.891a 0.017a 0.029a
high 0.313a 12.8 0.818a 0.021a 0.028a 0.234a 10.7 0.782a 0.017a 0.026a
low 0.278a 7.8 0.455 0.016c 0.022a 0.211a 5.6 0.745b 0.019b 0.044a
Turnover med 0.290a 8.2 0.685b 0.018b 0.043a 0.224a 7.2 0.564c 0.016b 0.029a
high 0.217a 5.0 0.697b 0.016b 0.030a 0.194a 7.4 0.903a 0.016a 0.026a
low 0.190a 8.0 0.770a 0.013a 0.011a 0.155a 7.6 0.539 0.010c 0.019a
Size med 0.626a 20.9 0.758a 0.045a 0.048a 0.384a 12.0 0.745b 0.032a 0.051a
high 0.360a 10.3 0.745b 0.025b 0.041a 0.226a 6.9 0.709b 0.020a 0.032a
low 0.273a 8.2 0.758b 0.018a 0.018a 0.236a 8.5 0.600c 0.016b 0.026a
Tangibility med 0.221a 5.5 0.418 0.012 0.021a 0.165a 5.5 0.539 0.014b 0.026a
high 0.288a 6.7 0.600c 0.018b 0.026a 0.152a 3.9 0.782a 0.018a 0.029a
low 0.569a 14.2 0.552c 0.038b 0.067a 0.449a 10.6 0.636b 0.040b 0.075a
Q ratio med 0.411a 9.4 0.382 0.020 0.049a 0.263a 5.0 0.527 0.020c 0.045a
high 0.175a 6.7 0.636b 0.011b 0.016a 0.142a 7.0 0.636b 0.010b 0.018a
zero 0.225a 7.5 0.527 0.013b 0.018a 0.205a 8.7 0.818a 0.019a 0.028a
low 0.409a 6.0 0.406 0.021c 0.036a 0.169a 4.4 0.648b 0.014c 0.027a
ITiτ med 0.422a 6.6 0.600c 0.033a 0.040a 0.373a 7.3 0.527 0.022b 0.035a
high 0.407a 8.2 0.830a 0.038a 0.033a 0.363a 7.6 0.782a 0.029a 0.039a
43
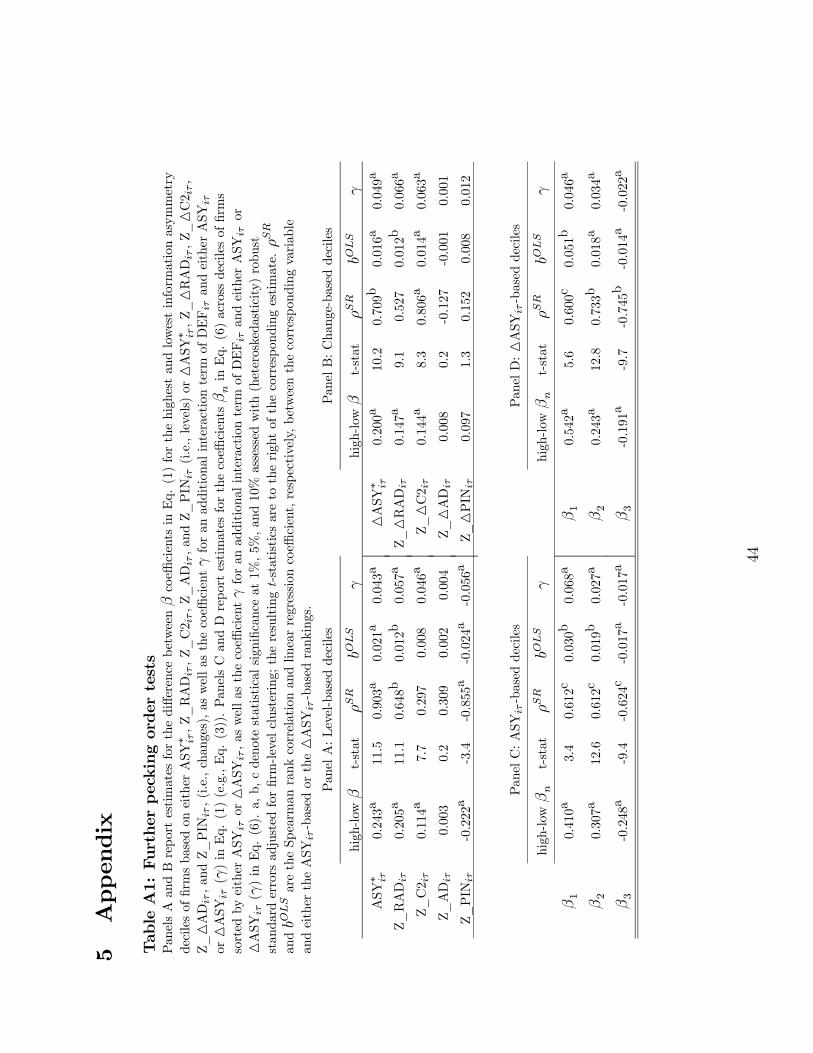
5Appendix
TableA1:Furtherpeckingordertests
PanelsAandBreportestimatesforthedifferencebetweenβcoefficientsinEq.(1)forthehighestandlowestinformationasymmetry
decilesoffirmsbasedoneitherASY∗ iτ,Z_RADiτ,Z_C2 iτ,Z_ADiτ,andZ_PINiτ(i.e.,levels)orMA
SY∗ iτ,Z_MR
ADiτ,Z_MC
2 iτ,
Z_MA
Diτ,andZ_PINiτ,(i.e.,changes),aswellasthecoefficientγforanadditionalinteractionterm
ofDEFiτandeitherASY
iτ
orMA
SYiτ(γ)inEq.(1)(e.g.,Eq.(3)).PanelsCandDreportestimatesforthecoefficientsβninEq.(6)acrossdecilesoffirms
sortedbyeitherASY
iτorMA
SYiτ,aswellasthecoefficientγforanadditionalinteractionterm
ofDEFiτandeitherASY
iτor
MASY
iτ(γ)inEq.(6).a,b,cdenotestatisticalsignificanceat1%,5%,and10%assessedwith(heteroskedasticity)robust
standarderrorsadjustedforfirm-levelclustering;theresultingt-statisticsaretotherightofthecorrespondingestimate.ρSR
andbOLSaretheSpearmanrankcorrelationandlinearregressioncoefficient,respectively,betweenthecorrespondingvariable
andeithertheASY
iτ-basedortheMA
SYiτ-basedrankings.
PanelA:Level-baseddeciles
PanelB:Change-baseddeciles
high-low
βt-stat
ρSR
bOLS
γhigh-low
βt-stat
ρSR
bOLS
γ
ASY∗ iτ
0.243a
11.5
0.903a
0.021a
0.043a
MASY∗ iτ
0.200a
10.2
0.709b
0.016a
0.049a
Z_RADiτ
0.205a
11.1
0.648b
0.012b
0.057a
Z_MR
ADiτ
0.147a
9.1
0.527
0.012b
0.066a
Z_C2 iτ
0.114a
7.7
0.297
0.008
0.046a
Z_MC
2 iτ
0.144a
8.3
0.806a
0.014a
0.063a
Z_ADiτ
0.003
0.2
0.309
0.002
0.004
Z_MA
Diτ
0.008
0.2
-0.127
-0.001
0.001
Z_PINiτ
-0.222a
-3.4
-0.855a
-0.024a
-0.056a
Z_MP
INiτ
0.097
1.3
0.152
0.008
0.012
PanelC:ASY
iτ-baseddeciles
PanelD:MA
SYiτ-baseddeciles
high-low
βn
t-stat
ρSR
bOLS
γhigh-low
βn
t-stat
ρSR
bOLS
γ
β1
0.410a
3.4
0.612c
0.030b
0.068a
β1
0.542a
5.6
0.600c
0.051b
0.046a
β2
0.307a
12.6
0.612c
0.019b
0.027a
β2
0.243a
12.8
0.733b
0.018a
0.034a
β3
-0.248a
-9.4
-0.624c
-0.017a
-0.017a
β3
-0.191a
-9.7
-0.745b
-0.014a
-0.022a
44

TableA2:Furtherconventionalleverageregressions
Thistablereportsestimatesforthecoefficientb 1from
firmfixed-effectsandTobitpanelregressionsofEq.(4)for
Leverage iτ=DMAiτ,wherewereplaceASY
iτwithASY∗ iτ,Z_RADiτ,Z_C2 iτ,Z_ADiτ,orZ_PINiτ(i.e.,levels),andfrom
fixed-effectsregressionsofEq.(5)forMLeverage iτ=MD
MAiτ,wherewereplaceMA
SYiτwithMA
SY∗ iτ,Z_MR
ADiτ,
Z_MC
2 iτ,Z_MA
Diτ,orZ_MP
INiτ(i.e.,changes).Thecolumnnumberinparenthesesreferstothecorrespondingregression
specificationinTable6.a,b,cdenotestatisticalsignificanceat1%,5%,and10%,assessedwith(heteroskedasticity)robust
standarderrorsadjustedforfirm-levelclustering;theresultingt-statisticsarereportedbelow
theestimatesforb 1.Each
estimateismultipliedby100.
OLS
Tobit
OLS
OLS
OLS
OLS
OLS
OLS
OLS
Eq.(4)
(1)
(2)
(4)
(5)
(6)
Eq.(5)
(7)
(9)
(10)
(11)
ASY∗ iτ
0.577a
0.965a
0.408a
1.341a
0.623a
MASY∗ iτ
0.220b
0.203b
0.179b
0.214b
7.6
9.7
7.7
7.8
8.2
2.4
2.2
2.0
2.3
Z_RADiτ
-0.305a
-0.912a
-0.255a
-0.412b
-0.298a
Z_MR
ADiτ
-0.071c
-0.049
-0.055
-0.083b
-6.2
-13.7
-5.3
-2.2
-6.0
-1.8
-1.3
-1.4
-2.1
Z_C2 iτ
0.201a
0.432a
0.232a
0.596b
0.210a
Z_MC
2 iτ
0.0003
0.073
-0.019
-0.0009
3.9
5.2
4.6
2.1
4.2
0.01
0.2
-0.5
-0.02
Z_ADiτ
0.025
0.145
0.192b
0.195c
0.031
Z_MA
Diτ
0.089
0.083
0.119
0.089
0.3
1.2
2.2
1.8
0.4
1.0
0.9
1.3
1.0
Z_PINiτ
0.480b
2.164a
0.306
0.367
0.470b
Z_MP
INiτ
0.178c
0.183c
0.187c
0.186c
2.3
8.8
1.5
0.8
2.3
1.8
1.8
1.9
1.9
45