doe bioenergy technologies office (beto) 2019 project peer ... · summary of “quantifying &...
TRANSCRIPT

ORNL is managed by UT-Battelle, LLC
for the US Department of Energy
DOE Bioenergy Technologies Office (BETO)
2019 Project Peer Review
4.2.2.40 Quantifying and Visualizing
Progress Toward Sustainability
March 5, 2019
Analysis and Sustainability Technology Area
Esther S. Parish
Oak Ridge National Laboratory

22 BETO A&S Project 4.2.2.40
Goal Statement
• Quantify the environmental & socioeconomic benefits, impacts and costs of cellulosic bioenergy options measured relative to stakeholder sustainability goals.
• Enable informed decisions and consistent, science-based communication via a web-based tool: the Bioenergy Sustainability Tradeoffs Assessment Resource (BioSTAR).
• Help DOE, industry and other researchers quantify, visualize and communicate potential effects of bioenergy deployment options.

33 BETO A&S Project 4.2.2.40
4.2.2.40, Quantifying & Visualizing Progress Toward Sustainability
Timeline
• Start date: October 1, 2018
• End date: September 30, 2021
• Project is 15% complete
This is a new 3-year cycle of “Bioenergy
Sustainability: How to Define & Measure It”.
Total
Costs
Pre-
FY17
FY 17
Costs
FY 18
Costs
Total
Planned
Funding
(FY19-
Project End Date)
DO
E F
un
de
d
$7
00
,00
0 t
o
$750,0
00/y
ear
$8
00
,00
0
$7
00
,00
0
$700,000
per year
Barriers addressed
• Quantification of Economic, Environmental,
and Other Benefits & Costs (At-E)
• Science-Based Methods for Improving
Sustainability (At-F)
Objective
Propel the US bioenergy industry toward
implementation of systems that maximize
benefits while minimizing negative impacts.
End of Project Goal
Provide science-based data and web-based
analytical tools (e.g., BioSTAR*) to holistically
analyze tradeoffs of US biomass production
options by integrating environmental and
socioeconomic indicators of sustainability
tailored to local conditions and stakeholder
priorities.
*BioSTAR = Bioenergy Sustainability Tradeoffs Assessment Resource
Collaborators include researchers at the USDA Forest Service, Antares, International Energy Agency (IEA), UT, Penn State, ANL, INL & more

44 BETO A&S Project 4.2.2.40
1 - Project Overview
Understanding potential trade-offs among environmental and socioeconomic indicators can help government & industry maximize potential benefits for local communities.
ORNL's research agenda includes
Defining environmental & socioeconomic benefits and costs of bioenergy systems
Quantifying opportunities & tradeoffs associated with bioenergy systems in specific geographic contexts
Engaging with a range of stakeholders to better understand the challenges & paths forward for sustainable bioenergy production
Communicating case study results & generalizing lessons learned for improved practices
Key challenges New methods are needed to accurately represent complex tradeoffs
Indicator data are collected at different spatial & temporal scales
Sustainability Indicators:
• Environmental indicators
in McBride et al. 2011
• Socioeconomic indicators
in Dale et al. 2013
35 total in 12 categories

55 BETO A&S Project 4.2.2.40
Sustainability Assessment Approach
Source: Dale VH, Kline KL, Parish ES, Inwood SE. Assessing Progress toward Landscape Sustainability. In Review.
1 - Project Overview (cont’d)

66 BETO A&S Project 4.2.2.40
Integrated assessment
of sustainability using
up to 35 indicators
Aggregate indicators within a
multi-attribute decision support
system (MADSS) framework
Assign ratings to each
environmental &
socioeconomic sustainability
indicator
Compare sustainability
outcomes of alternative
scenarios
1 - Project Overview (cont’d)
Parish et al. (2016)
Ecosphere 7(2):e01206.

77 BETO A&S Project 4.2.2.40
SUCCESSFUL PROGRESS RESULTS FROM:
• Bi-weekly ORNL team meetings
• Monthly spending reviews
• Monthly BETO A&S Lab calls
• Monthly Antares Group webinars
and in-person meetings
• Quarterly milestones for BETO
• Stage Gate & Merit reviews (2018)
• Preparations for a ‘Go/No Go’ milestone (June 2020)
2 – Approach: Project ManagementOur FY19-21 project is organized into two inter-related tasks:
--plus--
• Journal publications
• Conference presentations & invited talks
• Preparations for May 2019 IEA workshop
Task 1: Theory
Develop methods & frameworks to quantify and integrate environmental and
socioeconomic sustainability indicators for tradeoffs analyses
Task 2: Case-Study Application
Develop & test a multimetric visualization platform for informed decision-making

88 BETO A&S Project 4.2.2.40
Esther Parish (PI)Geographer & landscape ecologist with > 10 years bioenergy sustainability research experience; Recent PhD in Energy Science & Engineering
Rebecca EfroymsonRisk assessment expert with 30 years experience studying environmental effects of energy technologies
Keith Kline> 30 years of international experience with sustainable development projects involving renewable energy systems and community engagement
Mike HilliardExpert in logistics and supply chain management, modeling & simulation; Created Billion Ton 2016 report data visualizations
2 – Approach: Project Team
Subcontractors include 2 usability experts + 1 programmer Collaborators include researchers at the US Forest Service,
International Energy Agency (IEA), Antares Group, Penn State, University of Tennessee, ANL, INL, and more

99 BETO A&S Project 4.2.2.40
2 – Approach: Advance Sustainability Science
How will prioritization of indicators by different stakeholders affect sustainability outcomes?
How can combinations of indicators be used to maximize benefits from landscape design alternatives?
How should we set targets for indicators?
How can we integrate and visualize indicator data that have been collected across many spatial & temporal scales?

1010 BETO A&S Project 4.2.2.40
2 – Approach: Share Research through BioSTAR

1111 BETO A&S Project 4.2.2.40
3 – Technical Accomplishments/ Progress/Results
Develop sustainability
science theories
Test theories through case
study application
Share lessons learned via
BioSTAR for improved practices
(1) East TN switchgrass
(2) Southeastern U.S. wood pellets (10 new pubs) (3) Iowa stover
& switchgrass (in progress)

1212 BETO A&S Project 4.2.2.40
Are species affected by wood pellet production?
Overlapping bioenergy wood pellet
industry & GT priority conservation areas
Gopher tortoise (GT) is a keystone species in SE US pine forests
ixwirx.wordpress.com
Documented wood pellet supply chain steps & intersections with GT life history
Identified practices that will protect GT
Assessed Savannah fuelshed thinning effects on several species distributions using Bio-EST model
3 – Technical Accomplishments (cont’d)

1313 BETO A&S Project 4.2.2.40
Case Study of 2 Wood Pellet Fuelsheds3 – Technical Accomplishments (cont’d)
Savannah Fuelshed
Chesapeake Fuelshed

1414 BETO A&S Project 4.2.2.40
Iowa Landscape Design Case Study
Cellulosic ethanol from:• Corn stover• Switchgrass
3 – Technical Accomplishments/Progress (cont’d)
1515 BETO A&S Project 4.2.2.40
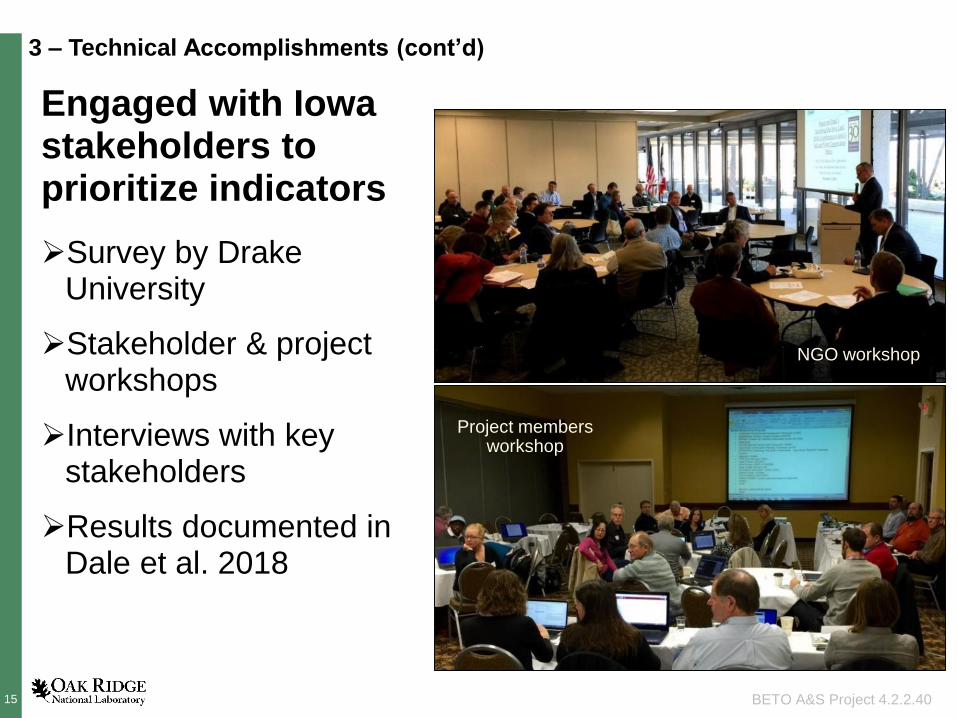
Engaged with Iowa stakeholders to prioritize indicators
Survey by Drake University
Stakeholder & project workshops
Interviews with key stakeholders
Results documented in Dale et al. 2018
Project membersworkshop
NGO workshop
3 – Technical Accomplishments (cont’d)

1616 BETO A&S Project 4.2.2.40
ORNL is working with Antares project consortium to define scenarios and indicator baselines & targets needed to quantify sustainability tradeoffs
Sustainability Goals Key
Stakeholder(s)
Related
Indicator
Categories
Source(s) of
Information
Produce cellulosic
feedstock supply for
commercial-scale
biofuels production
Biorefinery
Operator,
Farmers
Productivity,
Profit, Soil
quality
AgSolver/EFC,
Purdue, Penn State
PIHM-Cycles
modeling, INL BLM,
ORNL IBSAL
Reduce nitrate and
phosphorus runoff from
nonpoint sources to meet
Iowa Nutrient Reduction
Strategy goals
State of Iowa Water quality
(and quantity)
USDA ACPF, ANL
SWAT modeling,
Penn State PIHM-
Cycles modeling
Improve pheasant
populations for
recreational hunting
USDA CRP,
Pheasants
Forever
Biodiversity USDA NRCS, ORNL
Bio-EST modeling
and optimization
3 – Technical Accomplishments/Progress (cont’d)
Linked Iowa sustainability indicators & goals

1717 BETO A&S Project 4.2.2.40
BioSTAR tool designed to compare feedstock sustainability
3 – Technical Accomplishments/Progress (cont’d)

1818 BETO A&S Project 4.2.2.40
BioSTAR tool designed to make indicator data transparent
3 – Technical Accomplishments/Progress (cont’d)

1919 BETO A&S Project 4.2.2.40
4 – Relevance• Advance sustainability science needed to analyze environmental &
socioeconomic tradeoffs of cellulosic bioenergy options• Web-based BioSTAR tool will enable users to integrate indicators of
sustainability tailored to local conditions + stakeholder goals/priorities• Sustainability quantification & visualization will help government &
industry implement bioenergy systems that maximize potential benefits
Rural Jobs
Farmer Profits
Soil Quality
Water Quality
Biodiversity
Carbon Emissions
Energy Security
Rural Jobs
Farmer Profits
Soil Quality
Water Quality
Biodiversity
Reduced Carbon
Emissions
Energy Security
PROJECT BENEFITS

2020 BETO A&S Project 4.2.2.40
Feedback from March 2018 Stage Gate ReviewIowa Landscape Design Project
“The process for prioritizing and choosing relevant sustainability indicatorsis outstanding. The journal article published by Dale et al* (provided to us duringthe review meeting) on this process and its outcomes is an important contributionto the literature on sustainability metrics. The team has gone to extraordinary andyet efficient means to engage a large number of organizations and stakeholderswho would be impacted by the development of sustainable bioenergy and productsupply chains in the targeted region of Iowa by taking advantage of multiplevenues during 2015 and 2016. The analysis of the stakeholder feedback isintelligently and cogently presented, and is a model for others who wish toadopt a valid stakeholder engagement process.”
4 – Relevance (cont’d)
Dale VH, Kline KL, Richard TL,
Karlen DL, Belden WW (2018)
Bridging biofuel sustainability
indicators and ecosystem services
through stakeholder engagement.
Biomass & Bioenergy 114:143-156.
*

2121 BETO A&S Project 4.2.2.40
4 – Relevance (cont’d) BioSTAR Inputs (2017)

2222 BETO A&S Project 4.2.2.40
4 – Relevance (cont’d)
BioSTAR
BioSTAR Inputs (Recent & Planned)

2323 BETO A&S Project 4.2.2.40
5 – Future Work
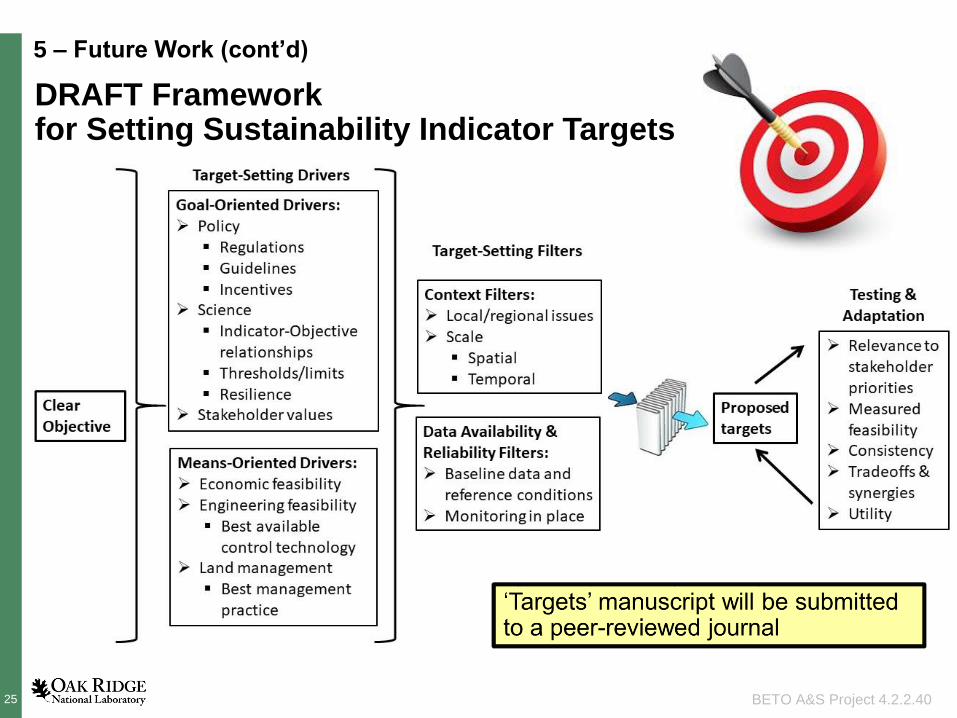
Due Date Milestone Expected Outcomes
March 2019 Develop draft
theoretical
framework for
setting targets
• Targets established for Iowa case study
environmental & socioeconomic indicators
• Publication(s)
• Methodology incorporated into BioSTAR
June 2019 IEA collaboration
session with
BioSTAR prototype
• Wood pellet case study indicators vetted &
prioritized by many stakeholders
• Feedback used to refine & improve tool
Sept 2019 Pick set of
national-scale
datasets
• Incorporation of ‘default’ indicator datasets
within BioSTAR to assist with new project
evaluation
Dec 2019 Prioritization
capability
• Visualize sustainability outcomes based on
different stakeholder priorities
March 2020 Set Iowa
socioeconomic
targets
• Quantify changes in net jobs, household
income & social acceptability for alternative
landscape designs
June 2020 ‘Go’/ ‘No Go’ • BioSTAR allows users to explore their own
projects (+ the 3 case studies)

2424 BETO A&S Project 4.2.2.40
Project ‘Go’/‘No Go’ Milestone (June 2020)
Is it feasible for users to enter their own projects into BioSTAR?
Demonstrate two separate examples:1. User uploads indicator dataset2. Data gets processes3. Indicator results are visualized
graphically
Refine & improve BioSTARuser interface. Ensure
stakeholder access to tool
If successful If it doesn’t work
Meet with BETO to discuss options, including redirecting remaining $ to meet BETO
sustainability visualization & communication goals through
alternate approaches.
5 – Future Work (cont’d)
2525 BETO A&S Project 4.2.2.40
5 – Future Work (cont’d)
DRAFT Framework for Setting Sustainability Indicator Targets

2626 BETO A&S Project 4.2.2.40
Use Iowa Case Study to develop methods for quantifying & visualizing sustainability tradeoffs & synergies across a fuelshed
5 – Future Work (cont’d)

2727 BETO A&S Project 4.2.2.40
Potential Risk: Not getting enough indicator datasets of sufficient quantity/quality forconsistent visualization of progress toward sustainability for all 12 categories.
Abatement Strategy: If this happens, we will narrow our focus to a few keyindicators that have the best available data.
5 – Future Work (cont’d)
QUANTIFY & VISUALIZE A SET OF SUSTAINABILITY INDICATORS based on transparent national-scale spatiotemporal datasets loaded into BioSTAR
ORNL Bio-EST
WATERWater Analysis Tool
for Energy Resources

2828 BETO A&S Project 4.2.2.40
Summary of “Quantifying & Visualizing Progress Toward Sustainability” (Project 4.2.2.40)
Develop sustainability
science theories
Test theories through case
study application
Share lessons learned via
BioSTAR* for improved practices
GOAL: Provide DOE, industry and other researchers with toolsto holistically quantify benefits & costs and visualize tradeoffs ofcellulosic bioenergy options.
*BioSTAR = Bioenergy Sustainability Tradeoffs Assessment Resource
WHY? Maximize environmental & socioeconomic benefits for bioenergy stakeholders
ACCOMPLISHMENTS (since March 2017):
• 19 new publications + 7 manuscripts + many invited presentations
• Effective collaboration with researchers at the USDA Forest Service,
International Energy Agency (IEA), Antares Group, Penn State,
University of Tennessee, INL, ANL, and more
• BioSTAR wireframes built to showcase 3 case studies + user-added projects

2929 BETO A&S Project 4.2.2.40
Additional Information

3030 BETO A&S Project 4.2.2.40
Environmental sustainability indicators (19 in 6 categories)
Category Indicator Units
Soil quality Total organic carbon (TOC) Mg/ha
Total nitrogen (N) Mg/ha
Extractable phosphorus (P) Mg/ha
Bulk density g/cm3
Water
quality &
quantity
Nitrate concentration in
streams (and export)
concentration: mg/L;
export: kg/ha/yr
Total phosphorus (P)
concentration in streams
(and export)
concentration: mg/L;
export: kg/ha/yr
Suspended sediment
concentration in streams
(and export)
concentration: mg/L;
export: kg/ha/yr
Herbicide concentration in
streams (and export)
concentration: mg/L;
export: kg/ha/yr
Storm flow L/s
Minimum base flow L/s
Consumptive water use
(incorporates base flow)
feedstock production:
m3/ha/day;
biorefinery: m3/day
Category Indicator Units
Greenhouse
gases
CO2 equivalent emissions
(CO2 and N2O)
kgCeq/GJ
Biodiversity Presence of taxa of
special concern
Presence
Habitat area of taxa of
special concern
ha
Air quality Tropospheric ozone ppb
Carbon monoxide ppm
Total particulate matter
less than 2.5μm diameter
(PM2.5)
µg/m3
Total particulate matter
less than 10μm diameter
(PM10)
µg/m3
Productivity Aboveground net primary
productivity (ANPP) / Yield
gC/m2/year
McBride et al. (2011) Ecological Indicators 11:1277-1289

3131 BETO A&S Project 4.2.2.40
Socioeconomic sustainability indicators (16 in 6 categories)
Category Indicator Units
Social well-
being
Employment Number of full time equivalent
(FTE) jobs
Household
income
$ per day
Work days lost
due to injury
Average number of work days
lost per worker per year
Food security % change in food price volatility
Energy
security
Energy security
premium
Dollars /gallon biofuel
Fuel price
volatility
Standard deviation of monthly
percentage price changes over
one year
External
trade
Terms of trade Ratio (price of exports/price of
imports)
Trade volume Dollars (net exports or balance
of payments)
Profitability Return on
investment
(ROI)
Percent (net investment/ initial
investment)
Net present
value (NPV)2
Dollars (present value of benefits
- present value of costs)
Category Indicator Units
Resource
Conserv-
ation
Depletion of non-
renewable
energy resources
MT (amount of petroleum
extracted per year )
Fossil Energy
Return on
Investment (fossil
EROI)
MJ (ratio of amount of
fossil energy inputs to
amount of useful energy
outputt
Social
accept-
ability
Public opinion Percent favorable opinion
Transparency Percent of indicators for
which timely and relevant
performance data are
reported
Effective
stakeholder
participation
Number of documented
responses to stakeholder
concerns and
suggestions reported on
an annual basis
Risk of
catastrophe
Annual probability of
catastrophic event
Dale et al. (2013) Ecological Indicators 26:87-102

3232 BETO A&S Project 4.2.2.40
Dale et al. (2017) GCB Bioenergy, Dale et al.
(2017) Forest Ecology and Management, Parish
et al. (2017) Data in Brief, Parish et al. (2017)
World Biomass, Parish et al. (2017) WIRES
• Over half of US wood pellets ship to Europe
from Savannah, GA & Norfolk, VA
Wood Pellet Case Study: Background Information
Only a small
portion of SE
US timberland
removals are
used for
bioenergy
wood pellets
• Examined USDA Forest Inventory & Analysis
(FIA) data for changes from pellet production

3333 BETO A&S Project 4.2.2.40
Project Publications (since March 2017)Baskaran, Latha Malar (2017) Effects of Switchgrass Related Land-Use Changes on Aquatic Macroinvertebrates. PhD
dissertation, University of Tennessee. https://trace.tennessee.edu/utk_graddiss/4384
Dale VH, HI Jager HI, AK Wolfe, RA Efroymson (2018) Risk and resilience in an uncertain world. Frontiers in Ecology and the
Environment 16(1):3. http://onlinelibrary.wiley.com/doi/10.1002/fee.1759/full
Dale VH, KL Kline (2017) Interactive Posters: A valuable means for enhancing communication and learning about productive
paths toward sustainable bioenergy. Biofuels, Bioproducts and Biorefining 11:243–246.
Dale VH, KL Kline, ES Parish, AL Cowie, R Emory, RW Malmsheimer, R Slade, CT Smith, TB Wigley, NS Bentsen, G Berndes,
P Bernier, M Brandão, H Chum, R Diaz-Chavez, G Egnell, L Gustavsson, J Schweinle, I Stupak, P Trianosky, A Walter,
C Whittaker, M Brown, G Chescheir, I Dimitriou, C Donnison, A Goss Eng, KP Hoyt, JC Jenkins, K Johnson, CA
Levesque, V Lockhart, MC Negri, JE Nettles, M Wellisch (2017) Status and prospects for renewable energy using wood
pellets from the southeastern United States. GCB Bioenergy 9(8):1296-1305.
Dale VH, Kline KL, Richard TL, Karlen DL, Belden WW (2018) Bridging biofuel sustainability indicators and ecosystem
services through stakeholder engagement. In a Special Issue on “Biofuels and Ecosystem Services” Biomass &
Bioenergy 114:143-156.
Dale VH, Parish ES, Kline KL, Tobin E (2017) How is wood-based pellet production affecting forest conditions in the
southeastern United States? Forest Ecology and Management 396:143-149.
Dimitriou I., Berndes, G., Englund, O., Brown, M., Busch, G., Dale, V., Devlin, G., English, B., Goss, K., Jackson, S., Kline, K.
L., McDonnell, K., McGrath, J., Mola-Yudego, B., Murphy, F., Negri, MC., Parish, E. S., Ssegane, H., and Tyler, D.
(2018) Lignocellulosic Crops in Agricultural Landscapes: Production systems for biomass and other environmental
benefits – examples, incentives, and barriers. IEA Bioenergy Task 43 Report TR2018-05. Available online at
http://task43.ieabioenergy.com/publications/lignocellulosic-crops-in-agricultural-landscapes/
Duden AS, PA Verweij, HM Junginger, RC Abt, JD Henderson, VH Dale, KL Kline, D Karssenberg, JA Verstegen, APC Faaij, F
van der Hilst (2017) Modelling the impacts of wood pellet demand on forest dynamics in southeastern United States.
Biofuels, Bioproducts and Biorefining 11(5):1007-1029.

3434 BETO A&S Project 4.2.2.40
Project Publications (cont’d)Eichler Inwood SE, López-Ridaura S, Kline KL, Gérard B, Monsalue AG, Govaerts B, Dale VH. (2018) Assessing sustainability
in agricultural landscapes: a review of approaches. Environmental Reviews 26(3):299-315.
Fritsche UR, G Berndes, AL Cowie, VH Dale, KL Kline, FX Johnson, H Langeveld, N Sharma, H Watson, J Woods (2017)
Energy and land use. Working Paper for the UNCCD Global Land Outlook. Prepared for UNCCD and IRENA.
Kanter DR, Musumba M, Wood SLR, Palm C, Antle J, Balvanera P, Dale VH, Havlik P, Kline KL, Scholes RJ, Thornton P,
Tittonell P, Andelman S. 2018. Evaluating agricultural trade-offs in the age of sustainable development. Agricultural
Systems 163:73-88.
Kline KL, Parish ES and Dale VH (2018) The importance of reference conditions in assessing effects of bioenergy wood pellets
produced in the southeastern United States. World Biomass 2018/2019 Edition, Pages 82-86. DCM Productions, United
Kingdom.
Liu J, Dou Y, Batistella M, Challies E, Connor T, Friis C, Huettmann F, Millington J, Parish E. et al. (2018) Spillover systems in
a telecoupled Anthropocene: Typology, methods, and governance for global sustainability. Current Opinion in
Environmental Sustainability 33:58–69.
Parish, Esther Sullivan (2017) Investigating the Sustainability of Southeastern United States’ Wood Pellet Production for Use in
European Biopower Facilities. PhD Diss., University of Tennessee. https://trace.tennessee.edu/utk_graddiss/4832/
Parish ES, Dale VH, Kline KL (2017) Has pellet production affected SE US forests? World Biomass 2016/2017 Edition, Pages
38-42. DCM Productions, United Kingdom.
Parish ES, Dale VH, Kline KL Abt RC (2017) Reference scenarios for evaluating wood pellet production in the Southeastern
United States. WIREs Energy and Environment 6:e259.
Parish, ES, Dale VH, Tobin E, Kline KL (2017) Dataset of timberland variables used to assess forest conditions in two
Southeastern United States’ fuelsheds. Data in Brief 13:278–290.

3535 BETO A&S Project 4.2.2.40
Project Publications (cont’d)Parish ES, Herzberger A, Phifer C, Dale VH (2018) Telecoupled transatlantic wood pellet trade provides benefits in both the
sending and receiving systems. Ecology and Society 23(1):28. Synthesis article for a special issue on “Telecoupling: A
New Frontier for Global Sustainability.”
Souza G, Ballester MVR, Cruz CHB, Chum H, Dale B, Dale VH, Fernandes E, Foust T, Karp A, Lynd L, Maciel R, Milanez A,
Nigro F, Osseweijer P, Verdade L, Victoria R, Van Der Wielen L (2017) The role of bioenergy in a climate-changing
world. Environmental Development 23:57-64.

3636 BETO A&S Project 4.2.2.40
Current Manuscripts
Baskaran LM, Parish ES, Dale VH (In Revision) How will SE US wood pellet production affect the gopher tortoise (Gopherus
polyphemus)?
Dale VH, Kline KL, Parish ES, Eichler SE (Submitted) Engaging Stakeholders to Assess Landscape Sustainability. Landscape
Ecology
Hodges DG, Chapagain B, Watcharaanantapong P, Poudyal NC, Kline KL, Dale VH (In Review) Dataset of Forest Landowner
Survey to Assess Interest in Supplying Woody Biomass in Two Southeastern United States Fuelsheds. Data in Brief
Hodges DG, Chapagain B, Watcharaanantapong P, Poudyal NC, Kline KL, Dale VH (In Review) Opportunities and attitudes of
private forest landowners in supplying woody biomass for renewable energy. Renewable and Sustainable Energy
Reviews
Nair S, Parish ES, Baskaran LM (In Preparation) Analysis of hydrologic impacts from forest thinning for bioenergy wood pellet
production.
Parish ES, Brandeis C, Turner J, Kline KL (In Preparation) What is the sensitivity of environmental indicators derived from
USDA Forest Inventory and Analysis Data to bioenergy fuelshed boundaries?
Parish ES, Baskaran LM, Brandeis C, Dale VH, Jager H, Kline KL, Langholtz LM, Nair S, Turner J (In Preparation)
Sustainability analysis of two Southeastern US bioenergy wood pellet fuelsheds.

3737 BETO A&S Project 4.2.2.40
Related Team Publications (since March 2017)
Davis M, Alves BJR, Karlen D, Kline KL, Galdos M, Abulebdeh D (2018) Review of Soil Organic Carbon Measurement
Protocols: A U.S. and Brazil Comparison and Recommendation. Sustainability 10(1)53.
Efroymson RA, VH Dale, MH Langholtz (2017) Socioeconomic indicators for sustainable design and commercial development
of algal biofuel systems. GCB Bioenergy 9:1005-1023.
Parish ES, Pracheil BM, McManamay RA, Curd SL, DeRolph C, Smith B (2019) Review of environmental metrics used across
multiple sectors and geographies to evaluate the effects of hydropower development. Applied Energy
https://doi.org/10.1016/j.apenergy.2019.01.038
Sylvester L, Omitaomu OA, Parish ES, Bhaduri BL (2019) Evaluating the Implications of Climate Projections on Heat
Hardiness Zones for Green Infrastructure Planning. Current Environmental Engineering. Available online at
http://www.eurekaselect.com/167284/article
Wang G, Jager HI, Baskaran LM, Brandt CC (2018) Hydrologic and water quality responses to biomass production in the
Tennessee river basin. GCB Bioenergy 10(11)877-893.

3838 BETO A&S Project 4.2.2.40
Feedback from March 2017 ‘Go/No Go’ BioSTAR Workshop
BioSTAR is a “Very useful and one-of-a-kind tool for evaluating sustainability
for different bioenergy land use options.”
We agree that BioSTAR is unique. We do not know of any other decision tool
that tries to address all three pillars of sustainability for bioenergy systems.
“It is challenging to communicate biomass sustainability to diverse stakeholder
groups.”
True! We think that BioSTAR users may include researchers from government &
academia, industry, NGO’s, and potential feedstock producers. It is challenging
to build a tool that can assist all of these stakeholders with decision-making.
“Taking a lot of complex data on a large issue-sustainability-is a huge undertaking.
Take a small slice of this challenge and focus on it to be successful.”
We started with 3 case study applications before beginning to think about ways
for users to analyze their own projects.
“Incorporate data from BT16 Vol 2 into the tool.” We are currently working on this.
“Include options to explore all data by feedstock type, by sustainability indicator data
available, etc.”
BioSTAR’s “Indicator Data Explorer” and “Feedstock Comparison” modules are
under development to address these suggestions.

3939 BETO A&S Project 4.2.2.40
Responses to 2017 DOE Peer Review Comments“The true value of this project is to get people thinking about a broad umbrella of indicators especially going beyond the traditional environmental indicators and including economic and social impacts as well. It will be important as the project moves forward to enable the use of best practices by providing examples of how these various metrics can be assessed, integrated, and effectively visualized.”
Our web-based BioSTAR tool is being built to demonstrate 3 case studies that use a combination of environmental & socioeconomic indicators to assess and visualize sustainability relative to stakeholder priorities. Sharing lessons learned will promote good practices.
“It would be useful to consider how the project could support making data available for the analysis of future biofuel systems and/or how could data be brought together from disparate sources to support a comprehensive sustainability assessment of biofuel systems.”
In addition to sharing ORNL’s case study results, we are beginning to pull together national-scale datasets that can provide baseline values for our starting checklist of environmental & socioeconomic indicators of bioenergy sustainability (or perhaps a subset of key indicators).These datasets and our sustainability assessment methodology will be made available through the web-based BioSTAR tool so that they can be used to comprehensively evaluate the benefits & costs of new cellulosic biomass systems.

4040 BETO A&S Project 4.2.2.40
Comments from 2018 Project AOP Merit Review
“This proposal is to develop an online tool and support database to quantify and visualize the potential sustainability costs and benefits of using different cellulosic bioenergy feedstocks in different geographic contexts. It is very innovative, and if successful, could yield strong rewards to local and regional decision makers and planners.”
“An important aspect of the work is making existing and forthcoming BETO research more understandable and accessible.”
“Overall, this project's objective - to inform decisions and better implement bioenergy systems - is admirable and supports BETO's mission.”