documentation of the dutch refinery model; serum - ecn · documentation of the dutch refinery model...
TRANSCRIPT
Documentation of the Dutch refinery model
SERUM
G.J. Stienstra
ECN-E--06-029 November 2006
2 ECN-E--06-029
Acknowledgement This report was written as part of the project ‘NEV-instrumentarium’ (project number 7.7753) for the Ministry of Economic Affairs of The Netherlands. Abstract The refinery model SERUM is part of a wider array of models that are used for modelling the Dutch National Energy Outlook. This combination of models and their common database is ap-plied for projections and scenarios for future energy use and emissions. The Dutch Refining industry is modelled with an LP model for the techno-economic analysis of refining operations. Its applications lie in scenarios for future energy use, and assessing the ef-fects of new regulatory standards for fuel emissions or new refining technologies. The effects on refining energy requirements and emissions are the main goals in these analyses. This report gives a model overview of SERUM, and its interactions with other models as well as it provides some detailed information on the architecture of the refinery model.
ECN-E--06-029 3
Contents
List of figures 4 1. Introduction 5
1.1 Purpose of this Report 5 1.2 Model Summary 5
1.2.1 SERUM GAMS model 5 1.2.2 The operational MS Excel Shell (SERUM.XLS) 6
2. Model Purpose 7 2.1 Model objectives 7 2.2 Relationship to other Models 7
3. Model Overview 10 3.1 Existing documentation on SERUM 10 3.2 Theoretical approach 10 3.3 Inputs and outputs of SERUM GAMS model 10 3.4 Overview of model operations 11 3.5 Fundamental Assumptions 12
4. Model Structure 14 4.1 Introduction 14 4.2 Flow of Data 14 4.3 GAMS Model 15 4.4 Excel shell 15
4.4.1 Additional calculations 16 References 18 Appendix A SERUM GAMS model 19
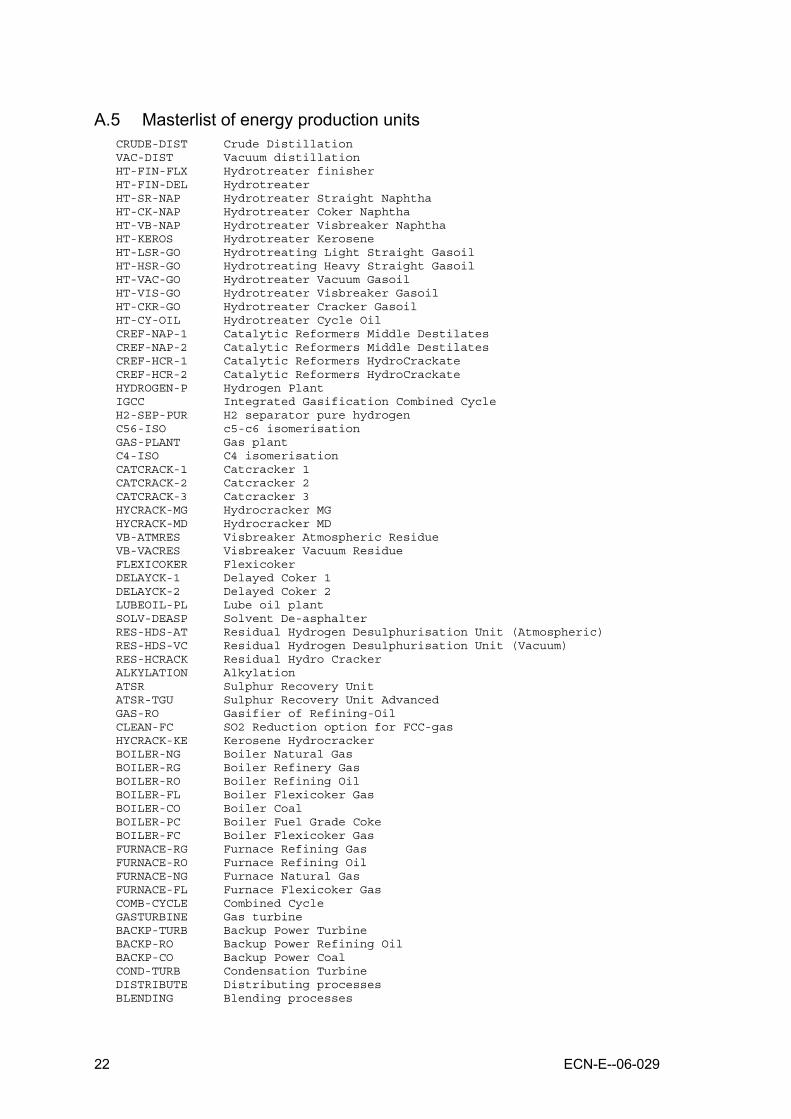
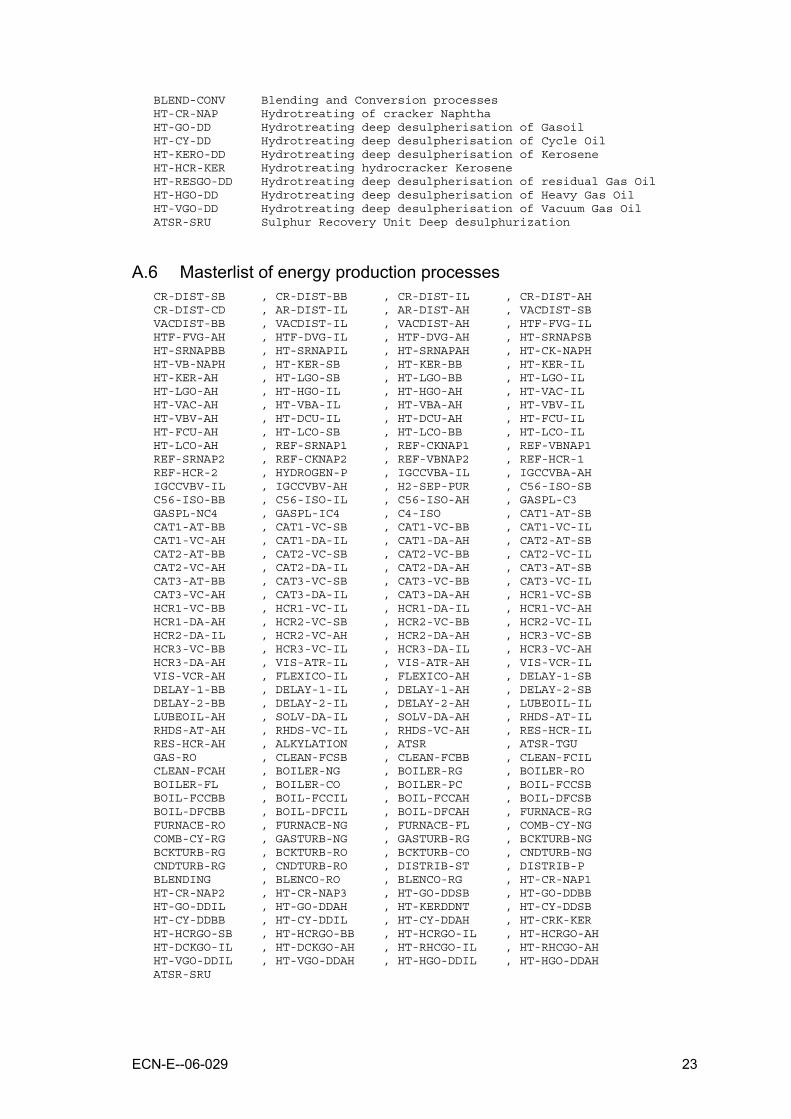
A.1 Final products 19 A.2 Intermediate products 19 A.3 Masterlist of the energy producer labels 21 A.4 Masterlist of energy production plants 21 A.5 Masterlist of energy production units 22 A.6 Masterlist of energy production processes 23

4 ECN-E--06-029
List of figures
Figure 2.1 Overview of the Dutch National Energy Outlook Modelling System (NEOMS) 8 Figure 3.1 Typical Inputs and Outputs of the SERUM-GAMS model for scenario studies 11 Figure 3.2 Operational structure of the SERUM model 12 Figure 4.1 Flow of data in individual files for the SERUM model 14

ECN-E--06-029 5
1. Introduction
1.1 Purpose of this Report The purpose of this report is to define the objectives of the refinery model SERUM, describe its basic approach, and provide some detailed information on its architecture. This report is in-tended as a reference document for model analysts and users. First this report describes the model generally. In chapter two the purpose of the model and its relationships with other models is described. Chapter 3 presents a model overview and discusses the basic assumptions. Finally in Chapter 4 the model structure is presented in detail.
1.2 Model Summary SERUM stands for ‘Static ESC Refinery Utility Model1’, and it is a techno-economical model of the petroleum refineries in the Netherlands. The model is able to calculate the effects of vari-ous changes in the refineries environment: e.g. technical changes like different crude types, feedstocks, and available technology, as well as more economically and policy driven changes such as: product specifications, product demand, and energy use and emission standards. The model can be divided into three parts: an operational shell in Microsoft Excel, a linear op-timalisation model written in GAMS, and the communication with the other databases of the scenario studies. In this report, the term ‘SERUM-model’ applies to the elements combined. The SERUM model is one of several models used for Dutch National Energy Outlook Model-ling System. This collection of models is called the NEOMS2, and has a combined database for model inputs and results. Historically the SERUM model was developed to address policy issues related to the introduc-tion of lead-free gasoline in the early 1980s. The Dutch Ministry of Economic affairs was inter-ested in an independent source of quantitative information on energy related issues concerning refining technology and operation. In 1986 Lead-free gasoline was introduced in the Nether-lands ahead of EU-policy.
1.2.1 SERUM GAMS model The SERUM GAMS model is an LP model that forms the operational backbone of the SERUM model. LP stands for linear programming, a mathematical technique for optimization for finding the best solution (in an economic sense) to complex problems involving the allocation of scarce resources across many competing activities. In refining analysis, the scarce resources are the production facilities of the refineries of interest and the competing activities are the various processing operations in the refineries.
1 ESC stands for Energy Study Centre, and is the former name of the organization that is now one unit within the
Energy research Centre of the Netherlands, and continued its work under the name ‘Policy Studies’. 2 NEOMS stands for National Energy Outlook Modeling System (Dutch Acronym: NEV-RS).
6 ECN-E--06-029
The SERUM GAMS model describes the conversion of three crudes (Brent Blend, Iranian Light and Arabian Heavy) into oil products. In three modules the model distinguishes three separate refinery functions, viz. refining, blending and heat and power generation (utility function). The refining module specifies the processing of crudes in different processing units such as distilla-tion, catalytic cracking and hydrocracking, hydrotreating and other refinery processes. For each process data is available on cost, product yield, energy requirements, type of fuel used, emis-sions and qualities of the different output streams. Equations in the blending module represent the blending of intermediate product streams into oil products, conform the product specifications identified in the model. Finally the utility module specifies different types of furnaces, boilers, gas turbines and ad-vanced fuel conversion technology and the fuels used to generate the required energy for refin-ing (i.e. steam, heat and electricity). This module includes data on generation costs, energy con-version efficiencies and SO2 and NOx emissions.
1.2.2 The operational MS Excel Shell (SERUM.XLS) SERUM.XLS is a MS Excel Workbook that consists of several worksheets containing the basis assumptions, constraints and input data. It automates the generation of input-files for the SERUM GAMS model, and provides a user interface for the operation of the SERUM model. The Excel Shell also contains several calculation steps that are an addition to those within the GAMS-model; e.g. for the overall CO2 balance. Also several calculation steps are available to convert results in a format that is consistent with the other NEOMS models. SERUM.XLS is also the operational user interface of the model. The following steps can be discerned when executing the model. The input data is gathered for a specific run using Visual Basic routines; data-files are pre-processed; and SERUM GAMS op-timalisation is started; results are imported in excel-worksheets, and additional calculations are made. In a separate operational procedure results can be transferred to the NEOMS database. A more detailed description of the model operations can be found in Chapter 3.
ECN-E--06-029 7
2. Model Purpose
2.1 Model objectives The primary objective of SERUM is to calculate energy use of the Dutch refineries. Secondary to calculate the CO2 and SO2 emissions related to refining. Additionally, the SERUM model can be used specifically to estimate energy saving in refineries3, and for parametric analysis of the Dutch refinery sector. Model results are typically used in National and European scenario studies such as the ‘Referen-tieraming4’ (Van Dril, 2005) or ‘WLO - Four European energy scenarios5’, as well as for analy-sis of the allocation of the CO2 emission rights for the refining sector.
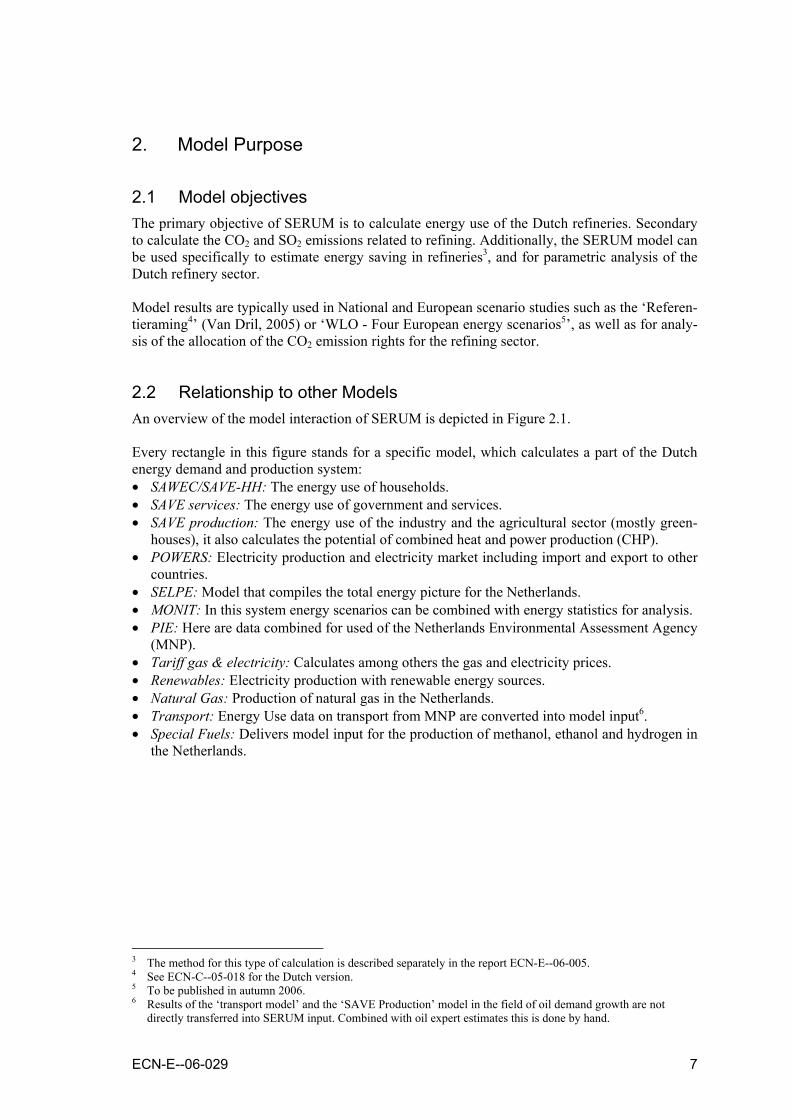
2.2 Relationship to other Models An overview of the model interaction of SERUM is depicted in Figure 2.1. Every rectangle in this figure stands for a specific model, which calculates a part of the Dutch energy demand and production system: • SAWEC/SAVE-HH: The energy use of households. • SAVE services: The energy use of government and services. • SAVE production: The energy use of the industry and the agricultural sector (mostly green-
houses), it also calculates the potential of combined heat and power production (CHP). • POWERS: Electricity production and electricity market including import and export to other
countries. • SELPE: Model that compiles the total energy picture for the Netherlands. • MONIT: In this system energy scenarios can be combined with energy statistics for analysis. • PIE: Here are data combined for used of the Netherlands Environmental Assessment Agency
(MNP). • Tariff gas & electricity: Calculates among others the gas and electricity prices. • Renewables: Electricity production with renewable energy sources. • Natural Gas: Production of natural gas in the Netherlands. • Transport: Energy Use data on transport from MNP are converted into model input6. • Special Fuels: Delivers model input for the production of methanol, ethanol and hydrogen in
the Netherlands.
3 The method for this type of calculation is described separately in the report ECN-E--06-005. 4 See ECN-C--05-018 for the Dutch version. 5 To be published in autumn 2006. 6 Results of the ‘transport model’ and the ‘SAVE Production’ model in the field of oil demand growth are not
directly transferred into SERUM input. Combined with oil expert estimates this is done by hand.
8 ECN-E--06-029
TransportTransport
RenewablesRenewables SERUMRefineriesSERUM
Refineries
SELPESELPE
SAVE-ProductionCHP -Industry-AgroSAVE-Production
CHP -Industry-Agro
SAVE-ServicesSAVE-ServicesSAWEC/SAVE-HHSAWEC/
SAVE-HH
Tariffs gas & electricity
Tariffs gas & electricity
PowersPowers
Monit/PIEconversionMonit/PIEconversion
Output TablesOutput TablesMONITMONITMNP/PIEMNP/PIE
Natural GasNatural Gas
SpecialFuelSpecialFuel
IEAIEA Protocol savingsProtocol savings
Figure 2.1 Overview of the Dutch National Energy Outlook Modelling System (NEOMS)
NEOMS The model is generally used in combination with other sector-models in the NEOMS7. For sce-nario modelling of the Dutch national energy use and the related emissions a number of techno-economic models are used. Their results are combined for further analysis, or can be used as in-put for other models. NEOMS has a central database which handles the storage and distributing of the data between the models. An overview of the NEOMS models and their interaction is given in Figure 2.1. If al sub-models are ready, the SELPE model starts from this database and compiles the total Dutch energy picture. Input data such as electricity, gas and oil prices are obtained from the database before each run, and model results are stored in the NEOMS database. Database tools distribute the results from specific SERUM runs to the NEOMS database. These results can be used as inputs to other models: e.g. the refinery gas that is delivered to the chemical industries in the SAVE industry model; and the MONIT model that calculates amongst others the sector specific energy use and saving. These interactions take place through the SELPE model as indicated in Figure 2.1.
7 NEOMS stands for National Energy Outlook Modeling System.
ECN-E--06-029 9
Energy Prices An iterative calculation with POWERS, the tariff model and the SAVE models results in the electricity and gas prices used in the NEOMS models. Although SERUM is part of this loop, the influence of the SERUM model on the updated final electricity price is small within this loop. This is to be expected since in practise the electricity price has limited influence on refining op-erations. Other energy intensive industries have a much stronger dependency on electricity and gas prices. Moreover the allocation of CHP in the refineries is modelled in the ‘SAVE produc-tion’ model (see next paragraph). Therefore this model is most important in the loop for gas and electricity prices. SAVE Production SERUM also interacts directly with an other model within the NEOMS, the so-called SAVE-Production8 model, which models the development of energy use and generation in the Dutch manufacturing industry as well as that of Dutch agriculture. In particular the interaction with the SAVE production model is present for the Combined generation of Heat and Power (CHP). The steam demand of the refinery model is used in the SAVE production model to allocate the co-generation capacity in the whole Dutch power sector, including those in the refineries. This in-teraction for CHP calculations is illustrated by the dotted line in Figure 2.1.
8 SAVE stands for Simulation and Analysis of Virtual energy use in Energy scenarios.
10 ECN-E--06-029
3. Model Overview
3.1 Existing documentation on SERUM A clear description of the SERUM GAMS model, its operations and a sensitivity analysis for scenario calculations is given in Kok (1996). An overview of the SERUM GAMS model, its as-sumptions and the basic process data can be found in Van Oostvoorn (1989). The background data for the GAMS model is collected in Technika (1985). The latter dataset was externally au-dited by the Dutch refining industry in 1988. Recent modifications are documented in internal reports and documentation. SERUM interacts with several other models in the Dutch National Energy Outlook Modelling System. An overview of this systems can be found in Volkers (2006) (in Dutch). The interaction of SERUM with other SAVE models is described in more detail in Daniëls (2006).
3.2 Theoretical approach The functional goal of the GAMS model is to minimise the total cost of the allocated refinery processes needed to produce certain amounts of several oil products at a specified quality, to-gether with an elaborate set of constraints. The constraints for modelling energy use can be di-vided in the following groups: • Capacity constraints on Process, Unit, and Plant Level • Energy balance constraints • Volume restrictions on intermediate streams • Quality constraints for oil products and intermediate streams or feedstocks • Other oil blending restrictions • Environmental constraints (e.g. SO2) • Crude oil and feedstock quality • Energy Efficiency.
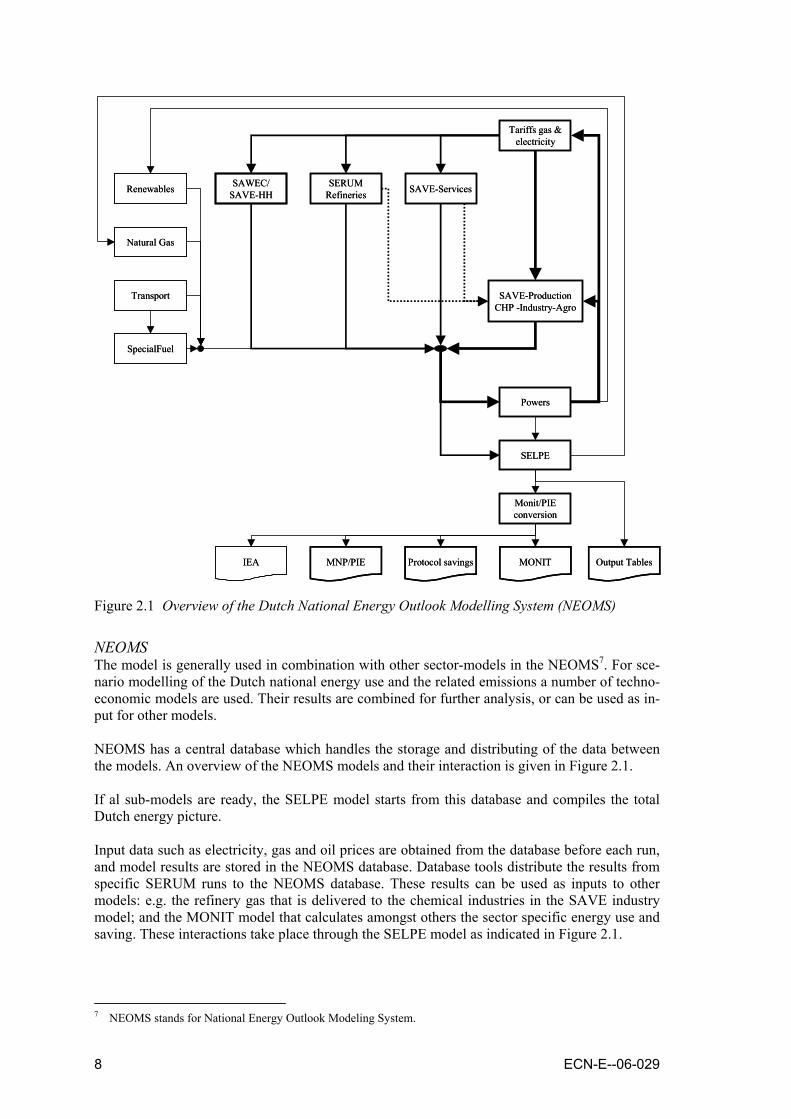
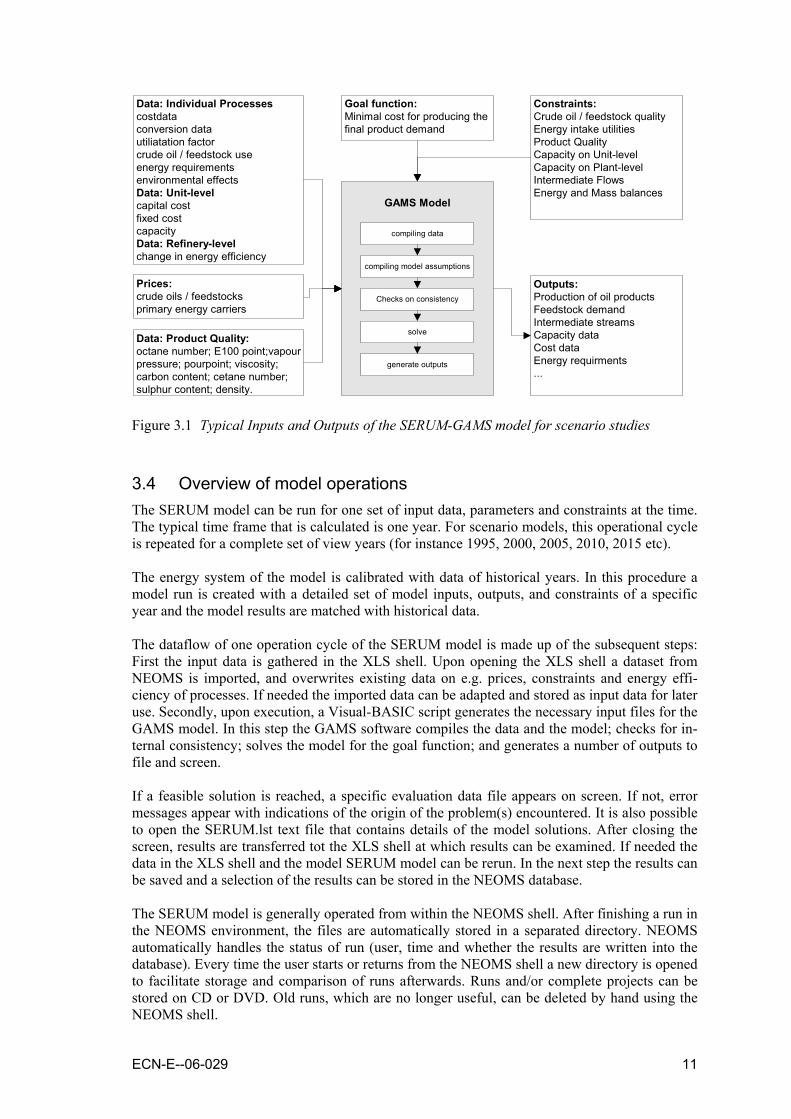
3.3 Inputs and outputs of SERUM GAMS model More specifically, when the SERUM model is used for scenario studies, part of the constraints are inputs of the modelled refineries, while others are constraints on the outputs of the modelled refineries. The model outputs, e.g. total energy use and crude oil intake, are the result of the cost optimisation for producing the final product demand. Figure 3.1 gives more into detail the in-puts and outputs of the use of the SERUM GAMS model specifically for calculations for sce-nario studies.
ECN-E--06-029 11
Data: Individual Processescostdataconversion datautiliatation factorcrude oil / feedstock useenergy requirementsenvironmental effectsData: Unit-levelcapital costfixed costcapacityData: Refinery-levelchange in energy efficiency
Outputs:Production of oil productsFeedstock demandIntermediate streamsCapacity dataCost dataEnergy requirments...
Constraints:Crude oil / feedstock qualityEnergy intake utilitiesProduct QualityCapacity on Unit-levelCapacity on Plant-levelIntermediate FlowsEnergy and Mass balances
Prices:crude oils / feedstocksprimary energy carriers
Data: Product Quality:octane number; E100 point;vapourpressure; pourpoint; viscosity;carbon content; cetane number;sulphur content; density.
GAMS Model
solve
Checks on consistency
compiling model assumptions
compiling data
generate outputs
Goal function:Minimal cost for producing thefinal product demand
Figure 3.1 Typical Inputs and Outputs of the SERUM-GAMS model for scenario studies
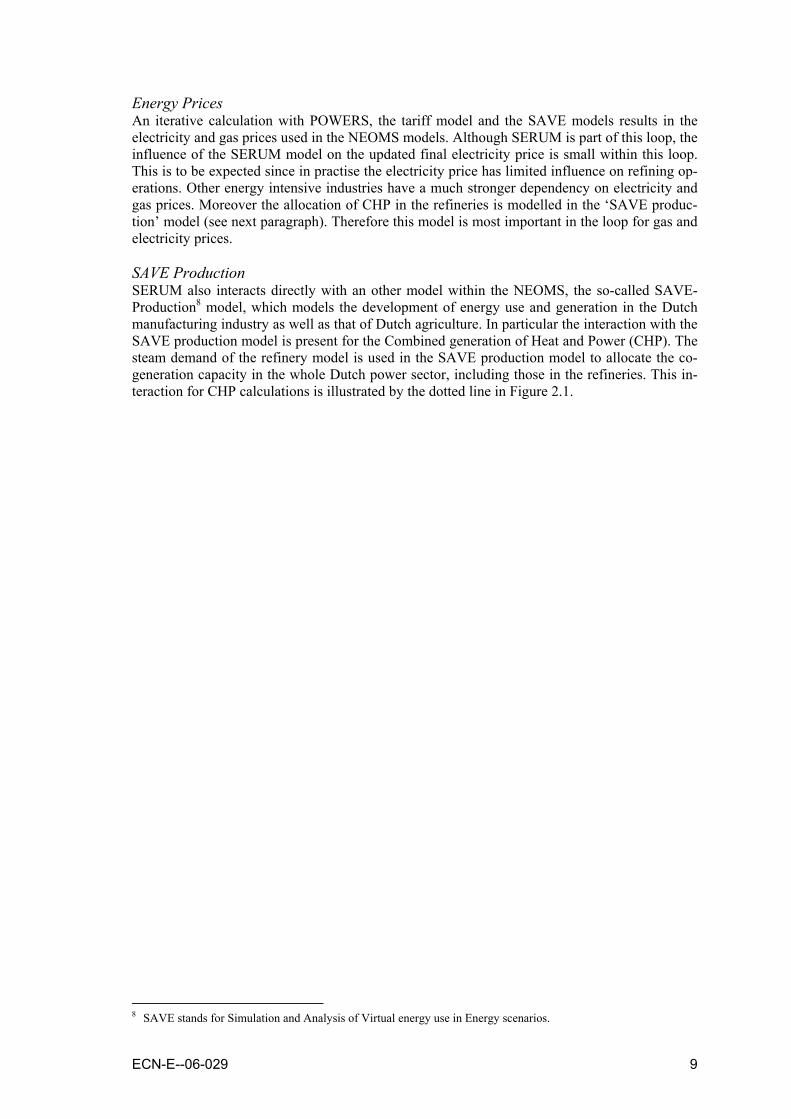
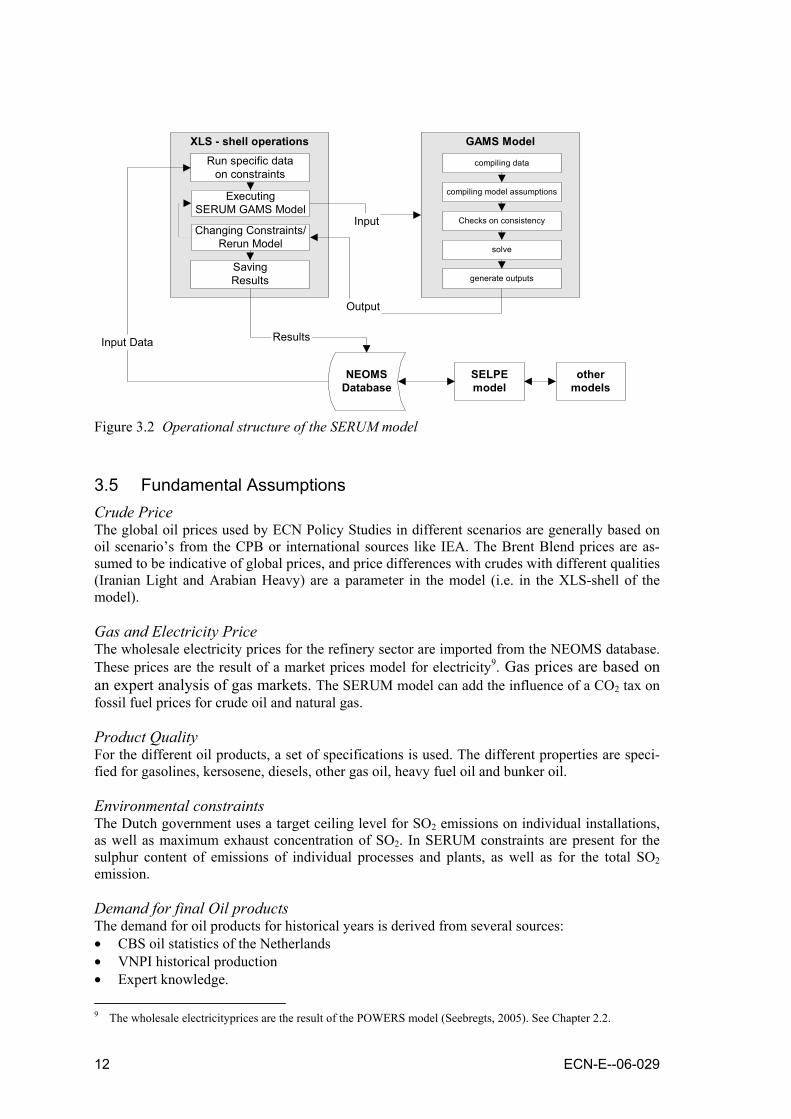
3.4 Overview of model operations The SERUM model can be run for one set of input data, parameters and constraints at the time. The typical time frame that is calculated is one year. For scenario models, this operational cycle is repeated for a complete set of view years (for instance 1995, 2000, 2005, 2010, 2015 etc). The energy system of the model is calibrated with data of historical years. In this procedure a model run is created with a detailed set of model inputs, outputs, and constraints of a specific year and the model results are matched with historical data. The dataflow of one operation cycle of the SERUM model is made up of the subsequent steps: First the input data is gathered in the XLS shell. Upon opening the XLS shell a dataset from NEOMS is imported, and overwrites existing data on e.g. prices, constraints and energy effi-ciency of processes. If needed the imported data can be adapted and stored as input data for later use. Secondly, upon execution, a Visual-BASIC script generates the necessary input files for the GAMS model. In this step the GAMS software compiles the data and the model; checks for in-ternal consistency; solves the model for the goal function; and generates a number of outputs to file and screen. If a feasible solution is reached, a specific evaluation data file appears on screen. If not, error messages appear with indications of the origin of the problem(s) encountered. It is also possible to open the SERUM.lst text file that contains details of the model solutions. After closing the screen, results are transferred tot the XLS shell at which results can be examined. If needed the data in the XLS shell and the model SERUM model can be rerun. In the next step the results can be saved and a selection of the results can be stored in the NEOMS database. The SERUM model is generally operated from within the NEOMS shell. After finishing a run in the NEOMS environment, the files are automatically stored in a separated directory. NEOMS automatically handles the status of run (user, time and whether the results are written into the database). Every time the user starts or returns from the NEOMS shell a new directory is opened to facilitate storage and comparison of runs afterwards. Runs and/or complete projects can be stored on CD or DVD. Old runs, which are no longer useful, can be deleted by hand using the NEOMS shell.
12 ECN-E--06-029
GAMS Model
solve
Checks on consistency
compiling model assumptions
compiling data
generate outputs
XLS - shell operations
ExecutingSERUM GAMS Model
Run specific dataon constraints
SavingResults
Input
Output
NEOMSDatabase
SELPEmodel
Input Data
othermodels
Results
Changing Constraints/Rerun Model
Figure 3.2 Operational structure of the SERUM model
3.5 Fundamental Assumptions Crude Price The global oil prices used by ECN Policy Studies in different scenarios are generally based on oil scenario’s from the CPB or international sources like IEA. The Brent Blend prices are as-sumed to be indicative of global prices, and price differences with crudes with different qualities (Iranian Light and Arabian Heavy) are a parameter in the model (i.e. in the XLS-shell of the model). Gas and Electricity Price The wholesale electricity prices for the refinery sector are imported from the NEOMS database. These prices are the result of a market prices model for electricity9. Gas prices are based on an expert analysis of gas markets. The SERUM model can add the influence of a CO2 tax on fossil fuel prices for crude oil and natural gas. Product Quality For the different oil products, a set of specifications is used. The different properties are speci-fied for gasolines, kersosene, diesels, other gas oil, heavy fuel oil and bunker oil. Environmental constraints The Dutch government uses a target ceiling level for SO2 emissions on individual installations, as well as maximum exhaust concentration of SO2. In SERUM constraints are present for the sulphur content of emissions of individual processes and plants, as well as for the total SO2 emission. Demand for final Oil products The demand for oil products for historical years is derived from several sources: • CBS oil statistics of the Netherlands • VNPI historical production • Expert knowledge. 9 The wholesale electricityprices are the result of the POWERS model (Seebregts, 2005). See Chapter 2.2.
ECN-E--06-029 13
The future developments in the demand for oil products are based on expert knowledge obtained form partly confidential discussions with oil companies and general literature. Furthermore sce-nario data of the transport sector, petrochemical sector and space heating are used. The CBS oil statistics of final refinery products are converted into the more detailed SERUM input format. This conversion requires additional expert knowledge that is partly confidential. For instance the division of heavy oil products in heavy oil and bunker oil, and the division of middle distillates between different gas oil qualities is confidential. Technology and Processes The process descriptions originate from a 1989 report, and numerous processes that have been added in the years. Examples of new processes are (deep) desulphurisation, energy conversion, other FCC-catalysts and several (co-)generation technologies in utilities. The current model10 consists of 201 processes, which are bundled in 74 units and 32 plants. This collection of proc-esses is representative of the unit operations encountered in the Dutch refining industry. In a typical model run the number of allocated processes is around 160. This allocation is needed to describe the Dutch refining activities in 2010. The constraints for the individual processes and plants are derived from VNPI publications VNPI (2005), expert knowledge from confidential discussions with the Dutch petroleum indus-try and international publications11. Energy Efficiency All processes in the SERUM model have defined energy requirements, in terms of the quantity of steam heat or electricity that is net consumed or produced. These individual requirements de-fine the technological baseline for the overall energy use. The energy efficiency of the com-bined refining processes is an input parameter in the model, and can have different values for the energy categories of steam heat and power. The total energy use in the model is a combina-tion of the overall energy efficiency and the energy requirements of the allocated processes.
10 Model Version 5.2, March 2006 specific run for WLO calculations (GE5, 2010). 11 E.g. Oil and Gas Journal, Hydrocarbon processes, Petroleum Economist.

14 ECN-E--06-029
4. Model Structure
4.1 Introduction The SERUM model consists of several layers: The Excel Shell, the GAMS model, and the in-formation exchange with the NEOMS database. In this chapter the model structure is presented, starting with the flow of data through the opera-tional cycle of the model, followed by an overview of the model structure of the two layers.
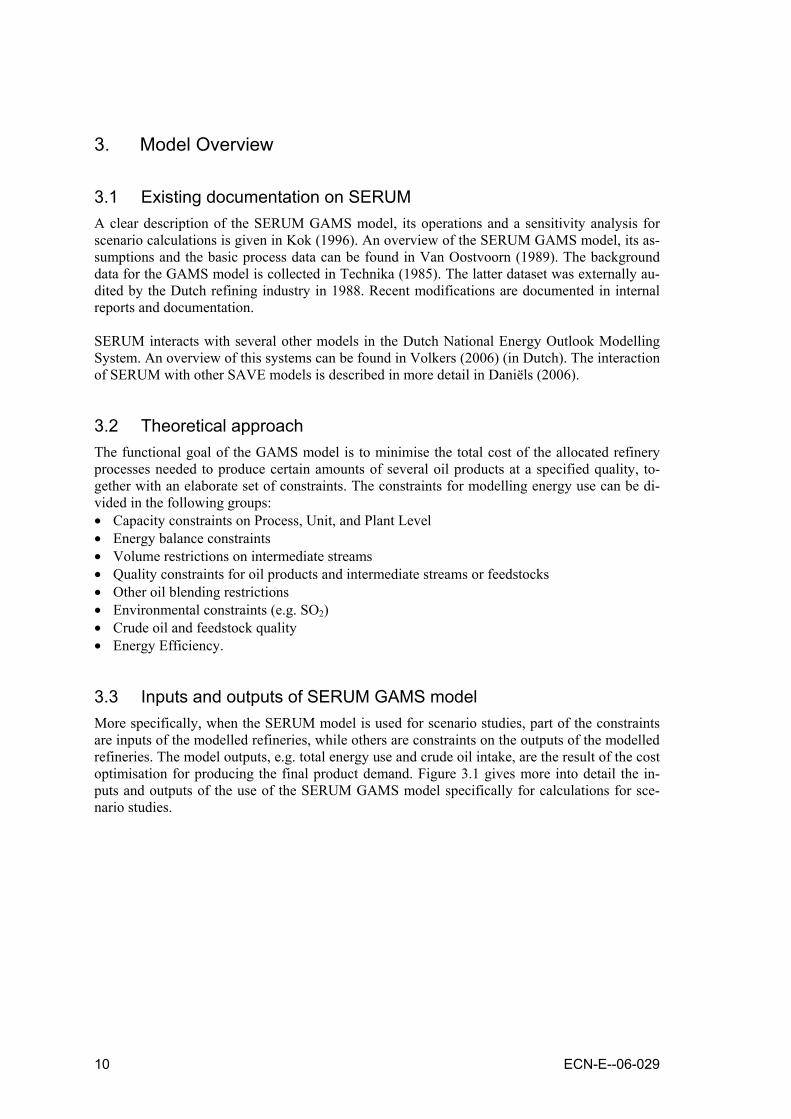
4.2 Flow of Data The model structure makes use of a number of individual files that contain both model equa-tions, input data, and output. Figure 4.1 illustrates the flow of data through the different files in the SERUM model. The input files with a capital font are similar for each model run, whereas the other input-files are unique for each model run. As part of the procedure in NEOMS a model run is created in a separate directory for each simulated year. It is possible to simulate the refining sector with one refinery type (for instance ‘trad’), or with three refineriy types (‘trad’, ‘hycon’ and ‘coker’). In case of three types of refineries, the SERUM GAMS model runs three times and the XLS shell calculates the total of the three runs. Figure 4.1 shows only the flow of data for the traditional (‘trad’) run.
Data Files:elekprijs.txtgasprijs.txtolieprijs.txtserumin.txtser_jaar.txt
Model Files:trad.inchycon.inccoker.inc
Model Files:SERUM.GMSDISPLAY.INCMESSAGE.INCRAFEVAL.INCINDEX.INC
Model results:MESSAGE.txteval.txtProcessresults:trad.txtList output:SERUM.lst
SELPEmodel
Results:serumuit.txtMODEL.inimodel status:info.ini
Results tables:tab#.txt
GAMS Model
solve
Checks on consistency
compiling model assumptions
compiling data
generate outputs
XLS - shell
ExecutingSERUM GAMS Model
Run specific dataon constraints
Additional Calculation& Saving Results
NEOMSDatabase
Other models
Other models
Other models
Figure 4.1 Flow of data in individual files for the SERUM model
ECN-E--06-029 15
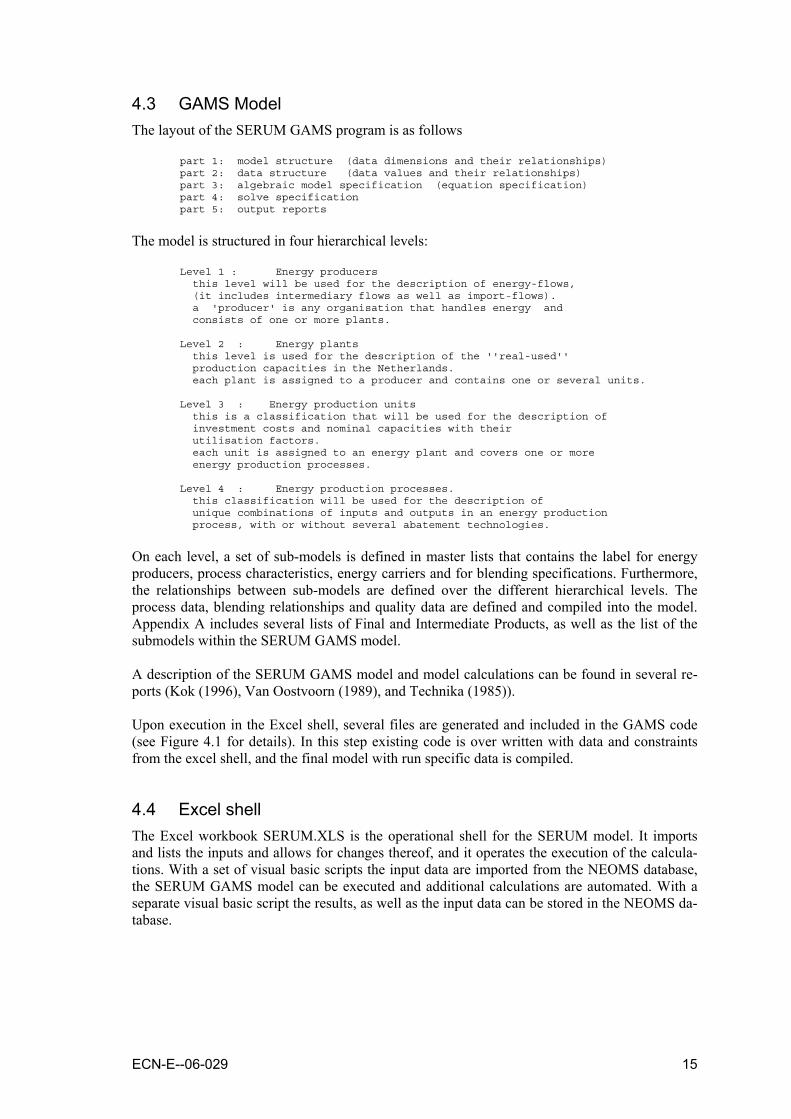
4.3 GAMS Model The layout of the SERUM GAMS program is as follows
part 1: model structure (data dimensions and their relationships) part 2: data structure (data values and their relationships) part 3: algebraic model specification (equation specification) part 4: solve specification part 5: output reports
The model is structured in four hierarchical levels:
Level 1 : Energy producers this level will be used for the description of energy-flows, (it includes intermediary flows as well as import-flows). a 'producer' is any organisation that handles energy and consists of one or more plants. Level 2 : Energy plants this level is used for the description of the ''real-used'' production capacities in the Netherlands. each plant is assigned to a producer and contains one or several units. Level 3 : Energy production units this is a classification that will be used for the description of investment costs and nominal capacities with their utilisation factors. each unit is assigned to an energy plant and covers one or more energy production processes. Level 4 : Energy production processes. this classification will be used for the description of unique combinations of inputs and outputs in an energy production process, with or without several abatement technologies.
On each level, a set of sub-models is defined in master lists that contains the label for energy producers, process characteristics, energy carriers and for blending specifications. Furthermore, the relationships between sub-models are defined over the different hierarchical levels. The process data, blending relationships and quality data are defined and compiled into the model. Appendix A includes several lists of Final and Intermediate Products, as well as the list of the submodels within the SERUM GAMS model. A description of the SERUM GAMS model and model calculations can be found in several re-ports (Kok (1996), Van Oostvoorn (1989), and Technika (1985)). Upon execution in the Excel shell, several files are generated and included in the GAMS code (see Figure 4.1 for details). In this step existing code is over written with data and constraints from the excel shell, and the final model with run specific data is compiled.
4.4 Excel shell The Excel workbook SERUM.XLS is the operational shell for the SERUM model. It imports and lists the inputs and allows for changes thereof, and it operates the execution of the calcula-tions. With a set of visual basic scripts the input data are imported from the NEOMS database, the SERUM GAMS model can be executed and additional calculations are automated. With a separate visual basic script the results, as well as the input data can be stored in the NEOMS da-tabase.
16 ECN-E--06-029
4.4.1 Additional calculations The results from the SERUM GAMS model are post-processed for use in the NEOMS data-bases. Several additional calculations are needed to maintain the consistency format used in the database. CO2 emissions The CO2 emission of the refineries is derived from an overall mass balance of all streams to and from the refineries. For individual streams, CO2 emissions factors are used from the Dutch Cen-tral Bureau for Statistics (CBS). The perimeter of the refinery is used as the border in the CO2 balance. Scenario studies use a different border in the CO2 balance, where Co-generation of heat and power is excluded from the refinery-sector. Also a mean CO2 emission factor for its own fuel use is calculated and stored in the NEOMS for further use by other models, which is e.g. used in the monitoring tool MONIT12. SO2 emissions The two desulpherisation plants in SERUM emit the remaining SO2. This amount of SO2 emis-sion is related to the total H2S input of these Claus plants and exported as process emission to SELPE. Feedstocks In practise, next to crude oil, the feedstocks for refineries are also gas condensate and interme-diate products. Light feedstocks are corrected on the bruto-production. In SERUM the heavy feedstock intake was therefore modelled as a synthetic crude that is a combination of the crude oil intake and heavy feedstocks. Since the primary goal of SERUM is to model the energy use of refineries correctly, the synthetic crude properties are constructed based on energy content of the constituents. Because this leads to a difference between the model and statistics, it was later on decided to correct for heavy feedstocks as well. As a consequence of the corrections the throughput of SERUM is lower than the CBS statistics indicates. Because of a thorough calibra-tion, this has no consequence for the amount of CO2 emissions calculated with SERUM. Oil gasifier In SERUM an oil gasifier is defined that produces both hydrogen and electricity, and steam as a by-product. Several adjustments are made to transfer the correct electricity and steam demand, and heavy fuel oil production to the SELPE model. Details are described in sheet 1 of the SERUM.xls file. FCC gas The energy content of FCC-gas is defined differently in SERUM and CBS statistics. To main-tain consistency in both energy output, demand and emissions, corrections are made before ex-porting the results to SELPE, in the following streams: the energetic content FCC gas, the heat-demand of the FCC-processes and the CO2, NOx, and SO2 emissions. Crude oil intake The amount of crude oil imported is calculated from the crude oil import and the onshore and offshore production. Steam demand for COGEN model In a separate model ‘SAVE production’ the cogeneration capacities are calculated. Save-production describes the development of energy use and generation in the Dutch manufacturing industry as well as that of Dutch agriculture. Contrary to the previous model version, ‘SAVE production’ also includes the CHP of these and other sectors, such as the refineries and the ser-vices sector. 12 MONIT is an monitoring and analytic tool for energy use, emissions and energy saving.

ECN-E--06-029 17
Inputs for this model are the steam and heat demands in different sectoral models, and the gas and electricity prices. For refineries the amount of steam that can be supplied by cogeneration is limited and is calculated as follows: The total amount of steam supplied by utilities, subtracted by the steam production of the refining processes.
18 ECN-E--06-029
References
Daniëls, B.W. (2006) Save industry: Modelling of energy use and CHP production. internal ECN report, in preparation.
Daniëls, B.W. (2006) Save Production: A bottom-up energy model for Dutch industry and agriculture. in preparation.
Dril, A.W.N. van, et. al. (2005): Reference Projection Energy and Emissions 2005-2020. ECN-C--05-089, ECN, Petten, October 2005.
Kok I.C., P. Kroon (1997): Raffinagemodel SERUM in hoofdlijnen. ECN-C--96-066, ECN, Petten, March 1997.
Oostvoorn F. van, P. Kroon, A.V.M. de Lange (1989): SERUM: Een model van de Nederlandse raffinage-industrie. ESC-49, ECN, Petten, October 1989.
Seebregts A.J., M.J.J. Scheepers, R. Jansma, J.F.A. van Hienen (2005): Kerncentrale Borssele na 2013 - Gevolgen van beëindiging of voortzetting van de bedrijfsvoering. Bijlage B: Beschrijving POWERS-model, p. 123-133, ECN-C--05-094/NRG 21264/05.69766/C, ECN/NRG, Petten, 2005.
Stienstra, G.J. (2006): Energiebesparing Raffinaderijen: Beschrijving ‘bottom-up’ methodiek& toepassing voor de periode 1990-2003. ECN-E--06-005, ECN, Petten, October 2006.
Technika (1985), Data Collection for the national refining sector model. Technika, report number F407.
VNPI (2006): The Netherlands Petroleum Industry Association. www.vpni.nl, accessed May 2006.
Volkers, C.H. (2006): NEV-RekenSysteem: Technische beschrijving. Internal ECN report, in preparation.

ECN-E--06-029 19
Appendix A SERUM GAMS model
A.1 Final products PG-COKE PREMIUM GRADE COKE EVC-GASOIL EXPORT VACUUM-GASOIL PREMIUM-LD LEADED PREMIUM PREMIUM-LL LOW-LEADED PREMIUM PREMIUM-UL UNLEADED PREMIUM REGULAR-LD LEADED REGULAR REGULAR-LL LOW-LEADED REGULAR REGULAR-UL UNLEADED REGULAR AUTODIESEL AUTO DIESEL OTH-GASOIL OTHER GASOIL H-FUEL-OIL HEAVY FUEL OIL BUNKER-OIL HEAVY BUNKER FUEL OIL KEROSENE KEROSENE P-NAPHTA NAPHTHA FOR THE PETROCHEMICAL INDUSTRY REF-OIL REFINERY FUEL OIL (FOR OWN USE ONLY) REF-GAS REFINERY GAS (MOSTLY SELF-CONSUMPTION) ASPHALT ASPHALT LPG LIQUID PETROLEUM GAS
A.2 Intermediate products CRUDE CRUDE CONDENSATE NATURAL GAS CONDENSATE ATM-R-FEED ATMOSPHERIC RESIDUE USED AS FEEDSTOCK NATURALGAS NATURAL GAS S-KEROSENE STRAIGHT-RUN KEROSENE D-KEROSENE DESULPHURISED KEROSENE S-KERO-DD STRAIGHT-RUN KEROSENE DEEP DESULPHURISED NAPHTA+LE STRAIGHT-RUN NAPHTHA & LIGHT ENDS SL-NAPHTA LIGHT STRAIGHT-RUN NAPHTHTA SH-NAPHTA HEAVY STRAIGHT-RUN NAPHTHTA CK-NAPHTA COKER-NAPHTHTA VB-NAPHTA VISBREAKER NAPHTHTA CR-NAPHTA1 CRACKED NAPHTHA SEVERITY 1 CR-NAPHTA2 CRACKED NAPHTHA SEVERITY 2 CR-NAPHTA3 CRACKED NAPHTHA SEVERITY 3 CR-NAPHDS1 CRACKED NAPHTHA DESULPHURIZED SEVERITY 1 CR-NAPHDS2 CRACKED NAPHTHA DESULPHURIZED SEVERITY 2 CR-NAPHDS3 CRACKED NAPHTHA DESULPHURIZED SEVERITY 3 CK-GASOLIN COKER GASOLINE VB-GASOLIN VISBREAKER GASOLINE ATM-RESID ATMOSPHERIC RESIDUE VAC-RESID VACUUM RESIDUE ATM-RES-D DE-SULPHURISED ATMOSPHERIC RESIDUE VAC-RES-D DE-SULPHURISED VACUUM RESIDUE RHC-RESID RESIDUE-HYDROCRACKING RESIDUE VBA-RESID VISBREAKER RESIDUE FROM ATMOSPHERIC FEED VBV-RESID VISBREAKER RESIDUE FROM VACUUM FEED SL-GASOIL LIGHT STRAIGHT-RUN GASOIL SH-GASOIL HEAVY STRAIGHT-RUN GASOIL DSL-GASOIL DESULPHURISED LIGHT STRAIGHT RUN GASOIL SL-GO-DD LIGHT STRAIGHT-RUN GASOIL DEEP DESULPHURISED DSH-GASOIL DESULPHURISED HEAVY STRAIGHT RUN GASOIL SH-GO-DD DEEP DESULPHURISED HEAVY STRAIGHT RUN GASOIL VAC-GASOIL VACUUM GASOIL DVC-GASOIL DESULPHURISED VACUUM GASOIL VAC-GO-DD VACUUM GASOIL DEEP DESULPHURISED FLX-GASOIL FLEXICOKER GASOIL
20 ECN-E--06-029
FLV-GASOIL FLEXICOKER VACUUM GASOIL DEL-GASOIL DELAYED COKER GASOIL DLV-GASOIL DELAYED COKER VACUUM GASOIL DCK-GASOIL DESULPHURISED COKER GASOIL DCK-GO-DD (COKER) GASOIL DESULPHURISED HCR-GASOIL HYDROCRACKER GASOIL HCR-GO-DD HYDROCRACKER GASOIL DEEP DESULPHURISED HCR-KEROSE (RESIDUE) HYDROCRACKER KEROSENE HCR-KER-DD (RESIDUE) HYDROCRACKER KEROSENE DEEP DESULPHURISED RHC-GASOIL RESIDUE HYDROCRACKER GASOIL RHC-GO-DD RESIDUE HYDROCRACKER GASOIL DESULPHURISED RDS-GASOIL RESIDUE HYDRODESULPHURISED GASOIL (RESID-HDS GAS OIL) VBA-GASOIL VISBREAKER GASOIL FROM ATMOSPHERIC FEED VBV-GASOIL VISBREAKER GASOIL FROM VACUUM FEED DVB-GASOIL DESULPHURISED VISBREAKER GASOIL L-CY-OIL LIGHT CYCLE OIL DL-CY-OIL DESULPHURISED LIGHT CYCLE OIL L-CY-DD LIGHT CYCLE OIL DEEP DESULPHURISED H-CY-OIL HEAVY CYCLE OIL L-CRACKATE LIGHT HYDROCRACKATE H-CRACKATE HEAVY HYDROCRACKATE ASPHALT-R ASPHALTIC RESIDUE DA-OIL DEASPHALTED OIL REFORM93 REFORMATE 93 RON REFORM100 REFORMATE 100 RON LUBR+WAXES LUBRICANTS + WAXES ALKYLATE ALKYLATE ALKYL-TAR ALKYLATION TAR ISOMERATE ISOMERATE RAFFINATE RAFFINATE COAL COAL FG-COKE FUEL GRADE COKE FCC-GAS FLUID CATALYTIC CRACKING GAS (ALL CRUDES) DFC-GAS LOW SULPHUR FLUID CATALYTIC CRACKING GAS (ALL CRUDES) FLX-GAS FLEXICOKER GAS (ONLY IL+AH-CRUDE) C1C2 REFINERY GASES C3 PROPANE NC4 N-BUTANE IC4 ISO-BUTANE C3-GP PROPANE-STREAM FROM GAS-PLANT NC4-GP NBUTANE-STREAM FROM GAS-PLANT IC4-GP ISOBUTANE-STREAM FROM GAS-PLANT PRO+BUTENE PROPENE + BUTENE POWER-P POWER PRODUCED IN THE REFINERY PROCESSES (OUTPUT) STEAM-P STEAM PRODUCED IN THE REFINERY PROCESSES (OUTPUT) S SULPHUR H2 HYDROGEN H2-P HYDROGEN PRODUCED IN C-REFORMER H2-PP HYDROGEN PURGE FROM SEPARATION AND PURIFICATION PROCESS H2S HYDROSULFIDE METH-TBA METHANOL AND TBA MIX MTBE MTBE1 MTBE-EXTR MTBE2 REF-OIL-U REFINERY FUEL OIL FOR UTILITIES (PJ) REF-GAS-U REFINERY GAS FOR UTILITIES (PJ) PG-COKE PREMIUM GRADE COKE EVC-GASOIL EXPORT VACUUM-GASOIL PREMIUM-LD LEADED PREMIUM PREMIUM-LL LOW-LEADED PREMIUM PREMIUM-UL UNLEADED PREMIUM REGULAR-LD LEADED REGULAR REGULAR-LL LOW-LEADED REGULAR REGULAR-UL UNLEADED REGULAR AUTODIESEL AUTO DIESEL OTH-GASOIL OTHER GASOIL H-FUEL-OIL HEAVY FUEL OIL BUNKER-OIL HEAVY BUNKER FUEL OIL KEROSENE KEROSENE
ECN-E--06-029 21
P-NAPHTA NAPHTHA FOR THE PETROCHEMICAL INDUSTRY REF-OIL REFINERY FUEL OIL (FOR OWN USE ONLY) REF-GAS REFINERY GAS (MOSTLY SELF-CONSUMPTION) ASPHALT ASPHALT LPG LIQUID PETROLEUM GAS
A.3 Masterlist of the energy producer labels CRUDE-DIST ATMOSPHERIC DISTILLATION OF CRUDE OIL VAC-DIST VACUUM DISTILLATION OF ATMOSPHERIC RESIDUE H2FINER PRE-HYDROTREATER FOR COKER PRODUCTS H2TREATING HYDROTREATER C-REFORMER CATALYTIC REFORMER HYDROGEN-P HYDROGEN PRODUCER C56-ISO C56 ISOMERATION GAS-PLANT GAS-PLANT (SEPARATES VARIOUS PROPANE & BUTANE STREAMS) C4-ISO C4 ISOMERATION CRACKERS CRACKING (HYDRO-CRACKERS AND CATALYTIC CRACKERS) RESID-UPGR RESIDUE UPGRADING ALKYLATION ALKYLATION AM-SULFREC AMINO TREATMENT AND SULPHUR RECOVERY UTILCLEAN SO2 REDUCTION OPTIONS FOR UTILITIES UTILITIES ENERGY UTILITIES BLENDING BLENDING PROCESS BLEND-CONV CONVERSION OF FINAL PRODUCTS FROM TON TO PJ
A.4 Masterlist of energy production plants CRUDE-DIST Crude distillation VAC-DIST Vacuum distillation H2FINER Hydrogen Finer HTREAT-NAP Naphtha Hydrotreaters HTREAT-OTH Other Hydrotreaters C-REFORMER Catalytic Reformer HYDROGEN-P Hydrogen Plant IGCC Integrated Gasifier Combined Cycle H2-SEP-PUR H2 separator purifier C56-ISO C5 c6 isomerisation GAS-PLANT Gas plant C4-ISO C4 isomerisation CATCRACKER Catcrackers HYDCRACKER Hydrocrackers VISBREAKER Visbreakers FLEXICOKER Flexicokers DELAYCOKER Delayed cokers LUBEOIL-PL Lube oil plant SOLV-DEASP Solvent deasphalters RESID-HDS Residual Hydrodesulphurization RES-HCRACK Residual Hydrocrackers ALKYLATION Alkylation AM-SULFREC Sulphur Recovery Plant GASIFIER Gasifier CLEANCRACK Catalyst cleaner for Crackers BOILERS Boilers FURNACES Furnaces COGENERATE Cogeneration processes DISTRIBUTE Distribution process BLENDING Bending process BLEND-CONV Conversion of final products from Ton -> PJ
22 ECN-E--06-029
A.5 Masterlist of energy production units CRUDE-DIST Crude Distillation VAC-DIST Vacuum distillation HT-FIN-FLX Hydrotreater finisher HT-FIN-DEL Hydrotreater HT-SR-NAP Hydrotreater Straight Naphtha HT-CK-NAP Hydrotreater Coker Naphtha HT-VB-NAP Hydrotreater Visbreaker Naphtha HT-KEROS Hydrotreater Kerosene HT-LSR-GO Hydrotreating Light Straight Gasoil HT-HSR-GO Hydrotreating Heavy Straight Gasoil HT-VAC-GO Hydrotreater Vacuum Gasoil HT-VIS-GO Hydrotreater Visbreaker Gasoil HT-CKR-GO Hydrotreater Cracker Gasoil HT-CY-OIL Hydrotreater Cycle Oil CREF-NAP-1 Catalytic Reformers Middle Destilates CREF-NAP-2 Catalytic Reformers Middle Destilates CREF-HCR-1 Catalytic Reformers HydroCrackate CREF-HCR-2 Catalytic Reformers HydroCrackate HYDROGEN-P Hydrogen Plant IGCC Integrated Gasification Combined Cycle H2-SEP-PUR H2 separator pure hydrogen C56-ISO c5-c6 isomerisation GAS-PLANT Gas plant C4-ISO C4 isomerisation CATCRACK-1 Catcracker 1 CATCRACK-2 Catcracker 2 CATCRACK-3 Catcracker 3 HYCRACK-MG Hydrocracker MG HYCRACK-MD Hydrocracker MD VB-ATMRES Visbreaker Atmospheric Residue VB-VACRES Visbreaker Vacuum Residue FLEXICOKER Flexicoker DELAYCK-1 Delayed Coker 1 DELAYCK-2 Delayed Coker 2 LUBEOIL-PL Lube oil plant SOLV-DEASP Solvent De-asphalter RES-HDS-AT Residual Hydrogen Desulphurisation Unit (Atmospheric) RES-HDS-VC Residual Hydrogen Desulphurisation Unit (Vacuum) RES-HCRACK Residual Hydro Cracker ALKYLATION Alkylation ATSR Sulphur Recovery Unit ATSR-TGU Sulphur Recovery Unit Advanced GAS-RO Gasifier of Refining-Oil CLEAN-FC SO2 Reduction option for FCC-gas HYCRACK-KE Kerosene Hydrocracker BOILER-NG Boiler Natural Gas BOILER-RG Boiler Refinery Gas BOILER-RO Boiler Refining Oil BOILER-FL Boiler Flexicoker Gas BOILER-CO Boiler Coal BOILER-PC Boiler Fuel Grade Coke BOILER-FC Boiler Flexicoker Gas FURNACE-RG Furnace Refining Gas FURNACE-RO Furnace Refining Oil FURNACE-NG Furnace Natural Gas FURNACE-FL Furnace Flexicoker Gas COMB-CYCLE Combined Cycle GASTURBINE Gas turbine BACKP-TURB Backup Power Turbine BACKP-RO Backup Power Refining Oil BACKP-CO Backup Power Coal COND-TURB Condensation Turbine DISTRIBUTE Distributing processes BLENDING Blending processes
ECN-E--06-029 23
BLEND-CONV Blending and Conversion processes HT-CR-NAP Hydrotreating of cracker Naphtha HT-GO-DD Hydrotreating deep desulpherisation of Gasoil HT-CY-DD Hydrotreating deep desulpherisation of Cycle Oil HT-KERO-DD Hydrotreating deep desulpherisation of Kerosene HT-HCR-KER Hydrotreating hydrocracker Kerosene HT-RESGO-DD Hydrotreating deep desulpherisation of residual Gas Oil HT-HGO-DD Hydrotreating deep desulpherisation of Heavy Gas Oil HT-VGO-DD Hydrotreating deep desulpherisation of Vacuum Gas Oil ATSR-SRU Sulphur Recovery Unit Deep desulphurization
A.6 Masterlist of energy production processes CR-DIST-SB , CR-DIST-BB , CR-DIST-IL , CR-DIST-AH CR-DIST-CD , AR-DIST-IL , AR-DIST-AH , VACDIST-SB VACDIST-BB , VACDIST-IL , VACDIST-AH , HTF-FVG-IL HTF-FVG-AH , HTF-DVG-IL , HTF-DVG-AH , HT-SRNAPSB HT-SRNAPBB , HT-SRNAPIL , HT-SRNAPAH , HT-CK-NAPH HT-VB-NAPH , HT-KER-SB , HT-KER-BB , HT-KER-IL HT-KER-AH , HT-LGO-SB , HT-LGO-BB , HT-LGO-IL HT-LGO-AH , HT-HGO-IL , HT-HGO-AH , HT-VAC-IL HT-VAC-AH , HT-VBA-IL , HT-VBA-AH , HT-VBV-IL HT-VBV-AH , HT-DCU-IL , HT-DCU-AH , HT-FCU-IL HT-FCU-AH , HT-LCO-SB , HT-LCO-BB , HT-LCO-IL HT-LCO-AH , REF-SRNAP1 , REF-CKNAP1 , REF-VBNAP1 REF-SRNAP2 , REF-CKNAP2 , REF-VBNAP2 , REF-HCR-1 REF-HCR-2 , HYDROGEN-P , IGCCVBA-IL , IGCCVBA-AH IGCCVBV-IL , IGCCVBV-AH , H2-SEP-PUR , C56-ISO-SB C56-ISO-BB , C56-ISO-IL , C56-ISO-AH , GASPL-C3 GASPL-NC4 , GASPL-IC4 , C4-ISO , CAT1-AT-SB CAT1-AT-BB , CAT1-VC-SB , CAT1-VC-BB , CAT1-VC-IL CAT1-VC-AH , CAT1-DA-IL , CAT1-DA-AH , CAT2-AT-SB CAT2-AT-BB , CAT2-VC-SB , CAT2-VC-BB , CAT2-VC-IL CAT2-VC-AH , CAT2-DA-IL , CAT2-DA-AH , CAT3-AT-SB CAT3-AT-BB , CAT3-VC-SB , CAT3-VC-BB , CAT3-VC-IL CAT3-VC-AH , CAT3-DA-IL , CAT3-DA-AH , HCR1-VC-SB HCR1-VC-BB , HCR1-VC-IL , HCR1-DA-IL , HCR1-VC-AH HCR1-DA-AH , HCR2-VC-SB , HCR2-VC-BB , HCR2-VC-IL HCR2-DA-IL , HCR2-VC-AH , HCR2-DA-AH , HCR3-VC-SB HCR3-VC-BB , HCR3-VC-IL , HCR3-DA-IL , HCR3-VC-AH HCR3-DA-AH , VIS-ATR-IL , VIS-ATR-AH , VIS-VCR-IL VIS-VCR-AH , FLEXICO-IL , FLEXICO-AH , DELAY-1-SB DELAY-1-BB , DELAY-1-IL , DELAY-1-AH , DELAY-2-SB DELAY-2-BB , DELAY-2-IL , DELAY-2-AH , LUBEOIL-IL LUBEOIL-AH , SOLV-DA-IL , SOLV-DA-AH , RHDS-AT-IL RHDS-AT-AH , RHDS-VC-IL , RHDS-VC-AH , RES-HCR-IL RES-HCR-AH , ALKYLATION , ATSR , ATSR-TGU GAS-RO , CLEAN-FCSB , CLEAN-FCBB , CLEAN-FCIL CLEAN-FCAH , BOILER-NG , BOILER-RG , BOILER-RO BOILER-FL , BOILER-CO , BOILER-PC , BOIL-FCCSB BOIL-FCCBB , BOIL-FCCIL , BOIL-FCCAH , BOIL-DFCSB BOIL-DFCBB , BOIL-DFCIL , BOIL-DFCAH , FURNACE-RG FURNACE-RO , FURNACE-NG , FURNACE-FL , COMB-CY-NG COMB-CY-RG , GASTURB-NG , GASTURB-RG , BCKTURB-NG BCKTURB-RG , BCKTURB-RO , BCKTURB-CO , CNDTURB-NG CNDTURB-RG , CNDTURB-RO , DISTRIB-ST , DISTRIB-P BLENDING , BLENCO-RO , BLENCO-RG , HT-CR-NAP1 HT-CR-NAP2 , HT-CR-NAP3 , HT-GO-DDSB , HT-GO-DDBB HT-GO-DDIL , HT-GO-DDAH , HT-KERDDNT , HT-CY-DDSB HT-CY-DDBB , HT-CY-DDIL , HT-CY-DDAH , HT-CRK-KER HT-HCRGO-SB , HT-HCRGO-BB , HT-HCRGO-IL , HT-HCRGO-AH HT-DCKGO-IL , HT-DCKGO-AH , HT-RHCGO-IL , HT-RHCGO-AH HT-VGO-DDIL , HT-VGO-DDAH , HT-HGO-DDIL , HT-HGO-DDAH ATSR-SRU