document resume ud 022 841 - eric - education .... introduction trends in new york city education...
TRANSCRIPT

DOCUMENT RESUME
ED 2'31 960 UD 022 841. .
TIii.E Education Budget Options, Fiscal Year 1984.'11(STITUTION Educational Priorities Panel, New York, N.Y.PUB DATE (83] '---L
NOTE 48p.PUB TYPE , Statistical Data (110) -- RepOrts Genertl (140)
EDRS'PRICEDESCRIPTORS
I_OENTIFIERS
MF01/PCO2 Plus Postage.*Board of Education Role;Finance; Elemedtary SeconSchools; *School DistrictEducational Priorities Pof Education
*Buoi4ets;AEducationalary Education; PublitSpedding
ne1014117; *New York City Board
ABSTRACT\.This paper presents the/suggestions of the
Educational Priorities Panel (EPP) to tlie New York City Council andthe Board of Estimate,-concerning the c4ty's educational budget forFis9a1 Year 1984. Recent trends in-New ork City's educationalservices are reviewed. Noting thit the Public schools have had toreduce their services due to financial difficulties, and that morefunds should-be available for 1984, the panel calls for therestoration of some of the services that had been curtailed. Theproposed education budget for 1984 is analyzed and areas where thepanel agrees and disagrees with'proposed budget cuts are presented.The EPP then presents its own budget initiatives for 1984. It callsfor an additional $49.1 million in order to restore servicesxincluding reduced first grade class size, more full day kindergartenclasses, expanded vocational education services, summer schoolprograms that allow high school age students to repeat failedcourses, and expanded day care servixes for student parents. The EPPalso calls upon the Board of Education to implement administrativecuts expeditiously so that the full savings projected can berealized. (AOS)
s.
414
*****************************************t****************************** Reproductions supplied byEDRS are the best that can be made . *
* from the original document. *
***********************************************************************L

U.S. DEPARTMENT OF EDUCATIONNATIONAL INStITUTE OF EDUCATION
EDUCATIONAL RESOURCES INFORMATIONCENTER IF CI
1"Lis 4doi urrZeilt has een repnefoi od as
re( rowed from the eson of organization
Minor rhanges hal been made to Improvemuumuus.; a
reprodui non duzdity
Points ot ve4 01 opinions stalfli in this docuLment do not neGpssanly represent (Mickel NIE
Position or pole y

The Educational Priorities Panel
95 Madison AvenueNew York, NY 10016
-(212) 685-3563
Helen C. Heller, Coordinator
Advocates for ChildrenAmerican Jewish Committee, New York Chapter
ASPIRA of New YorkAssociation for the Help of Retarded Children
Center for Public Advocacy ResearchCitizens' Committee for Children of New York, Inc.
The City Cldb of New YorkCity-Wide Confederation of High School Parents
Coalition of 100 Black WomenCommunity Council of Greaser New York
Community Service SocietyThe Junior League of Brooklyn
The Junior League of New York City, Inc.League of Women Voters of New York CitYmetropolitan Council of New York, NAACP
New York Urban CoalitionNow York Urban LeaguePresbytery of New York
PROGRESS, Inc.Public Education Astociation
Queensboro Federation of Parents ClubsRheedlen Foundation
United Neighborhood HousesUnited Parents Associations
Women's City Club Cilt\New York
Support for the Educational Priorities Panel far 1982-83 has been provided by:
Rockefeller Brothers FundBankers Trust CompanyBooth Ferris FoundationCharles Revson FoundationCharles Stewart Mott FoundationChase Manhattan BankCitibankConsolidated Edison Company of New YorkFund for the City of New York
Stanley LitowDavid Lebenstein
. Robin Willner
Helena'Rubinstein FoundationManufacturers Hanover FoundationMerrill, Lynch and Company -
Metropolitan Life Insurance CompanyMorgan Guaranty Trust CompanyMurjani International, Ltd.New York Community TrustThe New York Times FoundationScherman Foundation
Management Staff - INTERFACE
251 Park Avenue SouthNew York, NY 10010
(212) 674-2121
Steven RedfieldSusan AmlungSandra,Moore
b
a

S UMMAR
In its analysis of the proposed education budget for FY'84, the EducationalPriorities Panel calls upon the City Council and Board of Estimate to add
$49.1 million to the Executive Budget. Of the $81 million in cuts proposed
by the Office of Management and Budget, this addition would restore $24.5
million -- those which the Panel believes would severely diminish necessaryservices for children -- including remedil programs, special education,and lunch costs. The Panel recommends that the remaining funds be used for -
important new initiatives in the early grades and high schools.\ They includereduced first grade class size, more full day kindergarten classes, expandedvocational education services, summer school programs to enable all highschool age students to repeat failed courses, and expanded day care serVices
for student parents.
This restoration is possible because the Panel's independent revenue projec-
tions show that $96-158 million more than the city has estimated will he
available for spending next year. If revenues and administrative cost.savings are not sufficient to preserve at least the present level of vitalcity services, the Panel would support local tax increases.
The EPP also calls upon the Board of Education to implement administrativecuts expeditiously so that the full savings projeceed can be realized.
Only with these actions can the city's school system effectively rebuildpre-fiscal-crj.sis service levels and begin to provide a quality..education
for New York City's school children.
Summary of EPP Funding Request
Budget Restorations to PreserveCurrent Service Levels $27.0 million
Less Additional Adminitrative Savings
Total Funds for Restorations
Funding for expansion of services
- Reduced first grade class size
- Full day kindergarten(no net additional c ost; value $5.3 million)
(2.5)
17.8
- High School vocational programs 4.0
- Summer school opportunities 2.5
- Child care services for student parent's .3
Total New ServiCes
Total Funding Increase
$24..5
$24.6
$49.1 million

TABLE OF CONTENTS
I. Introduction
Trends in New York City Education Service 1
Education in the City Budget 6
EPP Tax Policy 8
City Tax Revenues 9
II. Proposed Education Budget Reductions Supported by EPP 13
Administrative Reductions 14
Consolidation of School Buildings 16
SFecial Education 187
4
Annualization of Midyeax Reductions 19
Enrollm6nt Decline 19
Promotional Policy.. 20
Outside Savings 20
Board of Examiners 21
III. Proposed Education Budget Reductions Opposed by EPP 23
Substitution of Tax Levy Fundings 23
School Lunch Prices 24
Special Education Mainstreaming 24
Community School Districts Staff 25
IV. EPP Initiatives for 1984 26
Reduced First Grade Class Size 26
...ExpanSion'of Full Day Kindergarten ' 30
(
l \ .ExpansionfOqVocational Education Opportunities 31
Expansion of Summer School 36
Expansion of Child Care Servioes 37
Conclusion 38

co.
am
I. INTRODUCTION
Trends in New York City Education Services
The 1983-84 school yearkcan be a milestone in the development r
of the New York City public schools. The new Chancellor has already
_announced major 'initiatives for September to bolster the early grades
and the high schools. The city's economy is on the rise, providing .
increased revenue for vital city services. Nationwide, there has
been a renewed interest in the public schools, froT public officials,
academics and leaders of the business community alike who have recog-
nized the necessity of investing in education to maintain this country's
position in the world economy.
The city(s schools are in an ideal position to benefit from these -
influences. The groundwork for improvement hats been laid, with innova-;
tive educational programs emerging in the community school districts,
with renewed attention to standards from the central Board of Education,
and with new budgetary emphasis on classroom services for children over
administration. Moreover, the schools have had the support of the
City Council, the Board of Estimate and the Mayor in their efforts to
preserve school services during financially dif&cult times. In each
of the last five years, major threatened service reductions have been
averted at budget time through administrative savings and additional
city funding. (However, midyear budget shortfalls in the 1979-80 and
1982-83 school year did necessitate service reductions.)
Nevertheless, the fact that we have held the line on services for
the past five years does not mean that the schools are able to meet the
demands put on them in the 1980s. The services lost during the city's

fiscal crisis of 1975 have never been restored. Maintenance of 1,000
school buildings has been cut back to emergency work only. So called .
"optional programs," including library services, music and art classes
have 'all but disappeared, and even basic supplies like textbooks and
paper continue to be scarce commodiiies.
The level of most basic services has also fallen behind. Tables 1,
2 and 3 show the decline. of three service measures, comparing the ..levels
in 1974-75 with more recent years. Table' 1 (page 4) shows that the pupil-
teacher ratio has increased by 20 percent in the districts and 11 per-
cent in the high schools.' (These figures do not reflect average class%
size because the total number of teachers includes "coverage" needs.)
The increases translate into larger classes, more classes that
excee normal contractual size limits, less personal attention and
fewer subject offerings. The school budget wOuld need an additional
$226 million next year to achieve the 1974-75 pupil-teacher ratio.
Table 2 shows a similar comparison for tax-levy funded guidance
counselors. The loss in the community school districts has been
dramatic, with a 31 percent increase in the number of students per
guidance counselor in the junior high/intermediate schools. If the
ratio of students to guidance counselors were at the 1974-75 level --
which Many argue was insufficient -- the community school districts'
budget would need to be almost $6 million higher next year. While
these tax levy positions have been supplemented in past years with
federally reimbursable positions, recent federal budget cuts have now
eroded this source of funding.
Additional teacher time needed to cover it class when the regularteacher is doing administrative or preparation duties.

-3-
Table 3 shows the change in the level of,tpx-Xevy-funded instruc-
tional paraprofessional services. Thenumber of-hours available per
student did rise seven percent in the junior high schools, but fell
11 percent in the elementary schools. Coupled with the loss of
teachers alrekidy discussed, this decline further reduces children's
opportunities for individual instruttfon. It would cost approximately
$4.5 million more next year to maintain the 1974 service level in
the elementpry schools.
These are only a few indicators of the service reductions that
currently remain unrestored in the public schools. But even a return
to 1974-75 service levels would not repiesent a comparable situatfon
in the context of increasing technical demands and contracting
employment opportunities.
In the following pages, as we analyze the proposed budget and'
pue'forthour _recommendations for new funding priorities, our under-.4p*,4104,,
lying premise is that we must t4ke acivantage of the improvihg econom4c
conditions and begin to move forward not only to regain what,has been
lost, but also to prepare students better for a productive adulthood.

TABLE 1
CHANGE IN PUPIL.ATEACHER RATIO1974-75 to 1982-83
Pupil-TeacherRatio1
Community School Districts
High Schools
1974-75 1982-83 % Change
23.5 28.1 +20%
22.9' 25.4 +11%
Additional teachers needed tOmaintain 1974-75 servicelevels: 5,,420
Average teacher salary $29,400
1983-84 Cost (Approximate): .$226 million
1 Regular classroom te s, from Modified Budgets. (CSD figuresinclude special educe on teachers and students, while high schoolfigures do not.) Registers from OSIS, Educational ManagementInformation Unit.
TABLE 2
CHANGE IN TAX LEVY FUNDED GUIDANCE COUNSELORS
(Ratio of
1974-75 to 1980-81
Students per Guidance Counselor)
1974-75 1980-81 % Change
Elementary Schools 1,111:1 1,450:1 +31%
Junior High Schools/Intermediate Schools 728:1 883:1 +21%
High Schools 949:1 761:1 -20%
Additional district personnelneededito provide 1974-75guidance service levels: 139
Average salary $29,400
1983-84 Cost (approximate): $5.7 million
Source: School Profiles, 1974-75 and 1980-81, Wird of Education

1
-5-
TABLE 3
CRANGE /N TAX-LEVY-FUNDEDINSTRUCTIONAL PARAPROFESSIONAL TIME.
1974-75 to 1980-81
(Hours per Pupil)
1974-75 1980-81- % Change
Elementary Schools 15 13.3 -11%
Junior High Schools/Intermediate Schools 8.6 9.2 + 7%
Additional hours needed inelementary schools to maintain1974-75 service levels:
Average hourly wage:
1983-84 Cost (approximate):
640,32R hours
- $7.00,
$4.5 million
SourCe: school Profiles, 1974-75 and 1980-81, Board of-rducation
1 u

4
Education in the City Budget
Before we examine the specific items in this year's Executive
Budget for education, it is revealing to compare the Board of Fducation's
budget to total proposed city expenditures. What is the City's commitment
to education as a priority service? How do expenditures for education
compare to other vital services and city spending in general? Is the
city making the necessary investment in our public faudents as it builds
services back from the nadir of 1975-76?
A comparison of the April Executive Budget with the January Financial
Plan clearly reveals that the Mayor has placed the highest priority on.avoid ng the devastating education cuts forecast in the preliminary budget.
d of Education has received 56.8 percent of the total citywide'
regtorgtion s to the January plan, and 51.3 percent of the funds for new
needs. knd the Board's share of the remaining budget reductions is
proportional to its share of total city expenditures.
However,/if we are to look at eguitx positively in terms of actual
funding, not negatively 135/ measuring cuts, we must compare the Executive
Budget to prior actual school expenditures. ReE;toratibns tc, the January
Financial Plan are misleacpelbeceuse the plan imposed on the Board of
Education an overwhelming share of the Draconian cuts demanded by the
Financial Control Aoard.
If we compare the number of positions funded in the Executive Budget_3to previrs years' staffing levels, instead, ducationdcies not fare as well.
, ..
According to Table 4, the Board would have 384 more full-tisr
pedagogic staff if its staffing increase were as great as the cit 1'W ide'
average cncrease in personnel since June 30, 1982, or 220 more if
- --.\use February 28, 1983 as the base.

4
CitywidePositions
DOE TotalPositions
ROE PedagogicPositions
4 I t
-7-
:TABLE 4
City and Board of Education Staffing Levels
Change toExecutie
Payroll Budget6/30/82 FY'84 Change e
196,151 +665 +.3%
es,
70,891
64,751
L,
- 801
- 11O
I.
Payroll2/28/83
194,135,
Change toExecutiveBudgetFY'84, Change
+2,681
70,184 ' -94, -
+674 +1:1%
$ Change(000's)
% Change.
to*
TABLE 5
City, Education and Uniformed Services Spending Levels
Change in Actual Expenditures F,Y 1982 toEmelcutive Budget FY 1464
Total City DOE Police
(less debt serviceand pensions)
+1,681,777'
+14.2
Fire Sani teflon
+408,879 +152,080 +70,269 +50,411
+13.7 +19.0 +17.3 +15.0

.5.
.o
- .5
) City and Board of Education Staffing Levels ,
% ChangePayroll 6/30/82 to
Executift Budget FY 1984S.
-1.5Citywide BOE TotalPositions Positions ,Positions
BOE Pedagogic
4
% ChangePayroll 2/28/83.to
Executive Budget FY 1984
CitywidePositions
BOE Totale agE Pedagogic'Positions - POsitions
Ciiy, Education and Uniformed Services Spending Levels
% Change inActual Expenditures FY 1982 to
Executive Budget FY 1984
20.01
18.016.0'14.012.010.08.0
4.0
2.00.0
Total City,
(less debt serviceand pensions)
Police Fire Sanitation
1 3

-8-
If we look at dollar expenditures in Table 5, the sane disparity
is evident. Expenditures for.the Board of Educgtion rose at a slightly
lower rate-sinos-FY-T982 than total City spending. If education
expenditures had increased at the same rate as the overall city's
expenditures, the Board of Education would have an additional
$16,224,000. When we compare,education to othe'r vital services, wetl
see that the Board Of Education could have done considerably better.
If expenditures had grown as fast as Police, Fire or Sanitation, the
education budget would .include $160 million, $109 million or $40
million more, respectively.
EPP Tax Policy
Over the past seven years EPP has fashioned an education budget
strategy which called upon each level of governmellit to do its part
to protect classroom services for children. We have called on the
\ Board of Education to reorder its priorities, make Adminiftrative cuts
and shift dollars into services.. We have asked the city to place a
higher priority on education.by reduqing its PEG targets and adding
additional funds to the education budget. We have called upoil the
state to move toward a more egUitable distribution of State aid and
have urged the feftal government not to abandon its financial commit-
ment to public education. In each of these areas, save the last, we
have.achieved some succe8s. Yet it is federal tax and spending
policies which have caused the gap in the city budget. Therefore,
this year, in addition to calling on the Board of EducatiOn, the city
and the state to protect classroom services for children, we ask the
citizens of New York to be mindful of the impaCt of the federal

-9-
reductions and to support cost savings wherever possible and local
taxes at the minimum level necessary to preserve current levels of
vital city services.*
City Tax Revenues.
According to EPP estimates, tax revenues from existing taxes
will be higher than the city has assumed in the Executive Budget.
Independent revenue projections made in May 1983 by EPP con-
sultant Georgia Nanopou1os-Stergi6u, for both fiscal 1983 and 1984,
indicate that the city's budget projections may be low by $25 million
in fiscal 1983, and from $96 to $158 millicn low for fiscai 1984.
(See Table 6, p. 12)
For fiscal 1984 the Executive Budgetprojects locally-derived
revenues of $10.222billion, an increase of $418 expected
fiscal 1983 revenues This increase is a result of expected growth
in the general property tax (+$190 mik).ion), the general corporation
tax (+$103 million), the 'sales tax (+$45 million), and the personal
income tax (+$124 million). Xhe expected total net increase is
rodghly three-fourths of the revenue increase experienced in the
last several years.
For the current fiscal year, the city expects to receive $9.804
billion, a growth of $455 million over fiscal 1982. (See Appendix 1.)
Because her model has previously underestimated reventis in the
recovery years following each of the last three recessions, ProfessorP
0 Stergiou projects a range of estimated revenues to account for the
* Tbe Queensboro Federation of Parents Clubs, by an unofficial votes,does not concur with a policy that calls for new taxes.
err
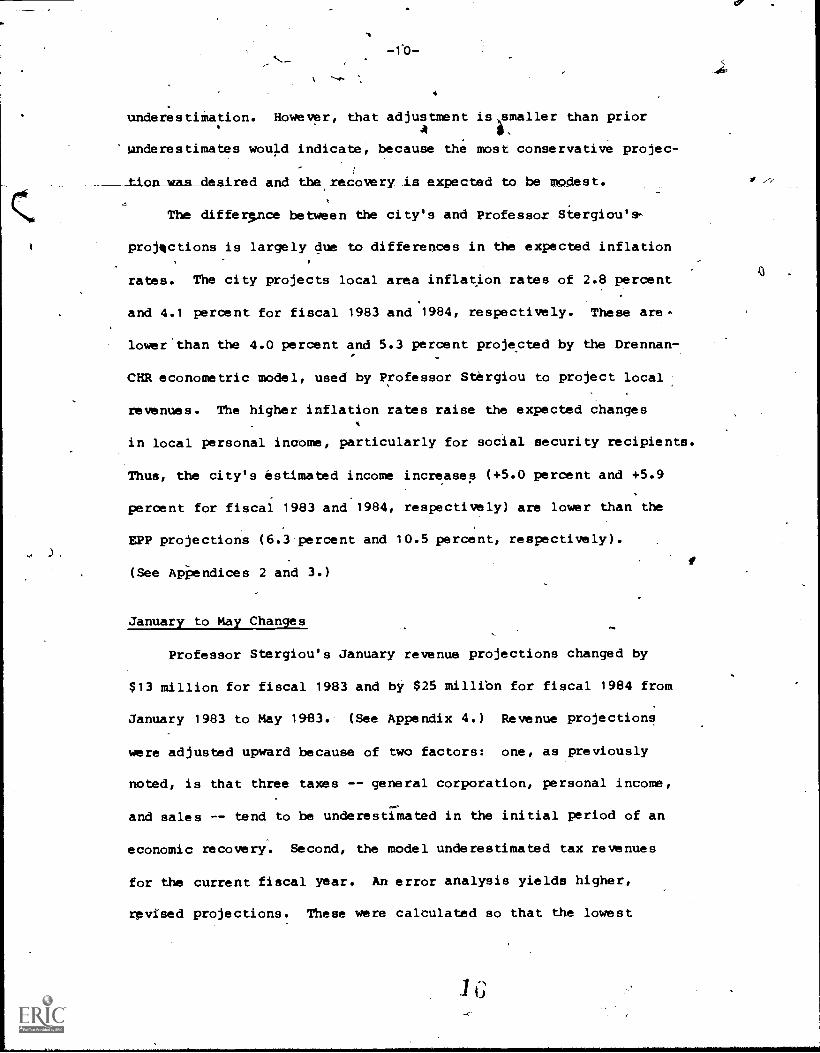
underestimation. However, that adjustment is >smaller than prior
underestimates would indicate, because the most conservative projec-
_Lion was desired and the, recovery is expected to te modest.
aThe di f fe realce between the ci ty' s and Professor Stergiou'
projections is largely due to differences in the expected inflation
rates. The city projects local area inflation rates of 2.8 percent
and 4.1 percent for fiscal 1983 and .1984, respectively. These are -
lower.than the 4.0 percent and 5.3 percent projected by the Drennan-
CHR econometric model, used by Professor Stergiou to project local
revenues. The higher inflation rates raise the expected changesA
in local personal income, particularly for social security recipients.
Thus, the city's estimated income increases (+5.0 percent and +5.9
percent for fiscal 1983 and 1984, respectively) are lower than the
EPP projections (6.3 percent and 10.5 percent, respectively).
(See Apiendices 2 and 3.)
January to May Changes
Professor Stergiou's January revenue projections changed by
$13 million for fiscal 1983 and by $25 millibn for fiscal 1984 from
January 1983 to May 1983. (See Appendix 4.) Revenue projections
were adjusted upward because of two factors: one, as previously
noted, is that three taxes -- general corporation, personal income,
and sales -- tend to be underestimated in the initial period of an
economic recovery. Second, the model underestimated tax revenues
for the current fiscal year. An error analysis yields higher,
revised projections. These were calculated so that the lowest
1 G

41-
additional yield was used to establish an upper revenue projection
rkmi t, the most conservative approach.
Therefore , the EPP recommends that the ci ty add $1 00 million to
its budgeted revenue estimates fOr 1984. We believe this addition is
well within tlelbounds of prudent budgeting, While enabling New Yorkers
to enj'oy somewhat improved services in 1984.
or
-12-
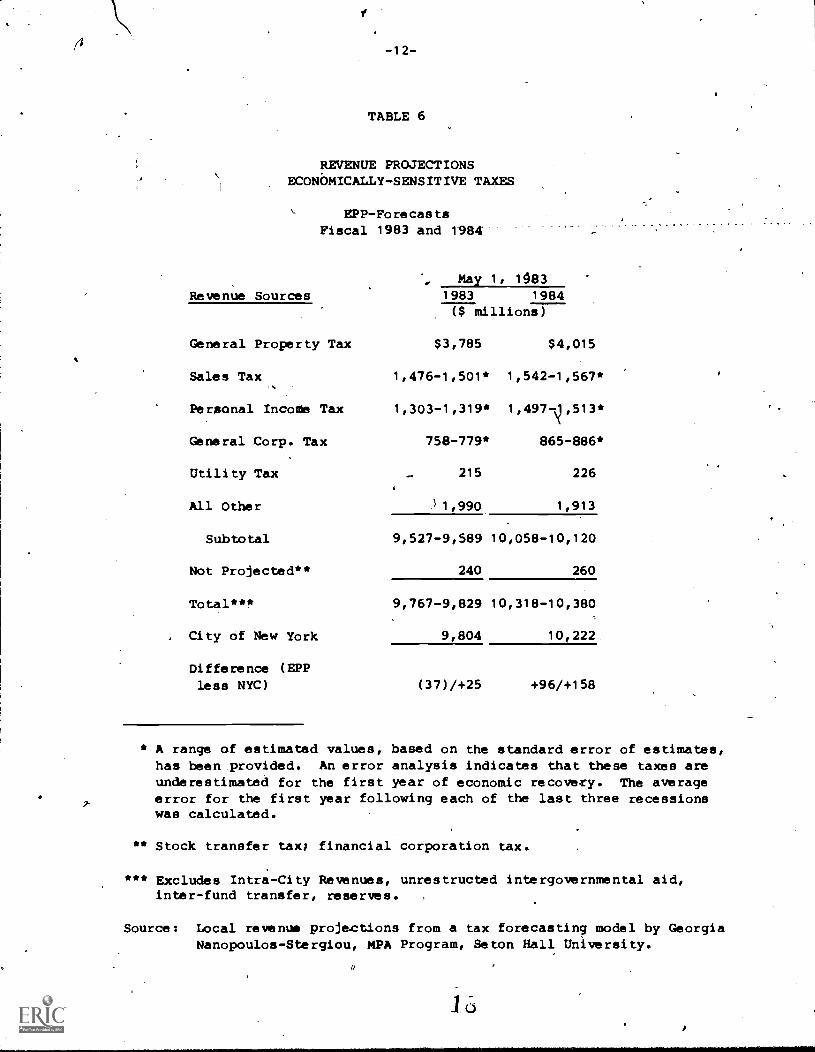
TABLE 6
REVENUE PROJECTIONSECONoMICALLY-SENSITIVE TAXES
EPP-ForecastsFiscal
Revenue Sources
1983 and 1984
". May 1, 10831983 1984($ Millions)
General Property Tax $3,785 $4,015
Sales Tax 1,476-1,501* 1,5421,567*
Personal Income Tax 1,303-1,319* 1,49711,513*
General Corp. Tax 758-779* 865-886*
Utility Tax 215 226
All Other ) 1,990 1,913
Subtotal 9,527-9,589 10,058-10,120
Not Projected** 240 260
Total*** 9,767-9,829 10,318-10,380
City Of New York 9,804 10,222
Difference (EPPless NYC) (37)/+25 +96/+158
* A range of estimated values, based on the standard error of estimates,has been provided. An error analysis indicates that these taxes areunderestimated for the first year of economic recovery. The average
7 error for the first year following each of the last three recessionswas calculated.
** Stock transfer tax; financial corporation tax.
*** Excludes Intra-City Revenues, unrestructed intergovernmental aid,inter-fund transfer, reserves. ,
Source: Local revenue projections from a tax forecasting model by GeorgiaNanopoulos-Stergiou, MPA Program, Seton Hall University.

-13-
ikII. PROPOSED EDUCATION BUDGET REDUCTIONS SUP ORTED gY EPP
The Educational Priorities Panel seeks'to save money in adminis-
trative costs at the Board of Education wherever pos4ble for two
purposes: first, to preserve classroom services; and second, to help
the city-reduce expenses in difficult financial times.
Of the $81 million of reductions the Mayor has:proposed for the
Board of Education, the Panel supports $52.4 million because they would
not.substantially affect classroom services. In addition, we recommend
another reduction of $2.5 million not included, in the city's proposal.
(See Table 7, page 22.)
Admittedly, with an apparent slowdown in enrollment decline and
*) after years of trimming administrative fat, such savings will not
come easily. Recent years' aufbmatic savings of $25 million a year
from the loss of 15,000 to 20,000 studgnts will not be available this
--ryear. The formerly simple task of reducing excese adMinistrators
through attrition must give way to a more aggressive policy of
trimming, careful plan'ning, and improvement in operating procedures.
The proposed cuts can be achieved, but only with commitment and
close attention.
For the past evera1 years, the city has put forth proposals
for savings some of which the Board has accepted but never implemented.
The ,problem is that, when budgeted administrAtive reductions are not
made, or are nOt made in a timely manner, the required savings will 7*.
eventually have to come from service reductions. And often, when
those shortfalls are not discovered until halfway through the year,
the reductions that have to be made are twice the'magnitude of theF-
t.

-14-
original proposa-1 in order to reach the savings goal in the remaining
half of the year. The EPP strongly objects to such a management
strategy. The Board cannot delay implementing administrative
Preductions in hopes of a last minute "bail-out." Administration
reductions should be planned vasll in advance. If additional revenues
do come in, the new money can be used for services instead. The
actions required to correct midyear deficits are extremely disruptive
to student services and are inimical to the kind of planning that
produces quality education.
In the following page's, vas outline the recommended savings,
several of which have been proposed in prior years. We urge the
Board to plan now so that the full value of these savings can be
realized, and we call upon the new Chancellor and his administration
to commit themselves'to that goal.
1. Administrative Reductions $18.8 million
kThe c ty proposes a $19.5 million savings in 'district and non-
11-- school based administration, to be achieved by reducing districts'
administration to their 1980-81staffing levels, and central officesIN
by, 20 percent. The Panel supports the full $14.8 million from the
central administrative reductions and $4 million of the $4.7 proposed
for the disbricts.
The city Office of Management and Budget (OMB) has identified
an increase of 26 percent in the size of community school district
administrative staff between fiscal years 17981 and 1983, from 573-
positions to 722. Administrative costs have risen by 32 percent, from
U

- 15-
$21.41 per pupil to $28.16. OMB identifies $4.69 million in savings
that would be realized by returning to the $21.41 per pupil expenditure
level. This means 26 fewer administrators, a 10 percent reduction in
administrative personnel. This level is lower than 1981's staffing
level because of rising costs. Because 4istrict enrollment has re-
mained fairly constant since that time, the Panel supports a reduction
to the 1981 staffing levels, rather than the 1981 expenditure level.
The savings achieved by this reduction would be $4 million.
elThe reduction of non-school based administration, which explicitly
excludes school safety, tiansportation and food services, would mean a
reduction'of approximately 550 administrators from central administrative
offices, the Division of High Schools, the Division of Special Education,
the Office of Pupil Personnel Services (excluding security officers and
attendance teachers) and the Office of Promotional Policy. It is the
EPP's position that the first step in Yealizing this saving must be
the clearing of vacant adminiltrative lines from fhese offices, as the
Board did successfully in 1979. As of,December, 1982, there were more
than 200 vacancies in these offices. Reducing the Board's administrative
positions by this number would reduce the budget for administration
without any effect on filled positions. The remaining cutbacks,
approximately 350, would mean only a 13 percent reduction in filled
administrative positions. Of course, the new Chancellor should be
allowed the flexibility to fill the positions of his choice within tha
level of staffing, adjusting budgeted lines as necessary. However, this
must not affect the overall reduction in administration.

41.
-16-
While seemingly straightforward, administrative reductions seem
to be the most difficult for the Board to implement, as shown by
the experience in this year's midyear budget shortfall. Although
the Board implemented a seven percent reduction in August 1982,
it had hired more than 130 new administrators during the preceding
three morkths. When the titre care for actions to reduce expenditures
in February, potential savings were greatly reduced: only four
months of savings could be realized instead of a full year'k. and
unemployment insurance had to be paid to people who were laid off.
This year the proposed reductions must be taken before the school
year begins. Of course, existing staffing levels-should not be
increased bbtween now and the end of the current fiscal year. The-11)
City Council and Board of Estimate should be provided with reports
of how these reductions have been implemented, followed by payroll
data.
2. Consolidation of School Buitaip55 $1.7 million
The Panel supports OMB's recommendation to save $1.7 million
through school closings and/or reorganizations. Although the dollar
saving for this proposal is small, its c lative effects are
important, since savings will continue each year. The cit has
made this proposal in each of the past three years and the ard,
while accepting it, has never carried it out.
There are currently more than 200 elementary and junior high
schools operating at less than 60 percent of capacity. While
selecting schools to close is always difficult, this large number
leaves wide latitude, since only ten schools need to be closed to
-17-
reach the proposed savings. In 1980, the City Planning Department
estimated that closing an elementary school would save pproximately
$100,000, and closing an average-sized junior high schoo would
save $200,000. Since then, custodial costs have increased more than
15 percent due to new contract settlements, increasing the potential
saving.
While OMB is focusing on closingNelementary and junior high
schools, the Panel recommends that high schools also be considered.
Though high school enrollmenir have declined by roughly 50,000 stu-
dents since their peak in 1976, there has been no reduction in the
number of vocational and academic high school buldings in use.
Therefore, there is space to allow some building consolidation.
Another reason for considering closing high schools is that since
the bdlidings are larger than the lower schools, the savingS realized
are greater. The major savings achieved by closing a school building
are custodial and energy costs, which are far greater for the high
schools because of the larger size of the buildings. The exact level
of savings depends oh the individual school chosen, and the offsetting
costs of moving, securing the building and transferring it tp new use.
The City Planning Department estimated in 1980 that closing a high
school would, on average, gisnerate $300,000 in savings, three times
the savings realized from closing eletientary sdhools. Closing high
school buildings would reduce the total number of schools that need
to be closed to achieve the required savings.
The projected savings eire based on a full school year. The
process of closing schools i difficult and time consuming, as the
2,3

-18-
-
EPP noted in its 1980 study, but it ca, . be done successfully.
Having accepted this reduction, the Board must follow through
immediately with the necessary procedures so that the buildings
can be closed and alternative uses found.
3. Special Education $5.7 million
Of the $10.5 in savings in special education proposed
by OMB, the Panel endorpes $5.7 million to come from Medicaid reim-
bursements for school health seivices to Medicaid-eligible special
education students. Before discussing savings in special education,
an important caveat must be made clear. Reductions are possible only
if the city meets its commitment to 'fund 'all mandated costs. This
cortunitment was made for the current year, 'and was ultimately met.
For next year, the city has pareadY added $40 million to the special
education base budget and has .committed an additional $25 million
to be provided when special education classes are established, and
more if there are new needs. Recent rulings in the court cases
involving special education are enforcing legal requirements-on the
system, the financial effects of which cannot be precisely predicted.
The city and the Board must continue their cooperation as developments
unfold. Children with handicapping conditions must be appropriately
served. The city's promise to cover necessary costs, however, does
not oOviate the need for the Division of Special Education to stream-
line JAE; management wherever possible.
The proposed saving is to come from state Medicaid reimburse-
ment for school health and testing services provided to Medicaid-
eligible special education students. The city has based its estimate
of savings on the cost of the Board's contracting out to current

-19--
medicaid providers. However, the Panel believes that such a plan
would discriminate against the tkdicaid-eligible children: instead)
of being served with their peers, they would have to leave the school,
which would stigmatize them and disrupt their school day. Instead,
the Panel favors the Board's plan, which is to obtain Medicaid,.
provider status in order 'to be, reimbursed for sertrices provided in
the schools, so that all children would receive the same services in
the same manner. The city and the Board must work actively to get
approval from -ihe state for provider status. With plans,the Board
4'
has been developing for the past several years, the three months
remaining before the start of school shoiild be sufficient time to
receive state approval and prep'are for the nedessaiT administrative
procedures. However, once again, this savings will be realized
only if the approval is iggressively pursued in Albany -- a mere*
pro forma request will no elicit the desired response.
4. Annualization of Midyear Reductions $4.2 million
As part of itibudget balancing reductions in February, the
Board implemented a series of budget reductions. OMB has estimated
the annual value of those savings at $4.2 million, an estimate
that the Board hajaccepted. The Panel endorses this saving, in
addition to the 20 pe
the coming year.
t administrative reduction proposed for
5. Enrollment Decline $10.2 million
The City and Board of Education have agreed on a $10.2 million
saving that will be relizedfrom an enrollment decline of 5,000

lo
-20-
students. This is the net change that is anticipated from growth
in the districts and continued decline in the high schools.
6. Reduction in the Promotional Policy due to LowerEnrollment Estimates $7.2 million
The October 1982 enrollAent in Promotional Gates classes was
18,300. T5is was 7,200,seats below the 25,500 assumed in the summer
allocation for the Promotional Poiicy. As a result, expenditures
were approximately $6.7 million below projecti6hofor the current
year. OMB is assuming that the registe% will remain stable in the
Gates claWses and is therefore estimating a savings of $7.2 million
for next year (factoring in the increases in salaries). The Panel
supports this reduction, with'the understanding, as explained in
the Mayor's budget message, that this will not reduce the funds
originally scheduled in the Promotional Policy Unit of Approprkstion
that were later transferred to the districts' U/A for early childhood
programs. These funds were removed from the Promotional Policy's
U/A before the $6.7 million saving was realized and are unrelated
'to the avings in the Gates classes.
7. Savings Outside of the Board of Education'sResponsibility $5.6 million
While the Panel has not analyzed the impact or feasibility of 4'
savings proOased for the Fashion Institute of Technology ($877,000)
or the savings in pensions ($4.7 million), it bases its approval
of these savings on the expectation that these reductions will be
taken in a manner that will not affect th4lBoard's available funds.

-21-
8. Board of Examiners $2.5 million
The Panel supports one,additional administrative reduction that
is not included in the Executiire Budget: elimination of tax levy
funding for the Boird of Examiners. Of course, the Panel recognizes
that quality education depends on having a meano/for identifying and
hiring the most qualified gersonnel, but the existing system run by
the Board of Examiners fails to provide a meaningful review. Moreover,*
New York City is the only school system in the state that.is forced
to shoulder the cost of its own testing system. Since teacher
licensing and certification are state mandated, the Educaeional
Priorities Panel maintains that the state must develop and fund a
new system that leads to the selection of the most qualified candi-
dates. The city and the Board must make new state legislation a
priority in their legislative programs if we are to be relieved of
what is, in essence, an.unfair tax on New York City residents.
a
2 7

-22-
J.
TABLE 7
EDUCATION BUDGET REDUCTIONS SUPPORTED BY EPP*
4
A. OMB Proposed Funding Reductions.Supported by EPP
1. Administrative Reductionsa. Reduction of community school district
administration 6-b. 20% reduction in non-school based
administration 4.2. School Consolidations3. Medicaid reimburiement for Special Educat4. Annualization of FY'83 reductions5. Enrollment Decline -- 5,00d studen6. Reduction in Promotional Policy due to
lower registers ,
7. Savings outside the Board of Education'sresponsibility- Fashion Institute of TechnologY(,- Pension adjustment
Total Proposed Reductions Supported by EPP
B. Additional Reductions
1. Elimination of,the Board of Examiners
TABLE 8
($000,000)
$ 4.0
14:81.7
5.74.2T0,2
7.2
5.6
$52.4
2.5
$54.9
PROPOSED EDUCATION FUNDING REDUCTIONS OPPOSED BY EPP*
1. Use of federal funding increases to reducetax levy expenditures $21.0
2. Increased school lunch prices .6 -
3. Special Education Mainstreaming 4.74. Remainder.of community school district
Administrative reduction .7
$27.0
* Tables 7 and 8 do not add to the full $81 million Board of EducationbUdget reduction because of rounding and technical adjustments.
23

-23-
III._ PROPOSED ,EDUCATION BUDGET...REDUCTIONS OPPOSED BY EPP
1.
I/There are $^274O million in reductions proposed by OMB that the
EPP opposes beCause they would dire4,tly affect services for children
(see Table 8, p. 22). They are included in the.three items,discussed
below. However, since the EPP has identified $2.5 million in addi-
tional savings from elimination\of the Board of Examiners, tihe... net
sum needed for restottions is $24.5 million.
1. Substitution of Tax Levy_Fundingwith Federal Chapter I Funds $,21 million
At the beginning of the 1982-83 school year, federal Chapter IJ
(formerly Titie I) funds for remediation were cut drastically 4nd
the programs throughout the, districts and high schools were reduced.
Subsequently, new appropriations were made by Congress to correct
the inequities in the formula used by the Department of Edlation ,to
distribute aid. These funds were not available to the Board of
Education until midyear at the time that the schools were strilyling
to avoid a deficit. The funds were used to fill the projected
budget gap, rather than to re-start remedial programs, which would
have brought services back only to last year's leyel. This year,
the city is proposing that $21 million in federal ChaPter I.funds .
continue to be used to replace tax levy funding. These'programs
may be "supplemental" when 'compared to the regular program, but
they are not supplemental to the city's prior remedial efforts.
Although the dollars would be targeted at the appropriate popula-
tions, there.is a net decrease in remedial services. -The city
29
40

-24-
should provide the $21 milliOn in city tax levy funds for remedia-
tion so that the federal dollars can be used for truly supplemental
, services.
There is a sgreat need for additional remediation services, as
the promotional gates program has made clear in the last two years.
The EPP believes it is especially important to provide ad' tionaV
serVices to those fifth and eighth graders who barely passed the
promotional gate in the fourth and seventh grades and those/who had
to repeat those grades. Their need for remediation does/not end
once they have passed the test, and they will continue' to need
added support for the following year at least. Another group in
reed of additional retrediation is those--eighth end ninth graders
who are in danger of not meeting high school admissions criteria.
2. Annualization of Midyear Service Reductions -School Lunch Prices $.6
In addition to the administrative reductions discussed in the
previous section, the Board of Edudation met its required February)
funding reductions by increasing school lunch prices by five cents.
P The Panel opposed this service re4Uction at the time it was imposed
becau.se it was an unfair tax on poor p4ldren. lms estimates that
the annualized value of this reducti n is $.6 million. Now that
the city's revenues are increasing, and with increased state
aid for education, the reduced price should be restored.,
3. Special Education Mainstreaming $4.7 million
The city ha's proposed2a savings of $4.7 million to be achieved
by placing 8,000 incoming special education students into mainstreamed.
settings instead of self-:contained classrooms.
u

-25-
-The-Panel-belie-we-this saying-is illusory. There is no proof
that mainstreamed settings cost less, considering the mandated support
services that must be provided and the fact that state aid for main-
streamed children in resource rooms for only part of the day is con-
siderably less than the aid for children in self-contained classrooms
all or most of the day. In addition, until more exact projections of
the number of special education students tb be placed are available,
any estimates of savings must be extremely teinuous. The EPP supports
management savings in special education (the 20% administrative
reduction being required for oentral divisions will affect "the
Division of Special Education as well), but not savings that will
diminish needed services for children.
4. Commtinity School District Staff $.7 million
The Panel oppose's $.7 Million of the $4.7 millibn reduction in
community school district administration, as exprhined on p. 14, to
allow districts to reduce staff to 1981 levels, rather than to return
to 1981 spending levels.
3 .o
-26-
IV. EPP INITIATIVES FOR 1964
Restoring $24.5 Million to the Board's budget as the EPP recommends
would allow the schools to maiAain their current level of services.
However, it would prdvide funds for no new programs, no expansion of
existing programs and no progress in nsturning to the level of service
offered before the city's 1975 fiscal crisis. Such a standstill situation
would, in fact, be a step backwards for the city's school children, in
the context of increasing technical demands and contracting employment
opportunities.-0The rising national tide against educational "mediocrity"
reflects the recognition that quality education is a necessity in today's
society. We cannot be satisfied with "holding the line." The Educational
Priorities Panel calls on the City Council and Board of Estimate to propose,
and the'Mayor to endorse, $24.6 million in new school services -- $17.8
million for the lower grades-i and $6.8 million for the high schools.
The programs the EPP recommends below are not simply nsvivals of
pre-1975 services.' They represent new priorities that grow out of the
lessons we have learned and the needs,that have emerged during the past
several years. Although many of the services lost were extremely valuable
for schdol children,:the members of the EPP, recognizing the need to select
only a few among many desirable programs, have chosen these initiatives as
the test ways to use limited available funds.
Early Grade Initiatives
1. Reduced First Grade Class Size $17.8 million*
Early gra", preventive programs are the.most important,finitiatives
that the schools can undertake. They benefit children and they conserve
school resourCes.
* Excess cost based on starting teacher salary for eWly hiredteachers. %
.1
-27-
The Panel asks the City Council to allocate $17.8 million to
the districts so they can have the opportunity to move boldly to
reduce first grade class sizes. This sum, added to the districts'
Module 2 allocation, would allow for an average of 25 children in a
class, excluding special education classes, as detailed in Table 9.
The experiences of children in their first few years in school
may shape the rest of their academic careers. Problems that arise
in later years often have their roots in the early grades; in fact,
experie7ed teachers can often identify potential problems in a child's
first year of school. Giving children extra attention early can pre-
vent many of these problems and also further the development of children
who are gifted or talented.
The additional cost of reducing class size to 25 for all first
graders is $259 per child. This expenditure can help eliminate the
need for much more costly remedial programs later. For example, the
Board estimates that the additional cost above the basic expenditure
for educating each first year Gates holdover is $1,000. The State
Education Deparcment estimates that resource room services cost about
twice as much per child as regular classroom services. So, though it
takes a large sum of money to start a program of reduced class site,
that investment yields savings.that are much greater in the,long term.
Although the need for remedial programs will never be entirely eliminated,
by reducing the number of students participating, the services that are
available can be concentrated cn those with the greatest need. Of course,
this initiative would have an even greater impact on student achievement
ife_An subsequent years as money becomes available,, class sizes could
be reduced in the other primary grades as well.

-28-
TABLE 9 1.
Ebtimated New Costs for ReducingFirst Grade Average Class Size
to 25 Studentatin the 1983-84 School Year1
NEW TEACHERS REQUIRED 712
COST OF NEW TEACHERS $11.82 million(Number of Teachers x Average Starting Salary)
BREAKAGE ALLOCATION .59
(5% of allocation)
OCCASIONAL ABSENCE COVERAGE .32
(Number of Teachers xi8 days x AverageSubstitute Rats)
FRINGE BENEFITS AND PENSIONS AT 40% 5.09
TOTAL COST $17.82 million
1 Based on the district allocation formula, assuming an averagestarting salary of $16,600 (present starting salary plus 15%for contract increases), and a first grade register of 70,000.

-29-
_
Today, many elementary school-classes contain- 35 to 40-Children
although the average class size is lower.* Teachers cannot treatA
children as individuals when they are forced to manage a class of
35 or 40. And-children find it difficult to learn,to read -- the
crucial task of first graders -- under such circumstances. While
research on the value of reduced class size has shbwn mixed results
for small changes, there are significant achievement gains when
classes approabtling 40 students can be reduced by 10 or 15 childrpn.
With an average of 25, many classes would have even fewer students.
Class size reductio'n would be dramatic, especially in tbme districts
that'are now overcrowded, and, we expect, so would the results.
In 1979-80, the city, at the urging of the City Council and
Board of Estimate, reduced first grade class size and now those
children's reading scores are higher than those of their predecessors,
according to the Board of Education's preliminary report of 1982 test
scores. While such a finding alone cannot be accepted as proof
of the program's value, it does strongly suggest that it was an
experiment wortkgmrsuing. Moreover, researchers have found that
with even small reductions in class size, teachers become more\
willipg to try innovative rograms, which in turn gives children
more diverse opportunities to learn.
* The Board of Oudation reported, for 1980-81, an average classsize of 29. L-This average is depressdd by the much-smaller specialeducation classes.
.-0
-30-
No additional funds.
2. Expansion of Full Day Kindergarten Value: $5.3 million
-V
Vith substantial new funding given to,the distric s to reduce
first grade class size, the stall allocation in Module 5B for this
purpose would no longer be necessary. Instead of reducing the 511
allocation, we propose that those funds be use to expand full day
kiddergartens, one of the programs that districts can fund from
Module 5B. This year, districts spent approximately $4.5 million
of the module on reducing first grade class size. Leaving these
funds in the module and increasing ttrm to reflect the new contract
settlement would mean an additional $5.3 million available for full
day kindergarten classes. This would pay for enough teachers to
create 360 additional full day kindergarten classes, for a total of
640, which would more than double the exihting number of 280.
many parents and educators place a high priority on full day
kindergartens because they are very beneficial for many children.-
The increased Opportunities for socialization, reading readiness
experiences and cognitive development are the primary benefit*.
Other benefits include the advantage for working parents and the
introduction to public schools for many parents who Fight otherwise
send their children to private kindeigartens and then retain them,
there for the rdst of their schooling.
The Panel has a long-standing position in support of full day
kindergarten. The new Chancellor has also cited full day kindergarten
as an important priority for'his new administration, and we agree
that'districts should be able to expand their offerings.

High School Initiatives
So far, the Panel's initiatives have addressed the needs of
children in the early grades, where the foundation for a good
0
education must be laid. However, the same principles of respond-
ing to different students' needs and providing appropriate programs
must be carried through in every grade. Appropriate programming
includes training in specific subject areas, career and college
preparation, ongoing efforts to identify personal and learning
problems, and reMediation for those who need it.
In recent years the Board and city have made signifigant strides
in offering appropriate high school programs in two areas -- in
vocational education and in remediation. The Panel has followed
these dsmelopments carefully and offers several new initiatives in
these areas.
1. Expansion of Vocational EducatiOn Opportdhities $4 million,
The Panel asks the City Council to restore $4 million to the
BoareS budget for the expansion oftvocational educatfon opportuni-
ties. This year, following recommendations made by the Panel,
the state increased its reimbursement fg6rocational program costs.
This reform, which is an important first step in achieving parity
between city and non-city funding formulas, added $7 million to the
Board's state aid. With thesi funds available to finance existing
vocational programs, the city can allocate a portion-of its tax
levy dollars to fund vocational services that are not eligible for
state funding. The Panel asks the City Council to allocate funds
for expansion of the TOP program and fdr increased supplies /tali-
3
-411%
-32-,
support services for vocational programs. Each of these is explained
in greater detail below.
a) Expansion of the Training Nprtunitiesprogram $ .5 milliont
The Panel recommends that $500,000 be allocated for expansion of
the Training Opportunities Program. Based on the Board's evaluation
and on the Panel's own monitoring efforts, the,program has successfully
mot
placed students in real work experie s. These placements acquaint
students with the appropriate beha--or and responsibilities of holding
job,.as well as giving them training not available in the schools7
and opportunities to work on equipment that the schools cannot afford.
Recognizing the quality of TOP, the State of New York has ranked it
first in the state in the compeation for the U.S. Department of
Education Secretary's Award.
In addition, the funds allocated to the program have been maximized
in two ways: first, by identifying employers who can receive Targeted
Jobe Tax Credits for their student workers, eliminatipg the need for tax
levy salary supplements; second, py Matching schools' allocations for
teacher monitoring and counseling time to the actual number of'studenta
participating. Because olf ylese savings, the program has been able to
expand into additional achoole. at no additional cost. The need for,
these kinds of placements is cleaebecause many:programs have been
asking to become part of TOP. The small allocation being requested
can increase the the number of children served from 1,500 to approxi-
mately 2,000, giving them the real world opportunities that often make
them qualified for their first job and able to receive the greatest
value from their formal education.

-33-
b) VIcational Program Supplies $2.5 million
A major constraint on vocational programs is the lack of money
for supplies. Virtually every program has necessary Other Than
Personal Service expenditures (OTPS) -- wire, fuses and Components
for electronic/programs, test tubes, bandages and microscope slides
for health career programs, materials and instructional manuals for
data processing courses, and so on. The Board's allocation formula
used to determine OTPS funding has not been updated for more than 10
years, and so bears no resemblance toPreal costs. Even worse, the
actual allocations are reduced by as much as 50 percent below theS
formula-driven levels every year due to lack of funds. Table 10
shows the formula allocations for the occups;Apstritreas4 which, in
1982-83 were reduced by almost half. This means that schools
received less than $2.00 per student in a shop program, and slightly
more than $1.00 each for students in business programs. A few
examples will illustrate the inadequacy of the funds: 'non-reusable
kit:5.1E1pr students in electronics programs rangs: in cost from $7 to
$40; cosmetology kits cost $25 to $50; sample medical forms for'
teaching clerical skills in medical office assisting programs cost
$8 a set. As the Panel found in its study of vocational education,
Learning to Work, these are typical of the ,upply needs that go unmet
in vocational programs.
The Panel's $2.5 miArlion request includes an inerease of $15
for every pupil in vocatiNal, industrial arts and home economics
courses, plus full funding of all components of the existing OTPS
allocation formula, not lust the career related components. It does

-34-
TABLE 10
OTHER THAN PERSONAL SERVICES -ALLOCATIONS FOR VOCATIONAL EDUCATION
AND INDUSTRIAL ARTS
Business office and secretarialtraining; dental and medicalassisting $2.00.times II of students
times periods per dayDrafting, mechanical drawing,commercial art 2.30
Transportation-aUtomotive,aviation and allied subjects,geheral.shop, maritime trades,repairs, graphic arts & printing,plumbing, coamunications,refrigeration & allied subjects,cosmetology
Ceramics,'crafts, wood, metals,photography, machines'i metalshops, electronics
3.30
4.30
a
Source: Comparative Analysis of the Organization of High Schools,Board,of Education

4.
-35-
not make sense to exbect a school to buy,specialized supplies when
it cannot afford paper for students or phone calls to help improve
the attendance of students at risk of droOping Out. Even the $15 per
student does not reflect full coSts, but will be a major improvement
in the schools' ability to provide vocational programming.
c. Targeted Funds for Vocational EducationDevelopment $1 million
There are many areas in vocational programs where a small amount
of money can lead to much greater bensfits, because the allocation
can bring in resources from outside the schools. For example,
allocation of teacher time for outreach to the business community
brought one city high school an expensive main frame computer. An
additional Unit for vocationaiguidance can prepare students to take
private sector placements, where they benefit from advanced training
and real work experience. More important, the program can attract
stipend funds from the,Private Industry Council or the new'Job Training
Partnership Act. And many of the students, who otherwise would not
be qualified for stipends, will be paid directly by the private sector.
Funds for curriculum development will attract the loan of industrial
personnel to review the curriculum and offer existing private sector
training packages. A small allocation for a technical teacher can
help to transfer a new curriculum from oh4 school to a second, thus
doubling the number of students who benefit from the program. Tile
bottom line is that this $1 million will generate millions in other
funds and improved programs for bens of thousands of high school
students.

Another important use for these funds is to address problems of
sex equity in vocational education programs. EPP's study, Learning
,to Work', demonstrated the need for active outreach and plans to attract
girls to nontraditional fields.
This funding request would allow schools to.develop the opportuni-
ties described. Tbe funds should_be allocated to the discretionary
units of the executive director of the High School Oivision,' who would
distribute units to schools based on principals' plans for their use.
This allocation will.eXten0 the benefits of existing programs to a
broader ,populatn for a minimal cost and will allow the developmept
Of esseatialainks with the private sector.
2. Expansion of summer school opportunities forhigh school age students $2.5 million
-/Summer school programs are already_9,ftgied to high school seniors
)41tohave failed a course and who will not graduate without completing
it successfully. The same option of repeating a failed course should :
be available to all high school students, regardless of their grade, as
r
it was before 1975. Giving students the opportunity to catch up over
the summer will strengthen their chances of moving forward when the
regulr sdhool year resumes.
t(This approach to remediation will require no new curriculum, since
students willbe repeating A specific subject. Methods for notifyingN\
students Of summer school opportunities are already in place for seniors
and.can easily be extended to the remaining students, and school buildings,
will be opened
subjects that
filling\these
for existing programs as well. If courses are offered inV
students frequently fail, there will be no difficulty
classes.
..
-37-
Summer school opportunities should also be made available t
eighth graders who have not met,the entrance require nts for high
school-. Many of these students may have been close meeting the
criteria, andothers may have,fallen below only because of the nature
of the measuring tool used. These students deserve a chance to retake
the tests in August, with additional work over the summer, so that
one test scorem'does not hold them back unfairly. Here, too, the
models exist, based on the seventh grade Gates extension programs,
and the schools will be.open for 'those programs. While there are
clearly problems with the summer Gates programs that must be worked
out, nonetheless, more than 7;000 students were promoted at the end .
of the summer. The programs should be studied to identify how they
can be improved, but meanwhile, they shour be.:expende4 to give at
least some eighth graders a chance to reach die standards for high
school entrance.
3. Expansion of Child Care Servicesfor Student Parents $300,000
Building on the success of the LYFE Program which 'wes funded
within the Board of Education budget last year, the EPP Proposes,
that funds be allocated for three additional child care centers to
address the day care needs of student parents. These centers would
be operated by community-based child care providers using-school
faCilities. (Many,of these student parents are eligible for Title
IV-A child care stipends and when procedures are worked out, it may
be possible to repay the city up to $230,000 with these funds.)
Day care services'.are crucial to keep student parents in jichool and
attending regularly.
r
43
ile;%

-38-
Conclusion
The City Council and Board of Estimate have an important
responsibility now. They can seize the moment and take advantage
of the improved economy, of the spirit that comes with i new
administration, and of the renewed concern of the nation that
our schools measure up to the demands of an incteasingly tychno-
logical society: They can provj.de the funds, as they have in the
past, that will allow odt\public school system to rebuild. Further,
they can provide the funds so the schools) can move boldly to give
-
children a firm foundation to prevent failure and dropouts in later
years-. Or they can not provide the funds and allow the system to
erode in small but telling ways. If they.choobe the latter, however,
we must not bs, surprised if the achoola have to keep creating costlyk
6 new programs for holdovers in the upper grades. And we must not be
surprised when businesses look elsewhere for a more skilled labor
force. The choice and the consequences go together.
4

APPENDIX 1
REVENUE PROJECTIONSCITY OF NEW YORK
Fiscal 1983 and 1984
Fiscal 1983 Fiscal 1984 .
Financial Executive Financp1 ExecutivePlan Budget Flail Budget
Revenue Sources (1/83) (5/83) (1/83) (5/83)
($ millions)
General Property Tax -$3,753 $3,779" $3,952 $3,969
Sales Tax-
1,495 1,495 1,563
o
1,540
Personal Income Tax 1,329 1,345 !--: .,. 1,442 1,469
'atneral Corp. Taw 700 770 807 873..:.
Utility Tax . 206 208 202 205k
Subtotal 7,483 7,597 7,966 8,056
Financial-Co-fp. -Trak 120 120 150 140
Stock Transfer Tax 120 120 120 120
All Other*(Excludes Intra-city
1,982 1 967 : 1,836,
1,906
Revenues**)
Total* 9,705 9,804 10,072 10,222Change from 1/83
* Excludes city-estimated Intra-city Revenues of $323 million forfiscal 1983 and $349 million for fiscal 1984. Also excludes:.transfers from capital fund ($81 million in fiscal 1983 and $93mi4ion in fi_scal 1984); unrestricted intergovernmental aid($996 and $1,043 million in 1983 and 1984, respectively);disallowances against categorical grants ($15 million in eachfiscal year).
Sources: City of New York- Financial Plan for Fiscal 1983 through 1987, 1/83.- Executive Budget, Message of the Mayor, Fiscal 1984, 5/83.

APPENDIX 2
'Projections of Key Economic IndicatorsDrennan-CHR ModelPercent Changes
1983 - 1984
1/83 5/83 1/0, 5/83
United qtatesGNP (1972 $) +2.5% +2.2% +4.2% +4.3%
CPI (1967-100) +5.0 +4.0 +5.9 - +5.3Unemployment Rate 10.1 10.3
(not % Change)8.8 9.3
Personal Income +7.2 , +5.8-
(current $)
+9.4 +8.0
'1\19.7Corporate Profits +12.4 +4.0 +19.8(current $)
,
New York CityCPI , , +6.0 +4.0 +6.0 +5.3
Employment . (0.6) +0.2 +1.5 +1.8
Personal Income(Current $) +6.7 +6.3 +10.2 +10.5
(1972 $) +1.4 +1.7_
+3.9 ±4.7Total City Income +1.3 +2.5 +3.7 +4.0
(1972 $)
City Export Income +2.8 +2.7 +3.4 +5.6
(1972 $)
Using OMB* National Assumptionsin Drennan-CHR Model
Total City Income +0.8 +3.2 +4.2 +3.8
City Export Income +2.4. +3.4 +3.9 +5.4/Employment (NYC) (1.5) +0.5 +1.6 +1.2
Personal Income (NYC) +10.6 +7.0 +10.8 +10.2
(Current $)
* OMB City of New York, Office of Management and Budget.
Source: Drennan-CHR Econometric Model of the Local Economy developedby Matthew Drennan, Professor of Economics, Graduate Schoolof Public Administration, New York University.
46

APPENDIX 3
PROJECTIONS OF,KEY ECONOMIC INDICATORSCITY OF NEW YORKPercent Changes
United States
1983 1984
FinancialPlan Budget Plan
ExecutiveBudget
GNP (1172 $) t2.4% . +3.2% +5.0% ' - +5.1%
CPI (1967100 ) +5.0 +2.6 +4.9 +4.5
Unemployment Rate 10.5 10.0 9.2 8.9(no Change)
ft,
Personal Inco(current $)
v+7.0 +5.8 +9.5 +8.4
Corporate Profit +10.2 +20.6 +21.5 +26.1(current $) \
New York City
CPI +4.7 +2.8 +4.1
Employment +0.6 +0.5 +0.8 +1.2
Personalincome 4-5.6 +5.0 +5.6 +5.9(Current $)
Source: See Aptioendix 1.

APPENDIX 4
EPP Revenue Projectlons, January 1, 1983
Economically - SensitiveFiscal 1983 and
Revenue Sources
Taxes1984
go.
January 1, 19831983 1984($ millions)
General Property Tax $3,776 $4,015
Sales Tax 1,474 1,567
Personal Income Tax 1,300 1,416
General Corp. Tax
-Utility Tax
All Other
758'
215
1 990
865
227
1 913
Subtotal _9,513 _10,003
Not Projected*, 240 270
Total** 9,753 10,273
City of 'New York 9L 705 10,072
Difference (EPPless NYC) +48 +201
.
* Stock transfer taxi financial corporation tax.
** Excludes Intra-City Revenues, unrestructed intergovernmental aid,inter-fund transfer, reserves.