document resume title state taxes in 1968. national ... · pdf filestate taxes in 1968....
TRANSCRIPT
ED 036 906
AUTHORTITLEINSTITUTIONPUB DATENOTEAVAILABLE FROM
DOCUMENT RESUME
EA 002 801
Roderick, Ellen; Goodenough, LindaState Taxes in 1968.National Education Association, Washington, D.C.Jul 6923104
National Education Association, 1201 Sixteenth St.,N.W., Washington, D.C. 20036 (Stock No. 511-15504,$.75)
EDRS PRICE EDRS Price MF-$0.25 HC Not Available from EDRS.DESCRIPTORS Comparative Statistics, National Surveys, *School
Taxes, *State Government, *State Legislation, Tables(Data), *Taxes, *Tax Rates
ABSTRACTThis report describes tax revenues in fiscal year
1968 and tax legislation enacted during the calendar year 1968, forall 50 States. The amount and percent of the total for major sourcesof tax revenue during fiscal 1968 are listed by State as are theamount per capita and percent change in the States, total taxrevenues from 1967 to 1968. Major tax legislation, tax rates, andgeneral provisions are listed, by State, for the following taxrevenue categories: (1) Sales, (2) tobacco, (3) alcoholic beverages,(4) gasoline, and (5) individual and, corporate income. Summary tablesrank each State on the basis of population, total personal income,total State tax revenue, tax revenue as a percent of personal income;and by general revenue, property tax revenue, and expenditure foreducation, per $1,000 of personal income. Related documents are EA
002 525 and EA 002 800. (JH)
Ch
he\CD
LAJ
PROCESS WITH MICROFICHE ANDPUBLISHER'S PRICES. MICRO-FICHE REPRODUCTION ONLY.
RESEARCH DIVISION
NATIONAL EDUCATION ASSOCIATION
STATE TAXES IN 1968
FOP. AN ELECTION year and off year in state legisla-tures, the 1968 record of taxes enacted was heavy.The pressure for additional state tax revenue forcedthe consideration of tax legislation in nearly allof the 24 state legislatures which met in regularsession during 1968. The resulting tax activityproduced a variety of increased taxes with particu-lar emphasis on general and special excise taxes.These actions are estimated to add $1.2 billion a
year to state tax revenues.
Although no new broad-based income or generalsales taxes were enacted in 1968, 29 rate increasesin state sales, income, and selected excise taxes(alcoholic beverages, cigarettes, and motor fuel)occurred in 14 states and the District of Columbia.Four states-Florida, Kentucky, Mississippi, andTexas--and the District of Columbia increased sales
tax rates. Five states--Maryland, Mississippi, NewJersey, New York, and Rhode Island--and the Districtof Columbia levied higher personal or corporate in-come taxes. Many state legislatures did not meet
in 1968. However, some important tax measures wereenacted by those that did meet, and others were ap-
proved in voter referendums.
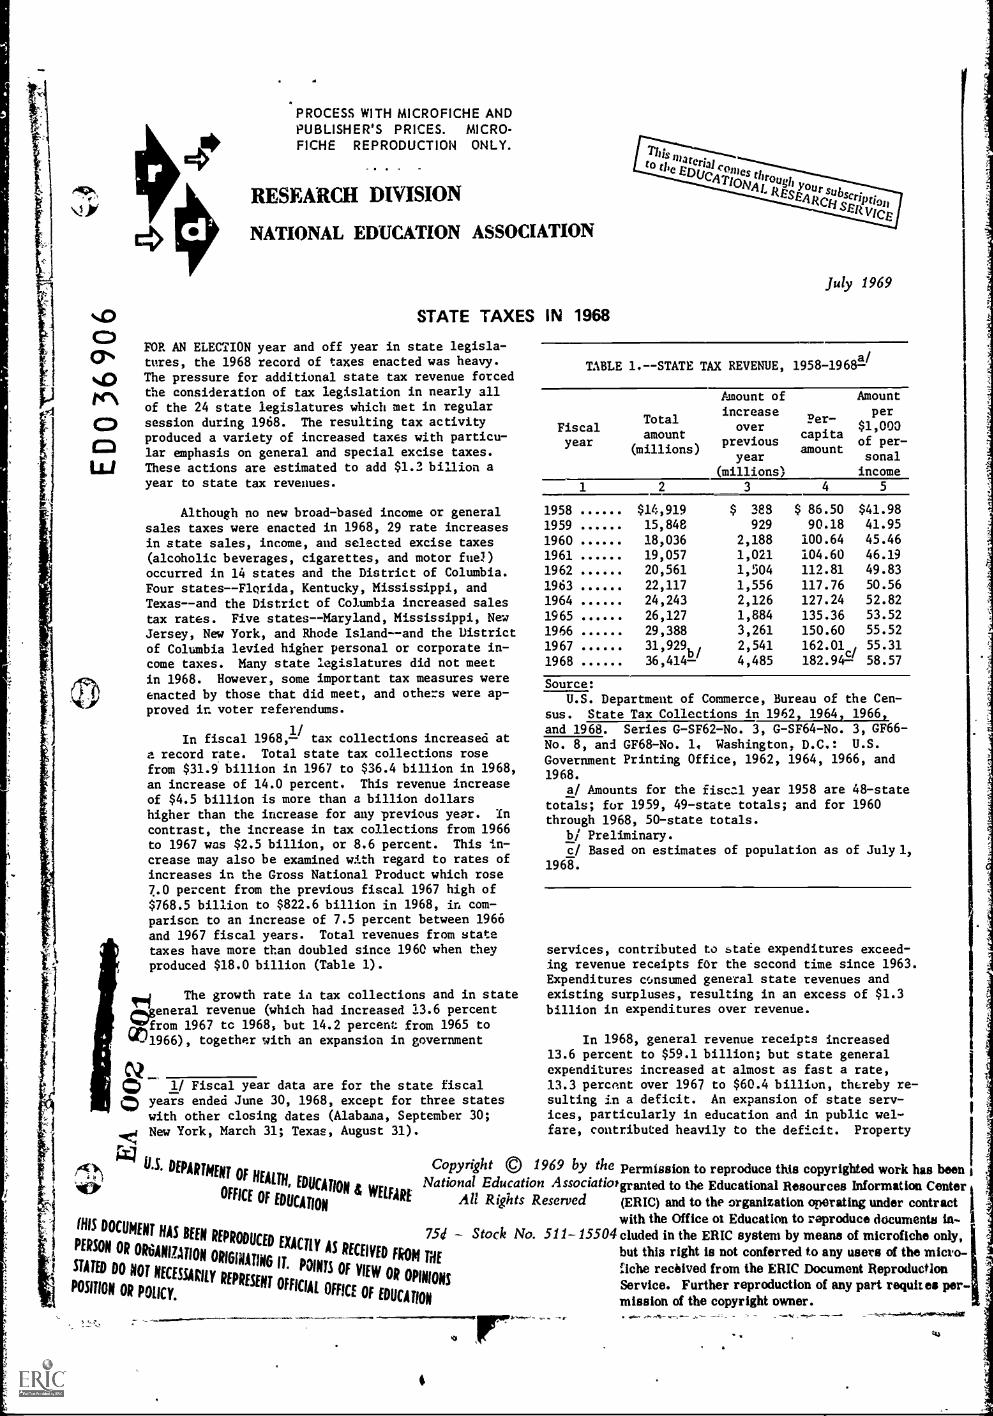
In fiscal 1968,1/ tax collections increased at
a record rate. Total state tax collections rosefrom $31.9 billion in 1967 to $36.4 billion in 1968,an increase of 14.0 percent. This revenue increaseof $4.5 billion is more than a billion dollarshigher than the increase for any previous year. In
contrast, the increase in tax collections from 1966to 1967 was $2.5 billion, or 8.6 percent. This in-crease may also be examined with regard to rates ofincreases in the Gross National Product which rose7.0 percent from the previous fiscal 1967 high of$768.5 billion to $822.6 billion in 1968, in com-parison to an increase of 7.5 percent between 1966
and 1967 fiscal years. Total revenues from state
W)1966), together with an expansion in governmentflgfrom 1967 tc 1968, but 14.2 percent from 1965 toeiNgeneral revenue (which had increased 13.6 percent
The growth rate is tax collections and in state
taxes have more than doubled since 1960 when theyproduced $18.0 billion (Table 1).
;.?cp 1/ Fiscal year data are for the state fiscal4:) years ended June 30, 1968, except for three states
with other closing dates (Alabama, September 30;New York, March 31; Texas, August 31).
4 U.S. DEPARTMENTOF HEALTH,
This materialcomes
throughyour subscription
to the EDUCATIONAL
RESEARCHSERVICE
July 1969
a/TABLE 1.--STATE TAX REVENUE, 1958-1968-
Fiscalyear
Totalamount
(millions)
Amount ofincrease
overprevious
year(millions)
Per-capitaamount
Amountper
$1,000
of per-sonalincome
1 2 3 4 5
1958 $14,919 $ 388 $ 86.50 $41.98
1959 15,848 929 90.18 41.95
1960 18,036 2,188 100.64 45.46
1961 19,057 1,021 104.60 46.19
1962 20,561 1,504 112.81 49.83
1963 22,117 1,556 117.76 50.56
1964 24,243 2,126 127.24 52.82
1965 26,127 1,884 135.36 53.52
1966 29,388 3,261 150.60 55.52
1967 31,929b/ 2,541 162.01 55.31
1968 36,414- 4,485c/
182.94- 58.57
Source:U.S. Department of Commerce, Bureau of the Cen-
sus. State Tax Collections in 1962, 1964, 1966,
and 1968. Series G-SF62-No. 3, G-SF64-No. 3, GF66-
No. 8, and GF68-No. 1. Washington, D.C.: U.S.
Government Printing Office, 1962, 1964, 1966, and
1968.
at Amounts for the fiscal year 1958 are 48-statetotals; for 1959, 49-state totals; and for 1960through 1968, 50-state totals.
b/ Preliminary.c/ Based on estimates of population as of July 1,
1968.
services, contributed to state expenditures exceed-ing revenue receipts for the second time since 1963.Expenditures consumed general state revenues andexisting surpluses, resulting in an excess of $1.3billion in expenditures over revenue.
In 1968, general revenue receipts increased13.6 percent to $59.1 billion; but state generalexpenditures increased at almost as fast a rate,13.3 percent over 1967 to $60.4 billion, thereby re-sulting in a deficit. An expansion of state serv-ices, particularly in education and in public wel-fare, contributed heavily to the deficit. Property
EDUCATION& WELFARE
1969 by the permission to reproduce this copyrighted work has been
granted to the Educational Resources Information Center
PERSON OR OR6ANLWIONN Fk0 but this right is not conferred to any users of the micro-
nche received from the ERIC Document Reproduction
POSITION OR POLICY.
STATED DO NOT NECESSARILYREPRESENT
OFFICIALOFFICE
OFWEDOURCAOTPIOINNIONSService. Further reproduction of any part requites per-
mission of the copyright owner.
2
TABLE 2.--STATE TAX COLLECTIONS, BY TYPE OF TAX
Source Amount (millions)Percent change Percent
distri-bution,1968
Amountper
capita,1968W
1967 1966to to
1968 1967
1968 1967
1 2 3 4 5 6 7
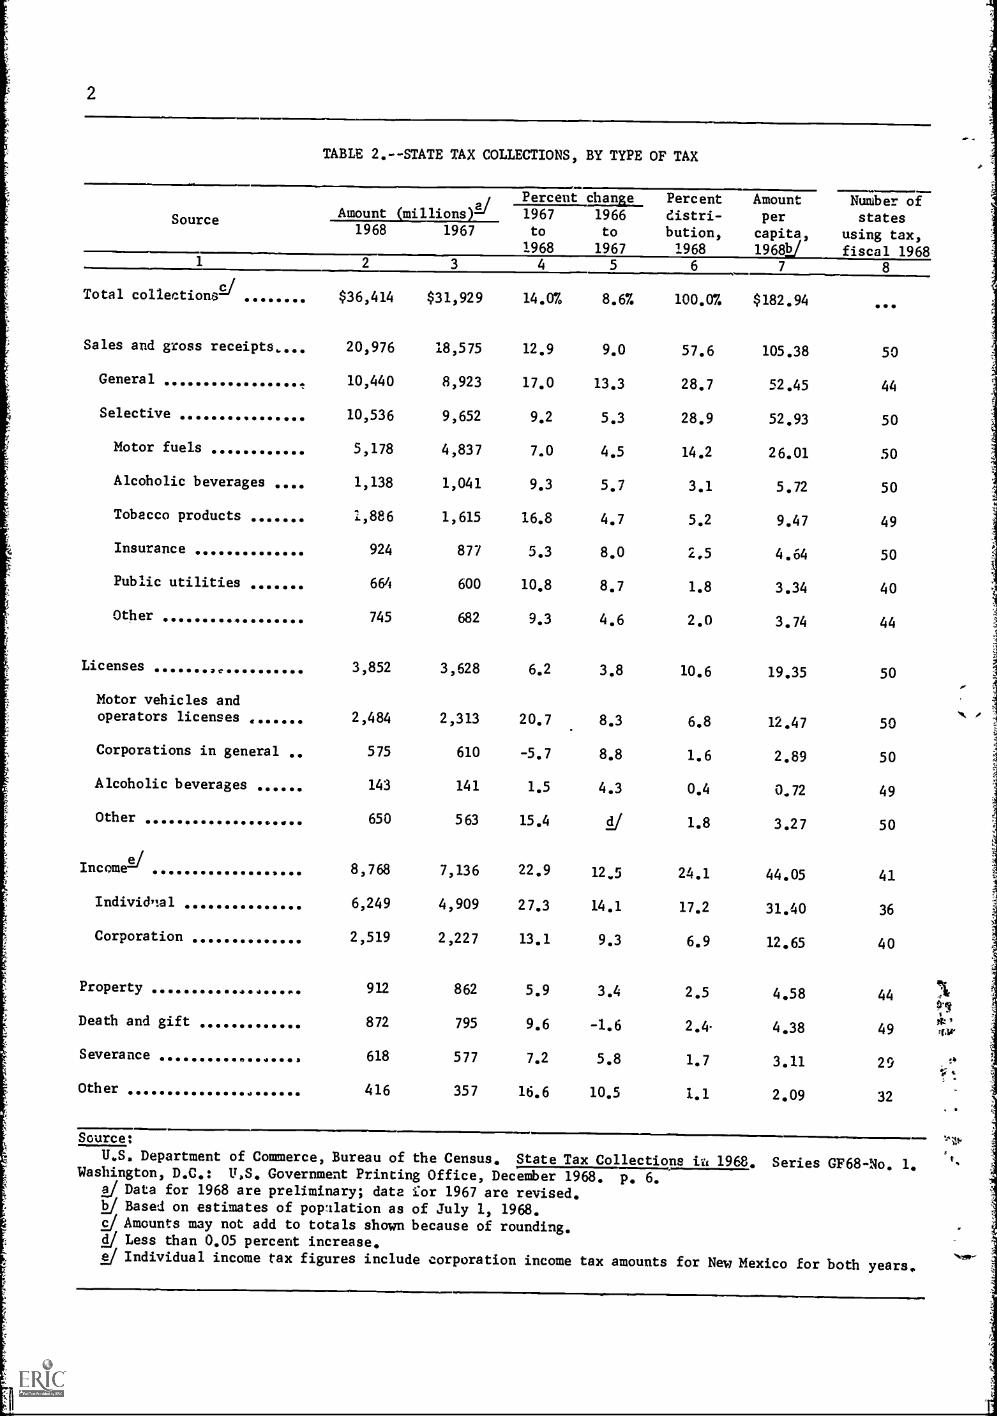
Total collectionsE/ $36,414 $31,929 14.0% 8.67. 100.07. $182.94
Sales and gross receipts. 20,976 18,575 12.9 9.0 57.6 105.38
General 10,440 8,923 17.0 13.3 28.7 52.45
Selective 10,536 9,652 9.2 5.3 28.9 52.93
Motor fuels 5,178 4,837 7.0 4.5 14.2 26.01
Alcoholic beverages 1,138 1,041 9.3 5.7 3.1 5.72
Tobacco products 1,886 1,615 16.8 4.7 5.2 9.47
Insurance 924 877 5.3 8.0 2,5 4.64
Public utilities 664 600 10.8 8.7 1.8 3.34
Other 745 682 9.3 4.6 2.0 3.74
Licenses 3,852 3,628 6.2 3.8 10.6 19.35
Motor vehicles andoperators licenses 2,484 2,313 20.7 8.3 6.8 12.47
Corporations in general 575 610 -5.7 8.8 1.6 2.89
Alcoholic beverages 143 141 1.5 4.3 0.4 0.72
Other 650 563 15.4 g 1.8 3.27
IncomA/ 8,768 7,136 22.9 12.5 24.1 44.05
Individ,:al 6,249 4,909 27.3 14.1 17.2 31.40
Corporation 2,519 2,227 13.1 9.3 6.9 12.65
Property 912 862 5.9 3.4 2.5 4.58
Death and gift 872 795 9.6 -1.6 2.4- 4.38
Severance 618 577 7.2 5.8 1.7 3.11
Other 416 357 16.6 10.5 1.1 2.09
Number ofstates
using tax,fiscal 1968
8
...
50
44
50
50
50
49
50
40
44
50
50
50
49
50
41
36
40
44
49
29
32
Source:
U.S. Department of Commerce, Bureau of the Census. State Tax Collections in 1968. Series GF68-No. 1.Washington, D.C.: U.S. Government Printing Office, December 1968. p. 6.
2/ Data for 1968 are preliminary; date i:or 1967 are revised.J Based on estimates of population as of July 1, 1968.2/ Amounts may not add to totals shown because of rounding.
Less than 0.05 percent increase.!/ Individual income tax figures include corporation income tax amounts for New Mexico for both years,
tax revenue continues to carry the burden for newschool revenue; the new state revenue monies exceed-ed those of new local revenue monies in the pastyear. State expenditures for education during 1968increased 14.4 percent to $24.3 billion; of thisamount, $13.3 billion was spent in state aid to pub-lic schools and $9.0 billion was spent or highereducation. Public welfare expenditures increased20.3 percent to a total of $8.6 billion.
As state and local government expenditures con-tinue their rapid growth, legislators must take cog-nizance of the necessity to finance such expansion.Hence, the increasing costs force legislators tofind new sources of revenue while seeking moreequitable tax liabilities. States have increasedtax rates, broadened tax exemptions, made liabilitychanges, enacted tax credits, and effected measuresto make property and sales taxes less regressive.One continuing trend has been to permit local govern-ments an increasing role in imposing local nonprop-erty taxes.
This report deals with tax revenues in fiscal1968 and state tax legislation enacted during thecalendar year 1968. The main sources of informa-tion on legislation were the Commerce Clearing Housepublications, State Tax Guide, State Tax Reporter,and State Tax Review, and the Prentice-Hall publica-tion, State and Local Taxes. Data on tax collec-tions and government finances were from the annualreports of the Bureau of the Census.
Highlights
All major sources of tax revenue increasedduring fiscal 1968 (Table 2). Individualincome taxes showed the greatest gain witha 27.3 percent increase, to $6.2 billion.Motor vehicle and operator license taxes,which totaled almost $2.5 billion, were up20.7 percent over the previous year.
Close behind were the general sales taxeswith a 17.0 percent increase, to $10.4 bil-lion. General sales taxes, which still ac-count for more than one-fourth (28.7 percent)of total collections were also the bestsource of revenue for 32 states.
Tobacco taxes rose 16.8 percent to almost$1.9 billion; corporation income taxes, 13.1percent to $2.5 billion; alcholic beveragetaxes, 9.3 percent to $1.1 billion; and motorfuel taxes, 7.0 percent to almost $5.2 bil-lion.
All states collected more tax revenue infiscal 1968 tnan in fiscal 1967. The numberof states which had an increase of less than6 percent from the previous year decreasedfrom 19 to 10. Nebraska had the greatestincrease, 42.2 percent. Eight other states-California, Illinois, Maryland, Michigan,Minnesota, Nevada, Ohio, and Wyoming--hadsubstantial increases ranging from 18.0 to33.8 percent (Table 3).
For the fifth consecutive year, state taxcollections exceeded local tax collections.
3
State revenues yielded $36.4 billion, up14.0 percent from the 1967 collections of
$31.9 billion, while local levies produced$32.5 billion, a rise of 12.4 percent overthe 1967 figure of $28.9 billion. The trendof state collections surpassing the localbegan in 1964. The previous year (1963) thelocal revenues of $22.2 billion exceeded tnestate collections of $22.1 billion. The fol-lowing year, the states and localities re-versed positions, with state tax revenue of$24.2 billion surpassing the local tax col-lections of $23.5 billion. Thereafter,state tax collections exceeded local taxcollections with the largest difference oc-curring in 1968 when state taxes exceededlocal taxes by $3.9 billion.
State legislatures in 1968 followed the pat-tern of tapping old, established sources ofrevenue rather than imposing new levies.Seven states increased rates on cigarettes;5 plus the District of Columbia, rates oncorporate income; 3 plus the District ofColumbia, rates on personal income; 4 plusthe District of Columbia, rates on generalsales; 5, rates on gasoline; and 2, rateson alcoholic beverages.
Currently all states tax gasoline and alco-holic beverages in some form. Only NorthCarolina does not tax cigarettes. Sixstates do not tax general sales; 12, per-sonal income; and 10, corporate income.
State Comparisons2
While state tax yields are influenced by under-lying economic trends, sharp year-to-year changesin amounts for individual states generally reflectalso the effect of legal changes in the base, rate,or timing of collection of particular major taxes.
Some increase in total tax revenue from thepreceding fiscal year is reported by Table 3 for allthe states, In 1967, 19 states snowed an increaseof less than 6 percent; in 1968, 10 states. Thefive states showing the greatest percentage rise instate tax revenue from the preceding fiscal yearwere as follows:
Percent increase,:967 to 1968
Nebraska 42.2%
California 33.P
Wyoming 24.2
Minnesota 23.5
Michigan 23.2
2/ Adapted and partially quoted from: U.S.Department of Commerce, Bureau of the Census.State Tax Collections in 1968. Series GF68-No. 1.Washington, D.C.: Government Printing Office, De -cember 1968. p. 1-3.

4
TABLE 3.--STATE TAX COLLECTIONS, BY STATE AND TYPE OF TAX, 1968(Columns 2-7 in thousands of dollars)
StateSales and
gross
receiptsIncome/ Licenses Others Total, 196812/ Total, 1967
Percent
change,
1967
to1968
Amountper
capita,1968E/
1 2 3 4 5 6 7 8 9
50 states $20,975,536 $8,768,042 $3,851,997 $2,818,894 $36,414,469 $31,926,135 14.0% $182.94
Alabama 364,722 94,758 46,346 25,836 531,662 483,064 10.1 149.09Alaska 16,291 26,464 11,598 6,049 60,402 58,169 3.8 218.06Arizona 195,627 47,613 24,256 48,420 315,916 298,535 5.8 189.17Arkansas 193,390 51,149 38,086 7,019 289,644 283,896 2.0 143.96California 2,478,603 1,530,425 307,891 346,450 4,663,359 3,485,125 33.8 242.52
Colorado 195,341 117,762 35,407 12,741 351,251 335,715 7.5 176.39Ccnnecticut 340,583 79,846 41,050 38,347 499,826 468,154 6.8 168.92Delaware 34,829 66,132 35,633 8,195 144,789 140,125 3.3 271.14Florida 751,817 149,459 71,854 973,130 876,821 11.0 157.98Georgia 502,203 182,303 42,804 9,871 737,181 667,847 10.4 160.68
Hawaii 156,057 81,508 3,218 1,872 242,655 220,111 10.2 311.90Who 69,246 42,627 22,931 1,984 136,788 128,534 6.4 194.03Illinois 1,468,099 215,573 46,962 1,730,634 1,450,326 19.3 157.70Indiana 536,054 173,922 68,858 40,318 819,152 771,300 6.2 161.66Iowa 301,956 103,638 77,965 18,894 502,453 452,762 11.0 182.84
Kansas 216,198 82,534 40,976 17,337 357,045 355,165 0.5 155.03Kentucky 315,674 125,795 31,661 36,185 509,316 465,707 9.4 157.73Louisiana 339,962 73,817 60,628 266,029 740,436 690,439 7.2 198.40Maine 117,219 21,299 7,627 146,145 132,524 10.3 149.28Maryland 361,394 325,847 47,981 35,146 771,358 641,433 20.3 205.31
Massachusetts 448,539 476,0144/ 67,4924/ 41,318 1,033,363 953,669 8.4 190.06Michigan 1,136,805 303,348 247,821i 197,652 1,885,629 1,530,806 23.2 215.75Minnesota 329,003 338,512 76,219 71,388 815,122 660,112 23.5 223.57Mississippi 251,129 28,494 25,831 17,066 322,520 307,909 4.7 137.71Missouri 425,137 131,404 85,747 14,679 656,967 615,082 6.8 141.99
Montana 40,613 36,903 13,852 13,605 104,973 92,823 13.1 151.48Nebraska 145,493 14,835 19,924 13,725 193,977 136,459 42.2 134.99Nevada 83,500 14,005 6,023 103,528 87,236 18.7 228.54New Hampshire 48,241 2,689 16,070 8,261 75,261 65,181 13.7 107.21New Jersey 609,454 88,536 178,872 77,092 953,954 833,964 14.4 134.78
New Mexico 122,636 19,433 28,816 46,252 217,137 205,765 5.5 213.93New York 1,561,816 2,200,207 327,783 357,359 4,447,165 4,056,275 9.6 245.52Nutt% Carolina 461,866 313,437 88,570 36,277 900,150 840,712 7.1 175.30North Dakota 61,073 16,945 18,002 _,436 101,456 86,628 17.1 162.33Ohio 1,045,904 249,520 74,792 1,370,216 1,157,817 18.0 129.38
Oklahoma 232,310 65,602 70,393 59,197 427,502 401,030 6.6 169.78Oregon 82,477 175,544 55,088 11,688 324,797 322,742 0.7 161.75Pennsylvania 1,361,332 270,932 265,257 106,059 2,003,580 1,769,332 13.2 171.07Rhode Island 126,153 17,132 16,494 6,814 166,653 143,447 16.2 182.53South Carolina 273,854 104,814 26,415 7,315 412,308 395,793 4.2 153.19
South Dakota 71,396 586 14,161 1,730 87,873 83,640 5.1 133.75Tennessee 396,971 60,144 104,528 15,677 577,320 514,422 12.2 145.20Texas 876,971 .04 233,613 327,387 1,437,971 1,335,847 7.6 131.06Utah 99,124 53,002 13,847 17,537 183,510 175,438 4.6 177.48Vermont 35,898 35,239 13,591 3,444 88,172 78,675 12.1 208.94
Virginia 360,814 271,515 68,770 30,575 731,674 634,946 15.2 159.16Washington 711,483 60,437 106,724 878,644 775,641 13.3 268.21West Virginia 251,003 31,416 31,305 6,852 320,576 281,657 13.8 177.60Visconsin 325,908 504,158 81,886 78,596 990,548 921,051 7.5 235.12Wyoming 43,368 14,065 11,238 68,671 55,284 24.2 218.00
Sources:U.S. Department of Commerce, Bureau of the Census. State
Tax Collecticns in 1968. Series GF68-No. 1. Washington, D.C.:U.S. Government Printing Office, Decemtzr 1968. P. 6-7. StateGcvernmult Finances in 1967. Series GF67-No. 1. Washingtcn,D.C.: U.S. Covernment Printing Office, June 1968.
2/ Combined individual and corporation11/ Data for 1968 are preliminary; 1967c/ Based on estimates of population asii1/ Portion of corporation excise taxes
by corporate excess included in amount forcome; included in amount for licenses for
net income.data are revised.of July 1, 1968.and surtaxes measured
corporation net in-prior years.
5
TABLE 4.--MAJo4 STAIE TAX COLLECTI0N IN 1968(As percent of o.otal tax revenue)
State
Sales and gross receiptsTotal Generalsales salesand or
gross grossreceipts receints
Motor Tobaccofuels products
Alco-hollebever-ag,:s
In-
sur-
auce
Income Licenses
Total
Cur-Indi- pora-
Others vidnal tLnincome net
inct Ste
incomeTotallicen3e
Motorvehicles
and
operators
others'
1 2 3 4 5 6 7 8 9 10 11 12 14
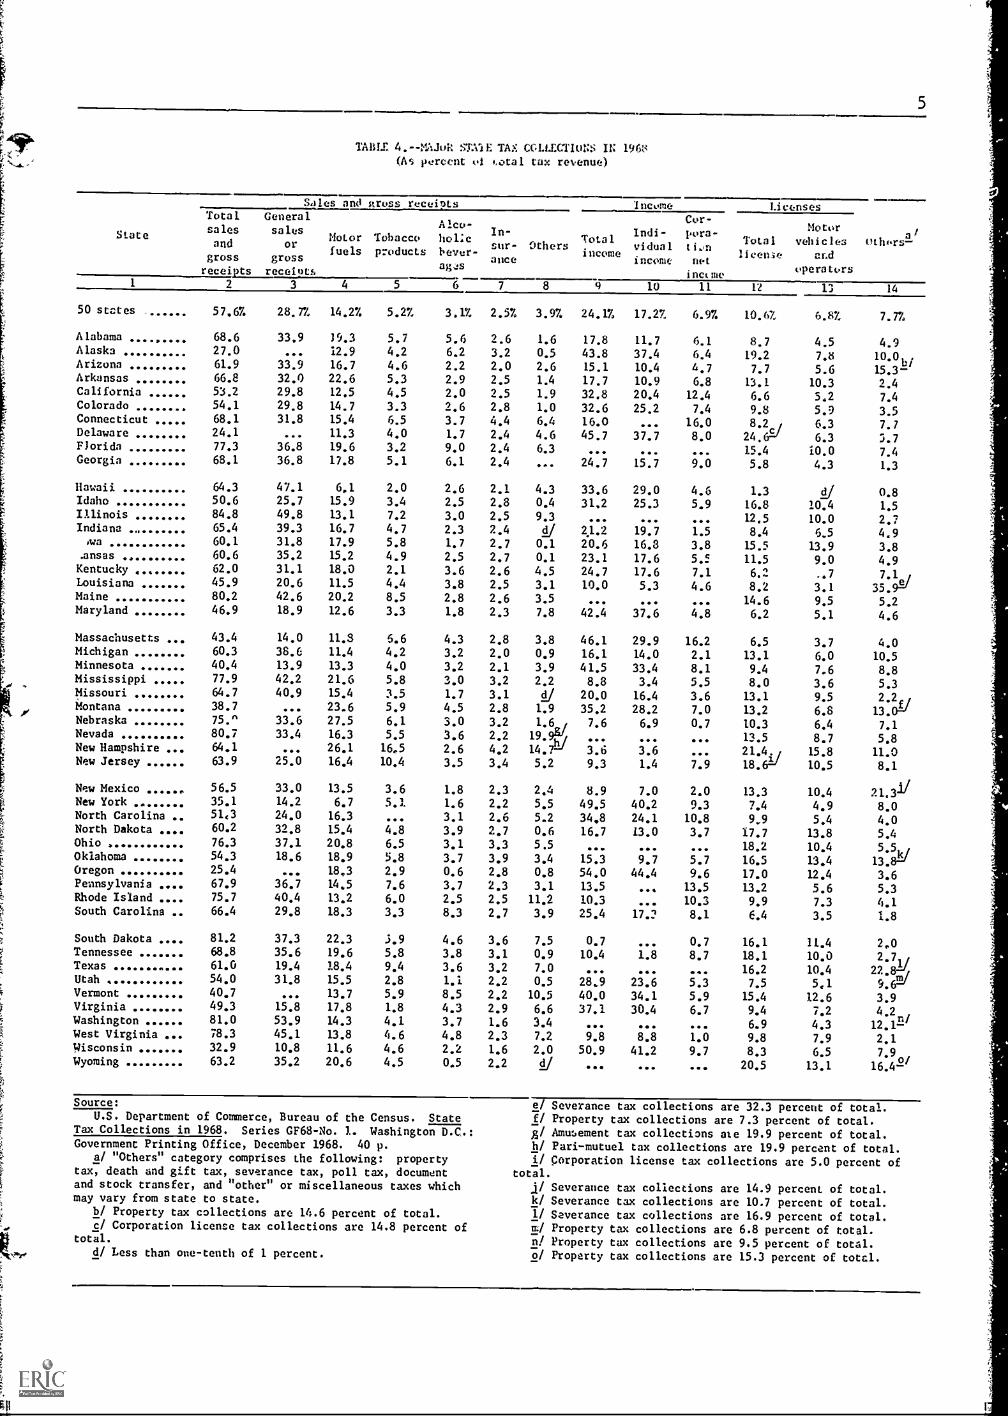
50 states 57.67. 28.7% 14.27. 5.27 3.1% 2.5% 3.97. 24.17 17.27 6.97. 10.6! 6.87 7.77
Alabama 68.6 33.9 19.3 5.7 5.6 2.6 1.6 17.8 11.7 6.1 8.7 4.5 4.9AlaskaArizona
27.061.9
...
33.9
12.9
16.7
4.2
4.66.2
2.23.2
2.00.5
2.643.815.1
37.410.4
6.44.7
19.2
7.7
7.8
5.6
10'0b/
15.3-Arkansas 66.8 32.0 22.6 5.3 2.9 2.5 1.4 17.7 10.9 6.8 13.1 10.3 2.4California 53.2 29.8 12.5 4.5 2.0 2.5 1.9 32.8 20.4 12.4 6.6 5,2 7.4Colorado 54.1 29.8 14.7 3.3 2.6 2.8 1.0 32.6 25.2 7.4 9.8 5.9 3.5Connecticut 68.1 31.8 15.4 6.5 3.7 4.4 6.4 16.0 16.0 8.2 6.3 7.7Delaware 24.1 ... 11.3 4.0 1.7 2.4 4.6 45.7 37.7 8.0 6.3 5.7Florida 77.3 36.8 19.6 3.2 9.0 2.4 6.3 15.4 10.0 7.4Georgia 68.1 36.8 17.8 5.1 6.1 2.4 24.7 15.7 9.0 5.8 4.3 1.3
Hawaii 64.3 47.1 6.1 2.0 2.6 2.1 4.3 33.6 29.0 4.6 1.3 LI/ 0.8Idaho 50.6 25.7 15.9 3.4 2.5 2.8 0.4 31,2 25.3 5.9 16.8 10.4 1.5Illinois 84.8 49.8 13.1 7.2 3.0 2.5 9.3 12.5 10.0 2.7Indiana .,,
,wa
65.4
60.139.331.8
16.7
17.9
4.75.8
2.31.7
2.42.7
cl/
0.121.220.6
19.7
16.81.5
3.88.4
15.5
6.5
13.9
4.9
3.8.ansas 60.6 35.2 15.2 4.9 2.5 2.7 0.1 23.1 17.6 5.5 11.5 9.0 4.9Kentucky 62.0 31.1 18.0 2.1 3.6 2.6 4.5 24.7 17.6 7.1 6.2 ..7 7.1e/Louisiana 45.9 20.6 11.5 4.4 3.8 2.5 3.1 10.0 5.3 4.6 8.2 3.1Maine 80.2 42.6 20.2 8.5 2.8 2.6 3.5 14.6 9.5 5.2Maryland 46.9 18.9 12.6 3.3 1.8 2.3 7.8 42.4 37.6 4.8 6.2 5.1 4.6
Massachusetts 43.4 14.0 11.3 6.6 4.3 2.8 3.8 46.1 29.9 16.2 6.5 3.7 4.0Michigan 60.3 38.6 11.4 4.2 3.2 2.0 0.9 16.1 14.0 2.1 13.1 6.0 10.5Minnesota 40.4 13.9 13.3 4.0 3.2 2.1 3.9 41.5 33.4 8.1 9.4 7.6 8.8Mississippi 77.9 42.2 21.6 5.8 3.0 3.2 2.2 8.8 3.4 5.5 8.0 3.6 5.3MissouriMontana
64.7
38.740.9 15.4
23.63.55.9
1.7
4.53.12.8
LI/
1.9
20.0
35.2
16.4
28.23.67.0
13.1
13.29.5
6.8
2.2
.(13. A/Nebraska 75.' 33.6 27.5 6.1 3.0 3.2 7.6 6.9 0.7 10.3 6.4 7.1Nevada 80.7 33.4 16.3 5.5 3.6 2.2 19.9n 13.5 8.7 5.8New Hampshire 64.1 26.1 16.5 2.6 4,2 14.7 3.6 3.6 21.4. 15.8 11.0New Jersey 63.9 25.0 16.4 10.4 3.5 3.4 5.2 9.3 1.4 7.9 18.621/ 10.5 8.1
New Mexico 56.5 33.0 13.5 3.6 1.8 2.3 2.4 8.9 7.0 2.0 13.3 10.4 21.31/New York 35.1 14.2 6.7 5.1 1.6 2.2 5.5 49.5 40.2 9.3 7.4 4.9 8.0North Carolina .. 51,3 24.0 16.3 3.1 2.6 5.2 34,8 24.1 10.8 9,9 5.4 4.0North Dakota 60.2 32.8 15.4 4.8 3.9 2.7 0.6 16.7 13.0 3.7 17.7 13.8 5.4Ohio 76.3 37.1 20.8 6.5 3.1 3.3 5.5 18.2 10.4 5.5,/Oklahoma 54.3 18.6 18.9 5.8 3.7 3.9 3.4 15.3 9.7 5.7 16.5 13.4 13.8=JOregon 25.4 18,3 2.9 0.6 2.8 0.8 54.0 44,4 9.6 17.0 12.4 3.6Pennsylvania 67.9 36.7 14.5 7.6 3.7 2.3 3.1 13.5 13.5 13.2 5.6 5.3Rhode Island .... 75.7 40.4 13.2 6.0 2.5 2.5 11.2 10.3 10.3 9.9 7.3 4.1South Carolina .. 66.4 29.8 18.3 3.3 8.3 2.7 3.9 25.4 17.2 8.1 6.4 3.5 1.8
South Dakota 81.2 37.3 22.3 3.9 4.6 3.6 7.5 0.7 0.7 16.1 11.4 2.0Tennessee 68.8 35.6 19.6 5.8 3.8 3.1 0.9 10.4 1.8 8.7 18.1 10.0 2.7,/Texas 61.0 19.4 18.4 9.4 3.6 3.2 7.0 000 .00 040 16.2 10.4 22.8=/Utah 54.0 31.8 15.5 2.8 1.1 2.2 0.5 28.9 23.6 5.3 7.5 5.1 9.6-1
m/Vermont 40.7 13.7 5.9 8.5 2.2 10.5 40.0 34.1 5.9 15.4 12.6 3.9Virginia 49.3 15.8 17.8 1.8 4.3 2.9 6.6 37.1 30.4 6.7 9.4 7.2 4.2Washington 81.0 53.9 14.3 4.1 3.7 1.6 3.4 000 .4.0 000 6.9 4.3 12.1 -West Virginia 78.3 45.1 13.8 4.6 4.8 2.3 7.2 9.8 8.8 1.0 9.8 7.9 2.1WisconsinWyoming
32.963.2
10.8
35.2
11.6
20.64.64.5
2.2
0.5
1.6
2.2
2.0
ci/50.9
00.41.2
0009.7 8.3
20.56.5
13.17'9
/16.4-
o
Source:
U.S. Department of Commerce, Bureau of the Census. StateTax Collections in 1968. Series GF68-No. 1. Washington D.C.:Government Printing Office, December 1968. 40 p.
a/ "Others" category comprises the following: propertytax, death and gift tax, severance tax, poll tax, documentand stock transfer, and "other" or miscellaneous taxes whichmay vary from state to state.
b/ Property tax collections are 14.6 percent of total.c/ Corporation license tax collections are 14.8 percent of
total.
d/ Less than one-tenth of 1 percent.
e/ Severance tax collections are 32.3 percent of total.f/ Property tax collections are 7.3 percent of total.z/ Amusement tax collections ate 19.9 percent of total.
h/ Pari-mutuel tax collections are 19.9 percent of total.i/ Corporation license tax collections are 5.0 percent of
total.
I/ Severance tax collections are 14.9 percent of total.k/ Severance tax collections are 10.7 percent of total.if Severance tax collections are 16.9 percent of total.m/ Property tax collections are 6.8 percent of total.n/ Property tax collections are 9.5 percent of total.o/ Property tax collections are 15.3 percent of total.

TABLE 5.--MAJOR STATE TAX COLLECTIONS, 1968
(in thousands of dollaz0
State
Sales and gross receipts
Income
Licenses
Other
taxes)
14
Total
sales and
gross
recei ts
General
sales or
gross
receipts
Motor
fuels
Tobacco
products
Alcoholic
beverages
lust.rance
Other
,
sales)
Total
income
Individual
income
10
Corporation
net income
11
Total,
license
12
Motor
vehicles
and
operators
13
23
56
78
9
50 states
$20,975,536
$10,439,829
$5,178,219
$1,886,014
$1,137,986
$924,195
$1,409,293
$8,768 042
$6,249,446
$2,518,598
$3,851,997
$2,483,838
$2,818,894
Alabama
364.722
180,358
102,674
30,226
29,574
13,586
8,304
94,758
62,516
32,442
46,346
23,930
25,836
Alaska
16,291
...
7,806
2,522
3,741
1,947
275
26,. 4
22,599
3,855
11,598
4,717
6,049
Arizona
195,627
107,152
52,670
14,518
6,839
6,170
8,278
47,613
32,890
14,723
24,256
17,540
48,420
Arkansas
193,390
92,783
6,547
15,311
8,432
7,237
4,080
51,149
31,522
19,627
38,086
29,796
7,019
California
2,478,603
1,390,954
580,675
209,719
93,370
116,030
87,805
1,530,425
951,613
578,812
307,891
240,562
346,450
Colorado
195,341
107,473
53,135
11,735
9,474
10,044
3,419
117,762
91,043
26,719
35,407
21,258
12,741
Connecticut
340,583
158,826
76,877
32,536
18,290
21,984
32,070
79,846
...
79,846
41,050
31,493
38,347
Delaware
34,829
...
16,429
3,834
2,529
3,428
6,609
66,132
54,554
11,578
35,633
9,127
8,195
Floric'a
751,817
357,683
190,460
30,884
87,523
23,776
61,491
...
...
...
149,459
97,036
71,854
Georgia
502,203
271,227
131,330
37,576
44,717
17,353
...
182,303
115,950
66,353
42,804
31,337
9,871
Hawaii
156,057
114,360
14,741
4,973
6,291
5,147
10,545
81,503
70,312
11,196
3,218
66
1,872
Idaho
69,246
35,127
21,714
4,606
3,402
3,790
607
42,627
34,619
8,008
22,931
14,197
1,984
Illinois
1,468,099
861,716
226,380
124,819
52,053
42,797
160,334
...
...
...
213,573
170,802
46,962
Indiana
336,054
322,301
137,052
35,538
18,448
19,694
21
173,922
161,459
12,463
68,858
53,628
40,318
Iowa
301,956
159,875
90,091
29,390
8,469
13,478
653
103,638
84,556
19,082
77,965
69,778
18,894
Kansas
216,198
125,558
54,435
17,532
8,823
9,562
238
82,534
62,823
19,711
40,976
32,224
17,337
Kentucky
315,674
158,610
91,855
10,739
18,340
13,038
23,092
125,796
.89,421
36,375
31,661
18:930
36,185
Louisiana
339,962
132,229
85,269
32,870
28,624
18,216
22,754
73,817
39,512
34,305
60,628
22,863
266,029
Maine
117,219
62,304
29,457
12,424
4,163
3,729
5,142
...
...
...
21,299
13,858
7,927
Maryland
Massachusetts
361,394
448,539
145,e47
145,112
97,212
121,767
25,578
68,342
14,103
44,754
18,118
29,446
60,536
39,118
326,847
476,014
290,135
308,956
36,712c/
167,058-J
47,981
67,492
79,070
37;987
35,146
41,310
Michigan
1,136,805
727,495
215,589
79,812
59,990
36,985
16,934
303,348
263,362
39,986
247,824
112,452
197,652
Minnesota .....
329,003
113,078
108,115
32,526
26,196
16,974
32,114
338,512
272,620
65,892
76,219
61,963
71,388
Mississippi
251,129
135,957
69,513
18,792
9,655
10,219
6,993
28,494
10,828
17,666
25,831
11,704
17,066
Missouri
425,137
268,689
101,126
23,247
11,145
20,649
281
:31,404
107,600
23,804
85,747
62,483
14,679
Montan
40,613
...
24,731
6,172
4,731
2,980
1,949
36,903
29,574
7,329
13,852
7,155
13,605
Nebraska
145,493
65,269
53,255
11.922
5,884
6,151
3,011
14,835
12,461
1,374
19,924
12,374
13,725
Nevada
83,500
34,527
16,829
5,665
3,682
2,233
20,564
...
...
...
14,063
9,044
6,023
New Hampshire
46,241
...
19,671
12,418
1,935
3,131
11,086
2,689
2,689
...
16,070
11,897
8,261
New Jersey
609,454
238,292
156,073
99,5/.,
33,583
32,474
49,457
88,536
12,954
75,582
178,872
100,471
77,092
New Mexico
122,636
71,647
29,288
7,710
3,855
4,922
5,214
19,433
15,103
4,330
28,816
22,608
46,252
New York
1,561,816
630,912
291,848
226,31e
71,665
95,680
245,393
:,200,207
1,787,897
412,310
327,753
219,179
357,359
North Carolina
461,866
216,174
147,147
...
28,315
23,455
46,775
313,437
216,549
96,888
88,570
48,707
36,277
North Dakota
61,073
33,298
15,575
4,879
3,990
2,707
624
16,945
13,158
3,787
18,002
14,028
5,436
Ohio
1,045,904
508,598
285,170
88,653
42,301
45,523
75,659
...
...
...
249,520
141,866
74,792
Oklahoma
232,310
79,541
80,729
24,962
15,852
16,750
14,476
65,602
41,373
24,229
70,393
57,473
59,197
Oregon
82,477
...
59,279
9,454
2,041
9,212
2,491
175,544
144,209
31,235
55,088
40,349
11,688
Pennsylvania
1,361,332
735,767
291,050
152,645
73,650
45,973
62,247
270,932
...
270,932
265,257
112,525
106,059
Rhode Is:and
125,153
67,267
21,988
9,925
4,106
4,240
18,627
17,132
...
17,132
16,494
12,186
6,814
South Carolina
273,854
123,040
75,585
13,732
34,189
11,283
16,025
104,814
71,293
33,521
26,415
14,392
7,315
South Dakota
71,396
32,743
19,560
5,211
4,059
3,195
6,627
586
...
586
14,161
10,054
1,730
Tennessee
396,971
205,325
113,189
33,265
22,176
17,968
5,048
60,144
10,187
49,957
104,528
57,465
15,677
Texas
876,971
279,659
264,7.51
135,831
51,657
45,335
100,238
...
...
233,613
149,1,94
327,387
Utah
99,124
58,386
28,514
5,136
2,041
4,048
999
53,002
43,301
9,701
13,847
9,380
17,537
Vermont
35,898
...
12,066
5,183
7,462
1,915
9,272
35,229
30,080
5,159
13,591
11,077
3,444
Virginia
360,814
115,950
130,573
13,204
31,263
21,493
48,331
271,515
222,678
48,837
68,770
55,078
30,575
Washington
711,483
473,184
125,980
35,602
32,784
13,788
30,145
...
..
...
60,437
39,216
106,724
West Virginia
251,003
144,52
44,330
14,847
13,270
8,967
23,067
31,416
28,195
3,221
31,305
25,419
6,852
Wisconsin
325,908
106,816
115,396
45,532
22,197
15,309
20,158
504,158
408,055
96,103
81,886
64,520
78,596
Wyoming
43,368
24,198
14,1/2
3,123
353
1,515
7...
...
...
14,065
8,980
11,238
Source:
U.S. Department of. Commerce, Bureau of the Census.
State Tax Collections in 1968.
Series GF68-No. 1.
Washington, D.C.:
U.S. Government Printing Office, December
1968.
p.
7 -9.
J Includes public utilities, parimutuels, amusements, and "other" miscellaneous
taxes which may vary from state to state.
J Includes property tax, death and gift tax, severance tax, poll tax, document and
stock transfer, and "other" or miscellaneous taxes which may vary from state to state.
j Portion of corporation excise taxes and surtaxes measured by corporate excess
included in amount for corporation net income; included in amount for licenses for prior
years.
o.

Nearly one-half of all state tax revenue wascollected by seven major states, with amounts asfollows (in millions):
California $4,663
New York 4,447Pennsylvania 2,004Michigan 1,886Illinois 1,731Texas 1,438
Ohio 1,370
A considerable interstate range appears in theaverage per-capita amount of state tax revenue, asindicated by the following distribution of the 50states, based on Table 3:
Per-capita statetax revenue, 1968
Number of
states
$200 or more 14
$180 to $199 6
$160 to $179 11
$140 to $159 12
$120 to $139 6
Less than $120 1
Caution must be used in comparing tax amountsfor individual state governments. There are markedinterstate differences in the scope and intensityof public services, in economic resources, and inthe pattern of distribution of responsibility forparticular public functions between the state andlocal levels. Some state governments directly ad-minister certain activities which elsewhere are un-dertaken by local governments, with or without statefiscal aid.
Tax Collections in 1968
State tax collections in fiscal 1968 rose$4.5 billion, or 14.0 percent, to $36.4 billion,reflecting in part the heavy legislation of the pre-vious year when 47 legislatures met in regular ses-sion. In 1967, tax collections rose $2.5 billion,or 8.6 percent, to $31.9 billion. The year 1966had been a record one for tax collection, increasing$3.3 billion, or 12.5 percent, over the collectionsof 1965 to $29.4 billion. In 1965, collections hadbeen lighter, rising 7.8 percent, or $1.9 billion,to a total of $26.1 billion. From 1963 to 1968,yields from state taxes have risen from $22.1 bil-lion to a high of $36.4 billion, an increase of64.6 percent. The graph shows the trends in collec-tions for the five major sources of state revenue.
For 1968, there was a higher rate of increasein tax collections over the previous year as wellas an increase in per-capita state tax revenue fromfiscal 1967 to 1968 (Table 2). An increase of 12.9percent in per-capita state tax revenue for 1968definitely continued the strong upward trend of the
past decade. Per-capita state revenue collectionclimbed from $162.01 in 1967, to $182.94 in 1968.
With nationwide prosperity continuing in fis-cal 1968, all 50 states were able to collect moretax revenue than during the fiscal year 1967. The
slower, gains in revenue in 1967, however, can be
7
attributed to a slackened economic activity andfewer tax boosts last year. Prospects are much the
same for next year, especially with the continua-tion of the federal 10 percent surtax and a lowerceiling on federal expenditures. Inasmuch as theyrestrict inflation, these actions by the federalgovernment will assist state and local governments.On the other hand, these same actions may limit con-sumer spending and, therefore, reduce increases instate tax revenue, especially that portion respon-sive to consumer spending.
Tax collections for all states combined aregiven in Table 2 by major type of tax, in total andin pt..r-capita amounts. Tax collections for eachstate for sales and gross receipts, income, licenses,and all °the: collections by major type of tax ap-pear in Table 3, and as percents of total tax reve-nue, in Table 4.
Trends in State Revenue From SelectedTypes of Taxes, 1964.1968
Mil boa of dollars12.0
10.0
8.0
6.0
4.0
2.0
10
General-------- sales
Motor fuel sales
--V 4,....offellwogw-wk.
..
.01#
Income
-.''Is_irwar....a__
6.
...,`.
owar."'w
Individual
Cnrporation net
.
:;r"--Motor vehicle'
Income ../.0". .au w.
0.....011....
S/041...... Vil
if" ceases
1964 1965 1966Flsca Year
1967 1968
Source:
U.S. Department of Commerce, BureaL of the Cen-sus. State Tax Collections in 1968. Series GF-No. 1. Washington, D.C.: Government Printing Of-fice, 1968. p. 1.

8
General and Selective Sales Taxes
Combined collections from state taxes leviedon various types general and selective sales andgross receipts accounted for 57.6 percent of taxcollections, almost three timers as much as any othersingle state tax in fiscal 1968. The tax yieldedover $20.9 billion, a 12.9 percent increase over1967 (Table 5). Of these sales and gross receiptstaxes, the general sales and gross receipts are ofprimary importance; providing more than one-fourth(28.7 percent) of all state tax revenues in 1968,the general sales collections rose to $10.4 billion,a 17.0 percent rise over 1967. Only individual in-come revenues which increased 27.3 percent showed agreater percentage increase.
The prominence of the sales tax is substanci-ated by the fact that 32 states continue to find ittheir best source of revenue. Moreover, of theseven states which together account for almost one-half of the nationwide state tax revenue, six- -California, Illinois, Michigan, Ohio, Pennsylvania,and Texas--drew the most revenue from their salestax. (The income tax yielded more in New York.)California alone collected $1.39 billion from thegeneral sales tax, and Illinois, Michigan, New York,Ohio, and Pennsylvania each collected more than$500 million. Twenty-six of the remaining salestax states each collected more than $100 millionfrom the tax.
Revenues from selective sales and gross re-ceipts (motor fuels, alcoholic beverages, tobaccoproducts, insurance, utilities, pari-mutuels, andseveral others) rose from $9.6 billion in 1967 to$10.5 billion in 1968, an increase of 9.2 percent.Of the selective sales tax levies, revenues from themotor fuels were the largest, yielding $5.1 billion,up 7.0 percent from a year ago. The next largestyield was derived from tobacco products; tobacco
collections for 49 states totaled $1.8 billion, arise of 16.8 percent (as contrasted to the lower4.7 percent in tobacco revenues from fiscal 1966 to1967.) A rise of 9.3 percent, from $1.0 billion to$1.1 billion was reported from the tax on alcoholicbeverages as collected by the 50 states. Taxes onpari-mutuels continued to increase in importanceand totaled $442 million (representing a 4.5 per-cent increase from a year ago.) The tax on pari-mutuels is one of the more concentrated state taxes.It is a revenue source in 28 states, with fivestates receiving nearly 70 percent of the total;New York alone accounts for 32.3 percent of thepari-mutuel collections. California, Florida, Illi-nois, and New Jersey are the other four states inorder of magnitude. Another case of concentrationis Nevada, accounting for over 58.5 percent of theamusement taxes levied in the 28 states.
Net Income Taxes
Individual income taxpayers paid over $6.2 bil-lion in such taxes to state governments in 1968, a27.3 percent increase over the fiscal 1967 collec-tions. No other revenue source registered a largergain. Collections of corporate net income taxes in-creased 13.1 percent from the previous year; this
increase contrasts to the lower 9.3 percent in-crease from 1966 to 1967. Forty-one states utilizedthis source in 1968, deriving $2.5 billion from thetax. The corporate income tax has come of age since1962, with a 92.9 percent increase in the six-yearperiod. With six states enacting increases in cor-porate income tax rates in their 1968 legislatures,the prospect for even larger increases in corporatetax revenues is indeed good. As a combined sourceof revenue, corporate and individual income taxesaccounted for nearly 25 percent of all state taxcollections. The produced revenues totaling $8.7billion, a gain of 22.9 percent over last year.
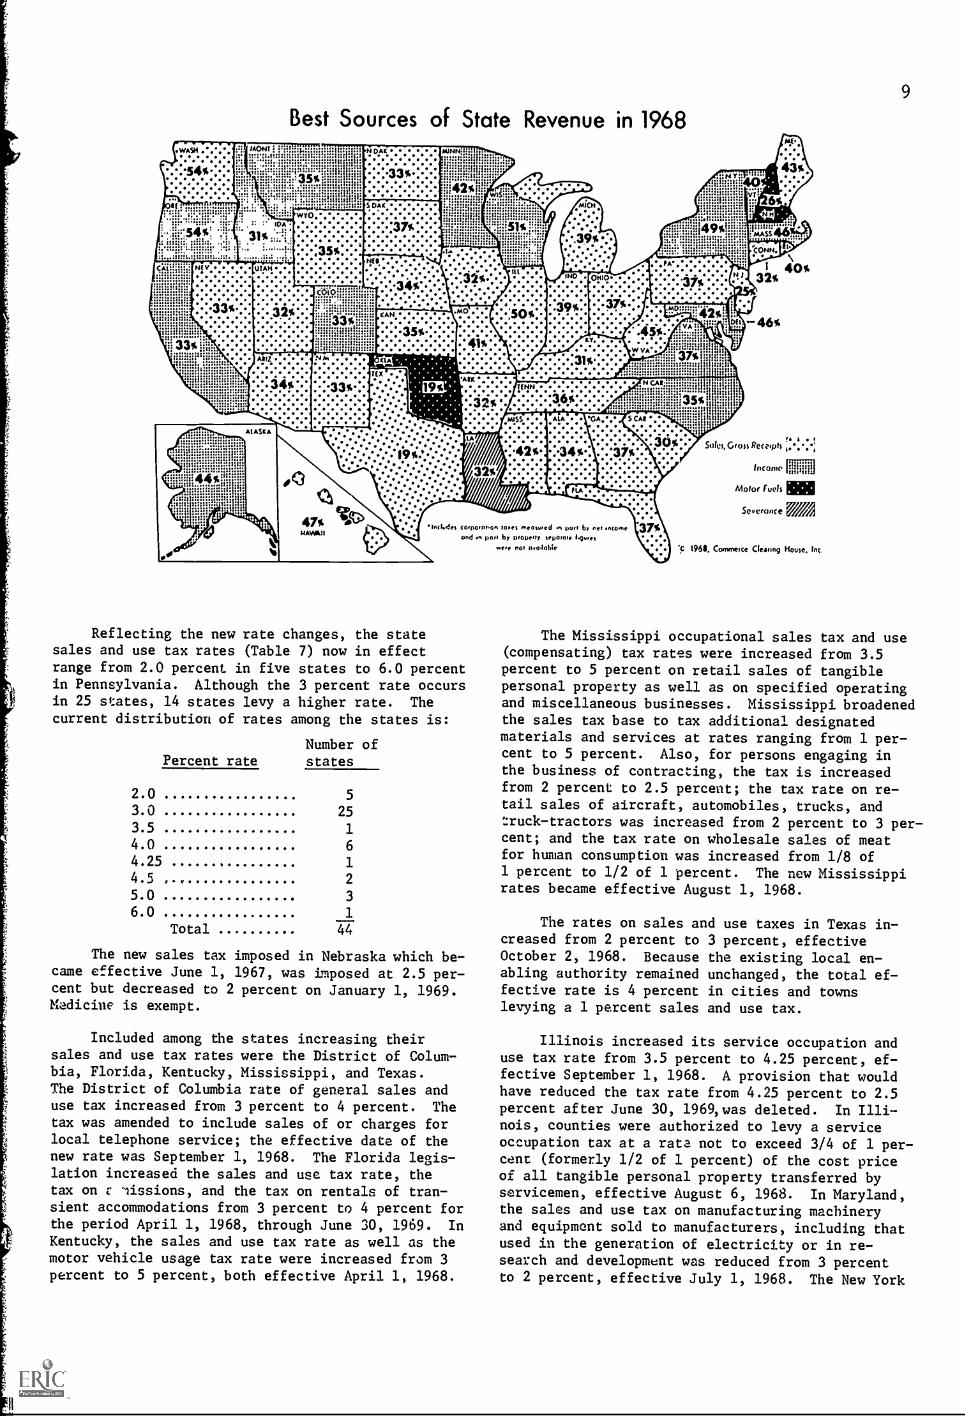
Best Sources State Tax Revenue
In fiscal 1968 the sales tax retained its promi-nent position as the greatest state tax revenuesource. The sales tax was the best source of reve-nue for 32 states. Although three states--Califor-nia, Iowa, and Nebraska-- exhibited a change to a newbest source of revenue during the past year, thenumber of states finding the sales tax their bestsource increased by one over the 1967 figure of 31.California exhibited a change from the sales tax asa best source to the income tax; Iowa, a change fromthe income tax to the sales tax; and Nebraska fromthe motor fuel tax to the sales tax. The incometax was the best source of tax revenue in 15 states,the gasoline taxes in New Hampshire and Oklahoma,and the severance tax in Louisiana. The best sourcesof state tax revenue in 1968 are shown for eachstate in the map reproduced with permission ofCommerce Clearing House.
State Tax Legislation
Tax legislation was unusually heavy in 1968,an off-legislative year. The 24 state legislaturesthat met in regular session during 1968 raised therates of existing taxes or made other changes intheir revenue systems (Table 6).
With no new tax adoptions, the number of stateswith general sales taxes remains the same as in1967, 44; the number with personal income taxes, 36(plus two states which tax only interest and divi-dends); and the number levying corporate incometaxes, 40.
Nearly 29 tax increases occurred in at least14 states and the District of Columbia. Legisla-tion to raise races on both personal and corporateincomes passed in the District of Columbia, Missis-sippi, and New York. New Jersey, Maryland, andRhode Island increased corporate income rates.Sales and use tax rates were increased in fourstates, and in the District of Columbia, but noneexceed the high rate of 6 percent approved in Penn-sylvania in 1967.
General Sales and Use Taxes
In 1968, nearly one-half of the states passedsome type of legislation affecting the sales tax.Four states and the District of Columbia adoptedrate increases in state sales and use taxes.
Best Sources of State Revenue in 1968DAK.
I 40%32%
:.42s
flA
17%...
47% IgkHAVAll
Inctvdes cotnot000n tomes meowed .n non by net anent,and m Pot, by properly review. 11.0t1
-eye not o.c0ohle
Reflecting the new rate changes, the statesales and use tax rates (Table 7) now in effect
range from 2.0 percent in five states to 6.0 percentin Pennsylvania. Although the 3 percent rate occursin 25 states, 14 states levy a higher rate. Thecurrent distribution of rates among the states is:
Number ofPercent rate states
2.0 5
3.0 253.5 1
4.0 6
4.25 1
4.5 2
5.0 3
6.0 1
Total 44
The new sales tax imposed in Nebraska which be-came effective June 1, 1967, was imposed at 2.5 per-cent but decreased to 2 percent on January 1, 1969.Medicine is exempt.
Included among the states increasing theirsales and use tax rates were the District of Colum-bia, Florida, Kentucky, Mississippi, and Texas.The District of Columbia rate of general sales anduse tax increased from 3 percent to 4 percent. Thetax was amended to include sales of or charges forlocal telephone service; the effective date of thenew rate was September 1, 1968. The Florida legis-lation increased the sales and use tax rate, thetax on r iissions, and the tax on rentals of tran-sient accommodations from 3 percent to 4 percent forthe period April 1, 1968, through June 30, 1969. InKentucky, the sales and use tax rate as well as themotor vehicle usage tax rate were increased from 3percent to 5 percent, both effective April 1, 1968.
46x
9&OSede%GroRemph*.%°;
Income III
Motor Fuels NEISmrance
t 1968. Commerce Cleanng House. Inc,
9
The Mississippi occupational sales tax and use(compensating) tax rates were increased from 3.5percent to 5 percent on retail sales of tangiblepersonal property as well as on specified operatingand miscellaneous businesses. Mississippi broadenedthe sales tax base to tax additional designated
materials and services at rates ranging from 1 per-cent to 5 percent. Also, for persons engaging inthe business of contracting, the tax is increasedfrom 2 percent to 2.5 percent; the tax rate on re-tail sales of aircraft, automobiles, trucks, andtruck-tractors was increased from 2 percent to 3 per-cent; and the tax rate on wholesale sales of meatfor human consumption was increased from 1/8 of1 percent to 1/2 of 1 percent. The new Mississippirates became effective August 1, 1968.
The rates on sales and use taxes in Texas in-creased from 2 percent toOctober 2, 1968. Becauseabling authority remainedfective rate is 4 percentlevying a 1 percent sales
3 percent, effectivethe existing local en-unchanged, the total ef-in cities and townsand use tax.
Illinois increased its service occupation anduse tax rate from 3.5 percent to 4.25 percent, ef-fective September 1, 1968. A provision that wouldhave reduced the tax rate from 4.25 percent to 2.5percent after June 30, 1969,was deleted. In Illi-nois, counties were authorized to levy a serviceoccupation tax at a rata not to exceed 3/4 of 1 per-cent (formerly 1/2 of 1 percent) of the cost priceof all tangible personal property transferred byservicemen, effective August 6, 1968. In Maryland,the sales and use tax on manufacturing machineryand equipment sold to manufacturers, including thatused in the generation of electricity or in re-search and development was reduced from 3 percentto 2 percent, effective July 1, 1968. The New York

10
legislature amended the local sales and use tax en-abling act to specify that local taxes may be im-posed ranging from 1/2 percent to 3 percent, effec-tive September 1, 1968. In California the 4 per-cent sales tax rate was extended indefinitely as aresult of voter approval of state funds for localproperty tax relief. When added to the 1 percentlocal tax, the combined stare and local sales taxremains at S percent.
1:weral states which did not increase the rateof ta:: 'lid extend the sales tax rate to transactionsnot previously covered. The Arkansas manufacturingand prot,essing exemption (sales and use tax) wasrevised. February 15, 1968, to provide that tangiblepersonal property used for repair of machinery isno longer exempt. Mississippi broadened its salestax base extensivel) nth new taxes ranging from 1percent to 5 percent on specified sales and serv-ices. Also, exemptions have been eliminated forsales of tangible personal property to contractorspurchasing in the performance of contracts withMississippi, its counties, and municipalities. Othere-femptions include gross income of hospitals, andsales of sea foods on which the tax has been paidby the seller under the Sea Food Act. Oklahoma re-pealed the exemption for the trade-in allowancegranted on farm machinery that has been traded inand resold by the re-ailer.
Although no states decreased their existingsales tax rates during 1968, several did enact newexemptions or provide for new credits on the taxpaid. Arkansas exempted machinery used for mining,quarrying, refining, and extracting oil and gas,effective February 15, 1968. California exemptedmeals served to elderly and hospital and mentalpatients, effective August 14, 1968. Exemptionswere allowed for pollution control equipment inArkansas and Missouri.
Georgia added exemptions of the sales and usetax for sales of food to private, nonprofit, ac-credited elementary schools, for property and serv-ices purchased by nonprofit hospitals, and for HolyBibles. In addition, farm tractors, attachments,and harvesting equipment used by persons engagedprimarily in producing farm crops for sale are ex-empt in Georgia and Kentucky. Georgia also exemptedsales in operation of transit facilities.
In Hawaii, fees received by cooperative housingcorporations in reimbursement of funds paid forlease rental, real property taxes, and other costsof operating, maintaining, and improving the co-operative land are exempt from the general excisetax. Illinois granted an exemption from the serv-ice occupation and use tax of the sale, lease, ortransfer of tangible personal property to inter-
TABLE 6.--STATES ADOPTING CHANGES OR ACTION IN SELECTED STATE TAXES IN 1968
. State
IncomeGen-eral
sales
To-bac-co
Alco-holicbev-erages
Gas-oline
State
IncomeGen-eral
sales
To-bac-co
Alco-holicbev-erages
Gas-oline
Per-son-
al
Cor-po-rate
Per-son-al
Cor-po-rate
1 2 3 4 5 6 7 1 2 3 4 5 6 7
Alabama .. Montana .Alaska . X X Nebraska 0Arizona .. X X NevadaArkansas . X X N. H,Calif. X X X X .0. X N. 5. XX X XColorado . X 40 C 0 N. Mex. X X X XConn. New York . X X X X X XDelaware . XX N. C. .00 ..0 11.. ..0 00. .00Florida .. 0 X X X .. N. D. .4. ... ... 0.. IPO. .0.Georgia . X X Ohio .00 ... X 00. 00. .0.Hawaii ... X Oklahoma . X... X X 60. XIdaho X 11, Oregon 0.. .0. 0.. 000 O.. .0,0Illinois . 04 4 Pa. 000 X X 00. ... 00Indiana 0 R. I. X X X X .0. XIowa I S. C. X .0. X X X XKansas X X S. D. .... .00 ... X 0.. 40. 000Ky. X Tenn. x.00 x 0.0 x xLa. X .0. 0.. .0. X Texas 0.. .0. X 0.0 000 .00Maine .... a Utah 000 ... ..0 0.. .0. 00.Maryland X X.4.. 0.0 ... X Vermont . X... ... O.. 0.. XMass. ..., X X Virginia . XX X ... X 0..Michigan . X X Wash. 010. 000 O.. ... .0. ...Minn, a. W. Va. XX ... X .0. lb..Miss. .X X Wis. ... X .00 600 .04 0.0Missouri X
1
1 Wyoming . ... 0.41 ... 0.. 000 ...Note: X indicates change in existing tax.
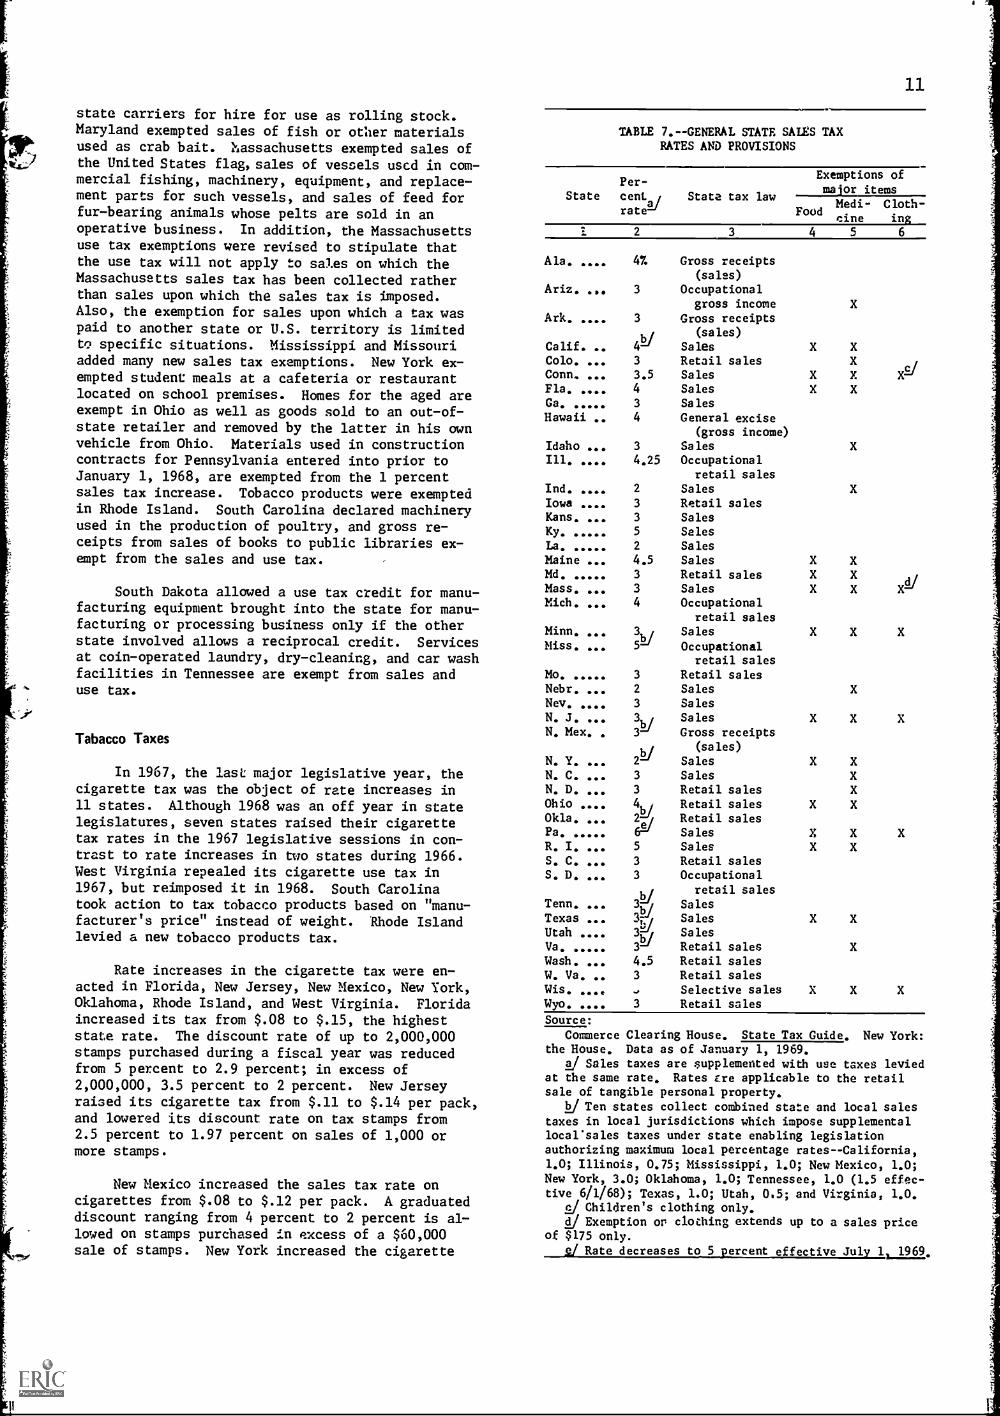
state carriers for hire for use as rolling stock.Maryland exempted sales of fish or other materialsused as crab bait. %assachusetts exempted sales ofthe United States flag, sales of vessels used in com-mercial fishing, machinery, equipment, and replace-ment parts for such vessels, and sales of feed forfur-bearing animals whose pelts are sold in anoperative business. In addition, the Massachusettsuse tax exemptions were revised to stipulate thatthe use tax will not apply to sales on which theMassachusetts sales tax has been collected ratherthan sales upon which the sales tax is imposed.
Also, the exemption for sales upon which a tax waspaid to another state or U.S. territory is limitedto specific situations. Mississippi and Missouriadded many new sales tax exemptions. New York ex-empted student meals at a cafeteria or restaurantlocated on school premises. Homes for the aged areexempt in Ohio as well as goods sold to an out-of-state retailer and removed by the latter in his ownvehicle from Ohio. Materials used in constructioncontracts for Pennsylvania entered into prior toJanuary 1, 1968, are exempted from the 1 percentsales tax increase. Tobacco products were exemptedin Rhode Island. South Carolina declared machineryused in the production of poultry, and gross re-ceipts from sales of books to public libraries ex-empt from the sales and use tax.
South Dakota allowed a use tax credit for manu-facturing equipment brought into the state for manu-facturing or processing business only if the otherstate involved allows a reciprocal credit. Servicesat coin-operated laundry, dry-cleaning, and car washfacilities in Tennessee are exempt from sales anduse tax.
Tabacco Taxes
In 1967, the last major legislative year, thecigarette tax was the object of rate increases in11 states. Although 1968 was an off year in statelegislatures, seven states raised their cigarettetax rates in the 1967 legislative sessions in con-trast to rate increases in two states during 1966.West Virginia repealed its cigarette use tax in1967, but reimposed it in 1968. South Carolinatook action to tax tobacco products based on "manu-facturer's price" instead of weight. Rhode Islandlevied a new tobacco products tax.
Rate increases in the cigarette tax were en-acted in Florida, New Jersey, New Mexico, New York,Oklahoma, Rhode Island, and West Virginia. Floridaincreased its tax from $.08 to $.15, the higheststate rate. The discount rate of up to 2,000,000stamps purchased during a fiscal year was reducedfrom 5 percent to 2.9 percent; in excess of2,000,000, 3.5 percent to 2 percent. New Jerseyraised its cigarette tax from $.11 to $.14 per pack,and lowered its discount rate on tax stamps from2.5 percent to 1.97 percent on sales of 1,000 ormore stamps.
New Mexico increased the sales tax rate oncigarettes from $.08 to $.12 per pack. A graduateddiscount ranging from 4 percent to 2 percent is al-lowed on stamps purchased in excess of a $60,000sale of stamps. New York increased the cigarette
11
TABLE 7.--GENERAL STATE SANS TAXRATES AND PROVISIONS
State
Ala.
Ariz.
Ark.
Calif.Colo.
Follaul.'.:::
Ga.
Hawaii
IdahoIll.
Ind.
IowaKans.Ky.La.
MaineMd.Mass.Mich.
Minn.
Miss.
Mo.
Nebr.Nev.
N. J.N. Mex.
N. Y.N. C.N. D.
OhioOkla.Pa.
R. I.
S. C.S. D.
Tenn.TexasUtahVa.
Wash.W. Va.
Wis.Wyo.
Per-cent
ratel/
StateState tax law
Exemptions ofmajor items
FoodMedi-eine
Cloth-ing
2 3 4 5 6
47.
3
3
412/
3
3.54
3
4
3
4.25
2
3
3
5
2
4.53
3
4
3ki5
3
2
3
3y3
2Y3
3
4,,i//
6/5
3
3
ti3Y1-143D3
4.5
3
,
3
Gross receipts(sales)
Occupationalgross income
Gross receipts(sales)
SalesRetail salesSalesSales
Sales
General excise(gross income)
SalesOccupational
retail salesSales
Retail salesSalesSales
Sales
SalesRetail salesSalesOccupational
retail salesSales
Occupationalretail sales
Retail salesSalesSalesSales
Gross receipts(sales)
SalesSalesRetail salesRetail salesRetail salesSalesSalesRetail salesOccupational
retail sales
SalesSales
SalesRetail salesRetail salesRetail salesSelective salesRetail sales
X
X
X
X
X
X
X
X
X
X
Y.
X
X
X
X
X
X
X
X
X
X
X
X
X
X
X
X
X
X
X
X
XX
X
X
X
EiX
I/X
X
X
X
X
Source:
Commerce Clearing House. State Tax Guide. New York:the House. Data as of January 1, 1969.
J Sales taxes are supplemented with use taxes leviedat the same rate. Rates ere applicable to the retailsale of tangible personal property.
I)/ Ten states collect combined state and local sales
taxes in local jurisdictions which impose supplementallocarsales taxes under state enabling legislationauthorizing maximum local percentage rates--California,1.0; Illinois, 0.75; Mississippi, 1.0; New Mexico, 1.0;New York, 3.0; Oklahoma, 1.0; Tennessee, 1.0 (1.5 effec-tive 6/1/68); Texas, 1.0; Utah, 0.5; and Virginia, 1.0.
(2/ Children's clothing only.
J Exemption or clothing extends up to a sales priceof $175 only.
2/ Rate decreases to 5 percent effective July 1 1969.

TABLE 8.--STATE CIGARETTE AND TOBACCO TAX RATES
State
Cigarettes
(per pack
of 20)
Cigars
Smoking
(per
tobacco
1,000)
Discount on
stamps
(percent of
face value)
State
Cigarettes
(per pack
of 20)
Cigars
Smoking
(per
tobacco
1,000)
Discount on
stamps
(percent of
face value)
12
34
51
23
45
Alabama
Alaska
Arizona
Arkansas
California
Colorado .
Connecticut
Delaware
Florida
Georgia
Hawaii
Idaho
Illinois
India :w
Iowa
Kansas
Kentucky
Louisiana
Maine
Maryland
Massachusetts
Michigan
Minnesota
Mississippi
Missouri
a/
100-
8
10 8
10 5 7
/
15gi
8a/
$1.50 to $20.25
2c to 11c perpack
1.00 to
10.00
lc per ounce
1.50 to
20.00
7.5%
1.0
1.5
6.0
0.85
6.0
2.25
3.5
2.92/
d/
2.0 to 8.0-
5.0
2-6/7 to
1-1/7a/
4.0
5.0
3.75
6.0f/
9.0
2.25
5.0
0.625 to
212/
1.0i
3.251/
8.0
3.0
Montana
Nebraska
Nevada
New Hampshire
New Jersey
New Mexico
New York
North Dakota
Ohio
Oklahoma
Oregon
Pennsylvania
Rhode Island
South Carolina
South Dakota
Tennessee
Texas
Utah
Vermont
Virginia
Washington
West Virginia
Wisconsin
Wyoming
8C
8 7
8.0%If
5.0
4.0
3.5
1.97,
4.01,
1.44T/
5.on/,
3.332/
4.0
4.175
3.0
2.0
5.0
4.0
4.15
2.25
4.0
2.0, 3.221
5.0
,
1.689f
4.0
2.4
6.01/
14
12
12 8 7
13 4
13
13 52/
8 8
11 8a/
10 2.5
11 7a
10_/
8
307, of retail price
117, of wholesale price
$6.50 to $30.00
407, of factory list
price
7 9 61/.
102/
8 2.5
810 6
10 7a/
8-'
9 4
407 of wholesale price
)
257. of wholesale price
(-307 of manufacturer's sales price-)
1.00 to
13.50
67. of wholesale
price
1.00 to
15.00
25% of factory list
price
(-257. of manufacturer's sales price-)
(107 of wholesale price
)
1.20 to
40.00
lc to 4c per
packg/
207 of wholesale
(107 of wholesale price-)
1.80 to
25.20
1-1/8c of each 5c of
retail price
307 of wholesale price
)
Source:
Commerce Clearing House.
State Tax Guide.
New York:
the ',louse.
Data as of
January 1, 1969.
J The tax rate shown applies to cigarettes of standard length and weight.
Foot-
note a/ designates those states with varying tax rates on cigarettes depending on
length and/or weight.
2/ Rates continue to increase at 3 cents for each additional ounce or fraction
thereof over 4 ounces.
2/ The discount rate in excess of 2 million stamps purchased in any one fiscal
year is 2 percent of par value.
El/ Depending on volume of cigarettes sold.
Present limitation i3 3.5 cents per
package.
J Depending on volume sold.
f/ For each $3.00 worth of o
'mps purchased, the purchaser receives an addi-
tional 18 cents worth of staml
g/ Plus $1.33 cents for eat
additional 5 cents of retail price above 15 cents
per package.
LI/ Licensees other than retailers are allowed a discount at the following rates:
chain store operators, 5.8 of 1 percent; vending machine operators, 1-1/4 percent;
and wholesalers, 2-1/2 percent.
No deduction is allowed on sales less than $100.
2/ Allowed to wholesalers.
i/ A discount of 2.5 percent is allowed on stamp purchases in excess of $150,000.
k/ A discount is applicable to the permanent levy of 5 cents per pack only; the
other 3 cents of the tax is veterans' bonus levy.
-Jl' A graduated discount is now in effect, ranging from 4 percent of stamp pur-
chases down to 2 percent.
No discount is allowed on any sale under $1,000.
2/ The discount rate is 1.22 percent of par value of stamp purchases in excess of
$600,000 per year.
LI/ Five percent on first $100,000 of stamps purchased; 4 percent on the excess.
2/ Discount rate is applicable to 6/7 of tax value regardless of amount of sales.
p/ The 3.2 percent discount rate applies to cigarette stamps only; a discount of
2 percent is allowed on other tobacco products.
g/ Discount applies to cigarette stamps only at rate of 2.0 percent on first 8
cents of tax per pack, 1 percent on next 2 cents of tax; 1/2 of 1 percent on last 1
cent tax.
I
-
TABLE 9.--STATE ALCOHOLIC BEVERAGES TAX RATES
State
Distilled
Wines
spirits
(per gallon)
(per gallon)
Malt
beverages
(per draught
gallon)
State
12
34
1
Alabama
$.426
Montana
30% of sellingprice)
)Alaska
$4.00
$.60
.25
Nebraska
Arizona
Arkansas
1.44/3/
.4212/
2.50-/
.75
.08
.202//
Nevada
New Hampshire
California
2.00
.01, .02A/
.04
New Jersey
Colorado
1.80
.20, .30
.06
New Mexico
Connecticut
2.00
.20, .50
.066
New York
Delaware
.90, 1,15
.80
.063
North Carolina
Florida
3.75, 7.50
1.15, 1.60,
2.30a/
.32
North Dakota
.
Georgia
3.75, 5.252
1.00, 2.0021
.31
Ohio
Hawaii
Oklahoma
(207. of wholesale price
Idaho
......
.15
Oregon
(107. of surcharge
)
Illinois
1.52
.23, .602/
.06
Pennsylvania
Indiana
2.08
.40
.088
Rhode Island
.Iowa
.12
South Carolina
(157. of established price
)
Kansasg/
1.50
.20, .50
.12
South Dakotai/
Kentucky!/
1.28
.50
.08
Tennesseeh/
Louisiana
1.68
.11, .21e/
.317,
Texas
Maine
.J
.24, .75 -/
.252/
Utah
Maryland
1.50
.20
.03
Vermont
Massachozetts,
2.95
/.40,,.50
.076
Virginia
....,
Michigan
8% of retail price
.502/
.203
Washington ...
Minnesota
2.87511/
.20, .60,
1.20h/
.05,
.10
West Virginia,
Mississippi.
2.50
.777
.427
Wisconsin...
Missouri
1.20
.15
.03
Wyoming
Source:
Commerce Clearing House.
State Tax Guide.
New York:
the House.
Data are as of January 1, 1969.
Note:
The tax rates on beer are usually reduced from
a per-barrel
rate to a per-gallon rate.
When not otherwise specified in the law,
one barrel = 31.5 gallons.
License taxes are not included in this
table.
a/ Monopoly state,.
Tax rates are in addition to any state price
markup.
2 In addition to the state sales
tax, a 3 percent tax is levied
on the retail sales price.
J An additional tax of $5.00 per barrel of 32 gallons is imposed
upon all beer sold or offered for sale.
2 There is a division of rates of specified alcoholic
content
where more than one tax rate i3 given.
The alcoholic content so
specified varies among the states.
The usual critical percentages
Distilled
spirits
(per gallon)
Wines
(per gallon)
23
Malt
beverages
(per draught
gallon)
4
$1.60
1.40
a/ 1.80
16% of retailprice)
$.20, .55
.30, .50
2./ .10
1.50, 2.40
..666, 2.25
12% of retail price
2.50, 4.05
.40
.10
. 60, .70
. 50, .60
'.12, .30
2.40
.36, .50
J.23
(18% of net selling pricea/8/
2.00
.20
2.72
1.08a/
1.25, 2.50
.25, .50
4.00
1.10
1.68
.13, .26
a/
(87. of retail selling price-,-f
5.10R/
.20, 1.202./
a/
107. of sales priye-
a/
.10A .t/
2/ 2.25
.17,,.34
.8ca/
.242/
/
) $.048
.08
. 06
.12
.033
.08
.04-4/9
.338
.08,
.161/
.079
.32
.042
).08
S 4
.13, .26
.11
.138, .165
.035, .129
.20
.193
.032,
.0481/
.17
.032
.02
are:
distilled spirits, 50% with the exception of Delaware and
New
York, which are near 257.; wines, 14% and under, 14 -217., and
over 21%;
beer, 3.2-4.0%.
e/ Discriminatory tax rates in favorof local products are used.
Tax rates given are not on local products.
f/ In lieu of the state sales
tax, an enforcement tax on retail
sales of 4.0 percent of gross receipts is levied.
gl Additional taxes
are imposed on the liquor industry, mainly
manufacturers.
12/ Includes a surtax of 15
percent levied until. June 30, 1969,
1/ The tax on beer sold in bulk
containers is $.08 per gallon; in
bottles and cans, $.16 per gallon.
1/ In lieu of the sales tax,
an additional tax of 10% is imposed
upon gross receipts of intoxicating liquor except high point beer.
Taxes on wholesale price of beer and alcohol
are also imposed.
/ Higher rate
on canned and bottled beer.
14
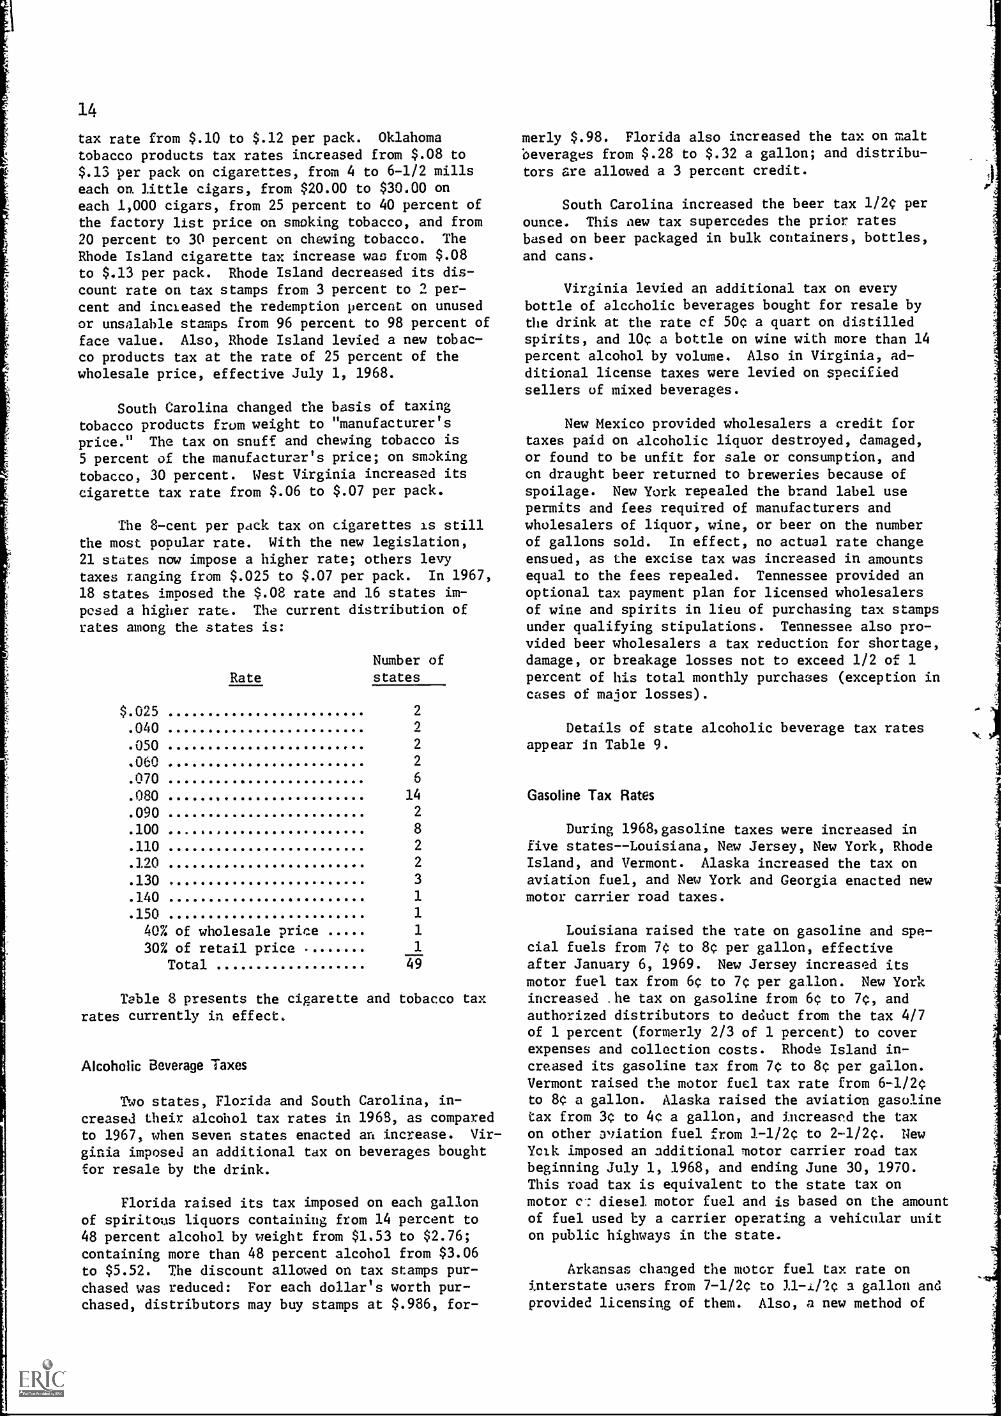
tax rate from $.10 to $.12 per pack. Oklahomatobacco products tax rates increased from $.08 to$.13 per pack on cigarettes, from 4 to 6-1/2 millseach on little cigars, from $20.00 to $30.00 oneach 1,000 cigars, from 25 percent to 40 percent ofthe factory list price on smoking tobacco, and from20 percent to 30 percent on chewing tobacco. The
Rhode Island cigarette tax increase was from $.08to $.13 per pack. Rhode Island decreased its dis-count rate on tax stamps from 3 percent to 2 per-cent and increased the redemption percent on unusedor unsalable stamps from 96 percent to 98 percent of
face value. Also, Rhode Island levied a new tobac-co products tax at the rate of 25 percent of thewholesale price, effective July 1, 1968.
South Carolina changed the basis of taxing
tobacco products from weight to "manufacturer's
price." The tax on snuff and chewing tobacco is5 percent of the manufacturer's price; on smoking
tobacco, 30 percent. West Virginia increased itscigarette tax rate from $.06 to $.07 per pack.
The 8-cent per pack tax on cigarettes is still
the most popular rate. With the new legislation,21 states now impose a higher rate; others levytaxes ranging from $.025 to $.07 per pack. In 1967,
18 states imposed the $.08 rate and 16 states im-
posed a higher rate. The current distribution ofrates among the states is:
Rate
Number ofstates
$.025 2
.040 2
.050 2
.060 2
.070 6
.080 14
.090 2
.100 8
.110 2
.120 2
.130 3
.140 1
.150 1
40% of wholesale price 1
30% of retail price 1
Total 49
Table 8 presents the cigarette and tobacco taxrates currently in effect.
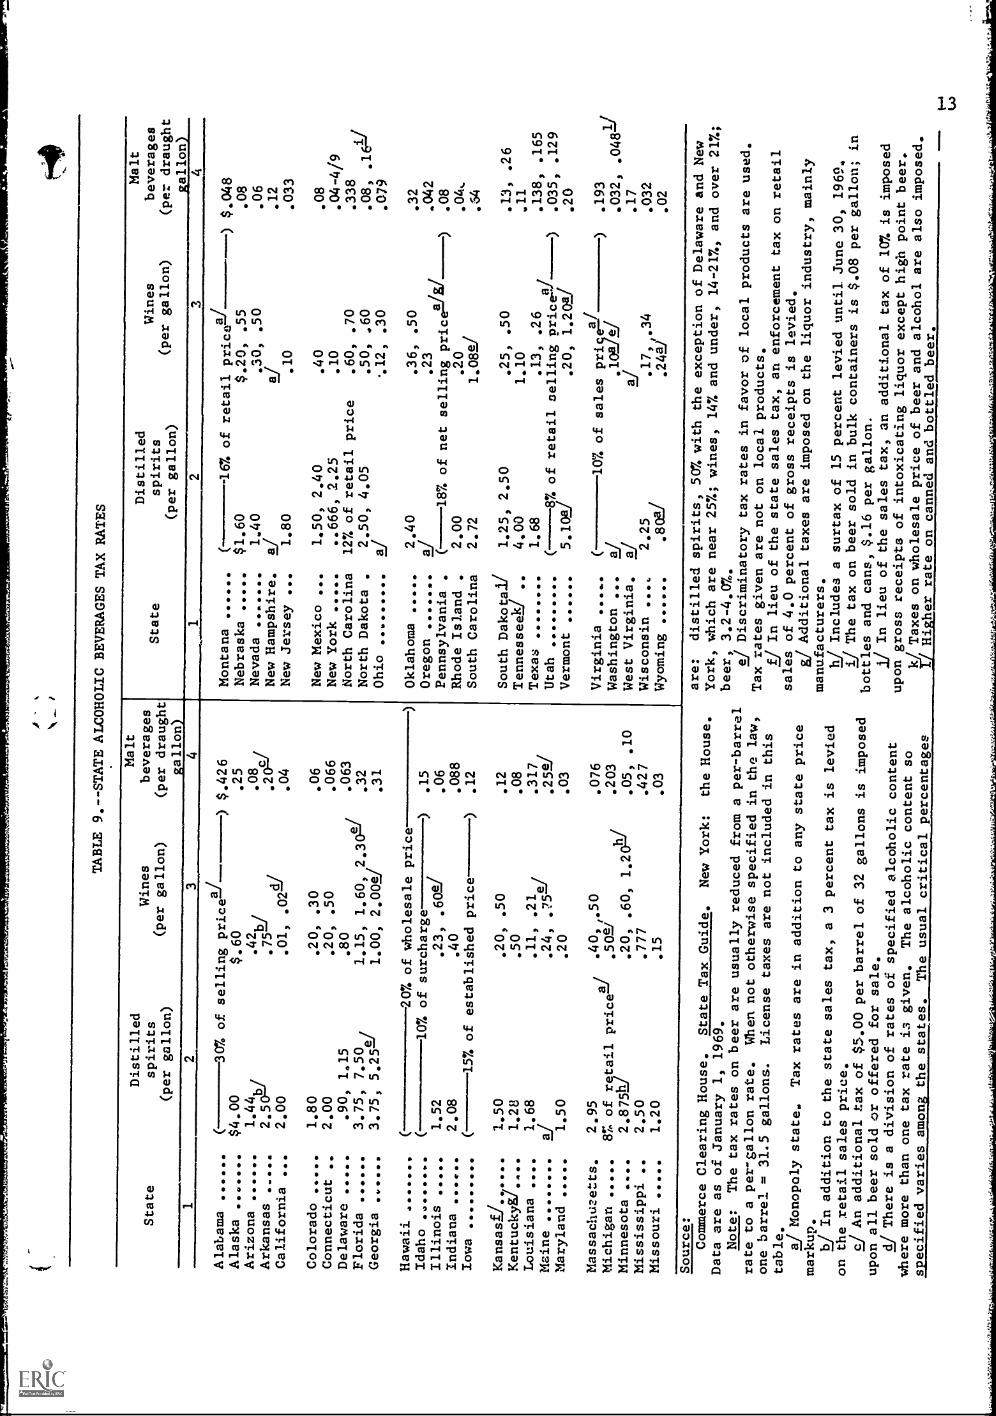
Alcoholic Beverage Taxes
Two states, Florida and South Carolina, in-creased their alcohol tax rates in 1963, as comparedto 1967, when seven states enacted an increase. Vir-
ginia imposed an additional tax on beverages boughtfor resale by the drink.
Florida raised its tax imposed on each gallonof spiritous liquors containing from 14 percent to48 percent alcohol by weight from $1.53 to $2.76;containing more than 48 percent alcohol from $3.06to $5.52. The discount allowed on tax stamps pur-
chased was reduced: For each dollar's worth pur-chased, distributors may buy stamps at $.986, for-
merly $.98. Florida also increased the tax on malt
beverages from $.28 to $.32 a gallon; and distribu-tors are allowed a 3 percent credit.
South Carolina increased the beer tax 1/2C per
ounce. This new tax supercedes the prior ratesbased on beer packaged in bulk containers, bottles,
and cans.
Virginia levied an additional tax on everybottle of alcoholic beverages bought for resale bythe drink at the rate cf 50c a quart on distilledspirits, and 10c a bottle on wine with more than 14percent alcohol by volume. Also in Virginia, ad-ditional license taxes were levied on specifiedsellers of mixed beverages.
New Mexico provided wholesalers a credit fortaxes paid on alcoholic liquor destroyed, damaged,or found to be unfit for sale or consumption, andon draught beer returned to breweries because ofspoilage. New York repealed the brand label usepermits and fees required of manufacturers andwholesalers of liquor, wine, or beer on the numberof gallons sold. In effect, no actual rate changeensued, as the excise tax was increased in amountsequal to the fees repealed. Tennessee provided anoptional tax payment plan for licensed wholesalersof wine and spirits in lieu of purchasing tax stampsunder qualifying stipulations. Tennessee also pro-vided beer wholesalers a tax reduction for shortage,damage, or breakage losses not to exceed 1/2 of 1percent of his total monthly purchases (exception incases of maior losses).
Details of state alcoholic beverage tax ratesappear in Table 9.
Gasoline Tax Rates
During 1968,gasoline taxes were increased infive states--Louisiana, New Jersey, New York, RhodeIsland, and Vermont. Alaska increased the tax onaviation fuel, and New York and Georgia enacted newmotor carrier road taxes.
Louisiana raised the rate on gasoline and spe-cial fuels from 7C to 8c per gallon, effectiveafter January 6, 1969. New Jersey increased itsmotor fuel tax from 6c to 7c per gallon. New Yorkincreased .he tax on gasoline from 6c to 7c, andauthorized distributors to deduct from the tax 4/7of 1 percent (formerly 2/3 of 1 percent) to coverexpenses and collection costs. Rhode Island in-creased its gasoline tax from 7c to 8c per gallon.Vermont raised the motor fuel tax rate from 6-1/2cto 8c a gallon. Alaska raised the aviation gasolinetax from 3c to 4c a gallon, and increased the taxon other aviation fuel from 1-1/2c to 21/2c. NewYet.k imposed an additional motor carrier road taxbeginning July 1, 1968, and ending June 30, 1970.This road tax is equivalent to the state tax onmotor c-: diesel motor fuel and is based on the amountof fuel used by a carrier operating a vehicular uniton public highways in the state.
Arkansas changed the motor fuel tax rate oninterstate users from 7-1/2c to 11-1/2c a gallon andprovided licensing of them. Also, a new method of
computing special motor fuel tax in Arkansas was en-acted. Arizona imposed limitations on motor vehicle
TABLE 10.--STATE GASOLINE TAX RATES)and aircraft fuel tax refunds. California allowedadditional exemptions on motor fuel and use fueltaxes. Watercraft gasoline tax refunds in Marylandare allowed only to watercraft used entirely forcommercial purposes. Oklahoma provided credit fortax paid per gallon on gasoline and special fuelused outside the state. South Carolina repealed thegasoline tax refund for watercraft and increasedthe maximum amount that an oil company may deductfor gasoline tax liability from $75 to $100.Tennessee expanded the motor fuel tax exemptionunder "governmental purposes" to include independentcontractors operating a local transit service.
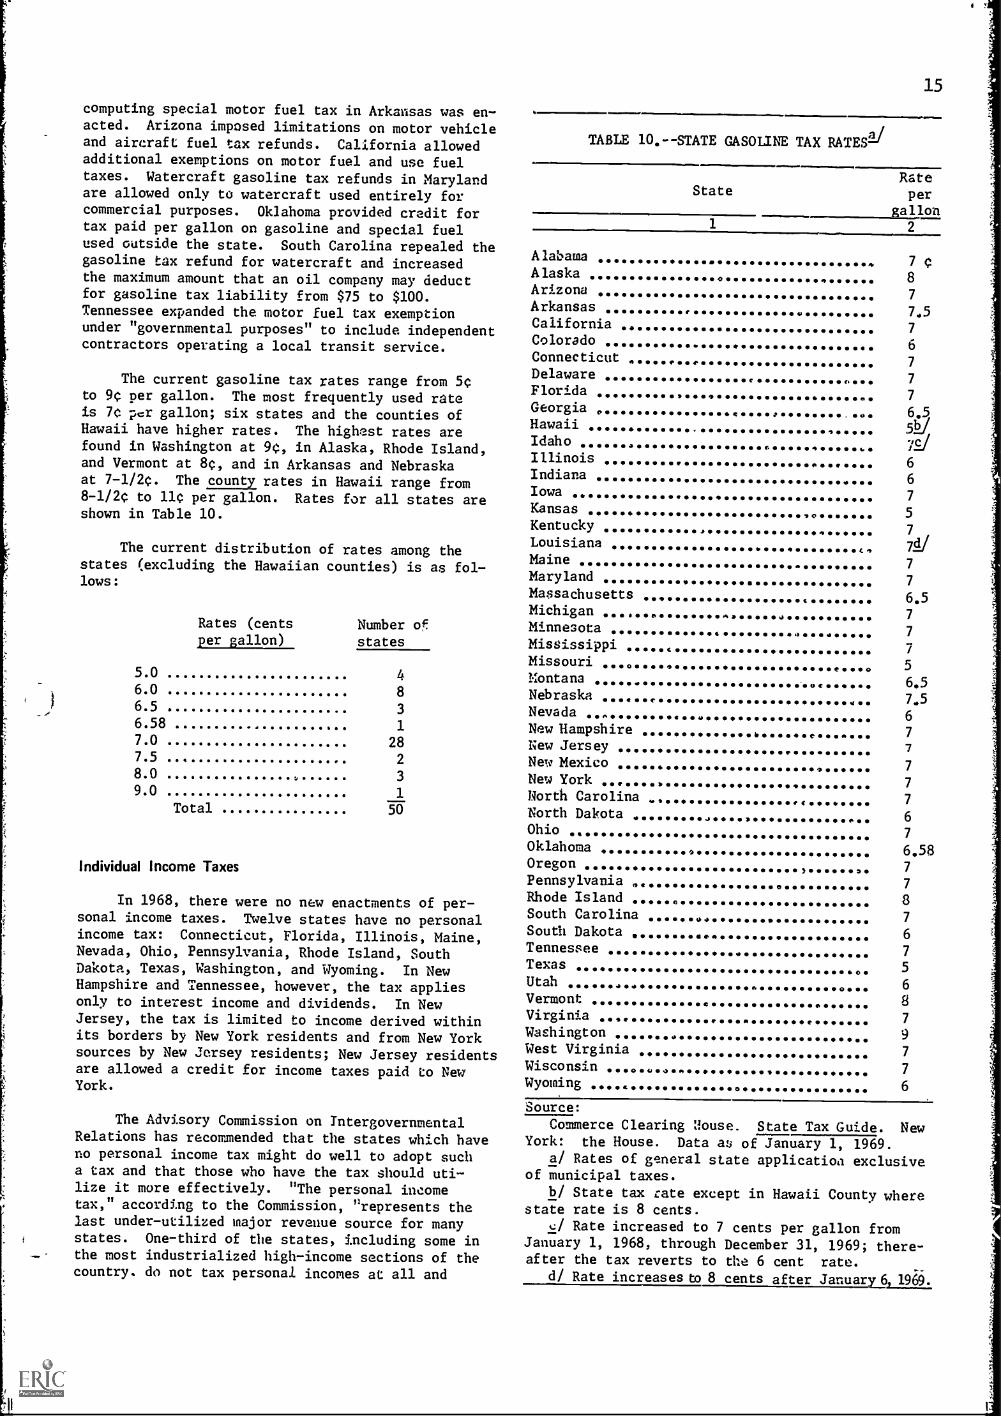
The current gasoline tax rates range from 5cto 9c per gallon. The most frequently used rateis 70 per gallon; six states and the counties ofHawaii have higher rates. The highest rates arefound in Washington at 9c, in Alaska, Rhode Island,and Vermont at 8c, and in Arkansas and Nebraskaat 7-1/2c. The county rates in Hawaii range from8-1/2c to 11c per gallon. Rates for all states areshown in Table 10.
The current distribution of rates among thestates the Hawaiian counties) is as fol-(excludinglows:
Rates (cents Number ofper gallon) states
5.0 46.0 8
6.5 3
6.58 1
7.0 287.5 2
8.0 39.0 1
Total 50
Individual Income Taxes
In 1968, there were no new enactments of per-sonal income taxes. Twelve states have no personalincome tax: Connecticut, Florida, Illinois, Maine,Nevada, Ohio, Pennsylvania, Rhode Island, SouthDakota, Texas, Washington, and Wyoming. In NewHampshire and Tennessee, however, the tax appliesonly to interest income and dividends. In NewJersey, the tax is limited to income derived withinits borders by New York residents and from New Yorksources by New Jersey residents; New Jersey residentsare allowed a credit for income taxes paid to NewYork.
15
StateRateper
gallon1 2
Alabama 7Alaska
aArizonasArkansas
87
7.5California 7Colorado bConnecticut 7Delaware 7Florida 7Georgia
. .0 6.5Hawaii 5121Idaho 721
6Indiana 6Iowa 7Kansas 5Kentucky 7Louisiana 7JMaine 7
Maryland 7
Massachusetts 6.5Michigan 7Minnesota 7
Mississippi 7Missouri 5Montana 6.5Nebraska 7.5Nevada 6New Hampshire 7
New Jersey 7
New Mexico 7New York 7
North Carolina . 7
'North Dakota 6Ohio 7Oklahoma 6.58Oregon 7Pennsylvania 7
Rhode Island 8South Carolina 7South Dakota 6Tennessee 7Texas 5Utah 6Vermont 8Virginia 7
Washington 9West Virginia 7
Wisconsin 7
Wyoming 6
Source:The Advisory Commission on Intergovernmental Commerce Clearing Uouse. State Tax Guide. New
Relations has recommended that the states which have York: the House. Data as of January 1, 1969.no personal income tax might do well to adopt such a/ Rates of general state application exclusivea tax and that those who have the tax should uti- of municipal taxes.lize it more effectively. "The personal income b/ State tax rate except in Hawaii County wheretax," according to the Commission, "represents the state rate is 8 cents.last under-utilized major revenue source for many c/ Rate increased to 7 cents per gallon fromstates. One-third of the states, including some in January 1, 1968, through December 31, 1969; there-- the most industrialized high-income sections of the after the tax reverts to the 6 cent rate.country. do not tax personal incomes at all and d/ Rate increases to 8 cents after January 6 1969.

16
TABLE 11.--STATE INDIVIDUAL INCOME TAX RATES
State
Range of Minimumrates rate on
(percent of taxabletaxable incomeincome) of:
Maximumrate ontaxableincomeover:
1 2 3 4
Ala,Alaska
1.5%-5.07.
(--16.07. of
$1,000 $5,000federal income taxli-)
Ariz. 2.0-8.0 1,000 6,000Ark. 1.0-5.0 3,000 25,000Calif. 1.0-10,C 2,000 14,000Colo. 3.0-8.0k/ 1.000 10,000Del. 1.5-11.0 1,000 100,000Ga. 1.0-6.0 1,000 10,000Hawaii 2.25-11.0 500 30,000Idaho 2.5-9.091 1,000 5,000Ind. (--2.07. of adjusted gross income-)Iowa 0.75-5.25 1,000 9,000Kans. 2.0-6.5 2,000 7,000Ky. 2,0-6.0 3,000 8,000La, 2.0-6.0 10,000 50,000Md. 2,0-5,0 1,000 3,000Mass (-4.0% of adjusted gross incomedA)Mich. (-2.6% of adjusted gross income-)Minn. 1.5-12.0 500 20,000
State
Range cf Minimum Maximumrates rate on rate on
(percent of taxable taxabletaxable income incomeincome) of: over:
1 2 3 4
Miss. 3.0%-4.0% $5,000 $5,000Mo. 1.0-4.02/ 1,000 9,000Mont.J 2.0-10.0 1,000 25,000Nebr. (- 10.0% of federal income tax-)
4.25% interest and dividends onlyN. J.&/ 2.0-14.0 1,000 23,000N. Mex. 1.5-6.0 10,000 100,000N. Y. 2.0-14AV 1,000 23,000N. C. 3.0-7.0 2,000 10,000N. D. 1.0-11.0 3,000 15,000Okla. 1.0-6.0 1,500 7,500Oreg. 3.0-9.5 500 8,000S. C. 2.0-7.0 2,000 10,000Tenn. 6.0% interest and dividends onlyUtah 2.0-6.5 1,000 5,000Vt. (---25.0% of federal income tax-)Va. 2.0-5.0 3.000 5,000W, Va. 1.2-5.5 2,000 200,000i/Wis. 2.7-10.0 1,000 14,000
Source:
Commerce Clearing House. St.72te Tax Guide. NewYork: the House. Data as of January 1, 1969.
J Percent of federal rates effective onDecember 31, 1963.
1)/ A surtax of 2 percent on intangible incomecver $3,000.
J Filing fee of $10 required per return,J Tax is 4 percent on earnings from employment,
profession, trade, or business; 2 percent on incomefrom annuities; 8 percent on interest and dividendsincome; 3 percent on capital gains on intangibles.
et Less tax credits in each bracket, except thefirst, from $5 to $135.
I/ After computing tax, taxpayers may subtract5 percent of the tax due.
e The tax is applicable only to income derivedfrom New Jersey sources by New York residents andfrom New York sources by New Jersey residents. NewJersey residents are allowed a credit for incometax paid to New York.
J Unincorporated businesses are taxed at apermanent rate of 5.5 percent.
J The same progression of rates applies tobrackets twice as large in the case of a jointreturn or a return of a surviving spouse.
another third tax them at relatively low effectiverates . "3 /
In state legislative actions during 1968, threestates and the District of Columbia increased per-sonal income tax rates. Mississippi increased theindividual income tax rates from 2 percent to 3 per-cent on the first $5,000 of taxable income and from3 percent to 4 percent on the remaining taxableincome. New Jersey raised the commuters' incometax rates on individuals with taxable income derivedfrom New Jersery sources in excess of $17,000 (for-merly $15,000). New York added new personal incomebrackets for taxable income over $17,000 as follows:over $17,000 but not over $19,000, 11 percent; over$19,000 but not over $21,000, 12 percent; over
3/ Advisory Commission on Intergovernmental Re-lations. 1967 State Legislative Program. M-33.Washington, D.C.: the Commission, September 1966.p. 6.
$21,000 but not over $23,000, 13 percent; and over$23,000, 14 percent. The District of Columbiaraised its personal income tax to 2 percent on thefirst $1,000 of taxable income, 3 percent on thenext $2,000, 4 percent on the ne:ft $2,000, 5 percenton the next $5,000, and 6 percent on taxable incomeover $10,000. Formerly, the rates ranged from 2.5percent on the first $2,000 of taxable income to 5percent on that exceeding $10,000. New Mexico elim-inated its deduction for federal income taxes.Hawaii, Massachusetts, Oklahoma, and Wisconsin pro-vided credit for taxes paid in other states for in-come earned in another state.
A few states enacted specific federal provi-sions. Arkansas adopted the federal law regardingthe deduction of medical expenses as in effect onJanuary 1, 1967. California made personal incometax annuity provisions conform to federal law. ForKansas income tax purposes, terms used are definedidentically as when used in the Internal RevenueCode as in effect on January 1, 1968. In Missouri,

17
TABLE 12.--STATE INDIVIDUAL INCOMF. TAX PROVISIONS
State Personal exemptions and credits Additionalexemptions
Tax iswithheld
Federal Federal in-income come usedtax de- as stateductible tax base
Single Married DependentsAged Blind
2 3 4 5 6 7 8 9
Alabama $1,500 $3,000 $300 ... ... X X ...Alaska 600 1,200 600 $600 $600 X ... XArizona 1,000 2,000 600 1,000 500 X X ...Arkansaslif 17.50 35 6
"l b/ "' ... ...Californiaa/ 25 50 8 20 -- 8 )X (q/
... ...Colorado 750 1,500 750 750 750 X X4/ XDelaware 600 1,200 600 600 600 X X-1 ...Georgia 1,500 3,000 600 600 600 X ... ...Hawaii 600 1,200 600 ... 5,000 X ... XIdahol/ 600 1,200f/ 600 600 600 X X XIndiana 1,000 2,000-1 500 500 500 X ... XIowaa/ 15 30 10 15 15 X X XKansas OOO Od 600 1,200 600 600 600 X X XKentuckyA/ 20 40 20 20 20 X X XLouisiana 2,50C 5,000 400 ... 1,000 X X ...Maryland
Massachusettag/800
2, 000
1,600k/2,600--/
800600
800600
8002.000
XX Xi /
X.0
Michigan 1,200 2,400 1,200 1,200 1,200,/ X ... XMinnesota) 19 38 19 20 20-1/ X X XMississippi 4,000 6,000 ... ... ... X .... ...Missouri 1,200 2,400 400 ... ... X X XMontana 600 1,200 600 600 600 X X XNebraska 600 1,200 600 600 600 X X XNew Hampshireh/ 600 600 ... ... ... ... ...New Jersey1/ 600 / 1,200 / 600 600 600 }(i/ ... XNew Mexico 60019/ 1,200921 600 600 600 X ... XNew York) 600 1,200 600 600 600 X ... XNorth Carolina 1,000 2,000 600 ... 1,000
XS/... ...
North Dakota 600 1,500 600 600 600 X X XOklahoma .... , 1,000 2,000 500 X X ...Oregon 600 1,200 600 q22/ 60P-/ X XA/ ...South Carolina 800 1,600 800 800 800 X X=1 ...Utah 600 1,200 600 200r-/ 1,200 X X ...Vermont 600 1,200 600 600 600 X ... XVirginia 1,000 2,000 300 600 600 X ... ...West Virginiag/ . 600 1,200 600 600 600 X ... XWisconsin 10 20 10 15 ... X ... XSource:
Commerce Clearing House. State Tax Guide. New York: the House. Data as of January 1, 1969.2/ Personal exemptions and credits for dependents are allowed in the form of credit against the tax.J Maximum credit allowed retired persons; although no age is specified, retired persons may receive a
tax credit equal to the tax on retirement income up to $2,000,J Withholding is for nonresidents only.El/ Deductions limited.
e/ Idaho lso provides for a credit against the tax of $10 per exemption.1/ Applic le when each spouse earns at least a $1,000 and a joint return is filed; otherwise, $1,500.z/ An additional exemption of up to $2,000 of income from dividends, interest, annuities, and capital
gains on intangibles if taxpayer's total income does not exceed $2,000 or spouses' combined income doesnot exceed $2,500.
h/ Minimum allowance; if both spouses earn income exceeding $2,000, personal exemption is $4,000; forspouse earning less than $2,000 but more than $600, personal exemption is the amount of income plus $2,000for other spouse.
J Limited to taxes paid on income taxed by Massachusetts.i/ Rate for single blind persons $20; $25 for married blind persons.J A $600 exemption is allowed on each income taxable. New Hampshire has a tax on dividends and
interest only.
1/ See Table 11, footnote g/ for taxpayers required to file return. Tax credits are also allowed.2/ No tax on income for married taxpayer filing a joint return or individual taxpayer with dependent if
net income is $1,500 or less.
2/ Single taxpayer is granted tax credit of $10; joint return, head of household, or surviving spouseis allowed $25 tax credit.
2/ Tax credits allowed: $18 for blind taxpayer or spouse and $12 for taxpayer or spouse if 65 or older.2/ This additional exemption for taxpayers over age 65 will increase to $400 in 1969 and $600 thereafter.a/A credit is allowed for liability of taxpayer under the business and occupation tax and for the
transportation privilege tax,

18
voters approved the provision that income tax maybe based on federal income tax law. In West Vir-ginia, amendments to federal laws made prior toJanuary 1, 1968 (instead of November 27, 1964),will be given effect in determining the tax imposed
beginning January 1, 1968, and thereafter under thestate personal income tax law.
Among the states making revisions in personalincome tax provisions was Arkansas which revisedrequirements for credit for dependents. The $6credit is allowed for each individual, other thanhusband or wife, whose income was less than $1,750,has not filed a joint return with a spouse, and isdependent upon the ta;:payer. California adoptionexpenses are deductible to the extent that expensesexceed 3 percent of the taxpayer's adjusted grossincome. Also, in California, the optional standarddeductions were increased; for individual incometaxpayers, from $500 to $1,000; for heads of house-holds or married couples filing jointly, from $1,000to $2,000. Delaware granted an additonal incometax exemption of $300 per taxable year for head ofhousehold. Idaho broadened the $10 income tax cred-it for sales tax paid to include a $10 credit for
each personal exemption claimed on the federal in-come tax return. In Massachusetts, persons 65 orover get full additional $600 exemption from busi-ness income if filing a joint return with spouse.
Mississippi decreased the amount of personal ex-emption for single individuals, from $5,000 to$4,000; for married individuals and heads of (Louse-holds, from $7,000 to $6,000. Educational expensesin South Carolina are now deductible from gross in-come for income tax purposes.
Other legislative amendments to state incometax laws in 1968 dealt with reporting requirements,time of payment, and exemptions. The chief provi-sions of individual income tax laws are given bystate in Tables 11 and 12.
Corporation Net Income Taxes
Corporation taxes are now imposed by 40 states.During 1968, no states enacted view corporate incometaxes. However, five states and the District ofColumbia increased their corporate income tax rates.Rhode Island and Virginia enacted provisions requir-ing declaration of estimated tax by corporations,and Maryland imposed a new 7 percent franchise taxon financial institutions.
The District of Columbia corporate income taxwas increased from 5 percent to 6 percent on foreignand domestic corporations for income derived fromsources within the District. The corporation incometax rate in Maryland was increased from 5-1/2 per-cen to 7 percent, effective January 1, 1968, withproration for fiscal years beginning with 1967 andending in 1968. Mississippi increased the corporateincome tax from 2 percent to 3 percent on the first$5,000 of a taxable income and from 3 percent to4 percent on the remaining taxable income with pro-ration for fiscal years beginning in the calendaryear 1967. New Jersey raised the corporate net in-come tax rate from 3-1/4 percent to 4-1/4 percent.Proration will apply if the privilege period coversany period prior to January 1, 1968. The corpora-tion franchise tax rate for New York was increasedfrom 5-1/2 percent to 7 percent and the minimum tax
payment from $25 to $100. This tax may be proratedfor the fiscal years beginning in 1967 and endingin 1968. Rhode Island repealed the manufacturer's10 percent business corporation surtax that was tobecome effective June 30, 1968, but raised the busi-ness corporation tax from 6 percent to 7 percent,effective July 1, 1968.
In other legislative actions relating to cor-porate income taxes, Alaska provided a 10-year taxcredit to anyone who establishes, owns, or proposesto establish or own an industrial business. NewYork revised the business corporation income tax al-location formula to include all :ales of tangiblepersonal property shipped to points within thestate. Louisiana enacted legislation to tax domes-tic corporations only on net income from sourceswithin Louisiana, instead of on all net income, ef-fective after December 31, 1968. In 1967, theTennessee legislature postponed a 7 percent tax onthe net income of building and loan associationsfrom July 1, 1970, to July 1, 1971. This post-ponement still remains valid. Until that time thetax will be based on gross income and levied at a3 percent rate As provided by the legislation,the alternate tax methods for the intervening yearswill be revised as follows: 7 percent of net in-come or 74 percent (previously 65 percent) of the3 percent gross income tax for the tax imposedJuly 1, 1967; 7 percent of net income or 67 percent(previously 56.5 percent) of the gross income taxfor the tax imposed July 1, 1968; and 7 percent ofnet income or 61 percent (previously 50 percent) ofthe gross income tax.for the tax :;mposed July 1,1969. The tax to be levied on July 1, 1970, willbe imposed at 7 percent of net income or 50 percentof the gross income tax.
Of the 40 states taxing corporate income, only13 allow the deduction of federal income tax pay-ments, including three which allow such a deductionon a limited basis. Thirty-two states impose thecorporate income taxes at a flat rate. Graduatedrates, at a range of at least two steps, are in ef-fect in eight states. In seven of the eight statestaxing corporations at graduated rates, the highestbracket begins at or below the $25,000 level; how-ever, in the remaining state (Iowa) the lowest
bracket begins at $25,000 or below and the highestat $100,000 down to the $75,000 level. Details ofthe corporate income tax rates and provisions ap-pear in Table 13.
Local Sales and Income Taxes
The term "piggy-back" tax has frequently beenused to denote a supplementary tax which stateshave permitted cities or counties to levy in addi-tion to the tax levied by the state. Increasingly,the tax has been a broad-based local sales tax or alocal income tax. Although not common until the1950's, the local sales tax had been authorized by10 states by 1963.4/ Local sales taxes are now
4/ For further discussion and detail see CEFReport No. 14, State Taxes in 1966, May 1967; and,Colman, William G. "Local Taxation." Addressgiven at the National Conference on Local GovernmentFiscal Policy, Washington, D.C., November 16-19,1966. Municipal Finance 39: 99-103; February 1967.
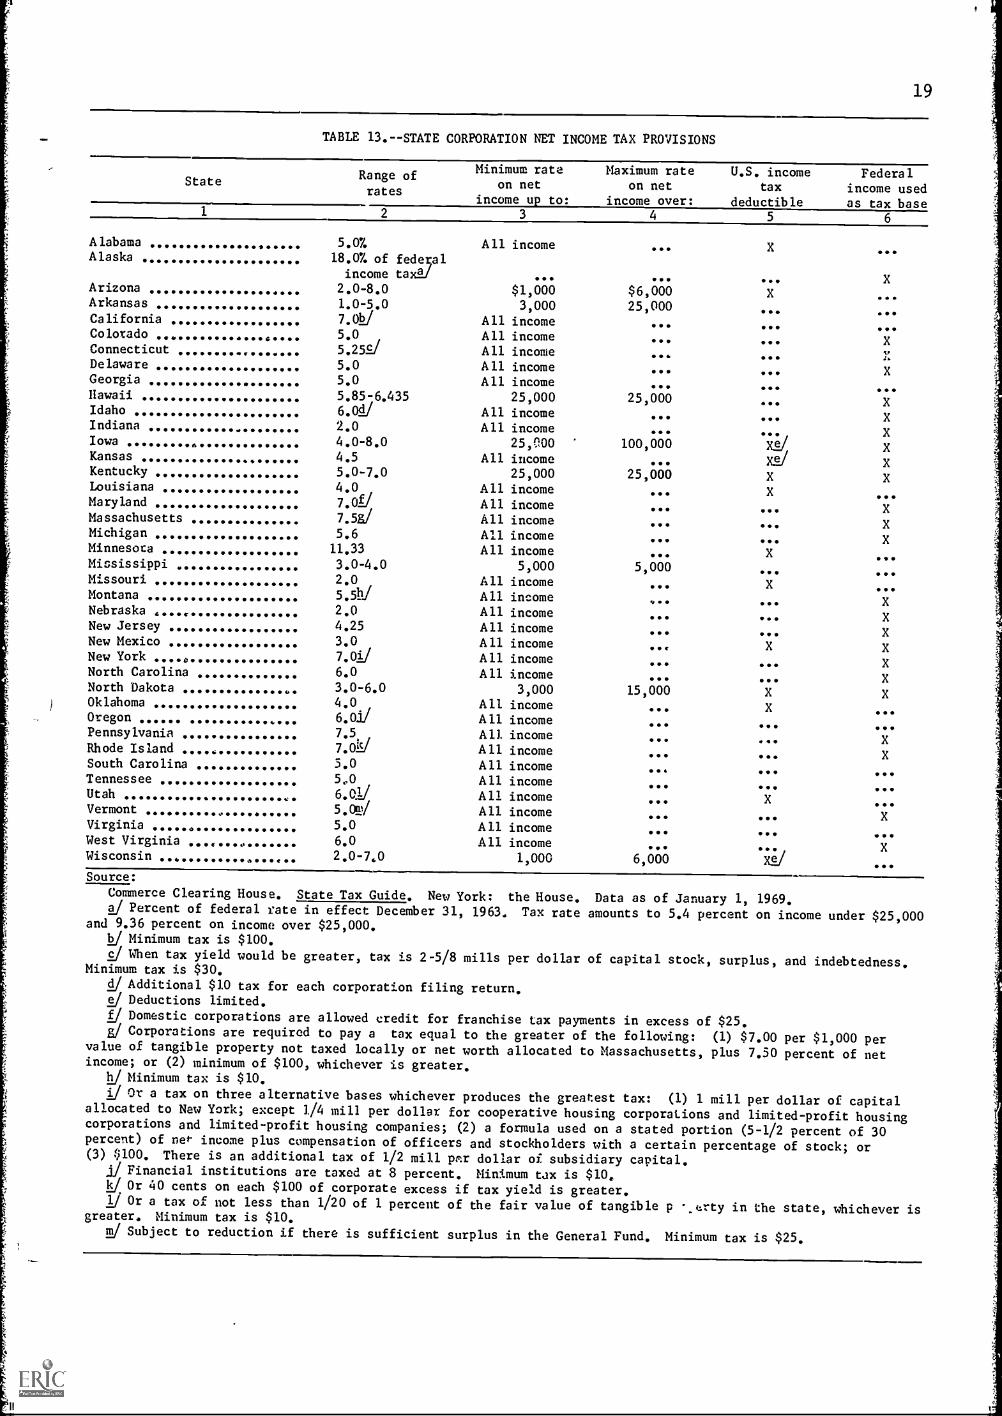
19
TABLE 13.--STATE CORPORATION NET INCOME TAX PROVISIONS
State Range ofrates
Minimum rateon net
income up to:
Maximum rateon net
income over:
U.S. incometax
deductible
Federalincome usedas tax base
1 2 3 4 5 6
Alabama 5.0% All income ... X ...Alaska 18.0% of federal
income taxJ ... ... ... XArizona 2.0-8.0 $1,000 $6,000 X ...Arkansas 1.0-5.0 3,000 25,000 ... ...California 7.012/ All income ... ... ...Colorad 5.0 All income ... ... XConnecticut 5.252./ All income 00* 000Delaware 5.0 All income ... ... XGeorgia 5.0 All income ... ... ...Hawaii 5.85-6.435 25,000 25,000 ... XIdaho 6.0e All income ... ... XIndiana 2.0 All income ... ... XIowa 4.0-8.0 25,000 100,000 x2/ XKansas 4.5 All income ... Xa/ XKentucky 5.0-7.0 25,000 25,000 X XLouisiana 4.0 All income ... X ..Maryland 7.01/ All income ... ... XMassachusetts 7.5g/ All income ... ... XMichigan 5.6 All income ... ... XMinnesota 11.33 All income ... X 090Mississippi 3.0-4.0 5,000 5,000 ... ...Missouri 2.0 All income ... X ...Montana 5.5h/ All income v.. ... XNebraska 2.0 All income ... ... XNew Jersey 4.25 All income ... ... XNew Mexico 3.0 All income ... X XNew York ... 7.01/ All income ... ... XNorth Carolina 6.0 All income ... ... XNorth Dakota 3.0-6.0 3,000 15,000 X XOklahoma 4.0 All income ... X ...Oregon 6.01/ All income ... ... ...Pennsylvania 7.5 Al], income ... ... XRhode Island 7.0/ All income ... ... XSouth Carolina 5.0 All income ... ... ...Tennessee 5,0 All income ... .. ...Utah 6.01/ All income ... X ...Vermont 0 5.0111/ All income ... ... XVirginia 5.0 All income ... ... ...West Virginia 0 6.0 All income ... ... XWisconsin 2.0-7,0 1,000 6,000 Xa/ ...Source:
Commerce Clearing House. State Tax Guide. New York: the House. Data as of January 1, 1969.J Percent of federal rate in effect December 31, 1963. Tax rate amounts to 5.4 percent on income under $25,000
and 9.36 percent on income over $25,000.12/ Minimum tax is $100.
J When tax yield would be greater, tax is 2-5/8 mills per dollar of capital stock, surplus, and indebtedness.Minimum tax is $30.
J Additional $10 tax for each corporation filing return.J Deductions limited.f/ Domestic corporations are allowed credit for franchise tax payments in excess of $25.J Corporations are required to pay a tax equal to the greater of the following: (1) $7.00 per $1,000 per
value of tangible property not taxed locally or net worth allocated to Massachusetts, plus 7.50 percent of netincome; or (2) minimum of $100, whichever is greater.
J Minimum tax is $10.i/ Or a tax on three alternative bases whichever produces the greatest tax: (1) 1 mill per dollar of capital
allocated to New York; except 1/4 mill per dollar for cooperative housing corporations and limited-profit housingcorporations and limited-profit housing companies; (2) a formula used on a stated portion (5-1/2 percent of 30percent) of net income plus compensation of officers and stockholders with a certain percentage of stock; or(3) $100. There is an additional tax of 1/2 mill pnr dollar of subsidiary capital.
..1./ Financial institutions are taxed at 8 percent. Minimum tax is $10,1c4 Or 40 cents on each $100 of corporate excess if tax yield is greater.
Or a tax of not less than 1/20 of 1 percent of the fair value of tangible p -.trty in the state, whichever isgreater. Minimum tax is $10.
J Subject to reduction if there is sufficient surplus in the General Fund. Minimum tax is $25.
II
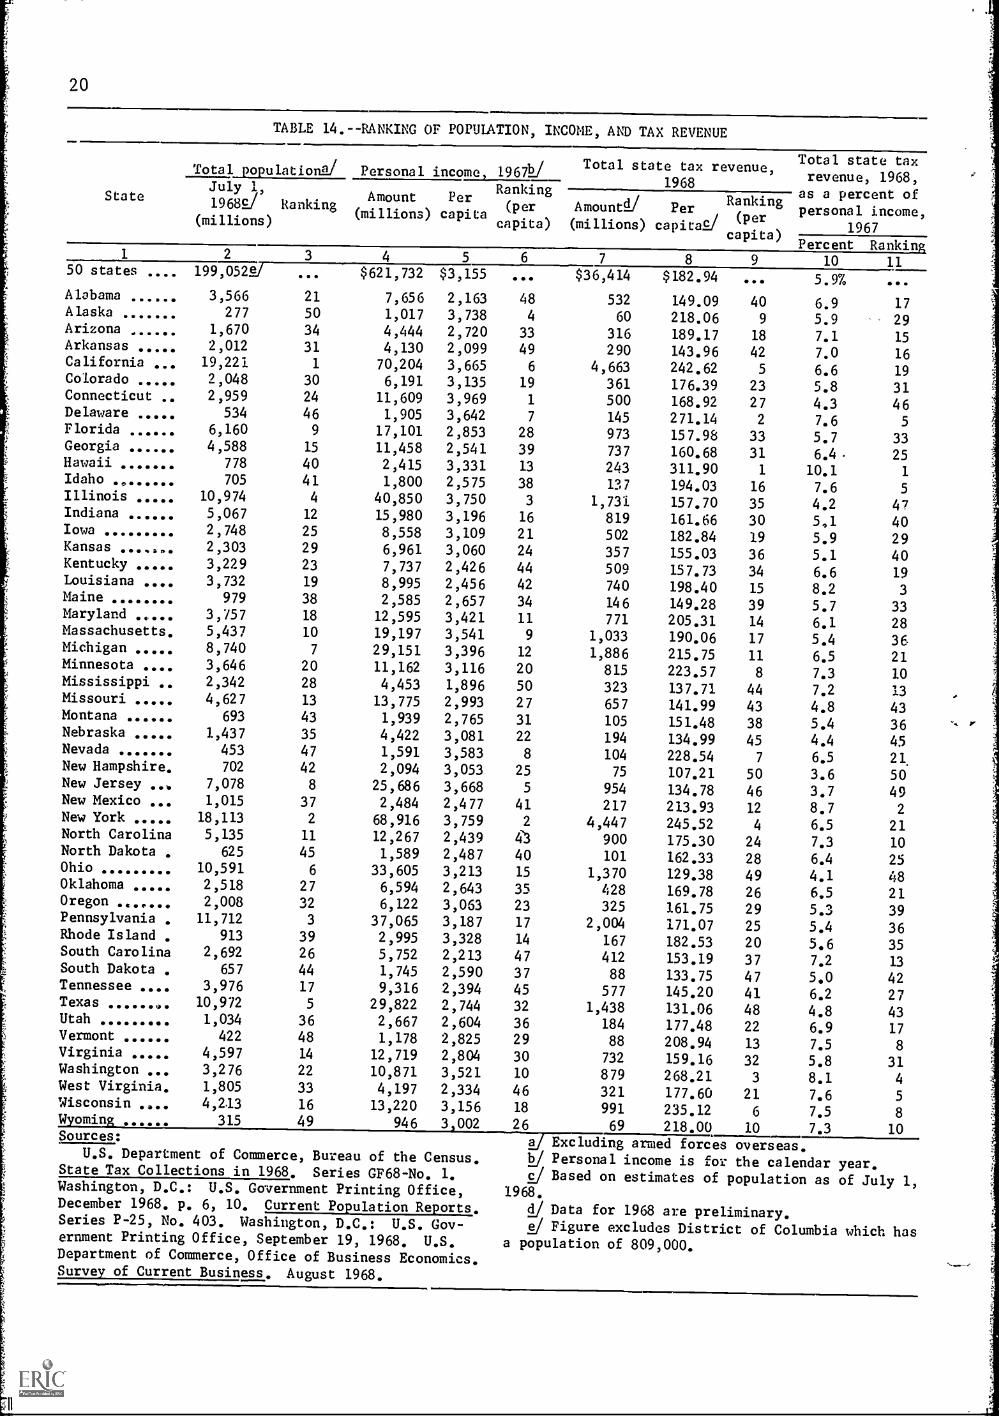
20
TABLE 14.--RANKING OF POPULATION, INCOME, AND TAX REVENUE
State
Total population2/July 1,
1968 Ranking(millions)
1 2 3
Personal income 196t/Ranking(per Amount
capita) (millions)
Amount Per(millions) capita
50 states
AlabamaAlaskaArizonaArkansasCaliforniaColoradoConnecticutDelawareFloridaGeorgiaHawaiiIdaho ......
IllinoisIndianaIowa
Kansas
KentuckyLouisianaMaineMarylandMassachusettsMichiganMinnesota
Mississippi .MissouriMontana
NebraskaNevadaNew Hampshire,New JerseyNew MexicoNew YorkNorth CarolinaNorth DakotaOhioOklahomaOregonPennsylvaniaRhode IslandSouth CarolinaSouth DakotaTennesseeTexas ...... 0Utah
VermontVirginiaWashingtonWest Virginia.Wisconsin .a
WyomingSources:
U.S. Department of Commerce, Bureau of the Census.State Tax Collections in 1968. Series GF68-No. 1.Washington, D.C.: U.S. Government Printing Office,December 1968. p. 6, 10. Current Population Reports.Series P-25, No. 403. Washington, D.C.: U.S. Gov-ernment Printing Office, September 19, 1968. U.S.Department of Commerce, Office of Business Economics.Survey of Current Business. August 1968.
199,0522/
3,566277
1,6702,01219,2212,0482,959
534
6,1604,588
778
705
10,974
5,0672,7482,303
3,229
3,732
979
3,./57
5,4378,7403,6462,342
4,627693
1,437453
702
7,0781,015
18,113
5,135
625
10,591
2,5182,008
11,712
913
2,692
657
3,97610,972
1,034
422
4,5973,276
1,805
4,213
315
21
50
34
311
30
24
46
9
15
40
414
12
25
29
23
19
38
18
10
7
20
28
13
43
35
47
42
8
37
2
11
45
6
2732
3
39
26
44
17
5
36
4814
22
33
16
49
4
$621,732
7,6561,017
4,444
4,13070,204
6,19111,609
1,905
17,10111,458
2,415
1,800
40,85015,980
8,558
6,9617,737
8,9952,585
12,595
19,197
29,15111,162
4,45313,775
1,939
4,4221,591
2,094
25,686
2,484
68,91612,267
1,589
33,605
6,594
6,12237,0652,995
5,7521,745
9,31629,8222,6671,178
12,719
10,871
4,19713,220
946
5
$3,155
2,163
3,7382,7202,099
3,6653,135
3,9693,6422,8532,541
3,3312,575
3,7503,1963,1093,0602,426
2,456
2,6573,4213,5413,3963,1161,896
2,9932,765
3,0813,5833,053
3,6682,477
3,7592,4392,487
3,2132,6433,0633,187
3,3282,213
2,5902,3942,744
2,6042,8252,804
3,5212,3343,156
3,002
Total state tax revenue,1968
PerRanking
capicaR/(per
capita)
Total state taxrevenue, 1968,
as a percent of
personal income,1967
Percent Rankin6 7 8 9 10 11
$36,414 $182.94 ... 5.9%
48 532 149.09 40 6.9 174 60 218.06 9 5.9 29
33 316 189.17 18 7.1 1549 290 143.96 42 7.0 166 4,663 242.62 5 6.6 19
19 361 176.39 23 5.8 311 500 168.92 27 4.3 467 145 271.14 2 7.6 5
28 973 157.98 33 5.7 3339 737 160.68 31 6.4 2513 243 311,90 1 10.1 138 137 194.03 16 7.6 53 1,731 157.70 35 4.2 4716 819 161.66 30 5,1 4021 502 182.84 19 5.9 2924 357 155,03 36 5.1 4044 509 157.73 34 6.6 1942 740 198,40 15 8.2 334 146 149.28 39 5.7 3311 771 205,31 14 6.1 289 1,033 190.06 17 5,4 36
12 1,886 215.75 11 6.5 2120 815 223.57 8 7.3 1050 323 137.71 44 7.2 1327 657 141.99 43 4.8 4331 105 151.48 38 5.4 3622 194 134.99 45 4.4 458 104 228.54 7 6.5 21.
25 75 107.21 50 3.6 505 954 134.78 46 3.7 49
41 217 213.93 12 8.7 22 4,447 245.52 4 6.5 210 900 175.30 24 7.3 10
40 101 162.33 28 6.4 2515 1,370 129.38 49 4.1 4835 428 169.78 26 6,5 2123 325 161.75 29 5.3 3917 2,004 171.07 25 5.4 3614 167 182.53 20 5.6 3547 412 153.19 37 7.2 1337 88 133.75 47 5.0 4245 577 145.20 41 6.2 2732 1,438 131.06 48 4.8 4336 184 177,48 22 6.9 1729 88 208.94 13 7.5 830 732 159.16 32 5.8 3110 879 268.21 3 8.1 446 321 177.60 21 7.6 518 991 235.12 6 7.5 826 69 218.00 10 7.3 10717ccluding armed forces overseas.12/ Personal income is for the calendar year...c./ Based on estimates of population as of July 1,
1968.
1/ Data for 1968 are preliminary.2/ Figure excludes District of Columbia which has
a population of 809,000.
11
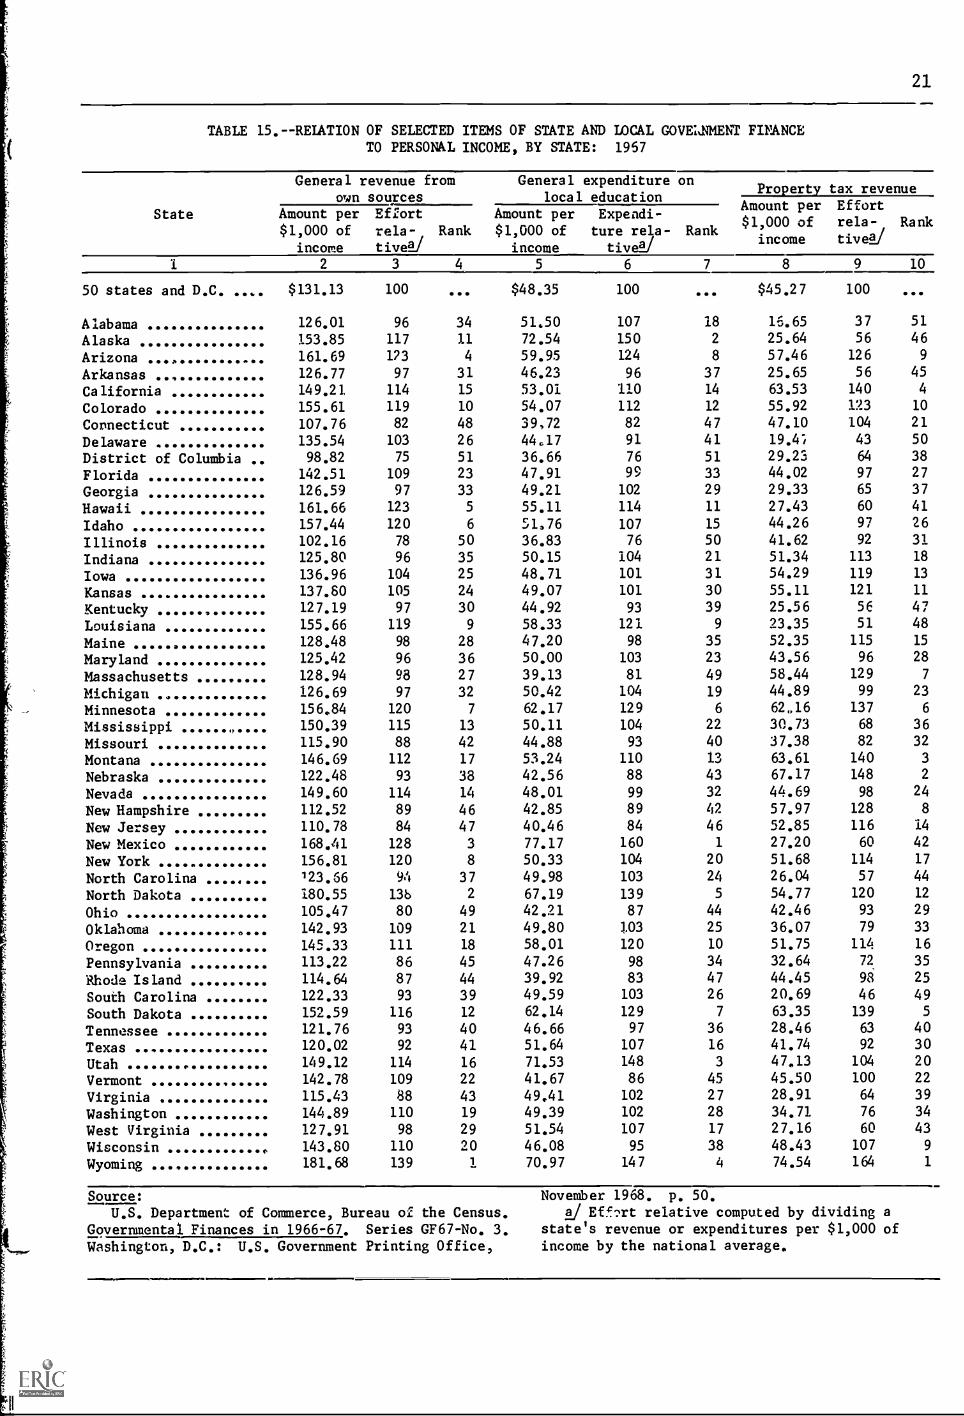
21
TABLE 15.--RELATION OF SELECTED ITEMS OF STATE AND LOCAL GOVERNMENT FINANCETO PERSONAL INCOME, BY STATE: 1957
State
General revenue fromown sources
Amount per Effort$1,000 of rela- Rank
income tive/
General expenditure onlocal education
Amount per Expendi-$1,000 of ture rela- Rank
income tiveW
Property tax revenueAmount per Effort
$1,000 of rela- Rankincome tivel/
1 2 3 4 5 6 7 8 9 10
50 states and D.C. $131.13 100 ... $48.35 100 ... $45.27 100
Alabama 126.01 96 34 51.50 107 18 15.65 37 51
Alaska 153.85 117 11 72.54 150 2 25.64 56 46
Arizona 161.69 173 4 59.95 124 8 57.46 126 9
Arkansas 126.77 97 31 46.23 96 37 25.65 56 45
California 149.21 114 15 53.01 110 14 63.53 140 4
Colorado 155.61 119 10 54.07 112 12 55.92 123 10
Connecticut 107.76 82 48 39,72 82 47 47.10 104 21
Delaware 135.54 103 26 44:17 91 41 19.4", 43 50
District of Columbia 98.82 75 51 36.66 76 51 29.23 64 38
Florida 142.51 109 23 47.91 99 33 44.02 97 27
Georgia 126.59 97 33 49.21 102 29 29.33 65 37
Hawaii 161.66 123 5 55.11 114 11 27.43 60 41
Idaho 157.44 120 6 51.76 107 15 44.26 97 26
Illinois 102.16 78 50 36.83 76 50 41.62 92 31
Indiana 125.80 96 35 50.15 104 21 51.34 113 18
Iowa 136.96 104 25 48.71 101 31 54.29 119 13
Kansas 137.80 105 24 49.07 101 30 55.11 121 11
Kentucky 127.19 97 30 44.92 93 39 25.56 56 47
Louisiana 155.66 119 9 58.33 121 9 23.35 51 48
Maine 128.48 98 28 47.20 98 35 52.35 115 15
Maryland 125.42 96 36 50.00 103 23 43.56 96 28
Massachusetts 128.94 98 27 39.13 81 49 58.44 129 7
Michigan 126.69 97 32 50.42 104 19 44.89 99 23
Minnesota 156.84 120 7 62.17 129 6 52.16 137 6
Mississippi 150.39 115 13 50.11 104 22 30.73 68 36
Missouri 115.90 88 42 44.88 93 40 37.38 82 32
Montana 146.69 112 17 53.24 110 13 63.61 140 3
Nebraska 122.48 93 38 42.56 88 43 67.17 148 2
Nevada 149.60 114 14 48.01 99 32 44.69 98 24
New Hampshire 112.52 89 46 42.85 89 42 57.97 128 8
New Jersey 110.78 84 47 40.46 84 46 52.85 116 14
New Mexico 168.41 128 3 77.17 160 1 27.20 60 42
New York 156.81 120 8 50.33 104 20 51.68 114 17
North Carolina 123.66 94 37 49.98 103 24 26.04 57 44
North Dakota 180.55 13b 2 67.19 139 5 54.77 120 12
Ohio 105.47 80 49 42.21 87 44 42.46 93 29
Oklahoma 142.93 109 21 49.80 103 25 36.07 79 33
Oregon 145.33 111 18 58.01 120 10 51.75 114 16
Pennsylvania 113.22 86 45 47.26 98 34 32.64 72 35
Rhode Island 114.64 87 44 39.92 83 47 44.45 98 25
South Carolina 122.33 93 39 49.59 103 26 20.69 46 49
South Dakota 152.59 116 12 62.14 129 7 63.35 139 5
Tennessee 121.76 93 40 46.66 97 36 28.46 63 40
Texas 120.02 92 41 51.64 107 16 41.74 92 30
Utah 149.12 114 16 71.53 148 3 47.13 104 20
Vermont 142.78 109 22 41.67 86 45 45.50 100 22
Virginia 115.43 88 43 49.41 102 27 28.91 64 39
Washington 144.89 110 19 49.39 102 28 34.71 76 34
West Virginia 127.91 98 29 51.54 107 17 27.16 60 43
Wisconsin 143.80 110 20 46.08 95 38 48.43 107 9
Wyoming 181.68 139 1 70.97 147 4 74.54 164 1
Source:
U.S. Department of Commerce, Bureau of the Census.Governmental Finances in 1966-67. Series GF67-No. 3.
Washington, D.C.: U.S. Government Printing Office,
November 1968. p. 50.a/ Effort relative computed by dividing a
state's revenue or expenditures per $1,000 ofincome by the national average.
=411.41.11
22
permitted in 19 states; in 13 of the 19 states, thetaxes are the piggy-back taxes administered by thestate. Some states, however, have in the past per-mitted the localities to administer the local salestax themselves, or to choose state administration.
The Advisory Commission on IntergovernmentalRelations, according to its Executive Director,William G. Colman, has advised that states becautious about extending nonproperty taxing powersto localities The primary reasons, as stated byColman, are that (a) nonproperty taxes may be un-suitable for small communities which may lack thefacilities needed for their administration; (b) suchtaxes may have yields insufficient to provide asuitable ratio between labor and other administrativecosts as related to yield; and (c) the local taxes"may adversely affect the community's economicposition relative to its neighbors, particularlywhen it is one or many small interdependent unitsclustered within a large urban complex."_V Conse-quently, only large taxing areas may be capable ofeffectively administering the taxes and thus ableto justify their adoptions, according to the Ad-visory Commission on Intergovernmental Relations.
In spite of the factors thei inhibit localsales and income tax adoptions, however, the ex-pansion of such taxes continued in 1968 as it hadin 1967. County transient rooms taxes were au-thorized in Kentucky for counties containing cities,effective June 13, 1968. This tax is not to ex-ceed 3 percent of the rent charged for rooms bymotor courts, hotels, motels, and similar accommoda-tions. Missouri authorized counties of the firstclass having a charter form of government to levy
5/ Colman, William, G., op. cit., p. 102.
a license tax not to exceed 5 percent on grossreceipts of public utilities, from business withinunincorporated areas of the country; to levy licensetaxes on motor vehicles owned by persons residingin areas outside incorporated cities; and to imposea cigarette tax not to exceed 5C per pack. NewMexico authorized the board of county commissionersto levy a county sales tax not to exceed 1/4 of1 percent of gross receipts of all retail businessesand services within the county in addition to thegross receipts tax already in effect. Any ordinanceimposing the tax must be submitted to voters of thecounty for approval. The tax may not be levied formore than five years from the effective date of theimposing ordinance.
V.rginia authorized cities and counties tolevy 1 percent use taxes. Local use taxes were notimposed before July 1, 1968. This 1 percent usetax is in addition to the 3 percent local sales tax.
In other legislative actions during 1968, ratesof existing local taxes were increased in severalinstances or the coverage was changed. In Louisiana,the sales and use tax that municipalities are au-thorized to impose cannot be in excess of 1 percent,and must conform to all proceedings and electionsrequired. Tennessee authorized an incr.ase in thelocal sales tax rates for counties and f.Acorporatedcities and towns, effective June l 1968. Thesesales and use taxes are to be levied on the sameprivileges as the state tax at rates not to exceedone-half (formerly one - third) of the prescribedstat.e rates, provided that the tax levied may notexceed $5 per single article if the tax does notexceed one-third of the state rates, or $7.50 ifthe tax exceeds one-third of the state rates.Wyoming voters repealed a $2 poll tax on November 5,1968, which had been used for county school purposes.
Prepared by Ellen Roderick, Staff Assistant,and Linda Goodenough, Assistant
to the Committee
NEA Committee on Educational Finance
WILLIAM D. FIRMAN, ChairmanAlbany, New York
WILBERT V. BOLL!GERPomona, Caiifornia
JOHN P. HINDMANCasa Grande, Arizona
WILLIAM P. McLUREUrbana, Illinois
JOHN A. MATTHEWSMadison, Wisconsin
EUGENE P. McLOONENEA Staff Contact
Address inquiries to the NEA Research Division.
II