document resume title a survey of nursing … resume ed 065 798 cg 007 330 title a survey of nursing...
TRANSCRIPT

DOCUMENT RESUME
ED 065 798 CG 007 330
TITLE A Survey of Nursing Home Staffing Patterns andGeneral Needs in the State of Maine.
INSTITUTION Maine's Regional Medical Program Research andEvaluation Service, Augusta.
PUB DATE Oct 70NOTE 256p.
EDRS PRICE MF-$0.65 HC-$9.87DESCRIPTORS *Health Facilities; Health Personnel; *Health
Services; *Medical Services; Medical Treatment;Nurses; *Nursing; *Nursing Homes; Personal CareHomes
ABSTRACTA study of nursing homes in Maine was conducted by
student researchers during the summer, 1970, under Maine's RegionalMedical Program (MRMP). The survey, focusing on staffing patterns andgeneral needs in nursing homes in Maine, was conducted in order todetermine ways in which MRMP might assist the nursing homes and theMaine Department of Health and Welfare in their efforts to providethe best possible patient care. The tabulation of the data which wascollected forms the basis of the report. It was found that for themost part nursing homes are understaffed, particularly in regard totrained nurses. Recommendations are made such as: the standardizationof state and federal requirements; a revision of medicare towardgreater responsiveness to patient's needs; and a greater availabilityof occupation, physical, speech, and psychological therapists tonursing homes. {Author/WS)
coc:hN-u-%
A SURVEY OF NURSING HOME
LIJSTAFFING PATTERNS AND GENERAL
NEEDS IN THE STATE OF MAINE
LI.S. DEPABIMENTOF HEALTH.
EDUCATIONBONELF
ABE
OFFICEOF EDUCATION
THISDOCUMENT
VIASBEEN
BEPBO-
OUCEDEOCILY
AS BECENEDFBOM
THE POISONOB OBGANIZATION
°BIG-
%HATINGII. POINTS
OF VIEV)OB OPIN
'IONSSTATED
00 NOTNECESSABILY
BEPBESENTOFFICIAL
OFFICEOF EN.
CATIONPOSITION
OB POLICY.
COMPILED BY:
MAINE'S REGIONAL MEDICAL PROGRAM
295 WATER STREET
AUGUSTA, MAINE
OCTOBER 1970
TABLE OF CONTENTS
CHAPTER PAGE
I. INTRODUCTION 1
II. DEFINITION 1
III. PROCEDURE AND SAMPLE 1
IV. QUESTIONAIRE 2
V. DATA PRESENTATION 2
General Findings 2
Education 4
Emergency Transportation 6
Home Health Services 6
Physician Relationship with Nursing Homes 6
Hospital-Nursing Home Relationship 7
VI. RESPONSE TO QUESTION, "DO YOU HAVE ANY ADDITIONAL
PROBLEMS IN OPERATING THIS NURSING HOME WHICH WE
MIGHT B&ABLE TO HELP YOU WITH'?" 7
VII. MAJOR CHANGES ANTICIPATED BY NURSING HOMES 8
VIZI. CONCLUSIONS OF INTERVIEWERS 9
IX. TABLES 11
X. CROSS TABULATIONS 97
XI. OUTLINE OF SURVEY QUESTIONS USED 252
This survey and the contents of this document are in no way the
responsibility of the Public Health Service.

I. INTRODUCTION
A study of the nursing homes of Maine was conducted by Maine's
Regional Medical Program during the summer of 1970 in order to determine
ways in which MRMP might assist the nursing homes and the Maine Department
of Health and Welfare in their efforts to provide the best possible patient
care. The tabulation of the data collected will form the basis for this
report.
II. DEFINITION
The State of Maine Department of Health and Welfare defines a
nursing home as "an establishment in which treatment or nursing service
is given to persons ill with chronic disease, who are crippled or infirm,
or may be convalescing from an illness or from surgery."
III. PROCEDURE AND SAMPLE
The administrators or head nurses of 131 nursing homes of Maine
were interviewed via questionnaire between June 15 and August 10, 1970.
This study was part of the Summer Research Program of Maine's Regional
Medical Program,and five Maine college students conducted the fieldwork
under the supervision of MRMP staff. Those interviewed were assured that
their responses would be kept confidential. The nursing homes had been
apprised of the study and their cooperation was solicited by letter,
early in June. The interviewers contacted the homes by phone to arrange
appointments when practical. The majority of the home owners were most
cooperative; only six refused to be interviewed, and one gave incomplete
information.
A sixth college student developed the computer program and supervised

the coding and computer processing of the data. The final tables were
produced by the end of August.
We wish to express our thanks to M. James Gerrie, Jr., Kurt Gregory,
Chris Hastedt, Jane Kinder, David LaVallee and Ann Nagel for their
assistance in the collection of the data, and to the nursing homes for
their cooperation.
IV. QUESTIONNAIRE
The questionnaire was developed by MRMP staff with the suggestions
of other interested parties.
The purpose of the questionnaire was to obtain the following
information; ways in which nursing home personnel are trained and the
resources available for continuing education; the transportation
services available to and needed by nursing homes; the connections and
interactions of the nursing homes with the hospitals and physicians of
their areas; and the availability of community home health services in
the respective areas. Finally, two general, open-end questions were
asked: "Do you have any additional problems in operating this nursing
home which we might be able to help you with?", and %That do you antici-
pate in the way of major changes in our methods of caring for elderly
people in this country in the next twenty years?"
In addition to the 46 formal questions, the interviewers were asked
to record their subjective evaluations based on their impressions after
a guided tour of each home.
V. DATA PRESENTATION
General Findings
The majority of those people interviewed were administrators OM
4

21% were the owners of the homes, were head nurses and four per cent
were "other" personnel.
Over one-half of the nursing homes in the state have between 11 and
30 beds (53%), 11% have ten or fewer, 18% have 31 to 50, 17% have 51 to
100, and 2% (two nursing homes) have more than 100 beds.
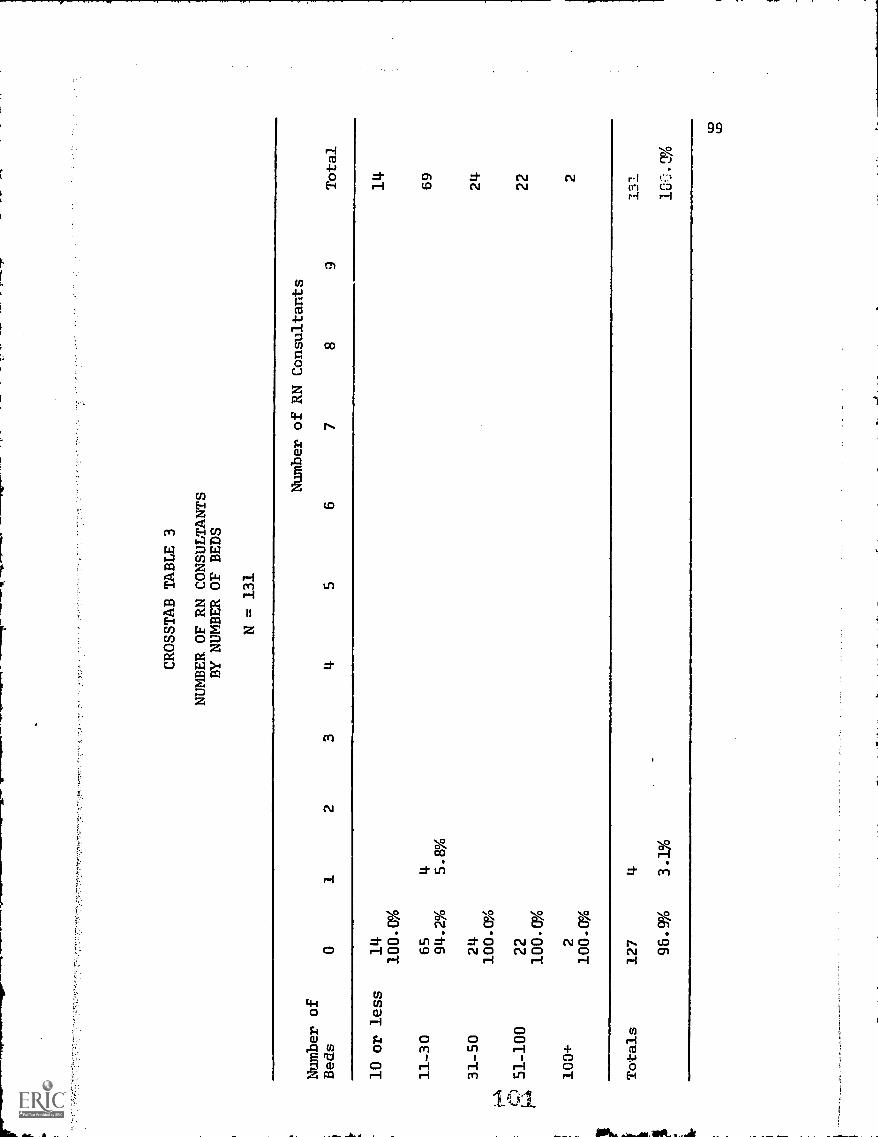
Tables 3 through 58 have to do with nursing home personnel: the
number of RN's, LPN's, aides, physical therapists, recreation and social
directors, dieticians, in-service educators, phychiatrists arid physicians
employed.
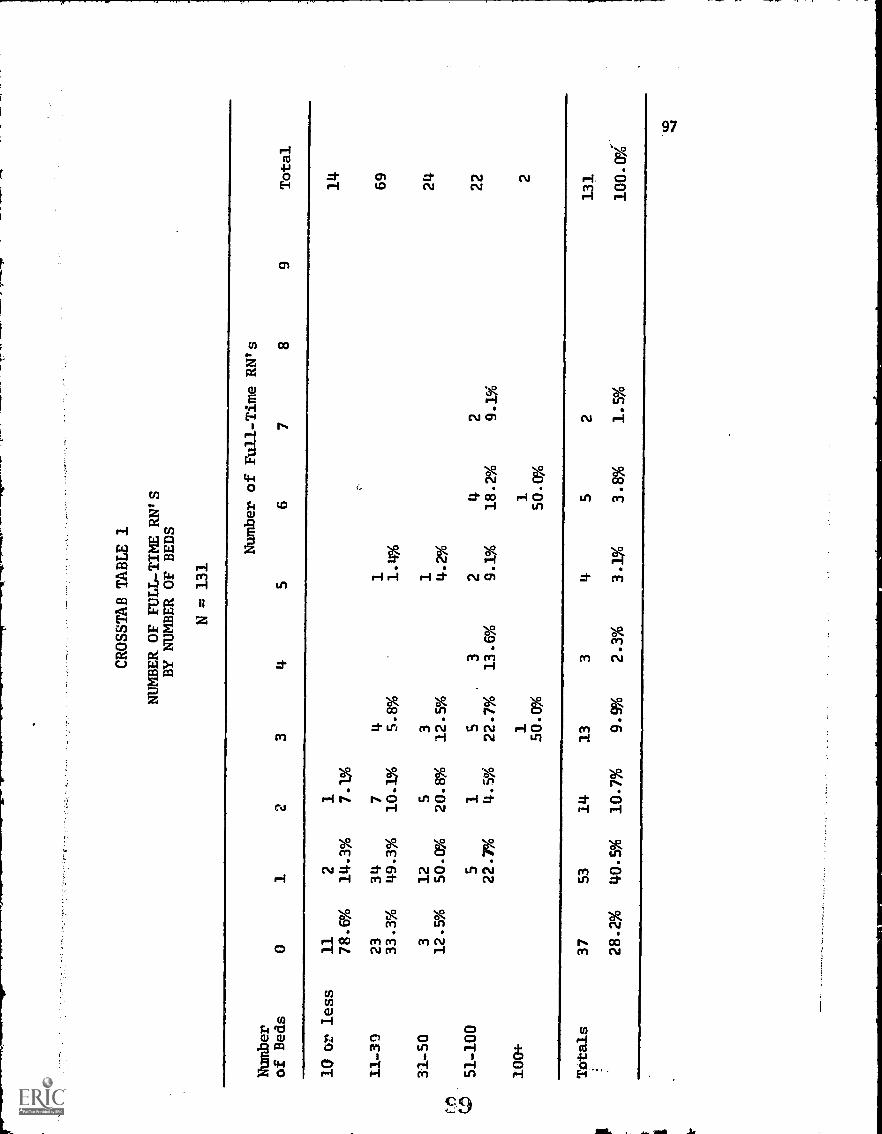
28% have no full-time RN's; 40% have one; 11% have two;. 10% have
three; 2, 3, and 4% have four; five and six RN's respectively; and 2%
(two nursing homes) have seven. The cross tabulations (Crosstab 101ble
1) show that all of those with no full-time RN have less than 50 beds,
and most of them (34 homes out of 37) have fewer than 30 beds. The two
homes with seven RN's each have between 51 and 100 beds.
38% of those queried have no full-time LPN's, 76% have no part-time
LPN's, and 98% have no LPN ccnsultants.
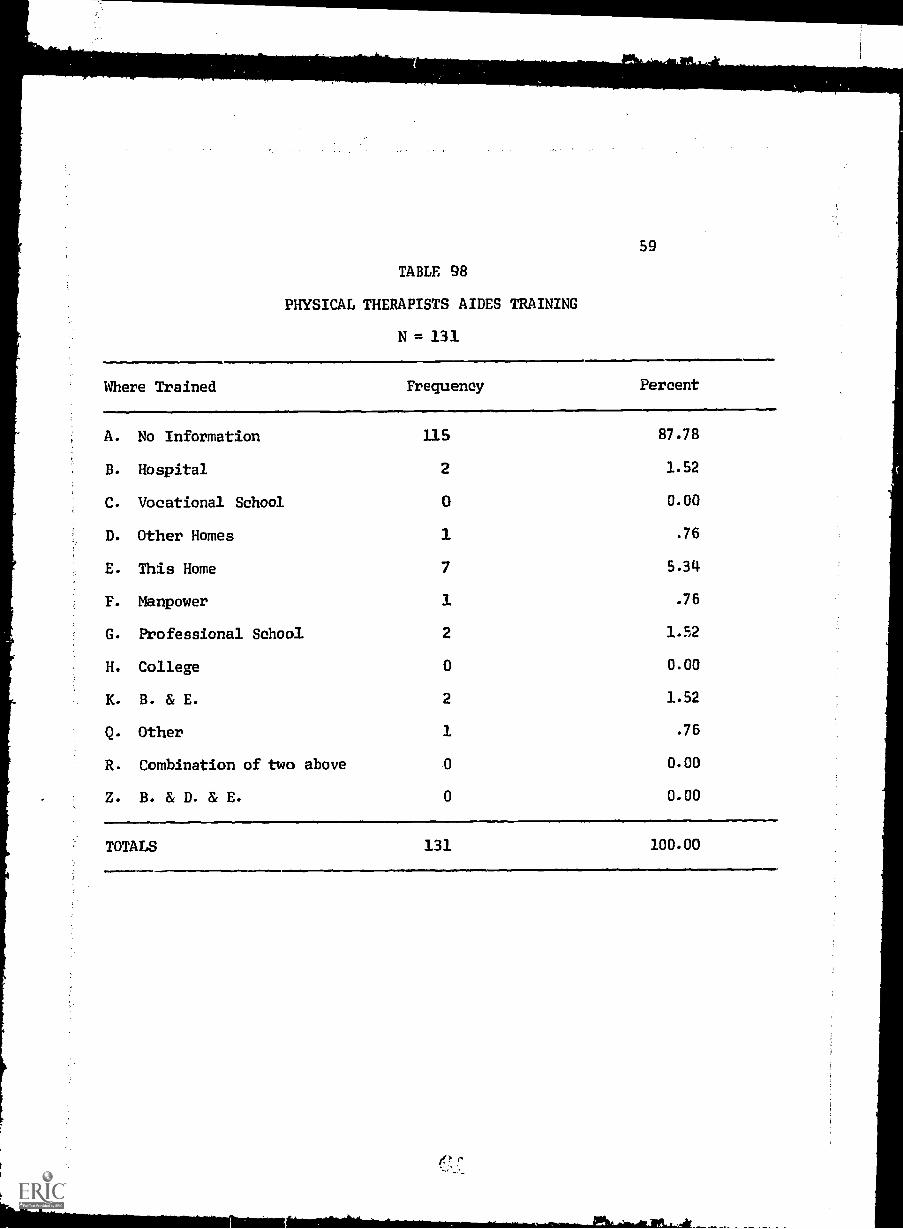
Ten of the 131 homes have full-time physical therapists, 14 have
part-time PT's, and 30 have PT consultants as needed.
Eight have full-time occupational therapists, ten have part-time OT's,
and four have OT consultants as needed.
Twenty-four have full-time recreation and social directors, 56
out of 131 have part-time recreation and social directors, and two have
recreation and social director consultants.
Seventeen homes have full-time dieticians, nineteen have part-time
dieticians, and 38 have dietician consultants.
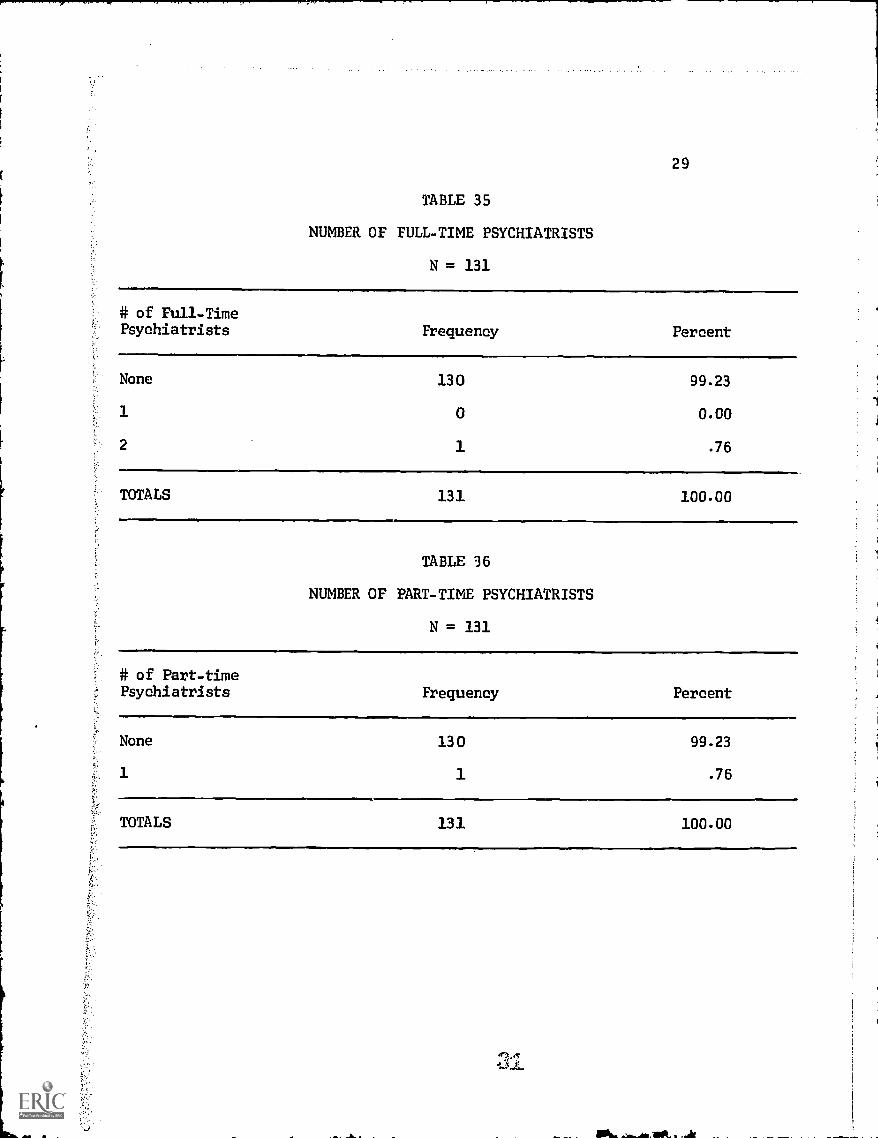
One home has two full-time psychiatrists, one has one part-time
and five have psychiatric consultants.

Ten homes have full-time physicians, nine have part-time physicians,
and sixty of the 131 homes have physician consultants.
Fifty-six per cent answered "yes" when asked if they have any trouble
hiring personnel because of shortage. RN's seem to be scarcest with 42
homes having trouble finding them.
Only 6% and 8% have trouble hiring physical therapists and occupa-
tional therapists because of shortage. In other words, if they haven't
hired them, it is not because there is a shortage. The same applies to
the hiring of dieticians, psychiatrists and physicians.
Education
Nine of the 131 homes have full-time directors of in-service education
on their staffs, 54 have part-time directors, and one has an education
consultant one day per month. Of the nine homes with full-time directors
of education, four have between 11 and 30 beds, four have between 31 and
50 beds and one has 51-100 beds. The homes with part-time directors of
education have between 11 and 100+ beds. Only two said they have trouble
hiring directors of in-service education because of shortage.
Sixty-three per cent of the homes have in-service education programs.
Of the 83 homes which have programs, 81 include their aides in their
programs, 63 include their LPN's and 61 include their RN's. Physical
therapists and occupational therapists are included in 15 and 7 homes
respectively.
Sixty-six homes (50%) said "yes" when asked if they would like a
representative from MRMP to visit and assist in developing an in-service
education program.
One hundred and eleven homes said members of their staff attend the
educational programs conducted by the State Department of Health and
Welfare. Twelve of the 20 who said "no", said they cannot spare the
6

time or personnel.
Thirty-eight per cent (fifty homes) would attend out-of-state
meetings to learn new practices in caring for nursing home patients.
Sixty-two of the 81 who said "no" listed "cannot spare time or personnel"
as the reason.
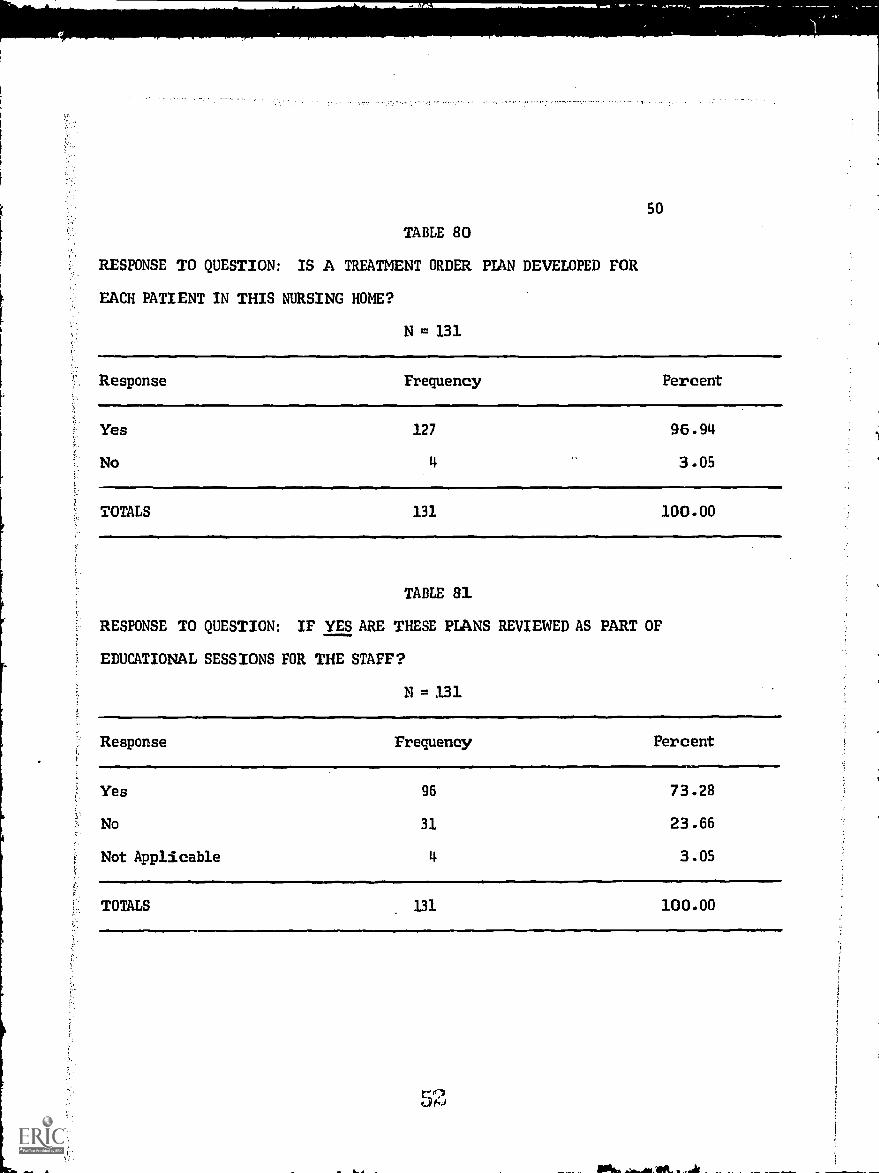
Ninety-six homes said that patient treatment order plans are developed
and reviewed as part of educational sesaions for the staff.
Fifty-seven homes said they have utilization review procedures, and
thirty-five of these use the results of these reviews for educational
purposes with the entire staff.
Eighty-four homes have procedure manuals for each category of personnel
on their staffs; one hundred and four homes feel that procedure manuals
can be helpful in orienting the new employee to the standard practices
of the nursing homes.
Tables 95 through 106 give information regarding fonmal training of
nursing home personnel.
Sixty-four percent of the homes reported that they would send one
of their nurses to a training course to become a geriatric care specialist
if such a course were available at the nearest regional medical center.
Seventy per cent said they would employ a person trained as an occupational
or physical therapy aide, or would send a staff member to a special
training course to become such an aide if the course were available at
little cost.
Only six per cent reported that the hospital maintains contact with
the patients they refer to the nursing homes in order to assure continuity
of care.
Twenty-seven nursing homes said that hospitals have offered to share
personnel, they accepted, and the arrangement was successful.

Emergency Transportation
Only two of 131 have diffiaulty arranging transportation for patients
from the nursing home to the hospital in emergencies; seigh have
difficulty in non-emergencies.
Ninety-seven percent think that the local hospital and its staff
are well equipped to handle medical emergencies which occur at the
nursing home.
Home Health Services
Eighty of the homes say there is a home health service agency in
their area.
Most of the homes do not notify the community home health service
agency when a patient leaves the nursing home.
Ninety-five homes answered "yes" when asked if they would utilize
consultant services if they were provided by a local non-profit community
health service.
Twenty-eight said they do feel that some of their patients might be
able to live at home and be cared for by a home health care service.
PhysicianRelationship with Nursing Homes
Most nursing home patients are tended by private physicians. Only
six of the 131 homes are cared for by staff physicians.
Seventeen per cent of the homes reported that they have had difficulty
securing the services of a physician in an emergency.
Forty-eight of the homes reported that their patients are examined
by a physician monthly, thirty-one, every two months.
Twenty-one per cent feel that the physicians and dentists in the
area could be more cooperative in helping with the care of the patients.
Fifty-nine per cent reported that the physician never participates
in nuraing home staff conferences. 12% always do, 28% sometimes do.

Thirty-three per cent answered "yes" when asked if they felt that a
physician's assistant, specially trained and licensed by the State to
provide most of the non-emergency care for nursing home patients, would
be able to provide better care for their patients than they presently get.
Hospital-Nursing Home Relationship
Tables 119 through 129 deal with the interactions between the nursing
homes and their local hospitals. All but two of the 131 homes reported
that they get patient referrals from nearby ho spitals . Seventy- four
per cent said they are never Invited to participate in the discharge
planning of these patients at the hospital.
Seventy-two per cent said they receive patient record abstracts
from the hospitals that refer the patients.
All but two have a nearby hospital which provides laboratory
diagnostic or therapeutic services. Eighty-five percent of these hospitals
are within ten miles.
VI. RESPONSES TO THE QUESTION, "DO YOU HAVE ANY ADDITIONAL PROBLEMS
IN OPERATING THIS WRSING HOME WHICH WE MIGHT BE ABLE TO HELP YOU WITH?"
The most frequently mentioned problems were the need for trained
personnel, for therapists of all kinds, and for assistance in in-service
education. Geriatric training for all personnel is needed. Several
specifically requested regional education courses. Others requested
that educational materials for staff be distributed. Nutritional
information for diet planning is needed. One home suggested that
surplus foods be distributed to nursing homes. Another suggested that
more male LPN's be trained because of the need for much lifting.
Another recommended that therapists be trained to work in small teams.
The lack of transportation to doctors' offices and clinics was a
9

8
frequently mentioned problem. One administrator suggested that a
minibus be operated by community health agencies. Transportation is
also needed once the patient goes home, for grocery shopping, doctors'
visits, etc.
Several mentioned financial problems. Low-cost loans for con-
struction to comply with state and federal requirements would be most
welcome.
The lack of cooperation among nursing homes, hospitals, physicians,
and the community was cited. Nursing homes should be included in
community health planning for total patient care. One administrator
recommended that a coordinating nurse develop cooperation between
facilities.
Nursing home patients badly need recreational activities. Vol-
unteers might be organized to answer this need. One interviewee sug-
gested that patient visits to their own homes be arranged.
Other problems mentioned were lack of information on state pro-
grams available to state-assisted patients, problems with Medicare
regulations (too much paperwork) and lack of physical examinations
for personnel.
VII. MAJOR CHANGES ANTICIPATED BY NURSING HOMES
1. More nursing homes will be needed -- more boarding homes
for the elderly and larger, one-story modern facilities with better
concentration of personnel.
2. More emphasis will be placed on rehabilitation, occupational
therapy and physical therapy.
3. Smaller homes will not be able to compete with the larger,
newer homes.

9
14. There will be a transition from "homey" atmosphere to a more
institutionalized atmosphere.
VIII. CONCLUSI9NS OF INTERVIEWERS
1. There seem to be two opposing philosophies of caring for
geriatric patients: one being that the patient should be kept as active
as possible, and the other being that, if the patient is happiest lying
in bed then he should be allowed to do so. The latter seem to feel that
only food and clean bedding are necessary for the maintenance of proper
health. Perhaps updated educational programs on geriatric care would
help.
2. The spirit of any nursing home seems to be directly related
to the philosophy of the administrator and is not necessarily related
to the appearance and physical plant of the home.
3. There seems to be a lack of communication and cooperation
amo n g nursing homes.
Lt. Nursing homes have trouble hiring trained personnel.
5. There is a need for refresher courses to be made available
to personnel, perhaps on a regional basis. Also initial professional
training for aides would be helpful.
6. Overcrowding seems to occur more frequently in the older
homes than in the newer homes.
7. Most homes felt that their relationships with nearby hospitals
were satisfactory, but were enthusiastic about the idea of increased
interaction.
8. When asked whether homes would participate in new programs
such as regional in-service education and home health care, cost seemed
to be the most important consideration.

9. Most of the homes seemed to consider themselves to be terminal
units. Therefore, they had little knowledge of home health care services
and felt that they had little need for occupational and physical therapists.
10. Nursing home owners do not seem to have sufficient input into
decisions and actions of the Department of Health and Welfare. Some
feel that they have little recourse with the Department.
11. Low interest loans would be of great help to those homes
trying to meet Department of Health and Welfare regulations.
12. Eye, ear and foot care for nursing home patients is a problem.
13. The homes need help in diet planning.
14. The cost of ambulance service is prohibitive.
15. Small homes will soon be unable to compete financially with
larger homes.
16. Occupational, physical, speech and psychological therapists
should be made available to nursing homes..
17. Medicare should be revised so it will be more responsive to
the needs of the patients.
18. State and federal requirements should be standardized.
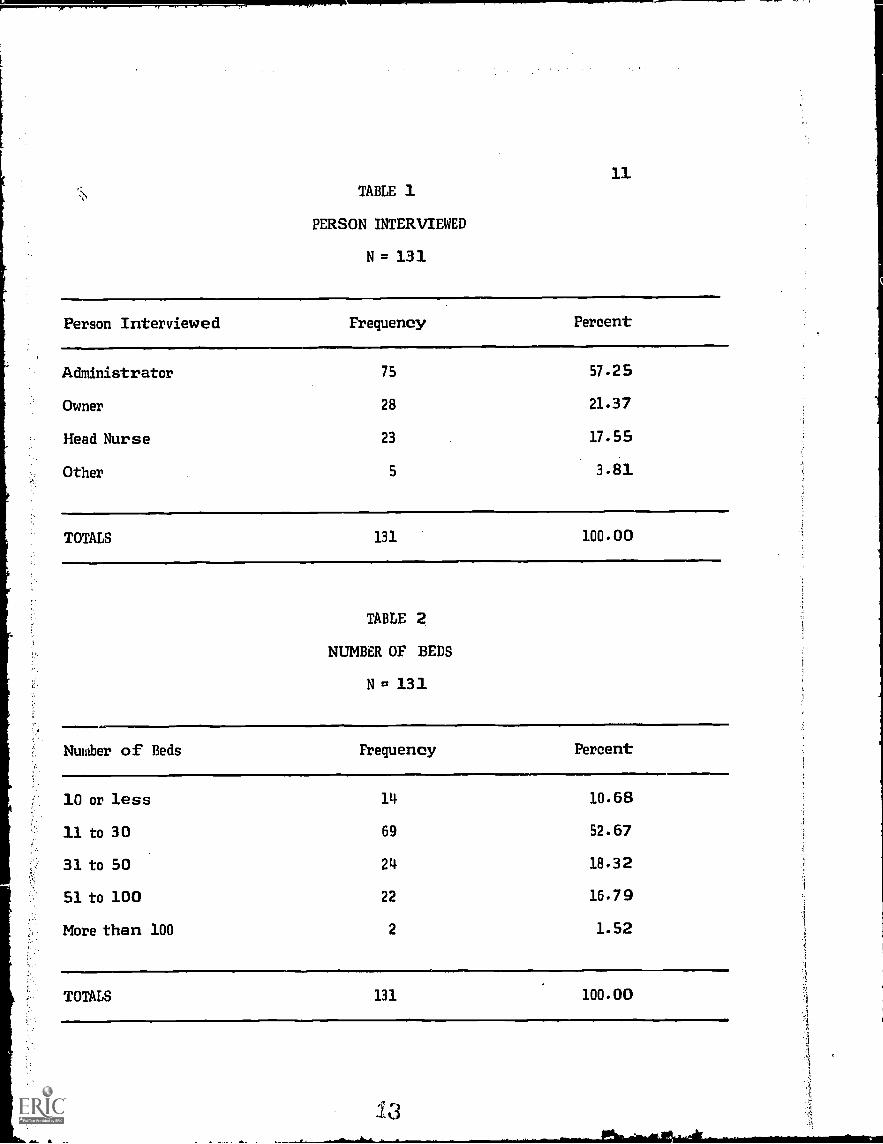
TABLE 1
PERSON INTERVIEWED
N = 131
11
Person Interviewed Frequency Percent
Administrator 75 57.25
Owner 28 21.37
Head Nurse 23 17.55
Other 5 3.81
TOTALS 131 100 . 00
TABLE 2
NUMBER OF BEDS
N = 131
Number of Beds Frequency Percent
10 or less 14. 10 . 68
11 to 30 69 52 . 67
31 to 50 24 18 .3 2
51 to 100 22 16.79
More than 100 2 1.52
TOTALS 131 100 . 00

TABLE 3
NUMBER OF FULL-TIME RN' s
N = 131
12
# of Full-Time RN' s Frequency Percent
None 37 28.24
1 53 40.45
2 14 10.68
3 .13 9.92
4 3 2.29
5 4- 3.05
6 5 3.81
7 2 1.52TOTALS 131 100.00
TABLE 14
NUMBER OF PART-TIME RN' S
N = 131
TFOT Part..time RN' s Frequency Percent
None 83 63.35
1 24 18.32
2 10 7.63
3 7 5.34
4 3 2.29
5 0 0.00
6 3 2.29
7-TOTALS
1 .76131 100.00
4

TABLE 5
NUMBER OF RN CONSULTANTS
N = 131
13
# of RNConsultants Frequency Percent
None 127 96.94
1 4 3.05
TOTALS 131 100.00
TABLE 6
RN CONSULTANTS, DAYS PER MONTH
N = 131
Days Per Month Frequency Percent
None 127 96.94
1 1 .76
2 1 .76
As Needed 2 1.52
TOTALS 131 100.00

TABLE 7
NUMBER OF FULL- TIME LPN/ s
N = 13 1
# Full- Time
LPN' s Frequency Percent
None 50 38. 1 6
1 38 29. 0 0
2 13 9. 92
3 16 12.21
4 7 5.34
5 El- 3.05
6 0 O. 00
7 0 O. 00
8 0 0.00
9 3 2.29
TOTALS 1 131 100. 0 0
TABLE 8
NUMBER OF PART- TIME LPN' s
N = 13 1
# of Part-time LPN' s Frequency Percent
None3
100 76.3 3
1 19 14. 50
2 7 5.34
3 3 2.2 9
It 2 1. 52
TOTALS 131 100. 0 0

TABLE 9
NUMBER OF LPN CONSULTANTS
N = 131
15
# of LPNConsultants Frequency 'Percent
None 129 98.47
1 1 .76
2 0 0.00
3 1 .76
TOTALS 131 100.00
TABLE 10
LPN CONSULTANTS, DAYS PER MONTH
N = 130*
Days Per Month Frequency N Percent *N Percent
None 128 98.46 97.70
1 0 0.00 0.00
2 0 0.00 0.00
3 0 0.00 0.00
4 0 0.00 0.00
5 1 .76 .76
Other 1 0.00 .76
As Needed 1 .76 .76
TOTALS 131 100.00 100.00
*N = Total N plus Blank and Other = 131

16
TABLE n
NUMBER OF FULL-T1ME AIDES
N = 130*
if of Full-Time Aids Frequency N Percent *N Percent
None 5 3.814 3.81
1-2 6 4.61 14.58
3-5 22 16.92 16.79
6-8 29 22.30 22.13
9-11 211 18.146 18.32
12-15 19 111.61 114.50
16-20 10 7.69 7.63
21-3 0 llt 8.46 8.39
31-140 3 2.3 0 2.29
41-50 0 0.00 0.00
51-60 0 0.00 0.00
61-80 0 0.00 0.00
81-99 0 0.00 0.00
Over 100 1 .7 6 .76
Other 1 0.00 .76
TOTALS 131 100.00 100.00
*N (Total N plus Blank and Other) = 131

17TABLE 12
NUMBER OF PART-TIME AIDES
N = 129*
# of Part-Time Aids Frequency N Percent *N Percent
None 30 23.25 22 . 90
1-2 38 29.45 29.00
3-5 42 32.55 32.06
6-8 11 8.52 8.39
9-11 4 3.10 3.05
12-15 2 1.55 1.52
16-20 1 .77 .76
21-30 0 0.00 0.00
31-40 0 0.00 0.00
41-50 0 0.00 0.00
51-60 0 0.00 0.00
61-80 0 0.00 O. 00
81-99 1 .77 .76
Other 2 0.00 1.52
TOTALS 131 100.00 100.00
*N (Total N Plus Blank and Other) 131

18TABLE 13
NUMBER OF ALE CONSULTANTS
N = 131
# of AidConsultants Fr equency Percent
None 12 9 98 . 47
1 1 .76
2 0 0.00
3 0 0.00
4 1 .76
TOTALS 131 100.00
TABLE 14
AIDE CONSULTANTS, DAYS PER MONTH
N = 131
Days per Month Frequency Percent
None
As Needed
129 98.47
2 1.52
TOTALS 131 100.00

F-cir Full-Time
19TABLE 15
NUMBER OF FULL-TIME PHYSICAL THERAPISTS
N = 131
Physical Therapists
None
1
2
Frevency Percent
121
8
2
92.36
6.10
1.52
TOTALS 131 100.00
TABLE 16
NUMBER OF PART-TL1E PHYSICAL THERAPISTS
N = 3.31
of Part-timePhysical Therapists Frequency Percent
None
1
2
3
117
13
0
89.31
9.92
0.00
1 .76
TOTALS 131 100.00
TABLE 17
NUMBER OF PHYSICAL THERAPIST CONSULTANTS
N = 131
# of P.T.Consultants
None
1TOTALS
Frequency
101
30131
Percent
77.09
22.90100.00
94

20TABLE 18
PHYSICAL THERAPIST CONSULTANTS, DAYS PER MONTH
N = 128*
Days Per Month Frequency N Percent *N Percent .
None 101 78.90 77 . 09
3 2.34 2.29
2 4 3.12 3.05
3 0 0.00 O. 00
4 4 3.12 3.05
5 0 0.00 O. 00
6 0 0.00 O. 00
7 0 0.00 0.00
8 3 2.34 2.29
As Needed 13 10.15 9. 92
Other 3 0.00 2.29
TOTALS 131 100.00 100.00
*N (Total N Plus Blank and Other) = 131

TABLE 19
NUMBER OF FULL-TIME OCCUPATIONAL THERAPISTS
N = 131
# of RM. 7-TimeOccupational Therapists Freguemy
None 123
1 8
21
Percent
93.89
6.10
TOTALS 131 100.00
TABLE 20
NUMBER OF PART-TIME OCCUPATIONAL THERAPISTS
N = 131
# of Part-TimeOccupational Therapi st s FreQuency Percent
None 121 92.36
1 9 6.87
2 1 .76
TOTALS 131 100.00
TABLE 21
NUMBER OF OCCUPATIONAL THERAPIST CONSULTANTS
N = 131
# of 0.T.Consultants Fre uenc
127
131
None
1
TOTALS
Percent
96.94
3.05
100.00

22TABLE 22
OCCUPATIONAL THERAPIST CONSULTANTS , DAYS PER MONTH
N = 131
Days Per Month Frequency Percent
None 127 96 .
1 1 .7 6
2 0 0.00
3 0 0.00
As Needed
1 . 7 6
2 1. 52
TOTALS 131 100. 00
TABLE 23
NUMBER OF FULL-TIME RECREATION & SOCIAL DIRECTORS
N = 131
41: of Full-TimeRea. & Soc. Directors Frequency Percent
None
1
2
107 81. 67
23 17.55
1 . 7 6
TOTALS 131 100 . 00
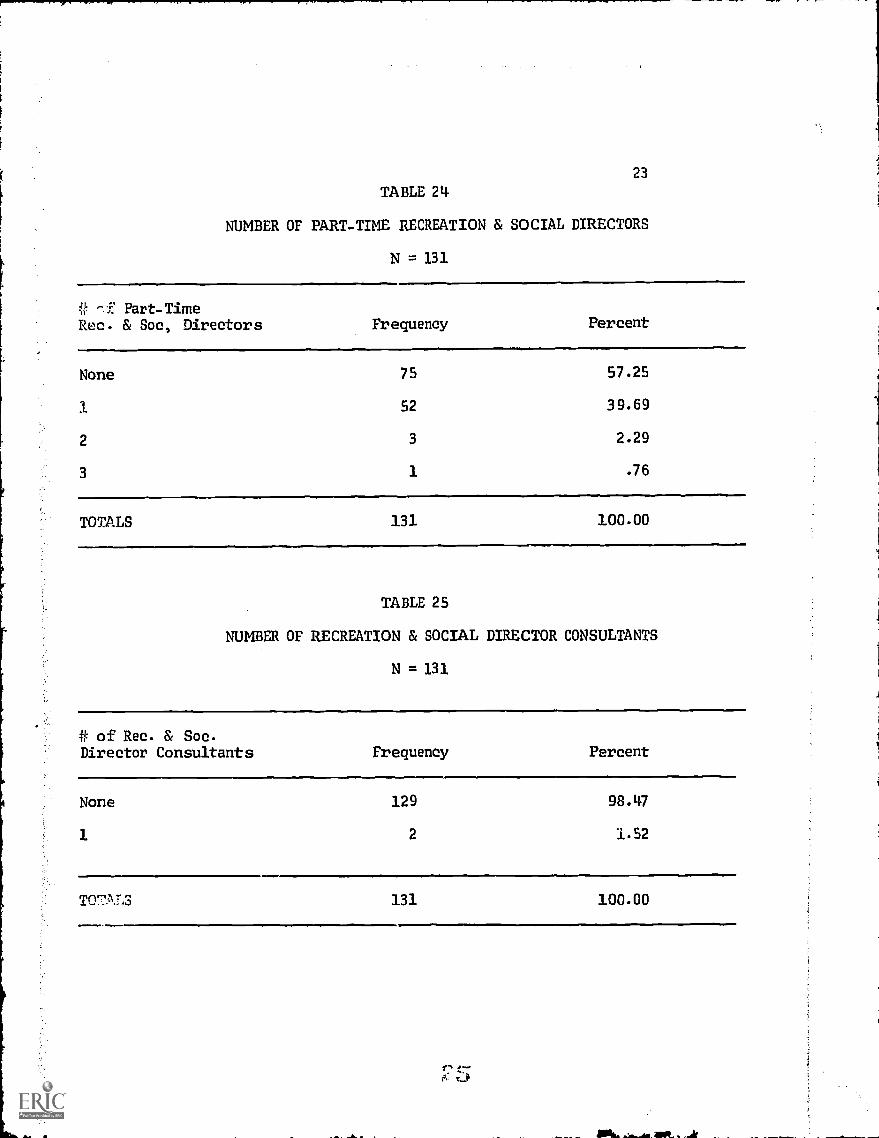
23TABLE 21-I-
NUMBER OF PART-TIME RECREATION & SOCIAL DIRECTORS
N = 131
if Part-TimeRec. & Soc, Directors Frequency Percent
None
1
2
75
52
3
57.25
39.69
2.29
3 1 .76
TOTALS 131 100.00
TABLE 25
NUMBER OF RECREATION & SOCIAL DIRECTOR CONSULTANTS
N = 131
of Rec. & Soc.Director Consultants Frequency Percent
None 129 98.11.7
1 2 1.52
TnTAL3 131 100.00
-X Z)

a., $.117 >, 011.71.,.-
24
TABLE 26
RECREATION & SOCIAL DIRECTOR CONSULTANTS , DAYS PER MONTH
N = 130*
Days Per Month Frequency N Percent *N Pere ent
None
As Needed
Other
129
1
1
99.23
.76
98 . 47
.76
.76
TO n 131 100. 00 100. 00
*N ;Total N Plus Blank and Other) = 131
TABLE 27
NUMBER OF FULL- TIME DIETICIANS
N = 131
.4ns Fr eauency Percent
None 114 87 . 02
1 17 12. 97
TO7'J'JJf 131 100. 00

25
TABLE 28
NUMBER OF PART-TIME DIETICIANS
N = 131
4 of Part-TimeDieticians Frequency
None
1
TOTALS
112
19
131
Percent
85.49
14.50
100.00
TABLE 29
NUMBER OF DIETICIAN CONSULTANTS
N = 131
# of DieticianConsultants
None
1
Frequency Percent
93 70.99
38 29.00
TOTALS 131 100.00
OA. wit

26
TABLE 30
DIETICIAN CONSULTANTS, DAYS PER MONTH
N = 130*
Days Per Month Frequency N Percent *N Percent
None 93 71.53 70.99
Daily 1 .76 .76
One 10 7.69 7.63
Two 6 4.61 4.58
Three 0 0.00 0.00
Four 2 1.53 1.52
Five 0 0.00 0.00
Six 0 0.00 0.00
Seven 0 0.00 0.00
Eight 1 .76 .76
As Needed 17 13.07 12.97
Other 1 0.00 .76
TOTALS 131 100.00 100.00
*N (Total N Plus Blank and Other) = 131
,rk.E3

27
TABLE 31
NUMBER OF FULL-TINM IN-SERVICE EDUCATORS
N = 131
# of Full-TimeIn-Service Educators Frequency Percent
None 122 93.12
One 9 6.87
TOTALS 131 100.00
TABLE 32
NUMBER OF PART-TIME IN-SERVICE EDUCATORS
N = 131
of Part-TimeIn-Service Educators Frequency Percent
None
1
2
77
52
2
58.77
39.69
1.52
TOTALS 131 100.00

28
TABLE 33
NUMBER OF IN-SERVICE EDUCATOR CONSULTANTS
N = 131
# of In-Service EducatorConsultants Frequency Percent
None
1
TOTALS
130 99.23
1 .76
131 100.00
TABLE 34
IN-SERVICE EDUCATOR CONSULTANTS, DAYS PER MONTH
N = 131
Days per month Frequency Percent
None 130 99.23
1 1 .76
TOTALS 131 100.00
29
TABLE 35
NUMBER OF FULL-TIME PSYCHIATRISTS
N = 131
# of Full-TimePsychiatrists Frequency Percent
None
1
2
13 0
0
1
99.23
0.00
.76
TOTALS 131 100.00
TABLE 36
NUMBER OF PART-TINE PSYCHIATRISTS
N = 131
# of Part-timePsychiatrists Frequency Percent
None
1
TOTALS
130 99.23
1 .76
131 100.00
ef

TABLE 37
NUMBER OF PSYCHIATRIC CONSULTANTS
N = 131
30
# of PsychiatricConsultants Frequency Percent
None
1
2
126
1
96.18
3.05
.76
TOTALS 131 100.00
TABLE 38
PSYCHIATRIC CONSULTANTS, DAYS PER MONTH
N = 131
Days per month Frequency Percent
None
1
As Needed
126
1
4
96.18
.76
3.05
TOTALS 131 100.00
TABLE 39
NUMBER OF FULL-TIME PHYSICIANS
N - 131
# of Full-timePhysicians Frequency
None
1
TOTALS
121
10
131
Percent
92.36
7.63
100.00

TABLE 40
NUMBER OF PART-TIME PHYSICLANS
N = 131
31
# of Part-TimePhysicians Frequency Percent
None
1
2
122
6
3
93.12
4.58
2.29
TOTALS 131 100.00
TABLE 41
NUMBER OF PHYSICIAN CONSULTANTS
N = 131
# of Physician Consultants Frequency Percent
None 71 54.19
1 46 35.11
2 7 5.34
3 2 1.52
L. 3 2.29
5 1 .76
6 1 .76
TOTALS 131 100.00

32
TABLE 42
PHYSICIAN CONSULTANTS, DAYS PER MONTH
N = 90*
Days per Month Frequency N Percent *N Percent
None 71 78.88 54.19
Daily 1 1.11 .76
1 2 2.22 1.52
2 7 7.77 5.34
3 2 2.22 1.52
4 3 3.33 2.29
5 0 0.00 0.00
6 0 0.00 0.00
7 0 0.00 0.00
8 2 2.22 1.52
9 2 2.22 1.52
Other 41 0.00 31.29
TOTALS 131 100.00 100.00
*N (lotal N Plus Blank and Other) = 131
.34

33TABLE 43
OTHER FULL-TIME PERSONNEL
N = 131
# of Other Pull-TimePersonnel. Frequency Percent
None 111 84.73
1 12 9.16
2 3 2.29
3 3 2.29
4 1 .76
5 0 0.00
0 0.00
7 0 0.00
8 0 0.00
9 1 .76
TOTALS 131 100.00
.3 5

TABLE 44
OTHER PART-TIME PERSONNEL
N = 131
34,
# of Other Part-Time Personnel Frequency Percent
None 125 95.41
1 3 2.29
2 0 0.00
3 1 .76
4 0 0.00
5 1 .76
6 1 .76
TOTALS 131 100.00
TABLE 45
NUMBER or OTHER CONSULTANTS
N = 131
# of Other Consultants Frequency Percent
None 113 86.25
1 7 5.34
2 U. 3.05
3 3 2.29
4 3 2.29
5 1 .76
TOTALS 131 100.00
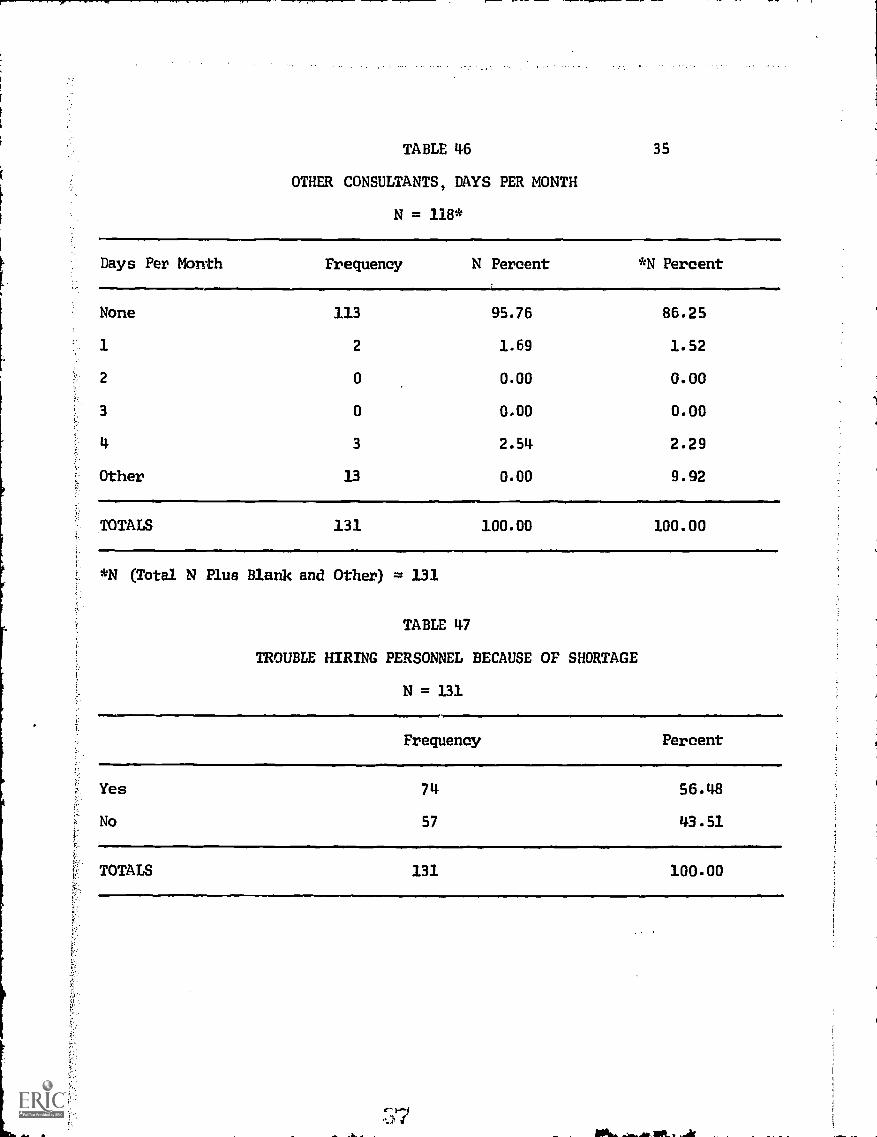
TABLE 46
OTHER CONSULTANTS, DAYS PER MONTH
N = 118*
35
Days Per Month Frequency N Percent *N Percent
None 113 95.76 86.25
1 2 1.69 1.52
2 0 0.00 0.00
3 0 0.00 0.00
4 3 2.54 2.29
Other 13 0.00 9.92
TOTALS 131 100.00 100.00
*N (Total N Plus Blank and Other) = 131
TABLE 47
TROUBLE HIRING PERSONNEL BECAUSE OF SHORTAGE
N = 131
Frequency Percent
Yes 74 56.48
No 57 43.51
TOTALS 131 100.00

TABLE 148
TROUBLE HIRING R .N. S BECAUSE OF SHORTAGE
N = 131
36
Frequency Percent
Yes 42 32 . 06
No 32 24 . 42
Not Applicable 57 43 .51
TOTALS 131 100 . 00
TABLE 49
TROUBLE HIRING L. P. N. S BECAUSE OF SHORTAGE
N = 131
Yes
No
Not Applicable
Frequency Percent
33 25 .19
41 31. 29
TOTALS
57 43 . 51
131 100 . 00
TABLE 50
TROUBLE HIRING AIDES BECAUSE OF SHORTAGE
N = 131
Frequency Percent
Yes
No
Not Applicable
40
34
57
30.53
25 . 95
43 .51
TOTALS 131 100 .00

TABLE 5137
TROUBLE HIRING PHYSICAL THERAPISTS BECAUSE OF SHORTAGE
N = 131
Frequency Percent
Yes 8 6 .10
No 66 50.3 8
Not Applicable 57 43 . 51
TOTALS 131 100 . 00
TABLE 52
TROUBLE HIRING OCCUPATIONAL THERAPISTS BECAUSE OF SHORTAGE
N = 131
Frequency Percent
Yes 10 7.63
No 64 48 . 85
Not Applicable 57 43 . 51
TOTALS 133. 100 . 00
TABLE 53
TROUBLE HIRING RECREATION & SOCIAL DIRECTORS BECAUSE OF SHORTAGE
N = 131
Frequency Percent
Yes Li- 3 . 05
No 7 0 53 . 43
Not Applicable 57 43. 51
TOTALS 131 100 . 00
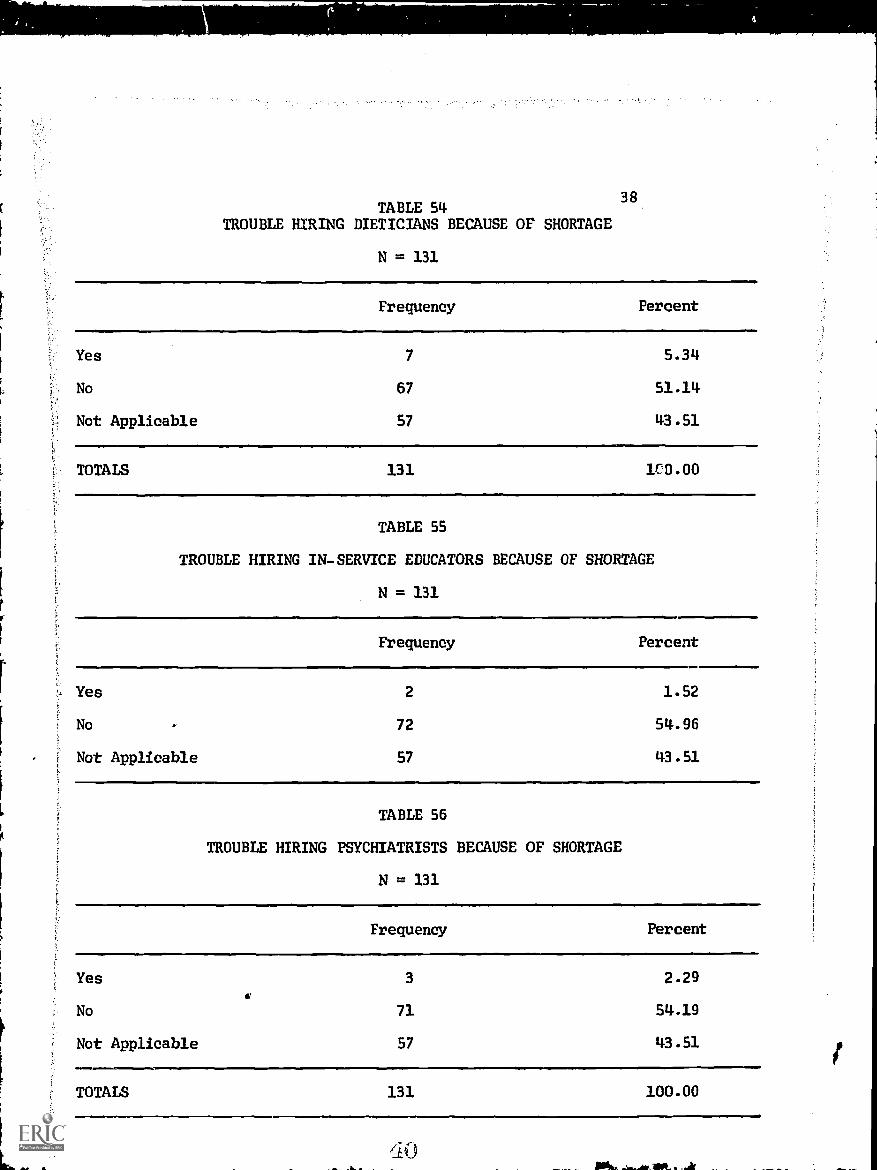
TABLE 5438
TROUBLE HIRING DIETICIANS BECAUSE OF SHORTAGE
N = 131
Frequency Percent
Yes 7 5.34
No 67 51.14
Not Applicable 57 43.51
TOTALS 131 le0.00
TABLE 55
TROUBLE HIRING IN-SERVICE EDUCATORS BECAUSE OF SHORTAGE
N = 131
Frequency Percent
Yes 2 1.52
No . 72 54.96
Not Applicable 57 43.51
TABLE 56
TROUBLE HIRING PSYCHIATRISTS BECAUSE OF SHORTAGE
N = 131
Frequency Percent
Yes 3 2.29
No 71 54.19
Not Applicable 57 43.51
twelrawill3
TOTALS 131 100.00

TABLE 57
TROUBLE HIRING PHYSICIANS BECAUSE OF SHORTAGE
N = 131
39
Frequency Percent
Yes 3 2.29
No 71. 54.19
Not Applicable 57 43.51
TOTALS 131 100.00
TABLE 58
TROUBLE HIRING OTHERS BECAUSE OF SHORTNGE
N = 131
Frequency Percent
Yes 8 6.10
' No 66 50.38
Not Applicable 57 43.51
TOTALS 131 100.00
;
TABLE 59
HAVE IN-SERVICE EDUCATION PROGRAM
N = 131
Frequency Percent
Yes 83 63.35
No 48 36.6 4
TOTALS 131 100.00
LS. _

."
TABLE 60
R. N. IS INCLUDED IN IN- SERVICE EDUCATION PROGRAM
N = 131
tb
Frequency Percent
Yes 61 46 . 56
No 22 16 . 7 9
Not Applicable 48 36 . 64
TOTALS 131 100 . 00
TABLE 61
L. P. N . S INCLUDED IN IN-SERVICE EDUCATION PROGRAM
N = 131
Frequency Percent
Yes 63 48 . 09
, No 19 14. 50
Not Applicable 49 37 . 40
TOTALS 131 100 . 00
TABLE 62
AIDES INCLUDED IN IN- SERVICE EDUCATION PROGRAM
N = 131
Frequency Pere ent
Yes 81 61 . 83
No 2 1. 52
Not Applicable 48 3 6.611
TOTALS 131 100 . 00

TABLE 63 41
PHYSICAL THERAPISTS INCLUDED IN IN- SERVICE EDUCATION PROGRAM
N = 131
Frequency Percent
Yes 15 11. 45
No 66 50 . 38
Not Applicable 50 38 .16
TOTALS 131 100 . 00
TABLE 64.
OCCUPATIONAL THERAPISTS INCLUDED IN IN- SERVICE EDUCATION PROGRAM
N = 131
Frequency Percent
Yes 7 5.34
No 74 56.48
Not Applicable 50 38.16
TOTALS 131 100. 00
TABLE 65
OTHERS INCLUDED IN IN- SERVICE EDUCATION PROGRAM
N = 131
Frequency Percent
Yes 31 23 . 66
No 52 39- 69
Not Applicable 48 36. 64
TOTALS 131 100.00
43_
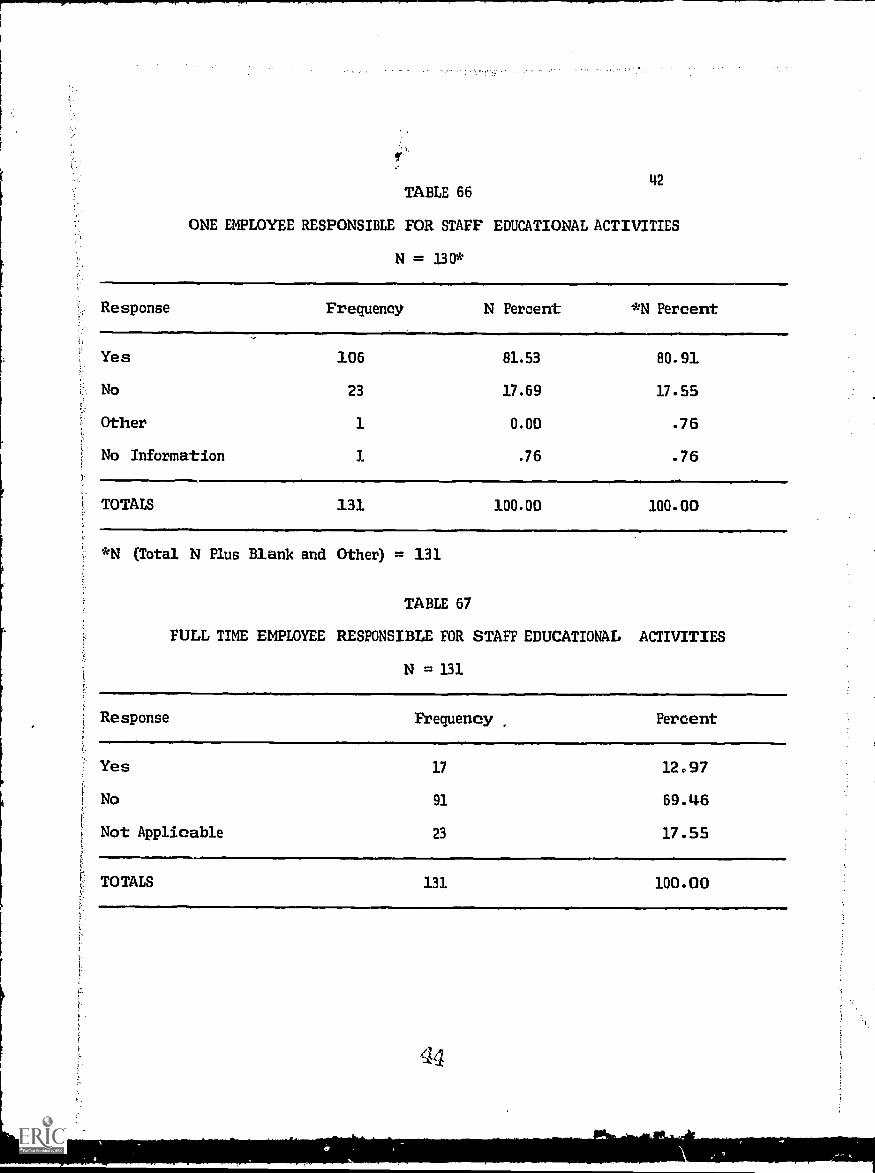
TABLE 66
ONE EMPLOYEE RESPONSIBLE FOR STAFF EDUCATIONAL ACTIVITIES
N = 130*
Re sponse Frequency N Percent *N Percent
Ye s
No
Other
No Informat ion
106
23
1.
81.53
17.69
O. 00
.76
80. 91
17. 55
. 76
. 76
TOTALS 131 100.00 100. 00
*N (Total N Plus Blank and Other) = 131
TABLE 67
FULL TIME EMPLOYEE RESPONSIBLE FOR STAFF EDUCATIONAL
N = 131
ACTIVITIES
Response Frequency Per cent
Yes 17 12 . 97
No 91 69 .146
Not Applicable 23 17 . 55
TOTALS 131 100 . 00

43TABLE 68
RESPONSE TO QUESTION: WOULD YOU LIKE A REPRESENTATIVE FROM MRMP TO
VISIT YOUR FACILITY TO ASSIST IN DEVELOPING AN IN-SERVICE EDUCATION
PROGRAM?
Response
N = 131
Frequency Percent
Yes
No
Don't Know
No Information
66
60
1
50.38
45.80
.76
3 .05
TOTALS 131 100.00
TABLE 69
RESPONSE TO QUESTION: DO YOU OR MEMBERS OF YOUR STAFF ATTEND THE
EDUCATIONAL PROGRAMS CONDUCTED BY THE STATE DEPARTMENT OF HEALTH
AND WELFARE?
Response
N = 131
Frequency Percent
Yes
No
TOTALS
111 84.73
20 15.26
131 100.00

44TABLE 70
REASON FOR NOT ATTENDING
N = 131
Reason Fr equency Percent
Programs not relevantto needs
Too Far Away
Cannot spare the timeor Personnel
Other
First two reasons
First and third
First and fourth
Second and third
Second and fourth
Third and fourth
Not Applicable
2
3
2
0
2
0
2
0
0
112
TOTALS 131
1.52
2.29
6.10
1.52
0.00
1.52
0.00
1.52
0.00
0.00
85.149
100.00
r.:

14-5
TABLE 71
RESPONSE TO QUESTION : WOULD YOU SEND MEMBERS OF YOUR STAFF TO FORMAL
EDUCATIONAL PROGRAMS IN THEIR SPECIALTIES AT PORTLAND?
N = 131
Response Frequency Percent
Yes 46 35.11
No 70 53 . 43
Not Applicable 14 10. 68
No Information 1 .76
TOTALS 131 100. 00
TABLE 72
RESPONSE TO QUESTION: WOULD YOU SEND MEMBERS OF YOUR STAFF TO FORMAL
EDUCATIONAL PROGRAMS IN THEIR SPECIALTIES AT LEWISTON-AUBURN?
N = 131
Response Fr equency Percent
Yes 63 48 . 09
No 53 40. 45
Not Applicable 14 10. 68
No Information 1 . 76
TOTALS 131 100. 00

46TA BLE 73
RESPONSE TO QUESTION: WOULD YOU SEND MEMBERS OF YOUR STAFF TO FORMAL
EDUCATIONAL PROGRAMS IN THEIR SPECIALTIES AT WATERVILLE-AUGUSTA?
N = 131
Response Frequency Percent
Yes 60 145.80
No 56 42 .74
Not Applicable 14 10.68
No Information 1 .76
TOTALS 131 100 .00
TABLE 74
RESPONSE TO QUESTION: WOULD YOU SEND MEMBERS OF YOUR STAFF TO FORMAL
EDUCATIONAL PROGRAMS IN THEIR SPECIALTIES AT BANGOR?
N = 131
Response Frequency Percent
Yes
No
Not Applicable
No Information
48
68
14-
1
TOTALS 131
36.64
51.90
10.68
.76
100.00

47TABLE 75
RESPONSE TO QUESTION: WOULD YOU SEND MEMBERS OF YOUR STAFF TO FORMAL
EDUCATIONAL PROGRAMS IN THEIR SPECIALTIES AT CARIBOU-PRESQUE ISLE?
N = 131
Response Frequency PercentVINEwm..,
Yes 13 9.92
No 103 7 8 . 62
Not Applicable 14 10 . 68
No Information 1 .76
TOTALS 131 100 . 00
TABLE 7 6
RESPONSE TO QUESTION: WOULD YOU SEND MEMBERS OF YOUR STAFF TO FORMAL
EDUCATIONAL PROGRAMS IN THEIR SPECIALTIES AT ANY OTHER LOCATION?
N = 131
Response Frequency Percent
Ye s
No
Not Applicable
No Information
10 7.63
106 80.91
14 10.68
1 .76
TOTALS 131 100.00
119

48
TABLE 77
WOULD NOT SEND PERSONNEL TO EDUCATIONAL PROGRAMS IN THEIR SPECIALTIES
N = 131
Re sponse Fr equency Percent
Yes 17 12. 97
No 112 85. LI-9
Not Applicable 1 . 7 6
No Information 1 .7 6
TOTALS 131 100. 00
TABLE 78
RESPONSE TO QUESTION: ARE YOU OR MEMBERS OF YOUR STAFF ABLE TO ATTEND
MEETINGS, WHICH ARE HELD OUT OF STATE, TO LEARN OF NEW PRACTICES IN
CARING FOR NURSING HOME PATIENTS?
N = 131
Response Frequency Percent
Yes
No
TOTALS
50
81
38.16
61 . 83
131 100.00

49TABLE 79
REASONS WHY NOT ABLE TO ATTEND MEETINGS WHICH ARE HELD OUT OF STATE
TO LEARN OF NEW PRACTICES IN CARING FOR NURSING HOME PATIENTS.
N = 130*
Reasons Frequenoy N Percent *N Percent
Too Expensive 2 1 . 53 1.52
Too Far 1 .76 .76
Caret Spare Time orPersonnel 38 29.23 29.00
No Such ProgramsAvailable 5 3.84 3.81
First & Second Reasons 4 3.07 3.05
First & Third 15 11.53 11.45
First & Fourth 1 .76 .76
Second & Third 8 6.15 6.10
Second & Fourth 1 .76 .76
Third & Fourth 1 .76 .76
Not Applicable 52 140.00 39.69
Three or More gc 1.53 1.52
Other %I. 1 0.00 .76
TOTALS 131 100.00 100.00
*N (Total N Plus Blank and Other) = 131
50
TABLE 80
RESPONSE TO QUESTION: IS A TREATMENT ORDER HAN DEVELOPED FOR
EACH PATIENT IN THIS NURSING HOME?
N = 131
Response Frequency Percent
Yes
No
TOTALS
127 96 . 911
3 .05
133. 100.00
TABLE 83.
RESPONSE TO QUESTION: IF YES ARE THESE PIANS REVIEWED AS PART OF
EDUCATIONAL SESSIONS FOR THE STAFF?
N = 131
Response Frequency Percent
Yes 96 7 3.28
No 31 23 .66
Not Applicable 14 3.05
TOTALS 131 100 . 00

51
RESPONSE TO QUESTION:
THIS HOME?
TABLE 82
DO YOU HAVE A UTILIZATION REVIEW PROCEDURE IN
N = 130*
Response Frequency N Percent *N Percent
Yes
No
Other
57
73
1
43.84
56.15
0.00
43.51
55.72
.76
TOTALS 131 100. 00 100.00
*N (Total N Plus Blank and Other) = 131
TABLE 83
IF YES, DOES THE ADMINISTRATOR PARTICIPATE IN THE REVIEW?
N = 131
Response Frequency Percent
Yes 42 32 . 06
No 14. 10. 68
Not Applicable 75 57-25
TOTALS 131 100. 00

52TABLE 84
IF YES, DOES THE HEAD NURSE PARTICIPATE IN THE REVIEW?
N = 131
Response Frequency Percent
Yes 48
Ho 8
Not Applicable 75
36.64
6.10
57.25
TOTALS 131 100.00
TABLE 85
IF YES, DO R.N.'S AND L.P.N.'S PARTICIPATE IN THE REVIEW?
N = 131
Response Frequency Percent
Yes
No
Not Applicable
22 16.79
34 25.95
75 57.25
TOTALS 131 100.00

TABLE 86
IF YES, DO THE AIDES PARTICIPATE IN THE REVIEW?
N = 131
53
Response Frequency Percent
Yes 13 9.92
No 43 32.82
Not Applicable 75 57.25
TOTALS 131 100.00
TABLE 87
IF YES, DO PHYSICAL THERAPISTS AND OCCUPATIONAL THERAPISTS PARTICIPATE IN
THE REVIEW?N = 131
Response Frequency Percent
Yes 4 3.05
No 52 39.69
Not Applicable 75 57.25
TOTALS 131 100.00
TABLE 88
IF YES, DOES THE SOCIAL WORKER PARTICIPATE IN THE REVIEW?
N = 131
Response Frequency Percent
Yes
No
Not Applicable
5
51
75
3.81
38.93
57.25
TOTALS 131 100.00

TABLE 89
IF YES, DOES THE PHYSICIAN(S) PARTICIPATE IN THE REVIEW?
N = 131
5 4
Response Frequency Percent
Yes 21 16.03
No 35 26.71
Not Applicable 75 57.25
TOTALS 131 100.00
TABLE 90
IF YES, DOES THE DIETICIAN PARTICIPATE IN THE REVIEW?
N = 131
Response Frequency Percent
Yes 1 .76
No 55 41.98
Not Applicable 75 57.25
TOTALS 131 100.00
TABLE 91
IF YES, DP OTHER PERSONS PARTICIPATE IN THE REVIEW?
N = 131
Response Frequency Percent
Yes 8 6.10
No 48 36.64
Not Applicable 75 57.25
TOTALS 131 100.00

TABLE 92 55
RESPONSE TO QUESTION: ARE THE RESULTS OF THE REVIEW USED FOR
EDUCATIONAL PURPOSES WITH THE ENTIRE STAFF?
N = 131
Response Frequency Percent
Yes
No
Not Applicable
No Information
35
33
60
3
26.71
25.19
45.80
2.29
TOTALS 131 100.00
TABLE 93
RESPONSE TO QUESTION: DO YOU HAVE PROCEDURE MANUALS FOR EACH CATEGORY
OF PERSONNEL ON YOUR STAFF?
N=131
Response Frequency Percent
Yes 84 64.12
No 47 35.87
TOTALS 131 100.00
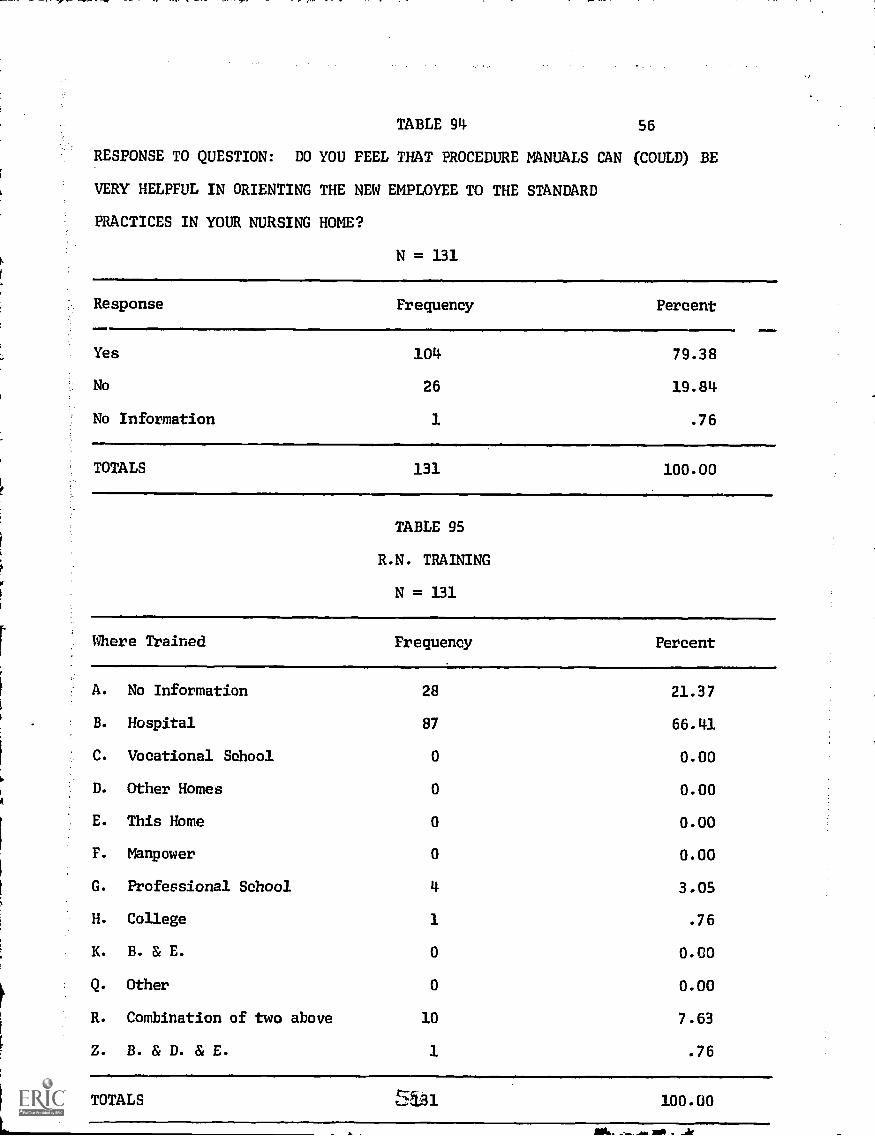
TABLE 94 56
RESPONSE TO QUESTION: DO YOU FEEL THAT PROCEDURE MANUALS CAN (COULD) BE
VERY HELPFUL IN ORIENTING THE NEW EMPLOYEE TO THE STANDARD
PRACTICES IN YOUR NURSING HOME?
N = 131
Response Frequency Percent
Yes 104 79.38
No 26 19.84
No Information 1 .76
TOTALS 131 100.00
TABLE 95
R.N. TRAINING
N = 131
Where Trained Frequency Percent
A. No Information 28
B. Hospital 87
C. Vocational School 0
D. Other Homes 0
E. This Home 0
F. Manpower 0
G. Professional School 4
H. College 1
K. B. & E. 0
Q. Other 0
R. Combination of two above 10
Z. B. & D. & E. 1
21.37
66.41
0.00
0.00
0.00
0.00
3.05
.76
0.00
0.00
7.63
.76
TOTALS 100.00

TABLE 96
L.P.N. TRAINING
N = 131
57
Where Trained Frequency Percent
A. No Information 38 29.00
B. Hospital 35 26.71
C. Vocational School 16 12.21
D. Other Homes 0 0.00
E. This Home 5 3.81
F. Manpower 0 0.00
G. Professional School 8 6.10
H. College 1 .76
K. B. & E. 8 6.10
Q. Other 5 3.81
R. Combination of two above 12 9.16
Z. B. & D. & E. 3 2.29
TOTALS 131 100.00

TABLE 97
NURSES AIDES TRAINING
N = 131
58
Where Trained Frequency Percent
A. No Information
B. Hospital 16
3.05
12.21
C. Vocational School 1 .76
D. Other Homes 5 3.81
E. This Home 40 30.53
F. Manpower 0 0.00
G. Professional School 1 .76
H. College 0 0.00
K. B. & E. 16 12.21
Q. Other L. 3.05
R. Combination of two above 22 16.79
Z. B. & D. & E. 22 16.79
TOTALS 131 100.00
Where Trained
TABLE 98
PHYSICAL THERAPISTS AIDES TRAINING
N = 131
59
Frequency Percent
A. No Information 115 87.78
B. Hospital 2 1.52
C. Vocational School 0 0.00
D. Other Homes 1 .76
E. This Home 7 5.34
F. Manpower 1 .76
G. Professional School 2 1.52
H. College 0 0.00
K. B. & E. 2 1.52
Q. Other 1 .76
R. Combination of two above 0 0.00
Z. B. & D. & E. 0 0.00
TOTALS 131 100.00

60
TABLE 99
OCCUPATIONAL THERAPISTS AIDES TRAINING
N = 131
Where Trained Frequency Percent
A. No Information 1.21 92.36
B. Hospital 0 0.00
C. Vocational School 0 0.00
D. Other Homes 1 .76
E. This Home 5 3.81
F. Mhnpower 0 0.00
G. Professional School 1 .76
H. College 3 2.29
K. B. & E. 0 0.00
Q. Other 0 0.00
R. Combination of two above 0 0.00
Z. B. & D. & E. 0 0.00
TOTALS 131 100.00

61
TABLE 100
PHYSICAL THERAPISTS TRAINING
N = 131
Where Trained Frequency Percent
A. No Ini:omation 106 80.91
B. Hostal 7 5.34
C. Voational School 1 .76
D. Other Homes 0 0.00
E. This Home 0 0.00
F. Marnower 0 0.00
G. PmEz..2oiona1 School 4. 3.05
H. College 9 6.87
K. IL & E. 0 0.00
Q. Other 0 0.00
R. Combination of two above 4. 3.05
Z. B. & D. & E. 0 0.00
TOTALS 131 100.00
63

62
TABLE 101
OCCUPATIONAL THERAPISTS TRAINING
N = 131
Where Trained Frequency Percent
A. No Inforwation 116 88.54
B. Hospital 7 5.34
C. Vocational School 2 1.52
D. Other Homes 0 0.00
E. This Home 1 .76
F. Manpower 0 0.00
G. Professional School 2 1.52
H. College 2 1.52
K. B. & E. 0 0.00
Q. Other 0 0.00
R. Combination of two above 1 .76
Z. B. & D. & E. 0 0.00
TOTALS 131 100.00

63
TABLE 102
DIETICIAN TRAINING
N = 131
Where Trained Frequency Percent
A. No Information 93 7 0 . 99
B. Hospital 8 6.10
C. Vocational School 0 0.00
D. Other Homes 1 .76
E. This Home 0 0. 00
F. Manpower 0 0.00
G . Professional School 5 3 . 81
H. College 15 11..115
K. B. & E. 0 0.00
Q. Other 5 3 . 81
R. Combination of two above 1+ 3 . 05
Z. B. & D. & E. 0 0. 00
TOTALS 131 100 . 00

64TABLE 103
NUTRITIONIST TRAINING
N = 131
Where Trained Frequency Percent
A . No Information
B . Hospital
C. Vocational School
D. Other Homes
E. This Home
F. Manpower
G . Professional School
H. College
K. B. & E.
Q . Other
R. Combination of two above
Z. B. & D. & E.
127
0
0
0
1
0
1
2
0
0
0
0
96 . 94
0.00
0. 00
0.00
.76
0.00
.76
I. 52
0.00
0.00
0.00
0.00
TOTALS 131 100 . 00
66

65
TABLE 104
DIETARY AIDE TRAINING
N = 131
Where Trained Frequency Percent
A. No Information 120 91.60
B. Hospital 1 .76
C. Vocational School 0 0.00
D. Other Homes 0 0.00
E. This Home 8 6.10
F. Manpower 0 0.00
G. Professional School 0 0.00
H. College 1 .76
K. B. & E. 0 0.00
Q. Other 0 0.00
R. Combination of two above 1 .76
Z. B. & D. & E. 0 0.00
TOTALS 131 100.00

66TABLE 105
RECREATION DIRECTOR TRAINING
N = 131
Where Trained Frequency Percent
A. No Information 94 71.75
B. Hospital 7 5.34
C. Vocational School 3 2. 29
D. Other Homes 2 1. 52
E. This Home 5 3.81
F. Manpower 3 2.29
G. Pro fessional School 3 2. 29
H. College 5 3. 81
K. B. & E. 1 .76
Q. Other 6
R. Combination of two above 2 1. 52
Z. B. & D. & E. 0 O. 00
TOTAL 131 100. 00

67
TABLE 106
EDUCATOR TRAINING
N = 131
Where Trained Frequency Percent
A. No Information 96 73 . 28
B. Hospital 25 19 . 08
C. Vocational School 0 0.00
D. Other Homes 0 0.00
E. This Home 3 2.29
F. Manpower 0 0.00
G. Professional School 1 .76
H. College L. 3.05
K. B. & E. 0 0.00
Q. Other 1 . 76
R. Combination of two above 1 .76
Z. B. & D. & E. 0 0.00
TOTALS 133. 100. 00

68TABLE 107
RESPONSE TO QUESTION: IS EACH PATIENT IN THIS HOME UNDER THE CARE OF A
PRIVATE PHYSICIAN?N = 131
Response Frequency Percent
Yes 126 96.18
No 5 3.81
TOTALS 131 100.00
TABLE 108
IF NO, DOES THE HOME HAVE A STAFF PHYSICIAN WHO CARES FOR THE PATIENTS
WITHOUT A PRIVATE PHYSICIAN?N = 131
Response Frequency Percent
Yes 6 4.58
No 0 0.00
Not Applicable 125 95. 41
TOTALS 131 100. 00

69TABLE 109
RESPONSE TO QUESTION: APPROXIMATELY HOW MANY TIMES IN THE PAST YEAR HAVE
YOU HAD DIFFICULTY SECURING THE SERVICES OF A PHYSICIAN FOR AN EMERGENCY
SITUATION?
N = 131
# of Times Frequency Percent
None 109 83.20
1..5 20 15.26
6.10 2 1.52
TOTALS 131 100.00
TABLE 110
RESPONSE TO QUESTION: HOW OFTEN, ON THE AVERAGE, ARE THE PATIENTS EXAMINED
BY A PHYSICIAN?N = 131
How Oft en Frequency Percent
Monthly
Every 2 months
Every 4 months
Every 6 months
Yearly
Never
Other
48
31
15
2
2
1
32
36.64
23.66
11.45
1.52
1.52
.76
24.42
TOTALS 131 100.00

7 0TABLE 111
RESPONSE TO QUESTION : WHAT PERCENTAGE OF YOUR PATIENTS ARE PRIVATE
SELF-PAY?N = 131
Percentage Frequency Percent
None 10 7.63
Le ss than 10% 33 25.19
11-30 43 32.82
31 50 19 14.50
51 80 17 12.97
81-100 8 6.10
No Information 1 .76
TOTALS 131 100.00
TABLE 112
DENTAL CARE ARRANGEMENTS
N = 131
Arrangement s Frequency Percent
Patient visited byown Dentist
Dentist on Staff
Emergency Basis
Other
2E1
3
26
78
18.32
2.29
59.54
TOTALS 131 100.00

71TABLE 113
RESPONSE TO QUESTION: DO YOU FEEL THAT THE PHYSICIANS AND DENTISTS IN THE
AREA COULD BE MORE COOPERATIVE IN HELPING WITH THE CARE OF YOUR PATIENTS?
N = 131
Response Frequency Percent
Yes
No
No Opini.on
27 20 . 61
102 77.86
2 1.52
TOTALS 131 100. 00
TABLE 114
RESPONSE TO QUESTION: DOES A PHYSICIAN PARTICIPATE IN YOUR STAFF CONFERENCES?
N = 130*
Re sponse Frequency N Percent *N Percent
Always 16 12.30 12.21
Sometimes 37 28 . 46 28 . 211
Never 77 59.23 58.77
Other 1 0.00 .76
TOTALS 131 100. 00 100 . 00
*N (Total N Plus Blank and Other) = 131

72
TABLE 115
RESPONSE TO QUESTION: DO YOU FEEL THAT A PHYSICIAN'S ASSISTANT, WHO WAS
SPECIALLY TRAINED TO CARE FOR ELDERLY PEOPLE AND WHO WAS LICENSED BY THE
STATE TO PROVIDE MOST OF THE NONEMERGENCY CARE FOR NURSING HOME PATIENTS,
WOULD BE ABLE TO PROVIDE BETTER CARE FOR YOUR PATIENTS THAN THEY PRESENTLY
GET? SUCH A PERSON MIGHT BE SHARED BY SEVERAL NURSING HOMES.
N = 131
Response Frequency Percent
Yes 43 3 2 .82
No 7 6 5 8 .01
Don't Know 12 9.16
TOTALS 13 1 100.00
TABLE 116
RESPONSE TO QUESTION: WOULD YOU SEND ONE OF YOUR NURSES TO A TRAINING
COURSE TO BECOME A GERIATRIC CARE SPECIALIST IF SUCH A COURSE WERE AVAIL-
ABLE AT THE NEAREST REGIONAL MEDICAL, CENTER?
N = 131
Response Frequency Percent
Yes
No
Don't know
84. 611.12
3 3 2 5.19
14 10.68
TOTALS 131 100.00

73TABLE 117
IF NOT, REASONS
N = 130*
Reasons Frequency N Percent *N Percent
A. Cannot Spare 11 8.46 8.39
B. No ane present,Capable 2 1.53 1.52
C. No Need 11 8.46 8.39
D. Other 9 6. 92 6.87
E. A & B 0 0.00 0.00
F. A & C 0 0.00 0.00
G. A & D 1 .76 .76
H. B & C 0 0.00 0.00
I. B & D 0 0.00 0.00
J. C & D 0 0.00 0.00
K. Not Applicable 96 73.84 73.28
Other 1 0.00 .76
TOTALS 131 100.00 100.00
*N (Total N Plus Blank and Other) = 131

714-
TABLE 118
RESPONSE TO QUESTION: WOULD YOU EMPLOY A PERSON TRAINED AS AN OCCUPATIONAL
OR PHYSICAL THERAPY AIIE, OR WOULD YOU SEND A MEMBER OF YOUR PRESENT STAFF
TO A SPECIAL TRAINING COURSE TO BECOME SUCH AN ADE IF THE COURSE WERE
AVAILABLE AT LITTLE COST?
N = 131
Response Frequency Percent
Yes 92 70 . 22
No 25 19. 08
Don't know 11-I. 10 . 68
TOTALS 131 100 . 00
TABLE 119
RESPONSE TO QUESTION: DO YOU HAVE PATIENTS WHO ARE REFERRED TO YOUR NURSING
HOME FROM A NEARBY HOSPITAL?N = 131
Response Frequency Percent
Yes 129 98.47
No 2 1.52
TOTALS 131 100 . 00

75
TABLE 12 0
IF YES, IS A MEMBER OF YOUR STAFF INVITED TO PARTICIPATE IN THE DISCHARGE
PLANNING FOR THOSE PATIENTS AT THE HOSPITAL?
N = 130*
Re sponse frequency N Percent *N Percent
Always 11 8.146 8.39
Sometimes 23 17. 69 17. 5 5
Ne ver 96 73.84 73 . 2 8
Not Applicable 0 0. 00 0.00
Other 1 0. 00 . 7 6
TOTALS 131 100. 00 100 . 00
*N (Total N Plus Blank and Other) = 131
TABLE 121
RESPONSE TO QUESTION: DO THE HOSPITALS WHO ICFER PATIENTS TO YOUR NURSING
HOME FORWARD THE PATIENTIS RECORD ABSTRACTS?
N = 13 0*
Response Frequency N Percent *N Per cent
Always 93 71 . 53 70. 99
Sometimes 3 3 25.38 25.19
Never 4 3.07 3.05
Other 1 0.00 .7 6
TOTALS 131 100 . 00 100 . 00
*N (Total N Plus Blank and Other) = 133.

76
TABLE 122
RESPONSE TO QUESTION: WHAT LABORATORY AND DIAGNOSTIC PROCEDURES ARE YOU
EQUIPPED TO PERFORM IN YOUR NURSING HOME?
= 131
Laboratory andDiagnostic Procedures Frequency Percent
A. ECG Only 1 .76
B. CBC only 0 0.00
C. Urinalysis only 7 5.34
D. Other 1 .76
E. A & B 0 0.00
F. A & C 0 0.00
G. A & D 0 0.00
H. B & C 0 0.00
I. B & D 0 0.00
J. C & D 20 15.26
K. More than 2 3 2.29
L. No information 1 .76
M. None 98 714.80
TOTALS 131 100.00
8

77TABLE 123
RESPONSE TO QUESTION: IS THERE A NEARBY HOSPITAL WHICH PROVIDES LABORATORY,
DIAGNOSTIC OR THERAPEUTIC SERVICES FOR YOUR PATIENTS?
N 131
Response Frequency Percent
Yes 129 98.117
No 2 1.52
TOTALS 131 100 . 00
TABLE 124
IF YES, HOW FAR AWAY IS THIS HOSPITAL FROM THIS NURSING HOME?
N = 131
Distance Frequency Percent
0-10 miles
11-20 miles
21-S0 miles
Over SO miles
112
13
6
0
85.149
9.92
14. 58
0.00
TOTALS 131 100.00

78
TABLE 125
RESPONSE TO QUESTION: DO THE HOSPITALS FROM WHICH PATIENTS ARE REFERRED
TO YOUR NURSING HOME MAINTAIN CONTACT WITH THE PATIENTS WHEN THU ARE IN
YOUR HOME TO ASSURE CONTINUITY OF CARE?
N = 131
Response Frequency Percent
Ye s
No
Sometimes
8 6.10
113 86.25
20 7.63
TOTALS 131 100.00
TABLE 12 6
RESPONSE TO QUESTION: HAS ANY HOSPITAL OFFERED TO SHARE PERSONNEL WITH
YOU, SUCH AS AIDES OR THERAPISTS OR PHYSICIAN ASSISTANTS?
N = 131
Response Frequency Percent
Yes 27 20.61
No 104 79.38
TOTALS 131 100.00

79TABLE 127
IF YES , DID YOU ACCEPT?
N = 131
Response Fr equency Percent
Yes 27 20. 61
No 1 .76
Not Applicable 103 78 . 62
TOTALS 131 100.00
TABLE 128
IF NO, WOULD YOU ACCEPT IF THEY DID?
N = 129*
Response Frequency N Percent *N Percent
Yes 811 65 .11 614.12
No 18 13 . 95 13 .714
Not Applicable 27 20 . 93 20 . 61
Other 2 0.00 1. 52
TOTALS 131 100 . 00 100. 00
*N (Total N Plus Blank and Other) = 131

80TABLE 129
IF YES, HAS THE ARRANGEMENT BEEN SUCCESSFUL?
N = 129*
Response Frequency N Percent *N Percent
Yes 27 20.93 20.61
No 3 2.32 2.29
Not Applicable 99 76.74 75.57
Other 2 0.00 1.52
TOTALS 131 100.00 100.00
*N (Total N Plus Blank and Other) = 131
TABLE 130
RESPONSE TO QUESTION: WHAT ARE THE MAIN REASONS THAT CONSULTANTS IN
OCCUPATIONAL THERAPY, REHABILITATION, PHYSICAL THERAPY, DIETETICS, ETC.,
ARE NOT USED MORE IN PLANNING THE SPECIAL CARE OF YOUR PATIENTS AND PROVIDING
SUCH CARE?N = 128*
Reason Frequency N Percent *N Percent
Not Availqble 41 32.03 31.29
Available, but couldnot improve care 17 13.28 12.97
Patients and statewon't pay extras 39 30.46 29.77
Other Reasons 31 24.21 23.66
Other 3 0.00 .2.29
TOTALS 131 100.00 100.00
*N ("fatal N Plus Blank and Other) = 131
110&. imA ..Ar

81
TABLE 131
RESPONSE TO QUESTION: DO YOU HAVE A LARGE (5074 OR OVER) PERSONNEL TURNOVER
EACH YEAR IN R.N.'S?N = 130*
Response Frequency N Percent *N Percent
Yes 6 4.61 4.58
No 124 95.38 94.65
Other 1 0.00 .76
TOTALS 131 100.00 100.00
*N (Mal N Plus Blank and Other) = 131
TABLE 132
RESPONSE TO QUESTION: DO YOU HAVE A LARGE (M OR OVER) PERSONNEL TURNOVER
EACH YEAR IN L.P.N.'S?N = 130*
Response Frequency N Percent *N Percent
Yes
No
Other
3
127
1
2.30
97.69
0.00
2.29
96.94
.76
TOTALS 131 100.00 100.00
*N (ratal N Plus Blank and Other) = 131

82
TABLE 133
RESPONSE TO QUESTION: DO YOU HAVE A LARGE (50% or over) PERSONNEL
TURNOVER EACH YEAR IN AIDES?
N = 130*
Response Frequency N Percent *N Percent
Yes
No
Other
47
83
1
36.15
63.84
0.00
35.87
63.35
.76
TOTALS 131 100.00 100.00
*N (Total N Plus Blank and Other) = 131
TABLE 134
RESPONSE TO QUESTION: DO YOU HAVE A LARGE (50% OR OVER) PERSONNEL
TURNOVER EACH YEAR IN PHYSICAL THERAPISTS?
N = 130*
Response Frequency N Percent *N Percent
Yes
No
Other
2
128
1
1.53
98.46
0.00
1.52
97.70
.76
TOTALS 131 100.00 100.00
*N (Total N Plus Blank and Other) = 131

83
TABLE 135
RESPONSE TO QUESTION: DO YOU HAVE A LARGE (50% OR OVER) PERSONNEL
TURNOVER EACH YEAR IN OCCUPATIONAL THERAPISTS?
N = 130*
Response Frequency N Percent *N Percent
Yes
No
Other
0
130
1
0.00
100.00
0.00
0.00
99.23
.76
TOTALS 131 100.00 100.00
,*N (Tctal N Plus Blank and Other) = 131
TABLE 136
RESPONSE TO QUESTION; DO YDU HAVE A LARGE (50% OR OVER) PERSONNEL
TURNOVER EACH YEAR IN RECREATION & SOCIAL DIRECTORS?
N = 130*
Response Frequency N Percent *N Percent
Yes
No
Other
0
130
1
0.00
100.00
0.00
0.00
99.23
.76
TOTALS 131 100.00 100.00
*N (Total N Plus Blank and Other) = 131
ES

84TABLE 137
RESPONSE TO QUESTION: DO YOU HAVE A LARGE (SM OR OVER) PERSUNNEL
TURNOVER EACH YEAR IN DIETETICS?
N = 130*
Response Frequency N Percent *N Percent
Yes
No
Other
2
128
1
1.53
98.46
0.00
1.52
97.70
.76
TOTALS 131 100.00 100.00
*N (Total N Plus Blank and Other) = 131
TABLE 138
RESPONSE TO QUESTION: DO YOU HAVE A LARGE (50% OR OVER) PERSONNEL
TURNOVER EACH YEAR IN IN-SERVICE EDUCATION?
N = 130*
Response Frequency N Percent *N Percent
Yes
No
Other
0
130
1
0.00
100.00
0.00
0.00
99.23
.76
TOTALS 131 100.00 100.00
*N (Total N Plus Blank and Other) - 131

85
TABLE 139
RESPONSE TO QUESTION: DO YOU HAVE A LARGE (5% OR OVER) PERSONNEL
TURNOVER EACH YEAR IN PHYSICIAN CARE?
N = 130*
Response Frequency N Pement *N Percent
Yes
No
Other
0
130
1
0.00
100.00
0.00
0.00
99.23
.76
TOTALS 131 100.00 100.00
*N (Total N Plus Blank and Other) = 131
TABLE 140
RESPONSE TO QUESTION: DO YOU HAVE A LARGE (50310 OR OVER) PERSONNEL:
TURNOVER EACH YEAR IN OTHER STAFF?
N = 130*
Response Frequency N Percent *N Percent
Yes
No
Other
6
124
1
4.61
95.3 8
0.00
,
4.58
94.65
.7 6
TOTALS 131 100.00 100.00
*N (Dotal N Plus Blank and Other) = 131
E7

86
TABLE 141
RESPONSE TO QUESTION: DOES THE COST OF TRAINING NEW PERSONNEL
SUBSTANTIALLY INFLUENCE THE COST OF OPERATING YOUR NURSING HOME?
N = 131
Response Frequency Percent
Yes 37 28.24
No 91 69.46
Don't Know 3 2.29
TOTALS 131 100.00
TABLE 142
RESPONSE TO QUESTION: DO YOU USE VOLUNTEER HELP IN THIS NURSING
HOME?
N = 131
Response Frequency Percent
Yes 41 31.29
No 90 68.70
TOTALS 131 100.00

TABLE 143 87
RESPONSE TO QUESTION: IF TRAINED VOLUNTEERS WERE AVAILABLE, HOW MANY
COULD YOU USE?
N=131
Amount
1
2-3
Frequency Percent
4-5
5-10
More than 10
None
No Information
11
48
27
13
4
21
7
8.39
36.64
20.61
9.91
3.05
16.03
5.34
TOTALS 131 100.00
TABLE 144
RESPONSE TO QUESTION: ARE THERE TRAINED, BUT INACTIVE RN's, LPN's, OR
AIDES IN THIS COMMUNITY WHO MIGHT WORK ON A PART-TIME BASIS AFTER THEY HAD
ATTENDED A REFRESHER COURSE IN THEIR SPECIALTY?
N = 131
Response Frequency Percent
Yes
No
Don't Know
40 30.53
36 27.48
55 41.98
TOTALS 131 100.00

88
TABLE 145
IF THERE ARE, HOW MANY R.N.'s WOULD YOU BE ABLE TO HIRE?
N = 131
Amount Frequency Percent
A. 1-2 29 22.13
B. 3-4 2 1.52
C. 5-6 1 .76
D. 7-8 0 0.00
E. None 17 12.97
F. Checked but didn'tindicate number 8 6.10
G. Not Applicable 29 22.13
H. No Information 44 33.58
K. Other 1 .76
TOTALS 131 100.00
5..0

89
TABLE 146
IF THERE ARE, HOW MANY L.P.N.TS WOULD YOU BE ABLE TO HIRE?
N = 131
Amount Frequency Percent
A. 1-2 37 28.24
B. 3-4 1 .76
C. 5-6 2 1.52
D. 7-8 0 0.00
E. None 13 9.92
F. Checked but didn'tindicate number 8 6.10
G. Not Applicable 26 19.84
H. No Information 43 32.82
K. Other 1 .76
TOTALS 131 100.00

90
TABLE 147
IF THERE ARE, HOW MANY AIDES WOULD YOU BE ABLE TO HIRE?
N :: 131
Amount Frequency Percent
A. 1-2 9 6. 87
13. 3-4 6 4. 58
C. 5-6 1 .76
D. 7-8 2 1. 52
E. None 26 19.84
F. Checked but didn' tindicate number 7 5.314-
G. Not Applicable 27 20. 61
H. No Information 52 39. 69
K. Other 1 .76
TOTALS 131 100. 00
92,

TABLE 1148
RESPONSE TO QUESTION: DO YOU HAVE DIFFICULTY ARRANGING TRANSPORTATION FOR
PATIENTS FROM YOUR NURSING HOME TO THE HOSPITAL (IN EMERGENCIES)?
N = 131
Response Frequency Percent
Yes 2 1.52
No 129 98.47
TOTALS 131 100 . 00
TABLE 149
RESPONSE TO QUESTION: DO YOU HAVE DIFFICULTY ARRANGING TRANSPORTATION FOR
PATIENTS FROM YOUR NURSING HOME TO THE HOSPITAL (NON EMERGENCIES) ?
N = 131
Response Frequency Percent
Yes 8 6.10
No 123 93 .89
TOTALS 131 100.00
93

92TABLE 150
RESPONSE TO QUESTION: DO YOU THINK THAT THE HOSPITAL AND ITS STAFF ARE
WELL EQUIPPED TO HANDLE MEDICAL EMERGENCIES WHICH OCCUR AT YOUR NURSING
HOME?
N = 130*
Response Frequency N Percent *N Percent
Yes
No
No Information
Other
126
3
1
1
96 . 92
2.30
.76
0.00
96.18
2.29
.76
.76
TOTALS 131 100 . 00 100.00
*N (Total N Plus Blank and Other) = 131
TABLE 151
RESPONSE TO QUESTION: IS THERE A HOME HEALTH SERVICE AGENCY IN THIS AREA?
N = 131
Response Frequency Percent
Yes 80 61.06
No 32 24.42
Don't Know 19 14.50
TOTALS 131 100 .00
Ez4

93
TABLE 152
IS THERE A. VISITING NURSE PROVIDED FOR PATIENTS IN THEIR HOMES IN YOUR
AREA?
N = 131
Response Frequency Percent
Yes
No
Don't Know
82 62.59
19 14. 50
30 22. 90
TOTALS 131 100. 00
TABLE 153
RESPONSE TO QUESTION: IS THERE PHYSICAL THERAPY PROVIDED FOR PATIENTS IN
THEIR HOMES IN YOUR AREA?
Response
N = 131
Frequency Percent
Yes 24 18.32
56. 48
25.19
No 74
Don't Know 33
TOTALS 131 100. 00

94
TABLE 154
RESPONSE TO QUESTION: IS THERE OCCUPATIONAL THERAPY PROVIDED FOR
PATIENTS IN THEIR HOMES IN YOUR AREA?
N = 131
Response Frequency Percent
Yes 11 8.39
No 84 64.12
Don't Know 36 27.48
TOTALS 131 100.00
TABLE 155
RESPONSE TO QUESTION: IS SOCIAL WORK SERVICE PROVIDED FOR PATIENTS
IN THEIR HOMES IN YOUR AREA?
N = 131
Response Frequency Percent
Yes 56 42.74
No 41 31.29
Don't Know 34 25.95
TOTALS 131 100.00

95
TABLE 156
RESPONSE TO QUESTION: ARE THERE ANY OTHER SERVICES PROVIDED FOR PATIENTS
IN THEIR HOMES IN YOUR AREA?
N = 131
Response Frequency Percent
Yes 15 11.45
No 82 62.59
Don't Know 34 25.95
TOTALS 131 100.00
TABLE 157
RESPONSE TO QUESTION: WHEN A PATIENT LEAVES YOUR NURSING HOME TO RETURN
TO HIS FAMILY, DO YOU INVITE HIS COMMUNITY's HOME HEALTH SERVICE AGENCY TO
PARTICIPATE IN THE DISCHARGE PROCEDURES?
N = 130*
Response Frequency N Percent *N Percent
Always 10 7.69 7.63
Sometimes 16 12.30 12.21
Never 66 50.76 50.38
No Such Patient 36 27.69 27.48
No Information 2 1.53 1.52
Other 1 0.00 .76
TOTALS 131 100.00 100.00
*N (rotal N Plus Blank and Other) = 131

96
TABLE 158
RESPONSE TO QUESTION: IF A LOCAL NON PROFIT COMMUNITY HEALTH SERVICE
AGENCY COULD PROVIDE CONSULTANT HELP IN THE AREAS OF PATIENT ChRE
LISTED IN QUESTION 4I:41, WOULD YOU UTILIZE THESE SERVICES?
N = 131
Response Frequency Percent
Yes 95 72.51
No 17 12.97
Need Mbre Information 19 14.50
TOTALS 131 100.00
TABLE 159
RESPONSE TO QUESTION: DO YOU FEEL THAT ANY OF YDUR PATIENTS MIGHT BE ABLE
TO LIVE AT HOME AND BE CARED FOR SAXISFACTORILY BY A HOME HEALTH CARE
SERVICE?
N = 129*
Response Frequency N Percent *N Percent
Yes 28 21.70 21.37
No 100 77.51 76.33
No Information 1 .77 .76
Other 1 0.00 .76
Blank 1 0.00 .76
TOTALS 131 100.00 100.00
(Tota1 N Plus Blank and Other) = 131
£8
CROSSTAB TABLE 1
NUMBER OF FULL-TIME RNIS
BY NUMBER OF BEDS
N = 131
Number
of Beds
01
34
Number of Full-Time RN's
56
78
9Total
10 or less
11
21
14
78.6%
14.3%
7.1%
11-39
23
34
74
169
33.3%
49.3%
10.1%
5.8%
1.4%
31-50
312
53
124
re)
12.5%
50.0%
20.8%
12.5%
4.2%
C.:
51-100
51
53
24
222
22.7%
4.9%
22.7%
13.6%
9.1%
18.2%
9.1%
100+
11
250.0%
50.0%
Totals
37
53
14
13
34
52
131
28.2%
40.5%
10.7%
9.9%
2.3%
3.1%
3.8%
1.5%
100.0%

CROSSTAB TABLE 2
NUMBER OF PART-TIME RN'S
BY NUMBER. OF BEDS
N = 131
Number of
Beds
01
23
45
Number of Part-Time RN's
67
89
10 or less
13
192.9%
7.1%
11-30
SO
14
21
2
72.5%
20.3%
2.3%
1.4%
2.9%
31-50
12
54
21
(-)
50.0%
20.6%
16.7%
8.3%
4.2%
(;)
51-100
84
43
12
36.4%
18.2%
18.2%
13.6%
4.5%
9.1%
100+
11
50.0%
50.0%
Totals
83
24
10
73
31
63.4%
18.3%
7.6%
5.3%
2.3%
2.3%
0.8%
Total
14
69
24
22 2
CROSSTAB TABLE 3
NUMBER OF RN CONSULTANTS
BY NUMBER OF BEDS
N = 131
Number of RN Consultants
Number of
Beds
01
23
45
67
89
Total
10 or less
14
14
100.0%
11-30
65
L.
69
94.2%
5.83/0
31-50
24
24
100.0%
PA °51-100
22
22
14-1
100.03/0
100+
22
100.0%
Totals
127
4131
96.9%
3.1%

CROSSTAB TABLE 4
RN CONSULTANT DAYS PER MONTH
BY NUMBER OF BEDS
N = 131
Number
of Beds
As Needed
01
RN Consultant Days Per Month
23
45
67
89
Total
10 or less
14
14
100.0%
11-30
265
11
69
2.9%
94.2%
1.44
1.4%
31-50
24
24
100.0%
51-100
22
22
100.0%
100+
22
100.0%
Totals
212
71
113
1
1.5%
96.9%
0.8%
0.0%
100.0%

CROSSTAB TABLE S
NUMBER OF FULL-TIME LPN'S
BY NUMBER OF BEDS
N = 131
Number of Full-Time LPN's
Number of
Beds
01
23
45
67
89
Total
10 or less
10
414
71.4%
28.6%
11-30
30
25
65
21
69
43.5%
36.2%
8.7%
7.2%
2.9%
1.4%
31-50
6S
47
224
r ' ,
25.0%
20.8%
16.7%
29.2%
8.3%
C.,
51-100
44
34
41
222
18.2%
18.2%
13.6%
18.2%
18.2%
4.5%
9.1%
100+
11
250.0%
50-0%
Totals
SO
38
13
16
74
3131
38.2%
29.0%
9.9%
12.2%
5.3%
3.1%
2.3%
100.0%

CROSSTAB TABLE 6
NU
MB
ER
OF
PAR
T-T
IME
LPN
' SB
YNUMBER OF BEDS
N=
131
Number of
Bed
s0
12
3
Number of Part-Time LPNIs
45
67
89
Tot
al
10 or less
13
114
92 .
9%7
.1%
11-3
053
131
11
6976.8%
18.8%
1.4%
1.4%
1.4%
31-5
019
22
124
i- r-79
.2%
8.3%
8.3%
4 .2
%
k"1°51-100
14
33
11
22
63 .
6%13
. 6%
13 .6
%4.
5%
4.53
/4
100+
11
250.0%
50.0%
Totals
100
197
32
131
76.3%
14.5%
5.3%
7.3%
1.5%
100.0%

CROSSTAB TABLE 7
NUMBER OF LPN CONSULTANTS
BY NUMBER OF BEDS
N=
131
Number of
Beds
12
3
Number of LPN Consultants
45
67
89
Total
10 or less
11-30
31-50
1392.9%
68 98-%
24
1 7.1%
1 1.4%
14 69
211
100.0%
Col 51-100
22
22
1c0.0%
100+
22
100.0%
Totals
129
11
131
98.ri°4
0.8%
0,g%
100.0%

CROSSTAB TABLE 8
LPN CONSULTANT DAYS PER MONTH
BY NUMBER OF BEDS
N = 131
LPN Consultant Days Per Month
Number
As
of Beds
Needed
02
34
56
78
9Other
Total
10 or less
112
114
7.1%
85.756
7.1%
11-30
68
198.6%
1.4%
31-50
24
100.0%
51-100
22
100.0%
100+
2
100.0%
69
24
22 2
Totals
1128
11
131
0.8%
97.7%
0.8%
0.8% 100.0%

CROSSTAB TABLE 9
NUMBER OF FULL-TIME AIEES
BY NUMBER OF BEDS
N = 131
Number of Full-Time Aids
Number
over
of Beds
01-2
3-5
6-8
9-11
12-15
16-20
21-30
31-40
41-99
100
Other
Total
10 or less
46
31
28.0% 42.9%
21.4%
7.1%
11-3
01
1925
166
11.434
27.5%
36.2ro
23.2%
8.7%
1.43/0
31-50
37
83
21
12 .
5%29
- 2
%33
-3%
12 -
5%
8 -3
%4
- 2%
51-100
15
68
2
4.5% 22.7% 27.3% 36.4%
9.1%
100+
14
69
1.4%
24
'22
11
250.0%
50.0%
Tot
als
56
2229
2419
1011
31
133
1
3.8%
4.6% 16.8%
22.1% 18.3% 14.5%
7.6%
8.4%
2.3%
0.8%
0.8% 100.0%

.77
CROSSTAB TABLE 10
NUMBER OF PART-TIME AIDES
BY NUMBER OF BEDS
N = 131
Number
of Beds
01-2
3-5
6-8
Number of Part-Time Aides
over
9-11
12-15
16-20
21-99
100
Other
Total
10 or less
85
114
57.1%
35.7%
7.1%
11-30
16
21
26
32
169
23.2%
30.4%
37.7%
4.3%
2.9%
1.4%
31-50
49
74
24
16.7%
37.5%
29.2%
16.7%
C GC51-100
23
84
41
22
9.1%
13.6%
36.4%
18.2%
18.2%
4.5%
100+
11
250.0%
50.0%
Totals
30
38
42
11
42
11
2131
22.9%
29.0%
32.1%
8.4%
3.1%
1.5%
0.8%
0.8%
1.5%
100.0%

! P
CROSSTAB TABLE 11
NUMBER OF AIDECONSULTANTS
BY NUMBER OF BEDS
N = 131
Number of
Beds
01
Number of Alde Consultants
23
45
67
89
Total
10 or less
13
114
92.9%
7.1%
11-30
68
169
98.6%
31-50
24
211
tt51-
100
100+
100.0%
22
100.0%
2
100.0%
22 2
Totals
129
98.5%
1 0. 8%
1 0.8%
131
100.0%

CROSSTAB TABLE 12
AIDE CONSULTANT DAYS PER MONTH
BY NUMBER OF BEDS
N = 131
Number
of Beds
As
Needed
01
2
Aide Consultant Days Per Month
34
56
78
9Total
10 or less
113
14
7.1%
92.9%
11-30
168
69
1.4%
98.6%
31-50
24
24
100.0%
51-100
22
22
100.0%
100+
22
100.0%
Totals
2129
131
1.5%
98.5
%10
0.0%

CROSSTAB TABLE 13
NUMBER OF FULL-TIME PHYSICAL THERAPISTS
BY NUMBER OF BEDS
N = 131
Number of Full-Time Physical
Therapists
Number of
Beds
01
23
45
67
89
Total
10 or Less
14
100.%
11-30
67
297.1%
2.9%
i...01-50
24
100.0%
51-100
16
51
72.7%
22.7%
4.5%
100+
11
50.0%
50.0
Totals
121
82
92.4%
6.1%
1.5%
14
69
24
22 2
131
le0.0%

CROSSTAB TABLE 14
NUMBER OF PART-TIME PHYSICAL THERAPISTS
BY NUMBER OF BEDS
N = 131
Number of
Beds
01
23
4
Number of Part-Time Physical Therapists
56
78
9Total
10 or less
14
14
100.0%
11-30
62
769
89.9%
10.1%
31-50
24
24
100.0%
51-100
16
51
22
72.7%
22.7%
4.5%
100+
11
250.0%
50.0%
Totals
13.7
13
1131
89.3%
9.9%
0.8%
100.0°4

CROSSTAB TABLE 15
NUMBER OF PHYSICAL THERAPIST CONSULTANTS
BY NUMBER OF BEDS
N =
131
Number of Physical Therapist Consultants
Number of
Bed
s0
12
35
.67
89
Tot
al
10 or less
14
14
100.0%
11-30
55
14
69
79.7%
20.3%
31-
5013
1121
451
4.2%
45.8%
251-100
17
52
ci77.3%
22.7%
100+
22
100.0%
131
Tot
als
101
30
77.3%
22.9%
100.0%

CROSSTAB TABLE 16
PHYSICAL THERAPIST CONSULTANT DAYS PER MONTH
BY NUMBER OF BEDS
N=131
Number
of Beds
11-30
51-100
100+
Totals
Physical Therapist Consultant Days Per Month
As
Needed
01
23
45
67
89
Other Total
6
14
100.0%
55
23
12
14
69
8.7%
79.7%
2.9%
4.3%
1.4%
2.9%
513
11
31
24
20.8%
54.2%
4.2%
4.2%
12.9%
4.2%
217
12
22
9.1%
77.3%
4.5%
9.1%
22
100.0%
13
101
34
4.
33
131
9.9%
77.1%
2.3%
3.1%
3.1%
2.3%
2.3%
100.0%

CROSSTAB TABLE 17
NUMBER OF FULL-TIME OCCUPATIONAL THERAPISTS
BY NUMBER OF BEDS
N = 131
Number of
Beds
01
23
Number of Full-Time Occwational Therapists
45
67
89
10 or less
14
100.0%
11-30
68
198.6%
1.4%
31-50
22
2
91.7%
8-3%
.trA 51-100
19
386.4%
13.6%
100+
2
100.0%
Totals
123
8
93.9%
6.3%
Total
14
69
24
22 2
131
100.0%
Lu

Number of
Beds
CROSSTAB TABLE 18
NUMBER OF PART-TIME OCCUPATIONAL THERAPISTS
BY NUMBER OF BEDS
N = 131
Tumber of Part-time Occupational Therapists
12
34
56
78
9Total
10 or less
14
100.0%
14
69
11-30
66
3
95.7%
4.3%
24
31-50
22
2
91-7%
8-3%
22
51-100
18
31
81.8%
13.6%
4-5%
2100+
11
50.0%
50.0%
131
Totals
121
91
100.0%
92.4%
6.9%
0.8%

CROSSTAB TABLE 19
NUMBER OF OCCUPATIONAL THERAPIST CONSULTANTS
BY NUMBER OF BEDS
N = 131
Number of
Beds
01
23
Number of Occupational Therapist Consultants
L.
56
78
9
10 or less
11-30
14
100.0%
68
1
98.6%
1.4%
31-50
23
195.8%
4.2%
'N.1 51-100
20
290.9%
9.1%
2
100.0%
Totals
127
4
96.9%
3-1%
Total
14
69
24
22 2
131
100.0%
-r-1
1.11
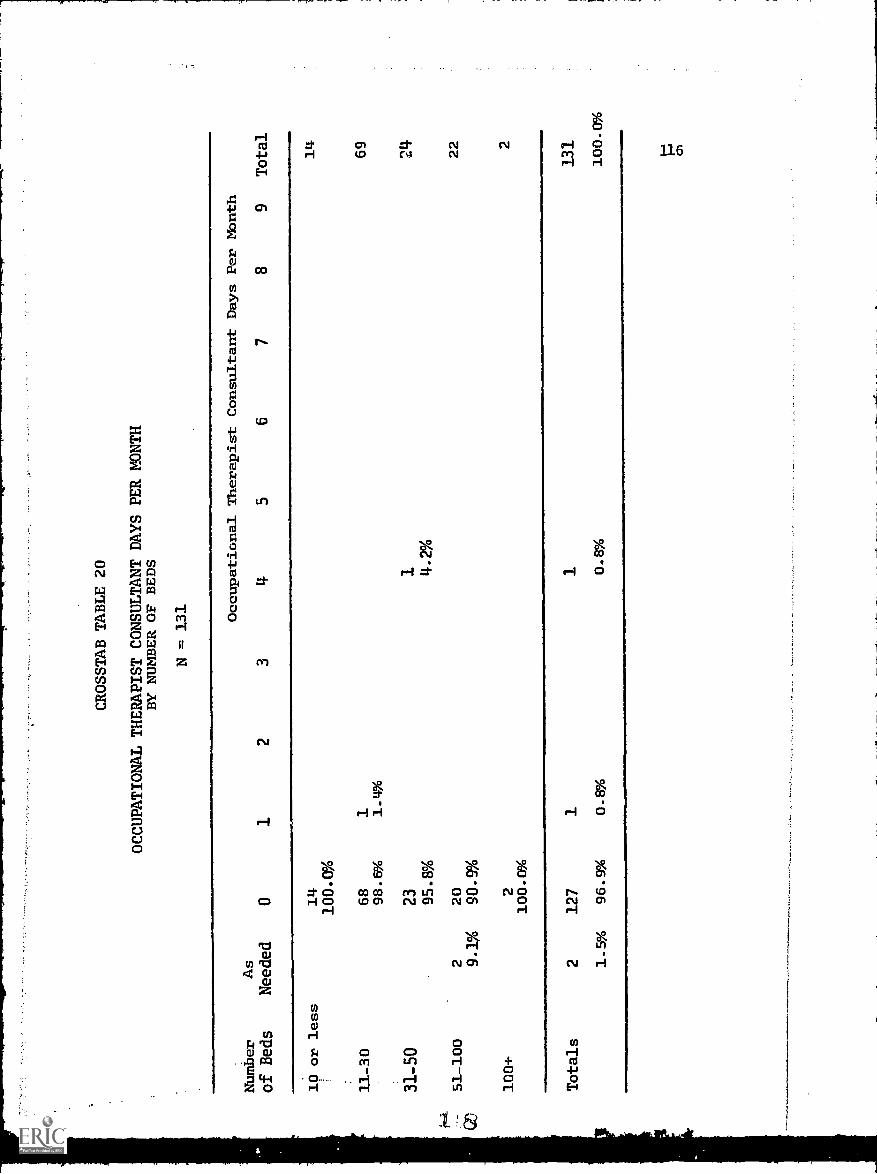
CROSSTAB TABLE 20
OCCUPATIONAL THERAPIST CONSULTANT DAYS PER MONTH
BY NUMBER OF BEDS
N = 131
Occupational Therapist Consultant Days Per Month
Number
As
of Beds
Needed
01
22
45
67
89
Total
10 or less
14
14
100.0%
11-30
68
169
31-50
23
124
95.8%
4.2%
51-100
220
22
9.1%
90.9%
100+
22
100.0'4
Totals
2127
11
131
1.5%
96.9%
0.8%
0.8%
100.0%

CROSSTAB TABLE 21
NUMBER OF FULL-TIME RECREATION & SOCIAL DIRECTORS
BY NUMBER OF BEDS
N = 131
NuMber of
Beds
01
2
Number of Full-Time Recreation & Social Directors
34
56
78
9Total
10 or less
13
114
92.9%
7 .1%
11-30
58
11
69
84.1%
15.9%
31-50
18
624
75.0%
25.0%
51-100
18
422
81.8%
18.2%
100+
11
2
50.0%
50.0%
Totals
107
23
1131
81.7%
17.6%
0.8%
loo.o%

Nuoiber of
Beds
0
CROSSTAB TABLE 22
NUMBER OY PART-TIME RECREATION & SOCIAL DIRECTORS
BY NUMBER OF BEDS
N = 131
12
34
10 or less
14
100.0%
11-30
39
28
11
56.5%
40.6%
1.4%
1.4%
31-50
10
14
41.7%
58.3%
51-100
11
92
50.0%
40.9%
9.1%
100+
11
50.0%
50.0%
Totals
75
52
31
57 .3%
39.7%
2.3%
0.8%
Number of Part-Time Recreation & Social Directors
56
78
9Total
14
69
24
22 2
131
100.0%
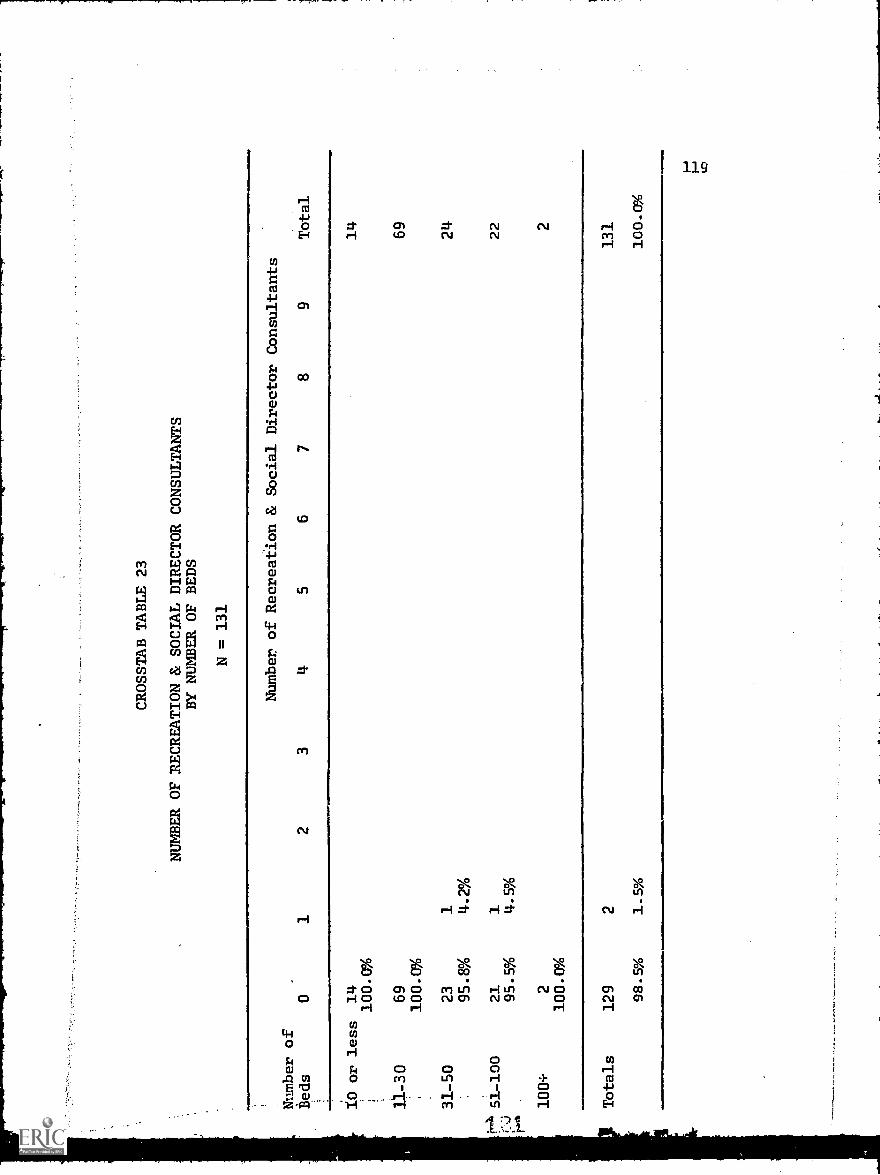
CROSSTAB TABLE 23
NUMBER OF RECREATION & SOCIAL DIRECTOR CONSULTANTS
BY NUMBER OF BEDS
N = 131
Number of
Beds
01
Number of Recreation & Social Director Consultants
23
45
67
8
or less
14
100.0%
11-30
69
100.0%
31-50
23
1
95.8%
4.2%
51-1
0021
195.5%
4.5%
isa4"
100+
2
100.0%
Totals
129
2
98.5
%1.
5%
9Total
14
69
24 22 2
131
100.0%

CROSSTAB TABLE 24
RECREATION & SOCIAL DIRECTOR CONSULTANT DAYS PER MONTH
BY NUMBER OF BEDS
N = 131
Recreation & Social Director Consultant Days Per Month
Number
As
of Beds
Needed
01
23
45
67
89
Other
Total
10 or less
14
100.0%
11-30
69
100.0%
31-50
23 95.0%
.*.st
51-100
121
4-9%
95.9%
100+
2
100.0%
69
124
2%6
22 2
PTotals
1129
0.8%
99-936
1131
0.0% 100.0%

CROSSTAB TABLE 25
NUMBER OF FULL-TIME DIETICIANS
BY NUMBER OF BEDS
N=131
Number of
Beds
0
Number of Full-Time Dieticians
12
34
56
78
9
10 or less
12
2
85.7%
14.3%
11-30
61
8
88.4%
11.e%
31-50
21
3
87.5%
12.5%
51-100
18
481.8%
18.2%
100+
2
100.0%
Totals
114
17
87.0%
13.0%
Total
14
69
24
22 2
131
loo.ag

CROSSTAB TABLE 26
NUMBER OF PART-TIME DIETICIANS
BY NUMBER OF BEDS
N = 131
Number of
Beds
Number of Part-Time Dieticians
o1
23
45
67
89
Total
114
7.1%
12
69
17.4%
224
8.3%
19
322
11
2
10 or less
13 92.9%
11-30
57 82.e%
31-50
22 91.7%
51-100
100+
86.4
%
50.0%
13.6
%
50.0%
Totals
112
19
85.5%
14.5%
131
100.0%

CROSSTAB TABLE 27
NUMBER OF DIETICIAN CONSULTANTS
BY NUMBER OF BEDS
N = 131
Number of
Beds
12
Number of Dietician Consultants
34
56
78
9Total
10 or less
14
14
100.0%
11-30
53
16
69
76.8%
23.2%
31-50
16
824
66.7%
33-3%
1.15I-100
913
22
.'.:%. )
40.9%
59.1%
; Cif100+
11
2
!
50.0%
50.0%
Totals
93
38
131
71.0%
29.0%
En-
0%
F-1
Lc)

CROSSTAB TABLE 28
DIETICIAN'CONSULTANT DAYS PER MONTH
BY NUMBER OF BEDS
N = 131
Number
As
of Beds
Daily Needed
0
10
or less
14
loo.a%
11-30
12
53
17.4%
76.8%
31-50
316
12.5%
66.7%
51-100
29
9.1%
40.9%
100+
11
50.0
%50
.0%
Totals
117
93
0.8%
18.0%
71.0%
Dietician Consultant Days Per Mbnth
12
34
56
78
9Other
Total
14
31
69
4.3%
1.4%
32
24
12.5%
8.3%
44
11
122
18.2%
18-2%
4.5%
4.5%
2
10
6.
21
1131
7.6%
4.6%
1.5%
0.8%
0.2%
10(1).0%

CROSSTAB TABLE 29
NUMBER OF FULL-TIME
IN-SERVICE EDUCATORS
BY NUMBER OF BEDS
N = 131
Number of
Beds
1
Number of Full-Time
In-Service Educators
23
45
67
89
Total
10 or less
14
100.0°A
14
11-30
65
469
94.2%
5 .8%
31-50
20
424
83 .3%
16.7%
sl-100
21
122
95.5%
Li. 5
%
100+
2
2100.0%
Totals
122
9131
6.9%
rr4

, A 6 P
CROSSTAB TABLE 30
NUMBER OF PhRT-TIME IN-SERVICE EDUCATORS
BY NUMBER OF BEDS
N =
131
Number of
Beds
01
Number of Part-Time In-Service Educators
23
45
67
89
Total
10 or less
14
14
100.0%
/1-30
43
26
69
62.3%
37.7
%
31-50
914
137.9%
58.3
%4.2%
51-100
10
111
4.5.5%
50.0%
4.8%
100+
11
250
.0%
50.0%
Tot
als
7752
213
1
58.8%
39.7%
1.5%
100.0%
;

- -
7
CROSSTAB TABLE 31
NUMBER OF 1N-SERVICE EDUCATOR CONSULTANTS
BY NUMBER OF BEDS
N = 131
Nuthber of In-Service Educator Consultants
Number of
Beds
01
23
45
67
89
Total
10 or less
14
100.0%
13-30
68
31-50
24
100.0%
51-100
22
100.0%
198.6%
1.4%
A100+
2100.0%
69
24
22 2
Totals
130
1
99.2%
0.8%
131
100.0%

.
CROSSTAB TABLE 32
IN-SERVICE EDUCATOR CONSULTANT DAYS PER MONTH
BY NUMBER OF BEDS
N = 331
Number
of Beds
01
2
In-Service Educator Consultant Days Per Month
34
56
78
9Total
10 or less
14
14
100.0%
11-30
68
169
98.6%
1.4%
31-50
24
24
100.0%
51-100
22
22
100.0%
100+
22
100.0%
Totals
130
1131
99.2%
0.8%
100.0%

CROSSTAB TABLE 33
NUMBER OF FULL-TIME PSYCHIATRISTS
BY NUMBER OF BEDS
N = 131
Number of Full-Time Psychiatrists
Number of
Beds
01
23
45
67
89
Total
r10 or. less
14
14
100.0%
11-30
69
69
100.0%
31-50
23
124
95.8%
4.2%
22
22
100.0%
2100.0%
2
Totals
130
1131
99 .2%
0.8%
100.0%..

CROSSTAB TABLE 34
NUMBER OF PART-TIME PSYCHIATRISTS
BY NUMBER OF BEDS
N = 131
Number of Part-Time Psychiatrists
Number of
Beds
01
23
45
67
89
Total
14
169
10 or less
14
100.0%
11-30
6898.5%
31-50
24
100.0%
22
100.0%
1004-
2
100.0%
1.4%
211
22 2
Totals
130
1131
99.2%
0.8%
100.0%

CROSSTAB TABLE 35
NU/4HBR OF PSYCHIATRIST CONSULTANTS
BY NUMBER OF BEDS
N = 131
Number of Psychiatrist Consultants
Number
of Beds
01
23
45
67
89
Total
10 or less
14
100.0%
11-30
31-50
51-100
r100+
Totals
66
21
95.7%
2.9%
1.4Y0
23
195. 8%
69
24
21
122
95.5%
4.5%
22
100.0%
126
41
131
96.2%
3.1%
0.8%
100.0%

CROSSTAB TABLE 36
PSYCHIATRIST CONSULTANT DAYS PER MONTH
BY NUMBER OF BEDS
N = 131
Number
of Beds
As
Needed
01
2
Psychiatrist Consultant Days Per Muth
34
56
78
9Total
10 or less
14
14
100.%
11-30
266
169
2.9%
95.7%
1.14%
31-50
123
24
4.2%
95-8
0%
51-100
121
22
4.5%
95.5%
100+
22
100.0%
Tot
als
412
61
131
3.1%
96.2%
0.8%
100.0%

CROSSTAB TABLE 37
VUMBER OF FULL-TIME PHYSICIANS
BY NUMBER OF BEDS
N = 131
Number
of Beds
01
23
5
Number of Pull-Time Physicians
67
'
10 or less
,11-30
31-50
14
100.0%
64
5
92.0
7.2%
22
291-7%
8.3%
19
3
86.436
13.6%
2
100.0%
Totals
121
10
92.4%
7.6%
89
Total
24
22 2
131
100.0%
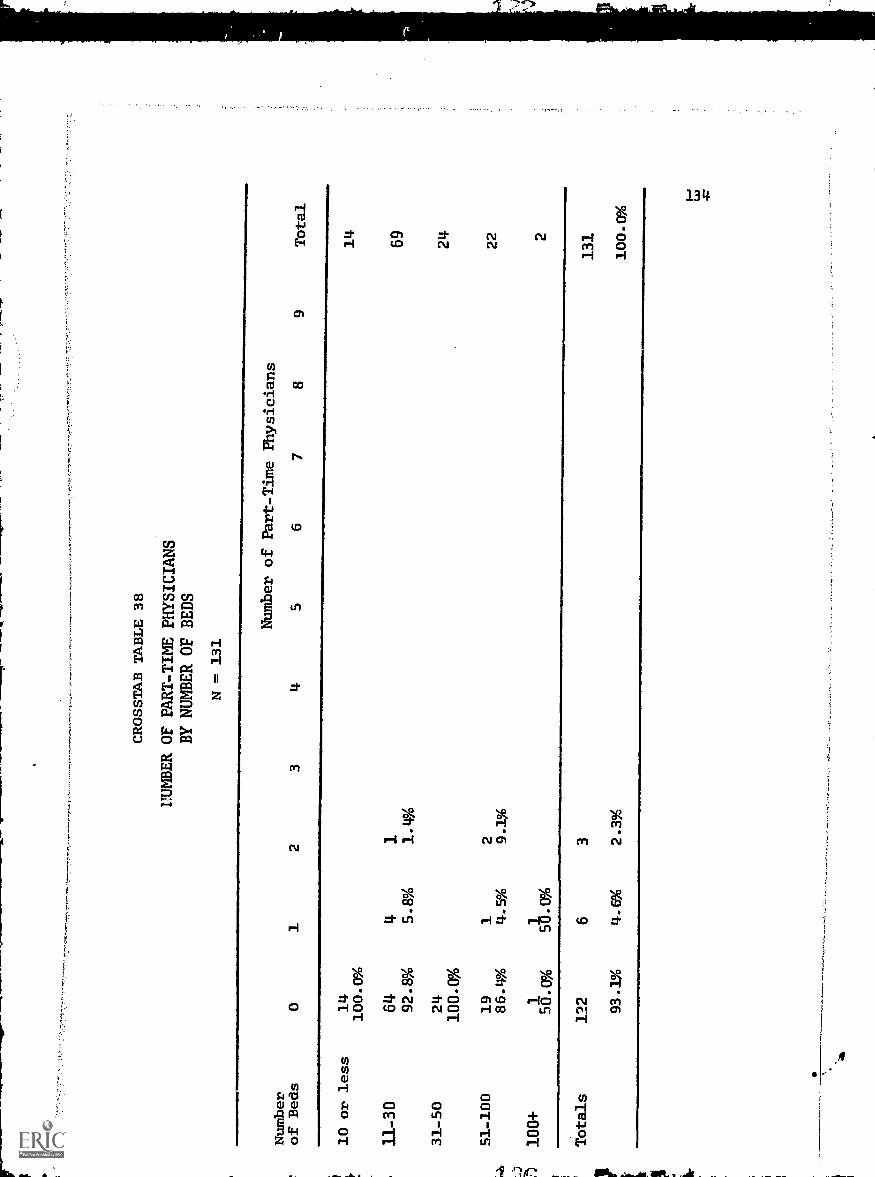
CROSSTAB TABLE 38
UUMBER OF PART-TIME PHYSICIANS
BY NUMBER OF BEDS
N = 131
Number
of Beds
Number of Part-Time Physicians
12
34
56
78
9Total
10 or less
14
100.0%
11-30
64
41
92.8%
5.8%
1.4%
31-50
24
100.0%
51-100
19
12
86.4%
4.5%
9.1%
100+
150.0%
51).0%
Totals
122
63
P93.1%
4.6%
2.3%
14
69
24
22 2
131
100.
0%

CROSSTAB TABLE 39
NUMBER OF PHYSICIAN CONSULTANTS
BY NUMBER OF BEDS
N = 131
".A !\.! )1 t hr
Number
of Beds
01
23
Number of Physician Consultants
45
67
89
Total
10 or less
11-30
31-50
51-100
100+
964.3%
4159.4%
1145.8%
940.9%
150.0%
428.01,
2130.4%
11
45.8%
10 45.5%
1 7.1%
2 2.9%
2 8.3%
1 4.5%
150.
W.
1 1.4%
1 4.9%
3 4.3%
1 4.5%
1 1.4%
14
69
24
22 2
Totals
1 54.2%
46
35.1%
7 5.3%
2 1.5%
3 2.3%
1 0.8%
1 0.8%
131
100.0%

CR
OSS
TA
B T
AB
LE
40
PHYSICIAN CONSULTANTS DAYS PER MONTH
BY
NU
MB
ER
OP
BE
DS
N = 131
Number
of Beds
Daily
01
23
Physician Consultant Days Per MOnth
45
67
89
Other
Total
10 or less
91
11
2114
64.3%
7.1%
7.3%
7.3%
11-30
41
L.
11
121
69
59.4%
5.8%
1.4%
1.4%
1.4%
30.4%
31-50
11
21
19
24
45.8
%8.
3%4.
2%4.
2%37
.5%
-. x51_1130
1 4.5%
940.9%
1 4-5%
1 4.5%
1 4.5%
922
! I10
0+150.0%
1 sox%
2
Totals
171
27
23
22
41
131
9-8%
54.2%
1.5%
5.3%
1.5%
2.3%
1.5%
1.5%
31.3%
100- 0%
C71

'
CROSSTAB TABLE 41
NUMBER OF FULL-TIME OTHER EMPLOYEES
HY NUMBER OF BEDS
N = 131
Number of Other Fdll-Time Employees
Number
of Beds
01
23
45
67
89
Total
10 or less
11-30
14
100.0%
57
82.6%
9
13.0%
1 1.4y0
2 2.9%
14-
69
31-50
21
21
24
Tawli
87.5%
8.3%
4.2%
A C451-100
18
11
11
22
81.8%
4.5%
4.5%
4.5%
4.5%
100+
11
250.0%
50. 0%
Totals
111
12
33
11
131
84.7%
9.2%
2.3%
2.3%
0.8%
0.8%
100.0%
_

CROSSTAB TABLE 42
NIMBI R OF :PTHER..PART- TIME EMPLOYEES
BY NUMBER OF BEDS
N = 131
Number of Other Part-Time Employees
Ntmber
of Beds
01
23
45
67
89
Total
10 or less
14
14
100.0%
11-30
67
269
97.1%
2.9%
-31-50
24
24
100.0%
t" 151-
100
20
11
22
90.9%
4.5%
4.5%
F100+
11
50.
50.0%
20%
Totals
125
31
11
131
95.4%
2.3%
0.8%
0.8%
0.8%
100.0%
LU
CO

'
CROSSTAB TABLE 43
NUMBER OF OTHER CONSULTANTS
BY NUMBER OF BEDS
N = 131
Number
Number of Other Consultants
of Beds
01
23
45
67
89
Total
10 or less
14
14
100.096
11-30
63
23
169
91.3%
2.9%
4.3%
1.4%
31-50
21
21
24
87.5%
8.3%
4.2%
F.4.51-100
14
21
31
122
63.6%
9.14
4.5%
13.6%
4.5%
4.5%
r
100+
11
2
50.0%
50.0%
Totals
113
74
33
1131
hr
86.3%
5.3%
3.1%
2.3%
2.3%
0.8%

CROSSTAB TABLE 44
OTHER CONSULTANT DAYS PER MONTH
BY NUMBER OF BEDS
N = 131
Number
of Beds
01
23
Other
Days Per Month
56
78
9Other
Total
10 or less
14
100.0%
11-30
63
191.3%
1.4%
31-50
21 87.%
51-100
14
163 . 6%
4.5%
100+
150.0%
1 4.2%
14
469
5.8%
224
8.3%
722
31.8%
2
Totals
113
2
86 .3%
1.5%
3 2.3%.
13
131
9.9% 100.0%
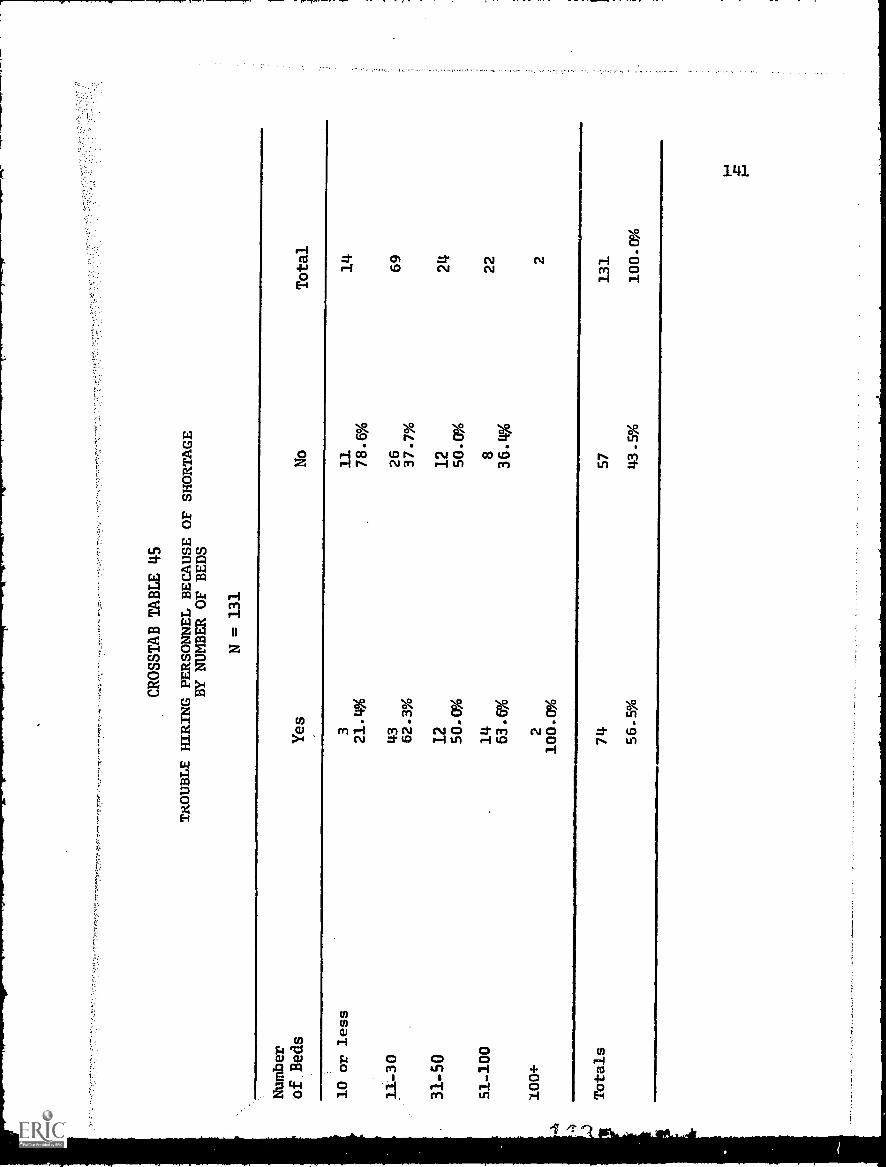
CROSSTAB TABLE 45
TROUBLE HIRING PERSONNEL BECAUSE OF SHORTAGE
BY NUMBER OF BEDS
N = 131
Number
of Beds
Yes
No
Total
10 or less
311
1421.4%
78.6%
11-30
43
26
69
62.3%
37.7%
31-50
12
12
24
SO.%
50.0
%
51-100
148
22
63.6%
36.4
%
100+
22
100.0%
Totals
74
57
131
56.5%
43.9%
100.0%

7
CROSSTAB TABLE 46
TROUBLE HIRING R.N.'s BECAUSE OF SHORTAGE
BY NUMBER OF BEDS
N = 131
Number
of Beds
Yes
No
Not Applicable
Total
10 or less
311
14
21.4
%78.6%
11-30
24
19
26
69
34.6%
27.5%
37.7%
31-50
48
12
24
16.7%
33.3%
50.0%
51-100
1359.1%
1 4.9%
3:.4%
22
twel 100+
W.N
11
S2
50.0%
0.0%
Totals
42
32
57
131
32.1%
24.4g
143.5%
100.0%

CROSSTAB TABLE 47
TROUBIE HIRING L.P.N.Is BECAUSE OF
SHORTAGE
BY NUMBER OF BEDS
N = 131
Number
of Beds
Yes
No
Not Applicable
Total
10 or less
1 7.1%
2
14.3%
11 78.6%
14
11-30
20
23
26
69
29.0%
33.3
%37
.7%
31-50
39
12
24
12.5%
37-5%
50.0A
51-100
86
822
000+
Total
36.4%
27.3%
36.4
%1
12
50.0%
50.0%
33
41
57
131
25.2
%31
.3%
43.5
%100.0%

CROSSTAB TABLE 48
TROUELE HIRING AIDES BECAUSE OF SHORTAGE
BY NUMBER OF BEDS
N = 131
Number
of Beds
10 or less
11-30
31-50
Yes 1 7.1%
2434,8%
6
25.0%
940.9%
Totals
No
Not Applicable
Total
211
14.3%
78.6%
19
26
27.5%
37.7%
612
25.0%
sox%
58
22.7
%36
. 49
6
14
69
24 22
2
100.0%
2
40
30.5%
34
26.0%
57 43.5%
131

CROSSTAB TABLE 49
TROUBLE HIRING PHYSICAL THERAPISTS BECAUSE OF SHORTAGE
BY NUMBER OF BEDS
N = 131
Number
of Beds
Yes
No
Not Applicable
Total
10 or less
311
14
21.4%
78.6%
11-30
439
26
69
5.8%
56.5%
37.7%
31-50
111
12
24
4.2%
45.8%
50.0%
51-100
311
822
134%
50.0%
100+
22
100.0%
Totals
866
57
131
6.1%
50.4%
43.9%
100.0%

CROSSTAB TABLE 50
TROUBLE HIRING OCCUPATIONAL THERAPISTS BECAUSE OF SHORTAGE
BY NUMBER OF BEDS
N = 131
Number
of Beds
Yes
No
Not Applicable
Total
10 or less
311
14
21.4%
78.6%
11-30
439
26
69
5.8%
56.5%
37.7%
31-50
39
12
24
12.9%
37.9%
50.0%
51-100
311
822
H.
13.6%
50.0%
36.4%
00
100+
22
100.0%
Totals
10
64
57
131
7.6%
48.9%
43.5%
100.0%

CROSSTAB TABLE 51
TROUBLE HIRING RECREATION & SOCIAL DIRECTORS BECAUSE OF SHORTAGE
BY NUMBER OF BEDS
N = 131
Number
of Beds
Yes
No
Not Applicable
Total
10 or less
311
14
21.4%
78.6%
11-30
142
26
69
1.4%
60.9%
37.7%
31-50
210
12
24
8.3%
41.7%
50.0%
51-100
113
822
59.1%
36.4%
100+
2
100.0%
2
Totals
4 3.1%
70 53.Wo
57 43.5%
131
100.0%

CROSSTAB TABLE 52
TROUBLE HIRING DIETICIANS BECAUSE OF SHORTAGE
BY NUMBER OF BEDS
N = 131
Number
of Beds
Yes
No
Not Applicable
Total
10 or less
11-30
3
3
21.4%
40
11
78.6%
26
14
69
4.3%
58.0%
37.7%
31-50
111
12
24
45.8%
so.og
.._
Ul o
51-100
3
13.6%
11 50.0%
8
36.4%
22
100+
22
100.0%
Totals
767
57
131
5.3%
51.1%
43.9%
100.0%

CROSSTAB TABLE 53
TROUBLE FIRING IN-SERVICE EDUCATORS BECAUSE OFSHORTAGE
BY NUMBER OF BEDS
N=
131
Number
of Beds
Yes
No
Not Applicable
Total
10 or less
3
21.4%
1178.6%
14
11-30
142
26
69
1.4%
60.9%
37.7%
31-50
12
12
24
50.0%
50.0%
51-100
113
822
Cfr
,..*
4.5%
59.1%
36.4%
100+
22
100.0%
Totals
272
57
131
1.5%
55.0%
43.5%
100.0%

Cf:
CROSSTAB TABLE 54
TROUBLE HIRING PSYCHIATRISTS BECAUSE OF
SHORTAGE
BY NUMBER OF BEDS
N = 131
Nuthber
of Beds
Yes
No
Not Applicable
Total
10 or less
311
14
21.'4%
78.6%
11-30
142
26
69
1.4%
60.9%
37.7%
31-50
12
12
24
50.0%
50.0%
51-100
212
822
36. 4%
100+
22
100.0%
Totals
371
57
131
2.3%
54.2%
43.5%
100.0%

cr;
CROSSTAB TABLE 55
TROUBLE HIRING PHYSICIANS BECAUSE OF SHORTAGE
BY NUMBER OF BEDS
N = 131
Number
of Beds
Yes
Not Applicable
Total
10 or less
311
14
21.4%
78.6%
11-30
241
26
69
2.9%
59.4%
37.7%
31-50
12
12
24
50.0%
50.0%
51-100
113
822
59.1%
36.4%
100+
22
100.0%
Totals
371
57
131
2.3%
54.2%
43.5%
100.0%

CROSSTAB TABLE 56
TROUBLE HILING OTHER PERSONNEL
BECAUSE OF SHORTAGE
BY NUMBER OF BEDS
N = 131
Number
of Beds
Yes
No
Not Applicable
Total
10 or less
12
11
14
7.1%
14.3%
78.6%
11-30
340
2 6
6 9
1.3%
58.0%
37.7%
31-50
210
12
24
8.3%
41.7%
50.0%
51-100
113
822
4.5%
59.1%
36.4%
100+
11
2
50.0%
50.0%
Totals
866
57
131
6.1%
50.4%
43.5%
100.0%

CROSSTAB TABLE 57
IN-SERVICE EDUCATION PROGRAM
BY NUMBER OF BEDS
N = 131
Number of
Beds
Yes
No
Total
10 or less
113
7.1%
92.9%
11-30
43
26
62.3%
37.7%
31-50
19
5
79.2%
20.8%
i--'
51-100
18
4Cri
81.8%
18.2%
100+
2
100.0%
14
69
24
22 2
Totals
83
48
131
63.4%
36.6%
100.0%

CROSSTAB TABLE 58
IN-SERVICE EDUCATION PROGRAM INCLUDING RN's
BY NUMBER OF BEDS
N = 131
Number
of Beds
Yes
No
Not Applicable
Total
10 or less
113
14
7 .1%
92.9%
11-30
as
17
26
69
37.7%
24.6%
37.7%
31-50
16
35
24
66.7%
12.5%
20.6%
t..,
!,
51-100
17
14
22
CI
77.3%
4.5%
18.2%
C;
100+
22
100.0%
Totals
61
22
48
131
46.6%
16.8%
36.6%
100.0%

CROSSTAB TABLE 59
IN-SERVICE.EDUCATION PROGRAM INCLUDING LPN's
BY NUMBER OF BEDS
N = 131
Number of
Beds
Yes
No
Not Applicable
Total
10 or less
113
14
7.1%
92.9%
11-30
29
13
27
69
42.0%
18.8%
39.1%
31-50
15
45
24
62.5g
16.7%
20.8%
51-100
16
24
22
72.7%
9.1%
18.2%
100+
22
100.0%
Totals
63
19
49
131
48.1%
14.5%
37.4%
100.0%

CROSSTAB TABLE 60
IN-SERVICE EDUCATION PROGRAM INCLUDING AIDES
BY NUMBER OF BEDS
N = 131
Number
of Beds
Yes
No
Not Applicable
Total
10 or less
113
14
7.1%
92.9%
11-30
42
126
69
60.9%
1.4%
37.7%
31-50
19
524
79.2%
20.8%
51-100
17
1I.
22
77.3%
4.5%
18.2%
100+
22
100.0%
Totals
81
248
131
61.8%
1.5%
36.5%
100.0%

;,,7
CROSSTAB TABLE 61
IN-SERVICE EDUC/TION PROGRAM INCLUDING PHYSICAL THERAPISTS
BY NUMBER OF BEDS
N = 131
Number
of Beds
Yes
No:
Not Applicable
Total
10 or less
1 7.1%
13 92.9%
14
11-30
537
27
69
7.2%
53.6%
39.1%
31-50
118
524
4.0%
75.0%
20.e%
51-100
710
522
31.8X
45.9%
22.7%
100+
22
100.0%
Totals
15
66
50
131
11.9%
50.4%
38.2%
100.0%

CROSSTAB TABLE 62
IN-SERVICE EDUCATION PROGRAM INCLUDING OCCUPATIONAL THERAPISTS
BY NUMBER OF BEDS
N = 131
Number
of Beds
Yes
No
Not Applicable
Total
10 or less
113
14
7.1%
11-30
240
27
69
2.9%
58.0%
39.1%
31-5
019
524
79.2%
20.8%
51-100
413
522
18.2%
59.1
%22
.7%
100+
11
2
50.0%
50.0%
Totals
774
50
131
5.3%
56.5%
38.2%
100.0%
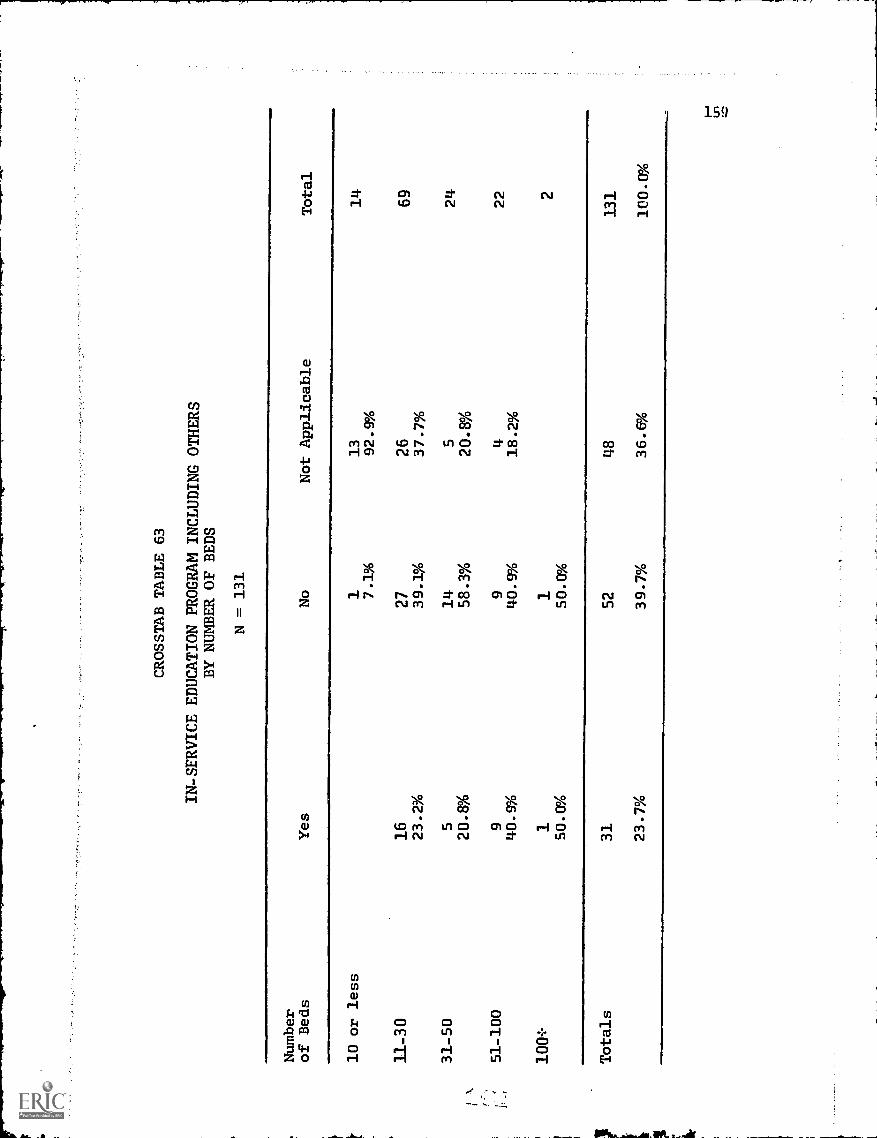
CROSSTAB TABLE 63
IN-SERVICE EDUCATION PROGRAM INCLUDING OTHERS
BY NUMBER OF BEDS
N =
131
Number
of Beds
Yes
No
Not Applicable
Total
10 or less
113
14
7.1%
92.9%
11-30
16
27
26
69
23.2%
39.1%
37.7%
31-50
514
524
20.8%
58.3%
20.8%
I\
Y51-100
99
422
100+
40.9%
40.9%
18.2%
11
2so.0g
50.0%
Totals
31
52
48
131
23.7%
39.7%
36.6%
100.0%

CROSSTAB TABLE 64
ONE EMPLOYEE RESPONSIBLE FOR STAFF EDUCATIONAL ACTIVITIES
IN THIS HOME
BY NUMBER OF BEDS
N =
131
Nuthber
of Beds
Yes
No
Other
No Information
Total
10 or less
11-30
642 58
84.1%
857.1%
9
13.o%
1 1.14%
1 1.11%
14
69
31-50
51-100
100+
22 91.7%
1986.4%
1
50.0%
2 8.3%
3 13.6
%
150.0%
24
22 2
Totals
106
80.9%
23
11
131
17.6%
0 .8%
0 . 8%
100 0%

CROSSTAB TABLE 65
ONE FULL-TIME EMPLOYEE RESPONSIBLEFOR STAFF EDUCATIONAL ACTIVITIES IN THIS HOME
BY NUMBER OF BEDS
N = 131
Number
of Beds
Yes
No
Not Applicable
Total
10 or less
42
814
28. e%
14.3%
57.1%
11-30
654
969
8.7%
78.3%
13.0%
31-50
418
224
16.7%
75.0%
8.3%
51-100
316
322
13.6%
72.7%
13.6%
100+
11
2
50.0%
50.0%
Totals
17
91
23
131
13.0%
69.5%
17.6%
100.0%

CROSSTAB TABLE 66
WOULD YOU LIKE A REPRESENTATIVE FROM MRMP TO VISIT YOUR FACILITY TO ASSIST IN DEVELOPING
AN IN-SERVICE EDUCATION PROGRAM?
BY NUMBER OF BEDS
N = 131
Number
of Beds
Yes
No
Don't Know
No Information
Total
10 or less
212
14
14.3%
85.7%
11-30
38
28
12
69
55.1%
40.6%
1.4%
2.9%
31-50
14
91
24
58.3%
37.5%
4.2%
51-100
10
11
122
45.9g
50.0%
4.5%
1004-
22
100.0%
Totals
66
60
14
131
50.4%
45.ES
0.8%
3.1%
100.0%

CROSSTAB TABLE 67
DO YOU OR MEMBERS OF YOURSTAFF ITTEND THE EDUCATIONAL PROGRAMS
CONDUCTED BY THE
STATE DEPARTMENT OF HEALTHAND WELFARE? BY NUMBER OF BEDS
N = 131
Number
of Beds
Yes
No
Total
10 or less
11-30
857.1V
59
85.5,
6 42.9
%
10
14 69
31-50
23
124
95.8%
4.2%
51-100
19
322
1004
.
86.4%
13.6%
2
100.0%
2
Totals
111
20
131
84.7%
15.3%
100.0%

CROSSTAB TABLE 68
REASON FOR NOT ATTENDING
BY NUMBER OF BEDS
N= 131
ANumber
Prog.not
of Beds relevant
to needs
Too
Far
Away
Time/
Person-
nel
Other
A&B
A&C
A&D
B&C
B&D
Not
Appli-
C&D
cable
Total
10 or less
21
11
914
14.34
7.1%
7.1%
7.1%
64.3%
11-30
23
51
58
69
2.9%
4.3%
7.2'4
1.4%
84.1%
31-50
24
24
100.0%
51-100
11
119
22
4.5%
4.5%
4.5%
86.4%
100+
2100.0%
2
Totals
2 1.5%
3 2.3%
8 6-1%
2 1.5%
2 1.5%
2 1.5%
112 85.5%
131
100.0%

CROSSTAB TABLE 69
WOULD YOU SEND MEMBERS OF YOUR STAFF TO FORMAL
EDUCATIONAL PROGRAMS IN THEIR SPECIALTIES
AT PORTLAND?
BY NUMBER OF BEDS
N = 131
Number
of Beds
Yes
No
Not Applicable
No Information
Total
10 or less
428.6%
5
35.7%
5
35.7%
14
11-30
22
39
869
31.9%
56.5%
11.0%
31-50
716
124
29-2%
66-7%
4.2%
51-100
11
10
122
50.0%
45.5%
4.g%
100+
22
Total
46
70
14
1131
35.1%
53.4%
10.7%
0.8%
100.0%

CROSSTAB TABLE 70
WOULD YOU SEND MEMBERS OF YOUR TAFF TO FORMAL EDUCATIONAL PROGRAMS IN THEIR SPECIALTIES
AT LEWISTON-AUBURN?
BY NUMBER OF BEDS
N = 131
Number
of Beds
Yes
No
Not Applicable
No Information
Total
10 or less
45
514
28.6%
35.7%
35.7%
11-30
29
32
869
42.0%
46.4%
11.6%
6-
31-50
15
81
24
CP
62.5%
33.3%
4.2%
51-100
13
81
22
59.1%
36.4%
4.504
100+
22
100.0%
Totals
63
53
14
1131
48.1%
40.5%
10.7%
0.8%
100.0%

CROSSTAB TABLE 71
WOULD YOU SEND MEMBERS OF YOUR STAFF TO FORMAL EDUCATIONAL PROGRAMS IN THEIR SPECIALTIES
AT WATERVILLE-AUGUSTA?
BY NUMBER OF BEDS
N = 131
Number
of Beds
Yes
No
Not Applicable
No Information
Total
10 o
r le
ss2 14.3
%7
50 . 0%
5
35.7
%14
11-30
29
32
869
42.0%
46.4%
11.8%
31-50
13
10
124
54.2%
41 .7%
4.2%
.1, 5
1-10
015
61
2268.2%
27.3
%4.9%
.1.:
c.4
100+
11
250.0%
50.0%
Totals
60
56
14
1131
45.8
%42
.7%
10.7
%0.
8%10
0.0%

CROSSTAB TABLE 72
WOULD YOU SEND MEMBERS OF YOUR STAFF TO FORMAL EDUCATIONALPROGRAMS IN THEIR SPECIALTIES
AT BANGOR?
BY NUMBER OF BEDS
N =
131
Number
of Beds
Yes
No
Not Applicable
No Information
Total
10 or less
9S
14
614.3%
357%
11-30
25
36
869
36.2%
52.2%
11.6%
,,--z
31-50
10
13
124
P141.7%
54.2%
4.2%
51-100
12
91
22
54.5%
40.9%
4.5%
100+
11
250.0%
50.0%
Totals
48
68
14
1131
36.0%
51.9%
10.7%
0.8%
100.0%

CROSSTAB TABLE 73
WOULD YOU SEND MEMBERS OF YOUR STAFF TO FORMAL EDUCATIONAL PROGRAMS IN THEIR SPECIALTIES
AT CARIBOU-PRESQUE ISLE?
BY NUMBER OF BEDS
N131
Number
of Beds
Yes
No
Not Applicable
No Information
Total
10 or less
36
514
21. 4%
42.9%
35.7%
11-30
556
869
7 .2%
81 .2%
11.6%
31-50
221
124
8.3%
87 . S%
4.2%
51-100
-;
V-I
3
13.6%
18 81.8%
1 4.5%
22
100+
22
100.0%
Totals
13
103
14
1131
9.9%
78.6%
10.7%
0.8%
100.0%

CROSSIAB TABLE 74
WOULD YOU SEND MEMBERS OF YOUR STAFF TO FORMAL EDUCATIONAL PROGRAMS IN THEIRSPECIALTIES
AT ANY OTHER LOCATION?
BY NUMBER OF BEDS
N = 131
Number
of Beds
Yes
No
Not Applicable
No Information
Total
10 or less
11-30
4 5.8%
9
64.3%
57 82.e%
5
35.7%
811.6%
14
69
31-50
51-100
100+
2 8.3%
418.24
21
87.5%
17
77.3%
2100.0%
1 4.2%
1 4.5K7
24
22 2
Totals
10 7.6%
106 80.9%
14
10.7%
1 0.8%
131
100.0%

CROSSTAB TABLE 75
WOULD NOT SEND PERSONNEL TO SUCH A MEETING
BY NUMBER OF BEDS
N = 131
Number
of Beds
Yes
No
Not Applicable
No Information
Total
10 or less
68
14
42.9%
57.1%
11-30
10
58
169
14.5
84.1%
1.4%
31-50
123
24
4.2%
95.1%
51-100
21
122
100+
22
100.0%
Totals
17
112
11
131
13.0%
85.5%
0.8%
0.8%
100.0%

CROSSTAB TABLE 76
ARE YOU OR MEMBERS OF YOUR STAFF ABLE TO ATTEND MEETINGS, WHICH ARE HELD OUT OF STATE, TO
LEARN OF NEW PRACTICES IN CARING FOR NURSING HOME PATIENTS?
BY NUMBER OF BEDS
N = 131
NuMber
of Beds
Yes
No
Total
10 or less
311
21.4%
78.6%
14-
11-30
23 33.3%
46 66.7%
69
31-50
915
24
37.5%
62.5%
51-100
13
922
59.1%
40.9%
100+
22
100.0%
Totals
50
38.2%
61.8%
10
0 C
rA

CROSSTAB TABLE 77
REASONS WHY NOT ABLE TO ATTEND MEETINGS WHICH ARE HELD OUT OF STATE, TO LEkRN OF NEW PRACTICES
IN CARING FOR NURSING HOME PATIENTS.
BY NUMBER OF BEDS
N = 131
AB
CD
EF
GH
IJ
KL
/lumber
Too Ex- Too
Time/
No Prog.
Not
3 or
of Beds
pensive Far
Personnel Avail. Al:B
A&C
ASe0
BeeC
B&D
C&D
Applio. More
Other
Total
10 or less
1 7 .1%
642 . 9'%
214.3%
214.3%
321 . 4%
14
11-30
11
21
23
10
15
123
169
1. WA
1. 4%
30. 4g
2 . 9g
4.3%
14.5%
1. 4%
7 .2%
1 . kg
33 .3%
1 . 4%
31-50
61
13
111
124
25.0%
4.2%
4.2%
12.5%
4.2%
45.8%
4.2%
51-100
52
113
122
22.7%
9.1%
59.1%
4.9%
100+
22
1100. 0%
Totals
21
38
54
15
18
11
52
21
131
1.5%
0.8%
29.0%
3.8%
3.1%
11.5%
0.8%
6.1%
0.8%
0.8%
39.7%
1.9%
0.8%100.0%

CROSSTAB TABLE 78
IS A TREATMENT ORDER PLAN DEVELOPED FOR EACH PATIENT IN THIS NURSING HOME?
BY NUMBER OF BEDS
N =
131
Number of
Beds
Yes
No
Total
10 or less
12
214
85-7
%14
-3%
11-30
68
169
38.6%
1.4g
31-50
24
24
130.0%
51-100
21
122
95.5%
4.5'4
100+
22
...1
100.U%
,
(.1')
?Totals
127
4131
96.9%
3.1%
100.0%

CROSSTAB TABLE 79
IF YES, ARE THESE PLANS REVIEWED AS PART OF EDUCATIONAL SESSIONS FOR THE STAFF?
BY NUMBER OF BEDS
N = 131
Number
of Beds
Yes
No
Not'Applicable
Total
10 or less
66
214
42.9%
14.3%
11-30
51
17
169
73.9%
24.6%
1.4%
31-50
19
524
79.2
20.9%
51-100
18 81.8%
3
13.6%
1 4.5%
22
100+
22
100.0%
Totals
96
31
4131
73.3%
23.7%
3'.1%
100.0%0

CROSSTAB TABLE 80
DO YOU HAVE A UTILIZATION REVIEW PROCEDURE IN THIS HOME?
BY NUMBER OF BEDS
N = 131
Number
of Beds
Yes
No
Other
Total
10 or less
11-30
1 7.1%
31
12
185.7%
7.1%
38
14
69
44.9%
55.1%
31-50
11
13
24
45.8%
51-100
13
922
59.1%
100+
11
2!
50-n%
50.0%
QO
FTotals
57
73
1131
i' k
43.5%
55.7%
0.8%
100.0%
! 111-

CROSSTAB TABLE
DOES THE ADMINISTRATOR PARTICIPATE IN THE REVIEW?
BY NUMBER OF BEDS
N =
131
Namber
of Beds
Yes
No
Not Applicable
Total
10 or less
1 7.1%
13 92.9%
14
11-30
25
638
69
36.2%
8.7%
55.1%
31-50
74
13
24
29.2%
16.7%
54.2%
51-100
84
10
22
36.4%
18.2%
45.9%
100+
11
2
h'
50.0%
50.0%
Totals
42
14
75
131
32.13
10.7%
57.3%
100.0%

CROSSTAB TABLE 82
DOES THE HEAD NURSE PARTICIPATE IN THE REVIEW?
BY NUMBER OF BEDS
N = 131
Number
of Beds
Yes
No
Not Applicable
Total
10 or less
113
14
7.1%
92.9%
11-30
26
538
69
37.7%
7.2%
55.1%
31-50
10
113
24
54.2°4
F,151-100
CYs
10 45.9%
2 9.1%
10
22
cw100+
11
250.0%
50.0%
Totals
48
875
131
36.6%
6.1%
57.3%
100.0%
F-1
CO

CROSSTAB TABLE 83
DO THE RN's AND LPN's PARTICIPATE IN THE REVIEW?
BY NUMBER OF BEDS
N = 131
Number
of Beds
Yes
No
Not Applicable
Total
10 or less
113
14
7.1%
92.9%
11-30
11
20
38
69
15.9%
29.0%
55.1%
31-50
65
13
24
25.0%
20.8%
54.2%
51-100
39
10
22
13.6%
40.9%
45.9%
100+
150.0%
.500%
2
Totals
22
34
75
131
16.8%
26.0%
57.3%
100.0%

CROSSTAB TABLE 84
LJ THE AIDES PARTICIPATE IN THEREVIEW?
BY NUMBER OF BEDS
N = 131
Number
of Beds
Yes
No
Not Applicable
Total
10 or less
11-30
31-50
51-100
F .-
i.100+
1 7.1%
11
15.95
1 4.25
20 29.0%
104-1.7%
1254.5%
150.0%
13 92.9%
3855.1%
13 54.2%
10 150.0%
14
69
24
22 2
Totals
13
43
75
131
9.9%
32.8%
57.3%
100.0%

CROSSTAB TABLE 85
DO THE PHYSICAL THERAPISTS AND OCCUPATIONAL THERAPISTS PARTICIPATE IN THE REVIEW?
BY NUMBER OF BEDS
N = 131
frA
Number
of Beds
Yes
No
Not Applicable
Total
10 or less
113
14
7.1%
92.9%
11-30
31
38
69
44.9%
55.1%
31-50
11
13
2L
i
45.8%
54.2%
51-100
39
10
22
13.6%
40.9%
45.5%
-
11
2
50.0%
50.0%
Totals
452
75
131
3.1%
39.7%
57.3%
100.0%
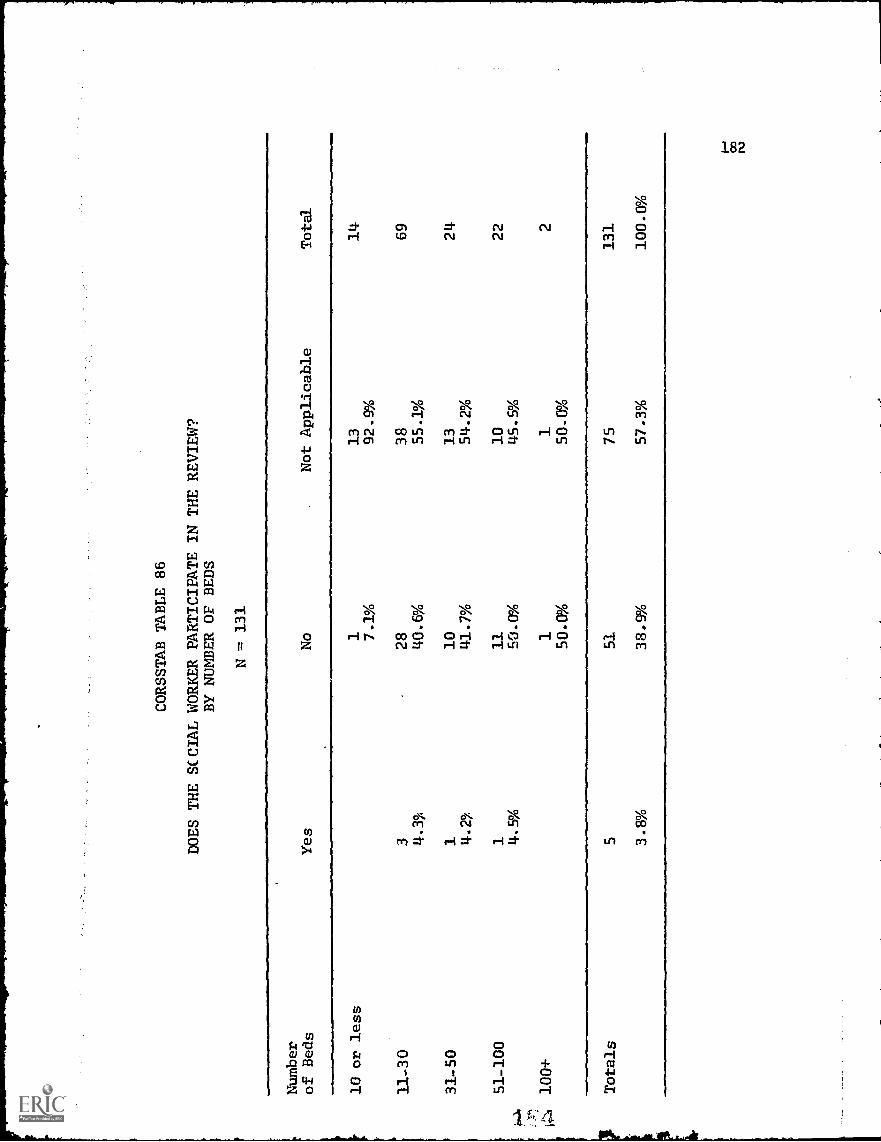
CORSSTAB TABLE 86
DOES THE SCCIAL WORKER PARTICIPATE IN THE REVIEW?
BY NUMBER OF BEDS
N = 131
Number
of Beds
Yes
No
Not Applicable
Total
10 or less
113
14
7.1%
92.9%
11-30
328
38
69
4.3$
40.6%
55.1%
31-50
110
13
24
41.7%
54.2%
51-100
111
10
22
4.9%
50.0%
45.9%
100+
11
2
50.0%
50.0%
Totals
551
75
131
3.8%
38.9%
57.3%
100.0%

CROSSTAB TABLE 87
DOES THE PHYSICIAN(S) PARTICIPATE IN THE REVIEW?
BY NUMBER OF BEDS
N = 131
Number
of Beds
Yes
No
Not Applicable
Total
10 or less
113
14
7.1%
92.9%
11-30
922
38
69
13.0)
31.9%
55.1g,
31-50
38
13
24
12.59
33.3%
54.2%
51-100
100+
84
10
22
36.4%
18.2%
11
2
50.0%
50.0%
Totals
21'
35
75
131
16.0%
26.7%
57.3%
100.0%
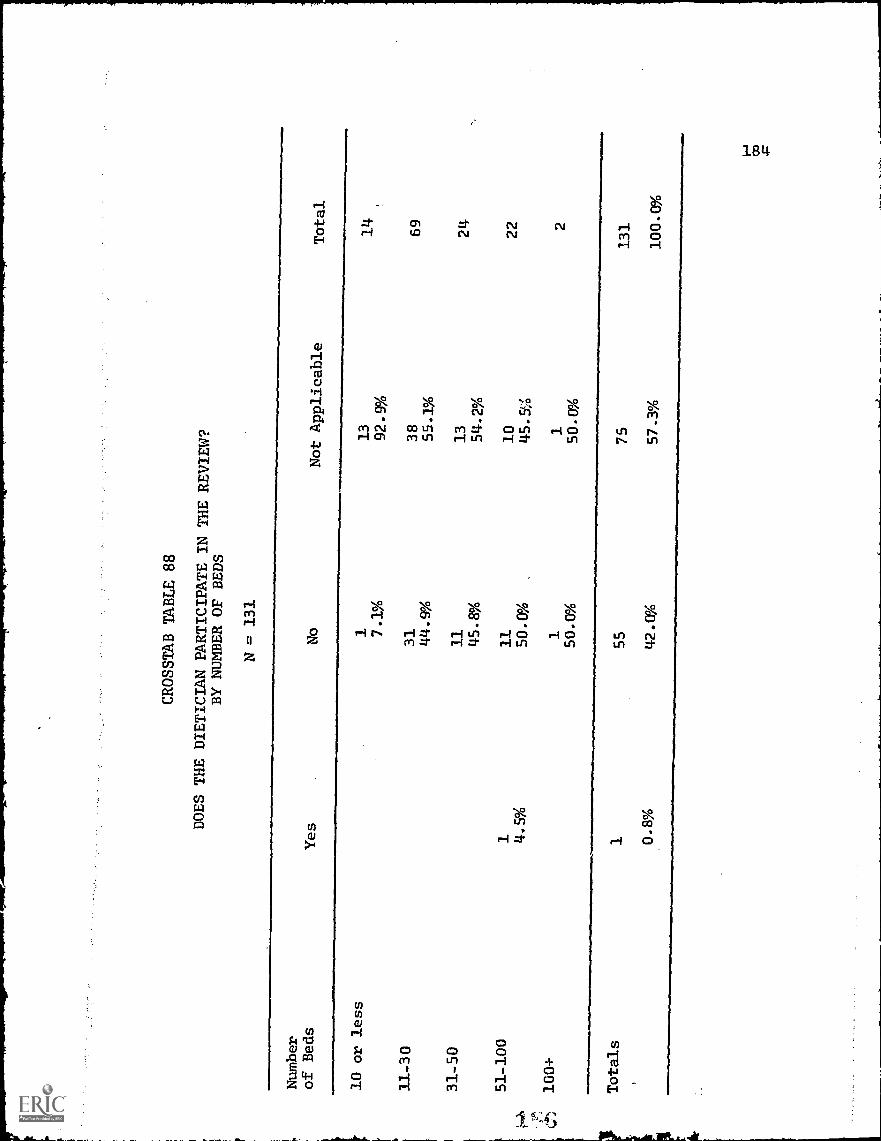
CROSSTAB TABLE 88
DOES THE DIETICIAN PARTICIPATE IN
THE REVIEW?
BY NUMBER OF BEDS
N = 131
Number
of Beds
Yes
No
Not Applicable
Total
10 or less
113
14
7 .1
%92.9%
11-30
31
38
69
44.9%
55.1%
31-50
11
13
24
45.8%
54.2%
51-100
111
10
22
..'A
4.5%
50.0%
45.5%
zA
100+
11
250.0%
Totals
155
75
131
0.8%
42.
CPA
57.3%
100.0%

CROSSTAB TABLE 89
DO OTHER EMPLOYEES PARTICIPATE IN THE REVIEW?
BY NUMBER OF BEDS
N = 131
Number
of Beds
Yes
No
Not Applicable
Total
10 or less
1314
7:1%
92.9
%
11-30
229
3869
2.9'
342
.0%
55.1
%
31-50
110
1324
4.29
41.7%
54.2
%
51-100
710
22
22.7%
31.8%
45.5
%
100+
1 50.0
%1 50
.0%
2
Totals
848
75
131
6.1%
36.6%
57.3%
100.0X

CROSSTAB TABLE 90
ARE THE RESULTS OF THE REVIEW USED FOR EDUCATIONAL PURPOSES WITH THE ENTIRE STAFF?
BY NUMBER OF BEDS
N = 131
Number
of Beds
Yes
No
Not Applicable
No Information
Total
10 or less
13
-9
114
7.1%
21.4%
64.3%
7.1%
11-30
19
16
32
269
27.5%
23.2%
46.4%
2.9%
31-50
96
924
37.5%
25.0%
37.5%
51-100
67
922
27.3%
31.8%
-a.
-.a
-
11
250.0%
50.0%
Totals
35
33
60
3131
26.7%
25.2%
45.0%
2.3%
100.0%

4..1
;
CROSSTAB TABLE 91
DO YOU HAVE PROCEDURE MANUALS FOR EACH CATEGORY OF PERSONNEL
ON YOUR STAFF?
BY NUMBER OF BEDS
N=
131
Number
of Beds
Yes
No
Tote/
10 or less
11-30
535.7%
143
62.3%
964-.3%
26
37.7%
14 69
31-S0
15
924
62.5%
37.3%
51-100
19
322
86.11%
13.6
Yo
22
100.0%
Totals
84
47
131
64.1%
35.9%
100.0%

CROSSTAB TABLE 92
DO YOU FEEL THAT PROCEDURE MANUALS CAN (COULD) BE VERY HELPFUL IN ORIENTING THE NEW
EMPLOYEE TO THE STANDARD PRACTICES IN YOUR NURSING.HOME?
BY NUMBER OF BEDS
N= 131
Number
of Beds
Yes
Np
No Information
Total
10 or less
11-30
31-50
ae
51-100
100+
857.1%
54
78.3%
2187.5%
19 86.4%
2
100.0%
642.9%
14
20.3%
3
12.5%
3 13-6
%
14
169
24
22 2
Totals
104
26
1131
79.4%
19.8%
0.8%
100.0%

CROSSTAB TABLE 93
IS EACH PATIENT IN THIS HOME UNDER THE CARE OF A PRIVATE
PHYSICIAN?
BY
NU
MB
EROr BEDS
N = 131
NuLaber
of Beds
Yes
No
Total
10 or less
14
100.0%
14
11-30
68
169
98.6%
1.4%
31-50
23
124
95.0%
4.2g
.A51-100
103
2286.14%
13.6
%VA100-1-
2
Totals
126
96.2%
5131
3.8%
100.0%

CROSSTAB TABLE 94
IF NO, DOES THE
HOME HAVE A STAFF
PHYSICIAN WHO CARES FOR
TffE PATIENTS WITHOUTA PRIVATE PHYSICIAN?
BY NUMBER OF BEDS
N = 131
Number
of Beds
Yes
No
Not Applicable
Total
10 or less
14
100.0%
14
11-30
267
69
2.9%
97.1%
31-50
123
24
4.2%
95.8%
51-100
319
22
13.6%
86.4%
100+
22
100.0%
Totals
6125
131
4.6%
95.4%
100.0%

CROSSTAB TABLE 95
APPROXIMATELY HOW MANY TIMES IN THE PAST YEAR HAVE YOU HAD DIFFICULTY SECURING THE SERVICES
OF A PHYSICIAN FOR AN EMERGENCY SITUATION?
BY NUMBER OF BEDS
N = 131
Number
of Beds
01-5
Number of Times
6-10
11-20
More than 20
No Info
Total
10 or less
11-30
31-50
1285-7%
5884.1%
20
83.3%
2
14.3,)
10
14.59
4
18.7%
1
14 69
24
51-100
18
422
81.0
18.2%
1004-
11
250.0%
50.0%
Totals
109
20
2131
83.2%
15.3%
1.5%
100.ag

CROSSTAB TABLE 96
HOW OFTEN, ON THE AVERAGE, ARE THE PATIENTS EXAMINED BY A PHYSICIAN?
BY NUMBER OF BEDS
N = 131
Number
of Beds
Monthly
Ev. 2 Mo.
Ev. 4 Mo.
Number of Times
Ev. 6 Mb.
Yearly
Never
Other
No
Info. Total
10 or less
11-30
7
50.0%
1927.5%
1 7.1%
21
30.4X
;'
14.3%
11 1.9%
1 1.14P4
1 1.4%
1 1.4,4
U.
28.6%
15
21.7%
14
69
31-50
9
37.5%
6
25.0%
2 0.3%
1 4.2%
6
25.0%
2 4
51-100
13
36
22
-.
59.1%
13.0%
27.3%
)'-
'
loo+
11
2
1
50.0%
50.0%
Totals
48
31
15
22
132
131
36.6%
23.7%
11.5%
1.5%
0.8%
24.4%
100.0%
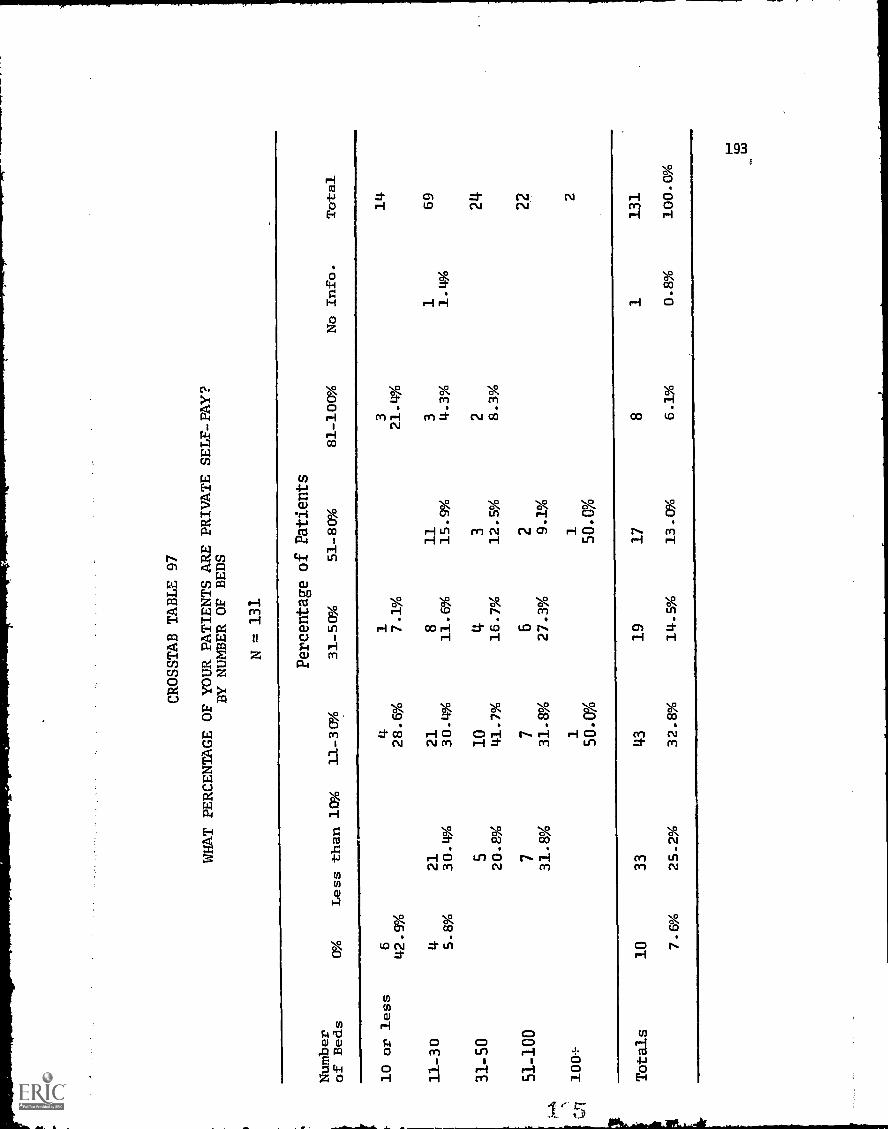
CROSSTAB TABLE 97
WHAT PERCENTAGE OF YOUR PATIENTS ARE PRIVATE SELF-PAY?
BY NUMBER OF BEDS
N = 131
Number
of Beds
0%
Less than 10%
11-30%
Percentage of Patients
31-50%
51-80%
81-100%
No Info.
Total
10 or less
11-30
642.9%
4 5.8%
2130.4%
428.e%
2130.9%
1 7.1%
811.6%
1115.9%
321.9%
3 4.3%
1 1.4%
14
69
31-50
51-100
100F.
5
20.8%
7
31.8%
10 41.7%
7
31.8%
150.0%
416.7%
6
27.3%
312.5%
2 9.1%
I50.0%
2 8.3%
24
22 2
Totals
10 7.6%
33 25.2%
43
32.8%
19
14.5%
17
13.0%
8 6.1%
1 0.8%
131
100.0%

CROSSTAB TABLE 98
WHAT ARRANGEMENTS DO YOU HAVE FOR DENTAL CARE IN THIS HOME?
BY NUMBER Or BEDS
N = 131
Number
Type of Arrangement
of Beds
Visited by Own
Dentist on Staff
Emergency Basis
Other
Total
10 or less
41
914
28.6%
7.1%
64.3%
11-30
10
1U.
47
69
14.5%
1.4%
15.9%
68.1%
31-50
56
13
24
20.8%
25.0%
54.2%
51-100
51
97
22
22.7%
4.5%
40.9%
31.8%
100J,
2100.0%
2
Totals
24
326
78
131
18.3%
2.3%
19.8%
59.5%
100.0%
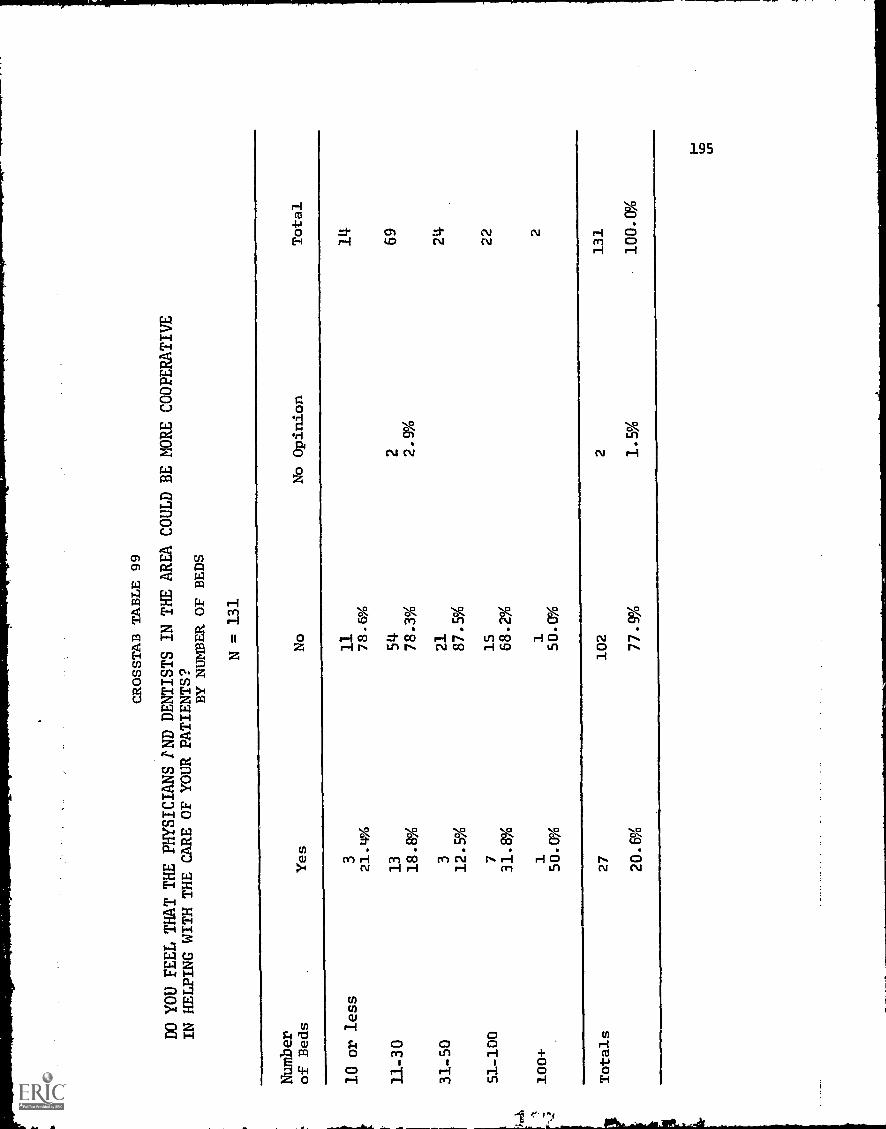
CROSSTAB TABLE 99
DO YOU FEEL THAT THE PHYSICIANS PND
DENTISTS IN THE AREA COULD BE MORE COOPERATIVE
IN HELPING WITH THE CARE OF YOUR PATIENTS?
BY NUMBER OF BEDS
N = 131
Number
of Beds
Yes
No
No Opinion
Total
10 or less
311
14
21.4%
78.e%
11-30
13
54
269
18.9%
78.3%
2.9%
31-50
321
24
12.9%
87.9%
51-100
715
22
31.8%
68.2%
100+
11
2
50.0%
50.0%
Totals
27
102
2131
20.6%
77.9%
1.9%
100.0%

r It
CROSSTAB TABLE 100
DOES A PHYSICIAN PARTICIPATE IN YOUR STAFF CONFERENCES?
BY NUMBER OF BEDS
N = 131
Number
of Beds
Always
Sometimes
Never
Other
Total
10 or less
1 7.1%
13 92.9%
14
11-30
618
44
169
8.7%
26.1%
63.8%
1.4%
31-50
48
12
24
16.7%
33.3%
50.0%
..),51-100
6
27.3%
s
36.4%
8
36.4%
22
C100-1-
22
100.0%
Totals
16
37
77
1131
f I12.2%
28.2%
58.8%
0.8%
100.0%
I hr
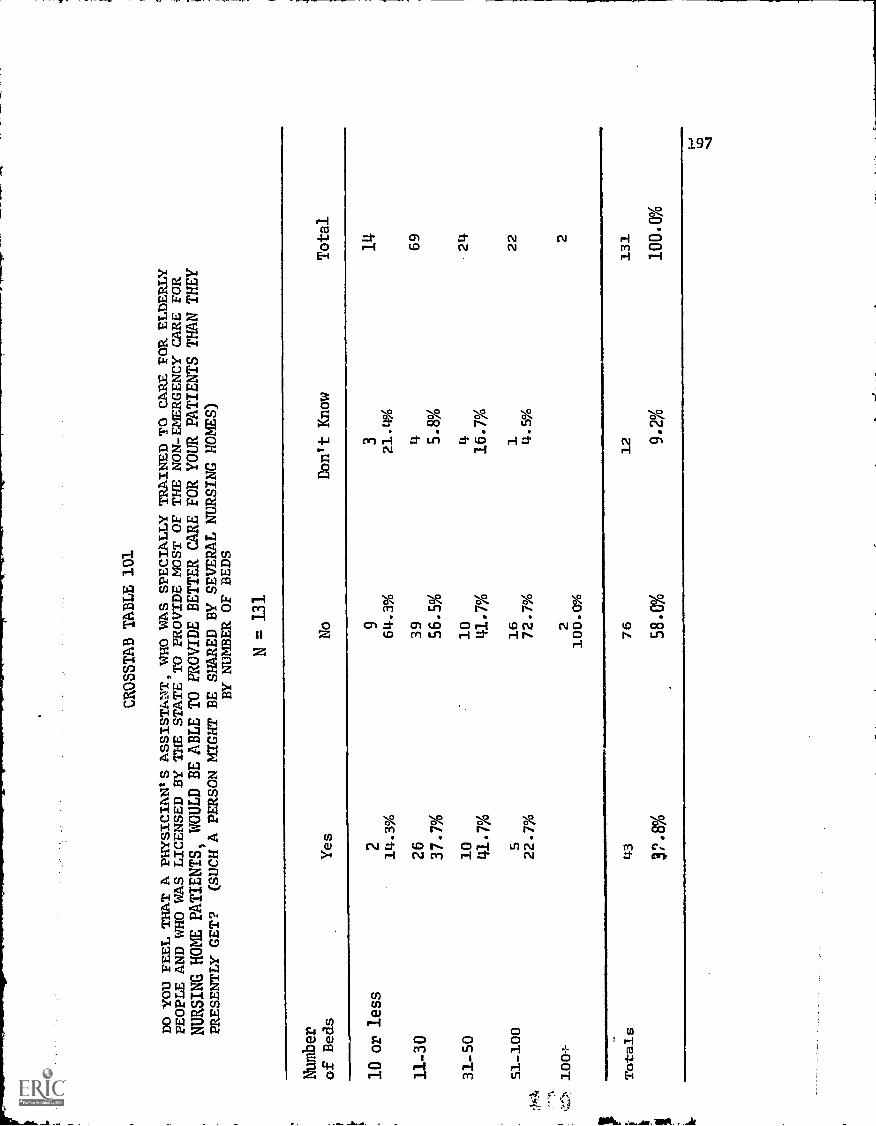
CROSSTAB TABLE 101
DO YOU FEEL THAT A PHYSICIAN'S ASSISTANT, WHO WAS SPECIALLY TRAINED TO CNRE FOR ELDERLY
PEOPLE AND WHO WAS LICENSED BY THE STATE TO PROVIDE MOST OF THE NON-EMERGENCY CARE FOR
NURSING HOME PATIENTS, WOULD BE ABLE TO
PROVIDE BETTER CARE FOR YOUR PATIENTS THAN THEY
PRESENTLY
GE
T?
(SU
CH
A P
ER
SON
MIG
HT
BE
SH
AR
ED
BY
SE
VE
RA
L N
UR
SIN
G H
OM
ES)
HY NUMBER OF BEDS
N =
131
Num
ber
of Beds
Yes
No
Don't Know
Total
10 or less
2
14 .3%
9
64.3%
3
21 . 4%
14
11-3
026
39L
.69
37.7%
56.5%
5.8%
31-5
010
10
L.
2441.7%
41.7%
16.7%
51-100
516
122
1°4
22.7
%72
.7%
4.50
4,
>loo+
22
100.0%
Totals
43
76
12
131
poo
5800
9.2%
lochoyo

CROSSTAB TABLE 102
WOULD YOU SEND ONE OF YOURNURSES TO A TRAINING COURSE TO BECOME
A GERIATRIC CARE SPECIALIST
IF SUCH A COURSE WEREAVAILABLE ET THE NEAREST REGIONAL MEDICALCENTER?
5Y NUMBER OF BEDS
N = 131
Number
of Beds
Yes
No
Don't Know
Total
10 or less
11-30
28.6%
47 68.1%
9
64.3%
16 23.2%
1 7.1%
6 8.7%
14
69
31-50
1770.8%
416.7%
312.5%
24
51-100
14L.
422
63.6%
18.2%
18.2%
22
100.0%
Totals
8 4
33
14
131
64.1%
25.2%
10.7%
100.0%
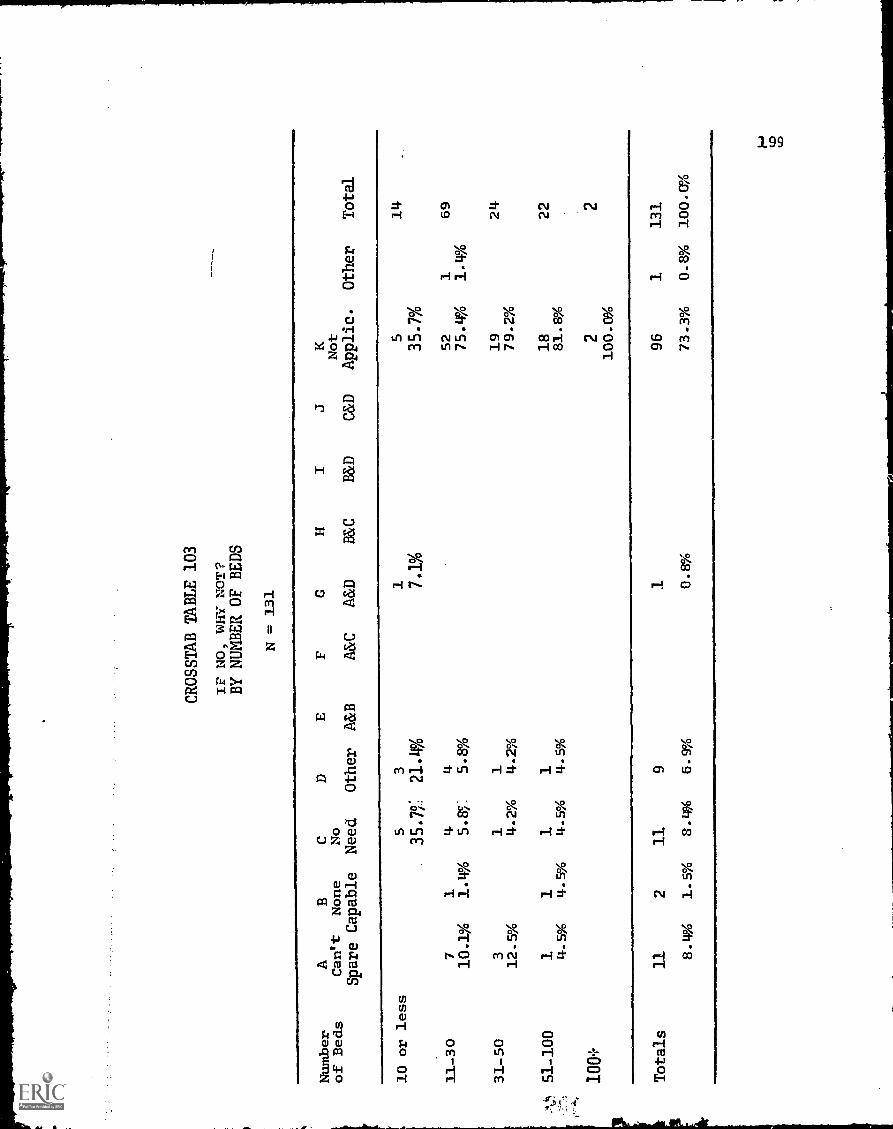
CROSSTAB TABLE 103
IF NO, WHY NOT?
BY NUMBER OF BEDS
N=1.31
Number
of Beds
A Can't
None
Spare Capable
No
Need
Other A&B
A&C
A&D
Not
B&C
B&D
C&D
Applic.
Other
Total
10 or less
53
15
14
35.75'.
21.4%
7.1%
35.7%
11-30
71
44
52
169
10.1%
1.4%
5.85
5.8%
754%
1.4%
31-50
31
119
24
12.5%
4.2%
4.2%
79.2%
51-100
1 4.5%
1 4.5%
1 4.5%
1 4.5%
1881.9%
22
100+
2
Totals
11
211
9
8.4%
1.5%,
8.4%
6.9%
196
1131
0.8%
73.3%
0.8%
100.0%

CROSSTAB TABLE 104
WOULD YOU EMPLOY A PERSON TRAINED AS AN OCCUPATIONAL OR PHYSICAL THERAPYAIDE, OR WOULD YOU
SEND A MEMBER OF YOUR PRESENT STAFF TO A SPECIAL TRAINING COURSE TO BECOME SUCH AN AIDE IF
THE COURSE WERE AVAILABLE AT LITTLE COST?
BY NUMBER OF BEDS
N =
131
Number
of Beds
Yes
No
Don't Xnow
Total
10 or less
56
314
35.7
%42.9%
21.1.%
11-30
48
16
569
69.6%
23.2%
7.2%
31-50
18
33
24
75.0%
12.9%
12.5%
51-100
19
322
86.4%
13.6%
100+
2
100.0%
2
Totals
92
70.2%
25
19.1%
14
10.7%
131
100.0%

CROSSTAB TABLE 105
DO YOU HAVE PATIENTS WHO ARE REFERRED TO YOUR NURSING
HOME FROM A NEARBY HOSPITAL?
BY NUMBER OF BEDS
N = 133.
NuM
ber
of Beds
Ye s
No
Total
10 or less
11-30
31-50
1285.7%
59
100.M
24
214.3%
14
69
24
51-100
,Nt
100+
.-.).1
1
100.0%
22
100 . 0%
2
100.0%
22 2
Total
129
2131
98.5%
1.9%
tir

CROSSTAB TABLE 106
IF YES, IS A MEMBER OF YOUR
STAFF INVITED TO PARTICIPATE IN THE DISCHARGE PLANNINGFOR
THOSE PATIENTS AT THE HOSPITAL?
BY NUMBER OF BEDS
N = 131
Number
of Beds
Always
Sometimes
Never
Other
Total
10 or less
311
14
21.4X
78.6%
11-30
31-50
4 5.8%
16 23
.2%
1 4.2%
48 69.6%
23
1 1.4%
69
24
51-100
46
12
22
18 .2%
27 .3%
100:-
22
100.o%
Totals
11
23
96
1131
8.0
17.6%
73.3
%0.
8%10
0.0%

CROSSTAB TABLE 107
DO THE HOSPITALS WHO REFER PATIEDTS TO YOUR NURSING HOME
FORWARD THE PATIENT'S RECORD ABSTRACTS?
BY NUMBER OF BEDS
N = 131
Number
of Beds
Always
Sometimes
Never
Other
Total
10 or less
11
12
14
78.6%
7.1%
14.3%
11- 30
45
21
21
69
65.2%
30.4
2.9%
1.4%
31-50
18
624
75. 0%
25.0%
51-100
17
22
77.3%
22.7%
N 100+
22
100.0%
Totals
9333
41
131
71.0%
25.2%
3.1%
0.8%
100.0%'

CROSSTAB TABLE 108
WHAT LNBORATORY AND DIAGNOSTIC FROCEDURES ARE YOU EQUIPPED TO PERFORM IN YOUR NURSING HOME?
BY NUMBER OF BEDS
N = 331
AB
CD
EF
Gif
IJ
KL
MTotal
Number
ECG
CBC
Urin-
More
No
of Beds
only
only
alysis
Other
A&B
A&C
A&D
B&C
B&D
C&D
Than 2
Info.
None
10 or less
15
814
7 .3.0/6
35.7%
57.1%
11-30
41
81
154
69
5.8%
1.45'!
11.6%
1.4%
1.4%
78.3%
31-50
14
19
24
4.2%
16.7%
79.2%
51-100
11
317
22
4.5%
4.5%
13.6%
77.3%
100J-
22
100.0%
Totals
17
120
31
98
131
0 .8%
5.3%
0.8%
15.3%
2.3%
0.8%
74.8%
100.0%

CROSSTAB TABLE 109
IS THERE A NEARBY HOSPITAL WHICH PROVIDES LABORATORY, DIAGNOSTIC OR THERAPEUTIC SERVICES
FOR YOUR PATIENTS?
BY NUMBER OF BEDS
N = 131
Number
of Beds
Yes
No
Total
10 or less
14
14
100.M
11-30
68
169
98.6%
1-4%
31-50
23
124
95.8%
4.2%
51-100
22
22
100.0%
22
100.0%
Totals
129
2131
98.5%
1.5%
100.0%

CROSSTAB TABLE 110
IF YES HOW FAR AWAY IS THIS
HOSPITAL FROM THIS NURSING HOME?
BY NUMBER OF BEDS
N = 131
Number
of Beds
0-10 miles
11-20 miles
Distance fi-um Nursing Home
Not
21-50 'Idles
over 50 mi.
Applicable
Total
10 or less
12
11
14
85.7%
7.1%
7.1%
11-30
55
10
469
79.7%
14.5%
5.8%
31-50
23
124
95.8%
4.2%
!*,4) 51-100
20
222
,..-) _
90.9%
9.1%
100+
2
100.0%
Totals
112
13
6131
85.5%
9.9%
4.6%
100.0%

CROSSTAB TABLE 111
DO THE HOSPITALS FROMWHICH PATIENTS ARE REFERREDTO YOUR NURSING HOME MAINTAIN CONTACT
WITH THE PATIENTS WHENTHEY ARE IN YOUR HOME TOASSURE CONTINUITY OF CARE?
BY NUMBER OF BEDS
N = 131
Number
of Beds
Yes
No
Sometimes
Total
10 or less
14
14
100.0%
11-30
658
569
8.7%
84.1%
7.2%
31-50
24
24
100.0%
51-100
116
522
72.7%
22.7%
100+
11
2
50.0%
50.0%
Totals
8113
10
131
6.1%
86.3%
7.0%
100.0%

CROSSTAB TABLE 112
HA
S A
NY
HO
SPIT
AL
OFF
ER
ED
TO
SH
AR
E P
ER
SON
NE
LW
ITH
YO
U, S
UC
H A
SA
IDE
S O
R T
HE
RA
PIST
SO
RPH
YSI
CIA
N A
SSIS
TA
NT
S?
BY
NU
MB
ER
OF
BE
DS
N =
131
Number
of B
eds
Yes
No
Tot
al11
11.
10 o
r le
ss7.
1%92
. 9°
A14
11-3
010
5969
85.5
%3/
-50
518
2425.0%
75.0
%51
-100
814
2236.4%
63 .6
%10
0+2
2100.0%
Tot
als
2710
413
120
.6%
79. 4
%10
0. 0
°/0

CROSSTAB TABLE 113
IF YES, DID YOU ACCEPT?
BY NUMBER OF BEDS
N = 131
NuMber
of Beds
Yes
No
Not Applicable
Total
10 or less
113
14
7 .1%
92.9%
11-30
10
59
69
14.5%
85.9%
31-50
51
18
24
20.8%
4.2%
75.0%
51-100
913
22
40.9%
59.1%
100+
2100.0%
2
Totals
27
1103
131
20.6%
0.8%
78.6%
100.0%

,
CROSSTAB TABLE 114
IF NO, WOULD YOU ACCEPT IF THEY
DID?
BY NUMBER OF BEDS
N = 131
Number
of Beds
Yes
No
Not Applicable
Other
Total
10 or less
77
14
50.0%
11-30
52
510
269
75.4%
7.2%
14.5%
2.9%
31-50
15
27
24
62.9%
8.3%
29.2%
51-100
10
39
22
45.9%
13.6%
100+
11
2
50.0%
Totals
84
18
27
2131
64.1
%13.7%
20.6%
1.5%
100.0%

CROSSTAB TABLE 115
IF YES, FAS THE ARRANGEMENT
BEEN SUCCESFUL?
BY NUMBER OF BEDS
N = 131
Number
of Beds
Yes
Vo
Not Applicable
Other
Total
10 or less
112
114
7.1%
85.7%
7.1%
11-30
10
356
69
14.5%
4.3%
81.2%
31-50
617
124
25.0%
70.8%
4.2%
4t1-100
814
22
.C.,:
36.4%
63.6%
100+
22
100.0%
Totals
27
399
2131
20.6%
2.3%
75.6%
1.5%
100.0%

NI
CROSSTAB TABLE 116
WHAT ARE THE MAIN REASONS THAT CONSULTANTS IN OCCUPATIONAL TMERAPY,
REHABILITATION, PHYSICAL
THERAPY, DIETETICS, ETC., ARE NOT USED MORE IN PLANNING THE SPECIAL CARE OF YOUR PATIENTS
AND PROVIDING SUCH CARE?
BY NUMBER OF BEDS
N131
Number
of Beds
Not
Available
Couldn't
Improve Care
Main Reasons
Won't
Pay Extra
Others
(Other)
Total
10 or less
11-30
31-50
51-100
100+
1 7.1%
2637.7%
8
33.3%
6
27.3%
3
21.4%
6 8.7%
3
12.5%
5
22.7%
3
21.4%
2231.9%
9
37.5%
5
22.7%
6
42.9%
14
20.3%
12.5%
6
27 .3%
2
100.0%
1 7.1%
1 1.4%
1 4.2%
14
69
24
22 2
Totals
41
31.3%
17
13 .0%
39
29. a%
31
23.7%
3 2.3%
131
100.0%

CROSSTAB TABLE 117
DO YOU HAVE A LARGE (50% OR OVER)
PERSONNEL TURNOVER EACH YEAR IN RN'S?
BY NUMBER OF BEDS
N =
Number
of Beds
Yes
No
Other
Total
10 or less
13
114
92 . 9%
7 .1%
11-30
LI
65
69
5.8%
94. 2%
31-50
123
24
4.2%
95.8%
N51-100
121
22
-..
4.5%
95.5%
Ul
100+
22
100.0%
Totals
6124
1131
4.0%
94.7%
0.8%
100.0%

CROSSTAB TABLE 118
DO YOU HAVE A LARGE (50% OR OVER) PERSONNEL TURNOVER EACH
YEAR IN LPN'S?
BY NUMBER OF BEDS
N = 131
Number
of Beds
Yes
No
Other
Total
10 or less
13
114
92.9%
7.1%
11-30
366
69
95.7%
31-50
24
24
100.0%
51-100
22
22
100.0%
100+
22
100.0%
Totals
3127
1131
2.3%
96.9%
0.8%
100.0%

CROSSTAB TABLE 119
DO YOU HAVE A LNRGE (50% OR OVER)
PERSONNEL TURNOVER EACH YEAR IN AIDES?
BY NUMBER OF BEDS
N = 131
Number
of Beds
Yes
No
Other
Total
10 or less
211
114
14.3%
78.6%
7.1%
11-30
23
46
69
33.3%
66.7%
31-50
11
13
24
45.8%
54.2%
51-100
10
12
22
'100+
11
2
50.0%
50.0%
Totals
47
83
1131
35.9%
63.4%
0.8%
100.0%

GC
CROSSTAB TABLE 120
DO YOU HAVE A LARGE (50:4 OR OVEN') PERSONNEL TURNOVER
EACH YEAR IN PHYSICAL THERAPISTS?
BY NUMBER OF BEDS
N = 133.
Number
of Beds
Yes
No
Other
Total
10 or less
11 -30
31-50
51-100
100+
1 1.4%
1 4.2%
13 92.9%
911.09
2395.8%
22
100.0g
2
100.0%
1 7.1g
14
69
24
22 2
Totals
2128
1131
1.5%
97.7%
0.8%
100.0%
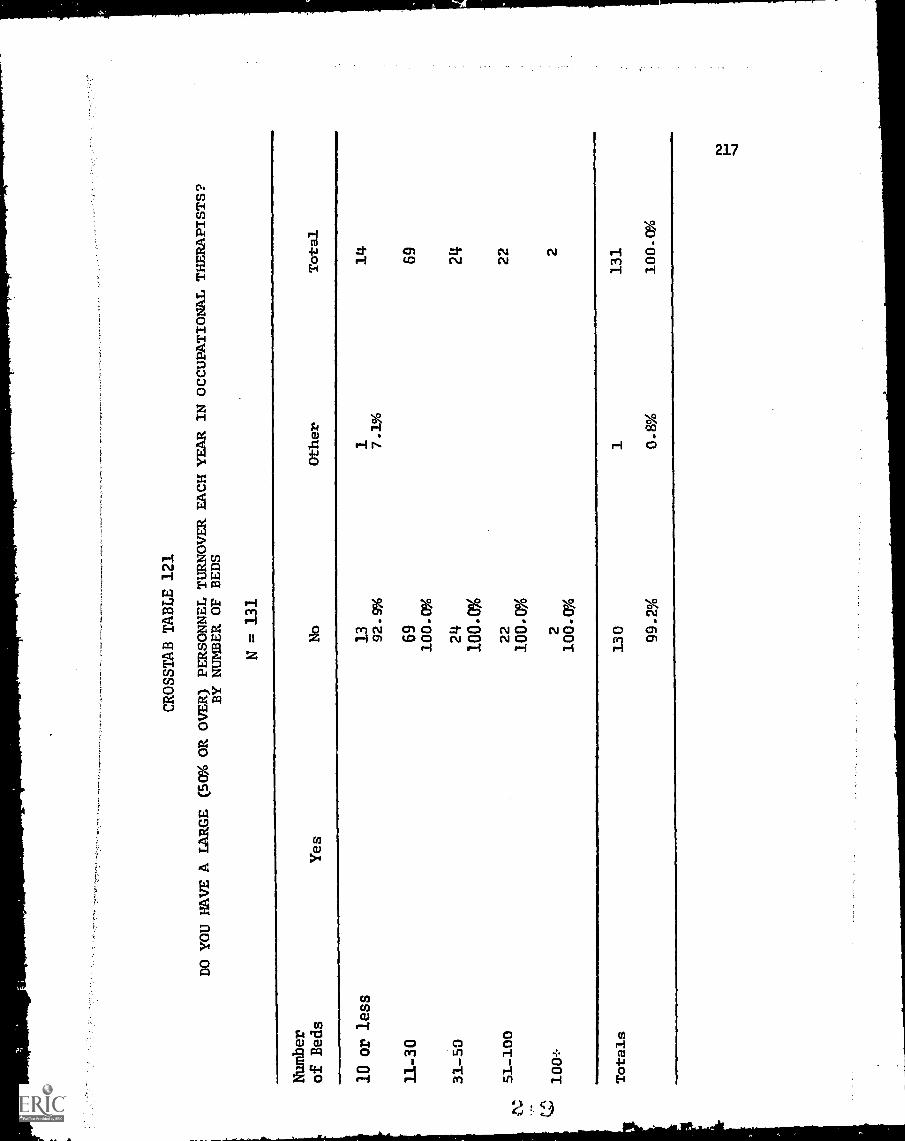
CROSSTAB TABLE 121
DO YOU HAVE A LARGE (50% OR OVER) PERSONNEL TURNOVER EACH YEAR IN OCCUPATIONAL THERAPISTS?
BY NUMBER OF BEDS
N = 131
Number
of Beds
Yes
No
Other
Tota/
10 or less
13
114
92.9%
7.1%
11-30
69
69
100.o%
31-50
24
24
100.0%
51-100
22
100.0%
22
100+
22
100.0%
Totals
130
113
1
99.2
%0.
8%100-0%

CROSSTAB TABLE 122
DO YOU HAVE A LARGE (5( % OR OVER) PERSONNEL TURNOVER EACH YEAR IN RECREATION & SOCIAL DIRECTORS?
BY NUMBER OF BEDS
N=131
Number
of Beds
Yes
No
Other
Total
10 or less
13
114
92.9%
7.1%
11-30
69
69
100.0%
31-50
24
24
100.0X
N7
A51-100
22
22
oe
-100.0%
0L'" 100+
22
100.00/0
Totals
130
1131
99.2%
0.9%
100.0%

CROSSTAB TABLE 123
DO YOU HAVE A LARGE CM OR OVER) PERSONNEL TURNOVER EACH
YEAR IN DIETETICS?
BY NUMBER OF BEDS
N =
Ul
Number
of Beds
Yes
No
Other
Total
10 or less
11-30
31-50
13
92.9%
69
100.0%
24
100.0%
1 7.1%
14
69
24
til-100
121
22
4.9%
95.9%
100+
11
2
50.0
%50
.0%
Totals
212
81
131
1.5%
97.7
%o
. 8%
100.0%

CROSSTAB TABLE 124
DO YOU HAVE A LARGE (51X4OR OVE:) PERSONNEL TURNOVER EACH YEAR IN
IN-SERVICE EDUCATION?
BY NUMBER OF BEDS
N = 131
Nuniber
of Beds
Yes
No
Other
Total
10 or less
11-30
31-50
13 92.9%
69
100.0%
24
1 7.1%
14
69
24
100.0%
51-100
22
22
100.0%
N.100+
22
tJ
100.0%
Totals
130
1131
99.2%
0.8%
100.0%

CROSSTAB TABLE 125
DO YOU HAVE A LARGE (SO% OR
OVER) PERSONNEL TURNOVER EACH YEAR IN
PHYSICIAN CARE
BY NUMBER OF BEDS
N =
131
Number
of Beds
Yes
No
Other
Total
10 or less
11-30
31-50
131
1492
.9%
7.1%
69
100.0%
24
100.0%
22
100.0%
2
100.
0%
69 24 22 2
Tot
als
130 99
.2%
0 .8
%10
0.0%

i0
CROSSTAB TABLE 126
DO YOU HAVE A LARGE (50% OR OVER)
PERSONNEL TURNOVER EACH YEAR IN OTHER EMPLOYEES?
BY NUMBER OF BEDS
N = 131
'timber
of Beds
Yes
No
Other
Total
10 or less
11-30
31-50
51-100
100+
4 5.8%
1 4.2%
1
13 92.9%
65
94.2%
23 95.8%
21 95.5%
2100.0%
1 7.1%
14
69 24
22 2
Totals
6124
94.7%
1 0.8%
131
100.0%
4.6%

CROSSTAB TABLE 127
DOES THE COST OF TRAINING NEW PERSONNEL SUBSTANTIALLY
INFLUENCE THE COST OF OPERATING
YOUR NURSING HOME?
BY NUMBER OF BEDS
N = 131
Number
of Beds
Yes
No
Don't Know
Total
10 or less
113
14
7.1%
92.9%
11-30
24
42
369
34.8%
60.9%
4.3%
31-50
717
24
29.2%
70.8%
51-100
418
22
18.2%
81.8%
100+
12
50.0%
50.0%
Totals
37
91
3131
28.2%
69.5%
2.3%
100.0%

CROSSTAB TABLE 128
DO
YO
U U
SE V
OL
UN
TE
ER
HE
LP
IN T
HIS
. DU
I1SI
NG
HO
ME
?BY NUMBER OF BEDS
N =
131
Number
Of Beds
Yes
No
Tot
al
10 or less
113
14
7.1%
92.9%
11-30
16
53
69
23.2%
76.8%
31-5
013
1124
54.2
%45
.8%
51-1
0010
1222
45.5
%54
.5%
1400
+1
12
50.0%
50.0%
Totals
41
90
131
31.3
%68
.7%
100.
0%

CROSSTAB TABLE 129
IF TRAINED VOLUNTEERS WERE AVAILABLE,
MANY COULD YOU USE?
BY NUMBER OF BEDS
N = 131
Number
of Beds
12-3
4-5
Number of Volunteers
5-10
More than 10
None
No Info.
Total
10 or less
34
61
14
21.4%
28.6%
42.9%
7.1%
11-30
532
17
57
369
7.2%
46.4%
24.6%
7.2%
10.1%
4.3%
31-50
29
43
14
124
8.3%
37.5%
16.7%
12.5%
4.2%
16.7%
4.2%
51-100
13
65
24
122
13.6%
27.3%
22.7%
9.1%
18.2%
4.9%
100+
11
250.0%
50.0%
Totals
11
48
27
13
421
7131
8.14%
36.6%
20.6%
9.9%
3.1%
16.0%
5.3%
100.0%

Co
CROSSTAB TABLE 130
ARE THERE TRAINED, BUT INACTIVE RN'S, LPN'S, OR. AIDES IN THIS COMMUNITY WHO MIGHT WORK
ON A PART-TIME BASIS AFTER THEY HAD ATTENDED A REFRESHER COURSE IN THEIR SPECIALTY?
BY NUMBER OF BEDS
N = 131
Number
of Beds
Yes
No
Don't Know
Tot
al
10or less
82
414
57.1%
14.3%
28.6%
11-30
18
18
33
69
26.1%
26.1%
47.8%
31-50
67
11
24-
25.0%
29.2%
45.8%
51-100
79
622
31.8%
40.9%
27.3%
100+
11
250 .
0 %
so.ug
Totals
36
5513
1
30.5
%27
.5%
42.0%
100.0%

CROSSTAB TABLE 131
IF THERE ARE, HOW MANY RN'S WOULD YOU BE ABLE TO HIRE?
BY NUMBER OF BEDS
N = 131
Number of RN's
Number
Didn't
Not
No
of Beds
1-2
3-4
5-6
7-8
None
Indicate 4
Applic.
Info.
Other
Total
10 or less
11-30
1 7.1%
19
1
535.7%
5
321.4%
3
321.4%
16
2114.3%
24
1
14
69
27.5
%1-4%
7.2%
4.3%
23.2
%34
.8%
1.4%
31-50
45
411
24
16.7%
20.8%
16.7%
ir
51-1
00)
5
22.7%
1 4.5%
1 4.5%
1 4.5%
2 9.1%
6
27.3%
6
27.3%
22
100+
11
250
.0%
50.0
%
Totals
29
21
17
829
44
1131
22.1%
1 . 5
%0
.13.0%
6.1%
22.1%
33.6%
0.8%
100.0%

CROS3TAB TABLE 13:
IF THERE ARE, HOW MANY
LPN/S WOULD YOU BE ABLE TO HIRE?
BY NUMBER OF BEDS
N = 131
Number of LPN's
Number
Didn't
Not
No
of Beds
1-2
3-4
5-6
7-8
None
Indicate # Applic.
Info.
Other
Total
10 or less
11-30
31-50
51-100
15
32
7.1%
35.7%
21.4%
14.3%
23
33.3%
1 1.4%
3 4.3%
3 4.3%
16
23 .2%
84
2
33.3%
16.7%
8.3%
51
12
6
22.7%
4.55
4.5%
9.1%
27.3%
1
Totals
314
21.4%
22
169
31.9%
1.4%
10
24
41.7%
722
31.8%
12
50.0
50.0
%
37
12
13
826
43
1131
28.2%
0 8%
1 .5%
6-1%
19.8%
32.8%
0.8%
100.0% a)

=-1
CROSSTAB TABLE 133
IF THERE ARE, HOW MANY AIDES WOULD YOU BE ABLE TO HIRE?
BY NUMBER OF BEDS
N = 131
Number of Aides
Number
of Beds
3-4
5-6
7-8
None
DidnIt
Indicate #
Not
Applic.
No
Info.
Other
Total
10 or less
25
22
314
14.3%
35 .7%
14.3%
14.3%
21.4%
11-30
3L.
112
316
29
169
5.8%
17.4%
4.3%
23.2%
42.0%
1.4%
31-50
21
63
12
24
8.3%
4.2%
25.0%
12.5%
50.0%
51-100
21
13
26
722
9.1%
4.5%
4.55
13.6%
9.1%
27.3%
31.8%
100+
150.0%
150.0%
2
Totals
96
12
26
727
52
1131
6.9%
4.6%
0.8r
1.9%
19.8%
5.3%
20.6%
39.7%
0.8%
100.0%

CROSSTAB TABLE 134
DO YOU HAVE DIFFICULTY ARRANGING TRANSPORTATION FOR
PATIENTS FROM YOUR NURSING HOME TO THE
HOSPITAL?
(rly EMERGENCY SITUATIONS)
BY NUMBER OF BEDS
N = 131
Number
of Beds
Yes
No
Total
10 or less
11-30
31-50
51-100
2 2.9%
100.%
67 97.1%
24
loo.u%
22
69
24
22
100.0%
/00+
22
100.0g
Totals
2129
131
1.5%
93.9%
100.0%
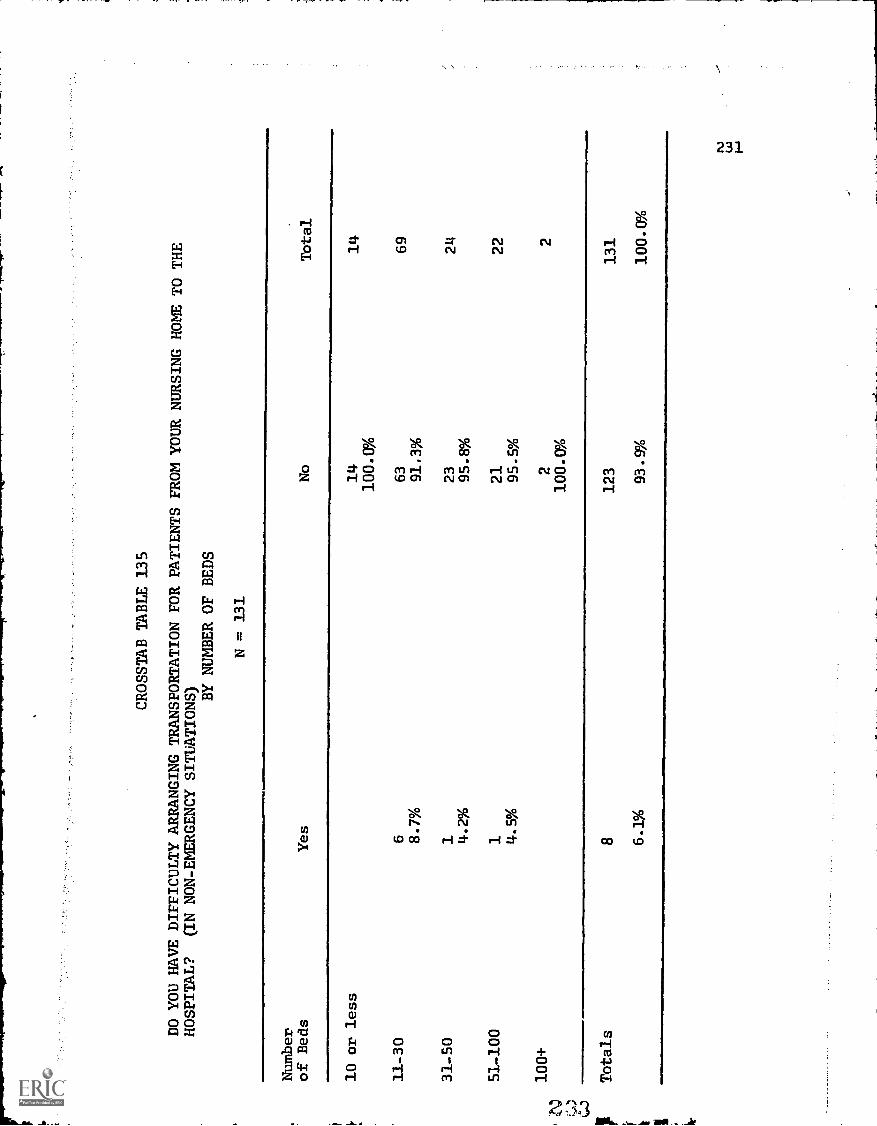
CROSSTAB TABLE 135
DO YOU HAVE DIFFICULTY. ARRANGING TRANSPORTATION FOR PATIENTS FROM YOUR NURSING HOME TO THE
HOSPITAL?
(IN NON-EMERGENCY SITUATIONS) BY NUMBER OF BEDS
N = 131
Number
of Beds
Yes
No
Total
10 or less
14
14
100.0%
11-30
663
69
8.7%
91.3%
31-50
123
24
95. e%
51-100
121 95.5%
22
100+
22
100.0%
Totals
123
131
6.1%
93.9%
100.0%

N
CROSSTAB TABLE 136
DO YOU THINK THAT THE HOSPITAL AND ITS STAFF ARE WELL EQUIPPED TO HANDLE MEDICAL
EMERGENCIES
WHICH OCCUR AT YOUR NURSING HOME?
BY NUMBER OF BEDS
N = 131
Number
of Beds
Yes
No
No Information
Total
10 or less
14
14
100.0%
11-30
66
369
957%
4.3%
31-50
24
24
100.0%
51-100
20
11
22
90.9%
41.5%
4.5%
100+
22
100.0%
Totals
126
31
1131
96.2%
2.3%
0.8%
0.8%
100.0%
,a=
111.
maO
ilWA
Lt,

CROSSTAB TABLE 137
IS THERE A HOMff HEALTH SERVICE AGENCY IN THIS AREA?
BY NUMBER OF BEDS
N = 131
Nnmber
of Beds
Yes
No
Don't Know
Total
10 or less
84
214
57.1%
28.6%
14.3%
11-30
43
17
969
62.3%
24.0%
13.0%
31-50
12
48
24
50.0%
16.7%
33.3%
51-100
15
722
68.2%
31.8%
100+
22
100.0%
Totals
80
32
19
131
61.1%
24.4%
14.9%
100.0%

CROSSTAB TABLE 138
IS A VISITING NURSE SERVICE PROVIDED FOR PATIENTS IN THEIR HOMES IN YOUR AREA?
BY NUMBER OF BEDS
N = 131
Number
of Beds
Yes
No
Don't Know
10 or less
750.0%
2
14.3%
535.7%
11-30
48
912
69.6%
13.0g
17.4g
31-50
12
48
50.0%
16.7%
33.3%
51-100
13
45
59.1%
18.2%
22.7%
Total
14
69
24
22
tsD 100+
22
100.0%
r
Totals
82
19
30
131
F 1
62 . 6%
14.5%
22.9%
100-V#

CROSSTAB TABLE 139
IS PHYSICAL THERAPY SERVICE PROVIDED
FOR PATIENTS IN THEIR HOMES IN YOUR AREA?
BY NUMBER OF BEDS
N =
131
Number
of Beds
Yes
No
Don't Know
Total
10 or less
45
514
28.6%
35.7%
35.7%
11-30
12
43
14
69
17.4%
62.3%
20.3%
31-50
214
824
8.3%
58.3
%33
.3%
51-100
412
622
18.2%
54.5
%27.3%
C.2
100+
22
100.0%
Total
24
74
33
131
18.3
%56.5%
25.2%
100.0%

CROSSTAB TABLE 140
IS OCCUPATIONAL THERAPY SERVICE PROVIDED FOR
PATIENTS IN THEIR HOMES IN YOUR AREA?
BY NUMBER OF BEDS
N = 131
Number
of Beds
Yes
No
Donit Know
Total
10 or less
L.
55
14
me%
35.7%
35.7%
11-30
351
15
69
73.9%
21.7%
31-50
114
924
58.3%
37.5%
51-100
313
622
13.6%
59.1%
27.3%
1004-
11
2
50.0%
50.0%
Totals
11
84
36
131
8.4%
64.1%
27.5%
100.0%

CROSSTAB TABLE 141
IS SOCIAL WORK SERVICE PROVIDED FOR PATIENTS IN THEIR HOMES IN YOUR AREA?
BY NUMBER OF BEDS
N = 131
Number
of Beds
Yes
No
Don' t Know
Total
10 or less
72
514
50.0%
14.3%
35.7%
11-30
26
28
15
69
37.7%
40. 6%
21.7%
31-50
10
59
24
41.7%
20.8%
37.5%
51-100
13
54
22
59.1%
22 .7%
18.2%
100+
11
2
50. 0%
50. 0%
Totals
56
41
3 4
131
42.7%
31.3%
26. 0%
100.0%

CROSSTAB TABLE 142
ARE OTHER SERVICES PROVIDED FOR FATIENTS IN THEIR HOMES IN YOUR AREA?
BY NUMBER OF BEDS
N =
131
Number
of Beds
Yes
No
Don't Know
Total
10 or less
95
14
64.3%
35.7%
11-3 0
10
44
15
69
1 4. 5%
63.8%
21.7%
31- 50
114
924
58.3%
37 .5%
51-100
1114
422
IN
k..-
5
18.2%
63.6%
18.2%
0100+
11
2
50.0%
50.0%
Total
15
82
34
131
11.5%
62.6%
26.0%
100.0%

CROSSTAB TABLE 143
WHEN A PATIENT LEAVES YOUR NURSING HOME TO RETURN TO THEIR FAMILY, DO YOU INVITE THEIR
COMMUNITY'S HOME HEALTH SERVICE AGENCY TO PARTICIPATE IN THE DIEUEARGE PROCEDURES?
BY NUMBER OF BEDS
N = 131
Number
No
of Beds
Always
Sometines
Never
No Such Patient
Info.
Other
Total
10 or less
59
14
35.7%
64.3%
11-30
38
39
18
169
11.6%
56.5%
26.1%
1.4%
31-50
21
14
61
24
8.3%
4.2%
58.3%
25.0%
4.2%
51-100
46
83
122
18.2%
27.3%
36.4%
13.6%
4.9%
100+
11
2
50.0%
50.0%
Totals
10
16
66
36
21
131
7.6%
12.2%
50.4%
27.5%
1.5%
0.0
100.0%

CROSSTAB TABLE 144
IF A LOCAL NON PROFIT
COMMUNITY HEALTH SERVICEAGENCY COULD PROVIDE
CONSULTANT HELP IN
THE
AREAS OF PATIENT CARELISTED IN QUESTION#41, WOULD YOU UTILIZE
THESE SERVICES?
BY NUMBER OF BEDS
N = 131
Number
of Beds
Yes
No
Need Mbre
Information
Total
10 or less
10
31
14
71.4%
21.4%
7.1%
11-30
54
78
69
78.3%
10.1%
11.6%
31-50
18
624
75.0%
25.0%
51-100
13
54
22
59.1%
22.7%
18.2%
100+
22
100.0%
Totals
95
17
19
131
72.5%
13.0%
14.5%
100.0%

CROSSTAB TABLE 145
DO YOU FEEL THAT ANY OF YOUR PATIENTS
MIGHT BE ABLE TO LIVE AT HOME AND BE CARED FOR
SATISFACTORILY BY A HOME HEALTH CARE SERVICE?
BY NUMBER OF BEDS
N = 131
Number
of Beds
Yes
No
Information
Blank
Other
Total
No
10 or less
212
14
14.3%
85.7%
11-30
14
52
11
169
20.3%
75.4%
1.4,4
1.4%
1.4%
31-50
519
24
20.8%
79.2%
51-100
616
22
27.3%
72.7%
N100+
11
2
Ci
50.0%
50.0%
Totals
28
100
11
1131
21.4%
76.3%
0.8%
0.8%
0.8%
100.0%

--"
"-7
1b.
A-
-,-
-711
1.
CROSSTAB TABLE 146
TROUBLE HIRING LPN'S BECAUSE THERE IS A SHORTAGE
BY DIFFICULTY IN HIRING RN'S BECAUSE OF SHORTAGE
N = 131
Difficulty
Hiring RN's
Yes
Difficulty Hiring LPN's
No
Not Applicable
Total
Yes
24
18
42
57.1%
42.9%
No
923
32
28.1%
71.9%
Not Applicable
57
57
100.0%
tO
Totals
33
41
57
131
25 . 2%
31.3%
43 . 5%
100 . 0%
A

Difficulty
Hiring RNIs
Yes
No
Not Applicable
Totals
cri
7.-
7
CROSSTAB TABLE 147
TROUBLE HIRING AIDES BECAUSE THERE IS A SHORTAGE
BY DIFFICULTY IN HIRING RNts BECAUSE OF SHORTAGE
N = 131
Difficulty Hiring Aides
Yes
No
Not Applicable
Total
21
21
42
50.0%
50.0%
19
13
32
59.4g
Lio.e%
57
57
100.0%
4034
57
131
30.5%
26.0%
43.5%
100.0%

CROSSTAB TABLE 148
TROUBLE HIRING PHYSICAL THERAPISTS BECAUSE
THERE IS A SHORTAGE
BY DIFFICULTY IN HIRING RN'S BECAUSE OF SHORTAGE
N = 131
Difficulty
Hiring RN's
Difficulty Hiring Physical Therapists
Yes
No
Not Applicable
Total
Yes
537
42
11.9%
88.1%
No
329
32
9.416
90.6%
Not Applicable
57
57
100.0%
Totals
866
57
131
6.1%
50.4g
43.5%
100.0%

CROSSTAB TABLE 149
TROUBLE HIRING OCCUPATIONAL THERAPISTS
THERE IS A SHORTAGE
BY DIFFICULTY IN HIRING RN'S BECAUSE OF SHORTAGE
N=131
Difficulty
Hiring RN's
Yes
Difficulty Hiring Occupational Therapists
No
Not Applicable
Total
Yes
6
14.3%
36
85.7%
42
No
428
32
12.5%
87.5%
Not Applicable
57
57
100.0%
"..1Totals
10
64
57
131
7.6%
48.9%
43.5
%10
0.0%

CROSSTAB TABLE 150
TROUBLE HIRING RECREATION & SOCIAL DIRECTORS
BECAUSE THERE IS A SHORTAGE
BY DIFFICULTY IN HYRING RN'S BECAUSEOF SHORTAGE
N=
131
Difficulty
Hiring RN's
Difficulty Hiring Recreation & Social Directors
Yes
No
Not Applicable
Total
Yes
240
42
95.2%
No
230
32
6.3%
93.8%
Not Applicable
57
100 . 0%
57
Totals
4 3 .1%
70 S3.4%
57
43.5%
131
100.0%

CROSSTAB TABLE 151
TROUBLE HIRING DIETICIANS BECAUSE
THERE IS A SHORTAGE
BY DIFFICULTY IN HIRING RN'S BECAUSEOF SHORTAGE
N = 131
Difficulty Hiring Dieticians
Difficulty
Hiring RN's
Yes
No
Not Applicable
Total
Yes
537
42
11.9X
88.1%
No
230
32
6 -3%
93 -8%
Not Applicable
.
57
57
Totals
767
57
131
5 .3%
51 .1%
43.5%
100.0%

CROSSTAB TABLE 152
TROUBLE HIRING IN-SERVICE EDUCATORS BECAUSE THERE IS A SHORTAGE
BY DIFFICULTY IN HIRING RN'S BECAUSE OF SHORTAGE
N =
131
Difficulty
Hiring RN's
Yes
Difficulty Hiring In-Service Educators
No
Not Applicable
Total
42 32
Yes
240
4.8g
95.2%
No
32
100.0%
Not Applicable
CJ1
57
100.0%
57
Totals
2 1.5%
72 SSA%
57
43.5%
131
100.0%

CROSSTAB TABLE 153
TROUBLE HIRING PSYCHIATRISTS BECAUSE THERE IS A SHORTAGE
BY DIFFICULTY IN HIRING RN'S BECAUSE OF SHORTAGE
N = 133.
Difficulty
Hiring RN's
Yes
Difficulty Hiring Psychiatrists
No
Not Applicable
Total
Yes
3 7.1%
39 92.9%
42
No
32
32
100.0,f)
Not Applicable
57
57
100.0%
Totals
371
57
131
2.3%
54.2%
43.5%
ioo.tr/0

CROSSTAB TABLE 154
TROUBLE HIRING PHYSICIANS BECAUSE THERE IS A SHORTAGE
BY DIFFICULTY IN HIRING RN'S BECAUSE OF SHORTAGE
N =
131
Difficulty
Hiring RN's
Yes
Difficulty Hiring Physicians
No
Not Applicable
Total
Yes
2 4.8g
40
95.2%
42
Eo
131
32
3.1X
96.9%
NNot Applicable
57
57
C.,
ik a
100.0%
C I
d
Total
371
57
131
2.3%
54.2%
43.5%
100.0%

CROSSTAB TABLE 155
TROUBLE HIRING OTHERS BECAUSE THERE IS A SHORTAGE
BY
DIF
FIC
UL
TY
IN
HIR
ING
RN
' S B
EC
AU
SE O
F SH
OR
TA
GE
N131
Difficulty
Hiring RNIs
Yes
Difficulty Hiring Others
No
Not Applicable
Total
Yes
2 4.8
ito42
No
626
32
18.8
%81
.3%
Not Applicable
57
57
100.0%
0Totals
866
57
131
6.1%
50.4%
100.0%

252
OUTLINE OF SURVEY QUESTIONS USED
1. What is your position in this nursing home?
2. How many beds does this nursing home have?
3. How many full-time and part-time employees and consultants do youemploy?
4. Do you have trouble hiring any tYpes of personnel because there isa shortage? If yes, which types?
S. Do you have an In-Service Education Program? If yes, who is regularlyincluded in the activities of this program?
6. Is one employee responsible for staff educational activities in thishome? If yes, is this a full-time duty?
7. Would you like a representative from MRMP to visit your facility toassist in developing an in-service education program?
8. Do you or members of your staff attend the educational programsconducted by the State Department of Health and Welfare? If no,what is the reason for not attending?
9. Would you send members of your staff to formal educational programsin their specialties at the nearest regional location?
10. Are you or members of your staff able to attend meetings, which areheld out of state, to learn of new practices in caring for nursinghome patients? If no, why are you not able?
11. Is a treatment order plan developed for each patient in this nursinghome? If yes, are these plans reviewed as part of educationalsessions for the staff?
12. Do you have a utilization review procedure in this home? If yes,who participates in the review? Are the results of the review usedfor educational purposes with the entire staff?
13. Do you have procedure manuals for each categoWof personnel on yourstaff?
14. Do you feel that procedure manuals can (could) be very helpful inorienting the new employee to the standard practices in your nursinghome?
15. Where have the majority of your personnel been trained?
16. Is each patient in this home under the care of a private physician?If no, does the home have a staff physician who cares for the patientswithout a private physician?
17. Approximately how many times in the past year have you had difficultysecuring the services of a physician for an emergency situation?
251

253
18. How often, on the average, are the patients examined by a physician?
19. What percentage of your pateints are private self-pay?
20. What arrangements do you have for dental care in this home?
21. Do you feel that the physicians and dentists in the area could bemore cooperative in helping with the care of your patients?
22. Does a physician participate in your staff conferences?
23. Do you feel that a physician's assistant, who was specially trainedto care for elderly people and who was licensed by the state toprovide most of the non-emergency care for nursing home patients,would be able to provide better care for your patients than theypresently get? Such a person might be shared by several nursinghomes.
214. Would you send one of your nurses to a training course to become ageriatric care specialist if such a course were available at thenearest regional medical center? If no, why not?
25. Would you employ a person trained as an occupational or physicaltherapy aide, or would you send a member of your present staff to aspecial training course to become such an aide if the course wereavailable at little cost?
26. Do you have patients who are referred to your nursing home from anearby hospital? If yes, is a member of your staff invited toparticipate in the discharge planning for those patients at thehospital?
27. Do the hospitals who refer patients to your nursing home forwardthe patient' s record abstracts?
28. What laboratory and diagnostic procedures are you equipped to performin your nursing home?
29. Is there a nearby hospital which provides laboratory, diagnosticor therapeutic services for your patients? If yes, how far awayis this hospital from this nwslog home?
30. Do the hospitals from which patients are referred to your nursing homemaintain contact with the patients when they are in your home toassure continuity of care?
31. Has any hospital offered to share personnel with you, such as aidesor therapists or physician assistants? If yes, did you accept?If no, would you accept if they did? If yes, has the arrangementbeen successful?
32. What are the main reasons that consultants in occupational therapy,rehabilitation, physical therapy, dietetics, etc., are not used morein planning the special care of your patients and providing suchcare?
2

254
33. In which personnel c??..tegories do Srou have a large (50% or over)personnel turnover each year?
34. Does the cost of training new personnel substantially influence thecost of operating your nursing home?
35. Do you use volunteer help in this nursing home?
36. If trained volunteers were available, how many could you use?
37 . Are there trained, but inactive R. N. s, L. P.N. s or aides in thiscommunity who might work on a part-time basis after they had attendeda refresher course in their specialty? If there are, how many ofeach would you be able to hire?
38. Do you have difficulty arranging transportation for patients fromyour nursing home to the hospital (1) in emergency situations? (2)In non- emergency situations ?
39. Do you think that the hospital and its staff are laell equipped tohandle medical emergencies which occur at your nursing home?
140. Is there a home health service agency in this area?
14l. What services are provided for patients in their homes in your area?
42. When a patient leaves your nursing home to return to their family,do you invite their community' s home health service agency to participattin the discharge procedures?
43. If a local non-profit community health service agency could provideconsultant help in the areas of patient care listed in Question 041 .
would you utilize these services?
1414. Do you feel that any of your patients might be able to live at homeand be eared for satisfactorily by a home health care service?
45. Do you have any additional problems in operating this nursing homewhich we might be able to help you with?
46. What do you anticipate in the way of major changes in our methodsof caring for elderly people in this country in the next twenty years?