document resume - eric · document resume. ed 055 548 he 002 586. author pieper, w. c., jr. title...
TRANSCRIPT

DOCUMENT RESUME
ED 055 548 HE 002 586
AUTHOR Pieper, W. C., Jr.TITLE Financial Support tor Institutional Research,
1969-70.INSTITUTION Assoc iation for Institutional Research.PUB DATE 71NOTE 44p.
EDRS PRICEDESCRIPTORS
ABSTRACT
MF-$0.65 HC-$3.29*Expenditures; *Financial Support; *Higher Education;*Institutional Research; *Surveys
The Association for Institutional Research conducteda survey of all institutions of higher education in the U.S. andCanada in order to assess the number, size, and financial support of
institutional research offices. Data were requested for the 1969-70academic year. This report is based on the responses of 1,444institutions that returned the questionnaire. Of these, 1,107 or 77
percent did not have an operating institutional research (IR) office
and 337 or 23 percent did. Information is presented on: (1) the
number of IR offices by size, type, and control of institution; (2)
offices scheduled to open during 1970-71 by type and control ofinstitution; (3) state or other central institutional researchagencies by type, control, and enrollment size; (4) financial support
for IR by type, control, and enrollment size of institution; (5)sources of financial support for IR; (6) wage and salary expenditures
for IR; (7) full-time equivalent staff in IR offices; and (8) other
areas of expenditures such as computer time, other electronic dataprocessing expense, publication of reports and other documents, and
equipment and furniture. The questionnaire and accompanying letter
are reproduced in appendix I, while appendix II gives a completebreakdown of the responses by type and control of the institution and
by enrollment size. (AF)

A
m'cntlf
t.
e,r
626i)-15o-EE°iJ(a1-.m zmwonwz °oowoM..-24su.17wEwzrz-u-s4mu_o'ijo wz
5
ziatImmw°ta2
1.1
-o1-0- n2 .1.-
TF.
00 50-z0z5x7,.tg
1440Euz wa-,(70,1z501-1;Z2lAinuuw-F=w-
lighH
8i7555 Q03

FINANCIAL SUPPORT
FOF
INDSTITUTIONAI RESEARCH
1969 - 1970
W. C. Pieper, Jr.
THE ASSOCIATION FOR INSTITUTIONAL RESEARCH
1971
2

Yamy persons and organizations contributed to the making of this
report. Addresses for the mailing of the muestionnaires were provided
by the National Education .Lssociation and by Dr. Hobert Y. Clark of the
'Jniversity of British Columbia. The public accounting firm of Touche,
Hoos and Company, particularly in the person of Miss Linda Brash, oversaw
the receipt of the questionnaires, which were then edited and key punched
by Yips Cherie Swanson cf the Office of institutional Research at Berkeley.
In addition, assistance in reading and correcting the manuscript was gen-
erously given by Sidney Suslow and Alfred Cavanaugh, both also of the
Office of Institutional Hesearch at Berkeley.
But perhaps the most important contribution was rade by the many
.individuals who took the time and trouble to fill out and return ques-
tionnaires. On behalf of both the Executive Committee of the Association
for Instizutional Research and the author, a warm word of thanks is offered.
,. C. Pieper, Jr.Office of Institutional HesearchUniversity of California, BerkeleyJune, 1971
3
FORWARD
Institutional Research in institutions of higher education has became
widespread in large part through the desire o aaministrators and faculty
to know more about their own institutions. Similarly, the importance and
proliferation of institutional research offices has generated a need to
know more about the institutional research function itself. In response
to this need, the EXecutive Committee of the Association for Institutional
Research conducted a survey of all institutions of higher education in
the United States and Canada. Its purpose was to assess the number, size
and financial support of institutional research offices.
Also, the reader shauld be aware that the Association for Institutional
Research is an international inaividual meMbership orgz.mization composed
of numerous individuals whose titles and institutional affiliations often
do not reveal any obvious involvement with the field of institutional re-
search. Thus, there are undoUbtedly many more inaividuals in higher edu-
cation who are Interested in the activities and products of ins-tuUonal
research than would be apparent fram the results of the study which
follaws.
This brief study can only be a beginning toward the goal of describing
with greater accuracy the nature of the instit,:C-Lonal research function at
institutions of higher learning.
Sidney SuslawPresident, 1970-1971Association for Institutional Research
4
Page
=R0DUCTIO77
VALIDATION OF THE SAMPLE2
THE NUT/2ER OF INsi-lutiONAL RESEARCH OFFICES 6
OFFICES SCHEDUT7n TO OPEN DURING 1970-71 10
=ATE OR OTHER CENTRAL INsi eulIONAL RESEARCH AGENCIES 12
RINANCIAL SUPPCRT FOR INS ITuTIONAL PESEARCP' 14
SOURCES OF FINANCIAL SUPPORT21
WAGE AND SALARY EXPENDITURES23
FUIL TIME EQUIVALENT STAFF26
OTHER AREAS OF EXPEND1zUrLE28
SUMMARY32
TEXT TABLES
1. A.I.R. Sample Compared to A.C.E. Census of U.S. 7-Igitutions. 4
2. Percent of the Sample Group which Reported Having anInstitutional Research Office by TYpe and Control of
Institution and Enrollment Size 5
3. The Effect of Nonzalizing Type and Control of Institutionfor Enrollment Size on the Propensity to Have an Institutional
Research Office7
4, Institutions Planning to Initiate IR Offices During 1970-71
by Type, Control, and Enrollment Size 11
5. Institutions Served by State or Other Central Institutional
Research Agencies by Type, Control, and Enrollmcnt Size . . . . 13
6. Total Support for Institutional Research by Type of Control
and Enrollment Size15
7. Total Support for Institutional Research at Universities by
Type of Control and Enrollment Size16
8. Tbtal Support for Institutional Research at Fdur-:Year Colleges
by Type of Control and Enrollment Size 17

rk)
0t-
-3
:18
(Di
'be,
,UU
.-)
.119
0`.
:1
1) Il
4'1
,'
:b: r
:S
,' ':
":
-'
P' )
0' 0
0 0
I. 0
ti. 0
...,/
.4 1
,/.1
.1.1
0
ro:.1
rii:I
0 0
:11
00ta
lo tr
)C
Dch
1DI l
ii'1
1' '0
3
;11
1 i.
En4
y :,
En
0 ci
:,-
CD
O. 0
g 'il
i1/
440' C
D1-
' O. 0
".40 0
11Y
'"/1
cf'
O. 0
-1.
3.cf
O. o
.
ri,rlt
,f,
"fD
(90
1.0...--
... 0 it
" 'ti
1
IV1
O. I
D(t
Di
1:11
1.1.
:12
-3E
l,-
)U
i 3
o.5
,,,
00
01'
'Ll
0 ct
4:cf
00
'I!7
.
1
ri o
.6,
oP
o
rn.D
/111
331
fit>
Or1
i'l'
041
.1;1
31
,I1,t
1.1'
. 5.:i
ltI0
D
a
ird
0'''.
00
It0
.-1
1-,
N I-
,r,
.,IT
II,
II.1.
I., D
I-it
ins
it0
iir
g P
Ii,'
9e.
kt. f
i0
.1I
.
....,
11 'd
6 ;3
:1ct
P.
1). -
) 010
00
0ti.1
0p
I)1-
..1.1
111
'cf.
I° 51
I
7/'1
7i
(J.
,....
14
WI.)
:ito
00
0c:
0rF.
4,I
.,(A
f
cf11
.0
r1
.,,.
.c
iv ,
.ti
iivi
(1
1-'
r.il
-,1
I
aIt
11
P1)
1"
P ,
1. c
jp
sro tt
Ht
k :,;
,.
(D.
Atf'
.>.
0 C
D13
.fp
tj11
fp
fDIc
)I.)
0 0
CD
0C
.I.1
0 I1
IA0
' i0
,3I '
011
I-'
1,1
4.:
VI
f. it
8.e)
ii0
-],-
_1
..1
a II.
.,,,
I,C
r II
11 .1 to
tk9
(f:1
-
I,D-1
"
Licf
I/'S
f1 0
0 ...
./
F.
,_ ji
:PI
1j 5
,,1
111
!IIS
4';
0-1-
1i F
t0
"1)
i7.
Ti
(I,
',..1
00,
,1it
rt/7
(.1.
SI 1
-(f
) 0
(,)
I.. 0
it It
O/D
1/ .4lb
O0
j ii
ti p
011
31.
1)1.
0 C
.
'.1)
jtif
I.. c
f
00
0 0
II.p:
I,cl
- I,
g is
0 .1 0
i-i ,I
4.,1
,1II,
i/f I
. i!,
,1.
,a
:3rt
. ID
r0,
,,c-
1-ct
4' 0
1. 0
(7,
F.
id-4
l'f 1
'1.
IDct
cf
1=11
lil
it)P.
I',to
ioto
o0
$..il
p .,1
, t0
I'
't16'
1g
N,.
A)
;'to
cr c
r' c
t-t
1.1
II.,
- 1,
1P
a
(ill:
0 ,..
,.
if 0
I" l'
il 0
P 0
11
0 I,
If it
1,3.
illi
1,1-
,0
0P
0.r
) 11
/0!S
i IV
0 3.
0
O 0
I'D e
if ct
P 'l
l31
111
pr,
t.,;
0fD
0 II
3.1
if. S
I'II,
.;1
13I,
01,
1,
;t1 0
00
p. o
i f r
t.o
o 0
M ID
0'..
I'Y0
:V1
df11
)
iii V
1-1
0 0 N
0 13
,C
D.1
061
4 1,
'iii:,
J
p 1.
-'0
01)
;1 0
).
a N
I0
it, 7
P.
.30
:1-
ii'1
33'
:3*
00
(30
0.0
I 1
', L
I0
fl .-
110
I, I"
,I'.
101-
/i-'
c- 0
00
3'0
K.
...i.
' ( '
H'
CI
ID1.
) I4-
i' 2
to3)
..
f'D
ID(f
l
II0
71 N
,it,
.,:t
.0
O q
',7'
rD I
N
I., r
,.
4...)
3,P
..
..
..
.
13.3
1.1
It.)
k0.
VI
\ .1
Ici
I)

2.7.1TRODUCTION
Presented herein are the results of a survey undertaken by the
Executive Commi"tee of the Association for Institutional Research and
carried aut by the Office of Ins%itutional Research at the University of
California, Berkeley. Durinz the fall term of 1970, some 3,000 questionn-
aires were sent to the presidents of all two and four-year colleges and all
universities in the United States and Canada. The questionnaire and accvm-
pan:ring letter are reproduced in full as Appendix I of this report. Res-
pondents were assured of complete ancnynity with regard to their replies,
which was achieved by having all returns channeled through the San Francisco
office of Touche, Ross and Company, Certified PUblic Accountants. There
postmarks and other possible identification%rere removed prior to tne ques-
tionnaires' being forwardad to Berkeley for processing. The total number of
questionnaires ret4arned was just under 50% of thc.,,e sent. There we= no
attempt to .Sttain additional responses thr.lugh the use cf follaw-up
correspolence.
The questio-T-,Aire addressed itself initially to obta471-Ing a basic
profile of ea-h institution and then, if the institution did in fact have an
office whose pr4-1,Pry responsibility wasinstitu'ional research, went on to
aak about sources and amounts of support for this activity, amounts ex-
pended in various categories of expense, numbe- FIE staff membe-s and
the percent of the institution's operating bldget which the total institu-
tional research expenditure represented. All data requested were for the
1969-1970 academic year, which would have been the most recent complete
year at the time the questionnaire went aut.

I.0
M13 1,'' 0, 0 ," (1 t° M q 2 4- tl. W, '4 '8 !'-, '2(-1. 1 (I 0. (t) I.: (1.) 0 ,I %1 3.' ti
t.1 'I 0O 0 ,jO 0 CD 1 I V
1 h ,1 , 0 D fI C. C r l , 0 i ,*V8 to -1
j,, (I.., CI ta (1, .3' I-, 0 31 I'. 0 G ,-, I'
. 31-.1 r 0 0 0 0 0 ...3 0 0 0
I q ' 1a il I ' I.1 :1 0, 0 0. 1.. :1V f ta If I'l. 0,
0 1. (i.I, t .,D- I , trI I 0 IL, 0
O I''' g U R. . P.
m 0 0 rr, 00
(1.;', c:.1' ill (II,I' c':',)P li, 0 0 0 crM 1
1, .1:1.00, [1:4'. t '''.1 :1 g i', N
(0 .1 0 4 0 0 1, ,'I i i 5: g., 11 'ti11 I'D 1,1 II (1. 4 '1 0 V; 5:
(4 1- 8 1,
; 'I!. fokooti.1 r:0
.0. .0. e.,ii , 0o 0 , - ., n, ...: c., 0
Ii2, tfi. or 31(100 C. ctio00,1; 2 :I
tf.. 0 CO '1 If 1, (1,1
it, 0 if If 0 b ,,. ti 1.3 " !. I.;-C.
8 PI 1J ii v.
(r. I .,i,.. .1) o, 01,
cr 31 o .0 a 0 0. IL 1.1 0 ,1 1,1 tiir. -t: ,
11 003, h 'g it H 0' 0
ri) ii -. g i:)) g ,,, 11,r, % g g g ii, : i', 3...'" 11 ',.; i '}'..
, g g fii :". .r 3,. ,f g #, . ti :re IC. . !Ijr p r,.;10,, of Pa 1'0',; oror.o.,ff r 'CI g ti. Ii,1 " ' Ci " s; .1) '..i)" '3'4 " I I. 6,14 " :1
V, 4 l' tigi-1.-: iT'' rcl ggligkg ',I pf:-
, (4 1-, CY (g1 I 1 f 1 ,
2 'p-il
0
''_IHri .,-:, 4 1-4' '4 .,.i ,. ., :I ..
t. Co ()i. 0
1 ,l' 1.
33. (D CD CD I: + II CY p. r 0 K"
CD1.
0 c,, 0 0 P.TIr 8 :,. a
(1) 4 P 3.4 . b IL a 0 0'..; II 0
g ri p,g,0,,,1 0 0 I ( 0 V I 'I. t'l M 'III 3C4 q p
.1-j m 1-; ,. ? p g 8 8' '1. II l'' '1
CD
i r' 0 3C C, IL ' Dii C
a tc1+ lc;I,3- "1 co 00 ,r 0 to o0P.0',1:06
fi '''',ct
ft.CD
,,. f:. i t;,:,.,,,i (i.
qi i, ( 1-, f?1 P. II 0 0 fo, III g0
6 0 0 3 004,L4g1,(,) .1 ,f
r 1, 0K. to
q- .1
II .1°I
0s ... I" 11
(,) 91. .
6 tt l' Iti. P g' '1 l'.
il 4, g g. - . ,
ti i. tt ') CI 10 I. 0 I....(r) 1,1', gl II a
I'. I S 11.
6I,
D a p UI " (A !
ICS* 0 0 tI0 tO I I- 11
0 p'l ao 0 I , 0 tiii 1 a k'., if
0 cl (3.. r,. It ,j 0 0irtD il i
0s It0 11, id 41 :-. .1,-, ;II 4!.
,p 2.: C., .,,r) .1 0. o
t-, L; u' 'o', g E il ° I .. 0 I) 1. ;_i' 0
ta3 q ii g. ,, ,. ,I0 '..3 I L op ,t
.: Ict t" LI! g oti' L4 ,4,1 0 CD ,g P 0 0oa P ,r) 9' I' 0 0
li I, , 1 . to .1
q g ,1 o 1 P. (1.. r , /0 I,
'g fi" g tl Pr ri .8 [it. 141
i-, Fr 11 1 i ,1 kl ii,'.: a L '

'V4)4
"}-1.
14
i4
41Q
r 441
1.
45,5
1il
0n
,.
4,1p
cl0
840
I I':i
8;8,1
nt)
:,
.' 1 1'1 4. 4'
40,il
I.:
04
g4
4
188)
el81
g.1
I.1.
'0
41
:4 8.)IGP
t;1
jj0.
t .IN
411,1.4
4-q4
I8'
.1
ti
4:Li,
O4.
.10
Pi
a11
14
4.,
r.r 44
4. Vn1:
08.
i 0i:
(r.
...
P.
41)... I0
1/41-4
0
54V8.
u, 4
,.....
n.9
tril
4:.,
V1.
1/14
,..V
54.).
.L:4,
11).
101. 4
CI
:I.4'
1.1'4 4
0
. 411
C.,
.4 .r ,
I.
.1)...
3.3
ii
el V1.
nV
1:C
lik
t:. 4
4'
4)0
f:?.
4.
04.1
ej44
p0
I.0
PI0
IA8
.C
I4'
.t-4/
rr
:I:
CP
Mot 4
li1
.i20
0C
P
ri,I'
r8.
I,>
00
. 4
..0
V14
?8.)
4,4
.00
V0
V)
4C
PC
P
14
G.
.04,
V'ri
ei0
4
84. 4
V11
4r.
4)Ltn , 4
4)
r.14
084
C.)
liC
C'441
'liI,
4 '
I:4:
fkC
.ici
:1.
4<
,1
0V
t, -1
4.1.9
1!:
4.
CI
0I.
V.
t:I..
Oti
I.P
0
-A00
041.
'I4,
`?ii
loo
c
tl0
.SV 1
0V
1.C
1
6:I
1114 40
Cl
0n
41g
44.44
4,4
i/0
4-1
444-11
101
fl.41
.1,4
V. 4P
I
41
I.r/
1...4C
Jv
1,4ag
O.
44-4
Vl
4)44
il41
030
5)
118
0J.,0
tO
AX
U01
4V
0
O:4
1--;
IV44
;,/,li
Vt-,
:,.,14 4
..r:
r 4I.O
4CI
0r 4
41
.4.4 0
op
.a
0.r4
4
'U11
14140
00
a.1
o..
r.-4 Va
N. 4
04)
O1'1
t100
.141:4
4-4I
111
S.
M
VI
61N
J-1
V0
OJ
01
0031
1.4
'g.V
)ti
S.
II4li
I:Si
04)
010
01:.1.,1
4101
9
400
0)II
il101
RF
14
0400
4.1g
4li
r 4.4
014
(-1,,0
ri
4)-ri
8.)il
t)1
O0
F.4-1
1 401
144)
981
1.1$
4$;
.fi84
0It
4.
:.8
0.0
.0.1
14n
,141)
.0j4'
ail
tiIP
VC
I.4 4
ii.E
i4
ac.
01
4
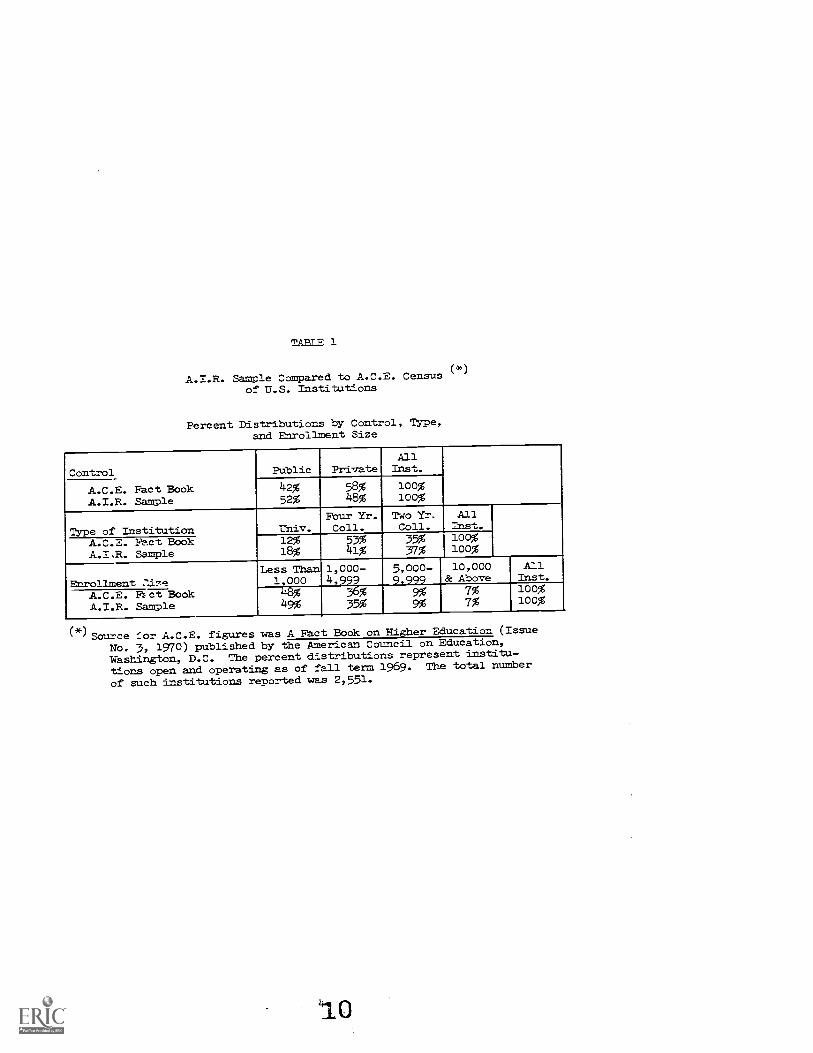
TABLE 1
(*)A.I.R. Sample Compared to A.C.E. Census
of U.S. Institutions
Percent Distributions by Control, Type,and FrirolIment Size
Control Public PrivateAll
Inst.
A.C.E. Fact BookA.I.R. Sapple
42%52%
58%48%
100%100%
Type of Institution Univ.Fbur Yr.Coll.
TWo Yr.Coll.
A/1Inst.
A-C.E. Fact BookA.I.R. Sample
12%18%
53%41%
35%37%
100%100%
Enrollment ::17e
Less Than1 000
1,000-4,999
5,000- 10,000& Above
AllInst.
A.C.E. Rot BookA.I.R. Sample
%49%
36%35%
..;,999
9%9%
7%7%
100%100%
(*) Source for A.C.E. figures was A Fact Book on Higher Education (Issue
NO. 3, 1970) published by the American Council on Education,
Washington, D.C. The percent distributions represent institu-
tions open and operating as of fall term 1969. The total number
of such institutions reported was 2,551.

TABLE 2
Percent of the Sample Group which Reported Having
An Institutional Research Office by Type anO*Control
of Institution and Enrollment Bizet
/
Type & Control of
Institution
Full Time Enrollment
All
Institutions
Lees Than
1,000
1,000-
4,999
5,000-
9,999
10,000-
19,999
20,000-
29,999
30,000-
& Above
Universities
Publicly Controlled
047
65
77
loo
86
61
Privately Controlled
828
4o
73
--
--
34
All Universities
437
57
75
loo
86
51
Four-Year Colleges
Publicly Controlled
27
35
70
loo
--
--
42
Privately Controlled
10
22
--
--
--
--
14
All Fbur-Year Colleges
10
27
70
100
--
--
19
Two-Year Colleges
Publiey Controlled
427
53
So
loo
--
34
Privately Controlled
230
--
--
--
--
5
All Two-Year Colleges
428
53
80
loo
--
16
Total Sample Group
PUblicly Controlled
632
63
79
loo
86
31
Privately Controlled
824
40
73
--
--
15
All InetitutiOne
728
A59
76
loo
86
23
(*) The numerical totals againet which these pereents were calculated are reported in detail in Appendix II.

THE NUMBER OF INSTTruTIONAL RESEARCH OFFICES
As Table 2 shows, 23% of the institutions which returned questionnaires
reported having offices or units whose primary responsibility is in the area
of institutional research. Table 2 also seems to inalcate that this pro-
yortion varies widely with control, type of institution, and enrollment size.
Fbr example, public institutions are twice as likely to have IR offices as
private institutions, and universities are more than twice as likely to have
IR offices than either four or two-year colleges. However, further analysis
reveals that these differences are very largely a function of enrollment
size with type of institution and control of institution playing only a
small part.
This is clearly shown in Table 3. Enrollment size was factored out of
the data by normalizing each of the sdb-groups to the enrollment distribu-
tion of the overall sample. This allows true comparison on the basis of
either control or type alone. The column entitled "Adjusted Score" Shows
that the entire difference between the proportion of universities reporting
IR offices compared to the proportion of four-year colleges reporting IR
offices can be attributed solely to the larger average enrollment size of
universities and not to any factor associated with type of institution per
se. Even two-year colleges fall only marginally below the population mean
when viewed In terms of the adjusted score. Similarly, the difference be-
tween public and private institutions is reduced substantially with the in-
fluence of enrollment size removed. Instead of a public institution figure
of 31% and a private institution figure of 15% (a net difference of 16 per-
centage points), the adjusted scores are 25 and 19, respectively. This
difference is still significant, of course, but is actually less thAn one
might expect. initially, IR offices existed primarily at public
6

TABLE 3
The Effect of Normalizing Type and Control of Inztitution
for Enrollment Size on the Prop!.tnsity to Have an TnctitutionalResearch Office
Type & Controlof Institution
No. ofInstitutions
In Sample
NO. Re-portingIR Office
% of TotalReportingIR Office
Adjustedscorel,*)
Universities 258 131 51% 25
Pour-Year Colleges 595 115 19% 25
TwoYear Colleges 541 89 16% 21
Total Sample 1444 337 23% 23
Public Institutions 744 233 31% 25
Private Institutions 691 101 15% 19
Total Sample 1444 337 23% 23
(*) Tonnollnent size was factored out by normalizing the subpopula -tions to the enrollment distribution of the overall sample.
Any enrollment size distribution could have been used, but
using the overall distribution yields a total adjusted score
which does not differ from the raw percent figure for the
total sample.
Institutions, having grown out of the need to supply budgetary and plmnning
data to state governments. Thus, to find private institutions only 6 points
below public insitutions (with the effect of enrollment size removed) in the
proportion reporting IR offices indicates that this historic disparity is
apparently de.areasing through time.
Returning to the sUbject of enrollment size, the reader can best assess
the importance of this factor as an indicator of an institution's propensitY
to have an IR office by loacing at the row labelled "All Institutions" in
Table 2. Among institutions with fewer thAn 1,000 full time enrollments,
only 7% bad IR offices, but each increment in size yields a higher percent
figure until virtually 100% of those institutions with enrollments of 20,000
and above reported having such a unit. Moreover, the range of percents by
enrollment category is almost equally broad and equally regular tor each
137

type of :not -.:tIon and each mode of control. The only irregularity is the
nimn of reported by publicly controlled four-year
collQges with enrollments, of lf_bs than 1.000. The simple size here fs small
(only instiutions out of 1,L141- fall into this category), and this may in
-1-tself have prod:iced a distorted result. ;,nother possible explanation is that
the four small colleges who reported havinE IR offices are new institutions
whose ormanizational structure was established in anticipation of future
:n any case, IR clearly seems to have found a pernPnent place for it-
self as a recognized organizational specialty. Francis Rourke and Glenn
Brooks in their book The Managerial Revolution in Higher Education (Baltimore:
The Johns HoPkins Press, 7.965) report a nuMber of findings concerning the
growth of IR and the various ways in which such officer operate. Unfortu-
nately little of their data is directly comparable to the results of the
currant survey, primarily because of a marked difference in sampl-ing tech-
nique.
The Rourke and Brooks survey was restricted to four-year institutions
in the United States, an::: the population consisted of all state institutions
but only a small sample (N=72) of community colleges and private institu-
tions. Moreover, in adking about the IR function, their auestionnaire was
phrased such that stitutions which had an individual staff member performing
IR work but no formal IR office could not be differentiated from institutions
which did have formal IR offices. :he effect of each of these factors is to
oppose the other: the restricted universe from which the sample derives
almost certainly excluded a number of institutions with TR offices, but the
confusion of 'fnriividuals with offices overstates the apparent number of
offices found among the institutions sampled. A measure of the effect of
this latter factor is the significantly higher percent of (four-year)
8

institutions reporting IR offices in the Rourke and Brooks data than in the
A.I.R. data, 45% compared to 29%. Also. unless one assumes that all insti-
tutions vith IR offices which were included in either the Rourke and Brooks
universe or the A.I.R. universe actually returned their questionnaires, the
fact that the earlier survey enjoyed an80% response compared to a 50% re-
sponse for the current effort would act to increase the count of IR offices
reported in the earlier year.
It is, of course, possible that these three factors simply cancel one
another, In which case the data from the two surveys are sufficiently com-
parable to give the reader a rough idea of the rate at which IR offices have
been established In recent years. /n this hope, and with due respect for
the preceding caveats, a few comparisons with the Rourke and Brooks data are
offered.
Their earliest figure, for the academic year 1954-55, showed only 15
IR offices nationally, with a full one-third of those having been established
just that year. By 1964-65 this figure had grown to 115, 21 of them newly
established. These figures compare to an estimated count of 220 (*) offices
reported at four-year institutions in the current survey. NO count of
nRwly established offices exists for 1969-70, however, because the A.I.R.
questionnaire did not request information on this point. But the data do
show a susteil-ed growth In the number of IR offices at a rate equivalent to
20% per year over the period 1955 to 1969, although the rate during the 1964
to 1969 period has slowed to approximately 15% per year.
An additional finding reported by Rourke and BroOks, and one that
(*)This figure represents the total of 337 offices reported less the 89
offices at two-year colleges and less an estimated 28 offices at
four-year Institutions In Canada.
15 9

corroborates the results of the present survey, is the importance of
enrollment size in stimulating the development of IR offices. Their data
showed that 72% of institutions with more than 10,000 students have such
offices compared to 20-% of institutions with fewer than 2,000 students en-
rolled. These percent figures are not directly comparable to the A.I.R.
data because of differences in grouping, but they do serve to illustrate the
principle involved.
OleraGES SCHEDULED TO OPEN DURING 1970-71
Although, as mentioned above, the questionnaire did not address itself
to the matter of newly established IR offices or tc plans for the establish-
ment of such offices, 27 institutions from the large ,:roup who had no office
during 1969-70 indicated that they were actively planning to initiate IR
offices during 1970-71. Since these responses were volunteered in the form
of written comments, they probably account for on2y a portion of the actual
nuMber of offices wh'.ch were scheduled to begin operation during the current
year, but this r%Amber still represents an 8% increase in the total number
of offices reported for 1969-70. This would Jruiicate that IR continues to
be in an active growth phase, although there is reason to think that the
rate of growth may have dropped somewhat fraa the recent 15% per annum cited
above. With most segments of higher education facing difficult brfigetary
situations In recent years, ftnds to establish new offices and units are not
readily available. Thus, many institutions, especially the smaller private
institutions which have limited resources even in the best of times, have
been forced to defer arzy formal move into IR activity until the future.
Nonetheless, these institutions represent the natural field for the growth
of IR as a profession, both because nearly all larger institutions already
10
16

have IR offices and also because TR offices have proven their utility at
institutions where they have been established.
TABLE 4
Institutions Planning to Initiate IR Offices
During 1970-71 by Type, Control, and Enrollment Size(*)
Type and Controlof Institution
PullTime EnrollmentLess Than
1,0001,000-4,999
5,000-9,999 Total
Universities
PUblicly ControlledPrivately Controlled
----
22
22
,
Total -- 4 4 8
Fbur-Year Colleges
PUblicly ControlledPrivately Controlled
23
1
4
1--
4
7
Total 5 5 1 11
Two-Year Colleges
Publicly ControlledPrivately Controlled
1
--51
1
--71_
Total1- 6 8
All Types
Publicly ControlledPrivately Controlled
33
87
42
1512
Total 6 15 6 27
(*) Counts reported in this table represent tallies of certain commentsvoluntarily supplied by respondents to amplify their responses
to questionnaire item 2.
FOr example, it is interesting to note that over 75% of the insti-'aztiorLs
which were planning to establisa IR officeshad enrollments of less than 5,000
students, and that there were nearly equal numbers of public and private
institutions. Also, there was a balanced representation of universities,
11
17
four-year colleges, and two-year colleges. See Table 4 for a complete break-
down of these 27 institutions by tybe, control, and enrollment size.
STATE 07 Orr= 7ENT7'AL INST777:70NAL 'ESEARCR A7:7:2:2772.
Also sf particular interest are the responses of those institutions whtc:.
do not have 17.7 offices of their own but are served by a state or other cen-
tral 77 agency. Ac Table 5 shows, there were ?7 such inntitutions. over
-327 of whioh were two-year collez7ec and ,1-'5',7, of which were publicly controlled.
There are no scmpara-ive data on which to draw. so it is hot possible
to assess the gro,,:th. if any. in the number of incttiono served ty cen-
tral 77. agencies. Fut f:r many small institutions this may be a solution to
the problem of need for IR services tut lack of funds to initiate a separate
office. As institutions grow. however. they apparently tend to undertake
their own IF work. Only 1 of the 97 institutions served by central agencies
had an enrollment greater than 10,032 students.
But these institutions are a significant element in the overall growth
of 1.7. They represent in number a group 25% as large as the total number of
institutions reporting 77: offices, and combrise 7% of the total number of
questionnaires returned. If this latter figure is added to the 23% who re-
norted having'IR offices and the 2% who indicated that they were in the pro-
cess of initiating such offices, nearly one-third (52%) of all institutions
in the United States and Canada naw use an IR office to assist in the evalu-
ation of their educational and administrative programs.
1218

TABLE 5
Institutions Served by State or Other Central Institutional Research
Agencies by Type, Control, and Enrollment Size
Type and Controlof Institution
Fullii me EnrollmentLessThan1,0oo
1,000-4,999
5,000-9,999
10,000-19,999 Total
Universities
Publicly ControlledPrivately Controlled
6--
3,,
--
,.,
--
:.,,,
--
Total 6 321 1 14
Four-Year Colleges
Publicly ControlledPrivately Controlled
36
65
1 --__
lo11
Total 9 11 1 -- 21
Two-Year Colleges
Publicly ControlledPrivately Cont-olled
452
111
----
--__
573
Total 47 12 -- -- 60
All Types
Publicly ControlledPrivately Controlled
558
216
5--
1 8314
Total 63 27 5 1 97(*)
(*) Totals include one institutionWhich did not indicate enrollment
size and two which did not -rleicate type. Mode of control was
shown in all cases.

F."-....ANCLV-.. =PORT F'OF 7.17=717ONAL RE..7FAFTH
In preparing the data on financial support, it was assumed that most
readers would be associated in some way with an instituticn of higher edu-
cation and that they would want to be able to identify the responses of
institutions similar to their own in terms of type, control, and enrollment
size. Fbr this reason, all tables dealing with aggregate support figures
were organized in ter= of these three variables, even though this led to
very small or even ze=o entries in many cells. Also, the reader should
keep in r4-,r, that this and all subsequent sections of tne report are based
on the responses of only those institutions which reported having an IR
office (N=337).
Table 6 shows total support for IR activity sil--,7--irized by mode of con-
trol w_.-2 enn.-11ment size. Tables 7, 8, and 9 show analogous figures for
universities, four-year colleges, and two-year colleges, respectively. Az
can be seen from the average support figures, enrollment size is once again
the critical factor, although mode of control is quite important as well.
Public institutions upend significantly =ore money on IR than do private
institutions, and this is particularly true among four-year colleges.
Interestingly, however, private universities, while less likely to have IR
offices than public universities, support them somewhat better where they
do exist.
The tables themselves are detailed and explicit, and they render un-
necessary an extended treatment of the findings on financial support here
in the text. But one characteris...lc of these financial support data de-
finitely:bears mention. Within enrollment size catagories, there is con-
siderable dispersion of responses around the mean, and this is true for
each of the slibpopulations represented in Tables 7 through 9. 7hus,
2.4
20

AIA
1,
'
el?
.',.:- L
2
1 III-1 I
.,
i'
u
1t1:11:
1t
II
11-'"1.144
1111111111"
14.1.,,,.,1-§i
1-.II'
i
.
,.T., .111
4
o.,
hai
I. 1tv
v
:
II
i0iih
MOOli
»:,14iii0o"
f
gkg1§11
lq§§§§§14R
: -;
- 14
...atiEitak
'...;
1'
!!

TABLE 7
Total Support for Institutional Research atUniversities by TyTe of Control and Enrollment Size
Total Support forInstitutional Research
Publ,:cly Controlled
FullTime Enrollment
Less Than1,000
1,000-4,999
5,000-9,999
10,000-19,999
20,000-29,999
30,000-And Above
Enroll.Not
indicated Total
$ 1,000 - $ 9,999 __ 1 2 -- 1 -- -- 4
$10,000 - $19,999 -- 1 5 3 __ __ __ 12
$20,000 - $29,999 -- 4 10 -- -- -- 17
$30,000 - $39,999 __ 2 5..,
6 __ __ __ 13
$10,000 - $59,999 __ 3 6 8 1 __ __ 18
s6o,000 - $99,999 __ -- 3 a 3 1 1 16
0100,000 and Above -- -- 1 1 3 5 11
No Amount Shown 4 2 1 -- --
Total ad 31 30 El 6 2 9:L
Average Supporta) $28,150 $35,550 $50,900 $98,900 $169,500 $263.800 $53,750
Privately Controlled
$ 1,000 - S 9,999 _- __ __ - __ --
$10,000 - $19,999 1 3 2 3 __ __ 9
$20,000 - $29,999 - 3 2 1 -- -- 6s30,000 - $39,999 -- -- 2 -- -- -- -- 2
$40,000 - $59,999 -- 3 3 __ __ -- 1 7
$60,000 - $99,999 - 1 1 3 __ -- __ 5$100,000 and Above -- 2 -- 1 -- -- 3
N. Amount Shown -- -- -- -- -- -- -- --
Total 1 12 10 a __ a 32
Average Support(1) $12,000 $88,050 $39,100 $54,750 __ __ A 49.000 S60,550
All Univeisities(2)
$ 1,000 - $ 9,999 1 2 -- 1 -- -- 4
$10,000 - $19,999 1 7 7 6 __ - __ 21
$20,000 - $29,990 7 12 4 -- -- -- 23
$30,000 - $39,999 -__ 2 7 6 __ __ __ 15
1340,000 - $59,999 6 9 8 1 - 1 25
$60,000 - $99,999 __ 1 5 11 3 1 1 22
$100,000 and Above -- 2 1 2 3 5 1 14
No Amount Shown -.. 4 2 1 __ __ __ 7
Total 1 30 45 38 O 6 3 131
Average Support(1) $12,000 $55880 $36,400 $51,750 $98,900 $169,550 $192,200 $59,250
(1) Based on the =her of actual responses to this item i.e. the total less the number of non-responses).
(2) ,Igure0 include one college which did not indicate 'whether it 1.ms publicly or privately controlled.
16 2 2

TABLE 8
Total Support for Institutional Research atPbur-Year Colleges by Type of Control and Enrollment Size
Total Support forInstitutional Research
Publicly Controlled
FullTine Enrollment
Less Than1,000
1,000-4,999
5,000-9,999
10,000.-
19,99920,000-29,999
30,000-And Above
Enroll.Nbt
Indicated Total
$ 1,000 - $ 9,999 __ 3 1 -- -- -- -- 4
$10,000 - $=9,999 __ 4 1 - -- -- - 5
$20,000- $29,999 2 7 7 1 __ __ 17
$30,000 - $39,999 1 3 2 2 -- -- - 8
$90,000 - $59,999 -- -- 2 - -- - - 2
$60,000 - $99,999 __ 4 -_ __ __ -- __ 4
$100,000 and Above - 2 2 -- - - 4
Nb Amount Shown 1 a - 4
Total 4 27 26 3 __ 59
Average Support(l) $31,750 $49.300 $947,300 $33,550 -- - - $47,000
Privately Controlled
$ 1,000 - S 9,999 10 7 -._ __ -- __ 17
$10,000 - $19,999 12 6 __ __ __ 18
$20,000 - $29,999 3 3 __ __ __ 11
$30,000 - $39,999 -- 1 __ -- -- 1
$40,000 - $59,999 1 3 -- -_ __ 4
$60,000 - $99,999 -- __ __ __ -- --
2100,000 and Above -- -- -- -- -- --
No Amourt Shown , -7t
Total 39 34 -- - 64
Average Support(l) $13.250 $20,700 $16,900
All Four-Year Colleges(2)
$ 1,000 - $ 9.999 10 11 1 __ -- 22
$10,000 - $19,999 12 10 1
:71 1 EE-- -- 23
$20,000 - $29,999 5 15 7 __ __ 28
$30,000 - $39,999 1 a 2 2 -- -- - 9
$940,000 - $59,999 ,.,. 3 2 - -- - -- 6
$60,000 - $99,999 __ 4 - -- - 4
$100,000 and Above - 2 2 -- -- - - 4
Nb Amount 59own 1 -- - - 19
Total 5 2 16-
-_ -- -- 115
Average Support(1) $15,150 $34,400 $49,300 33,350 -- - -- p30,850
(1) Based an the number of actual responses to this item (i.e. the total less the numberof non-responses).
(2) Figures include one university which did not indicate tthether it was publicly or privately controlled.
32 3

TABLE 9
Total Support for institutional Research at
Two-Year Colleges by Type of Control and Enrollment Size
Total SuppOrt forinstitutional Research
Publicly Controlled
Ful 1Time Enrol neat
Less Than1,000
1,000-4,999
5,000-9,999
10,000-19.999
20,000-29,999
30,000And Above
Enron.Not
Indicated TOtal
S 1,000 - S 9,999 2 6 __ -- - -- 1 9
$10,000 - $19,999 3 5 2 -- -- -- 10
320,000 - 329,999 2 23 2 1 1 __ 1 30
$30,000 - $39,999 2 5 4 2 -- 1 14
$40,000 - $59,999 __ 1 4 - - __ 5
$60,000 - $99,999 1 1 1 - __ __ 3
$100.000 and above __ _- 1 - - __ 1
No Abount Shown -- 7 3 1 -- -- 11
Total 10 48 17 4 1 -- 3 83
Average Sapport(1) $27,950 $23,250 849,200 $33,750 $27,0400 __ $20,750 $29,350
Privately Controlled
$ 1,000 - $ 9,999 1 1 -- -- -- -- 2
$10,000 - $19,999 -- 1 -- -- --
$20,000 - $29,999 -- __ --__ __ -
$30,000 - $39,999 __ -- -- -- -- --
$40,000 - $59,999 __ 1 __ __ __ 1
$60,000 - $99,999 __ -- __ __ __ -$100,000 and Above -- -- -- -- -- --
No Amount Shown , --
Total 2 35
Average Support(1) ° 5,300 $21,150 __ __ __ $13,760
All TwoYear Colleges(2)
$ 1,000 - $ 9,999 3 7 -- -- -- 1 11
$10,000 - $19,999 3 6 2 -- -- -- 11
$20,000 - 329,999 2 23 2 1 3.-- 1 30
$30,000 - 339,999 2 5 4 2 __ 1 14
$40,000 - $59,999 -- 2 4 -- -- -- 6
$60,c J - $99,999 1 1 1 -- -- __ 1
$100,000 and Above -- -- 1 -- -- -- I
No Amount Shown 1 8 3 1 __ -Total 12 SE 17 -4 1 -- 3 9
Average Support(1) $25,900 $27,100 $49,200 $33,750 $27,000 -- $20,750 $28,700
(1) Based as the number of aCtual resPeMses tothis item (i.e. the total less the number of non-respossss).
(2) pigures Include one two-year college which did notindicate whether it was publicly or privately
controlled.

there exists no clear norm upon which the reader can focus. Except In
the very largest and very smallest enrollment categories, there are a
significant numl-ar of responses at each of the levels of total support.
This is partially true because the classification intervals used in these
tables are broader at the higher levels of saPPort, which artificially in-
creases the number of responses in hose cells compared to cells with
smaller intervals. Nonetheless, it is also true that IR offices are fanded
at levels which vary widely from institution to institution, and thse var-
iations are not explained by differences in type, modo of control, or en-
rollment size.
Fbr example, there are Institutions with enrollments of 5,000 to 9,999
students which allocate as little az $.65 per student to IR while other in-
stitutions of equal size allocate In excess of $12.00 ber student for the
same purpose. Obviously, these differences merely reflect more Important
differences in the overall availability of funds to the institution, the
role of the IR office, and the ability of the IR director to compete for an
Increased share of the funds that are available. ln any case, the average
support figures should be used with caution. /t is interesting to note
that the average support for IR activity during 1969-70 vas $42,150 and
that universities were 406 above the mean while two and four-year colleges
were 30% below. However, this kind of analysis invites one to overlook the
fact that many two-year colleges fund their TR offices more generously tlls
do universitlem or faar-year colleges of the same enrollment size.
Table 10 is an interesting supplement to the above discussion. It shows
rhe annunt of salcpor".. for IR at institutions of various tyPes sTld sizes
expres. as a percent of the total operating budget for the institution.
The figures are, course, very small, with the average baing less than
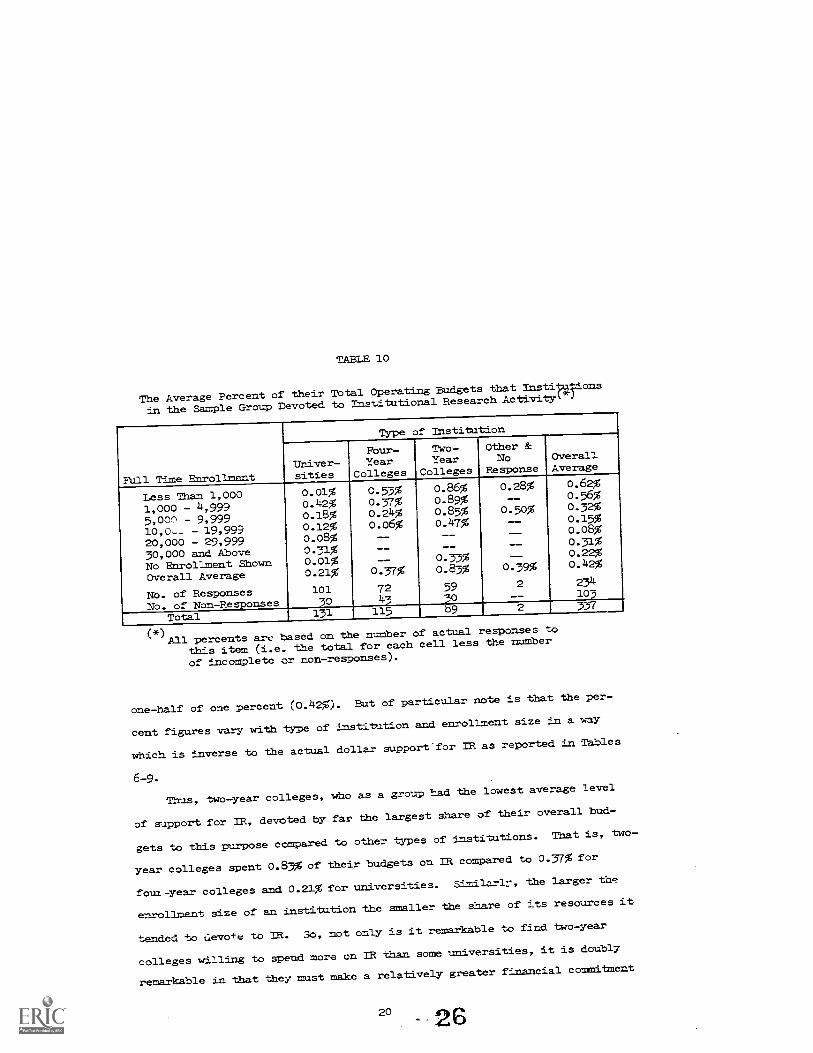
TABLE 10
The Average Percent of their Total Operating Budgets that Institulzions
In the Sample Group Devoted to Institutional Research ActiyityA*)
Ftll Time Enrollment
Type of Institution
Univer-sities
Fbur-Year
Colleges
Two-Year
Colleges
Other &Nb
ResponseOverallAverage
Less Than 1,000 0.01% 0.53% 0.86% 0.28% 0.62%
1,000 - 4,999 0.42% 0.37% 0.89% -- 0.36%
5,00' 9,999 0.18% 0.24% 0.85% 0.50% 0.32%
10,0- - 19,999 0.12% 0.06% 0.47% -- 0.15%
20,000 - 29,999 0.08% -- -- -- 0.08%
30,000 and Above 0.31% -- -- -- 0.31%
No Enrollment Shawn 0.01% -- 0.33% -- 0.22%
Overall Average 0.21% 0.37% 0.83% 0.39% 0.42%
No. of Responses 101 72 59 2 234
Nb. of Non-Responses 30 43 0 -- 103
Total 131 115 9 2 337
(4') All percents art- based an the nuMber of actual responses to
this item (i.e. the total for each cell less the nutber
of incomplete or non-responses),
one-half of one percent (0.42%). But of particular note is that the per-
cent figures vary with type of institution andenrollment size In a way
which is inverse to the actual dollar support-for IR as reported in Tables
6-9.
Thus, two-year colleges, who as a group had the lowest average level
of support for IR, devoted by far the largest qllare of their overall bud-
gets to this purpose compared to other types of institutions. That is, two-
year colleges spent 0.83% of their budgets on IR compared to 0.37% for
foul-year colleges and 0.21% for universities.Simi1ar1r, the larger the
enrollmPnt size of an institution the smaller the shame of its resources it
tended to clevote to IR. 30, not only is it -e-rmrkable to find two-year
colleges willing to spend more on IR than some universities, it is doubly
remarkable in that they must make a relatively greater finPncial commitment
2026

In order to have such an office at all. What seems to be taking place is
that there is a certain minimum efficacious size for an IR office and to
fund even this basic unit requires more of the resources of a small college
or university than of a large one.
SOURCES OF FINANCIAL SUPPORT
Tables 11 and 12 show quite clearly that two sources of funds account
for nearly all financial support for IR in the United States and Canada.
Moreover, one of these, regularly budgeted institutional funds, itself
TABLE 11
Percent of Total Supnort for Institutional Research
Activity Derived from Regularly Budgeted institutional Funds
Percent of TotalSupport for IR(l)
Type of 'Institution
Univer-sities
Pamir-Year
Colleges
Two-'Year
Colleges
Other &Nb
Response Total
1 % - 45% 4 11 4 -- 19
46% 55% 2 4 4 lo
56% - 65% 3 2 2 -- 7
66% - 75% 3 1 2 -- 6
76% - 85% lo 3 3 __ 16
86% - 95% 12 5 2 -- 19
96% - l00% 87 68 54 2 211
No Re onse 10 21 18 -- 49
TOtal 131 115 89 2 5,(
Average Percent(2) 93% 86% 90% l00% 90%
(1)
(2)
Percent figures In Tables 11, 12, 13, and 14 were grouped such that
they may be easily compared from table to table. The group Inter-
vals are either identical, or where one table is more det-Piled
another, aggregation of the detail will produce figures directly com-
parable to those Shown elsewhere at higher levels of summarization.
Bold type entries in the raw headings ineicate the upner and lower
bounds of comparable groupings.
Based on the rumber of actual responses to this item (i.e. the total
less the nuMber of.non-resmonses).

accounted for an average of 90% of all IR support. By type of institution
(which is used here as a rough expression of enrollment size as well as to
describe the scope of tLe academic program), there was almost mo variation
from the sample mean. The range was only 7 percentage points, with univer-
sity IR offices deriving the high of 93% of their support from regularly
budgeted institutional funds and offices at four-year colleges deriving the
law of 86%. Nbreover, the overall distribution was tightly clustered around
the mean. Some 88% of the offices received at least three fourths of their
support from this one source (see Table 11).
The second major source of financial support for IR was through grants
and contracts with governmental or other outside agencies (see Table 12).
Fewer than 20% of the insti-bitions in the sample had outside support, out
this source of funding was definitely of greater importance to two and
four-year colleges tl-,Pr, to universities. Nbre of the former institutions
had outside funding (20% compared to 12%), and this funding represented a
larger average Share of their budgets (9% compared to 3%). In fact, if an
IR office had outside support, it tended to be a significant factor in the
total fundia. The average percent contributed by outside agencies to
offices that received at least some outside support was over 40%.
Overall, however, the average IR office received 7% of its support from
outside sources and 90% from regularly budgeted instiaztional sources. This
left 3% to come from supplementary budget allocations, recharge income, and
miscellaneous sources. Of these, the least Important lott perhaps most in-
ter?sting was recharge Income. Only 10 offices had income from recharges
for services rendered, although one university listed this as having pro-
vided log% of itz IR support.
22 28

TABLE 12
Percent of Total Support for Institutional ResearchActivity Derived from Grants and/Or Contracts with
Outside Agencies
Percent of TotalSupport for TH(1)
Type of Institution
Univer-sities
Pour-Year
Colleges
Two-Year
Colleges
Other &Nb
Response Total
5 3 2 -- 10
6 % - 15% 2 3 1 __ 6
16% - 25% 2 1 4 -- 726% - 35% 1 1 -- -- 2
36% - 45% 2 4 1 -- 7
46% 55% -- 4 3 __ 756% - 100% 3 8 6
No Resnonse 116 91 72 2 281
Total 131 115 89 2 337
:verage Percent(2) 35 10% 9% __ 7%
(1) Percent figures in Tables 11, 12, 13, and 14 were grouped such thatthey may be easily compared from table to table. The group inter-vals are either identical, or where one table is more detailed thananother, aggregation of the detail will produce figures directly com-narable to those shown elsewhere at higher levels of summari,ation.Bold type entries in the raw headings indicate the upper and lower
bounds of comparable groupings.(2) In this calculation, non-responses were treated as zero entries so that
these percents would be additive to those shown in Table 11.
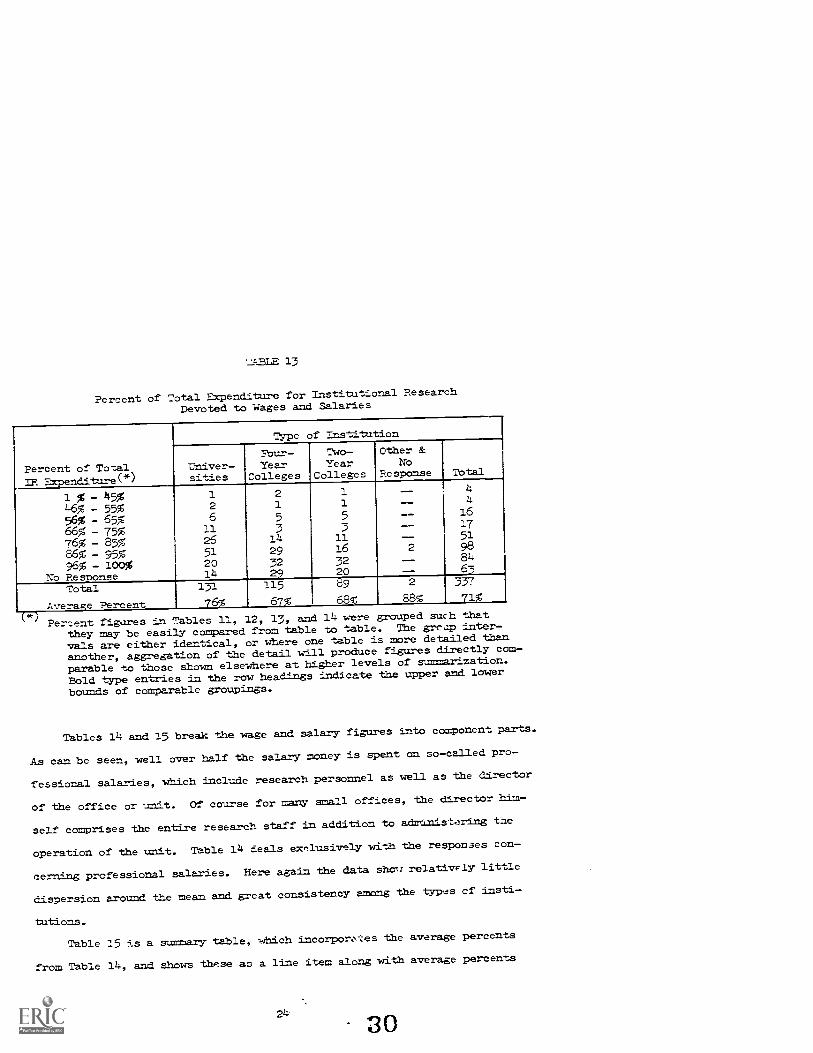
WAGE AND SALARY EXTPE:U'ITUPES
It is normal, particularly in adminstratI;ve and research work, for wage
and salal-y payments to be largest single category of exnense. As Table
13 shows, 77. off4ces not only conform to this rule, but on the average devote
over 70% of their available resources to paying the-J.r. employees. And, as
'with much of the expenditure data, there were only minor variations from
this mean percent among the three types of institutions_ Over 95% of all
;'.nstf_-tations in the sa=ple spent more than 557: of their resotrces on
and sal.aries, and a fur 25% of the respondents spent 965 or more of their
funds for this purpose.
29- 23
-t:"T.F 13
Percent of Total Expenditure for Institutional ResearchDevoted to Wages and Salaries
Percent of TotalIR Expenditure(*)
Type of institution
Univer-sities
Four-Year
Colleges
Two-Year
t._
Colleges
Other &NO
Response Total
1 % - 45% 1 2 1 __ 4
46% - 55% 2 1 1 -- 4
56% - 65% 6 5 5 .... 16
66% - 75% 11 3 3 _ 17
76% - 85% 26 14 11 -- 51
86% - 95% 51 29 16 2 98
96% - look% 20 32 32 __ 84
NO Resoonse 14 29 20 -- 63
Total 131 115 $9 2 337
Averaze Percent 76% 67% 68% 88% 71%
Percent figures in Tables 11, 12, 13, and 14 were grouped such that
they may be easily compared from table to table. The grcap inter-
vals are either identical, or where one table is more de+-q_iled talpn
another, aggregation of the detail will produce figures directly com-
parable to those shown elsewhere at higher levels of summarization.
Bold type entries in the raw heaeings irrilcate the upper and lower
bounds of comparable groupings.
Tables 14 and 15 break the wage and salary figures into component parts.
As can be seen, well over half the salary money is spent on so-called pro-
fessional salaries, which include research personnel as well as the director
of the office or unit. Of course for many small offices, the director him-
self comprises the entire research staff In addition to adurfcnistering the
operation of the unit. Table 14 deals exnlusively with the responses con-
cerning professional salaries. Bere again the data show relativFly little
dispersion around the mean and great consistency among the types cf insti-
tutions.
Table 15 is a summary table, which incorpor:tes the average percents
from Table 14, and shows these as a line item along with average percents
24-

TABLE 14
Percent of Total Expenditure for Institutional ResearchDevoted to Salaries of Director and Professional Reseamch Staff
Percent of TotalIR EXpenditure(*)
Type of Institution
Univer-sities
Pour -
YearColleges
TWo-Year
Colleges
Other &NO
Response Total
1 % - 15% 1 1 _- -- -,
16% - 25% 4 2 2 -- 8
26% - 35% 5 4 2 -- 11
36% - 45% 6 2 2 -- 10
46% - 55% 27 lo 8 -- 45
56% - 65% 28 11 11 1 51
66% - 75% 25 23 21 1 70
76% - 85% 13 15 9 -- 37
86% - 95% 4 9 5 __ 18
96% - 100% 2 8 8 -- 18
No Response 16 30 21 -- 67
Total 131 115 89 2
Average Percent 53% 51% 53% 65% 52%
(*) Percent figures in Tables 11, 12, 13, a-me; 14 were grouped such that theymay be easily compared fram table to table. The group intervals areeither identical, or Where one table is more detailed than another,
aggregat2.on of the detail will produce figures directly comparableto those shown elseWhere at higher le7els of summarization. Italicized
entries in the row headings indicate the upper and lowe- bolmeg cr`'
comparable groupings.
for other wage and sal-ry categories to reach an overall average salary per-
cent that corresponds to the total line In Table 13. No other category of
wage and salary expense vas of the order of magnitude of professional sal-
aries, but paynents to clerical staff were of definite-significance and
accounted for an average of 12% of a21 TR funds expended. Payments to sys-
tems pAlysts, programmers, and so-called "other stafr' accounted for the
remainder of wage and salary expenditures.
3 1,

TABLE 15
Average Percent of Total ,-cpendinare for institutional ResearchDevoted to Wages and Salaries by Type of Institution and
Type of Employee
Type of Employee
Type of Institution
Univer-sities
53%
:bur-YearSolleges
51%
Two-YearColleges
53%
All Types
52%Professional Staff(-)
syst.r19 Analysts 4 1% __ (2) 2%
Programmers 1% 1% 1% 1%
Clerical Staff 14% 11% 11% 12%
Other Staff 4% 3% 3% 4%
subtotal 76% 67% 68% 72%
Non-Salary ExpenseC3) 24% 33% 32% 29%
Total 100% 100% 100% 100%
(1) Includes director.(2) True value not zero, but toc small to be recorded as a whole percent.
(3) See Table 17.
FULL TINE EOUIVALMIT STAFF
Staffing figures, which are displayed in Table 16, parallel the distri-
bution of sa/ary figures by type of employee, although there are greater
differences among the types of institutions. That is, all institutions in
the sample seemed to devote their resources to wages aTre sCaries to much
the same extent, and the proportiorls1 distribution arlacg types of employees
was also quite similar. lEcwever, previous data have shown that universities
spend, on the average, twice as much an IR as co either four or two-year
colleges, and it is this that explAing the total full time equivalent staff
figure of 4.3 for universities compared to 1.7 and 2.1 for the other types
of institutions, respectively.
It is also interesting to find the average two-year college with a
staff figure higher than that for the average four-year college. The entire
26 3 2

TABLE 16
Average NuMber of Full Time Equivalent Institutional ResearchStaff by Type of Institution and Type of Employee
Type of Employee
Type of Institut4an
Univer-sities
Fbur-l'earColleges
^wo-YearColleges All Types
Professions' Staff(1)Systems AnalystsProgramm..rsClerical Staf'O ther Staff
2.2.2
..-
1.6.2
.9
.0 (2)1.-
-5.2
.9
.0 (2)7
-9.2
1.4.-.1
1.0.2
Total 4.3 1.7 2.1 2.8
Includes director.
True value not zero, but too anal to be recorded with ame decimal
difference of 0.4 FTE occurs in clerical staff, which very likely bespeaks
differences in tLe type of wnrk these offices normally undertake. Also
likely is chat average salary levels at two-year colleges are slightly
lower than at faur-year colleges, enabling the former to employ more people
on fewer dollars.
In any case, the typical L. office is not a large operation. It em..
ploys fewer than three full-time equivalent staff am a total budget of
roughly S40.000. Seventy percent, or $28,000, goes toward wage and salary
payments, leaving $12,000, or $l,WO per month, for telephone service,
supplies, and all the other items necessary to keep the unit function4ng.
Moreover, a substantial proportion of the offices in the sample, perhaps
as high as 45%, get along with fewer than 1 0 professional staff and a .5
/Pm clerical staff presumably consisting of a secretary who is shared with
soms :Jth....r office or department

OTHER AREAS OF -APENDIWEE
In addition 7.c e salary data discussed above, respondents were
asked to indicate what percent of.their total resources they spent in five
other areas of expenditure. These were computer time, other electronic
data processing expense, publication of roports or other documents, equip-
rant and furniture, and an omnibus .7ategory called "Gther EXpense". Also .
with regard to computer time, those IR offices which were not required to
pay for time vmre asked to supply an estimate of the number of hours of
subsidized time they used.
Internal checking of the salary responses indicated that they were con-
sistent, logical, and could be manipulated arithmetically without diz;torting
the result. This was not the case with the non-salary expensa figures. A
nu7.iber of responses had to be disoarded or were left blank, and those figures
which were provided seemed tc be consistently law. That is, the average
InLtitution accounted for less than 90% of its expenditures when all per-
cent figures were summed. Apparently many respondents were less conscien-
tiaus about the accuracy of their data toward the end of the auestionnaire,
especially in view of the fact that a substantial amount of accounting ana-
lysis would have been necessary in order to break the expenses Into the
categories shown.
There were several ways in which the data could have been adjusted to
compensate for the condition just noted, but it was felt these would pro-
bably cause more distortion than they wohld remedy. Thus, the only adjust-
ment that was made was to arbitrarily increase the category labelled "Other
Expenses" such that each column in Table 17 would add to 100%. All other
entriea in Table 17 are true averages of data actually supplied on the ques-
tionnaires. Even without the adjustment, however, "Other EXpenses" was
equal to "Clerical Staff" as the sec.ar.1'. largest experse category.
28 34
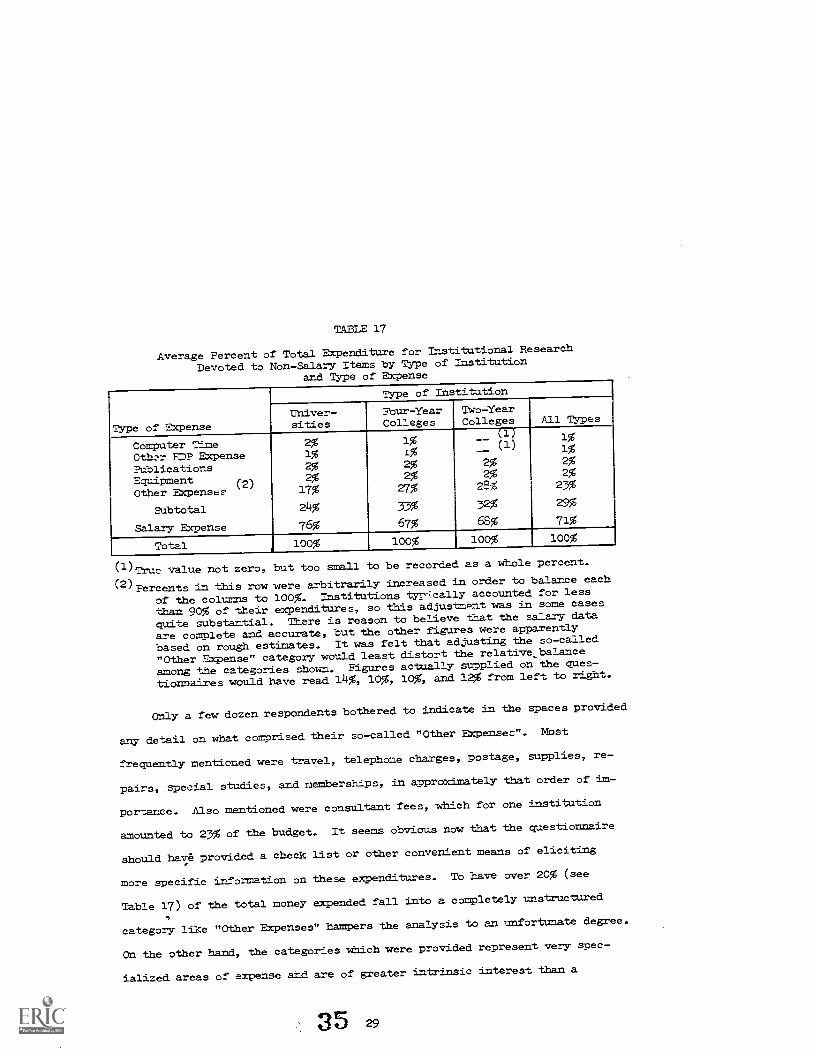
TABLE 17
Average Percent of Total Expenditure for Trqtitutional Research
Devoted to Non-Salary Items by Type of Institutionand Type of EXpense
Type of Expense
Type of Institution
Univer-sities
Fbur-YearColleges
Two-YearColleges All Types
Computer TimeOthz.r EDP EXpensePUblicationsEquipment (2)Other Expenses
Stibtotal
Salary Expense
2%1%2%2%17%
24%
76%
1%1%2%2%
27%
33%
67%
(1)(1)
2%2%28%
32%
68%
1%1%2%2%23%
29%
71%
Total 100% 100% 100% 100%
(1) True value not zero, but too small to be recorded as a whole percent.
(2) Percents in this row were arbitrarily increased in order to balance each
Of the columns to 100%. Institutions typ-;cally accounted for less
than 90% of mheir expenditures, sothis adjustme,nt was in same cases
quite substantial. There is reason to believe that the salary data
are complete and accurate, but the other figures were apparently
based on rough estimates. It was felt that adjusting the so-called
"Other Expense" category would least distort the relative.balance
among the categories shown.Figures actually supplied on the ques-
tionnaires would have read 14%, 10%, 10%, and 12% from left to right.
Only a few dozen respondents bothered to indicate in the spaces provided
any detail on what comprised their so-called "Other EXpenses". Nbst
frequently mentioned were travel, telephone charges, postage, supplies,
pairs, special studies, and meMberships, in approximately that order of
re-
im-
portance. Also mentioned were consultant fees, which for one institution
amounted to 23% of the budget. It seems obvious now that the questionnaire
should have provided a dheck list or other convenient means of eliciting
more specific information on these expenditures. To have over 20% (see
Table 17) of the total money expended fall into a completely unstructured
category like "Other Expenses" hampers the analysis to an rm?ortunate degree.
On the other hand, the categories which were provided represent very soec-
ialized areas of expense and are of greater intrinsic interest than a
35 29

detailed 1,rcakdown of the more or less routine business of keeping an office
supplied with postage stamps, mimeograph paper and the like.
Table 17 provides data on three areas of enpenditure which help to
describe the way in which IR offices occupy a middle ground between radi-
tional research and administrative! units. It is someWhat surprising, for
example, to find that "Computer Time" and "Other EDP Expense" represent a
combined total of only 2% of IR budgets on the average. Even at universities
with their larger enrollments and relatively larger IR offices, this figure
was only 3%. But at the same time, the direct cost of producing publica-
tions was also 2% of the total expense. In a research-oriented field
dealing with such things as enrollment statistics, survey results, and cost
studies, one would expect to find more emphasis on computer usage. Yet it
is also true that few purely admimistrative units produce formal publica-
tions to the extent of 2% of their overall budgets.
One reason for the seemingly rinimpl use of computer time is the exist-
ence of substantial amounts of subsidized time available to many IR offices.
As noted above, data on the amount of such time were requested, and these
data strongly suggest that sUbsidized time was the primary source of cam-
puting capacity for IR offices In general. The average institution In the
sample usecl just under 20 hours of sUbsidized computer time, and even at a
very conservative valuation of $50 per hour this is equivalent to an addi-
tiorral $1,00C of support and would Increase the proportional expenditure for
computer time from 1% to 3%. Moreover, if the true value of this time is
greater than $50 per hour, as it probably is, the combined figure for all
data processing including computer time might amount to as much as 5% or
more of the total. This would be mre in line with what a research unit
might spend, but it is questionable whether research units would have as
easy access to sUbsidized time as administrative units.
Thc sprea,1 of IR offices which occurred during the decade of the
1960's was concurrent with the equally rapid spread of electronic computing
equipment among institutions of higher education. Given this fact plus the
quantitative nature of many IR problems, it was to be expected that IR
offices 'iauld be regular users of such equipment. But Tshlezi 15, 16, and
17 taken together show that IR offices are not, on the average, heavily In-
volved with the design and ,Tnintenance of complex information systems.
Systems analysts and programmers, despite their relatively high pay
retes, account for a combined total of only 3% of the IR budgets and in
number comprise only 7% of the full-time equivalent staff. EVen at univer-
sities, altholigh 5% of IR budgets go to systP.ms wrid programming personnel,
these employees still represent the same 7% of total staff.
In sum, the distribution of expenditnres for both salary and non-salary
itPms shaws that IR offices are oriented toward analysis and special pro-
jects rather than toward the routine production of basic data or the actual
operation of ariministrative data processing facilities. Research and cleri-
cal salaries plus the cost of postage, telephone service, and supplies
account for 87% of IR expenditures, and this, in a very broad sense, defines
the role which IR has assumed on campuses In the United States and Canada.
3 731

SUMMARY
1. Of the institutions in the sample group, 23% had IR offices operating on
their campuses as of the fall 1969 term.
2. The propensity of an ins' ..:tion to have an IR office was a direct func-
tion of its enrollment size, 62thoilei public institutions were more
likely to have slch offices than private institutions.
3. The number of IR offices appears to have grown at a rate of roughly 15%
per year in rec^nt years.
4. If Institutions which were actively planning to initiate IR offices dur-
ing 1970-71 are combined with thicie served by state or other central IR
agencies and this figure is added to the number of institutions which
already have IR offices of their own, just under one-third (32%) of all
institutions In the United States and Canada are currently served by an
IR facility of some kind.
5. Average levels of financial support for IR offices varied widely with
enrollment size. Overall, however, the average figure for institutions
in the sample group was $42,150 per year.
6. The primary sources of financial support for IR offices were regularlybudgeted institutional funds and grants or contracts with outside
agencies. The former accounted for 90% of IR support funds
7. For the sample group as a Whole, 71% of the total expenditures went for
wage and salary payments with roughly another 20% devoted to office
sup-Plies, travel, communications, and miscellaneous.
8. The average IR office had a staff of 2.8 fal-time equivalent employees
who fell primarily into the professional research and clerical categories.
9. A figure based on an estimated value for subsidized computer time com-
bined with dollar amounts iTulicated for paid computer time and other
data processing expense dhows that the average IR office spent 3% - 5% of
its resources on data processing and computing.
32

APPEND= I
THE ASSOCIATION FOR INSTITUTIONAL RESEARCH
October 12, 1970
To The President:
The Association for Institutional Research is a non-profit organization
of academic and administrative professional members of institutions and
agencies of higher educatiaa. Its purpose is to advance research leading
to improved understenriing, planring and operation of such institutions.
Toward that end, the Association is currently conducting a survey to deter-
mine the level of financial support for the institutional research function
at colleges and universities in the United States and Canada. Many insti-
tutions have recently initiated or axe in the process of initiating offices
of institutional research, and it is our hope that the results of this
survey will be of benefit to them and to all others who are concerned with
improving the educational process through research and planning
If your institution has an office or bureau organized for institutional
research or if there exists an ad hoc activity which performs this functionv
will you please arrange to have the attached questionnaire completed and
returned in the envelope provided. If no such activity is recognized at
your institution, we still aak that you provide answers to questions 1 and 2
and return the questionnaire to be included in our count.
It is our intention to pUbliSh a brief report based on the findings of
the survey, although the anonymity of Ind_L-idual institutions will be care-
fully preserved. To insure this, all returns are routed directly to the
public accounting firm of Touche Ross & Company in San Francisco Where the
envelopes will be opened and discarded and an initial tally of the results
will be made. I would very much appreciate having your reply by NoveMber 30,
1970. Copies of the results can be obtained by writing to me at the address
shown below. Thank you for your assistance.
Sidney SuslawPresident
Office of Institutional ResearchRoom 210 Building T-8University of CaliforniaBerkeley, Ca. 94720
39 33

APPENDIX I (continued)
SURVEY OF =ANC:CAL SUPPORT FOR MVS21TuTI0NAL REtARCH
Your responses to the following questions will enable the Associationfor Institutional Research to answer questions directed to it concerningthe growth of institutional research as an organizational specialty In higher
education. Where precise Information is not available, estimntes may besUbstituted, but we would appreciate your making an effort to answer all
qUestions. Dollar amounts =ay be rounded to the nearest thousand 1.71d Ter-cents to the nearest whole number.
1. Institutional Profile
Please answer items A, B, and. C below by marking t:ie box near the entrywhich describes your institution.
Control of Institution
ElPublic OPrivate
TYpe of Institution
ODniversity OFOur-Year
Average regular term enrollment
FUll-Time Students
ElFewer than 1,000
01,000 to 4,999
0 5,000 to 9,999
0 10,000 to 19,999
ED 20,000 to 29,999
030,000 or more
2. The Tnstitutional Research Function
College ElTwo-Year College
during the 1969-70 year.
Part-Time Students
EDFewer than 1,000
01,000 to 4,999
05,000 to 9,99
010,000 to 19,999
020,000 to 29,999
030,000 or more
Does yourity is in
1Yes
institution have an office or unit:whose primary responsibil-the area of institutional research?
ONb EA state or other central agency whichhas this function serves our needs.
If your answer to question 2 was other than/es, your questionnaire lo nowcomplete. Please return it In the enclosed envelope.

APPENDIX I (continued)
3. Financial Support for Institutiona/ Research in 1969-70
A) What was the total dollar amount allocated to
institutional researah from regular institutional
funds at the beer,r-Tmg of the 1969-70 fiscal year?
B) If additional allocations of regular institutionalfunds were made during the fiscal year, please inrit-
cate the total amount of such additional allocations. $
C) What was the total revenue earned by insti-Mitional
research through recharges for services rendered to
other organizational units in your institution?
D) What was the total amount received fram grantsand/or contracts with autside agencies?
E) What was the total amount received fram sourcesothe- tlinr, those Shown above?
If this is a signIficant proportion of the totalsupport, please specify these other sources:
Total SupPort(sum of items A-E above)
4. EXpenditures for Institutional Researeh Activity During 1969-70
What was the total dollar amount expended for institutional
research at your Institution?
*If your office is not required to pay directly for computing time put
q% in items 5B1 and 5Bii and include no comput.lng costs in item #4.
5. Percent Distribution of EXpenditures
Based on the total expenditure figure indicated In response to question4, please show the percent expended in each of the following areas:
A. Salaries
i) Professional Research StaffIncluAing Director
ii) Systems Analysts
iii) Programmers and Equipment Operators
iv) Clerical and Clerical Supervision
v) Other(please specify)
%of Total No. of FTE-IRIR EXnend. Staff Positions
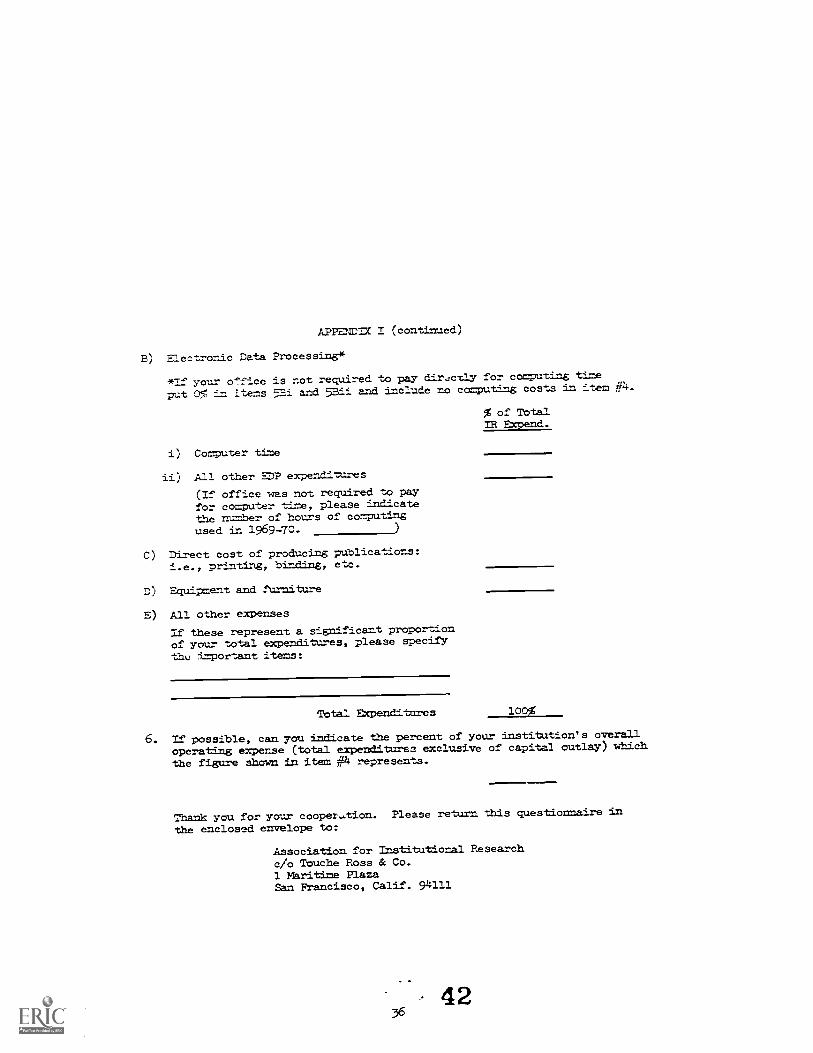
APPENDIX I (continued)
B) Electronic Data Processlng*
*7-4' your a'.'fice is not required to pay dir,c-aY for computing time
put O.% in items 53i and 53ii and include no computing costs in item #4.
i) Computer time
ii) All other EDP expenditures
(If office was not required to payfor computer time, please indicatethe number of hours of computingused In 1969-70.
C) Direct cost of producing publications:i.e., printing, bi,laing, etc.
D) Equipment and furniture
E) All other expenses
If these represent a significant proportionof your total expenditures, please specifythtJ important items:
% of TotalIR Expend.
Total EXpenditures 100%
6. If possible, can you indicate the percent of your institution's overall
operating expense (total expenditures exclusive of capital outlay) which
the figure Shown In item #4 represents.
ThPnk you for your cooper...tion. Please return this questionnaire in
the enclosed envelope to:
Association for Institutional Researchc/o Touche Ross & Co.1 Maritime PlazaSan Francisco, Calif. 914111

Arrazz-ix 7:
Instit=tions Responded to '-`Le Curvey by Tn..Control, and .rollxcent Size
Tyne & Control ofInstiLation
F ullTinae Enroll:sent
Lass tbar.1,000
1.000-.,,999
5,000-9.999
10,000-19.999
20,000-29,999
30,000And Above
Enroll.Not
1...icated Total
Uni.--aitiee
T.R. Office '.e-e&Pub'lcly Contri-led -- I5 34 30 8 6 2
Privately Controlled 1 12 10 8 -- -- 1 32
Control Not Indicated -- -- -- -- 1
1 N, 5 37 3 131
No T.R. OfficePublicly Controlled 12 20 IS 9 -- 1 3 63
Privately Controlled 11 31 15 3 -- -- 1 61
Control Not Indicated -- -- -- 3
Total -.,4 - 127
All nadversities
Publicly Controlled 12 38 52 39 e 7 5 161
Privately Controlled 12 43 25 1: -- -- 2 93
Control Not 'Indicated -- 2 -- -- --
Total 24 82 79 51 8 7 7 258
Pour-Year Colleges
T.R. Office RetortedPublicly Controlled 4 27 16 3 -- -- -- 50
Priv:L*17 Cortrolled 30 34 -- -- -- -- 64
0ant-n1 Not Indicated -- I -- .._ __ __ -- I
Total 3.4 62 16 3 -- -- -- 115
Nc 7.R. CITicePublicly Controlled 11 51 7 -- -- -- __ 69
Privately Controlled 283 120 -- -- -- -- 7 410
Control Not Indicated 1 -- -- --
Total 295 171 -- LBO
All FOur-Year Colleges
Publicly Controlled :5 78 23 3 -- -- -- 119
Privately Controlled 313 154 -- -- -- -- 7 474
Control Not Indicated 1 1 -- -- -- 2
Total 329 233 23 595
4337

r.:ontiltued)
Znatitutions ich Fesponded to the 3arvey by Type.Control. and Enrollment Cite
,Ype ec Control ofZnstitution
PullTine Enrolltsent
Less Than1,000
1,000-4.999
5,000-9.999
10,000-19.999
20,000-29.999
30,000-And Above
atroll.Not
Indlcated Total
Two-Year Colleges
T.R. Office ReportedPublicly Controlled :0 48 17 1 __ 3 83
Privately Controlled 2 3 -- -- -- -- -- 5
Control Not Indicated -- I --
Tbtal 1 52 17o9
No 1.2. OfficePublicly Controlled 211. 128 15 -- 3 361
Privately Controlled 81 7 -- -- -- -- 2 9c
Control Not Mmdicated 1-- 1
130 .,
452
Al: Two-Year Colleges
PUblicly Controlled 224 176 32 5 1 -- 6 244
Privately ControlledControl Not :Indicated
83--
102
-- ----
-- -- 2--
952
Total 307 188541
Total Sarple Group
T.R. Office ReportedPublicly Controlled 15 93 68 37 9 6 5 233
Privately Controlled 33 49 10 8 -- -- 1 101
Control Not Indicated -- 2 :. -- 3
:total 4b 144 79 5 9 6 6 337
No I.R. OfficePublicly Controlled 252 202 »0 10 1 6 511
Privately Controlled 402 159 15.
3 -- -- 11 590
Con.rol Not indicated 2 2 , _- 6
Total 656 363 56 , -- 7 1107
All Institutions
Publicly Controlled 267 295 108 47 9 7 11 744
Privately Controlled 435 208 25 11 -- -- 12 691
Control Not Indidated 2 4 2 1 -- o
Total 70 4 507 135 59 9 7 23 1444