document resume - eric1 list of figures planning for paratransit 34 2 market segmentation planning...
TRANSCRIPT

ED 280 329
AUTHORTITLEINSTITUTION
SPONS AGENCY
PUB DATENOTEAVAILABLE FROM
PUB TYPE
EDRS PRICEDESCRIPTORS
IDENTIFIERS
DOCUMENT RESUME
HE 020 144
Scalici, AnthonyParatransit: An Instructional Module.West Virginia Univ., Morgantown. Technology EducationProgram.Urban Mass Transportation Administration (DOT),Washington, D.C.Dec 85152p.; For related documents, see HE 020 138-143.West Virginia University, Transportation EducationProject, 2945 University Avenue, Morgantown, WV26506.Guides - Classroom Use Guides (For Teachers) (052)
MF01/PC07 Plus Postage.*College Instruction; Delivery Systems; EngineeringEducation; Higher Education; Innovation;*Instructional Materials; Marketing; MoneyManagement; Operating Expenses; ProgramAdministration; Public Administration Education;*Public Facilities; Research Utilization; RuralAreas; Technology Transfer; Theory PracticeRelationship; *Transportation; Urban Planning*Paratransit
ABSTRACTA concept-1,ased introduction to paratransit is
provided in this instructional module for_undergraduate and graduatetransportation-related courses for disciplines such as engineering,business, marketing, and technology. The concept of paratransitgenerally refers to modes of transportation other than mass transitand solo-driven automobiles. The characteristics and applications ofvarious paratransit modes are examined. A systematic approach forparatransit planning is presented along with problems and issuesassociated with the design and implementation of paratransit systems.Additional topics include: factors associated with ruraltransportation systems and the potential of designing paratransit forrural areas; the concept of market segmentation analysis; measures ofexisting service efficiency; how simple efficiency indicators arecalculated; how needs and services are compared to determine areas ofunmet needs; the process of system design; financing and marketingparatransit operations; management tasks associated with paratransit;and the use of brokerage in paratransit management. Case histories,examples, and an eight-page bibliography are included. (SW)
***************k******************************************************** Reproductions supplied by EDRS are the best that can be made ** from the original document. ************************************************************************

7.3.4
(4)INSTRUCTIONAL MODULE
tl*/4*US.Department of Transportation
Utbeiti Matt TratitatittötiOriAdministration
"PERMISSION TO REPRGDUCE THISMATERIAL HAS BEEN GRANTED BY
To THE EDUCATIONAL RESGURCESINFORMATIGN CENTER (ERIC),"
Lao IIII LEM I
2
Min
0*
POW%I. 110
U.S. DEPARTMENT OF CDUCATIONOffice of Education& Research and Improvement
EDUCATIONAL-RESOURCES INFORMATIONCENTER (ERIC)
Itsdocument _has--been _reproduced- asreceived from the person or organization
_ originating it.Minoz ohanges_have been rnade to improvereproduction quality,
Points of view or opinions staled in this docu.merit do- not- necessarily represent officialOERI position or policy,
'RP"
ei1., r ,1 No.
WV-11-00034:
"Paratransit:An Instructional Module
1
2 7.: . -er. A.cess.c.n No.
Lead Author: Anthony Scalici
9.--ic,-,;;;,;6;-ganization_Norne and Adche_ss
Technology Education DepartmentWest Virginia UniversityMorgantown, WV 26506
.1:Ai: n
3.
5. Re; ..,r Dote
6. Per(orming Orgonizaton Code86-1010-5010
Orgor.isco.on Report No.
10. Wok Unit No. (TRAM
H. ,-;; I or CrntWV=11=0003
12. Sponsoring Agency Name -and-Address'U.S. Department_of_TransportationUrban Mass Transportation Administration
Office of Service and Management Demonstrations20590
13. Type of Report ond Period Covered
14. Sponsoring Agency Cod
URT-3015. Supplrimntory Nots
16. ALstract
This module is intended to provide a broad, conceptbased introduction to thetopic of paratransit for use in both undergraduate and graduate transportation-related courses. The material is designed to be useful in many disciplines includingengineering, business, marketing, and technology.
The concept of_paratransit generally refers to modes of transportation other thanmass transit and solo-driven automobiles. This module examines the characteristics ofvarious paratransit modes and the various applications of these_modes according totheir characteristics. A systematic approach for paratransit planning is presentedalong with problems and issues associated with the desigh and implementation ofparatransit systems. Key ideas are illustrated by the use of case histories andexamples where possible.
17. Key Wordstransportation, paratransit, modaloptions, planning, market segmentation,targeted design
19. Security Clossif. (of this report)
Unclassified
111. Distribution Statement
Copies are available at cost from:Transport4ipn .Education Project2946 University AvenueWett Virginia University
,--Mar-933132F-5LOE20. SOCurity Classif. (of this pope) 21. No. ol Pages
Unclassified
22; Pricy
Form DOT F 1700.7 (8-72) Reproduction of completed pope authorized
3 BEST COPY AVAILABLE

PARATRANSIT:
AN INSTRUCTIONAL MODULE
Prepared_byThe Transportation Education Project
Technology Education ProgramWest Virginia University
ForThe Office of Service andManagement Demonstrations
Urban Mass TransportationAdministration
Project Staff
Principal InvestigatorProject Coordinator and Module EditorGraphics_CoordinatorInstructional Designers
Lead Authors = Transportation Brokerage= Rural Public Transportation- Public Transportation Pricing- Paratransit- Market Segmentation
December 1985
4
Dr; Paul W; DeVorePeter WrightLinda HaydenLinda HaydenCharley McWhaAnthony Scalici
Linda HaydenLinda HaydenCharley McWhaAnthony ScaliciPeter Wright

ACKNOWLEDGEMENTS
The Transportation Education Project of the TechnologyEducation Program at West Virginia University wishes to expressthanks to the members of the Office of Service and ManagemertDemonstrations at the Urban Mass Transportation Administration(UMTA) who have guided and supported our efforts in producingthese modules. We also wish to thank the transportationeducators and professionals who assisted our project by reviewingand field-testing our draft modules. The field reviewers andtesters of this module are listed below. The opinions expressedin this unit reflect those of the authors, and do not necessarilyreflect the views of UMTA or of our field reviewers.
Field Re4lewers
Lester HoelUniversity of Virginia
Paratransit Module
Field Testers
Jon EppsUniversity of Nevada
Jay Smith Mary KihlNorth Texas State University Iowa State University
Arun Chatterjee and students Shinya Kikuchi_University of DelawareUniversity of Tennessee
James Reading, T. Jones,Kelly, R. Carmichael, andCOTA, Columbus, Ohio
David P. MiddendorfMichael S. BronziniUniversity of Tennessee
C. S. PapacostasUniversity of Hawaii
Andrew FarkasMorgan State University
Jotin KhistyUniversity of Washington
5
Leon ZuehlsNortheast WisconsinTechnical Institute

TABLE OF CONTENTS
PARATRANSIT MODULE
Acknowledgements ii
List Of Figures iiiLiSt of Illustrations_ iVProfessor's Introduction V
General Introduction X
Introduction to Paratransit 1*
Transit and Paratransit Modes 11*
Rural Transportation Systems 24
Student Review and Investigations 30Guidelines for Student Review 31
Planning for Paratransit 32*
Market Segmentation Analysis 37
Assessment of Existing Services 46
Analysis of Unmet Needs 55
Targeted Design and Implementation 60*
Student Review and Investigat'on 73Guidelines for Student Review 75
Financing Paratransit 77
Marketing Paratransit 84
Management of Paratransit 92
Overall Summary of Paratransit Module 106
Student Review and Investigation 109Guidelines for Student Review 110
Selected References 112
An_asterisk has been_placed after the page_numbers ofmodule_sections which we suggest_concentrating on ifyou only have one class hour to treat this material
6
1
LIST OF FIGURES
Planning for Paratransit 34
2 Market Segmentation Planning 36
3 Commuter Travel Survey 41
4 Sample Survey Results 44
5 Hypothetical Data on a Single Subscription Bus 51
6 Principal Groups Involved in the TransportationDecision-Making Process 63
7 Planning Process to Obtain Federal Funding 66
8 Hypothetical Data for Single DRT Van 74
9 Budget Breakdowns for Two Demonstration VanpoolProjects 81
10 Sample Ridesharing Promotional Brochure 90
11 Organizational Structures of Two DemonstrationVanpool Projects 95
12 Structure of the Westport Demonstration Plan 101
111
7
LIST OF ILLUSTRATIONS
1 Applications of Paratransit 6
2 Communications Pattern for a emand-ResponsiveSystem 13
3 Transit and Paratransit Modes 1923
4 Utilization of Assessment Data 47
5 Principal Groups Involved in the TransportationOecision-Making Process 62
6 The TranSpOrtatiOn Planning Cycle 72
iv
8

PROFESSOR'S INTRODUCTION
Since the founding of the Service and Methods
Demonstration Program (SMD) in 1974, the Urban Mass
Transportation Administration (UMTA) has been intimately
involved in the development and diffusion of innovations
related to mass transportation; After a decade of
experiments and demonstrations; valuable insights and
techniques have emerged;
However, students graduating with transportation degrees
are often unaware of much of the information which UMTA has
developed. These modules were designed to introduce future
transportation professionals and people with related
interests to five areas where new ideas have proven
important in the planning and management of public
transportation systems. The topics are:
Market Segmentation Planning;
Paratransit;
Transportation Brokerage;
Rural Public Transportation; and
Public Transportation Pricing;
The topics are defired at the end of this introduction and
discussed in the General Introduction.
9

Description of the Modules
These mOdules are intended to provide a broad, concept-
based introduction to each Of the five topics for use in
both undergraduate and graduate transportation-related
courses. The material is designed to be useful in many
disciplines, including engineering, business, planning,
marketing, public administration, and technology.
One of the major findings of our phone interview in
February 1983 was that professors want curriculum packages
to be flexible. These modules were designed to be taught
for one to three classroom hours. The module text may be
used in a number of ways including uses as:
Lecture notes;
Student homework readings;
Overhead transparencies feom illustrations; and
In-class reading and discussion.
All graphic materials labeled as illustrations are
designed to be used as overhead projections while graphic
materials labeled figures are designed for photocopying.
Professors should feel free to use these materials to
supplement regular course design and materials in any way
they wish. However, we have placed asterisks in the Table
of Contents after sei-tions which we suggest you concentrate
on if you only have one hour to teach the module topic. At
vi
10
the end of each of the three sections of the module, there
are Student Review Questions based on the preceding
material.
The topics of the five modules have a significant
content overlap which is reflected in the module texts
themselves. Therefore, some module sections are virtually
repeated from one module to another. Professors utilizing
more than one of the modules should make allowances for
this in planning their presentations.
Persons wishing more detailed and in-depth information
on particular topics should refer to the list of references
at the end of each module. Sources published by UMTA may
be located through the UMTRIS computer database on the
DIALOG system or from the National Technical Information4
Service (NTIS). It may also be possible to obtain recent
UMTA Technical Reports and a current bibliography from U.S.
DOT/TSC, Service Assessment Division (DTS-64), Kendall
Square, Cambridge, MA 02142.
Module Topic Definitions
Market Segmentation
Market Segmentation is a trans-p-ortat4_o_n_p_l_a_nn1174
a-pp-r-oach which involves identifying groups in a market that
are "homogeneous with respect to important criteria that
influence their travel choices" (Nelson, TRR 823, p. 8).
vil
11

This approach is associated with integrated mobility-based
transportation planning and allows the consideration of
variety of solutions to individual travel needs and
markets.
Paratransit
Paratransit refers to modes of passenger transportation
which are on a continuum between the private automobile and
conventional transit. They are usually available to the
general public and able to operate over the street and
highway system (Kirby, 1974, pp. 1, 9). Paratransit
generally refers to modes such as dial-a-ride, shared-ride
taxi, jitneys, vanpools, and so on.
Transportation Brokerage
The transportation broker identifies the transportation
needs and demands of various market segments and then
matches these needs with available transportatiOn
resources. The broker also may resolve barriers to
innovative transportation arrangements and implement those
arrangements through contracts with social service
agencies, employers and private operators. Brokerage is a
concept which highlights many of the roles a transportation
manager can undertake to provide mobility cOmprehénSiVely
and cost-effectively.
viii
12

Rural Public Transportation
Rural public transportation involves systems in rural
and small urban areas with populations under 50,000
people. Public transportation services in rural areas have
often been provided solely by social service agencies
serving their clients. New federal programs have facili=
tated the development of rural systems open to the public
but strong local involvement and creativity are needed to
create and support such services.
Public Transportation Pricing
Public transportation pricing systems are composed of
fare structures and fare collection mechanisms. They are
based on consideraiion ot ine sysiem users, poiiiics,
funding sources, system costs, and system service charac-
teristics. Planning pricing systems involves the balancing
of many complex demands. Higher fares otien lead io
increased revenue generation but they can decrease
ridership thereby lowering the social benefits of transit
service. Complicated fare systems can promote equity among
riders but they can make fares difficult to collect
efficiently.
lx
13
GENERAL INTRODUCTION
Historically, mass transportation in the United States
was alm,st always provided by private, profit-seeking
enterprises. The public's interest was usually protected
through regulation by a public utility commission. Such
commissions controlled entry into the transit business,
fares, and the types of service offered.
As the number of automobiles and the quality Of roads
increased, mass transit ridership suffered a major
decline. At the end of World War II, 37% of commuters were
riding to work on public transit. By 1979, this figure had
fallen to 6%; and there was an automobile for every two
Americans. An expanding economy permitted many urban
residents to purchase cars and suburban houses.
Mass transportation did not adapt to these changes, And
private enterprise gradually withdrew from providing such
services. The federal government began to provide finan-
cial assistance for transit systems which permitted local
governments to take control of them. In the 1960s, the
federal government initiated operating subsidiet to help
curb deficits.
As federal assistance for transportation systems grew,
it became evident that the government was spending
1 4

increasing sums of money to support transportation systems
which were not adjusting to changing conditions. Research
into alternative methods of providing public mobility was a
necessity. In 1964 Congress created the Urban Mass
Transportation Administration (UMTA) to "research, develop,
and demonstrate projects in urban mass transportation."
In 1974 UMTA created the Service and rvithods
Demonstration (SMD) Program to promote the development and
widespread adoption of innovative transit services and
transportation management techniques. Some of the areas in
Which UMTA has facilitated major changes are bus and rail
equipment design, automation, paratransit, brokerage,
integrated planning, and other management innovations.
These modules were designed to introduce students
transportation to information on five topics: market
segmentation planning, paratransit, transportation broker=
age$ rural public transportation, and public transportation
pricing. The information in the modules is based on the
results of numerous UMTA-funded d-emonstration and research
projects related to these topics. The five topics are
introduced on the following pages.
X1
15
New Directions
Market Segmentation
Public transportation today involves a variety of
transportation modes with varying costs and character-
istics. A transportation planner must have new planning
tools to cope with the complex array of possible systems.
Instead of focusing on transportation systems, Ihe
planner should begin by studying the actual mobility needs
of the people to be served. Needs-based transportation
planning is the only way to ensure services that are fully
used and cost-effective. New or modified services which
meet the needs of certain groups must then be marketed to
inform people of the service's benefits for them.
There are four basic steps to the Market Segmentation
planning approach:
1. Market Segmentation Analysis
2. Assessment of Existing Services
3. Analysis of Unmet Needs
4. Targeted Design
Paratransit
Paratransit refers to any public transportation mode
which falls on the continuum between the large fixed-route
systems (bus, train, etc.) and the private automobile.
This includes demand-responsive modes such as Dial-A-Ride
and ridesharing modes such as vanpools. Paratransit
xi i
16
systems are designed to be flexible, cost-effective,and
targeted to specific needs, but they cannot move large
numbers of people on a single route as cheaply as mass
transit systems.
Paratransit is being used to serve commuters, the
handicaped, the elderly, and others. It works well in
low-density or special needs situations where conventional
mass transit would be too expensive. Paratransit also can
work well as a feeder service For a conventional system.
Brokerage
Suppose a city decides to provide its elderly with a
partially subsidized door-to-door service. It would be very
expensive to buy cars, maintain them, hire drivers, and so
on. It is cheaper to contract with local taxi companies
who already have facilities and a workforce. The taxi
company provides the service, the elderly give the drivers
tickets (provided by the broker) good for part of each
fare, and the city buys the tickets back from the taxi
company.
In such a case, the transportation planner acts as a
broker who matches transportation needs with available
services. Rather than operating as a carrier, the
transportation broker is primarily concerned with
increasing people's mobility with equitable and
cost-effective services.
17
Brokerage is useful in many areas of transportation
management; particularly in the provision of flexible,
low-cost paratransit services; lhe concept of brokerage
highlights the new types of roles transportation managers
can undertake in today's complex operating environments.
Rural Public Transportation
Rural areas are characterized by sparse populations,
often difficult road conditions, and limited resources, yet
people in rural areas need mobility for access to jobs,
shopping and health care; Most rural people either own
autos or rely on informal networks based on them. Public
transportation in rural areas has usually been provided
solely by social service agencies serving their clients.
Federal funding has facilitated the development of systems
open to the public but strong local involvement and
creativity are needed to create and support such services.
Rural systems have employed many innovations including
all types of cooperative arrangements, extensive use of
volunteers, and experiments with non-traditional vehicles
such as school buses and postal vehicles. Rural public
transportation fills pressing needs but due to the
difficulties of arranging and financing it, strong local
support and creativity are essential;
xiv
18
Public TransportatiOn PriCing
Public transportation pricing systems are composed of
fare structures and fare c011ection mechanisms Fare
structures deal with how much system riders pay tosë the
service while Collection mechanisms range from simple cash
fares to complex postpayment and user-subsidy ticket
systems.
Planning the pricing of a public transportation service
is an integral part of planning the overall transportation
system. Fares and collection methods are based on factors
such as who the system users are, political considerations;
sources of funding, costs of the system, and system service
characteristics. Planning pricing systems involves the
balancing of many complex demands.
Higher fares Often lead to increased revenue generation
but they can decrease ridership thereby lowering the social
benefits of transit service. Complicated fare systems can
promote equity among riders by permitting, for example,
discounts for the elderly. However, too many complications
can make fares difficult for bus drivers to collect
efficiently.

INTRODUCTION TO PARATRANSIT
The purposes of this section are:
TO familiarize students with the concept of
paratransit and the role it plays in proViding
alternative means Of transportation
TO detcribe the primary characteristics of
paratransit MOdet.
What is Paratransit
Paratransit is an approach to transportation which
Utilizes a variety of vehicles other than the solo-driven
private automobile and fixed route public systems.
Paratransit operations generally focus on specific purpose
tripS, such as commuting to and from work, and are
designed to meet individual travel needs, such as
docr-to-door service for elderly and handicapped.
The purpose of -ltransit services is to provide
increased mobility people who represent specific needs
or markets through the )rovision of targeted, flexible,
and cost=effective services.

Characteristics of Paratransit Operations
The list WOW defines the basic characteristicS Of a
paratransit system in operation. Following thit litt,
each characteristic is discussed in more detail.
It Utilizes vehicles on a continuum between the solo
driver's private auto and conventional fi.xed-route
means.
It travels over existing highways a d streets.
It iS flexible and distinct from conventional
transit.
It serves "trip demand."
It can be managed and operated by public or private
interests.
Paratransit is a System of Transportation utilizing
Vehicles or a Continuum Between the Solo-Driven PriVate
Auto and Conventional Fixed-Route Systems.
21

Paratransit has always existed within transportation
networks; taxi service is the most obvious modern example.
The function of taxi service is to carry people either to
an exact destination or to a fixed system pick=up place
from which they can be carried to their destination.
Similarly, taxis On call at a train terminal carry people
ftom fixed system stations to exact destinations.
Within the laSt decade, the "personalized service" and
"responsiveness to demand" elements or paratransit have
been recognized for potential beyond these traditional
roles. With some modifications, cars and vans can be made
to terve the transportation handicapped, whose needs to
travel on a daily basis are no less than those of the
non=handicapped, but which often cannot be met by
Conventional systems. Even modification to conventional
systems (i.e., bus ramps and lifts) do not help those who
are unable to get to a bus stop because of prohibitive
geography, long distances from fixed route stops, or
severe handicaps.
In addition to meeting specific needs with a variety of
modes, paratransit operations have been recognized to
contribute to the reduction of traffic congestion,
gasoline consumption, auto pollution, and the need to meet
transportation demands with only two options: more large
public systems and more roads.

The need for paratransit services in America was
formalized by the adoption of a federal mandate in the
mid=1970t, Whith directed all major urban transit planners
to assess and formulate ridesharing and other low cost
strategies for their respective cities and regions.
Transportation System Management (TSM) is the name given
tO this federal mandate. TSM set up funds for the
establishment of ridesharing and other paratransit
services to meet local needs with cost-effective, flexible
options.
Paratransit Travels Over Existing Highways and Streets
The construction of new roads requires large outlays of
capital and irreversible land use with no guarantee that
transportation conditions will improve. With all the road
building of the past twenty years, it is estimated that
fifty percent of America's highways are overused ninety
percent of the time.
The era of massive road construction has ended. Thit
leaves transit planners with the job of making more
efficient use of the resources that exist. The potential
of a paratransit opertion to reduce the number of vehicles
using existing roads makes it a important means for
helping to manage areas of congested traffic flow.
23

5
Paratransit is Flexible and Distinct from ConventionalTranSit
y redefining "conventional transit" as fixed route bus
and rail systems, paratransit operations can be viewed as
those in which vehicles move more freely to and from
diverse locations at varied times. This is an important
diStinction because it provides a means by which people in
such locations can be linked, when needed, to existing
conventional systems as well as to exact destinations.
Paratransit can also provide a direct and personalized
service to non-drivers and to those who do not own cars.
Some specific applications of paratransit are shown in
IllUStratiOn 1.
Paratransit Serves Trip Demand
Another unique a d useful characteristic of paratransit
is that it can respond immediately and in a variety of
ways to surges and drops in demand. These can be met by
increasing or decreasing the number of vehicles and/or by
varying the vehicles according tO their indiVidUal
carrying capacities.
24

kustration Applications Of Parattans.
AUTOCOMMUTERS
4...........APPLICATIONS
OF
PARATRANSIT
TRANSPORTATION
DISADVANTAGED
1ANSIT USERSFOR MASS
SUBSIDIESUSER SIDE
EDER SERVICES VATE CARRIERS
SOLODRIVERS
vt
VANPOOLSSUBSCR I PTION
BUSES
REGIONAL SYSTEMS
DEVELOPMENT

Paratransit Can Be Operated By Public or PrivateAgencies
The field of paratransit operation has opened new
opportunities for both the public and private sectors;
Taxi companies; as such; have always been engaged in
private carrier paratransit; Now, however, they are being
contracted through local government offices to serve
special-needs portions of local populations; particularly
the elderly and the handicapped;
Private taxi and van operators have the facilities, the
versatile investment base; and the management expertise to
efficiently implement such specialized demand-responsive
services; Federal and state user-side travel subsidies
also help to provide the means for elderly and handicapped
people to meet their unique travel needs; These subsidies
are based on discounted scrip which can be used for
private demand-responsive systems;
In addition to providing direct services, both public
and private agencies are now engaged in coordination of
ridesharing systems. Under the TSM directive, local
governments must attempt to reduce the number of cars that
use commuter routes each day, particularly during peak
hours. Part of the solution to such reductions is the
encouragement and organization of ridesharing programs:
8
carpoolsi vanpools, subscription busesi etc. The
implementation of the these programs can be handled by
local government agencies or contracted out to private
consulting groups.
History of Paratransit
Paratransit is the oldest form of transportation and it
Still represents the dominant transportation means fbr a
majority of the people in the world. When the villagers
in zaie6 eide the produce truck from the market to the
tity they consider it a paid-for ride but we would
classify it as a form of paratransit. similaely, the
small pickup trucks outfitted with benches to serve as
minibuses in Kenya are technically jitneysi a form of
paratransit.
The rediscovery of paratransit options in the United
Statet dat6t from the efforts of UMTA in the 1970s to
investigate and demonstrate cost-effective means of
meeting specific public transportation needs which COUld
not be met so1el2- by providing larger fixed-route systems
due to economici logistici and political reasons.
UMTA's early demonstrations included the promotion of
and implementation of vanpoolsi the establishment of
dial-a-ride services for the elderly and handicappedi and
the integration of specialized agency transportation
services. Not all demonstrations succeeded and many are no
28

9
longer in service. However, the demonstrations also
provided knowledge about successful services and critital
factors in their design and implementation. The results
also showed that paratransit represents an exciting group
of options which can and should be considered by all who
provide public transportation services.
The early 1980s have seen a flowering of paratransit
operations. It is hard to find a major city withbUt car
and vanpool promotions, and the use of coordinated
demand-responsive services to meet specific needs is
widespread. Paratransit operations currently utilize a
variety of modes, primarily ridesharing, vanpooling,
demand-responsive, and jitney. These will be discussed in
the next section. These modal options employ many types of
vehicles including cars, vans, taxis, minibuses, and
buses.
TrzAsportation Brokerage
Transportation brokerage is another innovation in
public transportaion management. Brokers serve as
specialists in "people mobility" and operate in the free
market to facilitate the matching of needs and services in
a locale; Rather than operating as a carrier, the
transportation broker is primarily concerned with
arranging for the provision of services targeted to
specific needs;
29

10
Suppose a city decides tà provide its elderly with a
partially subsidized door-to-door service. It would be
vcry expensive to buy cars, buy and operate maintenance
facilities, hire drivers; and so on. Yet local taxi
companies have already invested the capital in developing
these functions. It is cheaper and more rational for the
city to contract with local taxi operators to provide the
service. The taxi company provides individual trips, the
elderly give the drivers tickets (provided by the broker)
for part of the cost of each trip, and the city buys the
tickets back from the taxi company.
In this case the transportation planner is acting as a
broker. Similarly; brokers can visit large local
employers and promote the formation of employer-sponsored
vanpools. In this way a valuable transportation service
can be provided to commuters with little cost to the
transit agency. The employer gains lower parking costs
and improved regularity of worker arrivals.
Summary
Paratransit is an exciting concept. Its uses can
recombine existing resources in creative ways to meet
mobility; environmental; fiscal; and social requirements.
Because it is directed toward specific services; Planning
for paratransit provides new insights into the mobility
heedS And markets of local people. Increasing experienCe
With paratransit should help in meeting those needs.
30

11
TRANSIT AND PARATRANSIT MODES
The purposes of this section are:
o To differentiate between demand-responsive and
fixed-route transit systems.
4 To describe the characteristics of the various modes
used in p.roviding these two types of service;
There are four primary modal types which exist as
options for transportation pl?nners. They are: 1) demand-
responsive, 2) fixed-route, 3) jitney, and 4) ridesharing.
This section will describe the basic characteristics of
each. It will also discuss some unique advantages and
applications of each of these modal types.
The remainder of the module will refer to these modes
and their relationships with each other and with the
overall transportation network of cities and regions.
Demand-Responsive Transpartatiom Service
Demand-responsive transportation services (DRT) are
tailored to meet individual service needs and generally
31

12
provide door-to-door service. Included in this category
are taxi services (both single passenger and shared-ride
service) and dial-a-ride systems. Illustration 2 shows
the complex communication patterns of DRT systems.
DRT systems generally provide service between any
origin and destination point but can also connect any
point of origin to designated destinations, such as
shopping centers or universities. Similarly, a DRT system
can serve as a feeder service to another transportation
system, such as bus or rail service.
DRT services generally are requested by telephone; are
provided in small vehicles, such as cars, station wagods,
vans, and small buses; and are often provided on a shared
ride baSis. Rides are provided either immediately upon
request or by advance reservation. Because of their
schedule flexibility and door-to-door service, DRT systems
are well suited to meet the mobility needs of handicapped
and elderly people, and those without access to a car.
Because of their flexibility and individualized nature,
DRT systems are also attractive to car drivers who are
looking for an alternative.
For example, a DRT feeder service, which connects with
bus system, can effectively serve the commuting needs of
people who live in outlying suburbs and work in a central
bUtinett ditriet (CBD). Both the Tidewater Regional
TranSit Adthdrity in Norfolk, Virginia, and Peninsula
32

Illustration
13
CommunicatiOn Pattern for Demand-Responsive System.
RADIO LINKTO DRIVER
ROUTECONTROL
TO PICK UP
33

14
Transportation DisT.rict Commission serving Hampton-Newport
News; Virginia, provide such feeder service through
contracts with private taxi operators.
DRT service is commonly provided by private operators
such as taxi companies. However, publicly-operated DRT
services; known as dial-a-ride systems; now operate in
some communities to meet general and/or special
transportation needs. However; privately operated
systems seem to be replacing these. Agencies sponsoring
DRT systems include city and county gov(rnments, regional
transit authorities, and social service and health care
agencies;
DRT services are particularly suited to low-density
areas where bus service is uneconomical.
O They are a cost-efficient means of transnortation
for short trips, and for off-peak service hours
where demand for travel is lighter and more diffUSO.
o They can effectively substitute for fixed=route;
fixed-schedule bus service in the evenings and on
weekends; When used as a feeder system; DRT
services effectively complement bus service.
Small service areas-6 square miles or less--often
are served most practically by DRT systems.
DRT services provide a way to make public
transportation services available 24 hours a dayi 7
days a week;
3 4

15
This category is comprised of conventional fixed-route,
fixed-schedule bus and rail services. In contrast to the
flexible; individualized nature of DRT services,
fixed-route services are designed to provide the same
service to all people for all types of trips. It is the
most common form of public transit service, and is best
suited for carrying large volumes of people along
densely-developed corridors. A strong central business
district or other primary center of activity--such as a
un'versity, centralized shopping, commercial, industrial,
or health care center--is an essential focus for this type
of service;
The prime advantage of traditional bus service is its
capability to carry more people at a lower cost per trip
however, generating a sufficiently high volume of
ridf2rship can be a critical problem. The two groups who
most commonly use this service are commuters and
transit-dependent people - those without access to a car
when they need or wish to travel. Since the service is
not door-to-door, it is not the most effective way to meet
the mobility needs of many of the physically disabled or
of many of the elderly.
35

16
Jitneys are small capacity vehicles--mini-buses, vans,
station wagons--that operate on a variable schedule along
fixed routes. They stop either at designated loctions
along a route or at any point when hailed; Although
jitneys travel along a fixed route, they can devjate in
order to bring passengers closer to their destinations;
Jitneys were a popular form of public transportation in
the USA in the early 1900s, but by the mid-1920s had been
banned in most cities because of their competition with
trolley car service. They are still a fixture in
developing countries even in places like Bangkok; Thailand
where they compete directly with public bus services; They
are, however, re-emergirg in Atlantic City; New Jersey;
San Francisco; Anaheim; and San Diego; California;
Indianapolis; Indiana; Pittsburgh; Pennsylvania; Chicago;
Illinois; Chattanooga; Tennessee; and Miami; Florida.
Jitneys also hold promise for use in small citiec.;
Jitney operators are generally individual entrepreneurs
taxi operators. Because they operate small vehicles
and can deviate off a route, the service they offer is
often faster, more convenient, and more attractive then
that of a large capacity bus. Also, because of their size
and more flexible mode of operation, jitneys can often
operate at a profit on low ridership routes where bus
service is uneconomical. In addition, they can substitute
36

17
for or complement bus service in low-density areas or
during low-demand, off-peak periods in higher density
areas. Since jitneys can offer a variety of services at
low fares--usually as low as bus fares--they could provide
affordable services for many groups, including lOw-income
individuals.
Ridesharing
Carpools, vanpools, and subscription bus operations
represent various forms of ridesharing arrangements, which
primarily are formed for commuter rush hour trips. They
can be adapted, however, to meet the travel needs of the
elderly and physically handicapped, or to provide access
to jobs in suburban areas for low-income, inner-city
residents; Ridesharing and pooling arrangements are an
important element in paratransit planning as they
represent low-cost, quick-result actions which go a long
way in meeting commuter travel needs while reducing the
number of single passenger cars on the main travel
corridors.
The ridesharing concept is simple: people with similar
origins and destinations agree in advance to ride together
on a regular basis. The service is tailored to meet the
specific needs of each group. Members of a pool agree
upon the schedule, route, amount and method of payment,
origins and destinations, who will drive, and what
37

18
vehicle will be used; The advantages of a pool over
conventional bus service include doorto-door service,
faster and more direct service, few stops, and an assured
seat;
Ridesharing has grown increasingly attractive to more
and more commuters in the last several years as the costs
of cars, gasoline, maintenance, and insurance have sky-
rocketed; Many pools are formed at the initiative of
individuals who live in the same neighborhood and work in
the same office; building; or general area. Increasingly,
however, employers, private community groups, regional
transit authorities, and government agencies are
sponsoring ridesharing programs. In addition to
employers and local agencies acting as the third party,
transportation brokers can also serve to facilitate
pooling operations;
A graphic summary of transit and paratransit modes is
included as Illustrations 3a, 3b, 3c, 3d, and 3e.
Summ_a_ry
The four major transit and paratransit modes are
demand-responsive; ridesharing, fixed-route/fixed
schedule; and jitneys; Each had unique uses, character-
istics, and advantages; The transportation professional
must utilize modal options in the most effective
combinations to meet local travel needs and markets;
38

Illustration 3a. Transit and Paratransit Modes. 1 9
MODES
DEMAND RESPONSIVE
FIXED ROUTE SERVICE
JITNEY SERVICE
RIDESHARiNG
3 9

Illusti.ation 31:3; Transit and Paratransit Modes (cont'd);
MODE CHARACTER STICS EXAMPLES
DEMANDRESPONSIVE
MEETS INDIVIDUALSERVICE NEEDS
DOOR TO DOORSERVICE
SERVICE TOELDERLY &HANDICAPPED
TAXI SERVICE
DIAL-A-RIDE
SPECIALPURPOSEVANS

Illustration 3 . Transit and Paratransit Modes (cont'd).
MODE CHARACTERISTICS EXAMPLES
IXED ROUTEERVICE
MOVES LARGEVOLUMES OFPEOPLE
FIXED ROUTE &SCHEDULE
BUSES
LIGHT RAIL
HEAVY RAIL

Illustration 3d. Transit and Paratransit Modes (cont'd).
MODE CHARACTERISTICS EXAMPLES
!EY
/ICE
VARIABLESCHEDULE
FIXED ROUTES
PERSONAL STOPSALONG ROUTE
MINI BUSES
STATIONWAGONS
VANS
---..

Illustration 3e. Transit and Paratransit modes (cont'd).
MODE CHARACTERISTICS EXAMPLES
)ESHARING
46
COMMUTERORIENTATION
LOW COST/QUICKRESULTS
THIRD PARTYSPONSORS
CARPOOLS
VANPOOLS
SUBSCRIPTIONBUS
4 7

24
RURAL TRANSPORTATION SYSTEMS
The purposes of this section are:
To describe the factors uniquely associated With
rural transportation systems.
To illUttrate the potential Of de-signing paratranSit
for rural areas.
The feasiLility of a transit system is primarily
dependent on its ridership and efficiency of operation.
Because of low population densities, often rough terrain,
and high mileage-per-trip ratios in rural areas. the
feasibility of rural transit systems often problematic.
The incentives which atttact riders who own cars tb Lite
buses in large urban areas generally are not operative in
small urban communities. Traffic congestion, parking
availability and cost are usually not critical prOblems in
small communities. Unless a bus system offers extensive
routes, frequent scheduling, and minimal needs for
transfers, a trip can usually be made more quickly and
easily in a car, if one is available. These factors make
regular bus service difficult a d expensive to sustain in
rural areas and small towns;

25
However* major needs for public transportation services
in rural areas do exist. It is estimated that the rural
population comprises 25% Of the natiOri't total, and that
it accounts for 40% of the total person-miles travelled.
AUtO travel is virtually the only means by which people
living in rural areas can reach places of employment,
shopping centers, and medical services. Increases in
fuel, auto, and road maintenance costs have placed an
especially heavy burden on rural populations since federal
and state assistance is generally directed toward more
heavily populated regions.
Furthermore, approximately half of the rural elderly dO
not own automobiles. This group is conspicuously
dependent on outside help for their transportation needs.
These needs are generally met by friends and relatives.
The lack of ability to come and go when needed can be a
troublesome condition to to elderly. A similar situation
exists for handicapped people and non-drivers in rural
areas. Both of these groups find it especially difficult
to obtain regular and dependable transportation co places
Of employment as well as to shopping and medical centort.
4 9

26
Where do Solutions Lie?
In urban areas a variety of transit operations - public,
private and specialized services - generally exist.
Because of sufficiently high population densities and short
trip distances, such services can operate economically.
Rural areas, however, are often served by only a single
taxi company or even a single taxi. The cost to
individuals; particularly the elderly, of having a private
taxi drive many miles each time a travel need arises is
restrictive. What, then, is the answer?
Little historical information exists on solutions to
rural transportation problems; As late as 1978; less than
1% of all federal transportation research went into rural
projects, yet the rural population makes up one-quarter of
the nation; The lack of existing public services in
non-urban areas limits the availability of data. Since
1978, however; a number of rural studies and demonstrations
have been conducted. They have concluded that needs and
markets for public transportation services do exist in
rural areas.
Demonstrations have shown that successful and cost-
effective rural transportation systems can be designed and
implemented. Most are formed initially by local people to
meet specific needs and they depend heavily on strong local
volunteer effort, community support, and local fundraising.
Many of these originally small projects have grown as a

27
result of federal support and have expanded to nearby areas
where services are needed; The following case study summary
illustrates the potential for rural systems in overcoming
the obvious problems discussed above.
The Stagecoach project of Bethel, Vermont, was iniated
in 1976 by a non-profit community organization called
Faith, Hope, and Charity, Inc. The system serviced an
area of 800 square miles with a target population of
22,000; The population density was 28 people per square
mile; Some of the major initial barriers to this system
were severe cash flow problems, high insurance rates, and
uncertain sources of funds;
It began as a one-vehicle fixed=route operation. The
system has since expanded to 8 vehicles, providing six
different types of service:
fixed-route/fixed-schedule;
demand-responsive through contracts with social
service agencies;
school charter and handicapped services;
charter service for local groups;
commuter subscription service; and
freight delivery;
Ridership in 1982 was over 140 per day; the annual per
capita ridership of people in the service area was
approximately 1.6. Stagecoach has grown quite rapidly;
51

28
with recent expansion aided by receipt of a DOT Section 18
grant. With the expansion this system which had originated
as a small agency-based service grew into its own regional
transportation provider; The expansion, however, was only
possible with an increase in local volunteer dispatchers
and wider community participation.
Section 18, created through the Surface Transportation
Act of 1978; apportions funds to the states on a formula
basis; Each state is responsible for "fair and equitabl "
disbursement of funds, and up to 15% of its share can be
reserved for administrative purposes and for providing
technical assistance. Under the terms of the legislation,
the Department of Transportation will pay up to 80% of the
cost of capital and administrative expenses for the
individual projects, and up to 50% of operating costs not
covered by farebox revenue.
Through funding from Section 18, the Stagecoach Project
was able to expand, and, thus realize increased ridership.
However, federal support is not unlimited and may decline
in future years. Jim Bautz of UMTA and others believe that
future systems must emphasize the efficient utilization of-
resources, self help, public/private partnerships, and a
more market-oriented delivery of public services.
Some directions which may assist rural transportation to
meet these challenges include:
52
29
increasing coordination among existing providers
where possible;
increasing the use of existing resources far multiple
purposes such as postal buses and school buses for
public transportation purposes;
increasing the use of volunteers for driving and
dispatching; and
creating more information sharing networks among
existing transportation providers.
Significant progress has been made since 1978 in meeting
rural transportation needs. Much has been learned in areas
where local officials, business people, transportation
providers; and local citizens have addressed the issues
collectively; However; no one has yet claimed an "answer"
to the difficult problems involved in meeting rural
transportation needs;
Summau
The problems associated with designing systems in rural
areas are caused by low population densities, high mileage
trips, and scattered activity centers; The lack of public
transportation in rural areas is particularly troublesome
to elderly and handicapped persons. The potential for
designing workable systems may lie in area-wide
cooperation; volunteerism, and dedicated hard work;

30
STUDENT REVIEW AND INVESTIGATION
1. Discuss the concept of paratransit and how it differs
from fixed-route transit.
2. Describe the transit and paratransit modes; compare
their operational characterisitcs.
3. Describe ho i or ifi each of the four major transit and
paratransit modes are used in your local area; and
discuss possible new uses for each.
4. what are the common prOblems associated with publit
transit in rural areasi and how might such problems be
compensated for?
5. Visit a paratransit service or an agency sponsoring one
and ask the Director about the needs the service meets
and how it is paid for. Also discuss the history and
possible future of the service. Report to the class.
54

31
GUIDELINES FOR STUDENT REVIEW
1. Paratransit typically
a. Meett heeds of indiVidUalS
b. TraVelt from diVerte locations td diVerte dettinatiOnt
t. Usually operates on deMand
d. Cat-eies ihdiVidUalt Or small grOUOS Of people
6. Cat-eies feWer people at higher tost pee oassengee Mile
f. UteS a vaeiety Of Small vehicleS along all eoads
g. Can be operated by private tat-eiees.
Fixed=Route typically
a. Meets needs of the general public
b. Travels from fixed loctions to fixed destinations
t. Odeeates on fixed schedules
d. Carries large volumes of peop10
e. Carries mor0 pOop10 at lower cost per passenger mile
f. Uses large vehicles along restricted corridors
g. Typically run by public agencies
2. See Illustration 3.
3. This question is open ended.
4. Problems include: 1) long distances; 2) small ridership;
3) Scattered population; and 4) distance between activity
centers. There is no simple answer to compensate for
these prolems Generally, successful services have been
diversifiedmeeting a variety of needs, community
organized, and often aided by volunteers.
55

32
PLANNING FOR PARATRANSIT
The purpose of the following section are:
To introduce students to a basic methodology for
planning and designing paratransit systems.
To provide students with the basic conceptt and
terminology of planning and design.
To acquaint students with some Of the issues Which
face transportation planners.
The methodology for planning and designing paratransit
presented in this module has been develop,A from an
analysis of federally funded demonstration projects which
took place during the 1970s and early 1980s. Perhaps the
most significant -.'inding of these demonsttations has been
.liat the success af a paratransit operation depends on how
effic_i_ently_i_t meets the individual needs and preferences
of_p_o_teatial_use_rs-; This is especially significant to
transportation planners because it requires that they study
the people and the transportation infrastructures of th-LA-
cities or regions; This process is required in ordee to
56

33
gain the data by which new systems or modifications of
existing ones can be designed, implemented, and eValuated.
The importance of local cultural, geographical, and
political influences cannot be overstated.
Unless a system meets certain efficiency and quality
standards, it will fail to gain ridership, and simply
become another public deficit producer which dOJS little to
enhance mobility. Designing a paratransit system, and td a
great extent any transit system, should there-fore begin
with answering these basic questions:
Who desires and needs service?
What criteria most influence travel choices?
What services are desired or needed?
What means already exist whiCh can be utili2ed?
How can new services be implemented?
(See Figure 1.)
A Methodol_o_gy_for Planning Paratransit
The planning process can be broken down into four steps,
each of which addresses the questions suggested in the
previous paragraph. The steps are: 1) market segmentation
analysis; 2) assessment of existing services, 3) analysis
of unmet needs, and 4) targeted design. It must be
stressed that since the basis of all decisions lies in the
context of local environments, the planner must first have
a firm understanding of local issues, institutions, and

Figure 1; Planning for Paratran
CA L EN viR °NNE-NT

people. The illustration that follows outlines the four
steps, their relative positions in the overall process, and
the primary objectives and activities of each. (See Figure
2.)
59
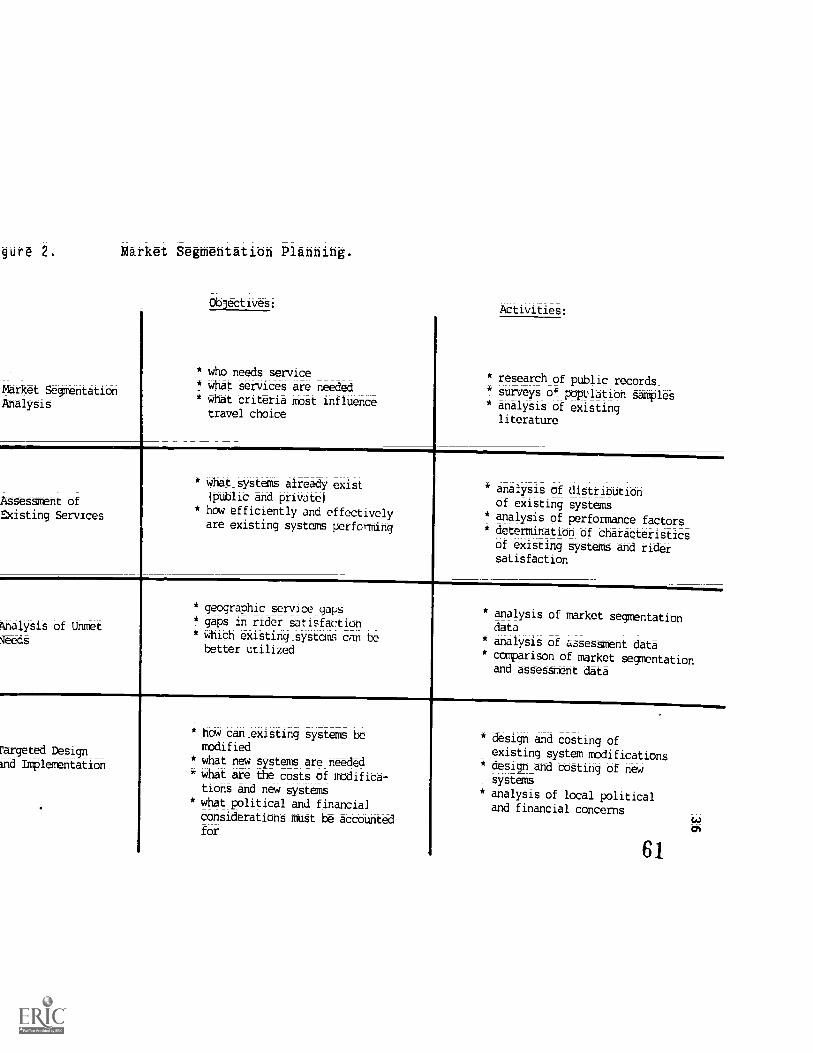
gure .
Market Segmentation
Analysig
Market Segmefttation Planning.
Ob3ectives:
* who needs service
* What services are needed
* what criteria most Influence
travel choice
Activities:
* research_Of public records_
* surveys opopu1ation samples* analysis of existing
literature
Assessment of
Existing Services
Nnalysis of Unmet
Need§
* what_systems already exist
lptiblic and private)
* how efficiently and:effectively
are existing systems perfo*-Minq
* analysis of distribUtion
of existing systems
* analy.tit Of performance factors_* determination bf characteristics
of existing systems and ridersatisfaction
* geographic service_gdp;'
* gaps in rider satisfaction
* Which existing_systems can bebetter utilized
* analySiS bf market segmentationdata
* analysis of assessment data
* teMparison of market segmentationand assessment data
rargeted Design
md Lmplementation
* how can_existing systems betbdified
* what new systems are needed
* what are the costs of modifica-
tions and new systems
* what pOlitical and financial
considerations MiiSt be accountedfor
* design and costing of
exitting system modifications* design_and testing of new
systems
* analysis of local political
and financial concerns
61

37
MARKET SEGMENTATION ANALYSIS
The purposes of this section are:
To describe and illustrate the concept of market
segmentation analysis.
To describe and illustrate techniques for segmenting
a population.
Market segmentation is an approach to transportation
planning based on the identification and analysis of groups
which are similar with respect to criteria that influence
their tra..,e1 choiCOS.
To begin the process of segmenting the general
population, it is useful to look at several of the more
prevalent types of trips which people regularly make. Thit
can serve as a starting point for understanding people's
travel needs according to trip purposes. The business of
defining more exact segments and clusters will be the main
focus of this section. The following generalizations are
intended to orient readers to the concept of grouping. The
groups below are organized according to their trip
purposes.

38
Thmmuting - people travel to and f. m work regularly
along main corridors by means of pri..ate vehicles and mass
transit systems.
Business and Commerce - people travel throughout the
workday over a wide area using private and commercial
vehicles and, to some extent, mass transit systems;
Rersonal Errands - people travel to and from diverse
locations for personal matters: health; social services;
banking, etc. Such trips are made by means of private auto
or public transit if destinations are located conveniently
along the fixed routes.
Shopping = travel to some degree to central locations
such as malls and downtown shopping districts. This group
tends to use private vehicles because of a need to carry
wnat i. purchased.
-rtion and Entertainment - people travel to and from
ivrse locations at diverse times by private auto or
means when destinations are conveniently located to
Tixe coute:,.
Shooling - people travel to centrally located schools
and universities. They often use public means and travel
to and from diverse locations. Except for a peak of
activity in the morning, particularly by secondary school
students, this group travels throughout the day.
63

39
Determination of Needs
Research and population sampling are the primarly tools
for analysis and categorizing the transportation needs of
cities and regions. Research based on census and other
public records reveals population distributions, basic
demographics, and activity centers.
Sampling is a technique for surveying portions of
population to learn about the whole. It can determine the
travel needs, desires, and preferences of people. Surveys
of sample groups are also used to collect information which
categorizes people by neighborhood or district, access to
automobiles or public transit, and so on.
A useful vehicle for the administration of survey
questionnaires is the employer; Worksites are the ideal
locations to reach grr ps economically and effectively.
The cooperation of employers is important not only for
survey dIstribution but also for implementation of
ride-sharing services. Employers are generally receptive
to such paratransit efforts since the success of these
services results in a greater level of punctuality and a
smaller requirement for parking facilities.
Contact wit!: public agencies and community organizations
can provide additional and specific information about
individuals and groups, and can also aid in the
d4,stribution of survey instruments; Lastly, existing
literature on transportation studies, regional problems,
64
40
and paratransit demonstration projects can be useful for
directing planning strategy.
Market Profiles
A market profile is a description of a consumer or
service user which indicates relevant needs, preferences,
and tendencies of travel mode choice. For the purpose of
transportation profes 71.31s, profiles should indiCat,J
those aspects of pe avel patterns such as
automobile use which 1Liant to sp.,tem planning.
Preliminary grocipino o peop;e (commuters, shoppers,
students, etc.) can be useful in designing survey
instruments and targeting groups for sampling. For
example, commuters predictably travel to the same place
each day while shoppers often do not. Therefore, questions
concerning regularity and times of trips need to be
designed for the two groups.
The following illustration is a travel survey aimed at
commuters. Note how the information being sought focuses
on general commuter characteristics. (See Figure 3.)
After such a survey has been administered to a
sufficiently large number of people, and the data analyzed,
subgroups (clusters) can be singled-out and studied for
possible services. In this case, ridesharing and pooling
were pre-designated as a service option for commuters.

Figure 3. Travel Survey. 41
MY NAME IS
TRAVEL SURVEY
11111111111111111111111111111111LAST NAME
tttjttj5_ 1411.11.1.STREET NUMBER STREET NAME
MY H3ME ADORESS ISs
I AM EMPLOYED BY.
thr.1llzEop5FIRST NAME MIOOLE INITIAL
NAME OF CITY OR SUBURB ZIP CODE
NAME OF FIRM
MY WORK PHONE IS. Itrefrier=f) MY WORK STARTS AT.(NEAREST 1/4 HR.)
I NORMALLY wpm THESEDAYS NDT INCLUDING OVER- 8000008TI.E. (PLEAsE MARK x) MO TU WE TH FR SA SU
WORK (MARK X).FLLL TIME PART TIME
uSUALLY WORK OVERTIME,
I USE MY OWN cAR FOR JOB
LESS THAN IDAY PER WEEK
8RELATED ACTIVITIES. LESS THAN 1
DAY PER WEEK
I USUALLY-TRAVEL T O A F ROM
WOR( BY. (MARK X IN ONLY ONE) elm.. AL.NE
CARPMX,RIDE
'CARPOOL IS TwO oR MOREPEOPLE INCLUDING DRIvER
8 cAppowy...vE
8
EcE8MY WORK ENDS AT,(NEAREST 1/4 HR.)
1-2 DAYSPER WEEK
EVERYDAY.
c.Arsaca.0/21aBE
LF YOU ARE IN A CARPOOL OR VANPOOL.HOW_MANT_PEOPLE 'INCLUDING YOUR-SELF) ARE IN YOUR POOL, 2 PERSONS
IN A_TYPICAL_wEEK_;_m0w ANY_DAYSDO YOU CCRIVE; _POOL4 BUS) TOGET TO AND FROM WCR(. I DAY
NOW MAW vEHICLES (BOTH AUTO Ag,AND TRUCK) ARE WINED OR LEASED Ljer YOUR HOUSEHOLD.
MY HomE PHONE NI-P6ER IS.
WITH
EVERYDAY
DRIVINGOTHERS
_11.11
3 PERSONS
2 DAYS
80 VEHICLE I VEHICLE
-40-4-2- 43 46MEM-=BMW
DEPARTMENT
AMOR PM
I KIRK A
1-2 DAYSPER WEEK
Eff 8AM OP PM
ROTATING SHIFT,
83 oR MORE
DAYS PER WEEK
8 vAPROcL
88
YES
83 OR moRE
DAYS PER WEEK
DROPPED OFF BY SOMEONE
BUS
OTHER (WALK. TAXI. MOTOR-CYCLE. BIcycLE. ETC.)
3 DAYS
8PERsoNs
4 DAYS
in5 OR MORE PERSONS
8--5 DAYS
e52 VEHICLES 3 OR MORE VEHICLES
MY SEX IS, (MARK
421-0 "ALE 0 FEMALE
Source: Weisbrod and Ederi_Evaluation of the MinneapollsRi-des-hari-ng-Commuter ServiCes Demonstrattbm, June 1980

42
Clusters
Profiles are initially made on individuals who are parts
of broad travel groups; The data gathered through surveys;
however, inGicate common characteristics among groups of
these individuals; Clustering the sample population
according to such common characteristics gives planners the
numerical information necessary to access new services.
The importance of designing the initial survey
instrument according to desired ends should be recognized
along with other technical aspects of survey and
questionnaire construction; The data gained from surveys
can surveys can only be as good as the information
requested.
The following simulation illustrates the sequence of
procedures and the progression toward defining market
segments and clusters:
A city has a particularly problematic traffic situation
stemming from a recently completed office complex.
Approximately 4;500 employees have begun working in this
complex, many who previously worked in small offices just
outside the city and others who are new; Most of these
employees have chosen to drive to work since few public
services are available to them from outside the city; City
planners estimated that more than 3;000 outomobiles have
been introduced to downtown; complicating traffic and
causing severe parking problems;
6 7
43
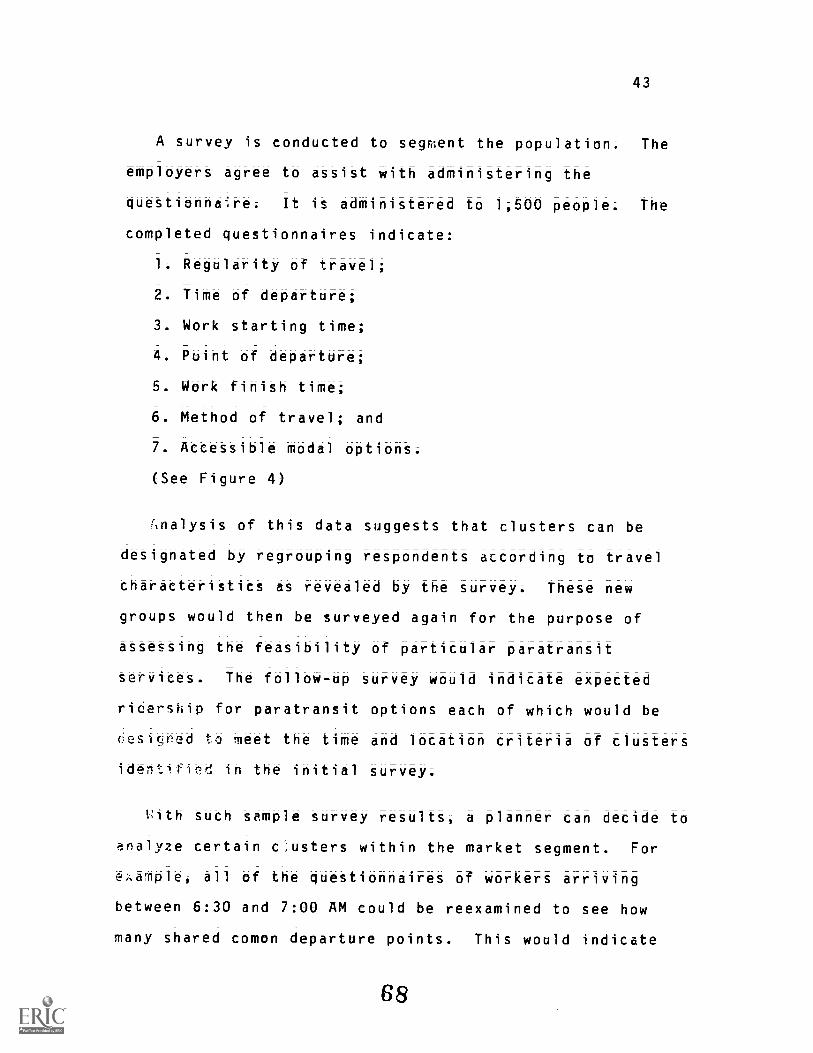
A survey is conducted to segment the population; The
employers agree to assist with administering the
questionnea.ire; It is administered to 1;500 people; The
completed questionnaires indicate:
1. Regularity of travel;
2. Time of departure;
3. Work starting time;
4. Point of departure;
5. Work finish time;
6. Method of travel; and
7. Accessible modal options;
(See Figure 4)
Analysis of this data suggests that clusters can be
designated by regrouping respondents according to travel
characteristics as revealed by the survey; These new
groups would then be surveyed again for the purpose of
assessing the feasibility of particular paratransit
services. The follow-up survey would indicate expected
rioership for paratransit options each of which would be
6osigned to meet the time and location criteria of clusters
idntlfid in the initial survey;
uith such sample survey results, a planner can decide to
analyze certain c'Asters within the market segment. For
e.Aamplei all of the questionnaires of workers arriving
between 6:30 and 7:00 AM could be reexamined to see how
many shared Conlon departure points. This would indicate
68
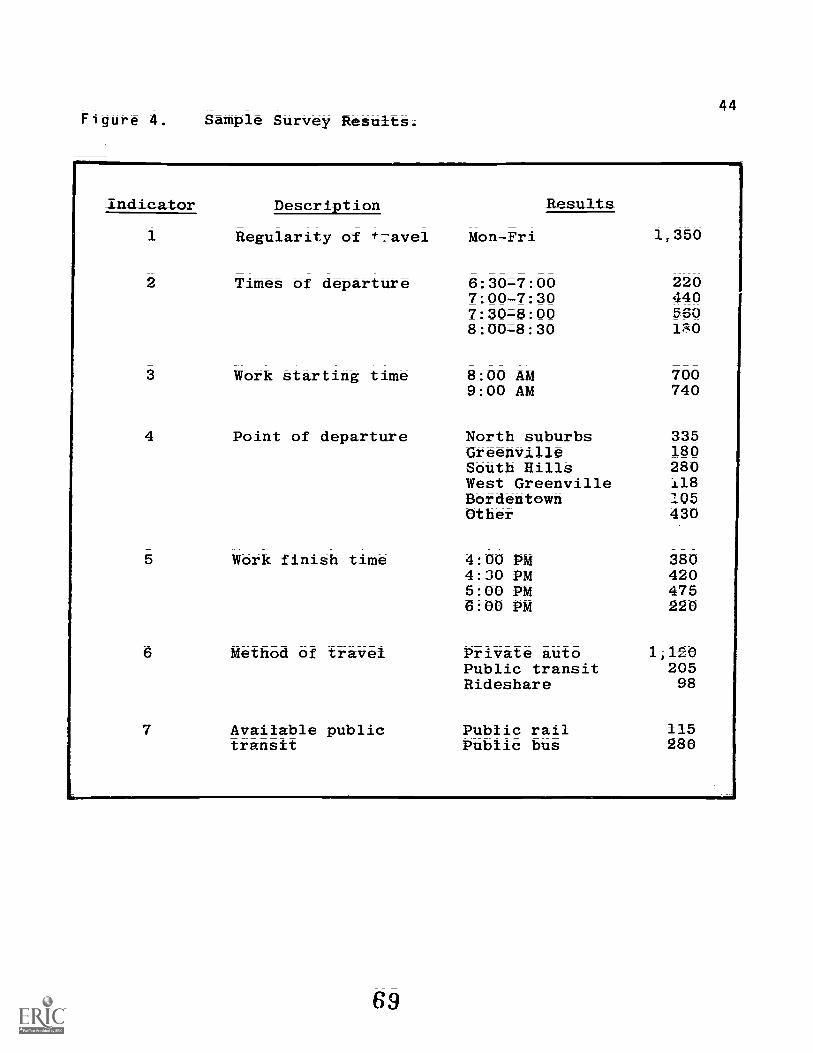
44Figure 4. Sample Survey Results.
Indicator Description R-suIts
1,350
22044056010
1
2
Regularity of t7avel
Times of departure
Mon-Fri
6:30=7:007:00=7:307:30=8:008:00=8:30
3 Work starting time 8:00 AM 7009:00 AM 740
4 Point of departure North suburbs 335Greenville 180South Hills 280West Greenville 118Bordentown 105Other 430
5 Work finish time 4:00 PM 3804:30 PM 420500 PM 4756:00 PM 220
6 Method of travel Private auto 1,120Public transit 205Rideshare 98
7 Available public Public rail 115transit Public bus 280
69

45
the feasibility of particular paratransit services such as
a subscription bus or a ridersharing program.
Ridesharing
The coordination of rideshring programs has been most
effectively accomplished through employers or by
employers. Several major corporations--Texas Instruments
Of What, Cenex of St. Pauli and TVA of Knoxville-have
included ridesharIng coordination as au employee
incentive. th services are generally organized through
the collection of application cards. Computerized Matthing
has been particularly effective for the analYSiS Of
employer-based ridesharing as the data can be worked int-6
normal employee recordkeeping programs.
With the exception of ridesharing promotioni paratransit
services often involve capital costs. Determining the
feasibility of these options will be dittUtSed in the
follOWing tettiOns.
SUmmary
The firtt step in a needs-b?sed planning approach it
market segment,Aion analysis. In this step the transporta-
tion planner utilizes quantitative and qualitative data tO
determine the transportation needs and markets in the
service area. Contact with key individuals ih the
community may lead to later support fOr bebbbsed SOlUtiohs.
70

ASSESSMENT OF EXISTING SERVICES
The purposes of this section are:
4 To describe measures of existing service
efficiency,
To show how existing services are assessed in terms
of an integrated planning framework, and
To demonstrate how simple efficiency indicators are
calculated.
Information or Existing Systems
Market segmentation analysis locates demand areas and
inditatet What types of service are desired. This informa-
tiOn -should then be compared with an assessment of existing
systems to determine if the existing systems meet transpor-
tation needs and if they need modification. Secondly, the
eccnomic performance data of existing systems is used tO
help evalUate their efficiency and the feasibility of
Potential new or modified services. (See Illuttratibh 4)
Generally, the performance data of existing systems
already exists. Transit planners need to obtain access to
system budgets and related financial and service records.
Alto, Since private carriers such as taxi and van services
can play a role in paratransiti their operating capacities,
71

itttAtioh 4.
MOSIV-
NEEDS &MARKETS
TARGETGROUPS
ERVICES
NEEDED
AREA)VERAGE
Utilization of Assessment Plan.
DESIGNOPTIONS
MODIFYSERVICES
ADD NEWSERVICES
z
CONTRACTPRIVATE
CARRIERS
EXISTING 1SYSTEMS
EXISTINGSERVICES
AREASCOVERED
PERFORMANCERATIOS
72 73

48
costs, and regions of operation, when available, should be
included in this phase of planning.
Assessment Techniques
Transportation planners and managers need a working
knowledge of the diverse; but interrelated; elements which
comprise the transit network. Vehicle engineering,
economics, legalities, market needs, market potential, and
system performance are all components in this decision
process. Assessment of services concentrates on system
performance measurements and the resultant economics.
Basically; existing services are initially evaluated in
terms of two questions:
1. What is the nature of the service being provided?
2 Is this service being provided in a cost-effective
manner?
Operational Factors
The nature of existing services can be described in
terms of what service is provided when, where; and to
whom. Operational factors are those which are determined
by management decisions. They include:
fares,
times of operation;
routes or zones of operation;
accessibility;
49
headways;
communication with users; and
safety;
The transportation planner should also attempt to
determine who uses the system; It is very important in the
planning process to know which market segments use the
system and at what times; This information can help in
determining unmet needs in the area and in tailoring system
characteristics to increase ridership;
System User Assessments_
It is important to interview selected users of the
system to obtain their opinions of the operational
characteristics listed above; Factors such as the level
driver assistance or the availability of route information
cannot be analyzed solely on the basis of written service
aid financial records; The planner should also ride the
various services in the system regularly to augment other
user assessments;
Assessments by system riders can help to identify both
system strengths and problems which decrease ridership; In
addition; user assessments are an essential element of
market research and are an essential first step in efforts
to promote ridership of new and existing services;
50
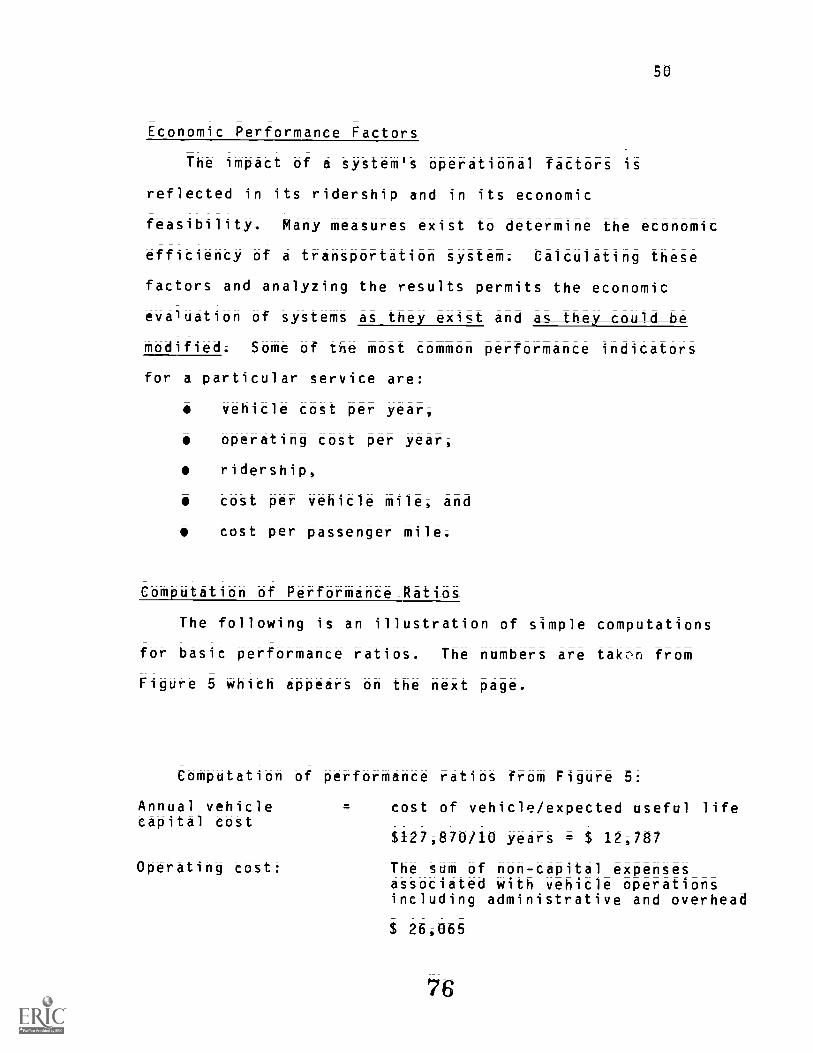
Economic Performance Factors
The impact of a system's operational factors is
reflected in its ridership and in its economic
feasibility. Many measures exist to determine the economic
efficiency of a transportation system. Calculating these
factors and analyzing the results permits the economic
evaluation of systems as_they exist and as they could be
modified. Some of the most common performance indicators
for a particular service are:
vehicle cost per year;
operating cost per year,
ridership,
cost per vehicle mile, and
cost per passenger mile.
Computation of Performance Ratios
The following is an illustration of simple computations
for basic performance ratios; The numbers are talu,n from
Figure 5 which appears on the next page.
Computation of performance ratios from Figure 5:
Annual_vehiclecapital cost
cost of vehicle/expected useful life
$127;870/10 years $ 12,787
Operating cost: The sum of non-capital expensesassociated with vehicle operationsincluding administrative and overhead
$ 26,065
76

51
Figure 5: Hypothetical Data on Single Subscription Bus with
Part-time Driver.
Annual miles 12,600
Average speed 25 mph
Labor cost/year/vehicle $ 105090
Fuel/year/vehicle $ 1i512
Maintenance $ 5,871
Insurance $ 3049
Administration $ 5,392
Fees and Licenses S 151
Total Operating_Cost(without capital) $ 26,065
vehicle cost/year $ 12,787
Total cost $ 38,852
Average occupancy per trip 31
Average capacity 53
250
10 years
Total round trips per
Expected vehicle life
year
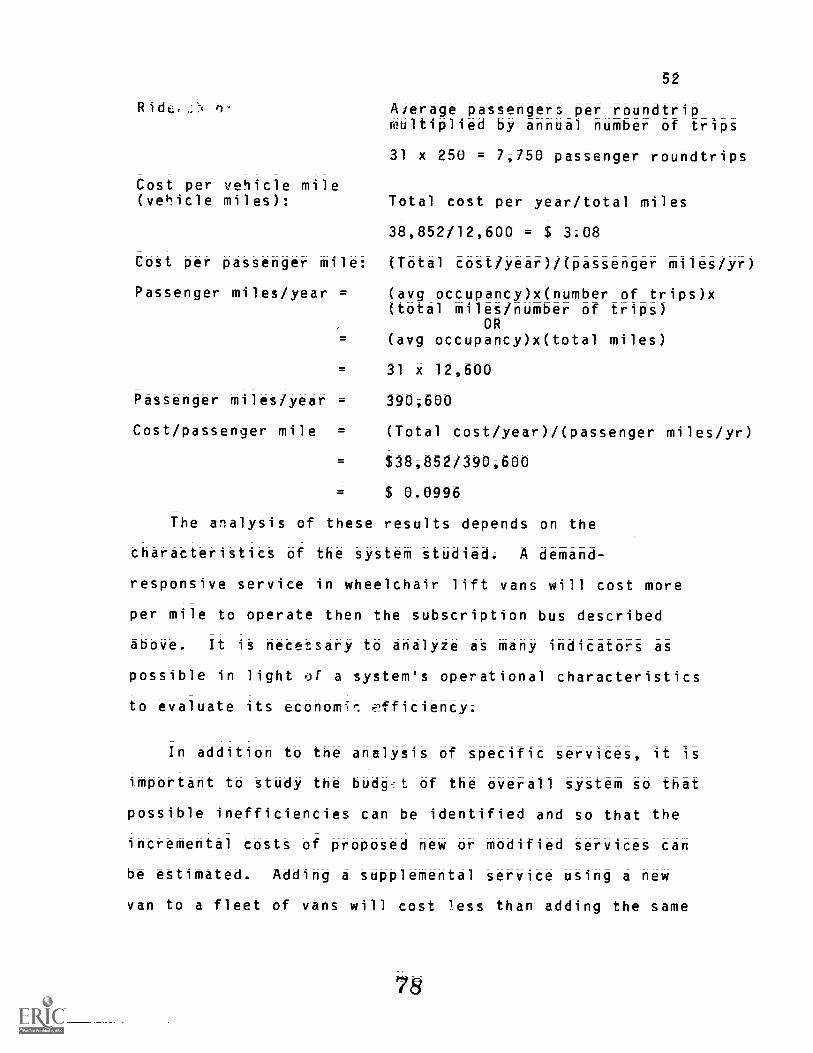
52
Rid kierage passengers per roundtripmultiplied by annual number of trips
31 x 250 = 7,750 passenger roundtrips
Cost_per vehicle mile(Vehitle miles): Total cost per year/total miles
38;852/12;600 = $ 3.08
Cost per passenger mile: (Total cost/year)/(passenger miles/yr)
Passenger miles/year = (avg occupancy)x(number of trips)x(total miles/number of trips)
OR(avg occupancy)x(total miles)
31 x 12,600
Passenger miles/year = 390;600
Cost/passenger mile = (Total cost/year)/(passenger miles/yr)
$38;852/390,600
$ 0.0996
The analysis of these results depends on the
characteristics of the system studied. A demand-
responsive service in wheelchair lift vans will cost more:-
per mile to operate then the subscription bus described
above. It is necessary to analyze as many indicators as
possible in light or a system's operational characteristics
to evaluate its economi,. efficiency;
In addition to the analysis of specific services; it is
important to study the budg-t of the overall system so that
possible inefficiencies can be identified and so that the
incremental costs of proposed new or modified services can
be estimated. Adding a supplemental service using a new
van to a fleet of vans will cost less than adding the same
78
53
van to a fleet of vans w1 -;1 cost than adding the same
service and van to a fleet composeo entirely of buses.
Some of the affected budget categories would inClUde
maintenance, insurance, and administration.
Paratransit and Cross-Modal BenefitS
Benefits derived from paratransit services can have
favorable effects on other transit systems; these are
termed cross-modal benefits. An example of this would be
the implementation of a mini-bus feeder line which serves
to increase ridership on a fixed rail or bUs system and
reduces the number of commuter automobiles. Improved
econowic performance of the fixed-route system and reduced
cOngestion would be the cross-mOdal benefitt.
While considering improvements for existing systems or
the introduction of new systems, the probable side effeCtt
of these proposed changes need to be examined. The
likelihood of resultant cross-modal benefits represent a
positive aspect of paratransit which should appear in
assessment computations.
Quantitatively estimating cross-modal benefitt it
difficult. It is a topic which is currently receiving_
considerable attention. As with other assessment
techniques, the survey instrument can play a significant
role in obtaining useful data. Given specified proposed

54
options; questions regarding modal choices can be built
into an initial survey questionnaire or can be sought by
separate survey instruments;
Summary
The second phase of a market-based transportation
planning process is the assessment of existing services.
The operational and economic characteristics of existing
public and private transportation systems should be
analyzed to determine at what cost and in what manner
service is being provided in a given area. If a variety
services is being offered it is important to assess their
cross-modal impacts;
80

55
ANALYSIS OF UNMET NEEDS
The purposes of this section are:
To show how needs and services are compared tti
determine areas of unmet needs, and
TO illustrate the types Of unmet needs which may be
discovered.
Market segmentation analysis categorizes the population
into groups according to their needs and preferences, and
estimates the sizes of such groups. Assessments of
:Asting services evaluate the ridership, location,
operating performance, and economic feasibility of existing
systems.
A comparison of the data on market segments and
existing services will reveal areas for improvement in the
transit network of a given city or region. Unserved needs
uncovered by this comparison can be interpreted in a
variety of ways depending on the nature of the system, its
users, and local priorities.
81
56
Forms of Unserved NeedS
Service gaps can appear in several forms§ among them:
specific trip demand§ special user groups needs§ and
unserved geographic areas.
Specific Trip Demand refers to transportation needs
which begin and end at specific locations at regular
times. Commuter work trips are the most common example of
spcific trip demand but this category also includes travel
by groups of people to any organized activity such at a
concert§ fair§ or sports event. It is often a
Steaightforward process to design services for such
specific markets. Often§ the type and size of vehicle can
be selected according to the characteristics of the
specific trip to be provided§ and the times and route of
travel are predictable.
For example§ in one suburb§ 45% of the workers were
found to be driving alone to the same train station every
morning along the same two lane road. If one-quarter of
these people would ride a convenient feeder service§ then
congestion and the cost of travel would be reduced for all
Of the commuters on that route. In another example§
downtown merchants were invited to urderwrite a ftee
shuttle bus on game days to a major college football
stadium to increase their business. This relieved both
parking and congestion problems.

57
are primarily the transportation
disadvantaged and the transportation handicapped. They can
have needs for specific types of transportation service.
People with certain disabilities may need specialized
service or the availability of vehicles with special
equipment The key issue is whether different groups
people have access to viable transportation services.
In fact, transit properties are required to make every
reasonable effort to provide transportation service to all
people in their communities in order to receive federal
support; Examples of services which can meet the needs of
special user groups include lift-equipped buses, demand-
responsive systems such as dial=a=ride, and user-side
subsidies provided to certain groups.
The transportation planner must investigate the size,
nature, and needs of special user group needs bere
propc;ing new or modified services A simplifiec
description of this process is presented in the example at
the end of this section;
U_n_er4RA__e_or_a_ph_i_areas should be identifiable from
local transit maps and survey data. However, lack of
transit service is relative. An elderly person in a
neighborhoou where she fears street crime may feel that she
is unserved if the bus does not stop within 200 yards of
her residence while her college age grandson may think
little of walking a mile to a busstop to reach his classes.
83
58
Unserved neighborhoods can lie within or outside the
boundaries of the public transit network. In many cases,
survey data can be used to determine whether there is
sufficient ridership to support the extension of an
existing fixed-route system, or to support a paratransit
(lotion.
Quality_of Sevice
Quality of service can be considered an unmet need if,
for ex,nmole; unclean buses discourage potential riders from
using public transportation; By improving bus maintenance;
ridership could be improved and the system could function
cwre efficiently while meeting more needs; Similarly;
low-cost actions such as repainting or new maps may produce
measurable ridership and revenu improvements;
Market research such as st..eys and interviews can be
useful in identifying how aesthetic and other service
quality factors are perceived by potential riders;
Negative quality factors can be investigated to determine
if service quality increases are feasible and cost-
effective. Factors that the public views positively can be
utilized as part of the system's promotion;

59
Summary
Determining unmot needs requires analysis of market
segments and of existing system data. Needs and demands
for public transportation service are compared with data on
the operational performance of existing services.
Planners can then identify unmet needs and evaluate
potential new and modified services. Mobility needs can
of several types including sper,ific trip needs, special
user needs, and geographic needs. Unmet needs can also
take the form of inadequate nai service on existing
systems; Only after unmet needs h6,e been identified can
new and modified systems be designed and assessed.

TARGETED DESIGN AND IMPLEMENTATION
The purposes of this section are:
To describe the process tem design and
selection in the context ..i the overall planning;
o To discuss the political implications of system
design and implementation;
To illustrate system design and the process of
implementation;
The design and implementation of paratransit services
must be done in direct response to specified needs
preferences of potential users; As it has been determined
by virtually all demonstration and pilot projects (those
that succeeded and those that "iled); umless a service
meets the individual needs o iders-_it will not be used;
It should not be assumed; however; that design and
implementation of modifications and new systems are simple;
Practical and logistic considerations must be placed
betide hard data before solutions can be proposed; Proposed
solutions must then be evaluated in light of financial and

61
Political fac -s to assess the realistic possibility of
implementation. t is necessary for transportation
planners to have working knowledge of related
institutions and issues and to understand the impact of
their work on the entire community.
(See Figure 6 and Illustration 5)
Factors for Design
Needs-based planning Jetermines modal characteristics
for r'LW systems; and the criteria for improving existing
systems; Generally; the factors which emerge as most
influencial in final design are:
The needs of designated groups;
The size of individual clusters;
The location of unserved groups; and
The
and
economic
vehicles;
i'easibY.ty and characteristics of modes
Recommendations for system design and modification
require consideration of logicstic; technical; economic;
and social factors. That is to say; final design is a
complex process; What follows is a brief summary lf the
elements of each of these factors;
Logistic - determining an optimum number of vehicles;
best routing patterns; and the combination of modal
options to serve the most needs in the best way.
8 7

lustr:Ijon 5. Principal Groups Involved in the Transportation Decision-Makin-4 PrOdeSS.
Ntts ebtOtw-Source: Technology Shatingi 1978, p.
89

F'gure Principal Groups Involved in the Transportation Decision-Making Process.
GOVERNMENT
LocalCountyMetropolitanRegionalSpecial DistrictTransportation AuthorityState Department of
TransportationOther State A-95 AgenciesFederal Department.of
TransportationOther Federal AgenciesLaw EnforcementPublic Safety AgenciesWelfareHealth Agencies
CITIZEN GROUPS
Advisory BoardsFraternal OrganizationsHowmowners
League of Women VotersNeighborhood GroupsParent Teacher AssociationsPeace GroupsReligious GroupsSchool GroupsService Clubs
BUSINESS COMMUNITY
Chamber of CommerceDevelopersLabor UnionsMerchantsNewspapersTaxi CompaniesTransit Operators
SOURCE: Technology Sharin , 1978, p. 29.
90

64
Technical - the operating efficiency of individual
vehicles; special needs modificat4 ;s; such as lifts and
1.amps; required maintenance equi and training;
Eccnomic - the capital cost of investment; start up costs;
operating costs; expected income from fares; and sources
of funding;
Social - what groups will benefit from new services; what
is the economic impact of new services; what social and
personal needs are to be met.
Factors for Implementation
Since financial resources are generally limited and
subject to political inf1,ncei pla lrs must organize
their analytical results Lf.d rake recommendations according
to:
What is the range of needs:
What is the cost of meeting each c these needs;
What needs should take priority over others; and
What is the potential for systam impllmentation
within the local political context.
Political Factors
Transport7tion planners and managers work within social
and political systams, so proposed changes are not usually
easily implited. Many parties have a stake and an
interest in public transportation services. These include
92
65
the tranOt ridero the transit workeri the taxpayeri the
employeri the motoristi and so cn. All have
differiant interestsi perspectivesi and methods.
Transit workers are justifiably concerned about their
work conditions and financial compensation. Taxpayers are
equally justified in their concerns about the benefits they
will derive from their tax dollars. Transit riders wish to
see transit services which will better meet their
individual needs and downtown merchants are interested in
attracting shoppers to their stores. Often systems cross
jurisdictional boundaries further complicai.ing politital
decision-making as each jurisdiction is ccr:erned that it
receives a reasonable service for itt
contribution.
The actual process of obtaining federal funding for
public transportation systems is long and complex as
illustrated by Figure 7. As discussed above
modified or new systems will be scrutinized by any number
of irteree.ted parties. The nature of this process makes it
mandatory to develop political support for new transpor-
tation systems during the initial planning process and n t
wait for a finished plan before assessing its political
feasibility.
Even sympathctic local governments will alter the most
carefully researched systems design in order to meet other
93
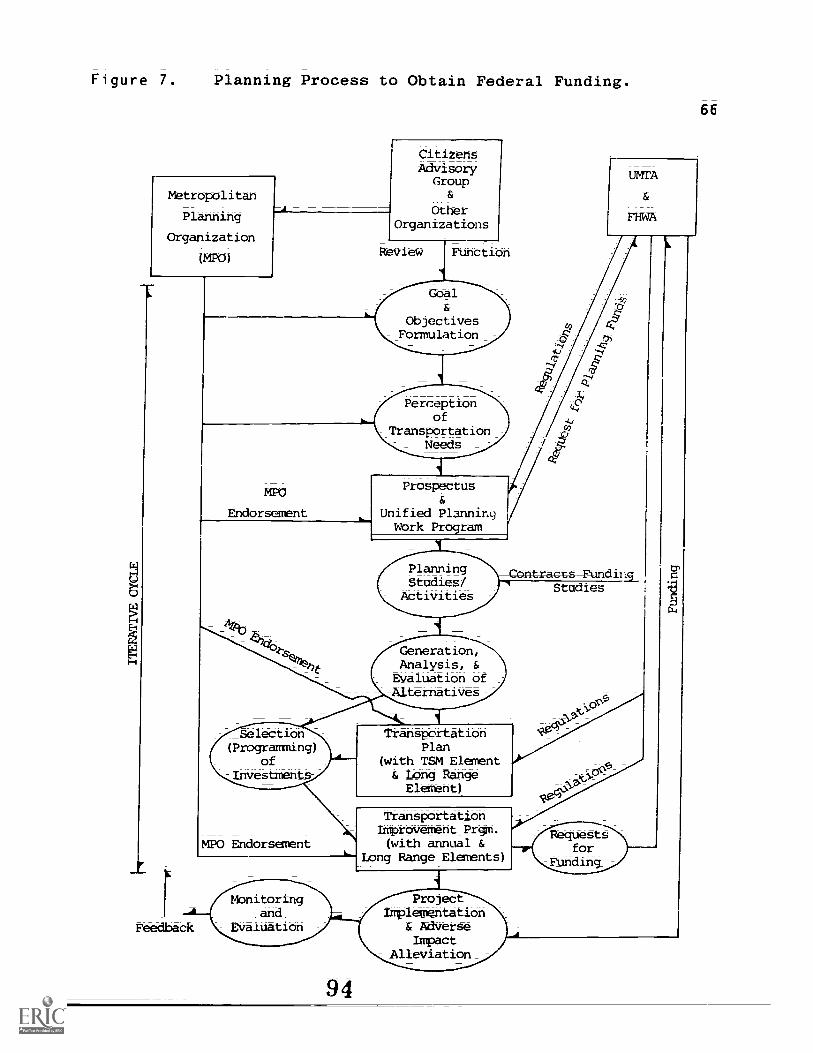
Figui-e 7. Planning Process to Obtain Federal Funding.
Metropolitan
Planning
Organization
(M40)
CitizensAdvisory
Group
OtherOrganizations
Review FUnCtiOn
Gbal
ObjectivesFormulation
Perceptionof
TransportationNeeds _
MPO
Endorsement
PlanningStudies/
Activities
MPO Endorsement
TransportationPlan
(with TSM Element& Long RangeEleent)
Transportationlimprovement_Prgm.(with annual &
ng Range Elements)
Req00StSfor
-Fundins
Feedback
ProjectImplementation
& AdVerseImpact
Alleviation_

67
priorities. The following simplified case illustrates how
systematic planning was used to determine design
characteristcs and how this design was then fit into an
overall financial and political framework.
The Case of Santa Fe, New Mexico
In 1977 the Mayor of Santa Fe, in response to community
requests, appointed a Public Advisory Committee to
undertake a needs-based traasportation planning project
process for the city. The results of the planning steps
arq summarized below.
Market Segmentation Analysis was conducted from
analy ! m of census data and from suryeys. Some of the
major ronclusions of this analysis were that:
14.7% of total households in Santa Fe do not own a
car (as compared to a national average of 13%)
In 7 of the 12 census tracts, more than 40% of the
population is 18 years of age or younger; in half
of the tracts, 15-30% are 60 years or older.
574 nf the telephone survey respondents indicated a
Wingness to pay additional taxes to finance
pubiic transportation services.
95

68
7% Of the telephone respondents indicated theie
hbUtehold had a handicapped member. 62.5% inditated
that the indiVidual's disability caused severe
transportation problems.
64% bf the telephone survey respondents and 58% Of
the tbmmunity rated public transportation at leatt Of
equal importance with other munitipal terVitet.
Pettonal interviews with leaders of tommuhity
organizations revealed that:
taxi service was inadequate in Santa ;
there was a perceived need for publit teantportationi
and the belief that citizens would support a trahtit
system;
there was opposition to a city-opeeated tytteM; the
dbMinant view was that service Should be orovided by
a private operator with assistance from the tity; ahd
terVice for the elderly and handicapped should be the
number one priority.
Assessment of Existing Services revealed that:
taxit were the only means of transportatiOn fbr the
general pUblici and that from 1975 tb 1978 the total
number of cabs had decreased frOm 11 tO 4.
all bther transportation services were retteicted tO
specific clientele and were of limited Size.
96

Analysis of Unmet Needs was conducted by placing the
needs and preferences alongside the existing services.
Given the low level of existing service, the planners were
basically able to assume that all needs for public
transportation were essentially unmet. Groups, which were
especially disadvantaged by lack of services, were then
designated as:
low income residents;
carless households;
the elderly;
the young; and
tne handicapped.
In addition, they noted the large percentage of local
residents who believed Santa Fe needed a form of public
transportation.
A system was then designed based on the previous
planning steps. First, the Committee prioritized the
transportation needs in order of importance. This
basically involved local political concerns. The top five
priorities were, in order, the handicapped, the
dlsadvantaged, the carless, the elderly, and commuters.
With their priorities clear, the Committee began to
consider specific alternatives which included:
o Fixed-Route Bus Service Service - a city=owned system
available to the public at the standard faee.
97

Dial-A-Ride Bus Service = tity=Owned Shared-ride
VehiCieS iiroviding door=i6=dtitir Sei'Vite on clethahd;;
User-Side Subsidy = faee distoUntS to specific groups
using privatelp=owned shaeed=i-ide taxi services;
The fixed-route bus service would haVe been of little
use tO the taii-Wority handicapoed segment beCa6Se it -viaS
net iziooi'-to-dOO-r'; 6iveil the lack of a iotai taki fleet tO
tontraCt With for a uSer==subsidy oeogeami the COMMittee
seleCted Dial-A-kide as iis top oeioeity.
Howevev7-, the city chose the user=subsidy progi-am beCause
it was fa.- eaSier to implement than buying a fleet of
Dial-A-Ride vehicles. Administrative and financial
investments were far less, and the proposed operating costs
were similar. Lastly, to increase the number of taxis, the
city recruited and contracted with a large taxi company to
begin operations in Santa Fe under th6 new program.
Summary
Tai'geted design iS a two=phase Ortitets. The planner
Mutt first design transportation systems bated on local
needs, existing systems, and cost effettiVehetS; At the
tame time, the political and fiscal 6hVieohtentS Must be
Continuously assessed to determine the featibility of
implementing the resulting proposals.

Neglecting either of these phases will lead to failure,
while attention to both will not guarantee success. The
complexity and difficulty of transportation management is
clearly revealed by attempts to implement new services or
alter existing ones. Illustration 6 shows how system
planning is a continuous process which does not conclude
just because an innovation is implemented.
9 9

tio 6. The Transportation Planning Cycle
FEM MONITOR) EVALUATION
UNMETNEED
DETERMINATION
kLISTIC PROBABILITYF IMPLEMENTATION
POLITICAL/FINANCIALFACTORS
PRACTICAL/LOGISTICCONSIDERATION
PROPOSEDSOLUTIONSAir
101.

73
STUDENT REVIEW
1. Discdtt téVeral ways by which planners can gather data
tO learn the transportation needs of their citieS and
regiont. Specify sources of data and the nature Of
information from each of these.
CbeittrUtt a transit needs questionnaire which Would
indicate groups of students at your university that need
regular transit service;
3. Using Figure 8; On the next page; calculate:
a. annual ridership
b. cost/vehicle mile
C. cost/passenger
d. cost/passenger if ridership increased to 5 % of
capacity
4. COMpare the figures obtained from Question 3 with thbse
taltulated previously for the subscription bus Servite
(See FigUre 5, pg. 51); Why does the DRT service have
lOWer ridershiO/capacity and higher costs/passenger?
5. Find ah UnMet transportation need or demand in your
area and interview a person affected by it. Report your
findings to the class and discuss possible services
Which could meet the need.
102

_ Figure 8:Hypothetical Data for a DRT Van
With 2 FUll-Time Drivers
ANNUAL COSTS
Labor $ 31;874
Fuel $ 3;600
Maintenance $ 7;200
Insurance $ 1;740
Administration a dDispatching $ 20;720
Fees & Licenses $ 240
Total Operating CostWithout Capital $ 65;374
Capital (Vehitlé) $ 3;840
Total $ 69;214
Annual miles 30;000
Avg. Occupancy per hour 2.4
Capacity of Vehitle 12
Hours of Operation per year 3536
103

7 5
GUIDELINES FOR STUDENT REVIEW
Surveys can be administered to employers Or to the
general public to learn Of the Specific travel
needs of individual grbubs Or
Contact with the public awciet and community
groups can reveal the travel needs of specifit
groups;
c. Existing literature, such at StUdiet and reports,
can document problems and solutiont for partitulai-
settings;
2; Guidelines should be established by the Orbfesscor.
3.. Annual Ridership 8,486
Cost/Vehicle Mile- $2 31
Cost/Passenger $8 16
Cost/Passenger at 50% capacity . . . $3.26
104

76
4. The DRT service has a lower ridership/capacity and
higher costs than a bus pool in part because in the DRT
system:
a. each passenger is picked up at an individual time
and location
b. each boarding requires time;
c. the vehicle must follow a separate route for each
passenger;
d. the vehicle has its fixed costs divided by a far
lower capacity; and
the DRT system has high administrative costs
associated with the scheduling and routing of the
vehicle and management of fares.
5. To continue this discussion; discuss the political and
financial feasibility of implementing the solutions
proposed for particular needs; Would they be utilized
and cost-effecive; or would they be inefficient and
costly?
105

77
FINANCING PARATRANSIT
The purposes of this section are:
To familiarize students with the existing framework
for financing paratransit operations.
To acquaint students with the current state of
financing for paratransit operations.
Research on the effectiveness and feasibility of
paratransit systems has taken place almost exclusively
through demonstration projects funded by the lh.bah Mass
Transportation Administration (UMTA) and the Federal
Highway Administration (FHWA). The prOblems and risks
associated with implementation of new transit And
paratransit systems on a private investment basis are
considerable. Private taxi and bus franchises operate
within rigid legal frameworks. Union and pUblicly-employed
drivers are protected by federal laws against loss of their
jobs; In addition, the capitali maintenance, and operating
expenses of vehicle fleets require large investments with
no guarantee of payback.
106

78
StartUp Costs
The federal government continues to finance research and
demonstration projects. SUch grants are of two types;
planning and implementation. Funds for planning are
generally used tO determine characteristics and sizes of
potential rider groups in areas or regions; and to
recommend which systems and modes should be introduced.
Funds for implementing systems are designated for the
purchase of vehicles; where recommended and approved, and
the costs of operation for a liMited time. Funding for the
continued operation of systems is generally contingent on
the initial success of the Project and on government
spending prioritiet.
Many systems have succeeded on their own beyond the
period of federal funding either in whole or in part. The
Pittsburgh ACCESS program; foe ekample; continues to
operate under contract from the city in the management and
coordination of social service and demand-responsive
riders. In general; however; paratransit systems are new
enough that theie ultiMate eole and economic feasibility
cannot yet be fully defined.
Outside Financing
The unique role of paratransit in providing
individualized and economic "trip-demand" service makes it
possible to find alternative sources of financing. This
has been demonstrated by the number of companies that have
107

79
decided to purchase vehicles for use by employee pooling
groups. The savings in parking lot construction and
maintenance, as well as the improved regularity of workers
arriving at and departing from work; offer convincing
arguments. Employers can also help offset the costs of
ridesharing feasibility studies by permitting and assisting
agencies to survey workers;
Vans and Bus Pools
Coordination and facilitation of ridesharing and pooling
is one means of providing low-cost paratransit services.
Vans and bus pools are commonly sponsored py third parties,
often public transit agencies. The employer or sponsoring
agency can lease the vehicle or purchase it outright, and,
in turn, lease it to a group of commuters either directly
or through a broker. Fares are set so as to cover all
costs, including depreciation and insurance. Van pools, in
particular, are one of the most cost-effective methods of
commuting, particularly for long distances. A recent
Congressional Budget Office study estimated that the
average cost per passenger for a 10-mile, one-way commuting
trip in a metropolitan area is 5.7 cents for a ten-member
van pool, as compared to 23.1 cents for a bus.
The two financial profiles that follow illustrate two
types of van pool operations. In Norfolk, the target
commuter population was estimated at 86,000; all working at
108
80
the U.S. Naval Base; In Golden Gate; the commuter
work-force was estimated at 140;000; all working at various
locations in San Francisco; but all traveling along a
targeted northern corridor; The Norfolk project purchased
and operated the van service. In both cases, initial
financing came from the Urban Mass Transit Administration.
(See Figure 9)
In addition to financing and managing paratransit
services; which involves the purchase or leasing of
vehicles; transit agencies can act to promote and
coordinate ridesharing and pooling for local employers.
The promotion of vanpools programs by major employers is
increasing nationwide as its benefits are becoming better
understood and the efforts of transit agencies are one of
the causes.
User-Side Subsidtes
User-side sutsidies are discounted ride tickets
provided to targeted groups for the purchase
of transportation services.
Since 1976 user-side subsidies have entered into the
economics of transit and paratransit services. When used in
conjunction with a public transit system, such a strategy
109
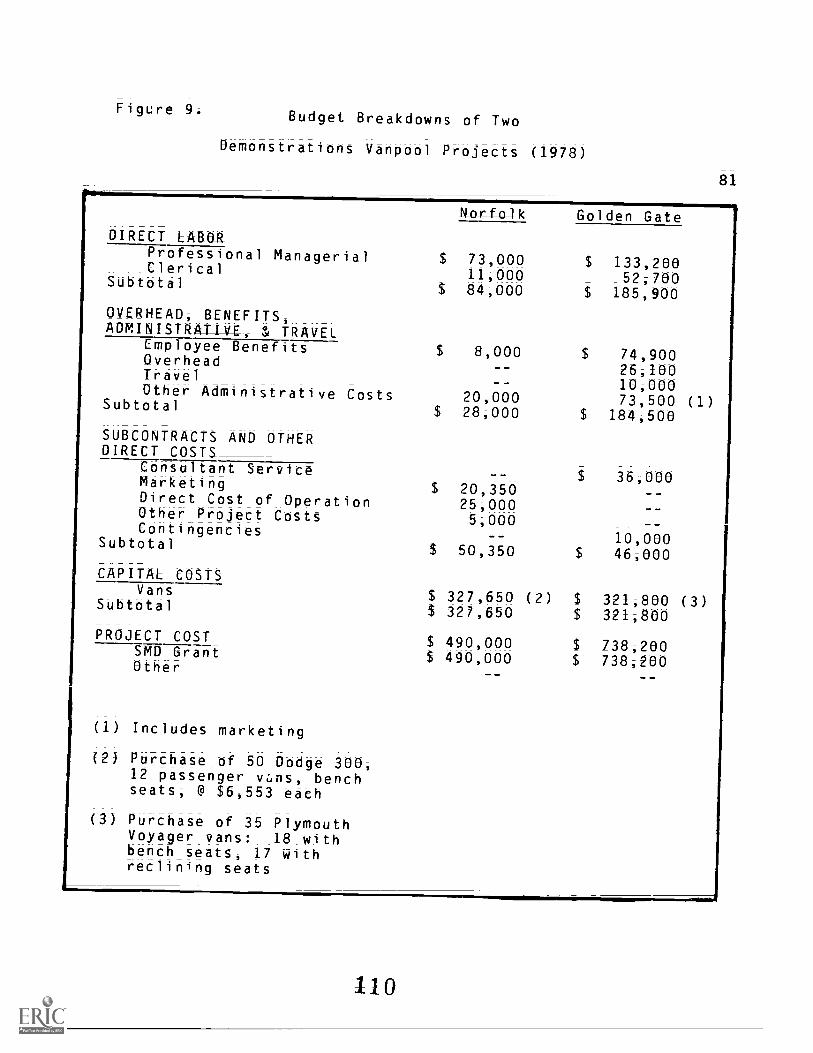
FigUreBudget Breakdowns of Two
Demonstrations Vanpool Projects (1978)
81
DIRECT LABOR
Norfolk
(2)
GOldeh Gate
(1)
(3)
$ 73,00011,000
$ 84,000
$ 8,000
--20;00028;000
$ 20,35025;0005,000
$ 50,350
$ 327,650$ 327,650
$ 490,000$ 490,000
$ 133,200_52,700
$ 185,900
$ 74;90025,10010;000
_73;500184;500
$ 36,000
--10;000
$ 46;000
$ 321,800321,800
$ 738,200$ 738;200
PrOfessional ManagerialClerical
SubtOtal
OVERHEAD, BENEFITS,ADMINISTRATIVE, & TRAVEL
Employee BenefitsOverheadTravel
_ Other Administrative COttsSUbtötäl
SUBCONTRACTS AND OTHERDIRECT COSTS_
Consultant ServiceMarketingDirect Cost of OperatiOnOther Project CostsContingencies
SUbtOtal
CAPITAL COSTS_ VansSUbtotal
PROJECT C_OSTSMD GrantOther
(1) Includes marketing
(2) Purchase of 50 Dodge 300,12 passenger vns, benchseats; @ $6,553 eath
(3) Purchase of 35 PlyMoUthVoyager vans:_ _18 Withbench seats, 17 Withreclining seatS
110

82
tends to increase the numb,.2rs of riders using the system
for which the subsidies are designated; This has had
positive effects in that it acts to lower system deficits
by moving more money through the system.
In reality; many user-subsidy programs are run by the
government but the specialized service is provided by
private operators such as taxi companies. The transit
agency acts as a broker and contracts with these companies
to accept the ride tickets and submit them for reimburse-
ment. Ih this way the agencies cost is limited to the
actual cost of the subsidies plus administration;
User-side subsidies are financed by local; state; and
federal tes; and by state lotteries; The use of
user-side subsidies represents a means whereby targeted
segments of lOcal populations are given the opportunity to
take advantage of existing systems; both public and
private. Common recipients of these subsidies include the
elderlyi the disabled; and low-income groups; With these
sUbtidiet; the designated user groups are better able to
travel and transportation providers realize increased
ridorship.
ill

83
Summary
Financing paratransit operations varies with the type of
system to be funded and with local, state; and federal
funding priorities. Involvirg the private sector as service
providers can reduce capital costs, while involving major
employers in vanpool programs can cost very little.
User-side subsidies are another means of providing targeted
services without developing entire new systems.
MARKETING PARATRANSIT
The purposes of this section are:
To make the student aware of the ceitical tOle Whith
marketing plays in modern transportation.
To familiarize the student with the basic elementS of
transportation marketing.
Active and ongoing promotion is necessary for any new
product or service. Suppliers generally do this through
advertising and public relations. A promotion is designed
to highlight the benefits of a product or service so that
the general public is influenced to consider What is being
promoted in terms of their own lives. Whether we fear bad
breath or are bullish on America, we are all influenced by
advertising. Transit and paratrnsit services represent
choices, and, as such, need to be visible and promoted.
Vtsibility m
Commuters, as woll as the general public, are flooded
everyday with the sight of passing vehicles. Paratransit
vehicles must operate within this flow and for the most
part blend into the myriad of colors and shapes. In
113

85
recent years, however, minibuses with the wordt DIAL-A-RIDE
boldly printed on all sides have begun to appear as
singular items in the otherwise indistinguishable lines of
vehicles. Similarly, special purpose vehicles for the
handicapped can be made to carry a message. The same holds
true for commuter vans and buses.
This element of visibility is an important form of
ongoing promotion for paratransit. A commuter sitting
alone in an automobile in a stalled line of traffic cannot
help but think of pooling when a distinctive van or
subscription bus filled with happy people passes by in a
"high-occupancy vehicle" (HOV) lane. Likewise, the harried
shopper, angered by the slowness of a checkout line and
worried by the expired parking meter two blocks away, must
stop and think when a DIAL-A-RIDE minibus pulls up and a
rider casually climbs aboard.
User Input in Planning
The idea of systems selling themselves is not enough;
Nor is it possible to design a promotional campaign to save
a system which was poorly planned and does not provide
needed services. What is necessary is to start system
planning with an integrated view of the product (service);
price, and promotion which will be provided
Because paratransit systems require the commitment and
cooperation of specific user groups, a plan to locate and
114

86
recruit these groups is essential. Much can be done to
attain these objectives during the initial planning. The
44r-ect involvement of people in an enterprise is a proven
technique in gaining support. Such involvement begins with
conducting surveys and meeting with groups.
The involvement of locai people in analyzing the
transportation needs of their neighborhoods can go a long
way in ensuring interest. Follow-up reports to them on the
results of planning efforts is another element of this
strategy. Community groups and leaders should also be
included in the design and implementation stages. They can
often provide informdtion that planners "from other parts
of town" would not otherwise know about. The importance of
local input should not be underestimated since cooperation
and participation at the local level is the foundation of
system success.
Planning a Marketing Strategy
Marketing strategy should begin during the first stages
of paratransit planning. Market segmentation analysis
provides insights into the needs and preferences of the
general population as well as specific segments and
clusters. Analysis of existing services reveals which
systems have adequat -idership and which suffer from
unused capacity.
115

87
Makthe&ystem Known
Strategic planning and design should lead tO the
selection of the best mode for targeted rider groups; but;
again; products do not sell themselVes. No matter how
_a_gprop_riateasystem may be, its existence and benefitS
aust_b_emade known to the public. Since paratransit
services are aimed at individual segments; adVertising of
the services should be done directly to the segments and
should highlight the service benefits.
An example of this would be the announcement of a
special shopper's minibus from a particular housing
development; It would be distributed at the. housing
development and clearly state the times of service;
location of pick-up points; and fares. The promotion would
highlight convenience, reliability; and courteous service.
It might also remind people that their input was
responsible for the existence of the service.
Ridership data which is generated from the assessment of
existing services provides useful information for
marketing. Analysis of why some systems enjoy a sustained
ridership can reveal strategies for developing or
increasing ridership for other services.

88
Destination ts a Key
The nature of transportation is that it is a means of
getting people to and from desired locations. That it to
say, it is not an end in itself. Although this may seem
-;obvious; it is an iMportant concept in marketing of
services; Because a new bus is fast and st'reamlined, aud
offers half-priced fares, people will hot eide it if it
does not go where they want to go. Destination is a prime
determinant of ridership, so destination should be the
ng message. Similarly, system maps
should be clearly written and easily obtaihab16.
Xarketl_n_g_RAdesharing
In general, pooling results in people arriving to work
on time regularly, and it is significntly less expensive
for a rider than driving alone. Because of itS
desirability to workers, pooling services are now promoted
as an employee benefit. From a company standpoint, the use
of vans to carry as many as twelve people to and from work
can eliminate the need for much of the parking space that
was believed essential ten years ago. This results in
considerable capital savings in construction and
maintenance which more than justifies the purchase
vehicles;
The benefits of pooling and ridesharing are well
documented, yet organizing and implementing such
paratransit systems can be difficult. The cooperation
117

89
employers is essential to these types of operations because
the place of employment is the primary common ctaracter-
istic of potential users. Marketing ridersharing to
employers and employees is an evolving job for planners,
managers, and brokers. Many successful vanpools exist
today, and this trend will continue partly because they do
benefit employers as well as employees; Many larger
companies subsidize vanpools by purchasing or assisting in
the purchase of vehicles.
Rideshating is only one type of paratransit and, in many
ways, the simplest to implement and promote (see Figure
10). It has a direct and immediate influence on reducing
traffic and can be a convincing alternative for
solo-driving commuters. Promotions for pooling and
ridesharing are often done through radio and t;v; spots, on
billboards, in newspapers, and directly through places of
employment. Some cities have set up ridesharing hot lines
and computerized ride and rider matching services; As with
all aspects of managing paratransit services, marketing
requires imagination and an understanding of the community;
Sustaining Ridership
Sustained ridership will depend on maintenance of the
quality of service and on continued promotion. It is
important to note that promises made in advertising
material must be followed up by service that MattheS
these. Ongoing evaluation will help determine which
118

Figure 10. Sample Ridesharing Promotional Brochure.
P...A.oPin
g
SAVE A BUN !you can save$575 a ye'ar
...just by changingthe way youride to wod<!
We'res'Sbpre a Ride: and tt*$575 is approximately IMlatyoucan save if you don't drive yourown car to work akvneeveryday.Now. before you go stiff in yourchair over the Incitight Of nothaving your yery own car sitting outthem in the company_porking lotall day everyday, consider some ofthe advantages of sharing a rideto work
You're going to save a lot ofmoney .. real, spendable, tax freeincome just because not drivingwill cost you less
Depending on the car you'redriving you may save_o little moreor a little less Ihtih our S575 Ifyou're driving a '39 Volks poweredby a rUbberband chances areyou've beat the system If you'retooting to work in a 78 Mercedes4513 SEL, we're about to save vou abundleMOS1 dcryt &hien lb Work.and that's easier on you. Parkinggels eosiew because there arefewer cars on the lot.
If you're a one car household,leaving the car at home will helpothers In your family get around.
And Share a Ride is a neat way tomeet some new folks.
Thvre ana Ride". Imost?
numbers ofto the virtuSumas! holyou folks dcftexible_wwerilday Pmay qualiNauto insuros
driving o nifVcxt fry _free.needs. too Ivery least. rchauffered Icomfort wipaper_ Oric(work. and olhove loct0 E kiterett,
arid tellrk:" monthfictioard. and
Source: Evaluation of the Minneapolis Ridesharin giommuter Services1980; p. A-3
BEST COPY AN

91
strategies work and which do not.
In addition to standard advertising strategies, several
uniquely transitoriented techniques can be adopted.
Off-peak fares, discount ride promotions, and similar
inducements have worked well in increasing ridership f r
both transit and paratransit systems. The involvement of
business can also be used tO promote a system by their
granting price discounts to regular system users.
Reduced-fare monthly passes have been proven to
encourage system use not only for commuters but also for
the general public. In Westport, Connecticut, it was
learned that the use of more efficient vehicles led to
reduced operating costs. These savings could more than
compensate for the costs of discounted monthly and faMily
fares. Such fare inducements led to increased riderShi0
which further enhanced the economic performance of their
Maxitaxi and minibus systems.
Summary
Marketing paratransit services begins in the planning
phase where an integrated combination of prOduct (service),
price; and promotion must be designed. The input of local
people and potential service users is a critical element in
this process. To succeed, paratransit systems must be used
which requires that potential riders know the systems and
have confidence in the quality and utility of the services.
-a
120

92
MANAGEMENT OF PARATRANS1T
The purposes of this section are:
To familiarize students with management tatkt
associated with paratransit.
To describe several types of management structures.
To discuss the concept of brokerage and illustrate
its use in paratransit management.
Typically, planners, engineers, managers, and operators
have each controlled specific tasks in the overall design
and operation of transit systems. By the 1970s, however,
the need for coordinated planning and operations became a
focal point in the field of urban mass transportation. In
the effort to redevelop urban and regional transportation
systems; it was discovered that th-ere was a notable latk of
expertise in coordinated planning and management.
Just as local characteristics, needs* and conditions
determine system designs, they also influence management
structures; A city of fifty thousand would obviously have
a smaller and less complex organization than a city Of

93
two-hundred thousand. Larger cities or regions may contain
several fixed-route systems along with a rumber of bus,
vani and taxi services; Managing these systems as an
effective network is the job that confronts today's
transportation professionals, and it must be understood
that local fiscal and operational environments will
determine the size and organization of individual
management structures;
General Concepts of
Coordinators of paratransit systems have generally been
people with special interests in a particular area. Since
the development of paratransit is relatively new, there are
virtually as many management models as there are pilot
program experiences; Nevertheless, the need for
versatility and self-motivation in managers has been proven
in all cases;
The cooperation and participation of the public is the
basis for all paratransit operations; Ridesharing and
pooling operations require than people make the choice to
participate and to remain active; Similarly, the choice to
use other paratransit sevices, such as downtown dial-a-ride
minibus, often requires that riders actively decide to
leave the car at home; In terms of management, this
translates into aggressive marketing and good community
relations;
122

94
Ongoing evaluation is another key to sound management.
This necessitates the monitoring of both quantitative and
qualitative elements of the overall system. The mechanisms
for evaluation are set in motion during the initial
planning stages. The user surveys and computations of
performance factors serve as the means of monitoring the
systems. A systematic updating of this data should provide
the information needed to assess system operations.
Structure
Paratransit operations can be integrated into a mass
transit structure or managed as a separate body. In either
situation, the management and operations staff Will be
determined by the size a d scope of the operations.
The two examples that follow represent two basic types
of paratransit systems* one in which the agency leases
vehicles to outside operators* the other in which the
agency directly operates vehicles (see Figure 11). These
examples* TTDC of Norfolk and GOlden Gate were used ih the
previous section to illustrate financing. The effects of
the management structure on the financial needs of an
agency can be seen by referring back to the profiles 0
these two systems. The informatin about these systems iS
taken from comparison of Organization and Operational
Aspects of Four Vanpool Demonstration Projects (UMTA
1979).
123

lOgure 11. Comparison of Norfolk and Go n Gate Vanpool Systems Structure.
TiddWater TYinSportation
District Commission (11DC)
Norfolk
Norfolk Vanpool Program:
- two full-time managers
- one half-time clerical
Marketing and
Prcaotion
Management of:
= finances
= Vehicle maintenance
Teases Vehicles to
Employees
Employer
MS: Naval Base
Matching Progratii Of
Marketing and PrOtotion
[7:omputer Cperated Van;To-1-1:1,=rDURCE:
Aspects of Four Vanpool Demonstration Projects;Heattiti JAC-WA-Oho & Pdaqe. 1979.
Golden Gate
Golden Gate Distri:t1
Special Project Cffice:
-I
- one half-time administrator
Vanpool Project
- five ftll=tite peitohhel
- two part=tite perSOnnel
Management of:
- vehicle fleet administration
- drivers
- vehicle maintenance
- finandeS
marketing and promotion
Agency Cperated Vanpools
125

NOrfOlk
The Tidewater Transportation District COmmissiOn (TTDC)
directly manages the Norfolk vanpool program. TTDC
OUrthases vans and leases them to qualified employeet Of
the U;S; Navy; TTDC is also responsible for overall
fidanCial management, vehicle maintenance, and general
marketing and promotion;
The U;S; Navy supports vannool projects by conducting
matching programs and marketing efforts at the level of the
ihdiVidual commands, which may contain from 20 to 11,000
personnel;
The vanpool program staff at the Tidewater
TrantpOrtation District Commission is composed Of'tWO
fUll-time and one half-time employee:
Project Manager - responsible for overall
iMplementation and management of the program.
Transportation Services Representative = responsible
for managing the marketing campaigns with the Navyi
Working with the Navy commands on matching programti
and coordinating with drivers on administrative and
operational matters;
Clerical Person (half-time) - provides clerical
support to the program and records monthly operations
data from vanpools.
126
97
The vanpool staff reports directlY to the Service
Development Manager who is one of 3 managers reporting to
the Executive Director of TTDC. The vanpool program draws
upon the resources of other TTDC divisions. such as Finance
and Operations, as required.
Golden Gate
The Golden Gate Bridge. Highway and Transportation
District directly manages the vanpool program. Its
activities include financial management. vehicle
maintenanCe, general marketing and promotion; and matching
of pool groups. It also employs professionals in the field
to serve on a Technical Advisory Committee;
The vanpool project staff at Golden Gate District is
part of the Special Projects Office. The head of this
office. the Special Administrator; devotes about half his
time to the vanpool project and reportt to the District
Manager. There are five additional full-time positions and
two temporary employees on the Staff:
Vanpool Developer/Project Administrator - responsible
for overall administration and project activities for
the vanpool program.
Fleet Administrator/Pool Coordinator - responsible
for fleet administration and pool organization;
Oversees a d assists driver coordinators. Supervises
Vanpool Project Assistant and Vanpool Coordinator.
127

98
Vanpool Project Assistant - under direct supervision
performs support work in fleet administration,
bookkeeping; and data töllettin.
Assistant Pool Coordinator - under general
supervision is responsible for matching applicants;
qualifying drivers; coordinating organization of pool
groups and data collection.
Vanpool Data Collection Clerk - responsible for
maintaining van insurance coverage and billing;
organizes and coordinates Defensive Driver Training
Courses; and provides clerical support.
Vanpool Aide (full-time) - responsible for promotion
and marketing of the vanpool program.
Administrative Assistant (part-time) - responsible
for the coordination of the various Ridesharing
Programs.
BOth TTDC and Golden Gate represent commuter vanpool
operations only. The structure of a comprehensive
multimodal paratransit system will be deteribed and
illuStrated after the following discussion of
transportation brokerage.

99
Brokerage
Management of paratransit is handled within publiC or
private agencies often by individuals who act as brOkers.
A brokerage operation is one in which a middleperSOn (the
broker) analyzes demand and negotiates with prOviderS td
supply services to specified groups or districts. The
broker usually has no capital investment in vehicles and
acts as a consultant to organize riders, resolve barriers,
set up contracts; and manage financial arrangements in
order that service be provided;
Brokerage provides a way to match existing serviCet With
designated transportation needs; The brokerage concept
seems especially effective because it can provide services
outside governmental and political structures. Because of
this, brokers are generally free to operate quickly in
response to changes;
Some local governments have found it operationally and
financially more efficient to broker services or segments
of services; The costs of training new personnel along
With capital expenses and the maintenance of vehicles can
impose increased tax burdens on areas whereas a private
operator already has management structures and maintenance
fACilities in place.;
The following is a summary of the Westpo-rt-Connecticut
Integrated Transit_S_yt_m_Ei_nal_Rep_a_rt (UMTA, 1979). It is
129

100
intended to demonstrate both the pötèntiàl scope of
paratransit operations as well as the use of brokerage in
managing such systems. Figure 12 presents a detailed
breakdown of individual operational activities.
Westport Demonstration Project
The Westport Demonstration was based on a major
brokerage rcile played by the Westport Transit District
(WTD) supported by a nuMber of contractual relationships
between WTD and the private sector. The major elements cf
the opertional structure were the management company, the
control center, the infOrmation center, and system support
contracts ih the areas of marketing and maintenance (see
Figure 12).
This structure enabled the WTD to provide regular and
supplemental fixed-route sr.,rvices, shared ride taXi
service, and special market services to local residents.
The structure also provided a foundation for developing
expanded brokerage services to meet the needs of local
businesses, downtown merchants, and special grou s.
All demonstrations were provided by an integrated
vehicle fleet containing the original Minnybus and Coach
vehicles, and 11 Vans purchased through the Demonstration
Grant.

11Figure 12. Structure of Wettport Demonstration Plan.
operations broker
Management
Contract
IControl Room StaffPrivate
Transportation SupervisOry Management
CbmPanY Drivers
Maintenance
Contract
AtipsysimametINNINNip
Vans
Available
i"...-1
Shated=Ride Taxi
Fixed-Route Supplementary
Special Markets
SUbscription
Gdoids Delivery
Butes Fixed-Route COmmuter
Fixed-Route Daytime
i
Maintenance Staff.FleetMaintenance
Fuel and Vehicle...Nanagement
Storage
WID Maintenance
WTD Dri Vert
preVentive
MarketingMarketing
Contract
InformatiOn
Broker
Information
Center
Pass Sales
Control
Center
Information
PUBLIC
Youth CommOtersElderly_ AdUltt
Handicapped
SOURCE: Futnitti Robert E; The_West
OTETE
TRANSPORTATICN SERVICESPreuium Rent-a-CarRide Taxi Schoo1 BusLsié
ott Connecticut Inte rated Transit S-ttettio 1979.
132

102
Management Company
The demonstration involved the WTD inviting the two
local taXi operators to form a management company to
provide the new paratransit services under contract with
the Transit District; The formation of this private entity
was an attempt of the WTD to integrate the valuable
components of taxi structure and operations which include
taXi-type door-to-door service, dispatching capability,
administrative experience; and the operations' familiatity
With the local community's geography and infrastructure.
The management company's contract responsibilitieS
intlUded provision of personnel, and supervisoey and
Management functions for the folowing system elements:
Paratransit services including shared=ride taxi,
Special market services, subscription service, and
small-goods delivery;
Specified supplementary fixed-route services.
Control center and dispatching duties for the above
named services; as well as for all fixed=route
services provided directly by the WTD.
Hiring; payroll; and other personnel activities necessaty
to perform these functions were the sole responsibility of
the management contractor;
133

103
_Co_ntrol Center
A base of operations was necessary to house the
management company and provide an operational nütleUt fOr
ail communications, dispatching, and fleet deployMent
activities. Control center space a d equipment were
provided directly by the WTD, while responsibility for the
staffing and supervision was contracted to the management
company.
Specific services controlled through the Center
included:
Regular fixed-route bus services, both daytime and
,:ommuter (operated by the WTD).
Supplementary fixed-route services (operated by the
WTD and the private contractor).
Paratransit services including shared-ride taxii
special markets service, subscription service, and
small-goods delivery (operated by private
contractor).
The Center also planned to handle additional transportation
services in the community (rent-a-car, limousine, premium
ride taxi) in the event the WTD was successful in
integrating other services through its brokerage rOle.
134
104
Information Center
The next system element was an interface between the
service operations and the public. The Center's function
was to provide comprehensive information on all transit and
paratransit services in Westport as well as premium-ride
taXi, regional bus service, commuter rail services, and
rent-a-car service.
Support Syst-_ Contracts
Marketing and maintenance activities were carried oUt
through contractual arrangements with outside profess-
ionals. The markeing program provided by the contracted
firm stressed the comprehensiveness of the Westport system
and the integrated nature of the services. The program
included direct mailings, radio and television advertising,
and information displays.
The maintenance contract covered the general management
of the vehicles; fuel and vehicle storage, and vehicle
r pairs. The contract was with a local school but
contractor whose garage was conveniently located near
downtown Westport; Since this facility already had the
personnel and equipment to handle maintenance operations
the costs to WT0 were significantly lower than they would
have been if personnel were hired and equipment and
facilities purchased or leased.
135

1 5
Sumaary
The evolving role of a transportation manager is one
which included community contact and coordination along
with technical and engineering expertise. Because
characteristics and needs are unique to individual locales,
management structures must be flexibile. Transportation
brokerage is a developing enterprise which offers new
opportunities to both regional systems and individuals.

106
OVERALL SUMMARY OF PARATRANSIT MODULE
Paratransit is an approach to transportation which
utilizes vehicles on a continuum between the solo-driven
private automobile and fixed-route bus and rail systems.
It is a modern concept (though ideas such as ridesharing
are as old as transportation itself) which is aimed at
low-cost needs-based systems. Paratransit operations focus
on utilizing existing resources in innovative ways that
address specific needs and preferences of specified user
segments;
Paratransit systems can use a variety of modes and
vehicle types in providing services. Such systems are
often demand-responsive in that direct door-to-door
transportation is available to riders. This type of
service is especially effective for elderly and hanidcapped
users. The utilization of private taxi and van services
has helped sponsors virtually eliminate the capital costs
and reduce the operating costs of demand-responsive
systems.
A second major area of paratransit focus has been in
coordinating ridesharing and pooling services. Much of
this effort involves identifying and working with large
employers since the workplace offers easy access to large
numbers of users. Lastly, paratransit has been used to
137

107
provide feeder lines for fixed-route bus and rail systems.
The planning process for paratransit systems can be
broken down into four steps: 1) market segmentation
analysis; 2) assessment of existing services; 3) analysis
of unmet needs, and 4) targeted design. This process
identified market segments according to user needs and
characteristics, then breaks down the segments into
subgroups called clusters. Existing services are evaluated
to determine whether unserved needs can be met by such
services or whether new sytems are required.
New systems are designed according to the specific sizes
and needs of targeted unserved groups. Implementing new
systems can be a difficult task for planners, however, as
local political and financial considerations often take
procedure over the best recommendations of transportation
planners. It is for this reason, that the involvment of
local people and community leaders in the planning process
is so critical.
Financial and management structures of paratransit
systems are determined within the context of the size and
scope of proposed operations. Management and operational
costs will depend on the size of the agency staff and
whether the purchase and operation of vehicles are
required. Management structure will also depend on whether
operations will be handled within or outside the mass
transit agency.
138

108
Marketing is a principal tool for establishing and
maintaining ridership for systems. A strategy for
marketing should begin during the planning stages by
involving local people and community groups in the needs
assessment. Participation by the public is essential to
the success of paratransit operations.
Paratransit represents a new option for transportation
planners. Since the beginning of demonstration projects in
1974 under the Office of Service and Methods Demonstration
(SM0), a subdivision of the Urban Mass Transit
Administration (UMTA); a number of attempts have been made
to increase mobility and reduce auto traffic congestion
through the use of cost-effective and easily implemented
systems. The results of these demonstration projects are
available from UMTA (see Biblography, Appendix A). In this
module an attempt was made to consolidate the major
concepts and conclusions derived from the project reports;
The information in this module the first steps in the
evolution of modern paratransit in America.

109
STUDENT REVIEW AND INVESTIGATIONS
1. Why might a private corporation be persuaded tO nutchate
a fleet of vans fot a ridersharing program fOr itt
employees, and how could these costS be reCoVered by the
corporation.
2. a. What are user-side subsidiet?
b. DiStUSS the use of these subsidies and the effettt
(positive anl negative) that they might have On a
region's transit network.
_ _
. Describe the brokerage function a d its applications to
paratransit management.
4. HOW Can initial planning aCtivitiet be Uted at a
marketing Strategy for paratransit systeMs, and why
might this be an effective technique?
5. How can the information gained from assetsing ekitting
systems be Used tO help in marketing them?
6. Interview someone who utilizes a carpool or vanpool.
Discuss the costs and benefits of the arrangement and
how the group handles the radio, smoking, unscheduled
stops, and lateness. Report to the class and discuss.
140
110
GUIDELINES FOR STUDENT REVIEW
l. The amount of necessary parking space is significantly
reduced, leaving more land for productive use, and
studies have shown that employees arrive at work on time
more regularly; Costs can be recovered through tax
deductions for depreciation and investments in parkin.g
lot construction and maintenance; and through greater
productivity due to more regular starting and finishing
times of employees;
2. a. User side subsidies consist of discounted ride
tickets used most commonly by special needs groups
such as the elderly and the handicapped.
b. Common reasons given include:
Positive: More people use public and commercial
carriers, special needs groups become more mobile;
more money moves through transit systems. Private
operators can also prosper while helping meet public
needs cost-effectively.
Negative: Political posturing stemming from debates
over who gets the subsidies; objections by carriers
who do not benefit; debate over how to finance.
3. See page 90;
141
UI
4. Initial maeket tégMentation analysis reveals what
t6evit6t aee detired and what system characterics are
fOreMott in people'S decisions to choose a particular
tyttehi. Thit alSo aids in the planning of system
promoticin.
5. It tah proVide the economic and environmental data; cost
per passenger Mile; fuel consumption; air quality; and
other factors that demonstrate the utility of public
tyttem Over OiVate auto use; It Can 61SO id6ntifY
systems or tiMe periods of system operations which can
benefit from fare changes;
142
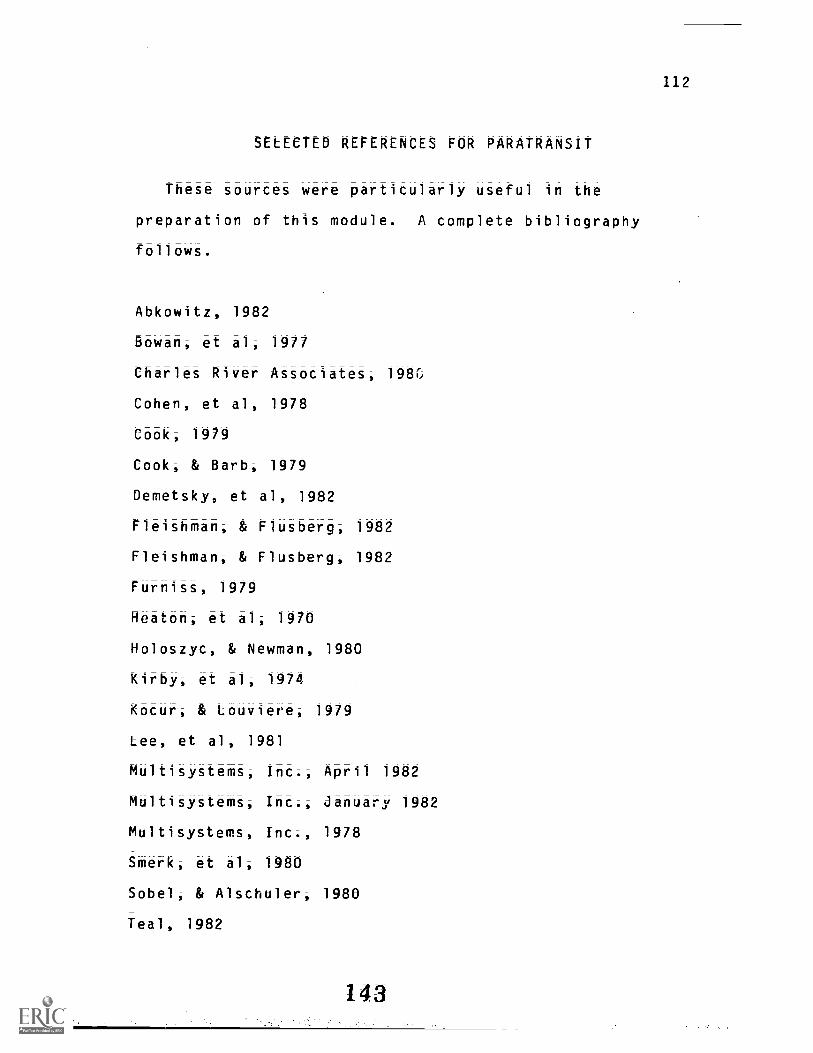
112
SELECTED REFERENCES FOR PARATRANSIT
These sources were particularly useful in the
preparation of this module. A complete bibliography
follows;
Abkowitz, 1982
Bowan, et al; 1977
Charles River Associates, 1981:
Cohen; et al, 1978
Cook; 1979
Cook; & Barbi 1979
Demetsky; et al; 1982
Fleishman, & Flusberg; 1982
Fleishman; & Flusberg; 1982
Furniss; 1979
Heaton, et al; 1970
Holoszyc, & Newman, 1980
Kirby, et al, 1974
Kocur, & Louviere, 1979
Lee, et al, 1981
Multisystems, Inc., April 1982
Multisystems, Inc., January 1982
Multisystems, Inc., 1978
Smerk; et al; 1980
Sobel, & Alschuler, 1980
Teal, 1982
143

Technology Sharing, 1981
Tennessee Valley Aut;iority, 1980
Transportation Research Board, TRR 863, 1982
Transportation Systems Center (DOT), 1981
UMTA/DOT. Paratransit Services for the Transportation
Handicapped, April 1982
Valente, 1983
Ward, et al, 1977
144
113

Al
APPENDIX A: BIBLIOGRAPHY
Abbreviations to be used in this bibliography:
DOT Department of TransportationFHA Federal_Highway Administration _
NTIS National Technical Information ServiceOSMD Office of Service and Method DemonstrationsTRB Transportation Research BoardTRR Transportation Research RecordTSC Transportation System CenterUMTA Urban Mass Transportation Administration
Abkowitz, M., Damm, D., Heaton, C., & Jacobson, J. (1982).Impacts and effectiveness of third party vanpooling.Washington, DC: UMTA/TSC.
APTA (1985). Transit fact book 1985. Washington, DC:American Public Transit Association.
Barb, C.E., & Cook, A.R. (1979). Technology transfer inparatransit: Five case studies. Washington, DC:National Academy of Sciences.
Barber, E.J. Wagner, D.W., Ellis, R.H., & Hallenbec , ME .
(1982). The Newport News, Virginia, easy-ridetransportation brokerage demonstration project.Washington, DC: DOT/UMTA.
Bautz, James A. Urban Microscale Planning for the 1980s .
Paper Prepared for the Conference on Travel AnalytisMethods for the 1980's, Easton, MD, Oct.. 3=7, 1982.
Beeson, J.D. (1978). Knoxville commuter pool: Annualreport, 1977-78. Washington, DC: DOT/UMTA.
Boaz, M., & Harman, L.J. (1980). The human servicestransportation consortium of Greater Bridgeport.Bridgeport, CT: Human Services TransportationConsortium.
Borowski, R.H. (1979). Automobile diversion: A strategyfor reducing traffic in sensitive areas. Washington,DC: National Academy of Science.
Burkhardt, C.E., Burker, W.G., Eisenberg, M.A., et al.Coordination and consolidation of agency transporta=tion. Washington, DC: TRB.
145
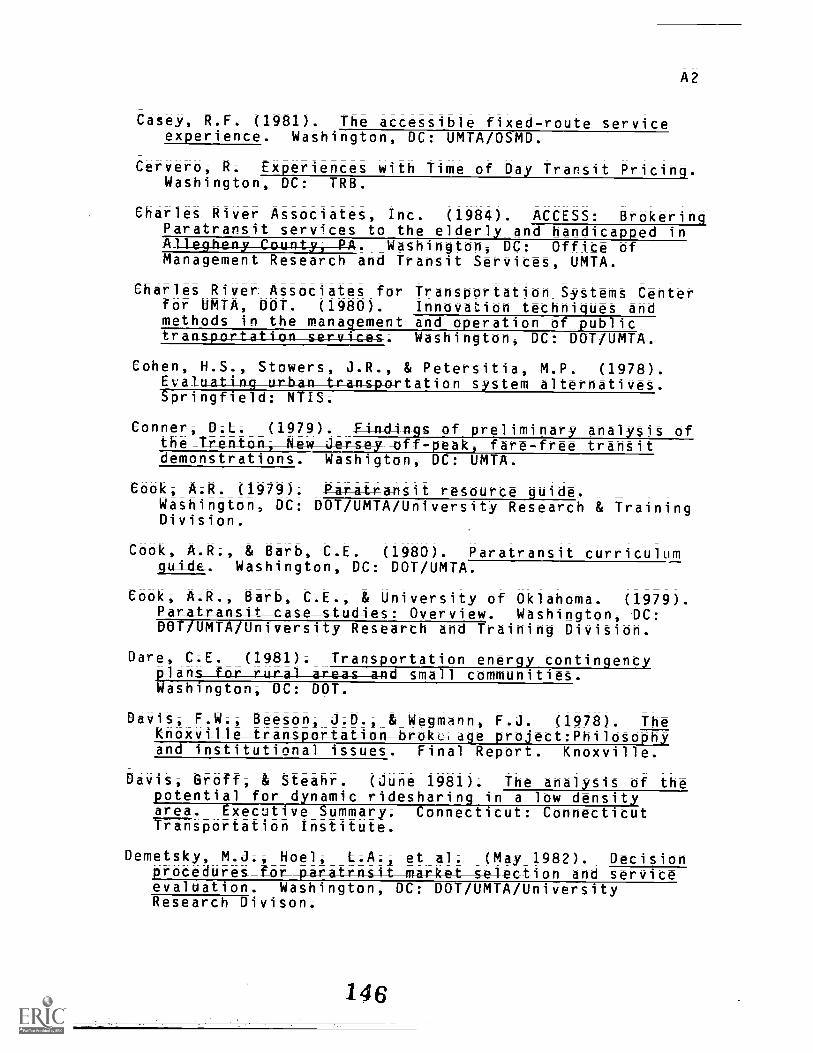
A2
Casey, R.F. (1981). The accessible fixed-route serviceexperience. Washington, DC: UMTA/OSMD.
Corvero, R. Exp_er_i_e_a_c_e_s_w__Ti-me of Day Transit Pricing.Washington, DC: TRB.
Charles River Associates, Inc. (1984). ACCESS: BrokeringPar : -to the elderly and handicapped inAl_l_e_Tkeny_Co_u_nty,_RA. Washington, DC: Office ofManagement Research and Transit Services, UMTA.
Charles River. Associates for Transportation Systems Centerfor UMTA, DOT. (1980). Innovation techniques andmethods in the management and operation of publictrail a I
. Washington, DC: DOT/UMTA.
Cohen, H.S; Stowers J.R. & Petersitia, M.P. (1978).Evalaatt;_g_u_rhan_i_r_ansp-;rtation system alternatives.-Springfield: NTIS.
Conner, D;L. (1979). Findings of preliminary analysis ofthe_Trenton_,__N_e_w__J_e_rs off-peak, fare-free transitdemonstrations; Washigton, DC: UMTA.
Cook, A;R; (1979). Paratransit resource guide.Washington, DC: DOT/UMTA/University Research & TrainingDivision.
Cook, A.R., & Barb, C.E. (1980). Paratransit curriculumouide. Washington, DC: DOT/UMTA.
Cook, A.R., Barb, C.E., & University of Oklahoma. (1979).Par. Rs: Overview. Washington, DC:DOT/UMTA/University Research and Training Division.
Dare, C.E. (1981). Transportation energy contingencyplans for rural_arzasand small communities.Washington, DC: DOT.
Davis, F.W., Beeson, J.D.,Knoxv tl_and _i_
Wegmann, F.J. (1978). Theage project:Philosophy
Final Report. Knoxville.
Davis, Groff, & Steahr. (June 1981). The analysis of thepotential_for_dynamic rides-Waring in a low densityarea. Executive Summary. Connecticut: ConnecticutTransportation Institute.
Demetsky, M.J.- Hoel, L.A., al. (May 1982). Decisionprocedureslor_ Jection and serviceevaluation. Washington, DC: DOT/UMTA/UniversityResearch Divison.
A3
Demetsky, M.J., & Lantz, K.E. (1980). Implementationplanning_af_i_ltegrated trnsi_t_services for a small urbanand rural area. Washington, DC: DOT/UMTA/UniversityResearch and Training Division.
Dorosin, E., & Phillips, J. (1979). Share a fare: Atranspartation program for elderly and
ha 11 @ -visas City, Missouri.Washington, DC; DOT/UMTA.
Ecosometrics, Inc. The sixth natlanal conference on ruralpubltc_transport_atlan. Final report, Nov. 1983, No.001-I-83-52.
Ecoplan International and Multisystems, Inc. (1982). TheEuropean paratransit experience. Paratransit: Optionsfar the Future. Washington, DC: DOT/UMTA/Office ofPolicy Research.
Fleishman, D. (no date). Mercer County, New Jersey,coordination/consolidation demonstration project.Washington, DC: UMTA/TSC.
Fleishman, D., & Flusberg, M. (1982). Paratransit for thework trip: Commuter ridesharing. Paratransit: Optionsfax the_future. Washington, DC: DOT/UMTA/Office ofPolicy Research.
Fleishman, D., & Flusberg, M. (1982). Paratransit inrural areas: Paratransit:Options for the Future.Washington, DC: DOT/UMTA/Office of Policy Research.
Furniss, R.E. (1979). Tne_Mestport Connecticut integratedtraftsit_system. Washington, DC: DOT/UMTA.
Green, D., & Assoc., Inc. Use_of_volunteers in thetr handi capped persons.Final report, Jan. 1984, No. DOT-I-84-02.
Heaton, C., Abkowitz, M., Domm, D., & Jacobson, J. (March1983); Impacts and effectivness af third party
-camarison of findings fors. Washington, DC: DOT/UMTA.
. 11 / .4
tour I -fled
Heaton; C.i Jacobson, J., &Compar*four NangaalDOT/Research
111
Poage. (April 1979).erational- aaspects of
demonstration _grojetts. Cambridge, MA:and Special Programs Administration.
(I ee
noel, L., Perle, E., Kansky, K., et al. (no date). Latentdemand for urban transport4tion. Pittsburgh, PA:Transportation Res.iarch Institute of Carnegie-MellonUniversity.
147

A4
Holoszyci M. & Beach, B. F. Transit Fare PrepaymentInftavations in Sacramento. Washington, DC: TRB.
Holoszyc, M., & Newman, D. (1980). Evaluation of thekachester,_Nelcric community transit servicethelmanstration. Executive Summary (Vol. I). Washington,DC: UMTA/TSC.
Homitz, Allen & Associates. (1981). Training course forpersanne_l_lnareawide ridesharing agencies. Washington,DC: DOT/Federal Highway Administration.
Hood; T.C., & Geiss, L.S. (APr i 1 1982). The volunteertanpsetat_i_onprogram:Some suggestions and cautio-Es intne__u_seofvolunteers as drivers, escorts, and othertransportationworkers. Washington, DC: DOT.
Iskander, W.H., & Hage, N.M. (December 1981). Integrationf_AG_T__sys_temswith -other transportation modes. Final
Report. Washington, DC: DOT/UMTA.
Kirby, Bhatt, Kemp, et al. (1974). Paratransit: Neglectedoptlions_for urban_mability. Washington, DC: DOT/Urban.Institute.
Kocur, G., & Louviere, J. (1979). An analysis of usercost and servAcetrade-offs in transit and paratransitservices. Washington, DC: UMTA/TSC.
Lave, R.E., & Holoszyc, M.A. (March 1979). The RocheSterNe_w_York integratedL-transit demonstration. ExecutiveSummary (Vol. I). Washington, DC: DOT/UMTA.
Lee, Tamahlow, & Mulinazzi. (April 1981). A publictransportation needs-study for low density areas in afive state reg-ton- in the Midwest. Washington, DC:UMTA/Office ofPublic Research/University of Kansas.
Meyburg, A.H. (October 1975). Mass transit developmentfor small urban areas: A case study - Tompkins CountyNew York. Second Year Final Report. Washington, DC:DOT.
Misch, Margolin, Curry, et al. (December 1981).GlAide_l_i_n_e_s_ for _u_s_i_uvandoo 1 s and carpools as a TSMtechnique (National Cooperative Highway Research ProgramReport #241). Washington, DC: TRB.
Multisystems, Inc. (1984). Estimating-Patronage forCommiu_n_i_ty_Tnansit Services. Washington, DC: Technology-Sharing Program, UMTA-USDOT.

A5
Multisystems, Inc. (January 1982). Paratransit for theridesharing. Washington, DC:
DOT/UMTA.
Multisystems, Inc. (August 1978). Taxis, the public andnat i on primer. Cambridge, MA:
Multisystems, Inc.
Nelson, D. Spano, M., & Skepetin, S. (1981). Fixed routeac-r-u-s-s-i-I4ebus--s-ervice in Connecticut: A case study.Washington, DC:DOT/UMTA.
Newman, D.A., Bebendorf, M. (1983). Integrated bicyclesaild_tramsit in-Santa Barbara." California. Washington,DC: DOT/UMTA.
Newman, D.A., Holoszyc, M. Evaluation of the Rochester,New -Y-o-r-kcommunity transit service demonstration.Executive Summary (Vol. Ii. Washington, DC: DOT/UMTA.
Office of Assistant Secretary for Government and PublicAffairs. (May 1979). How ridesharing can help yourcemgamy. Washington, DC: DOT/Assistant Secretary forGovernment and Public Affairs.
Public Technology, Inc. (June 1979). Transit pricingtechnioltes to improve productivity. Washington, DC:DOT/UMTA/OSMD.
Public Technology, Inc. (January 1980). Institutinalframework for inte rated trans ortation lannin .
Washington, DC: DOT UMTA Urban Consortium for TechnologyInitiatives.
Public Technology, Inc. (January 1980). Neighborhoodcontrols. Washington, DC: DOT/Urban Consortium forTechnology Initatives.
Public Technology, Inc. (April 1980). Center ciaenvironment-and transportation innovations in five_Eurapaam_c_ittes. Washington, DC: DOT/UMTA/Department ofHousing and Urban Development.
Public Technology, Inc. (September 1980). Taxicabs aspublic transtt. Washington, DC: DOT/Consortium forTechnology Initiatives.
Rural America (July/Aug;_1983). Getting There: MakingRural Transportatton Work.

A6
Schmidtt, R., Weitman, J.,_Beimborn, E. (April 1982).Examination of methods for cordinatin of_transportationplanning activities. Washington, DC: DOT/UMTA.
Schneider, J.B. (September 1981). Transit and thepolycentric city. Washington, DC: DOT/UMTA/UniversityResearch and Training Program.
School of Urban Sciences, University of Illinois atChicago Circle. (January 1981). Moving p_e_o_p_le.Chicago: University of Illinois.
Smerk, G.M., & Gerty, R.B. (1980). Mass transttmanagement: A handbook for small cities (2nd ed.) (Parts1, ir, III, Washington; DC: DOT/UMTA.
Sobel, K.L., Alschuler, D.M. (1980). Paratransitplanning: Application of a systematic market-orientedplanning And programming process (TransportationResearch Record #778). Washington, DC: TRB/NationalResearch Council.
Soot, S., Stenson, H.,_Esser, M., & Joyce, L. (1982).Cognitive aspects of transit use in areas of high andloW travel density. Executive Summary. Washington, DC:DOT/UMTA.
Spear, B.D.i et al. (December 1981). Service and metho'Ad6monsteatioelt peogrAM report. Washington; DC: UMTA.
Stammer,_Robert E. & Giangrande, R.V. MicrocomputercipeatiOn: The Tennettee experience.
Stommes, Eileen S. _(1985) The use of cooperatives foraltenatiVe e_tjeal pattenger trantportation: Report on a
New Ydek ttudy. TRB Paper.
Studenmund, A.H. (1982). The appropriate measures ofpedduttivity Atid diitpUt feJr the evaluation_of tranSitdemonstration peo6ttt. Wathingtön, DC: DOT/UMTA.
Suhribieri_J.H.,_& Wagner; F.A. (April_1979). Vanpooles6aeth: State of the art revieW. Washington, DC:DOT/UMTA.
Teal, R.F., Goodhue, R.E., Rooney, S.B., & Mortazavi, K.(1982). Taxi-based public transportaion for the elderlyand the- handicapped (Transportation Research Record#863). Washington, DC:TRB.
Technology Sharing. (March 1981). Paratrnsit: State of theart revieW. Washington, DC: DOT.
150

A7
Tennessee Valley Authority. (March 1980). Rides_h_a_ri_ng vs_road building: The TVA experience. Washington, DC:DOT/UMTA.
Texas Transportation_Institute, Texas A & M University.(January 1978). Instructors manual: Aleternatives forimproving urban transportation - a management overview.Washington, DC: DOT.
Transportation Center of the University of Tennessee.Transportation brokerage for executive Management.Washington, DC: UMTA.
TRB. (1980). New directions in transportation education(Transportation Research Record #748). Washington, DC:National Academy of Sciences.
TRB. (1981). Ridesharing needs and requirements: The roleof the private and public sectors. Washington, DC:DOT/UMTA.
TRB. (1981). Transportation education and training:Meeting the needs of the 1980s (Transportation ResearchRecord #793). Washington, DC: National Academy ofSciences.
TRB. (1982). Paratransit planning_and management(Tranportation Research Record #863). Washington, DC:National Academy of Sciences.
TRB, (1982). Ridesharing 1981. Washington, DC: NationalAcademy of Sciences.
TSC. (March 1981). Paratransitl State of the artoverview. Washington, DC: DOT/TSC.
TSL. & UMTA. (1974). State of the art overview of demand-responsive transportation. Washington, DC: DOT/UMTA.
UMTA (Aug. 1984). A Manual for Planning and Implementing aFare Change. Washington, DC: UMTA.
UMTA/DOT. (1980). Innovative techniques and methods inthe management and operation of public transportationservices. Washington, DC: DOT/UMTA.
UMTA/DOT. (September 1980). Rural transportation projectson Indian reservations: A report on elevendemonstrations. Washington, DC: DOT/UMTA.
UMTA/DOT. (Api-il 1982). Paratransit services for the _
transportation handicapped. Washington, DC: DOT/UMTA.
151

A8
UMTA/DOT/FHWA. (March 1981). Rural and small urbantransit manager s workshop: Student workbook, Vols. 1 &2
University of Oklahoma; School of Civil Engineering andEnvironmental Science. Paratransit resou_r_ce_gai_de;Washington, DC: DOT/Technology Sharing Program.
Urban Mass Transportation Ar!ministration UnviersityResearch Conference. ( '). The_future market forpublic transportation p.Strategies for the 1980s Ar,l sessions of the UrbanMass Transportation Adminis -ation University ResearchConference). Washington; DC: DOT/UMTA;
Urban Mass Transportation Research Informtion Service.(August 1982). Urban transportatAom_abstracts. (Vol. I,Part 1). Washington, DC: UMTA;
Valente, P. (International City Management Association);(1983). Public transportation training package.Wahington, DC: DOT/URTA.
Wegman, Bell, et al. (November 1978). The Knoxvilletransportation brokerage project (Vol. III: An EighteenMonth Evaluation). Washington, DC: DOT/UMTA.
Weisbrod, G.E., & Eder, E.S. (Cambridge Systematics,Inc.) (June 1980). Evaluation of the Minneapolisridesharing commuter services demOnstration.Washington, DC: DOT/UMTA/OSMD.
Young, D. (March 1983). Transit in transition: Majorchanges ahead. Mass Transit, p. 4.
Yukubousky, R. & Fitcher, D. Mobility club: A grass-rootsrurl and small town transport concept., NY DOT, PRR 69,Aug. 1974.
152