document resume el 008 037 zymelman, manuel · pdf filethis book examines the advantages and...
TRANSCRIPT
DOCUMENT RESUME
ED 119 383 El 008 037
AUTHOR Zymelman, ManuelTITLE Financing and Efficiency in Education: Reference for
Administration and Policymaking.INSTITUTION Agency for International Development (Dept. of
State), Washington, D.C.PUB DATE 73NOTE 322p.
EDRS PRICE MF-$0.83 HC-$16.73 Plus PostageDESCRIPTORS Cost Effectiveness; Delivery Systems; *Educational
Finance; *Efficiency; Elementary Secondary Education;Expenditures; *Financial Policy; Financial Support;Higher Education; *Models; National Programs;*Resource Allocations
ABSTRACTThis book examines the advantages and disadvantages
cf various methods of financing education and discusses the basicissues related to increasing efficiency in education. Section 1offers a short history of educational finance and discusses many ofthe traditional approaches to financing education. Section 2 presentsmethods for distributing funds to different levels of formaleducation and to various types of nonformal education. Section 3describes different arrangements for raising educational funds andcontrolling their use. Section 4 examines different methods forforecasting educational resources and describes the Index ofEducational Funding, a model for measuring national effort ineducational spending. Section 5 discusses concepts of efficiency ineducation and develops a general approach for improving efficiencythrough intervention in the educational system. Section 6 deals withways of increasing overall efficiency and decision-making in nationaleducational systems. Section 7 presents ways of increasingeducational effiCiency, with emphasis on educational contracting. Italso describes the Index of Educational Expenditures, a model forcomparing different nations' educational spending. (AuthorM)
***********************************************************************Documents acquired by ERIC include many informal unpublished
* materials not available from other sources. ERIC makes every effort ** to obtain the best copy available. Nevertheless, items of marginal *
* reproducibility are often encountered and this affects the quality *
* of the microfiche and hardcopy reproductions ERIC makes available *
* via the ERIC Document Reproduction Service (EDRS). EDRS is not* responsible for the quality of the original document. Reproductions ** supplied by EDRS are the best that can be made from the original. ************************************************************************
U.S. DEPARTMENT OF HEALTH,EDUCATION i WELFARENATIONAL INSTITUTE OF
EDUCATIONTHIS DOCUMENT HAS BEEN REPRO-DUCED EXACTLY AS RECEIVED FROMTHE PERSON OR ORGANIZATION ORIGINATING IT POINTS OF VIEW OR OPINIONSSTATED DO NOT NECESSARILY REPRESENT OFFICIAL NATIONAL INSTITUTE OFEDUCATION POSITION OR POLICY.
"PERMISSION TO REPRODUCE THIS COPY-RIGHTED MATERIAL HAS BEEN GRANTED BY
AlTO ERIC AND ORGA IZATIONS OPERATINGUNDER AGREEMENTS WITH THE,NATIONAL IN-STITUTE OF EDUCATION. FURTHER REPRO-DUCTION OUTSIDE THE ERIC SYSTEM RE-OUIRES PERMISSION OF TI-re COPYRIGHT
OWNER
Financing and Efficiencyin
Education
Reference for Administration and Policymaking
NCv:
0
MANUEL ZYMELMANHARVARD UNIVERSITY
2

This book was produced as part of a project spon-sored and funded under a contract with theAgencyfor International Development. The views expressedherein are, however, those of the author and are notnecessarily those of the Agency.
All rights reserved.
Composed and printed at The Nimrod Press, Boston, 1973
3

To Nancy
4
ACKNOWLEDGMENT
A work covering so many varied topics in the financing and efficiencyof education must necessarily rely on the assistance of many people. Fore-,
most, I acknowledge with thanks the help of my three research assistants:Dr. Jose Dominguez, who developed the idea of a Student Loan Develop-ment Bank; Mrs. Elaine Gould; and Mrs. Adele Neuringer. They collaborated
tiringly in all phases of this project.
I wish to thank Dr. Robert McMeeckin for his assistance in the formu-* tion of the chapters on planning, data for decision-making, and admin-
,tration; Dr. John Simmons for his assistance in the formulation of-thehapter on the economic valuation of educational outputs; Professor
Donald M. Levine for his assistance in the formulation of the chapter onPPBS; Professor John Anderson for his assistance in the formulation of thechapter on self-help in education; and Mrs. Jeanne Henn for her assistancein the formulation of the chapter on distribution of funds.
My thanks to Professors John Anderson, Roy Bahl, Charles Benson,Curley Bowen, Andre Daniere, Russell Davis, Werner Hirsh, Donald M.Levine, Selma Mushkin, Richard Speagle, and John Vaizey for speciallypreparing research papers that deal with various topics related to this book.
I am grateful to the members of the Task Force in Educational Financeand Measurement of the Agency for International Development, and to allthe participants of the International Conferences on the Financing ofEducation held in Cartagena and Malta in 1973 for their many basic andrelevant comments on early drafts of this book.
Lastly, I am especially grateful to Mrs. Helene Tuchman for herefficiency in compiling the index; to Dr. Martin Robbins who workedclosely with me in editing the manuscript and providing invaluable crit-icism; and to Miss Dolores Tirnbas for her indispensable critical editing ofthe final manuscript in close collaboration with me and for supervisingthe book through all stages of publication.
Although help, information, and advice were received from these andmany other sources, responsibility for this book rests solely with theauthor.
Manuel ZymelmanCambridgeJune, 1973
t..
TABLE OF CONTENTS
INTRODUCTION
Part I: THE SOURCES AND FINANCING OF EDUCATION
Chapter
1
Section 1
I EDUCATIONAL FINANCE IN HISTORICAL PERSPECTIVE 7
Delineation of Educational Needs 7
Nature of Sources of Support 8
Methods of Fund Acquisition 9
Methods of Fund Allocation 14
Summary 17
II PUBLIC AND PRIVATE EDUCATION: THE PHILOSOPHIES
BEHIND THE ISSUES 19
Justification for Government Intervention 19
Financing of and Provision for Education 20
The Philosophies Behind the Issues 21
Conclusion 25
III REVIEW OF TAXES COMMONLY USED TO FINANCE
EDUCATION 27
Criteria for Evaluating Taxes in General as Sources of
Finance for Education 27
Earmarked Taxes for Education 29
Analysis of Property and Sales Taxes 29
Summary 48
Section 2
IV ELEMENTARY AND SECONDARY EDUCATION: PUBLIC
AND PRIVATE FUNDING 50
Public Funding 50
Private Funding 79
V GOVERNMENT FINANCING OF HIGHER EDUCATION 82
Financing Patterns of Higher Education 82
Summary 89
VI NATIONAL STUDENT LOAN INSTITUTIONS 90
National Student Loan Institutions as Instruments of Policy 90
Effects of Student Loans on the Individual Borrower 91
Chapter
Possible Effects of Student Loans on Higher Education 92
Effects of Student Loans on Society 93
Operations of a National. Student Loan Institution 93
A Special Type of SLI: The Student Loan DevelopmentBank (SLDB) 103
Conclusions 108
VII THE FINANCING OF OCCUPATIONAL TRAINING 110
Difficulties in Categorizing and Comparing Types ofVocational Training 110
Alternative Types of Training 111
Trainee Differences and Other Variables 112
Financing of Vocational Education 113
Special National Training Institutions and Their Financing 120Summary 123
VIII RECURRENT EDUCATION 127
A Recurrent Education System 127
Implementing Recurrent Education 129
Financing Recurrent Education 130Feasibility of Recurrent Education for Developing Countries 131
IX FINANCING EDUCATIONAL BROADCASTING 133
Criteria and Forms of Financing 133
Summary 138
Section 3
X SELF-HELP AS A METHOD OF FINANCING EDUCATION 140
The Philosophical and Economic Perspectives of Self-Help 140
The Cooperative As a Self-Help Institution inEducational Financing 144
Summary 148
XI THE VOUCHER SYSTEM 149
Objectives of the Voucher System 149
Different Voucher System Plans 150
Additional Variations of Voucher System Models 154
The Voucher System and Developing Countries 154
XII EXTERNAL AID TO EDUCATION 156
The Donor-Recipient Relationship 156
The Content of External Aid 157
vi
7
Chapter
Distribution of Aid Within the Educational Sector 158
Rationale for Accepting External Aid to Education 159
Issues Faced by Donors of Aid to Education 160
Summary 161
Section 4
XIII FORECASTING RESOURCES FOR EDUCATION 162
Sources of Resources for Education . 162
Forecasting Resources for. Education Supplied byGovernment 163
Forecasting Education's Share in Government Expenditures 164
Forecasting Contributions by the Private Sector 167
Summary 168
XIV AN INDEX FOR MEASURING EDUCATIONAL FUNDING 169
The Index of Educational Funding 170
Notes to the Index of Educational Funding 172
Meaning and Uses of the Index of Educational Funding 174
Part 11: PROBLEMS OF EFFICIENCY AND FINANCE
Section 5
XV EFFICIENCY IN EDUCATION 179
Efficiency of a Transformation Process 179
Increasing Efficiency 187
XVI AN EVALUATION OF THE OUTPUTS OF EDUCATION 203
Educational Outputs Related to Stated Goals 203
The By-Products of Education 209
Method of Evaluating Educational Outputs 210
Summary 212
XVII THE ECONOMIC VALUE OF EDUCATIONAL OUTPUTS 213
The Rate of Return Approach 213
The Manpower Approach 221
Correlation Analysis 224
The Residual Approach 227
Regression Analysis Approach 229
Production Function Analysis 230
Summary 232
vii
8
Chapter
Section 6
XVIII EDUCATIONAL PLANNING AND PROGRAM BUDGETING 235Educational Planning 235Planning-Programming-Budgeting (PPB) 247
XIX DATA FOR ANALYSIS AND DECISION-MAKING 258The Needs for Data 258Sources of Data for Ministries of Education 260
XX THE ADMINISTRATIVE CONTEXT OF PLANNING,BUDGETING AND IMPLEMENTATION 268Centralization versus Decentralization of Educational
Administration 269The Interaction of Administration and Planning 273Summary 276A Recent Case of Decentralization 278
Section 7XXI EDUCATIONAL CONTRACTING 282
A Brief History 282Performance Contracting 283Uses of Performance Contracting in Developing Countries 288
XXII FINANCIAL DISTRIBUTION FORMULAS ANDINCREASED EFFICIENCY 290Bases for Allocating Funds 290Ways of Equalizing and Furthering Desirable Education
Goals 292Some Observations on Financial Distribution Formulas 299
XXIII AN INDEX FOR MEASURING EDUCATIONALEXPENDITURES 301
An Index of Educational Expenditures 301
Summary 304
AFTERWORD 305
INDEX 306
viii
9
Introduction
Everyone has the right to education. Education shall be free, atleast in the elementary and fundamental stages. Elementary educa-tion shall be compulsory. Technical and professional educationshould be made generally available, and higher education shall beequally accessible to all on the basis of merit.
Universal Declaration of Human Rights, 1948
MOST developing countries are trying to reorganize and expand. theirpublic educational systems to make these goals of the Universal Dec-
laration of Human Rights a reality. This is an enormous and very expensivejob. There have been financial constraints at every step. Governments nowthink that spending on education has reached a ceiling and that they canno longer meet the educational sector's requests for additional resources.Governments are insisting that education must first operate more efficientlybefore they will grant more funds.
Educationists must, therefore, better understand the ways and theproblems of raising additional resources. ,They must also learn to reducecurrent inefficiencies. These are essential steps toward solving the crisisof education in developing countries.
How did this crisis come about?The demand for education has increased rapidly with population
growth. In the last decade, world population has increased at an averageannual growth rate of two per cent. In developing countries, populationexpanded at approximately 2.6 per cent per year. School age populationgrew even faster. The demand for education was also encouraged by thebelief held by educators, economists, and politicians that educating asociety's members is most necessary to further economic progress.
The increased demand for education due to demographic, economic,and political factors was reflected in increased enrollments. Growth rates
1
10
of school enrollment in developing countries averaged 4.5 per cent in thelast decade. Primary, secondary, and vocational schools, universities,literacy programs, educational television, as well as various types of in-formal education, expanded at an unprecedented rate.
Increased enrollment and educational activity caused increased capitaland recurrent expenditures. In most countries, educational expendituresexpanded twice as fast as the GNP. Higher portions of national budgetswere increasingly allocated for education. Between 1960 and 1965, educa-tion's share of national budgets increased from 14.5 per cent to 16.4 percent in Africa, from 12.6 per cent to 15.4 per cent in Latin America, andfrom 11.8 per cent to 13.2 per cent in Asia. These figures are in themselvessignificant, but they underestimate expenditures on education. They do notinclude other significant sources of funds: ministries, other than the Minis-try of Education, that sponsor educational activities; and the entire privatesector. In some countries, such as Thailand, educational expenditures bythe Ministry of the Interior exceed those of the Ministry of Education. In
Ethiopia, 7.8 per cent of the government expenditures on education comesfrom other ministries. In Korea, 35 per cent of total education expendituresare paid for by the private sector, and in Indonesia, 26.4 per cent.
Increased educational expenditures were not only the result of theexpanding educational systems. Costs increased out of proportion to theexpanding enrollments. Annual enrollments, at all levels, in Latin America,Asia, and Africa increased by 6.2 per cent, 5.6 per cent, and 6.2 per cent,respectively, in the last decade. The annual rate of increases in spendingwas 12 per cent, 14 per cent, and 10 per cent, respectively.
But despite the large financial effort, educational sectors in developingcountries have not been able to keep up with the increasing need foreducation. There is still an astounding number of school-age children notattending primary school. In 1968, 25 per cent of Latin American, 55 percent of Asian, and 60 per cent of African children did not attend school.
Even with a marked increase in adult literacy programs, the overall numberof illiterates will increase.
Even these expanded educational activities have not helped many ofthose who had a chance to get some type of education. Many personsdropped out of school before being prepared for the world of work.Graduates of different levels of education found their training did not fit theeconomy's needs for specific labor, and training to use new technologieswas also not available. Despite increasing expenditures, education often
lost touch with society's needs.The direct consequences of these failures in the last few years (after
2
i1
1967) was a growing opposition to increasing education's share in publicexpenditures. This slowed the growth rate of funds for education. Theproblem of getting funds was also caused by the educational sector's dis-advantaged position in competing for funds with other sectors.
Educational authorities have always been the least politically involvedin their governments. Educators rarely have powerful positions in govern-ments and are usualy not sensitive to overall national planning needs. Theyconcentrate on keeping the educational system functioning for its ownsake and are only sensitive to demands from within.
Also politicians consider education to be of secondary importance.This is partly because, like other human services, education's product isdifficult to quantify and takes a long time to produce. Rarely do decisionsin the educational sector have an immediate impact on outputs, unlikedecisions in public works, industry, and commerce, where the impact isimmediate.
In other sectors, planners wait for political decisions that determinedirections of policy. The educational sector usually makes these decisions
for itself. Its demands on the political system most often are only requestsfor more financial resources. But when these requests reach a level beyondwhich increased expenditures could disturb a country's social and politicalequilibrium, they are often flatly rejected.
The solution has two related aspects: finding new means of financingeducation and/or improving the efficiency of the education process. Therole of efficiency is often overlooked in considering educational financethe less efficient a system is, the more funds must be raised for any givenlevel of operation.
There is a current emphasis that links developing new sources of fundsfor education with a search for efficient uses of these funds. This newemphasis is a clear sign that many developing as well as developed countriesbelieve that the amount of resources allocated to education seems to benearing a maximum.
This book will provide decision-makers with a clear idea of all theknown methods for financing education, as well as their advantages anddisadvantages. It also makes an understanding of the basic issues of in-creasing efficiency in education possible. The scope and organization ofthis book offers a survey of problems and old and new solutions in educa-tion, so that educationists in developing countries can see their particularproblems in a larger perspective. With such an overview, educationistsshould be able to improve the decision-making process as it applies tothe particular needs and goals of their country.
3
1 2
This book covers two aspects of educational finance: sources of fundsfor education, and the efficient use of resources in education.
Part I: The Sources and Financing of Education
Section 1, which opens with a short history of educational financing,shows that the many ways of ',lancing education presently in use havebeen tried throughout history. This is followed by a discussion of thephilosophical arguments that underlie many of the private and publicmethods of provision and financing of education. The section concludeswith a discussion of the nature of taxes traditionally used to financeeducationtheir economic and distributive impact, and their suitabilityfor further financing education.
Section 2 presents methods of financing and distribution of funds todifferent levels of formal education and to various types of non-formaleducation. The section starts with a discussion of methods of distributingfunds for education from the Central Government. to local educationalauthorities, based on the criteria of equity of financial burdens and guar=anteed minimum educational standards. The models described draw onthe United States experience, but some of them can be adapted to devel-oping countries with a federal system of government. This is followed bya summary of different methods' of financing elementary and secondaryschools from public and private sources. The summary is illustrated withselected examples from a comprehensive survey of the financing of educa-tion in developing countries.
Section 2 gives special attention to the financing of higher education.Monetary and power effects of different financial arrangements betweengovernment, institutions, and students are analyzed. Student Loan Institu-tions are discussed in detail because of their high potential in meeting thecrisis of financing higher education. A Student Loan Development Bankthat takes advantage of the national credit markets is proposed.
Most vocational education is provided outside the school walls andcan be financed in a variety of ways. Section 2 discusses a framework forclassifying types of vocational education and ways of financing them. Theexamples are taken from a comprehensive survey of over 50 nations. Ananalysis of special institutions for administering and financing vocationaleducationnow in use in many developing countriesis also included.
The financing of non-formal education, such as recurrent educationand educational radio and TV, is also discussed because these forms ofeducation are becoming more and more important.
Section 3 presents different arrangements for raising funds and control-
4
13
ling their use. Because self-help methods for financing education are nowbeing debated, this section analyzes the advantages and disadvantages ofself-help. A new form of self-help, educational cooperatives, is also dis-cussed.
The voucher system has been suggested to solve some of the problemsof education in the United States. Its applicability to developing countriesis minimal, but the general idea when adapted to the special conditionsof developing countries may be useful. A discussion of its advantages anddisadvantages is also included. The section closes with an analysis of exter-nal aid to education.
Section 4 presents different methods for forecasting resources foreducation. It also provides a model for the measurement of a country'sor a province's effort in spending on education. This Index of EducationalFunding can provide a ready instrument for comparing nations and prov-inces according to given standards of efforts.
Part II: Problems of Efficiency and Finance
Section 5 presents concepts of efficiency in education and developsa general approach for improving efficiency through intervention in theeducational system. Every intervention has its costs and benefits. Thetools of cost-benefit and cost-effectiveness analyses are discussed to helpdecision-makers choose a profitable course of action. But, while costs inthe educational sector can be determined, benefits are harder to assess.Therefore, a general framework for evaluating educational outputs, followedby a discussion of the different methods of determining the economicvalue of education, has been included in this section.
Section 6 deals with ways of increasing overall efficiency and decision-making in national educational systems. Three areas, were selected fordiscugsion: educational planning and program budgeting; data for decision-making; and administration. The advantages and disadvantages of the dif-ferent approaches are discussed, and suggestions are made for improvingeach of these areas in developing countries.
Section 7 presents particular ways of increasing efficiency. Because
educational contracting is often considered as a means to link expendituresto results, this method is reviewed. The advantages, pitfalls, and thepossibilities of applying this method to developing countries are discussed.
The way funds are distributed can promote or hinder efficiency. Differ-ent methods for fund distribution are therefore presented and analyzed,and suggestions are made for their application in developing countries.
This last section of the book closes with an Index of Educational Ex-
5
penditures. This Index provides a basis for comparing the way differentnations or regions spend on education, their preferences for different levelsof education, and unit costs. Together with the Index of EducationalFunding, they provide an analytical tool for evaluation of both aspects ofeducational finance: sources and uses of funds.
6
15
PART I
The Sources andFinancing .of Education
16
CHAPTER I
Educational Finance inHistorical Perspective
THROUGHOUT history, educational finance has made constant, if erratic, .
progress towards extending education beyond the aristocracy.Financial arrangements have ranged from simple payments in goods
to priests for instructing youths in initiation rites to modern practicesof acquiring and allocating funds, assigning responsibilities and organizingand controlling administration.
A historical analysis reveals what has been attempted and discarded,and why. A brief delineation of educational funding needs and, especially,the kinds of sources for educational funding will be included here. Thedescriptive account of methods for raising and disbursing funds for educa-tion will consider content and levels, units of organization, and responsi-bilities of government.
DELINEATION OF EDUCATIONAL NEEDS
Money is spent on education by particular groups in a society tosatisfy specific needs. How much money is spent depends on their percep-tion and acceptance of education's function to satisfy these needs, andon the natural wealth and economic ability of the society in general. Areaswhere specific needs were recognized for education in history include:religious, military, economic, political, and social.
Religious Needs There are countless examples of the need to teachthe holy books in societies with religious emphasis: the ancient Hebrewbet sefer; Brahmin, Buddhist and Confucian temple schools in India, Ceylon,China and Japan; Moslem khalwas, mektabs, and higher medress schoolsfor studying the Koran in Africa and the Near East; European early catechu-menal, monastic, cathedral and, later, presbyterial or parish schools; Prot-estant schools of the Reformation; Jesuit schools of the Counter-Reforma-tion; and, lastly, mission schools of many sects.
Military Needs The need to excel in warfare dictated the militarily-oriented training of Sparta and of pre-conquest Mexico. Chivalric codes
7
17

demanded the same for the feudal nobility of Europe and the samurai ofJapan.
Economic Needs Commercial transactions caused education to ex-pand in ancient Egypt and Sumeria. Trained scribes were needed to keepaccounts or ledgers, and to calculate weights and measures. With the riseof free enterprise in the Renaissance cities of northern Italy and the Han-seatic towns of the Baltic, abacus schools began to compete with schoolsof classical learning. The trading companies of the 18th century and, sub-sequently, the colonial empires, encouraged Western education in India,the Far East, and Africa to supply clerks, civil servants,'and commercial staff.
Vocational education, common in Hebrew and Roman times,. hasbeen stimulated by exposure to trade and industrial expansion from theguild burgher schools of the 12th century to various kinds of vocationalschools during the Industrial Revolution in Europe.
Political Needs A society with an open political system needs aneducated electorate. The need to train statesmen has also created specialschools, such as the 15th century'Ottoman Empire's palace school for thebest intellects in the Empire. In the United States during the late 19th andearly 20th centuries, evening schools helped fulfill the political need oftransmitting national cultural values and inculcating patriotism to immi-grants.
Social Needs In England in the late 18th century, Sunday schools wereestablished to provide moral instruction for children of the working classes;and in the 19th century, the need for social justice for working-class childreninspired activities of voluntary societies to provide schools, and nationallegislation to supply grants-in-aid. The Foster Act of 1870 was an example
of such legislation. Solutions to the 20th century medical, social, andecological problems call for societal support of scientific inquiry.
There are many instances where education has been less valued be-cause of its interference in child labor practices (19th century), incon-venience, expense, lack of relevance (now), and its potential threat to the
status quo.
NATURE OF SOURCES OF SUPPORT
Sources of educational support are expressions of people-indiluallyor collectively. Governnient is a basic source of eduati nal support at/
1foreign, national, regional, and local levels. Religiotrs/ groups have 'rovided
.
education since antiquity. Private enterprisesbusiness, trade or agricul-tural organizationshave helped to provide (funds; so have non-profit
8
organizations, such as alumni, civic, and professional groups. The privateindividual, or the household, has responded to appeals and subscriptions.Tuition payments, fees, services, charity, land and money bequests, studentand teacher room and board, building materials, and books have beencontributed to education.
400IA variety of techniques have been used to get resources for financing
education from the above sources.
METHODS OF FUND ACQUISITION
Ample historical evidence indicates a great variety of ways to acquirefunds. Only the most productive past methods will be considered here.
These include taxes, fees, philanthropy (bequests, endowments andfoundations), disposition of public wealth, royal patronage, use of profitsof private enterprise, and customs and excises. Others with generallylimited ability to produce revenue include: services, loans, interest andsavings, stock sales, lotteries, the establishment of special funds, appealsor subscriptions, fines, license fees, subventions, exemptions, foreign
government gifts, reparations, and the use of proceeds from governmentmonopolies.
Taxes
Through the centuries, taxes were the largest source of revenue foreducation, although they were not often directly imposed as a source offunds for education. A town tax to pay teachers' salaries from publicexpense existed in the first century A.D. Medieval university townsimposed clergy, wagon, bridge, and salt taxes. Henry VIII collected "firstfruits and tenths" for Bible education. In 1638, a tax was collected in thecolony of New Amsterdam (now New York City) to support a schoolmaster.Salt, stamp, and opium taxes helped finance schools in India.
The expanded use of poll and property taxes is a 19th and 20thcentury phenomenon. In 1739, the poll tax in Denmark was levied accord-ing to the taxpayer's status. An 1858 poll tax in Ghana failed when peoplerefused to pay because Western learning seemed irrelevant. In the 1920's,
poll taxes were also tried in South Africa and Tanzania.The property tax, commonly used in North America today, was levied
in Denmark in 1721 as a tax on land for payment of teachers' wages.' Thistax, known as the "hartkorn," was based on the land's productive capacity,or on its ability to support animalsmeasured in units of "hard corn."Property taxes in India in the 19th century were levied on the rental valueof the land in rural areas, or upon houses in urban areas.
9
19'
Taxes on banks in the United States in the early 19th century includedthose on state-bank paper money, on the banks' surplus accumulatedprofits, on deposits of non-residents, on agencies of foreign banks' bills,and on savings deposits. In 1910, in Quebec, Canada, corporate taxes weredistributed according to the number of Catholic and Protestant shareholdersof the company to the respective school boards. Other forms of taxationlevied in various places include: taxes on railroad freights in Ghana; salestaxes, transfers, registrations and payroll taxes in the United States; andDenmark's tax on titles and one per cent levy on church income for teach-ing the poor.
In Mexico early in this century, one per cent of income above aprescribed figure went to secondary school improvements. Pre-World WarI France taxed securities, doors and windows, stamps and alcohol, alongwith presumptive incomeas measured by amount of rent paidassources of general revenue from which the Central Government paidteachers' salaries. Germany also had a variety of taxes for general revenueswhich were applied to school appropriations. Such taxes were imposedon mineral water, beer, champagne, candles, salt, sugar, income, sales;auto, inheritance, racing, betting, and amusements. During the Third Reich,a graduated citizenship tax was also imposed.
Payment of Fees
This is one of the oldest and most consistent methods used to collectfunds. Fees for instruction have existed in many cultures. Primitive In-dians paid a wise man to teach them dances for exorcising evil spirits.Greek sophist lecturers charged per seat; the Romans charged tutorial fees;and the Japanese collected payments of dried sardines, sweets, and clothfor terakoya primary schools.
Collecting fees from the pupil at early sophist Greek lectures alsoserved to institutionalize the formal school arrangement. Graduated tuitionfees based on ability to pay were charged in 18th century Prussia, wherethe community was responsible for providing for the poor. In Calcutta in1731, the Bellamy's Charity School received rents from the governmentfor using their building to hold court. Universities have always dependedon tuition fees for much of their support, as well as fees for matricula-tion, lectures, medicine, food, examinations, graduation and degrees. In
Austria between 1880-1930, lecture room fees were earmarked for thepurchase of scientific equipment. In Prussia of the early 20th century, aprofessor was entitled to 80 per cent of the proceeds of the fees collectedin his courses.
10
20

Philanthropy
Both religious and secular philanthropy have been an important sourcefor acquiring funds for education.
Religious Charity and Bequests Charity and bequests have furnishedmoney for education, especially through the church. Traditions of Brahminand Moslem faiths obliged parents to provide for religious learning, butforbade fees. Instead, parents could donate gifts; but the obligation toteach religion fell upon the temple, and schools were established withinor near it. Wealthy rulers or benefactors supported Moslem students atsecondary school medresses. The same was true for Buddhist schools inIndia, Ceylon, Malaya, and Japan. The history of the Christian Church showsthat financial support was considered obedience to divine will. Theodol-phus, Bishop of Orleans under Charlemagne, decreed that "in every villageand in every estate in his See," priests should arrange for schools to whichany Christian father might send his children to learn their letters withoutpayment of a fee." Bequests for the continued chanting of Masses for theDead began the chantry schools of the Middle Ages. The school systemsof Western Europe, Japan, Australia, and countless others evolved fromexisting religious schools when nationalism became a world force.
Much missionary activity of the 17th, 18th and 19th centuries in Africa,South and North America, and Asia was supported by donations, churchfunds, and the efforts of dedicated believers. Protestant groups, such asthe British Society for the Propagation of the Gospel in Foreign Parts, theWesleyans, the American Baptist Mission Board, and the Church of Scotlandoperated educational stations in distant surroundings. The Jesuit, Fran-ciscan, and other monastic teaching orders were active in Latin America,Eastern and Western Europe, North America, Ceylon, and the Philippines.Missions in Nigeria attempted to be self-supporting by farming. After theIndustrial Revolution, religious societies in England created Sunday schoolsand charity schools to educate the poor.
Non-religious charitable educational endeavors are less common. Butthere were collection boxes at inns for schools for the poor in 16th centuryEngland. The communal Bureaux de Bienfaisance or Welfare Chests or19th century France and Denmark provided lunches, aprons, and shoes tothe need school-child. In the early 20th century, the Turkish Republic'sRed Crescent and Society for the Protection of Children provided foodand medicine to school children.
Besides religious charity support, endowments and foundations havebeen important in financing education.
21

Endowments Records in Greek Asia Minor tell of a bequest for theperpetual endowment of a school for the free citizens of Miletus thatprovides for administration and salaries. Ptolemy gave an endowment tothe library at Alexandria; Roman emperors endowed chairs at the museumthere. In 1448, Magdalene College at Oxford University received an en-dowment to maintain a professor. A prime source of income for theJesuits during the 16th, 17th, and 18th centuries was rents from endowedlands. In the early 18th century, Frederick William of East Prussia endoweda national fund of 50,000 thalers to assist needy schools in paying teachers'salaries, or in erecting school buildings. In the 18th century in India,provincial school records list innumerable endowments and legacies, in-cluding the Officers' Funds and Soldiers' Funds, used to support theirchildren at the Lower and Upper Orphans' School.
Foundations After the Industrial Revolution, individual families whichhad amassed large fortunes set up foundations to support education. Evenin Roman times, Trajan had set up municipal foundations to support theneedy. The George Peabody Education Fund, founded in 1867 to advanceeducation in the American South, is more of a prototype of today's non-governmental, non-profit organization, such as the Carnegie, Ford, Mellon,Sloan, and Rockefeller Foundations, and the Fund for the Advancement ofEducation.
Disposition of Public Wealth
A significant method of acquiring resources for education was sellingpublic wealth. Land was granted or sold by Henry VIII and Edward VI whenCatholic, monasteries and lands were confiscated and later used for Ang-lican schools. Denmark, too, confiscated Catholic properties through theChurch Ordinance of 1539 and used dissolved church foundation revenuesand old endowments to support Lutheran schools. In 1641, Boston desig-nated Deer Island, an island in its harbor, as land to produce school income.In 1790, Nova Scotia set aside a 1200-acre grant to support teachers. In
1791, Upper Canada received the Clergy Reserve Lands to support Churchof England schools. In 1826, Australia set apart one-seventh of the crownlands in each county for school income. In 1841, the United States Con-gress gave 500,000 acres to some states for internal improvements tofacilitate transportation of troop movemer This was later used to produceincome for schools. Congress also gave the State of Indiana saline landso that income from salt springs could be used for education. Sections ofland in territories of the United States were commonly reserved for yieldsto church and schools. The culmination of land grants in the United States
12
22
was the Morrill Act of 1862. Federal land was given to states to provide anendowment fund whose investment yield would encourage agriculturaland mechanical research at universities. Another disposition of publicwealth was the return to the states of a national treasury surplus in 1833-1837 by Andrew Jackson. Much of this was invested in common, per-manent school funds, and it produced income for some years.
Royal Patronage
Chairs at Alexandria were endowed by Roman emperors. Vespasiancontributed to teachers' salaries throughout the empire. Charlemagne
maintained a palace school. Sinhalese kings in Ceylon donated gifts ofland, villages, and grain fields during the seventh to the 14th centuries.Nepalese kings supported Buddhist education. Feudal Japanese lords wereresponsible for schools and donated capital and operational costs for fiveyears before village notables and villagers were obligated to accept costsof upkeep. During the Renaissance, the Italian royalty maintained courtboarding schools, such as the Duke of Mantua's school. French kings con-tributed prizes, museums, and libraries for private adult study groups.Moslem custom dictated that local rulers place students in homes ofacquaintances free of charge. African and Indian princes made land grantsto voluntary associations to build schools. In 1861, Malayan royal chiefstried to establish vernacular schools by contributing to a language in-stitute where their contributions were to be matched by the Indian govern-ment.
Profits from Private Enterprise
The 16th and 17th century merchant trading companies establishedreligious schools similar to English' charity schools. The Portuguese com-panies had schools in Ghana; the Dutch East India Company, in NewAmsterdam and in Ceylon; and the British East India Company, in Canada,India, Malaya, and Ceylon. In 1837, the English Board of Trade establisheda National School of Design whose exhibits in 1861 stimulated Parliamentto appropriate 200,000 pounds for the encouragement of science. In 1802,
English cotton milk which employed apprenticed children were obligedto teach them reading, writing, and arithmetic. In the.first part of the 20thcentury, the Ghanian Cocoa Marketing Board contributed two and one-half million Ghanian pounds for secondary school development, con-tinuing a tradition of contributions by African traders to voluntary schools.In 1923, Malayan estates and plantations were required by law to providea school if ten or more children of school age were resident. Turkey also
13
23

expected private companies to provide facilities for school children ofworkers. The Constitution of Mexico of 1917 ordered agricultural, indus-trial, and mining enterprises to provide schools for workers' children.Today, it is common for East European factories and co-ops to providenursery school facilities to workers' children free, or for small fees. U. S.
industry has executive training programs and provides scholarships. Inter-national oil companies have also had many school and training programs.
Customs and Excises
In some countries, educational provision has been dependent uponrevenue from customs and excises. Denmark assigned custom duties in
----"17013"td'IlielbiOi'thest to pay teachers to teach the poor. The duty onwine imported int& Halifax, Nova Scotia, in the late 18th century paidthe schoolmaster's salary. The Custom and Excise Act in England of 1890,the "Whiskey Money Act," for providing technical instruction funneledmoney into county boroughs for relief of local tax burdens. The U.S.state of Nevada used proceeds of toll rates and bridges for their school fund.Ghana and Uganda today use duties on exports and imports to pay forrecurrent education expenses.
METHODS OF FUND ALLOCATION
Accepting education as a national priority is a 20th century phenom-enon. So, too, is the awareness that piecemeal appropriations are inade-quate for the demands of capital investments and recurrent expenditures.Such appropriations allow little expansion of facilities or opportunities forthe general population. General taxation of the late 19th century impliedthe beginnings of a commitment to education as a national investment. In
this century, willingness to allocate resources to educational needs has in-creased constantly. The various ways these funds have been distributedand their various levels of effectiveness is significant.
Student Allowance
Living allowances were given to Hebrew students at the JerusalemAcademy in the first century. In 1253, the medieval city of Ypres gavestudents benches and strawwith no extra charge for medical blood-lettingservices. Room and board was provided for students of higher educationat Ottoman Empire medresses of the 15th century. In addition, their stu-dents were exempt from military service. In 1648, students at Germanacademies received free board. The Dutch East India Company sent ableCeylonese students to Leyden University at company expense in the late
14
24

17th century. In 1871, at the Calcutta Medress, an Arabic Persian languageand Mohammedan school, a student allowance was given.
Scholarships
These have been commonly provided by local, state, and nationalagencies; private companies and organizations; and universities. In theseventh century, Japan sent students abroad for learning. Scholarships
were awarded for room, board, books, stationery, tuition and fees at theOttoman Empire Galatasaray Lise secondary school for Moslems and mixednationalities of the late 19th century. The British Colonial Welfare andDevelopment Acts of the 20th century provided scholarships for Ghanianand Tanzanian students.
Educational Performance Contracting
Another technique for disbursing funds is through educational per-formance contracting. Funds are generally paid at completion of agreed-upon results. A performance contract exists from the Middle Ages spec-
ifying the conditions, expectations, and arbitration procedures of anagreement for a master to teach reading to a banker's sons. Hints of
commonly unpaid tuition are given. Performance contracting in elementary
schools was in effect in 19th century England. Payment by results was alsotried in Ontario, Canada, during the same period.
Grants
These grants have been a basic method of allocating needed supple-mentary funds to local school districts, regions, and institutions in manycountries. There have been many types of grants, used singly or in com-bination. These include: results, block or fixed and proportionate, specificsubject, capital equipment, matching, attendance and per capita, classifica-tion, transport, fee, conditional, salary, and direct teacher.
Results Grants Grants or payments on the basis of results originatedin England with Lowe's Revised Elementary Code of 1862. The idea waslater exported to the British Empire during the late 19th century. Grantswere made to schools based on the number of students passed at periodic
inspections, often in combination with other types of grants.
Block, Fixed and Proportionate Grants Block or fixed grants are aspecified amount granted for a specified time. In 1860, India gave simplefixed grants for five-year periods. Nigeria gives a fixed sum to the National
Universities Commission. Proportionate grants are fixed, but based on a
percentage of a school's expenditures.
15
2J
Specific Subject Grants Specific subject grants were awarded in Ceylonin 1812, for reading, writing, and arithmetic; in Ghana in the 1870's, forindustrial arts; in Malaya, in 1899, for teacher training and commercialsubjects; and in England, in 1902-1914, for laundry and dairy studies.These were designed to stimulate the teaching of particular subjects when-ever the need for that type of training existed.
Capital Equipment Grants These were used in England in the 18thcentury when a grant of 20,000 pounds helped a subscription society builda school for the poor. In 1829, Lower Canada received half the cost oferecting schoolhouses from the government. In the 1940's, South Africanfarmers or missions received a specified amount per classroom when theschool was used as a school for Africans.
Matching or Stimulation Grants Matching grants operate on the prem-ise that there is greater incentive for receiver involvement if equal sumsare forthcoming from a larger authority. Such grants stimulate localinitiative and responsibility.
In 1795, the New York State Legislature appropriated 20,000 pounds,to be divided among districtsprovided they raise an amount equal totheir distributive shares. In 1814, the English government through theKildare Peace Society matched local sums raised by that group in Ireland.The 1854 Dispatches of India stipulated that grants may not exceed amountslocally raised. In the 1880's, Western Canadian provinces required thattheir grants be matched by sums raised in intermediate areas, such ascounty units, with the purpose of equalizing educational opportunitiesover wider areas than townships.
The Smith-Hughes Act of 1917 provided federal funds for vocationaleducation in public schools to be matched by state funds, as did the Smith-Lever Act of 1914 which was directed to agricultural extension services.
England has used matching grants for medical treatment centers, playcenters, adult education, transportation of elementary school children,schools for delinquent children, and university scholarships.
Attendance and Per Capita Grants These fixed grants have been basedon enrollment, average attendance, or upon the number of pupils attendingexaminations. In 1853, England used per capita grants to supplement aschool's income. These were based on three-fourths of the childrenpresent during inspection on three rudimentary subjects. In the 19thcentury, the Ceylonese government paid grants to mission schools, basedon the average number of pupils. From 1902 to 1914, England used fixedgrants based upon average daily attendance. From 1920 to 1950, South
16
2 (i

Africa granted an amount to schools based on 110 per cent of the numberof pupils in attendance the previous year.
Classification Grants These depend on evaluation of a school accord-ing to several criteria: teacher quality, subject matter, efficiency, and,at times discipline. In 1882, Nigeria used discipline. In 1899, Malayan
schools had three levels of efficiency. In the early 20th century, Nigeria
and.Ghana also used efficiency as a criterion. In addition, vernacular schools
received half the amount obtained by English schools.
Transport Grants Since 1920, these have covered transportation costsfor students in Tanzania, free motor transport to mission schools in southernSudan, free railroad travel to Denmark's students, transport of elementarystudents to and from school in England, and busing of some parochialschool children.
Fee Grants Fee grants were attempts to eliminate tuition by reimburs-ing schools which had eliminated it. In 1891, the English government paid
ten shillings per year per child to elementary schools which ceased to
charge fees.
Conditional Grants Throughout history, special conditions have
prompted grants that recognized specific immediate needs, or particular
goals. In the 1830's, English grants stipulated that Scripture reading be
mandatory in recipient schools. India, in the Dispatch of 1854, insistedthat payment of some fees be a condition of receiving grants. In 1854,
South Africa made grants to schools teaching industrial arts, where master
craftsmen were in residence, to promote the teaching of industrial arts
to Africans. In 1876, England granted aid to sparsely populated 'areas. In
1882, India made grants to backward areas, to the poor, to girls, and to
lower castes. Frorn.1902-1914, England granted aid to special schools for
the deaf and handicapped.
Salary and Direct Teacher Grants Salary grants are based on a school's
expenditures for wages. Central Authorities often grant a percerv.age of
total salaries to a school. From 1880 to 1930, the Central Government of
West European countries often absorbed the entire cost of teachers'
salaries. In addition to straight salary grants, teachers have received special
aid for hardship areas, superior qualifications, seniority, travel, teaching
of special subjects or difficult children, and living allowances.
SUMMARY
Some tentative conclusions emerge, even from this brief description
17
27

of the history of educational finance. Educational finance is still an areaof great experimentation. There has been no steady pattern in history,except the expansion of provision of education for the masses andincreased state acceptance of financial responsibility. Most methods ofsecuring funds have ample precedents. Some of the historical experienceswith these methods of financing are useful lessons to those advocating newforms of financing.
18
h8
CHAPTER II
Public and Private Education: ThePhilosophies Behind the Issues
FINANCING and providing education are essentially separate functions:those who finance the system need not control or even influence its
provision or administration. These two functions can be carried out bygovernment, market forces, or a combination of the two. An individual'spreference for one mode of financing and provision of education overanother involves deep feelings toward the function of government insociety.
This chapter will focus on the justification for government interven-tion in education. It will give arguments for and against the differentmodes of financing and providing education. The varying possibilities ofdistributional equity, social cohesion, and equality of social opportunityunder these modes will be presented.
JUSTIFICATION FOR GOVERNMENT INTERVENTION
Government intervention has been advocated to increase overalleconomic efficiency and to foster distributional equity.
Economic EfficiencyExternalities and Market Imperfections
When one person's actions impose uncollectable costs on others oryield non-chargeable benefits, these are called externalities. Education
produces positive externalities of both an economic and non-economicnature. Private external benefits include: the transmission of literacy,aesthetic and cultural values, the creation of a politically sophisticated andinformed electorate, and additions to knowledge through research. Thepublic economic benefits include: greater productivity and human capitalinvestment which are needed for national economic growth.
These positive externalities justify substantial government intervention.If decisions on educational expenditures are left to the individual whocannot derive all of the benefits, lie will tend to under-invest in education.Because society receives benefits beyond those accruing to the individual,
19
29
it must, therefore, share part of the costs and also insure the continuoussupply of those benefits by providing education.
Market imperfections can occur when the information system is weak.This causes decisions based on imperfect knowledge that do not producean optimal allocation of resources. Faulty information on costs and benefitsof education's outputs is common. Labor markets do not always reflectchanges in demand for occupations. There is also a long time-lag betweenthe decision to educate persons for a given occupation and their actualentry onto the job. The risks of education then become very high andcannot be guarded against because "human capital" is not accepted ascollateral.
In most cases, education is similar to the telephone and electric com-panies which develop natural monopolies to produce the commodityeconomically. Because of the important social benefits of education andbecause consumers have little power in such a monopolistic market,government may be the best manager of a natural monopoly, such aseducation.
Distributional Equity
Most countries consider education a human right. A society mustinsure all members access to education, regardless of socio-economicclass, geographical region, or any other classifications. But, in a free market,education is not always available to the poor, and government assistance isessential.
FINANCING OF AND PROVISION FOR EDUCATION
Financing of and provision for education are essentially separate func-tionsthose who finance the system need not control or even influenceits provision or administration. But financing decisions very often affecta system's actual working._ This is because of the financing authorities'expressed intent or, more Often, the unintended consequences of financialdecisions and constraints.
There are four modes of financing and providing education:
Total government control both financing and provisionTotal private controlboth financing and market provisionGovernment finance and market provision
Private finance and government provision
It should be noted here that even when both financing and provision areprivate, government can intervene with legal controls, such as inspection,
20
30

licensing, and laws governing curricula and salaries.The individual has two values guiding his judgment of the usefulness
of these four modes: the type of service; and the way it is made available.The preference fOr a mode of financing and provision of education isrelated to one's deep feelings toward the function of government insociety. Some people attach a greater value to a market organization, eventhough service provided by the government is good. The reverse is also true.
THE PHILOSOPHIES BEHIND THE ISSUES
The arguments for and against different modes of financing andprovision should be considered within the framework of three philosophicalattitudes. These question whether people know what kind of educationthey want; and whether they should and do have the power to expressand to fulfill their preferences.
Do People Know What Kind of Education They Want?
Those for total government intervention in financing, as well as pro-vision, feel the government must protect children from unknowing parents.These persons believe a buyer is not always qualified to judge a commodity,particularly, education. Thus, open competition in education seems unde-sirable for both the individual and society. They believe most parents areill-informed, subject to commercial pressures, unwilling to make decisions,and likely to under-invest in educationall resulting in superficial, notbasic education.
Education itself molds choices, tastes, and preferences. Its future
demand is a function of education provided in the past. Parents are limitedby their own experience. Total government financing and provision allowsthe government to break the cycle of poverty and better educate those whowould not independently "buy" such quality.
Some proponents of government financing and provision also see noeffective and reliable method of providing the consumer with informationto help him function better in the educational market. They feel thatpeople do not know what they want 'and must, therefore, have their truepreferences expressed by others, so that their ignorance hurts neither theirchildren nor society.
The opponents of government intervention want a completely freemarket with total private financing and provision. They maintain thateducation is a purchasable commodity where market rationality applies aswith all commodities. They assert that total government provision fostersignorance by depriving people of the exercise of their rational choice.
21
31
For the few cases unable to take advantage of a market system, legislationcould safeguard children from parental ignorance. Moreover, the argumentof protectionism can be used against supporters of total governmentintervention by asserting that children need protection against incompetentadministrators and teachers who would be making decisions. Those for atotally free market admit that people make mistakes but say that a Ministerof Education becoming the "parent" for everyone is unacceptable. Theyfeel that-infringements upon personal freecibms would be intolerable, andthat it might be better for each parent to be a "Minister of Education,"receiving the same information as government officials. They believe thefamily institution is fundamental and must be allowed to choose the besteducation for its children.
Those for government financing and market provision take most oftheir arguments from the proponents of the market system. This assumesthe market's effectiveness for delivering education, and the individual'sprimacy in asserting his preferences over those of society. This approachdoes not oppose government involvement. Its thrust is government helpingindividuals to express their preferences in the market.
Do and Should People Have the Power to Express Their Preferences?
The proponents of total government involvement say that the peopledo not know what kind of education they want. They assert that thegovernment should direct their preferences through elected or appointedofficials.
Their opponents obviously believe that majority rule can be tyrannyand that each person should have the power to express his preferencesfor education directly, rather than through the medium of politics. Theyassert that under the free-market principle a person who buys his owneducation has more control over what he gets than if he gets it throughtaxes and someone else buys it for him. By being forced to buy his educa-tion through his taxes, he is subordinated to the supplier.
The self-interest of those who supply state education fosters continuedprotection of their long-established educational monopoly. Suppliers ofeducation, protecting their livelihood, have a disproportionate interestcompared to the diverse interests and demands of consumers. If govern-ment intervenes to help the supplier, this gives suppliers a disproportionateinfluence over consumers. Suppliers mold rather than respond to publicopinion. Government intervention reduces the individual's power to ex-press preferences. Those planners for government intervention say thisshould be done.
22
a2
Those advocating government financing and market provision againfollow the market proponents. Power to express preferences must lie withevery individual, but the government is important in strengthening thatpower of expression so that preferences are fulfilled.
Do and Should People Have Power to Fulfill Their Preferences?
The right to have and express preferences is a basic question. Its im-portance depends on this third question--whose preferences prevail? Howmuch power do people have to fulfill their preferences? Do they reallyhave much freedom of choice and action? These questions are basic to theissues of equal access to education, equality of social opportunity, and tosocial cohesion through education.
Equal Access to Education There are three alternatives for equalizingaccess to education. These varied approaches derive from the differentways of viewing the role of "purchasing power" in achieving equal access.
The proponents of government financing and government provisionalways believed that providing equal access was a social responsibility. Noone should be denied education because he cannot pay for: books ormaterials. Fees should be abolished, and the public schools should be thegovernment's responsibility. The idea of equal opportunity of educationcame into being in 19th century England and resulted in compulsory educa-tion. Compulsory education required that everyone take advantage of theopportunity.
This compulsory approach provides education and eliminates theproblem of equalizing purchasing power. No one buys educationit isfree to all. Without purchasing power, individuals cannot fulfill preferences.
Proponents of the market approach, free in both financing and pro-vision, obviously differ. They agree in principle on the need for everyone'sequality of purchasing power, but they oppose government financing andprovision because they say it does not do what the government says it does.
First, education is not free. People pay indirectly through taxes ratherthan directly in the market. Inequities of purchasing power are noteliminated. Rich communities can provide better education than can poorones. The rich can also choose private rather than state education. Moreforms of education are open to them than to the poor.
There is also the argument of double taxation. Families not using thestate system must pay again in the private system. They are not utilizingtheir education taxes. It is argued that double taxation forces the poorto use the state system because they cannot afford to pay twice, eventhough they would rather have another type of education. Also, many
23
3
middle- or lower-middle income families who have to use the free stateeducation system may accept a lower end result of education than theywould if they paid the full costs of education.
Proponents of the third strategygovernment financing and marketprovisionbelieve that equalization of purchasing power can best beobtained with their approach. The totally private approach cannot, withoutalso eliminating purchasing power as the government approach does.Government can give subsidies to individuals so that the poor have as,inuchpurchasing power as the rich but are free to use it as they wish. Thus,government financing and market provision equalizes the power to fulfill'preferences, which is impossible in both the totally free market andgovernment provision alternatives.
Equality of Social Opportunity Through Education Equality of oppor-tunity is measured by the output of education, not the input (money spent).Its concern is the extent to which individual preferences for specific out-puts are met through the different policy alternatives. What matters is,nor how "equal" the school is, but whether the graduate is equipped tocompete with others, regardless of social origins.
Given the goal of equality in social opportunity and the assumptionthat schools should significantly help meet it, advocates of both govern-ment financing as well as government provision insist that equality ofsocial opportunity can be achieved only when schools break the povertycycle. As their arguments on knowledge of preference and power ofexpression indicate, they believe total government intervention in educationis necessary. Only when knowledgeable decision-makers control theeducational system through curriculum control, teacher quality, and re-source-use and provide it "free" in order to equip each child adequately tocompete in the labor market will equality of social opportunity result. Thepoor cannot break the poverty cycle; government control of educationcan do it for them.
Proponents of the government financing but market provision alsobelieve that government should help education achieve equality of socialopportunity, but not by total intervention, since it has not succeeded thusfar in achieving the objective of equality. At the level of local government,the disparities are even sharper. Rich communities with a more lucrativetax-base give their governments more to spend on education than do poorones.
Advocates of government financing but market provision believe
these problems can be solved through their approach. Because it equal-izes buying power, only schools that effectively prepare a child would
24
34
survive. Such schools might use radically different approaches for advan-taged and disadvantaged children. Because children must be educateddifferently to equalize their opportunity, the flexibility of this system makesit successful and the rigidity of government provision, unsuccessful. Thepoverty cycle can be broken in the market because these people canexpress their preferences. The government's only function, these advocatesassert, is to insure equal power of expression. Equality of social opportunitywill follow.
Social Cohesion Besides equality of access and equality of social op-portunity, the issue of social cohesion must be considered to determinewhose educational preferences should prevail. The idea of a shared codeof conduct, belief, and values may be vague and could range from theclose-knit Israeli kibbutz to a caste system. Education's contribution to asense of social cohesion is generally in fostering citizen consciousness andinstilling common values. The various strategies discussed have differentorientations to this problem.
Proponents of total government intervention insist that only their typeof control will maintain social cohesion as the important common goal itshould be. Schools provided by the market may foster social divisiveness,with no guarantee that common values will be emphasized. In the freemarket, schools may have specific social, economic, and religious ap-proaches and thus provide a narrower education than in governmentschools. Government intervention advocates assert that schools providedthrough the market give individual interests precedence over social goalswhich they feel would not produce a cohesive society.
Market provision advocatesfor both private finance and publicfinanceassert that social cohesion has practical limits. Barriers of religion,ethnic identity, and economic status differentiate populations, so it is
unrealistic to expect schools to provide social cohesion to a major extent.They argue that one need only consider the existing separatism in manycountries to see that government provision schools do not create the socialcohesion advocated for them.
Advocates of government finance and market provision believe theirposition is on middle ground. Government financing may be legislatedto foster some social cohesion but care should be taken so that there willbe minimal infringement on freedom of choice.
CONCLUSIONThe previous discussion indicates that preference for a given mode of
financing and provision of education is greatly influenced by the way leaders
25
35
and citizens view the role of government in society. Preference is a decidingfactor when all other things are equal, but preferences can be overruledwhen costs of satisfying these preferences become too high, or when theseeducational needs collide with other, 'more important needs.
It is important, therefore, to review existing patterns of financing andprovision as neutrally as possible, keeping in mind the philosophical issuesraised in this chapter.
26
CHAPTER HI
Review of Taxes CommonlyUsed to Finance Education
EDUCATION is primarily a public expenditure. Financing education isclosely connected with a country's ability to raise tax revenues. The
composition of tax revenues varies from country to country. But, fordeveloping countries as a group, the largest proportion of fiscal revenuescomes from indirect taxes. These are, in order of importance in thestructure of total tax revenue: taxes on international trade; taxes on exciseand fiscal monopoly profits; sales taxes; and taxes on internal transactions.There are also three direct taxes: corporation taxes; personal income taxes;and property taxes.
Analyzing the financing of education need not include a detailed studyof the general sources of revenues for all public expenditures becauseeducation seldom exceeds 20 per cent of total Central Government
budgets. But it is important to evaluate particular taxes that are eitherearmarked for education, or are the main source for educational expendi-tures.
Because property and sales taxes are the most frequently used taxesto finance education, they are the focus of this chapter. Special attentionis given to the value-added tax which has been proposed as a new wayto raise educational revenue. These taxes are appraised according to several
criteria to enable decision-makers to evaluate their usefulness.
CRITERIA FOR EVALUATING TAXES IN GENERALAS SOURCES OF FINANCE FOR EDUCATION
The efIectiveness of different taxes as sources for education involvesevaluating the taxes according to the following criteria: adequacy, stability,growth, compliance and administration, impact, incidence, and neutrality.
Adequacy A given financing method must provide the money neededto operate the educational system satisfactorily.
Stability Because the educational process is continuous, availability of
27
37
funds cannot fluctuate widely without adversely affecting the educationalsystem.
Growth Because a natural increase of population usually increases thedemand for education, sources of funds must grow so that the quality ofeducation does not deteriorate.
Compliance and Administration The effectiveness of providing fundsfrom taxes often depends on the ability to enforce the taxes withoutincurring excessive costs.
Impact How easily a taxpayer can shift his burden to someone else,a form of tax avoidance, has significant social and economic effects whichmust be considered in evaluating the tax's use in a country's tax system.
Shifting a tax changes the levy's initial impact by changing marketprices of whatever is taxed. Tax is shifted either forward or backward:forward, as higher prices to consumers; backward, in lover prices tosuppliers. The shifting can occur within a sector and between sectors.Shifting between sectors occurs when a tax imposed in one sector causesa reduction in supply of that sector's output which tends to drive up theprice of the output in another untaxed sector.
Incidence Whoever bears the ultimate burden of the tax bears theincidence. The ultimate burden of the tax is related to the tax's distribu-tional effects. A major concern of incidence theory is to determine thereal income of various groups under a specific tax. More than just amatter of relative price changes, incidence analysis deals with real incomechanges. This distinguishes it from impact analysis. Incidence must bejudged by the principle of equity. Equity involves a value judgment. Eachsociety and, ultimately, each person may differ in attitudes. But there arevarious standards. Those usually used are:
Equal treatment of equalspersons in the same circumstance aretaxed the same amount.
Distribution of the overall tax burdenbased.bn ability to pay asmeasured by income, by wealth, and by consumption.
Exclusion of the lowest income groupsbecause they have notaxpaying capacity.
A progressive, overall distribution of the tax relative to incomebased on the rise of tax capacity relative to income.
Neutrality This indicates how the tax affects economic decisions. Theless distorting its effect, the more neutral its effect on decisions.
28
38
These seven criteria can constitute usable standards by which toevaluate financial plans.
EARMARKED TAXES FOR EDUCATION
Revenue for education can come from the general budget as eithera fixed or a variable proportion of the total revenues. When the proportion
is fixed, this is called earmarked revenue. When revenue is derived from
specific taxes for education, these are called earmarked taxes.
Earmarked taxes should only be used where they serve as proxies forfee payments because payments for a service should be linked, as muchas possible, to its users. (If motorists pay for the use of highways, they willadjust their consumption accordingly. Because it is difficult to have tollgates at all points, a gasoline tax is imposed as a proxy for using the road.)
This does not work for education. No special type of taxes can serve
as proxies. Theoretically, earmarked taxes should therefore not be usedas revenue sources for education. But when education is financed fromgeneral revenues, and revenues fluctuate significantly or the Ministry ofEducation is weaker than other ministries, fluctuating resources for educa-tion may result. In this situation, earmarking taxes or assigning a fractionof earmarked taxes may be justified when the types of taxes produce fairly
stable revenues. This allows the continuing flow of resources and expendi-tures necessary to maintain a certain quality of education.
From the general viewpoint of public finance, earmarked revenue foreducation is not desirable because it introduces rigidity in the allocationsof the budget. But when decisions on education's share in the budgetbecome arbitrary and do not take into account educational needs, it maybe necessary in some political contexts to insure a minimum amount of
expenditures as a "safety net" to protect resources for education from
struggles between ministries.
Earmarking may also be a way to "sell" a new tax to the public.Citizens who have little confidence in their government may be morewilling to accept a new tax if they know where the money is going.Furthermore, education is important to most people, and they are oftenmore willing to be taxed a little extra for education than for other purposes.
ANALYSIS OF PROPERTY AND SALES TAXES
When education is not financed from Central Government budgets but
from earmarked taxes or from state and local budgets, property and salestaxes are the major source of funds for education.
29
39
Property Taxes
The efficient and equitable raising of revenue to provide governmentservices has always been an economic concern. One of the oldest waysto raise these funds is by means of the property tax. This is broadly definedas a tax on all tangible wealth with exchange value.
Society has long held land as highly important, compared with othermeans of production. In feudal times, land was a logical base for all taxa-tion. Revenue for governmental services was expected from land becauseit seemed that its owner could easily get a surplus return from it. Land
was easily assessed and the tax could be collected immediately.With' the e'x'pansion of commerce and industry, the relative importance
of land changed. Agricultural land lost its important position in nationalwealth. Property did not. Property became more loosely defined as tangiblewealth with exchange value. Defined this way, the property tax remainedimportant. It applied to tangible wealth in both agricultural and urban areas.
Today, there is no special economic reason for subjecting land to dif-ferential taxation, but immobile property is still taxed at higher rates thanmobile property. Probably, the difference remains simply because a tax onland and immobile property is difficult to evade and is more easily admin-istered. It may also involve less severe inter-governmental competitionfor tax sources than other forms of taxation. The property tax is one of theoldest because of its relative simplicity and stability in raising revenue.
Property taxation is used throughout the world, especially in thosecountries once under the influence of the British tradition of property taxa-tion. The property tax is used more by local than Central Governmentsbecause jurisdictions are dearer. Local governments typically have limitedtaxing powers and must, therefore, rely more on readily accessible revenuewhen funds cannut be obtained from Central Governments.
Generally, those countries without some form of property tax do nothave much autonomous local government. In the United States and else-where, the importance of this tax varies with the strength of the localgovernment. Such a tax is maintained to retain decentralized decision-making, and owing to the democratic attractiveness of home rule. But thisis not the major reason for its importance. The basic need for local govern-ments to raise revenue and the reasonable efficiency of the property taxexplain its practical significance.
Rapid population increases, growing urbanization, and longer compul-sory school attendance have increased demands for local services. The highcosts of these services, especially the rising cost of education, test the prop-erty tax's effectiveness. It consistently supplies high proportions of funds
30
,40
needed, especially in developed countries. This is due in part to the easewith which local tax authorities can vary amounts collectible from a prop-erty tax and in part to the responsiveness of the economic base of theproperly 31440 Revenues from the tax clearly show a high "GNP elasticity"tax revenues rise by more than one per cent when there is a one per centincreasejta GNP. In recent years, this high "GNP elasticity" has reducedcriticisms of the tax. Its continued existence is explained as much by itspracticality as by its administrative expediency, politically desirable home -rule. basis, and general flexibility.
Nature and Characteristics of the Property Tax
The property tax is based on the ad valorem or valuation of an asset.Such taxes are non-personal and recurring. They are imposed upon theowners or users of property. The uniformity and generalitVzof the tax havediminished recently because of difficulties in administering such taxes inincreasingly complex local jurisdictions, each with its own special needsand abilities. Differences among types of property taxes are evident whencomparing tax-bases among different countries.
Such differences indicate the unresolved problem of defining "taxableproperty." In many countries, the ambiguity has partly caused the tax toevolve into a levy on only one specific type of property: real estatelandand permanent improvements to land. But real estate and improvementsare quite diversified. This causes property taxation to apply to a hetero-geneous aggregate, which creates major difficulty in defining the propertytax-base.
In order to compare and measure widely diverse assets, there mustbe some common element as the basis of what is taxed. The concept ofproperty suggests these assets should be physical things. Limiting the prop-erty concept (at least in taxation) to physically real things is obviouslyconvenient. Assessing non-physical property is highly subjective. Propertythat consists of only physical things can be assessed on a strictly objectivebasis. An asset's value is determined by its market exchange value, whichis a relatively objective measure.
Assessment Techniques
When property consists mostly of land, taxes have been assessed ac-cording to three concepts: the physical unit, income, and rental value.
Under the physical unit concept, land is assessed per unit of surface,regardless of the land's productive capacity. Such a tax is most suitablewhere land is plentiful and is applied either at a uniform or classified rate.
31
; 41
The uniform rate is best applied where the taxed land is homogeneous,each unit having the same value. The classified rate differentiates suchqualities as district, type of irrigation, or economic use of land. The phys--ical unit property tax, at a rudimentary level, combines the simple areaapproach' with the- more advanced one of assessing land value or produce.
Under the income concept, the taxable base includes not only theland's income but also that of other factors of production. These includelabor value of the cultivator and his family and the return on capital invested,as well as improvements on land or equipment. There are several types ofincome-based taxes. The base can be determined by a gross yield (or in-come), or a net yield (or income). Another form is taxing only producebrought to market.
Under the rental value concept, the base used for calculating propertytaxes is derived from its rental value. This is either the payment for usingthe land, commonly called annual rental value (ARV) in the British tradition,or an equivalent capital sum, commonly called capital value (CV), practicedin the United States. The major difference here is that the annual rentalvalue refers to only current income, while capital value refers to bothcurrent income and wealth. This difference is explained by the treatmentof vacant land. ARV entails a tax based on present, actual use of property;therefore, vacant properties are not taxed. CV is the capitalized value ofexpected net returns from property at its highest legal profitability. This
does not presuppose present use; therefore, under the CV concept, vacantland is taxed.
A workable method of assessment is needed for both ARV and CVbases. This requires the determination of a "normal" or "long -term value,"not necessarily the actual value of any particular time.
Buildings can be assessed according to ARV and CV concepts, and alsoin terms of comparative sales (based on the value of similar buildings beingsold in the market) and reproduction costs (based on the present cost ofconstructing a similar building).
Other Characteristics of the Property Tax in Theory and Practice
In theory, propeffy taxes are generally characterized by their grossproperty base, an ad valorem measurement, and impersonality. Propertytaxes are impersonal in that they are not applied to people. There arepossible variations based on ability to pay, but these are instituted on a class,not an individual basis. In practice, these characteristics are not very com-mon or uniform. A country's property tax is not a single uniform tax, buta consolidation of numerous levies reflecting differences in the legal defini-
32
4
Lions, the most readily available economic base, the demand for funds, andthe most feasible tax rate. Because these variables differ in various areas,an assumed uniformity does not hold up. Assessment practices vary fromone district to another. The universality of the tax is also thwarted bynumerous legal exemptions approved in some countries.
In theory, because the property tax is impersonal, the rate structure issupposed to be fairly rigid and the revenue yield, inflexible. But, in practice,the rate structure and revenue have been flexible. In many developingcountries rates are, in fact, adjusted to relieve taxpayers from hardship situa-tions. Differential rates are also designated for specific purposes. For ex-ample, loWer rates may be applied to high rise buildings to encourage thistype of construction in land-scarce areas.
Impact, Incidence, and Neutrality of the Property Tax
The overall impact, incidence, and neutrality effects of the propertytax are less discernible than those of any other major tax. These effects arehard to predict accurately because the property tax differs in various locales.
Impact
When property has not been bought or sold during a particular period,the owner must incur in full any newly levied tax during that period. If
transactions do take place, shifting may occur. Its extent and directiondepends on the type of property, its relative availability, and how the de-mand for housing changes as the price of housing changes. With property,shifting is usually forward in the form of higher prices to consumers.
If the property taxed is land sites, the owners theoretically incur thelevy. Shifting generally occurs when the supply of a tax's asset is reduced.In this case, the supply of land is not reduced; therefore, the tax cannotbe shifted forward to other users. Prospective buyers of such sites facedwith this higher annual tax burden will thus reduce their bids; a propertytax on land generally causes lower land prices. .
Owner-occupants of housing cannot shift the tax. A home is a con-sumer good whose taxation is hard to shift because it is for use and notfor sale. Only a tax that is high enough to force an owner to move couldbe shifted, but ,then only in part. The owners would incur at least part ofthe tax because the hOuse's market value would be reduced.
Property taxes on improvements and on tangible personal propertyused in business are usually assumed to be shifted forward to the products'consumers or with rental housing, to the occupants. Theoretically, rentcontrol relieves the tenant of some of the shifting of the tax because govern-
33
43
ment puts a ceiling on rents. In practice, tax clauses are often written intoleases that allow the continuance of tax shifting.
A general property tax on business capital could conceivably be shiftedbackward to the owners of capital, causing lower rates of return on theentire stock. This assumes the supply of savings is not responsive to interestrate changesa phenomenon not universally supported in practice. Mostbusiness property taxes are probably shifted forward, and much of the re-maining portion can be shifted backward to the owners of the capital asreduced asset values.
When a tax shifts within a sector, the division of the tax between land-owning and tenant groups becomes significant. In a country where landor housing is relatively plentiful, landlords competing for tenants tend toabsorb the tax. In countries that are land or housing poor, the tax is shiftedonto tenants unless they are protected by governmental regulation.
incidence
Most studies concur that the property tax is regressive. This is due tothe fact that the tax is largely a consumption tax, and a tax on consumptionis usually regressive through much of the income range. There are twocommon explanations for this overall regressivity, particularly for residentialproperty. The first results from inconsistent assessment procedures. Asses-sors usually value lower-priced property at higher percentages of full marketvalue and higher-priced property at lower figures. Presumably, this comesfrom the inability of local assessors to accurately evaluate expensive, com-plex property that typically shows inadequate market evidence. It is muchsimpler to accurately assess the more numerous inexpensive properties thatare frequently sold and, thus, show good market evidence. As far as uniformrates apply to all types of property, the result is marked regressivity.
A second and more adequate explanation is the fact that poor familiesspend a much larger percentage of their total purchasing power for housingthan do richer families. Expenditures on housing thus exhibit a relativelylow degree of income elasticity. As far as this is true, the tax on residentialproperty again exhibits substantial regressive tendencies. Much non-residen-tial property also exhibits regressive effects from the property tax. The
forward shifting of a substantial part of business property taxes causes suchlevies to be in part equivalent to a regressive general consumption tax. Whencombined, residential and non-residential property taxes are markedly re-gressive in the middle range of the income distribution.
Another regressive effect of the property tax comes from double taxa-tion. Because a distinction between rights and claims on property and the
34
44
actual physical thing itself must be made, some economists consider theproperty tax to be a tax not on personal wealth, but rather an erroneousdouble taxation on gross assets. Clearly, to tax a property's value plus itsmortgage (which is intangible property) is taxing a significant proportion ofthe total valuation twice.
The property tax has little relationship to ability to pay. It may be truethat, over time, asset values do tend to reflect capitalized income, butincome flows do not necessarily coincide with the particular taxpayer'sasset values at a given time. Discrepancies normally occur between thetime of income receipt and the time of tax payment.
The property tax also has been criticized because the tax is not alwaysrelated to the income derived from property. When land is being trans-ferred from idle to productive use, or when rural land becomes urbanized,tax rates nay rise quite prematurely to the actual realization of income fromthe land because of the increased potential value of the land.
Neutrality
Property taxes are not neutral. The property tax affects work incentives,saving, investment, consumption, and production inputs. Therefore, patternsof resource distribution develop that differ from those where there is noproperty tax.
Particularly in developed countries, much of property tax revenues isdevoted to education. The probable effect of the property tax is to shiftresources from private improvement of land to public education. Someobservers believe that although the substantial nature of the shift causesdiscriminatory effects in other sectors, the shift is still beneficial. Given thehigh social rate of return on investment in education, the extensive develop-ment of public education programs has been important for national eco-nomic growth in many countries, particularly, low-income countries. Further,the unquantifiable returns of education to the individual may make invest-ment in human development more advantageous relative to other formsof investment.
The property tax does not seem to have such favorable effects on othersectors. In the private production processes, it encourages substitution ofalternative inputs for real property. To the extent that industries are lim-ited in their capacity or opportunities to!substitute factors of productionwithin a reasonably flexible cost constraint, the tax is discriminatory bydiverting resources away from those industries with relatively rigid produc-tive processes.
The tax may also discriminate against housing by discouraging its con-
35
45
sumption. The average rate of excise tax on housing is much higher thanthat on most "oilier -uses of the consumer dollar. In suburban areas, thetax is disproportionately higher, but the consumption deterrent may besmall because the tax is directly tied to school and other public expenditurebenefits realized by the home-owner. This direct relation is much moretenuous in larger cities. In some countries, housing expenditures are alsolargely exempted from personal income tax, which also helps offset thediscouraging nature of the tax on investment in housing. Because somecountries make interest expenditures deductible and do not tax imputedrent, investment in owner-occupied housing, in spite of the general tax, isencou raged.
The non-neutrality of the tax is obviously objectionable to those whodo not see its direct public benefit. But this objectionable nature may stemlargely from the traditional perspective of viewing the tax strictly as a cost.This may be because some of its benefits are not readily apparent to non-residential property owners. The non-neutrality of the tax is mitigated if itis seen as a charge for the use of certain types of public facilities, or as acharge for the consumption of specific public services that the taxpayerwould purchase privately, if they were not provided publicly.
In summary, there is less agreement on the economic effects of prop-erty taxation, theoretically or empirically, than on its incidence and shift-ability. Like other taxes, the economic effects largely depend on the scopeof coverage of the levy on all real assets. Property taxation in most countriesdoes not apply to all real assets. There is much differential treatment. There-fore, understanding the tax's precise effects is an empirical problem.
Some Practical Problems of Implementation
When planners decide to implement a tax and determine its exact form,they must often rely on fiscal and administrative expediency, as well as ontheoretical information. For example, in deciding which concept to usefor valuationannual rental value (ARV) or capital value (CV)practicaladvantages and disadvantages of each method should be compared. TheARV base seems to be more equitable. It does not tax expected earnings,nor does it impose hardships due to taxes out of proportion to currentincome. It also avoids injustices because of differential capitalized rates.
But there are some disadvantages. Every addition to property theoret-ically causes additional rate liability. Thus, the tax inhibits the developingand improving of existing housing, something obviously undesirable indeveloping countries. Second, the ARV base works effectively only wherethere is no rent control. With rent control, housing prices are frozen
36
46
relative to other prices. Tax revenue cannot keep up with growing govern-ment needs, particularly during inflationary periods. Another loss of poten-tial revenue because of using the ARV base occurs in rapidly developingcities, where people often buy land to build in the future. The true valuemay far exceed the capitalized value of the present land's rent. The truevalue may thus continue to rise, though rent is fixed. This inability of theARV base to utilize rising property values may cause a substantial revenueloss to a government.
Some of the problems of the ARV base are met more satisfactorily bythe CV concept. When the CV base is used, idle land with considerablemarket value is taxed. Ownership of idle land may sometimes better indi-cate taxable capacity, even though the land does not currently produceincome. When all land is taxed under the CV base, this encourages moreoptimal use of the land than the ARV base does. But this may tend to hurrysocially marginal development of land because of the cost of holding unde-veloped property. Despite such problems, most planners appear to favorthe CV base in developing countries, even where renting predominates.
If the CV base becomes the property tax, there is still the option oftaxing the land's improved or unimproved value. Taxing the unimprovedland encourages developmentholding land off the market for a betterprice becomes unprofitable. Again, this may cause indiscriminate building.Investment in buildings is safe in inflationary periods, but this obviouslyincreases inflation. Further, if the supply of building, labor and materialsis inelastic, increased building must be supplemented by imports which,in turn, increase balance of payment problems. Building owners receivefree urban social services when these services are paid for by the generaltaxpayerwho may rrot benefit necessarily from new buildings. These
problems of social costs, however, can be met by governmental controls,such as interest rates on capital loans, or special charges for municipalservices.
Taxing the land's improved value fosters under-utilization and unfairlyfavors large landowners who can withhold land from use. There is a middleground. There can be a partial rate for buildings that are taxed relative toa city's development and the expanding need for revenue. This methodhas the advantage of encouraging development and acquisition of sufficientresources to provide municipal services for this development.
In addition to problems of misunderstanding and consequent inappro-priate use of property valuation methods, there are problems of administra-tion. Generally in developing countries, property taxes have been appliedmostly in rural areas. This is a major cause of the property tax's ineffec-
37
47
tiveness. Applying the tax in urban areas greatly facilitates its administrationthere, rather than in rural areas. In cities and towns, land is seldom ownedin common and it is easier to identify tax liability. Generally, urban areasare richer than rural ones and can absorb higher administrative costs andstill make collection of the tax worthwhile.
Many countries do not realize how much revenue is lost because ofa poor administrative organization. Adequate administration of land taxesfirst needs an efficient system of land administration. Good records of theregistration of property rights, goods supervision of land tenure systems,and updated inventories of land resources are needed.
Adequate personnel trained in assessment procedures are needed toproperly administer taxes. Heavy investment in this administrative cost willprove worthwhile in long run revenues realized by the tax.
Equitable assessment is crucial to an effective property tax. The taxwill be poorly administered if there is legal vagueness in the evaluationmethod, if properties are not re-valued often enough, or if either intendedor unintended inequities result from calculation procedures. In some coun-tries, discrepancies between calculations of national wealth and the prop-erty tax-base result from a deliberate under-assessing of most taxableproperty. This leads to differences in assessed percentages between varioustowns or cities, where some pay more for services than others. This "com-petitive under-evaluation" has been quite common in developing countries.Much more serious are inequalities between taxpayers in the same district.Residential property is often assessed at various percentages of full marketvalue because of ignorance or favoritism.
Government bureaucracies plagued with inefficiency will have tax col-lecting problems because of two related factors: the quality of the admin-istrative organization, and the society's attitude toward the tax. The relatedphenomena of evasion and compliance can serve as indices to both theabove factors.
Evasion most frequently occurs through political influencing of asses-sors and tax collectors, by general non-compliance, or through under-payment. When people will not pay their tax, administrative costs of col-lection become prohibitive. But when compliance costs for the governmentare held to a minimumby extensive records required of the payergovernment costs of collection are reduced. Placing the burden on theassessors, instead of relying on the stated returns of the taxpayers, probablyincreases administrative costs and may not necessarily increase compliance.
A country's property tax is dependent upon its administration. Thenumber of taxpayers affected by the tax is partly determined by the tax's
38
48-
purpose, but also partly by administrative feasibility. Some administrativeproblems can also determine the adjustment of the tax-base and its calcula-tion. This affects the impact, incidence, and neutrality of the tax. Muchmay be said for the administration of a simple tax, but the country's long-run interests must be considered.
The foregoing discussion of the practicality of using different types ofproperty valuation and the difficulties of administration are clear indicationthat no one form of property taxation fits all countries or all localities withina country. It seems best for countries and localities to choose the mostappropriate form of property taxation, based on their specific circumstancesand needs. The ultimate decision about the utility of a property tax dependson its function within a country's overall tax policy.
Sales Taxes
Sales taxes vary widely and have differing effects on economies. Thesevarious taxes are called sales taxes because of common specific character-istics and economic consequences.
Sales taxes may be generalimposed on the sale of all goods andservices except those specifically exemptor they may be specialappliedonly to certain commodities or services. Both forms may be levied at theproduction, wholesale, or the retail level.
The base of such a tax is the amount of commodities sold (or bought),measured either in physical units or monetary value.
In theory, sales taxes are proportionalthe tax rate is constant regard-less of the amount of the base. In practice, they are regressive; the poorusually pay a larger proportion of their income in sales taxes than do therich.
Such taxes effectively raise revenue with a fairly stable yield, that is,a yield subject to less fluctuations of the business cycle than income orproperty taxes.
After the implementation of a sale, taxes go to the government imme-diately. There is little of the lag in the receipt of funds that exists in otherforms of taxation, such as the property tax.
Sales taxes are "socially expedient." Relatively large amounts are paidwith little expressed dissatisfaction by people because they pay it in smallamounts.
Sales taxes are shifted forward so much they are also called "consump-tion taxes"because the consumer ends up paying. If the demand for aproduct is broad and, generally, steady regardless of price increases, thetax will be shifted onto the consumer. There are two main exceptions to
39
the forward shifting effect of sales taxes. If the demand for a productchanges appreciably as prices change, the supplier may absorb the cost ofthe tak to avoid losing customers through increased prices caused by thesales tax. Also, if a supplier's establishment borders an area not under thejurisdiction of a tax, he may absorb the cost of the tax to maintain competi-tive prices with the same commodities sold in an area across the border.
Retailers, wholesalers, or manufacturers assess and collect sales taxesand the government collects the revenue from them. The various kinds ofsales taxes make either the collector's or the government's administrativeresponsibilities more or less difficult and cumbersome.
The above characteristics apply to all sales taxes. There are specifictaxes whose differences in structure and application have various conse-quences for the economies of developing countries. These taxes are de-scribed below.
The Turnover Tax Such a sales tax is imposed at all levelson theproducer of raw materials, the manufacturer, the wholesaler, the retailer,and the consumer. Usually the rates of a turnover tax vary. Sales made bywholesalers are subject to one rate; sales by retailers, to another. The ratesare usually proportionate to the markup of a product at all stages of produc-tion. Rates at the wholesale level are lower than at the retail level. Thetax accumulates through production and distribution channels, and thefinal purchaser pays the total tax.
The turnover tax has some obvious problems. First, the increased pricethe consumer pays exceeds the total amount of taxes paid at various levels.Each dealer not only passes on all preceding taxes, but also determines hismarkup based on his total cost, which includes such taxes. Second, a turn-over tax favors vertically integrated production. Such a pattern has fewerstages in the production chain that are subject to taxation. To favor large,vertically organized firms puts an inequitable burden on those firms whichdo not choose to pay or cannot avoid the tax. It may even force small,non-vertically integrated firms out of business. Encouraging vertical integra-tion may be economically unwise if it tends to lead more slowly to eco-nomic growth than other patterns of production. In developing countries,where many firms are small, a turnover tax appears to have more harmfuleffects than beneficial ones.
The Single-Stage Tax at Pre-Retail Levels This tax is imposed only oncein the production-distribution chain, either when the manufacturer sellsthe goods or at the first or last wholesale transaction. The tax can also becollected at point of importation because most taxable goods in develop-
40
50
ing countries are imported in finished form. Imposition of this tax at eitherthe manufacture or the wholesale stages of the marketing chain avoids thesubstantial economic distortions of the turnover tax and concentratescollection on a small number of wholesalers. This is a particularly advan-tageous form of sales tax when much retailing is clone by peddlers or atmarket stalls. These retailers are not burdened with either tax collectionfrom consumers or tax payments to the government.
There are difficulties with both the manufacture and wholesale formsof this single stage tax. Both result in a non-uniform ratio of total tax tocost of production. Both have a similar cumulative effect, although notas severe as that of the turnover tax.
A specific disadvantage of the manufacture form of a sales tax is its
tendency to shift manufacturers into distribution, thus reducing the tax-base. This forward integration of firms is inefficient. It encourages "house"brands of goods. The product can be bought from a manufacturer cheaply,and distribution and advertising costs will not be taxed. As in verticalintegration problems of the turnover tax, firms that do not modify theirdistribution methods carry the burden of this tax, while those that doadjust avoid the tax.
A similar disadvantage occurs in the wholesale tax. This favors theretailer who integrates backwards. By doing his own manufacturing andwholesaling, he avoids the tax.
The Retail Sales Tax The retailer collects this tax from his customers;the government collects it from him. One advantage is that the retaileravoids all the problems of the pre-retail sales tax. There is complete for-ward shifting of the tax, with the consumer burden remaining uniform. Thetax is introduced at the end of the production-distribution chain, so it
does not accumulate. The retail sales tax also leaves production anddistribution methods unaffectedthey are not taxed. Because the tax is
separable from a commodity's price, wage increases due to price inflationare lessened. The price increase is seen only as a specific payment to thegovernment.
Also, the number of taxpayers the government deals with is muchlarger than the number of taxpayers at the pre-retail level. Related to thisdisadvantage is a potentially severe administrative problem in developingcountries. Where most retailers are small owners or peddlers, bookkeepingis often impossibleclue to lack, of personnel or to lack of sufficient educa-tion. Family businesses often do not keep separate accounts for businessand family finances. If retail sales taxes have different rates for different
41
5 1
goods, the small retailer must differentiate these rates, complicating hisalready burdensome bookkeeping.
One way to solve these administration problems in developing coun-tries would be exempting the smaller retailer, taxing only the larger opera-tions. The cut-off line would by necessity be arbitrary. Further, the revenuelost by exempting what might be a large number of retailers could besignificant in developing countries. This selective application might alsocause larger retail firms to subdivide`to avoid taxation.
The Value-Added Tax (VAT) A multi-level application of a tax, the VATis a flat percentage levy paid on the value added to a product or a serviceat each stage of production and distribution. It is applied (and itemizedon the invoice) at each point of sale (except final sale), where the valuehas increased. Each processor collects a tax on his total sales. He iscredited for all taxes paid on purchases from other VAT-paying firms. Thedifference between these two figures is paid to the government, as his
value-added tax.For example, production of a bolt of cloth involves a spinner, a dyer,
a weaver, and a retailer. If a VAT of ten per cent is imposed, the distributionis as follows: If the spinner charges ten cents for his goods, he is taxed onecent on his value added to the raw materials, so he charges the dyer 11cents. The dyer adds ten cents of value to the item. His total cost is 21cents (11 paid to the spinner, plus one cent tax for his ten cents valueadded); so he charges the weaver 22 cents. The dyer is credited one centfor the VAT paid on the spun yarn, so he pays only one centfor his valueadded. The weaver charges 33 cents for his bolt of cloth; he is creditedfor two cents of VAT and pays one cent to the government. The retailercharges the customer 44 cents and is credited for three cents, paying thegovernment one cent. The amount paid in VAT is four cents, but it is
collected in less visible installments than a retail sales tax. The VAT ispassed on in the production-distribution process until the consumer whobuys the finished goods pays all of it. But this is not really apparent inthe final price of 44 cents because the accumulated taxes are hidden withinit.
All such taxes, either in use or being seriously considered, involve thetax deduction approach to calculating liability: each firm subtracts thetax it pays on purchases at the end of a set time period from its taxablesales. The total base of the tax is the same as a retail sales tax. The retailselling price equals the sum of values added at all steps in productionand distribution. What is new about the VAT is that the impact of paymentis spread through the economy.
42
62
With a VAT payable at all stages in the production and distribution ofa good or service, the theoretical base of the tax is potentially as large asa country's gross national product. Because it has such a base, the VATcan raise large revenues through relatively low rates. The cost of providingbenefits from government service is spread through both the entire decisionprocess and the production- distribution- and consumption chain. This isa principle of taxation that is new to many countries. Taxation is nottypically viewed as a necessary cost of production "wherever productiontakes place and whatever is produced." Therefore, a discussion of thephilosophy behind value-added taxation is important to evaluate its merits.
Types of VAT
In a simple, closed economy with two productive factors (labor andcapital), there are three major types of VAT:
A "gross product" VAT, without allowances for capital purchases ordepreciation. This is equivalent to a uniform general sales tax on all finalgoods and services (GNP). Any additions to inventory are counted as apositive final good.
An "income" VAT, where depreciation is deducted from the tax-base.This is equivalent to a proportional tax on total factor income, minusdepreciation. Any deletions from inventory stocks are counted as anegative final good.
A "consumption" VAT, that allows immediate deduction of all amountsof VAT that a firm has paid on purchased supplies. This is equivalent toa general tax on final consumption goods only.
The most popular VAT is the third. All West European users set itsbase equivalent to familiar sales taxes on manufacture, wholesale, andretail levels. The most common base used is the retail. For this reason,
when the VAT is referred to as a basically retail sales tax, this means it isof "consumption" variety. This does not represent a tax at every stageof production, but it may be applied to all stages.
Strengths and Weaknesses of the VAT
These involve seven basic issues to be discussed here: neutrality,revenue raising power, inflation, equity, Central Government power, ad-
ministrative facility, and feasibility.
Neutrality of the VATThe most basic claim for this tax is that it distorts economic decision-
making the least. It is therefore considered as an alternative to those forms
43
of taxes that do cause distortions in investment decisions, pricing policies,and competitive positions. Its neutralityin not favoring one factor, goodor service over anotheris the VAT's strong point.
Under a VAT system (of the consumption type), an industry's tax liabil-ity is unaffected by the production process. No penalties or rewards forusing one type of factor over another occur. A VAT does not encourage"cost padding" or discourage cost reductionsa firm's VAT liability is
determined entirely by factors external to production-method decisions.Every dollar gained from internal cost reduction is reflected in a firm'safter-tax profits, which should encourage improvements for efficiency. Also,the tax is neutral towards the choice of debt or equity financing.
But its neutrality has been challenged. As used in Europe (often citedas a model for other countries), the tax is not neutral. It favors capital-intensive processes by exempting capital goods. But deducting depreciationis a disadvantage in developing countries where industry is mostly labor-intensive, directly increasing the cost of employment. To avoid a compara-tively higher tax burden, such firms may discourage employment or maylower wagessteps obviously harmful to a developing country's economy.
As a replacement for corporate income taxes, the VAT may producegreater revenue stability. But because corporate profits reflect fluctuationsin economic activity, a high tax rate makes an intensive application of thistax-base a major factor in fiscal instability. Revenue from the VAT systemfluctuates less than present corporate taxing schemes and, in most develop-ing countries, it may contribute to fostering stabilization in fiscal revenues.
The VAT may also stabilize consumption expenditures more than thepersonal income tax. Consumption expenditures can be specifically re-duced by a smaller increase of the VAT rates than by personal income taxrates. Such a broad-based tax as the VAT seems to regulate demand moreeffectively than the more narrow-based excise taxes. But this does notnecessarily prove to be true. Direct taxes are better manipulated for de-mand management purposes and probably have less effect on the cost ofliving than indirect taxes, such as the VAT. When indirect taxes are raisedto offset a budget deficit, prices go upwhich eventually causes labor toincrease wage demands.
If we define neutrality as the lack of any distortion towards privateeconomic activity, it is obviously quite difficult to demonstrate theneutrality of the VAT (or any other type of tax). Perhaps all that can be saidabout the neutrality of a VAT is that its primary effects appear to be lessdistorting than a corporate income tax, but that its secondary effects aredifficult to ascertain.
44
54
Revenue Raising PowerThe VAT is claimed to have great revenue raising power. It imposes
relatively low rates over the entire economic process instead of concen-trating on specified groups. For countries that are members of a commonmarket, the economic base becomes -) broader. The yield of the salestax on each commodity is automatically distributed, based on the valueadded in each country (when no rebate on exports within the commonmarket exists). Much of the VAT benefits occur in the international sectorbecause the tax can put foreign produced goods on the same tax-base asthose produced domestically.
In developing countries, leakages reduce the revenue collected and,consequently, limit the effectiveness of the VAT. Because in most VATplans farmers or artisans are not taxed, loss of VAT revenue occurs whena product goes directly from artisan to small retailer. This kiss of revenuecan be substantial when too many members of the economic process areexempted from the tax. Even worse, the tax may be shifted onto taxedproducts using materials produced by exempted firms. There are alsoproblems with service industries. If they are exempted, the VAT base isnarrowed and becomes less effective. If they are not exempted, multipleapplication of the tax may cause economic 'distortions. Only those servicesused in the production process should be taxed.
The VAT and InflationThe VAT opponents also argue that any of its power to raise revenue
is Iost through its inflationary tendencies. In countries with inflation, theysay, the VAT causes prices to riseprobably higher than the tax. Few
dispute this fact. A general tax with a base dependent on transactions isdemonstrably shifted forward in higher prices. A selective tax is assumedto cause prices of untaxed products to fall, while those of taxed ones torise. The extent of a selective tax, therefore, determines whether thegeneral price level will rise or remain about constant.
In an attempt to counter this assertion that prices inevitably rise withsuch a tax, idealistic proponents point out that if a VAT replaces existingtaxessuch as the income taxcorporate prices may decline. They claim,perhaps rightly, that a VAT's impact on prices will strictly be a function ofthe taxes it replaces.
But the main reason for considering the VAT in some countries is theadditional revenue needed, particularly to aid public education throughthe Central Government. It is not meant to revamp existing tax plans.Given this need, it is most unlikely that the VAT will replace any existing
45
55
tax method, at least initially. But, because a price rise results,from the intro-duction of a new'tax, VAT proponents do not have a strong argument.
Yet within presumed price increases, consumers, at least under presentcircumstances, could probably not distinguish between the portion of anincrease caused by the tax and the portion due to general inflationarypressures. The concealment of a VAT in retail purchases may be the savingcharacteristic. But, besides the basic rise in prices caused by the tax, asecondary price rise may occur when labor attempts to recoup its loss inreal income by demanding wage increases. Any relief to special groups,such as property owners, might thus be lost"ina new round of inflation.
Equity of the VATThe VAT is most frequently criticized as being only a national retail
sales tax which, because it is regressive, would hurt the poor most. Thosewho do not deny its regressivity point out the advantages in hurting theaffluent less because these classes save, invest, and innovate. This non-egalitarian approach is usually tempered by the assertion that the tax'sregressive force would be mitigated by rebates to lower income house-holds. The VAT is undoubtedly unsuited for income redistribution andthis goal must be left to other taxes and government policies. The VATdoes not attempt to create any particular patterns of income distribution.The present controversy involves only a reasonable equitability in the tax.It is generally agreed that VAT's do generate extensive revenue.
Political Effects of the VAT
As presently conceived, the VAT is imposed by the Central Govern-ment, and its revenue accrues to the Central Government. In developingcountries, whose educational expenditures are centrally controlled, thistax does not change government power relationships and it increases
resources for educational needs. It probably strengthens governmentcontrol over educational expenditure needs. But where education has beena local responsibility, this tax may disturb the power relationships amonglevels of government. The fear of usurping local autonomy is often greaterthan the incessant cry for relief of local fiscal distresses.
Administrative Facility of the VATThe VAT has two related administrative advantages: a built-in pressure
for compliance; and a related defense against pressures for exemptionstatus.
Collecting a substantial proportion of a selling price through a single
46
.'56
stage tax, such as a general retail sales tax, creates evasion problems whichthe VAT avoids. A'seller's failure to pay the VAT increases the VAT liabilityof the purchaser of a gbod or service. Purchasers, thus, have a strongvested interest to insist that sellers record their VAT amounts in full. This
is true simply because, according to laws in effect in Western Europe, onlythe VAT amounts written on sales invoices from purchases are deductible
from the VAT liabilites arising from sales. Fraud is possible, but is probablyless likely with the VAT than with many other major taxes. When tax paidby one firm is reported as a deduction by the firm that buys from them,cross-auditing can easily disclose evasion. In addition, evasion is minimizedbecause a large portion of the tax is collected prior to the retail stage. If
retailers evade, taxes will be lost only for this level.
The VAT has an administrative advantage in developing countries.Such taxes have received far greater compliance than direct taxes for gen-
eral purposes in countries where taxpayers are not confident of thegovernment's stability.
European legislation also indicates that the VAT has an inherent de-fense against demands for special treatment. Firms in a non-VAT-taxedindustry would not receive refunds of the VAT amounts included in theirpurchases. Firms taxed according to the VAT would receive no credit ontheir VAT liability when purchasing from non-VAT-paying suppliers. Thesetwo elements have caused the VAT base to expand, not contracta highly
desirable phenomenon because a broad base requires lower rates to raisea specified amount of revenue than does a narrower one.
The VAT has also some administrative disadvantages. Evasion is mini-mized but is by no means eliminated. The VAT is inherently harder toadminister by both the, collector and the assessed. The collector (theCentral Government) must deal with many more firms than it would for
a single-stage tax. This necessitates developing and administering com-petent bureaus to enforce and tabulate the tax.
The VAT requires of the small firm and street vendor in developing
nations more extensive bookkeeping than beforeif they have kept any
records at all. There is also the problem of literacy. The small firm owners
or street vendors must understand the workings of the tax (at least at itsmost simplified level) and must be able to do the necessary paper work.It is, therefore, proposed that vendors and firms with small monthly sales
and inadequate education be exempt because poor record-keeping would
render effective control impossible. But there are problems here. The
dividing line between those firms that must register and those that do not
is arbitrary, even with careful study. Firms must also be prevented from
47
7

subdividing to escape taxation. In addition, sale of goods to street vendorsmay be considered retail, rather than wholesale, and revenue will be lostin these transactions. Loss of tax on the street vendor's marginal increaseof value on his sales can be justified as social equity.
Feasibility of the VAT for Developing Countries
A VAT system undoubtedly has advantages for both developed andless developed nations. At the present time, the most attractive one is itsenormous potential for raising revenue. But much of its merit depends onits ability to minimize inefficiencies and distortions in economic decision-making, and on its ability to tax a country's broad economic base.
Evidence of these effects, particularly for developing countries, is notdefinitive. Most developing countries tend to be labor-intensive, and theVAT tends to favor the introduction of capital-intensive methods. Theexclusion of farmers and artisans can narrow the tax-base beyond effective-ness. Administrative problems for the small firm and street vendor makethe application of the tax difficult. The theoretical merit of the tax hasmany practical drawbacks.
These advantages of the VAT that seem soundly substantiated aremostly political. Much of the support for the tax may largely be due tothe fact that it simply possesses a new name and is, thus, politically moreacceptable than a modification of an established plan. Thus, the con-troversy seems restricted to discussions of giving a Central Governmentan additional revenue source, regardless of its merits judged by traditionalstandards of equity and efficiency. Perhaps, the VAT is a tax that is'the"lesser" of many evils.
SUMMARY
Property and sales taxes are major government sources of revenue foreducation. These taxes should be evaluated for their adequacy, stability,,.;:-.-nyth-potential, administrative ease, impact, incidence, and neutrality.
Both property and sales taxes have the capacity to provide adequaterevenue for an educational system, if the tax rates are sufficiently high.Property taxes tend to respond to fluctuations of the business cycle morethan sales taxes, but both can provide a fairly stable yield. Growth ofrevenue depends more on the growth of the tax-base than on the tax rate,but both tax-bases are directly related to income.
The impacts of both property and sales taxes are most often shiftedforward to the consumer. But in the case of property taxation, rent controlcan lessen this shift. The retail sales tax is seldom shifted backward to the
48
manufacturer. The VAT has an important advantage over other sales taxesby making each member of the production-consumption chain share theimpact of the tax.
In theory, the incidence of these taxes is proportional. But, in practice,they are all regressive. The poorer consumer and the smaller producercarry a greater burden of these taxes.
Property and sales taxes are not neutral. Property taxes particularlydiscourage the construction and improvement of housing. Both the turn-over tax and the single-stage pre-retail tax encourage modifications of acountry's production patterns. Retail sales taxes and the VAT appear to
be the least distorting.From an administrative viewpoint, property taxes require fairly
elaborate administration; avoidance is fairly difficult; and administrationappears easier in urban areas than in rural ones. Avoidance of sales taxes,except the VAT, is fairly easy. With the VAT, cross-checking is easy, andtax avoidance more difficult. The bookkeeping of the VAT, however,becomes more complex than that of other sales taxes and is a serious
drawback for developing countries.No tax is perfect and no tax alone meets all the needs of a country.
Careful consideration should be given to the effects of a particular tax,evaluated according to the criteria discussed above.
49
5'9
CHAPTER IV
Elementary and SecondaryEducation:
Public and Private Funding
METHODS of public financing of education sometimes vary with thegovernment structure of the country. Highly centralized governments
tend to use full central funding. Regional and local funding is more com-mon in government systems where states and localities have the power toimpose taxes.
This chapter describes the different modes of public financing ofeducation and the vehicles for distributing funds.
When regions and localities partially finance their educational systems,the capability of raising resources varies according to the local tax-base.Inequities of tax burdens are unavoidable if a satisfactory level of expen-ditures for education is to be provided. Central Authorities can mitigatethese inequities in the tax burden by distributing funds in ways that equalizethese burdens as much as possible.
This chapter describes and analyzes different methods for distributingfunds from the viewpoint of equity of the tax burden. Most of thesemethods are being used only in th.? United States, but the basic conceptsare transferable to other countries with federal systems of government.
Selected representative examples from developing countries are
presented to give a current overview of the following: public financing ofelementary and secondary education in developing countries, methods ofdistribution of funds, and types of aid from Central Government to regionaland local governments.
In addition to government funding, there has always been privatefunding of education. This chapter also discusses private funding by families,business corporations, voluntary agencies, and collectives.
PUBLIC FUNDING
An educational system can be fully supported by a single level ofgovernmentcentral, regional, or local--or by a combination of theselevels.
50
6 O.
Full Central Funding A highly centralized government may use fullcentral funding to maintain considerable control, both legal and financial.Such a government can also use full central funding and yet not impingeupon regional autonomy. Central Authorities allocate funds to regions forspending as the regions decide. The Central Authorities generate all educa-tional revenues but exercise control only in determining the total regionaleducational budget.
Recently in some Latin American countries, full central funding hasstrengthened national unity without creating a highly centralized system,by subdividing the country into regional educational authorities which haveno relation to the country's political subdivisions. Regional educational
authorities can thus attack their own particular problemsliteracy, tribal,or linguisticthat affect education, Without-being hampered by political
constraints.
Full Regional Funding Regional authorities may themselves generate alleducational revenues. Like Central Authorities, they can either control allactual expenditures, share them with local authorities, or simply determinethe local educational budgets and allow local authorities complete au-tonomy in spending.
Potentially, full central or regional funding can make a more equitabledistribution of educational resources than full local funding. The localeducational budget would not depend on local fiscal capacity or wealth,but rather on the fiscal or tax-base of the entire country or region. How-ever, there is the danger that when the Central or regional authoritiestightly control all spending, bureaucratic delay and confusion, as well as un-responsiveness to specific local needs, may become prevalent.
A political commitment to full central and/or regional funding mayalso cause financial constraints when there is general educational expan-sion. This creates pressures to curtail expansion and reduces quality byspreading resources too thin. For this reason, advantages and disadvantagesof additional funding from local and private sources should be carefully
considered.
Full Local Funding. This is possible when local authorities have widetaxing authority and a sufficient fiscal base to fund local educational needsgenerally unlikely in developing countries. Potentially, full local fund-ing could satisfy specific local needs, but it may lack economies of scale
for supportive programs, such as curriculum development.
Local fiscal capacity, even in wealthy countries, usually varies consid-erably from one area to another. Rich areas inevitably have excellent
51
61
schools and poor ones may not even have minimally adequate ones.Where full local funding poses inequities, the possibility of some partiallocal funding should be considered, supplemented by government funds.
Combinations of Central, Regional, and Local Funding Possible com-binations of public funding of education include: central and regional;central and local; regional and local; or a mixture of the three. In a com-bined funding plan, each government level might fund certain segmentsof the educational system. Central sources might fund capital costs; andlower level sources, recurrent costs. Alternatively, educational revenuegenerated at two or three levels might go into a general fund for redistribu-tion to educational spending units by either Central or regional authorities.
Vehicles for the Distribution of Public Funds
There are three major vehicles of distributing public funds: generalgrants, categorical grants, and aid in the form of goods and services.
General Grants Such grants made from a tax collecting authority to aspending authority may be used for any educational purl ose. They may beexpected to cover all recurrent expenses of educational institutions, or tosupplement local funds from various public and private sources.
Categorical Grants These may be spent only for some specific educa-tional purposeexperimental programs, special subjects, teachers' salaries,materials, maintenance, transportation, etc. Categorical grants may alsooffer special aid to selected types of schools, such as vocational, normal,or rural boarding schools. Selected local areas with problems specificallyrelated to education, such as high concentration's of poverty or sparse ornomadic populations, may receive such grants to solve their problems.When categorical grants are given to selected types of institutions, or tolocal educational authorities in particular areas, the distinction betweengeneral and categorical grants blurs. These types of grants may be tied tospecial programs or purposes, or may be awarded as genera,' aid. Categori-cal grants generally introduce rigidity and bias into decision-making becausethey channel expenditures to specific categories. But they do provide adegree of control for higher authorities that may be necessary when de-cision-making at the regional or local level has been highly inefficient.
Many developing countries use categorical grants extensively. But
local bottlenecks and inefficiencies of a system of tight categorical grantshave caused educational planners and economists to dislike them and tofavor general grants. Financial authorities who wish to control aspects ofeducational programs' actual provision are urged to use administrative
52
62
and/or legal regulations, rather than the rigid financial regulations of a com-plex structure of categorical grants. Financial authorities need not abandoncategorical grants altogether. But the advantages and disadvantages of cate-gorical grants for a particular country should be examined and the replace-ment of some or most of them by general grants should be stronglyconsidered.
Aid in Kind This type of aid refers to providing staff, special services,or materials to local schools or their administrations. Aid in kind includes:the central provision and financing of health personnel, supplies to localschools, provision of special kinds of teacherssuch as agricultural special-ists--and textbooks or library facilities.
Equity in the Distribution of Funds from Central toLower Level Governmental Units
A country with a federal system of government has substantial taxrevenues generated not only by the Central Government but also by re-gions and/or localities. Educational revenues may be generated by morethan one governmental level. Generally, each level is authorized to usedifferent tax-bases for revenue, although two levels might use the samebase, such as income. Various tax-bases of the Central Government coverthe entire country. A regi-rial or local government can only derive revenuefrom those tax-bases authorized in its own area. Sometimes these tax-basescan only be taxed at a minimum rate, thus limiting regional or local fiscalcapacity.
In almost all countries, the value of regional and local tax-bases variesconsiderably from one area to the next. When local governments or schooldistricts apply the same tax rate, those areas with a large tax-base willgenerate a much greater absolute amount of educational revenue thanpoor areas with a small tax-base. If regional or local taxing authorities mustapply widely differing tax rates to their individual tax-bases to generate anequal amount of revenue, then the tax burdens in different areas will begrossly unequal.
A primary reliance on local taxation for school support always leadsto wide disparities in local tax burdens, and also in the revenue per pupil
that local authorities can generate. A greater equalization of the burdenof support would result if the amount of revenue generated were a functionof the total national income and wealth, that is, of the total tax-bases
available in the entire country.This does not mean that local or regional taxing authorities have no
part in generating revenues. If the tax-bases available to local or regional
53
6 3,
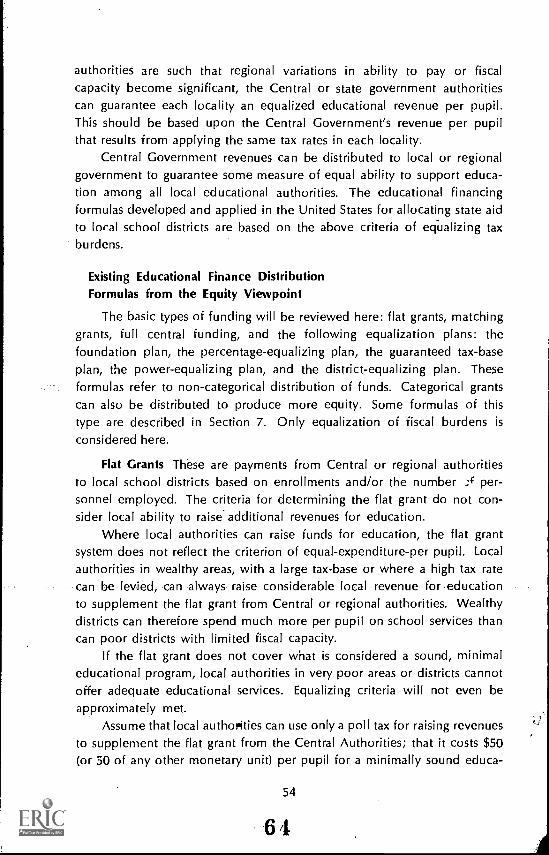
authorities are such that regional variations in ability to pay or fiscalcapacity become significant, the Central or state government authoritiescan guarantee each locality an equalized educational revenue per pupil.This should be based upon the Central Government's revenue per pupilthat results from applying the same tax rates in each locality.
Central Government revenues can be distributed to local or regionalgovernment to guarantee some measure of equal ability to support educa-tion among all local educational authorities. The educational financingformulas developed and applied in the United States for allocating state aidto local school districts are based on the above criteria of equalizing taxburdens.
Existing Educational Finance DistributionFormulas from the Equity Viewpoint
The basic types of funding will be reviewed here: flat grants, matchinggrants, full central funding, and the following equalization plans: thefoundation plan, the percentage-equalizing plan, the guaranteed tax-baseplan, the power-equalizing plan, and the district-equalizing plan. Theseformulas refer to non-categorical distribution of funds. Categorical grantscan also be distributed to produce more equity. Some formulas of thistype are described in Section 7. Only equalization of fiscal burdens isconsidered here.
Flat Grants These are payments from Central or regional authoritiesto local school districts based on enrollments and/or the number per-
sonnel employed. The criteria for determining the flat grant do not con-sider local ability to raise. additional revenues for education.
Where local authorities can raise funds for education, the flat grantsystem does not reflect the criterion of equal-expenditure-per pupil. Local
authorities in wealthy areas, with a large tax-base or where a high tax ratecan be levied, can always raise considerable local revenue for educationto supplement the flat grant from Central or regional authorities. Wealthydistricts can therefore spend much more per pupil on school services thancan poor districts with limited fiscal capacity.
If the flat grant does not cover what is considered a sound, minimaleducational program, local authorities in very poor areas or districts cannotoffer adequate educational services. Equalizing criteria will not even beapproximately met.
Assume that local authorities can use only a poll tax for raising revenuesto supplement the flat grant from the Central Authorities; that it costs $50(or 50 of any other monetary unit) per pupil for a minimally sound educa-
54
6 4
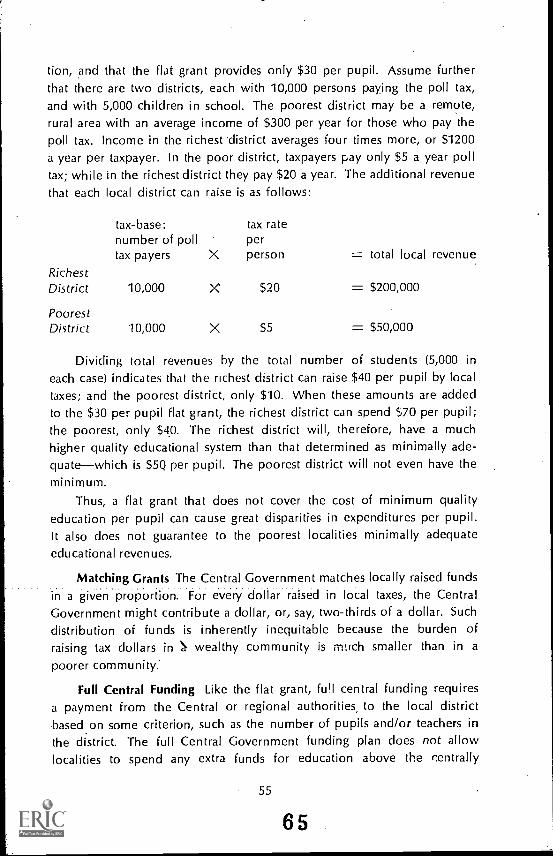
tion, and that the flat grant provides only $30 per pupil. Assume furtherthat there are two districts, each with 10,000 persons paying the poll tax,and with 5,000 children in school. The poorest district may be a remote,rural area with an average income of $300 per year for those who pay thepoll tax. Income in the richest 'district averages four times more, or $1200a year per taxpayer. In the poor district, taxpayers pay only $5 a year polltax; while in the richest district they pay $20 a year. The additional revenuethat each local district can raise is as follows:
tax-base:number of poll
tax rateper
tax payers X person = total local revenueRichestDistrict 10,000 X $20 = $200,000
PoorestDistrict 10,000 X $5 = $50,000
Dividing total revenues by the total number of students (5,000 ineach case) indicates that the richest district can raise $40 per pupil by localtaxes; and the poorest district, only $10. When these amounts are addedto the $30 per pupil flat grant, the richest district can spend $70 per pupil;the poorest, only $40. The richest district will, therefore, have a muchhigher quality educational system than that determined as minimally ade-quatewhich is $5Q per pupil. The poorest district will riot even have theminimum.
Thus, a flat grant that does not cover the cost of minimum qualityeducation per pupil can cause great disparities in expenditures per pupil.It also does not guarantee to the poorest localities minimally adequateeducational revenues.
Matching Grants The Central Government matches locally raised fundsin a given proportion. For every dollar raised in local taxes, the CentralGovernment might contribute a dollar, or, say, two-thirds of a dollar. Suchdistribution of funds is inherently inequitable because the burden ofraising tax dollars in wealthy community is mach smaller than in a
poorer community.
Full Central Funding Like the flat grant, full central funding requiresa payment from the Central or regional authorities, to the local districtbased on some criterion, such as the number of pupils and/or teachers inthe district. The full Central Government funding plan does not allowlocalities to spend any extra funds for education above the centrally
55
65
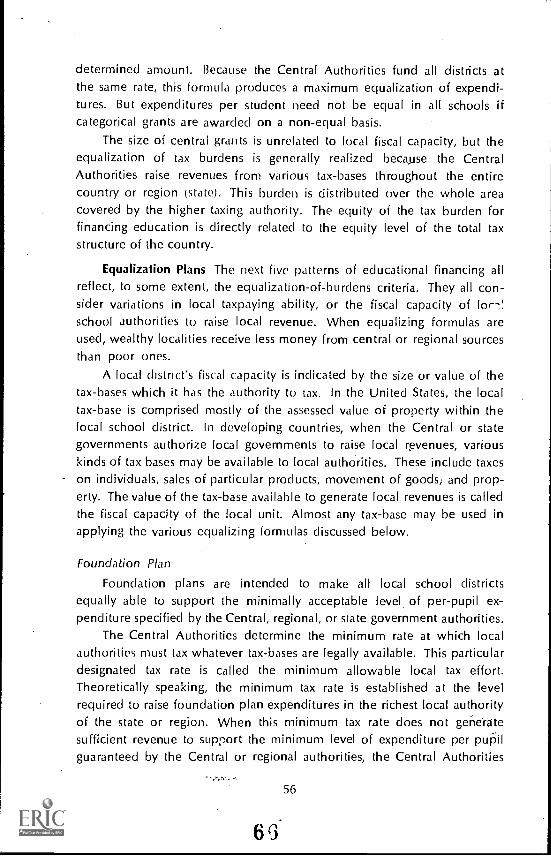
determined amount. Because the Central Authorities fund all districts atthe same rate, this formula produces a maximum equalization of expendi-tures. But expenditures per student need not be equal in all schools ifcategorical grants are awarded on a non-equal basis.
The size of central grants is unrelated to local fiscal capacity, but theequalization of tax burdens is generally realized because the CentralAuthorities raise revenues from various tax-bases throughout the entirecountry or region (state). This burden is distributed over the whole areacovered by the higher taxing authority. The equity of the tax burden forfinancing education is directly related to the equity level of the total taxstructure of the country.
Equalization Plans The next five patterns of educational financing allreflect, to some extent, the equalization-of-burdens criteria. They all con-sider variations in local taxpaying ability, or the fiscal capacity of lor7!school authorities to raise local revenue. When equalizing formulas areused, wealthy localities receive less money from central or regional sourcesthan poor ones.
A local district's fiscal capacity is indicated by the size or value of thetax-bases which it has the authority to tax. In the United States, the localtax-base is comprised mostly of the assessed value of property within thelocal school district. In developing countries, when the Central or stategovernments authorize local governments to raise local revenues, variouskinds of tax bases may be available to local authorities. These include taxeson individuals, sales of particular products, movement of goods; and prop-erty. The value of the tax-base available to generate local revenues is calledthe fiscal capacity of the local unit. Almost any tax-base may be used inapplying the various equalizing formulas discussed below.
Foundation Plan
Foundation plans are intended to make all local school districtsequally able to support the minimally acceptable level of per-pupil ex-penditure specified by the Central, regional, or state government authorities.
The Central Authorities determine the minimum rate at which localauthorities must tax whatever tax-bases are legally available. This particulardesignated tax rate is called the minimum allowable local tax effort.Theoretically speaking, the minimum tax rate is established at the levelrequired to raise foundation plan expenditures in the richest local authorityof the state or region. When this minimum tax rate does not generatesufficient revenue to support the minimum level of expenditure per pupilguaranteed by the Central or regional authorities, the Central Authorities
56
63
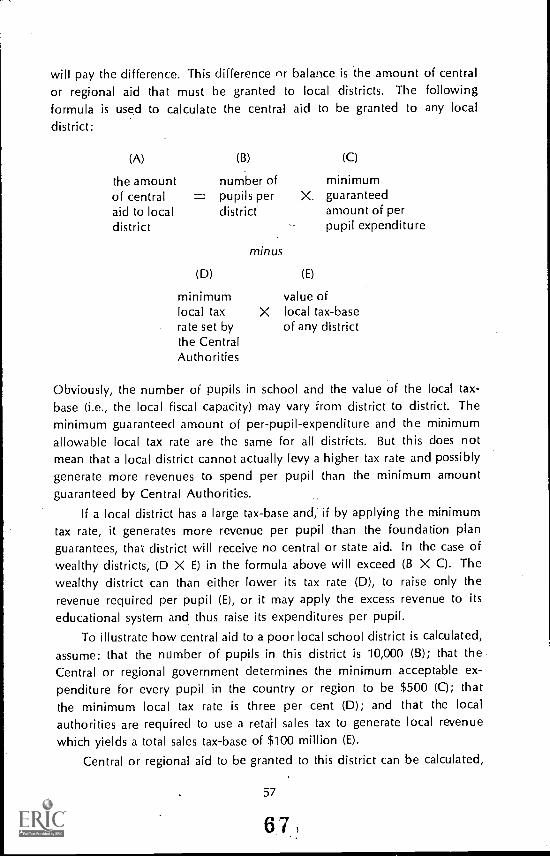
will pay the difference. This difference n r balance is the amount of centralor regional aid that must be granted to local districts. The followingformula is used to calculate the central aid to be granted to any localdistrict:
(A) (B) (C)
the amount number of minimumof central = pupils per X. guaranteedaid to local district amount of perdistrict pupil expenditure
minus
(D) (E)
minimum value oflocal tax X local tax-baserate set by of any districtthe CentralAuthorities
Obviously, the number of pupils in school and the value of the local tax-base (i.e., the local fiscal capacity) may vary from district to district. Theminimum guaranteed amount of per-pupil-expenditure and the minimumallowable local tax rate are the same for all districts. But this does notmean that a local district cannot actually levy a higher tax rate and possiblygenerate more revenues to spend per pupil than the minimum amountguaranteed by Central Authorities.
If a local district has a large tax-base and, if by applying the minimumtax rate, it generates more revenue per pupil than the foundation planguarantees, that district will receive no central or state aid. In the case ofwealthy districts, (D X E) in the formula above will exceed (B X C). Thewealthy district can than either lower its tax rate (D), to raise only therevenue required per pupil (E), or it may apply the excess revenue to itseducational system and thus raise its expenditures per pupil.
To illustrate how central aid to a poor local school district is calculated,assume: that the number of pupils in this district is 10,000 (B); that the
Central or regional government determines the minimum acceptable ex-penditure for every pupil in the country or region to be $500 (C); thatthe minimum local tax rate is three per cent (D); and that the localauthorities are required to use a retail sales tax to generate local revenuewhich yields a total sales tax-base of $100 million (E).
Central or regional aid to be granted to this district can be calculated,
57
6.7
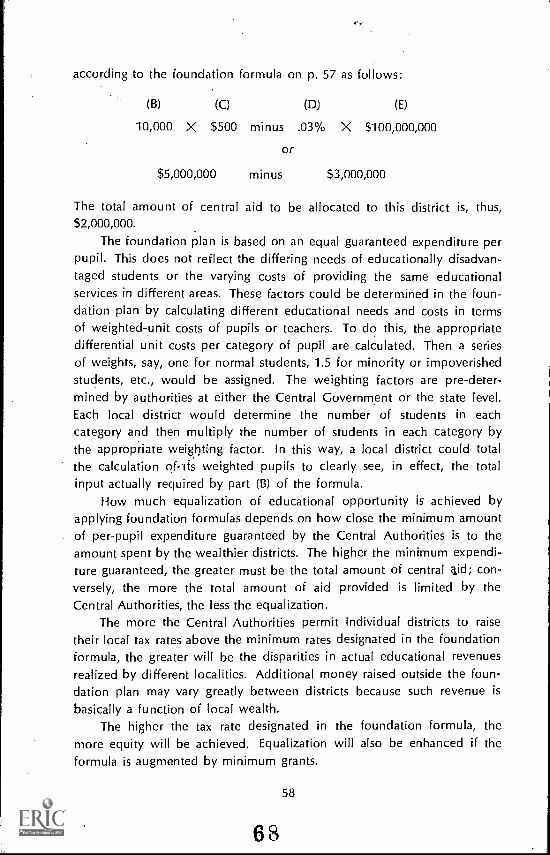
according to the foundation formula on p. 57 as follows:
(B) (C) (D) (E)
10,000 X $500 minus .03% X $100,000,000
or
$5,000,000 minus $3,000,000
The total amount of central aid to be allocated to this district is, thus,$2,000,000.
The foundation plan is based on an equal guaranteed expenditure perpupil. This does not reflect the differing needs of educationally disadvan-taged students or the varying costs of providing the same educationalservices in different areas. These factors could be determined in the foun-dation plan by calculating different educational needs and costs in termsof weighted-unit costs of pupils or teachers. To do this, the appropriatedifferential unit costs per category of pupil are calculated. Then a seriesof weights, say, one for normal students, 1.5 for minority or impoverishedstudents, etc., would be assigned. The weighting factors are pre-deter-mined by authorities, at either the Central Government or the state level.Each local district would determine the number of students in each
category and then multiply the number of students in each category bythe appropriate weighting factor. In this way, a local district could totalthe calculation of -'its weighted pupils to clearly see, in effect, the totalinput actually required by part (B) of the formula.
How much equalization of educational opportunity is achieved byapplying foundation formulas depends on how close the minimum amountof per-pupil expenditure guaranteed by the Central Authorities is to theamount spent by the wealthier districts. The higher the minimum expendi-ture guaranteed, the greater must be the total amount of central ,id; con-
versely, the more the total amount of aid provided is limited by theCentral Authorities, the less the equalization.
The more the Central Authorities permit individual districts to raisetheir local tax rates above the minimum rates designated in the foundationformula, the greater will be the disparities in actual educational revenuesrealized by different localities. Additional money raised outside the foun-dation plan may vary greatly between districts because such revenue isbasically a function of local wealth.
The higher the tax rate designated in the foundation formula, themore equity will be achieved. Equalization will also be enhanced if theformula is augmented by minimum grants.
58
68
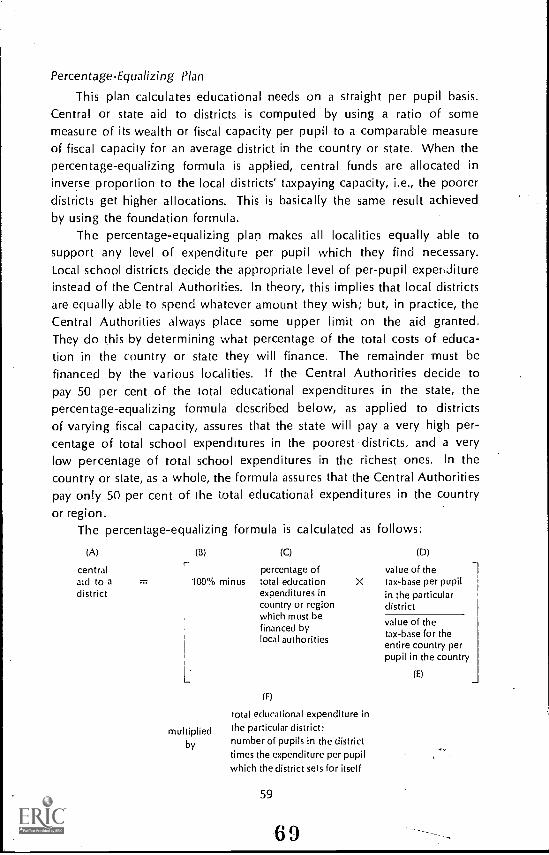
Percentage-Equalizing Plan
This plan calculates educational needs on a straight per pupil basis.Central or state aid to districts is computed by using a ratio of somemeasure of its wealth or fiscal capacity per pupil to a comparable measureof fiscal capacity for an average district in the country or state. When thepercentage-equalizing formula is applied, central funds are allocated ininverse proportion to the local districts' taxpaying capacity, i.e., the poorerdistricts get higher allocations. This is basically the same result achievedby using the foundation formula.
The percentage-equalizing plan makes all localities equally able tosupport any level of expenditure per pupil which they find necessary.Local school districts decide the appropriate level of per-pupil experditureinstead of the Central Authorities. In theory, this implies that local districtsare equally able to spend whatever amount they wish; but, in practice, theCentral Authorities always place some upper limit on the aid granted.They do this by determining what percentage of the total costs of educa-tion in the country or state they will finance. The remainder must befinanced by the various localities. If the Central Authorities decide topay 50 per cent of the total educational expenditures in the state, thepercentage-equalizing formula described below, as applied to districtsof varying fiscal capacity, assures that the state will pay a very high per-centage of total school expenditures in the poorest districts, and a verylow percentage of total school expenditures in the richest ones. In thecountry or state, as a whole, the formula assures that the Central Authoritiespay only 50 per cent of the total educational expenditures in the countryor region.
The percentage-equalizing formula is calculated as follows:
(A) (B) (C) (D)
central r percentage of value of theaid to a = 100% minus total education X tax-base per pupildistrict expenditures in in the particular
country or region district
multipliedby
which must befinanced bylocal authorities
(F)
total educational expenditure inthe particular district:number of pupils in the districttimes the expenditure per pupilwhich the district sets for itself
59
69
value of thetax-base for theentire country perpupil in the country
(E)
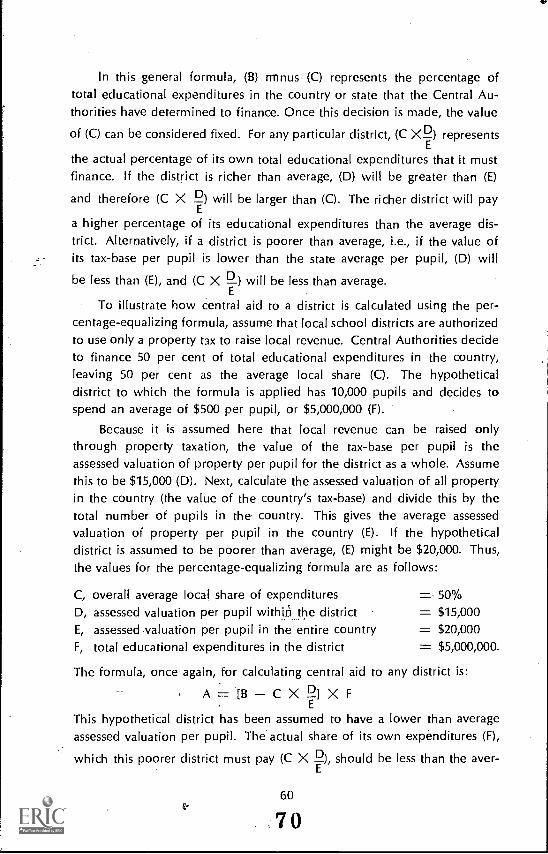
In this general formula, (B) tmnus (C) represents the percentage oftotal educational expenditures in the country or state that the Central Au-thorities have determined to finance. Once this decision is made, the value
of (C) can be considered fixed. For any particular district, (C X) represents
the actual percentage of its own total educational expenditures that it mustfinance. If the district is richer than average, (D) will be greater than (E)
and therefore (C X 2) will be larger than (C). The richer district will pay
a higher percentage of its educational expenditures than the average dis-trict. Alternatively, if a district is poorer than average, i.e., if the value ofits tax-base per pupil is lower than the state average per pupil, (D) will
be less than (E), and (C X -D) will be less than average.
To illustrate how central aid to a district is calculated using the per-centage-equalizing formula, assume that local school districts are authorizedto use only a property tax to raise local revenue. Central Authorities decideto finance 50 per cent of total educational expenditures in the country,leaving 50 per cent as the average local share (C). The hypotheticaldistrict to which the formula is applied has 10,000 pupils and decides tospend an average of $500 per pupil, or $5,000,000 (F).
Because it is assumed here that local revenue can be raised onlythrough property taxation, the value of the tax-base per pupil is theassessed valuation of property per pupil for the district as a whole. Assumethis to be $15,000 (D). Next, calculate the assessed valuation of all propertyin the country (the value of the country's tax-base) and divide this by thetotal number of pupils in the country. This gives the average assessedvaluation of property per pupil in the country (E). If the hypotheticaldistrict is assumed to be poorer than average, (E) might be $20,000. Thus,the values for the percentage-equalizing formula are as follows:
C, overall average local share of expenditures = 50%
D, assessed valuation per pupil within the district =- $15,000
E, assessed valuation per pupil in the entire country = $20,000
F, total educational expenditures in the district = $5,000,000.
The formula, once again, for calculating central aid to any district is:
A = [B C X !.:?.] X F
This hypothetical district has been assumed to have a lower than averageassessed valuation per pupil. The actual share of its own expenditures (F),
which this poorer district must pay (C X 2), should be less than the aver-
60
70
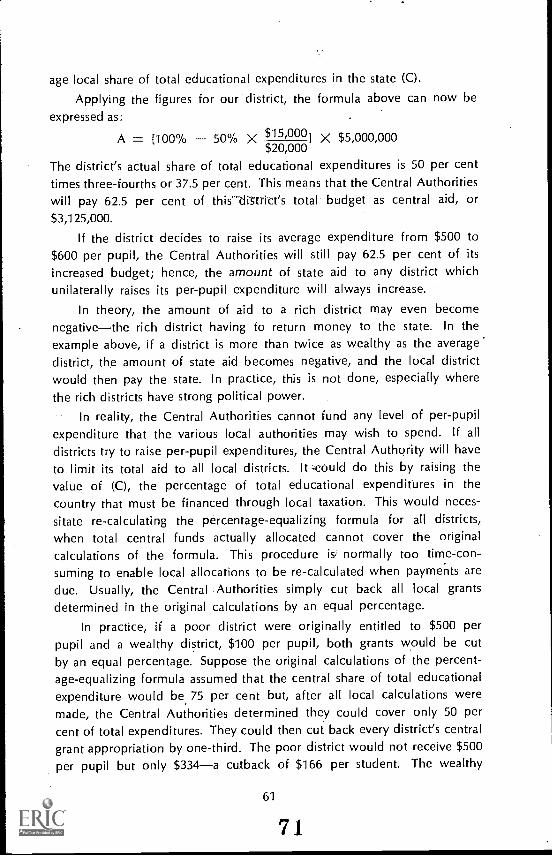
age local share of total educational expenditures in the state (C).
Applying the figures for our district, the formula above can now beexpressed as:
A = [100% 50% X $15 000 X $5,000,000$20,000
The district's actual share of total educational expenditures is 50 per centtimes three-fourths or 37.5 per cent. This means that the Central Authoritieswill pay 62.5 per cent of this' digtrict's total budget as central aid, or$3,125,000.
If the district decides to raise its average expenditure from $500 to$600 per pupil, the Central Authorities will still pay 62.5 per cent of itsincreased budget; hence, the amount of state aid to any district whichunilaterally raises its per-pupil expenditure will always increase.
In theory, the amount of aid to a rich district may even becomenegativethe rich district having to return money to the state. In theexample above, if a district is more than twice as wealthy as the averagedistrict, the amount of state aid becomes negative, and the local districtwould then pay the state. In practice, this is not done, especially wherethe rich districts have strong political power.
In reality, the Central Authorities cannot fund any level of per-pupilexpenditure that the various local authorities may wish to spend. If all
districts try to raise per-pupil expenditures, the Central Authority will haveto limit its total aid to all local districts. It -eould do this by raising thevalue of (C), the percentage of total educational expenditures in the
country that must be financed through local taxation. This would neces-
sitate re-calculating the percentage-equalizing formula for all districts,
when total central funds actually allocated cannot cover the originalcalculations of the formula. This procedure is normally too time-con-suming to enable local allocations to be re-calculated when payments aredue. Usually, the Central Authorities simply cut back all local grants
determined in the original calculations by an equal percentage.
In practice, if a poor district were originally entitled to $500 perpupil and a wealthy district, $100 per pupil, both grants would be cutby an equal percentage. Suppose the original calculations of the percent-age-equalizing formula assumed that the central share of total educationalexpenditure would be 75 per cent but, after all local calculations weremade, the Central Authorities determined they could cover only 50 percent of total expenditures. They could then cut back every district's central
grant appropriation by one-third. The poor district would not receive $500
per pupil but only $334a cutback of $166 per student. The wealthy
61
7 1
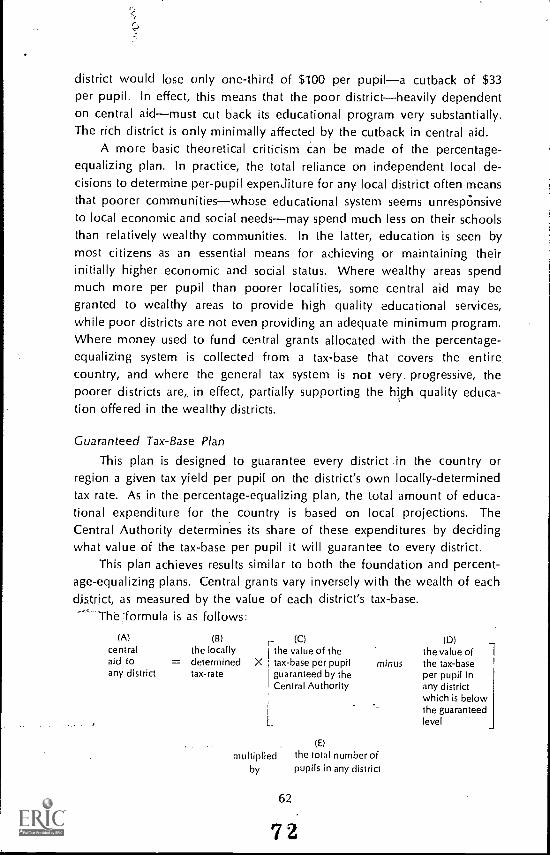
district would lose only one-third of $100 per pupila cutback of $33per pupil. In effect, this means that the poor districtheavily dependenton central aidmust cut back its educational program very substantially.The rich district is only minimally affected by the cutback in central aid.
A more basic theoretical criticism can be made of the percentage-equalizing plan. In practice, the total reliance on independent local de-cisions to determine per-pupil expenditure for any local district often meansthat poorer communitieswhose educational system seems unrespOnsiveto local economic and social needsmay spend much less on their schoolsthan relatively wealthy communities. In the latter, education is seen bymost citizens as an essential means for achieving or maintaining theirinitially higher economic and social status. Where wealthy areas spendmuch more per pupil than poorer localities, some central aid may begranted to wealthy areas to provide high quality educational services,while poor districts are not even providing an adequate minimum program.Where money used to fund central grants allocated with the percentage-equalizing system is collected from a tax-base that covers the entirecountry, and where the general tax system is not very progressive, thepoorer districts are, in effect, partially supporting the high quality educa-tion offered in the wealthy districts.
Guaranteed Tax-Base Plan
This plan is designed to guarantee every district in the country orregion a given tax yield per pupil on the district's own locally-determinedtax rate. As in the percentage-equalizing plan, the total amount of educa-tional expenditure for the country is based on local projections. The
Central Authority determines its share of these expenditures by decidingwhat value of the tax-base per pupil it will guarantee to every district.
This plan achieves results similar to both the foundation and percent-age-equalizing plans. Central grants vary inversely with the wealth of eachdistrict, as measured by the value of each district's tax-base.
The 'formula is as follows:
(A) (B) (C)central the locally the value of theaid to = determined X tax-base per pupilany district tax-rate guaranteed by the
Central Authority
(D)the value of
minus the tax-baseper pupil inany districtwhich is belowthe guaranteedlevel
(E)
multiplied the total number ofby pupils in any district
62
72
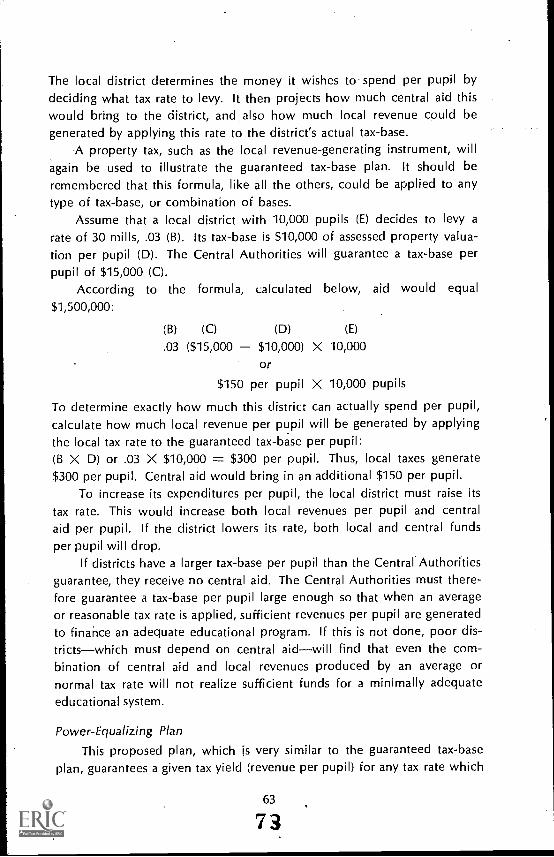
The local district determines the money it wishes to spend per pupil bydeciding what tax rate to levy. It then projects how much central aid thiswould bring to the district, and also how much local revenue could begenerated by applying this rate to the district's actual tax-base.
A property tax, such as the local revenue-generating instrument, willagain be used to illustrate the guaranteed tax-base plan. It should beremembered that this formula, like all the others, could be applied to anytype of tax-base, or combination of bases.
Assume that a local district with 10,000 pupils (E) decides to levy arate of 30 mills, .03 (B). Its tax-base is $10,000 of assessed property valua-tion per pupil (D). The Central Authorities will guarantee a tax-base perpupil of $15,000 (C).
According to the formula, calculated below, aid would equal
$1,500,000:
(B) (C) (D) (E)
.03 ($15,000 $10,000) X 10,000or
$150 per pupil X 10,000 pupils
To determine exactly how much this district can actually spend per pupil,calculate how much local revenue per pupil will be generated by applyingthe local tax rate to the guaranteed tax-base per pupil:(B X D) or .03 X $10,000 = $300 per pupil. Thus, local taxes generate$300 per pupil. Central aid would bring in an additional $150 per pupil.
To increase its expenditures per pupil, the local district must raise itstax rate. This would increase both local revenues per pupil and centralaid per pupil. If the district lowers its rate, both local and central fundsper pupil will drop.
If districts have a larger tax-base per pupil than the Central Authoritiesguarantee, they receive no central aid. The Central Authorities must there-fore guarantee a tax-base per pupil large enough so that when an averageor reasonable tax rate is applied, sufficient revenues per pupil are generatedto finahce an adequate educational program. If this is not done, poor dis-trictswhich must depend on central aidwill find that even the com-bination of central aid and local revenues produced by an average ornormal tax rate will not realize sufficient funds for a minimally adequateeducational system.
Power-Equalizing Plan
This proposed plan, which is very similar to the guaranteed tax-baseplan, guarantees a given tax yield (revenue per pupil) for any tax rate which
63
73
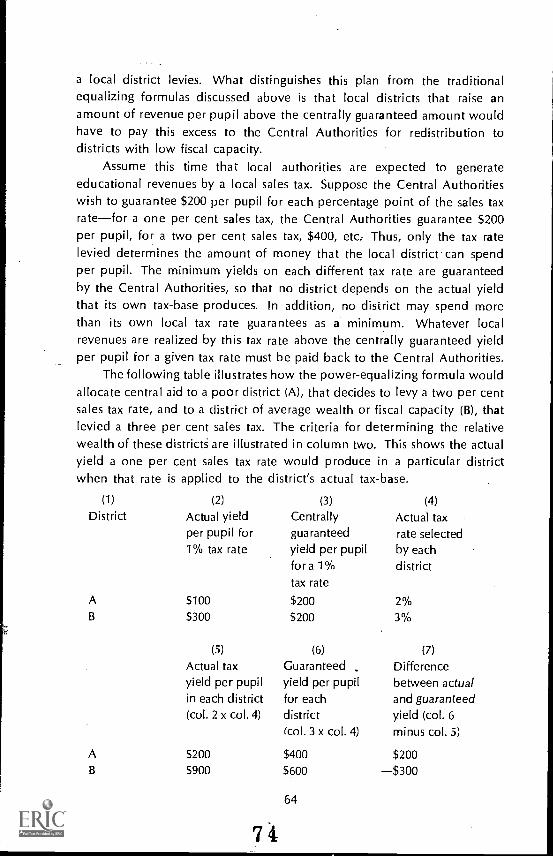
a local district levies. What distinguishes this plan from the traditionalequalizing formulas discussed above is that local districts that raise anamount of revenue per pupil above the centrally guaranteed amount wouldhave to pay this excess to the Central Authorities for redistribution todistricts with low fiscal capacity.
Assume this time that local authorities are expected to generateeducational revenues by a local sales tax. Suppose the Central Authoritieswish to guarantee $200 per pupil for each percentage point of the sales taxratefor a one per cent sales tax, the Central Authorities guarantee $200per pupil, for a two per cent sales tax, $400, etc: Thus, only the tax ratelevied determines the amount of money that the local district can spendper pupil. The minimum yields on each different tax rate are guaranteedby the Central Authorities, so that no district depends on the actual yieldthat its own tax-base produces. In addition, no district may spend morethan its own local tax rate guarantees as a minimum. Whatever localrevenues are realized by this tax rate above the centrally guaranteed yieldper pupil for a given tax rate must be paid back to the Central Authorities.
The following table illustrates how the power-equalizing formula wouldallocate central aid to a poor district (A), that decides to levy a two per centsales tax rate, and to a district of average wealth or fiscal capacity (B), thatlevied a three per cent sales tax. The criteria for determining the relativewealth of these districtS are illustrated in column two. This shows the actualyield a one per cent sales tax rate would produce in a particular districtwhen that rate is district's actual tax-base.
(1)
District
applied to the
(2)
Actual yieldper pupil for1% tax rate
(3)
Centrallyguaranteedyield per pupilfora 1%
(4)
Actual taxrate selectedby each
districttax rate
A $100 $200 2%B $300 $200 3%
(5)
Actual taxyield per pupilin each district(col. 2 x col. 4)
(6)
Guaranteedyield per pupilfor eachdistrict(col. 3 x col. 4)
(7)
Differencebetween actualand guaranteedyield (col. 6minus col. 5)
A $200 $400 $200B $900 $600 $300
64
74

Here District A by levying a two per cent sales tax would be guaranteedenough revenue to spend $400 per pupil. District B could spend $600 perpupil because of its sales tax rate of three per cent. Note that the tax ratewhich the local district uses is the only means by which its ultimate expendi-ture per pupil is determined.
In District A, a sales tax of two per cent generates only $200 per pupilin actual local revenue. Because the Central Authorities have guaranteedan expenditure of $400 per pupil to any district that levies a two per centsales tax, District A will receive an additional $200 per pupil in central aid.
District B has a larger tax-base, that is, the value of retail sales turnoverin the district. By using a three per cent sales tax, District B can generate$900 per pupil in local revenue. But because the- Central Authorities haveset the per-pupil expenditure guaranteeand limitfor a three per centsales tax rate at $600, District B must pay back to the Central Authoritieswhatever excess revenue it generates by using a three per cent tax rate.In this example, District B must pay $300 per pupil into the central fund.
Such a formula equalizes the burden for supporting educational pro-grams more than the other equalizing formulas discussed above. Local
areas with very large tax-bases must return revenues higher than thoseguaranteed by the formula to the Central Authorities for redistribution topoorer localities. But often rich districts are under pressure to move itemsout of the school budget account into other accounts, while poor districtswill do the opposite.
A substantial measure of local autonomy can be retained because anydistrict can achieve whatever level of per-pupil expenditure which the localauthorities and local population deem necessary; they simply raise the localtax rate to the level needed. But poor districts may still be at a disadvantageif they find it politically and economically impossible to levy a tax rate highenough to guarantee an adequate per-pupil expenditure. Part of suchdifficulty can be overcome by using weightings to reflect special needs ofeconomically and educationally disadvantaged students.
The aim of the power-equalizing formula is not to equalize per-pupilexpenditures, but rather to equalize tax burdens for supporting educationby linking per pupil tax yields directly to tax rates.
District-Equalizing Plan
This proposed plan actually attempts to move the tax-bases or fiscalcapacity of local districts towards equalization. This formula was developedbecause recent educational research showed that children of middle classparents tend to succeed more in school than children of poor parents.
65
7J
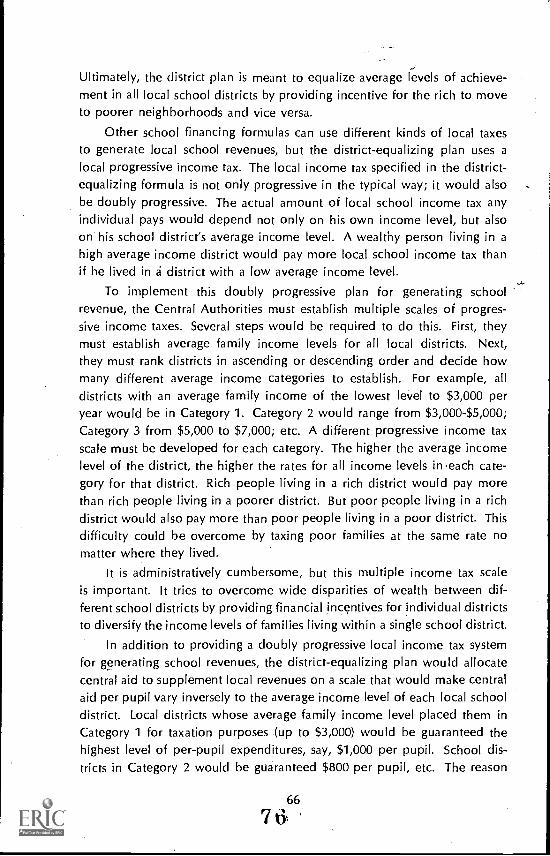
Ultimately, the district plan is meant to equalize average levels of achieve-ment in all local school districts by providing incentive for the rich to moveto poorer neighborhoods and vice versa.
Other school financing formulas can use different kinds of local taxesto generate local school revenues, but the district-equalizing plan uses alocal progressive income tax. The local income tax specified in the district-equalizing formula is not only progressive in the typical way; it would alsobe doubly progressive. The actual amount of local school income tax anyindividual pays would depend not only on his own income level, but alsoon his school district's average income level. A wealthy person living in ahigh average income district would pay more local school income tax thanif he lived in a district with a low average income level.
To implement this doubly progressive plan for generating schoolrevenue, the Central Authorities must establish multiple scales of progres-sive income taxes. Several steps would be required to do this. First, theymust establish average family income levels for all local districts. Next,
they must rank districts in ascending or descending order and decide howmany different average income categories to establish. For example, alldistricts with an average family income of the lowest level to $3,000 peryear would be in Category 1. Category 2 would range from $3,000-$5,000;Category 3 from $5,000 to $7,000; etc. A different progressive income taxscale must be developed for each category. The higher the average incomelevel of the district, the higher the rates for all income levels in each cate-gory for that district. Rich people living in a rich district would pay morethan rich people living in a poorer district. But poor people living in a richdistrict would also pay more than poor people living in a poor district. Thisdifficulty could he overcome by taxing poor families at the same rate nomatter where they lived.
It is administratively cumbersome, but this multiple income tax scaleis important. It tries to overcome wide disparities of wealth between dif-ferent school districts by providing financial incentives for individual districtsto diversify the income levels of families living within a single school district.
In addition to providing a doubly progressive local income tax systemfor generating school revenues, the district-equalizing plan would allocatecentral aid to supplement local revenues on a scale that would make centralaid per pupil vary inversely to the average income level of each local schooldistrict. Local districts whose average family income level placed them inCategory 1 for taxation purposes (up to $3,000) would be guaranteed thehighest level of per-pupil expenditures, say, $1,000 per pupil. School dis-tricts in Category 2 would be guaranteed $800 per pupil, etc. The reason
66
76
for this type of expenditure guarantee is based on the belief that childrenfrom poor communities (defined here as school districts) need more moneyto achieve levels comparable with those of children from wealthier familiesand communities.
But varying levels of central aid will not mean that wealthy districtswill actually spend less than poorer districts. Wealthy districts with highrates for local income taxation will inevitably generate sufficient localrevenues for high per-pupil expenditure. Any district that wishes to spendmore per pupil than the Central Authorities guarantee under the district-equalizing plan must pay all educational expenditures out of local fundsbecause the district would then not qualify for central aid.
The district-equalizing plan primarily affects the individual and com-munity decisions of wealthy persons. Citizens of wealthy districts con-fronted with high local taxes and low or no central aid for education wouldhave the following alternatives:
They can keep their community wealthy and exclusive by simplypaying high local taxes.
They can encourage tower income families to move into theircommunities by providing locally-financed, low income housing or by othermeans. This would lower the average income level of the local schooldistrict, reduce local school income taxes, and possibly make the districteligible for central aid.
Wealthy families could move into school districts with lower av-erage incomes and, hence, pay progressive income taxes on a lower scale.
If the wealthy individuals or communities choose one of the last twooptions, local wealth, as measured by average family incomes within schooldistricts, would tend to become more equalized throughout the countryor state. Even if the wealthy did not respond to the financial incentives ofthe district-equalizing plan to move to less wealthy school districts or toencourage poorer families to move into their districts, the district-equalizingplan would still guarantee poor districts a higher level of per-pupil expendi-ture than they would support locally, or than a conventional central aidformula based on an equal-expenditure-per-unweighted-student criterionwould allocate to poor districts.
By basing the level of state aid per pupil on a measure of average in-come in a particular district, the district-equalizing formula produces resultsroughly similar to other equalizing formulas that employ the weightedstudent concept to produce additional revenues per actual student to school
67
77-
districts, which, enroll students who are designated as educationally dis-advantaged. The district-equalizing formula uses an implicit weighting sys-tem based entirely on average income criteria. Children in districts withlow average incomes are assumed to require higher per-pupil expendituresthan children living in districts of average or above average wealth.
The ultimate goal of the district-equalizing plan is to equalize averagelevels of student achievement among local school districts. It tries to pro-mote socio-economic variations among families within the same schooldistrict and to provide the financial means to offer compensatory or en-riched educational services in districts of low average family income levels.
Comments on the Foundation, Percentage-Equalizing, andGuaranteed Tax-Base Plans
These three traditional equalizing formulas, presently used in the
United States, are instruments for allocating central funds to districts wherethe local authorities also have the power to raise local revenue to financeeducation. The basic intent of these equalizing plans is to enable all localdistricts to support some minimal level of educational expenditure perpupil. The formulas deal only with the problem of equalizing fiscal capacityin the public sector. Equalization of educational opportunity, in general,is a bigger problem and requires stronger and broader instruments. Never-theless, these formulas provide a degree of equalization of educationalopportunity. This equalization depends on a combination of several factors:
How much local authorities can determine their own actual levelof expenditure per pupil and tax rates. The wider the disparities in thevalue of the tax-base per pupil between local districts, and the widerthe latitude for local decision-making, the less the degree of equalizationactually achieved.
The wider the fiscal capacity is between districts, the greater isthe need for Central Authorities to pay a large proportion of total educa-tional expenditures in order to maximize equalization.
In general, the more accurately differing educational needs ofstudents and differing costs of providing similar educational services in dif-ferent localities are taken into account, the greater will be the ultimateequalization of educational opportunity achieved by the formulas.
Maximums and Minimums
Most applications of equalizing formulas would result in no central
68
78

funds or even negative aid for the richest districts, and very large grantsfor the poorest. In practice, for political or fiscal reasons, many CentralAuthorities use maximum and minimum amounts of aid. A minimum guar-antees that rich areas receive central funds, although the equalizing formulawould not allocate them any or may even demand reimbursement to thestate. Imposing a maximum on total aid per pupil prevents very poor dis-tricts from realizing the total central aid that an equalizing formula wouldnormally allocate to them.
Central Authorities can also set a maximum on the locally determinedexpenditure per pupil to prevent wealthier districts from absorbing toolarge a share of the total central funds appropriated for local aid. Whenthis imposed maximum corresponds to an expenditure necessary to providea minimum acceptable level of education, the percentage-equalizing planbecomes similar to the foundation plan.
Selected Examples of Provision of Elementary and Secondary Educationand Transfer of Funds to Institutions and to State and Local Governmentsby the Central Government
Different government levels provide education directly or transfer fundsto institutions or other levels of government. Often the Central Governmentprovides finance directly, as selected examples from developing countriesindicate below.
Central Government in Direct Financing and Administration In somedeveloping countries, the Central Government's Ministry of Education ac-tually finances and administers some schools. The Afghanistan constitutiongives only the Central Government the right and duty to establish andadminister institutions of elementary, secondary, and higher learning. Tu-nisia follows the French example of a strong system, administered mostlyby the Central Government. Malaysia also has a Central Government schoolsystem that maintains all types and levels of schools.
Not all developing countries have a centrally administered nationaleducation system, but in several countries the Central Government so dom-inates the financing, at one level or another, that the schools are actuallypart of a central system. Kenya's maintained schools usually receive thedifference between expenses and revenue, most often only fees, from theCentral Government.
The Central Government can dominate the secondary level, as in Kenya,Ghana, the French speaking African countries, Afghanistan, Cambodia,Malaysia, Indonesia, the Philippines, the People's Republic of China, theCaribbean countries, Argentina, Chile, Uruguay, Venezuela and other Latin
69
79
American countries. In the Philippines, Mozambique, Tanzania, Nigeria,Colombia, and Argentina, the Central Government fully finances most ofthe technical and teacher training.
Some Central Governments also provide primary education, althoughthis is not as widespread as provision of secondary education. CentralGovernments run primary education systems in African countries whichwere French colonies; in Ghana, Afghanistan, Malaysia, Cambodia, thePhilippines; and in some Latin American countries, such as Argentina,Brazil, Chile, and Colombia.
Ministry of Education Transfer of Funds Central Governrnent financialactivity in education in developing countries occurs mostly through thetransfer of funds either directly to schools or to regional or local governmentlevels which administer schools. To insure this transfer, the constitutionsof Colombia, Brazil, and Taiwan require the Central Government to spenda given percentage of its tax revenue or its national budget on education.India's Central Government contributes a given percentage toward edu-cation.
Because developing countries are currently most concerned with pri-mary education, most money transferred goes to the local levelwhoseauthorities are responsible for administering primary schools.
Some countries also have Central Government transfers to the regionallevel. Nigeria, Ghana, the French-speaking African countries, Malaysia, In-donesia, Thailand, India, Colombia, and Brazil are among developing nationswhose Central Governments assist at the regional, as well as the local level.
Some Central Government transfers also go directly to schools. TheMinistry of Education usually administers these allocations, as determinedby the legislative body that approves the national budget. There are manyproblems in allocating funds from the legislature directly to schools be-cause officials are subject to political pressures.
Transfer of funds occurs through general grants or categorical grants.Both types are subject to withdrawal by the Ministry of Educationpri-marily, when the school does not meet the Ministry's minimum standards.Grants may also be withdrawn if facts are knowingly misrepresented orfalsified by the recipient. Grants may also be cut in times of economicstress. Appropriations for school equipment and teachers' salaries areusually reduced first. Trained teachers may be fired and untrained oneshired at a lower salary.
Local or regional governments commonly receive general grants, as inNepal, Uganda, Kenya, and Latin America. Most general grants are givenon a matching basis, or as a percentage of earmarked revenue, and are
70
80
frequently put into special accounts. Because transferring funds to theregional level does not guarantee that they will be spent on. education,Colombia, Argentina, and other Latin American countries specifically ear-mark funds for educational purposes.
Categorical grants to institutions and other government level authoritiesare most prevalent in African and Asian countries. The amount dependsin an increasing number of countrieslargely on an assumed local con-tribution, estimated from the revenue which the regional local authorityhopes to raise. The Central Government then provides the difference be-tween the local estimated contribution and the total estimated expenses.If the local authorities do not collect the full estimated amount, they mayhave to reduce the quality of service. This method is used in Kenya andthe Cameroons. But in Taiwan, appropriations are sensitive to the financial ,
capabilities of the municipalities and equalize financial resources among therich and poor communities.
The most common categorical grant is for recurrent expenditures whichcomprise essentially teachers' salaries. The Central Governments of mostdeveloping countries offer some assistance for teachers' salaries. The
method of finance varies but some techniques predominate. Once *deter-mined, the bill for teachers' salaries is paid entirely or in part by the CentralGovernment through transfer of funds. This may be paid in a yearly lumpsum or in quarterly adjusted estimates to meet inflation. Ghana, Uganda,Indonesia, and Thailand use the latter method. Nigeria and Ghana use aper-pupil sum to calculate the transfer needed to pay recurrent expenditures.Assisted schools in Kenya receive only a fixed percentage of their recurrentexpenditures, but some teachers are assigned directly by the Ministry ofEducation. In Guyana the regional government provides a lump sum grantto each governing bud), for salaries, equipment, and other expenses.
Recurrent expenditure grants, usually carefully monitored by CentralGovernments, contain involved regulations that have to be met beforeauthorities or schools receive assistance. All grants are subject to theMinister of Education's approval. Minimum standards for the quality ofbuildings, teacher certification, teacher salary scales, classroom size, cur-riculum, attendance, and efficiency must be satisfactorily attained beforethe Mir'stry of Education extends grants.
A major use of categorical grants provided by the Ministry of Educationis for capital expenditure; this includes school, library, furniture, playground,equipment purchases, repairs, and even outhouse construction. Two com-mon methods determine the amount of the capital grants: a percentageof the project's estimated cost, and less common, an estimate of cost per
71
81
classroom. Some African countries pay a fixed rate based on cost perclassroom. Guyana is an unusual example of a third method where thegrant for buildings includes maintenance of the buildings. All plans andestimates must have the approval of the Minister of Education, and con-struction costs must be substantiated by receipts. Tanzania is one of thefew developing nations that requires a local contribution, either in theform of cash, labor, or materials before the Central Government will ap-prove a capital grant.
Some types of categorical grants which are less frequently allocatedin developing countries are of interest. Malawi provides grants for physicaltraining and recreation in the schools, as well as expenses for examinationssupervised by the Minister of Education.
Other Educational Functions of the Central Government The Ministryof Education in developing countries handles most transfer of funds toeducation by the Central Government. But other ministries and autonomousagencies, which either sponsor programs or transfer funds, are also involved.In Thailand, the Ministry of the Interior allocates all subsidies, while theMinistry of Education controls educational policy for primary education.In Uganda presently, ten ministries are involved in education. In Braziland Venezuela, more than 12 autonomous agencies support educationalactivities in one way or another.
Ministries other than the Ministry of Education most frequently con-centrate their work in education on capital expenditures. In Malaysia, the
Finance Committee of the National Development Planning Committee,operating out of the Prime Minister's Department, initially approves allcapital expenditures on education because funds are drawn from the con-solidated development fund
In Indonesia, Rhodesia, Tanzania, the United Arab Republic, and Ven-ezuela, the Ministry of Home Affairs or Department of Public Works isresponsible for educational capital expenditures. Colombia has autonomousagencies to administer capital expenditures for primary and secondary edu-cation. Development Boards provide additional funds for capital expendi-tures, either through Central Government budget appropriations or throughforeign assistance. These boards are common in Africa. In Latin America,such departments are powerful planning arms of the government but donot actually allocate funds.
Specific educational programs are often sponsored by the appropriate
department. In Indonesia, the Ministry of Religion supervises and oftenfinances religious schools. In the United Arab Republic, Tunisia, Thailand,Indonesia, Peru, and Ecuador, the Departments of Agriculture, Health, Public
72
82
Works, and Labor sponsor special schools for agriculture, public health,and engineering.
In Uruguay, responsibility for primary education is constitutionally in-dependent of the Ministry of Education. A Board of Primary Education atthe Central Government level presents its own budget needs to the legisla-ture and is responsible for administering primary education.
Selected Examples of Provision of Primary and Secondary Educationand Transfer of Funds to Institutions and Local Governments byRegional Government
Descriptions of regional, provincial or state level activity do not alwaysclearly indicate the organization of educational activity at that level. State-ments about regional responsibility seldom clarify whether the state hasfinancial or administrative responsibility. Nor do they indicate how muchof the money regional governments distribute is from their own resourcesand how much of it is transferred to them by the Central Government.Regional governments have a variety of responsibilities in education: fromdirectly providing education to just supervising' it; from providing theirown resources to allocating those from the Central Government.
The constitutions of Taiwan and Brazil specifically authorize provincialand state governments to spend a specific portion of their budgets on edu-cation. India's state governments carry a major financial burden for educa-tion. The Philippine provincial governicients are financially responsible forassisting secondary schools because national appropriations do not existat the secondary school level.
Those Latin American countries with a history of federated governmentsgive regional governments at least partial financial responsibility for edu-cation. The departments of Colombia, the provinces of Argentina, and thestates of Brazil are regional divisions with powers to raise revenues foreducation. They also match special educational account funds from thenational level and are responsible for administering them. Ghana is anexample where provincial level governments administer the grants andsubsidies of the Central Government.
Provision of Education at the Regional Level A few developing nationshave regional governments that administer some kind of education. Statesin Nigeria oversee primary education. State governments manage primaryboarding schools in India. In Madagascar, primary eck,Lation is partly underprovincial jurisdiction. In Colombia, Brazil, and other Latin American coun-
73
83

tries, regional authorities are largely responsible for administering primaryeducation. Indonesia also gives the state responsibility for primary edu-cation.
In African countries, regions administer secondary education. The pro-vincial governments of the People's Republic of China provide most sec-ondary education. The Taiwan provincial government sponsors summercourses for the in-service training of local public school teachers at theprovincial normal schools. In Brazil, the states are responsible for all
public secondary education. The departments in Colombia also sponsorsome secondary education.
Transfer of Funds from the Regional to the Local Level The fundstransferred are usually categorical. Some are given directly to schools, butmore often the transfer is between the regional and local educational au-thorities which administer several schools. The amount of the grant is fre-quently based on budgetary estimates of the local educational system'sneeds. Grants are usually given on a yearly basis. In Western Nigeria, how-ever, the yearly grants come in three unequal installments: the first two arebased on projected enrollments; the final grant is the "adjusted" one, basedon the actual number of teachers and pupils for that school year.
In India, states provide general educational grants, as well as categoricalgrants to local governments. These grants are calculated by a percentageof the approved expenditure and a given unit of service. There is no man-dated minimum local tax effort for education. States base their grants ona theoretical principle, which is not strictly relaed to need or efficiencyof schools or districts.
The most common categorical grant at the regional level is for recurrentexpenditures, especially, teachers' salaries. Regional authorities in WesternNigeria and Indonesia offer such categorical grants.
Most of the grants for capital expenditures are similar to those allocatedby Central Governments. Western Nigeria provides construction grants paidon a matching basis for secondary grammar schools. In Thailand, the pro-vincial governments administer capital funds allocated by the Central Gov-ernment.
The Taiwan provincial government provides a few interesting categori-cal grantsexpenses for pre-service and in-service training programs forteachers, and substantial subsidies for the education of aborigines.
In the People's Republic of China, provincial governments that Controlteacher-training schools, mostly for secondary education, assign the gradu-ates to local schools and pay them directly.
74
8 4
Selected Examples of Provision of Primary and Secondary Educationand Transfer of Funds to Institutions by Local Government
Even developing countries with radically different political philosophiesseem to agree that local authorities must assume more responsibility, atleast, for elementary education. This necessarily involves financial as wellas administrative effort. At present, the extent of local responsibility is
mostly administrative; their financial contribution to education is extremelylimited.
A few countries are actively pushing for increased local financial effortin education. The constitutions of Taiwan and Brazil compel local govern-ments, as well as the Jegional and central levels, to set aside a certain por-tion of their budgets for education. Nigeria, Kenya, and Tanzania makefinancing and organizing elementary education a local responsibility,whether it is clone by town governments, tribal associations, or collectives.The only local bodies which fully finance and sponsor public school systemsexist in the People's_ Republic of China. There the organization of the localgovernment bodies differs significantly from those of most developingcountries.
In most developing countries, local educational authorities are eitherautonomous or part of the local government structure. These authoritiesoversee all schools in their jurisdictionfully subsidized public schools orpartially subsidized private schools. Nearly all local governments receivesubstantial aid from either the Central and/or regional governmental levels.Their main job is to administer the educational assistance provided byhigher levels of government, most often allocating Central or regionalgovernment grants to fully assisted public schools, or to partially subsidizedprivate schools. Such assistance cannot be considered to be a local gov-ernment financial effort in education.
These local bodies may also collect and allocate the small amount ofresources for education gathered at the local level. Local government re-sources are used mostly for construction and maintenance of school build-ings, or for supplying equipment.
Selected Examples of Governmental Assistance to Private Institutions
F ate educational institutions include non-profit corporations, co-operatives with educational activity, and religious and privately ownedschools. Most educational systems in developing countries were started byreligious organizations or private individuals. As Central Governments as-sumed more responsibility for education, some governments made theseprivate schools the basis of the national educational system. It was only
75
natural to support them financially. In some developing nations, membersof religious groups would not attend secular schools. The Central Govern-ment in French West Africa began supporting Moslem schools to get somegeneral control of the country's education.
There are all levels of private schools in developing countries: there
are pre-primary, primary, secondary; technical and teacher training schools;farm schools, schools for the handicapped, and religious schools. And allof these types of schools receive financial assistance from the government.
Transfer of Funds Most financial support to private institutions comesfrom the Central Government. It is distributed either directly, or throughregional or local governments; thereby, creating a national educationalsystem. Countries with strong state or regional governments have additionalresources to assist private institutions. In Latin American countries, a sub-sidy from one level of government does not prohibit an institution fromconcurrently receiving a subsidy from another level.
General grants are common in Latin American countries, but uncom-mon in Africa and Asia. Categorical grants are the more frequently usedform of assistance to private institutions, and they help enable governmentsto control the quality of private education. These categorical grants arelike those awarded to centrally assisted public schools. The most commonare given specifically for teachers' salaries, rather than for total currentexpenditures. Nigeria, Indonesia, and Malaysia provide private schools withfinancial assistance for teachers' salaries. Thailand provides salary assistanceto only those teachers who meet certain qualifications.
Categorical capital grants and grants for supplies and equipment arealso given by the Central Government to private schools in many developingcountries, such as Malaysia, Thailand, and Nigeria.
Besides allocating categorical grants, Central Governments may provide.credit for capital expenses to private schools. In Spain, credit has beet"extended at interests below the market rates. In some cases, rather thanrepaying the loan to the Central Government, the recipient must provideequivalent funds in scholarships.
Technical Aid and Materials The Central Government of Indonesiaprovides private schools with technical assistance through trained teachers,as well as with funds for school buildings, equipment, and supplies. TheThai government provides teaching materials to private schools to assureminimum quality standards. Central governments in some Latin Americancountries provide teachers directly to cooperative school systems.
Grants and technical aid to private schools are controlled by a variety
76
86
of restrictions. Like public schools, private ones are subject to grant re-moval if they abuse funds or fail to maintain certain standards. Countriesthat foster centralized and public education place more restrictions on theirgrants to private schools than countries in which private schools are thebasis of the educational system.
Selected Examples of Governmental Assistance to Households
In developing countries, governmental assistance to households is al-located according to three criteria: social right, need, and merit. Almostall developing countries strive to provide, at least, free primary educationas a basic right of all citizens. Some have extended this right to the sec-ondary level; still others, to higher education. Most countries want freeeducation for all, but many developing countries cannot yet meet that goal.Thus, direct assistance to households based on need and merit helps relievesome of the burden of education for poor families in present educationalsystems. This assistance generally takes two forms: transfers for tuition, andtransfers for student maintenance.
Transfers for Tuition Scholarships for fees and tuition are the mostcommon transfers from the government to households. Cash is giver) tothe parents, students, or to the schools for direct payment of student bills,or as remission of government collected fees or educational taxes.
Scholarships are most often awarded by the Central Government, althoughin Nigeria, Guyana, and Botswana, scholarships are awarded by the localeducational authority or regional government.
Generally, scholarships are financed in three ways: most frequently,from budgetary allocations made within the Ministry of Education or otherministries; from funds where the principal is either donated privately orpublicly, and the income allocated as scholarships (Brazil and Guyana); andfrom funds voted by a government body constituted to finance scholarships(Malaysia).
Eligibility requirements are varied. Nearly all scholarships are awardedfor merit and some for need. Merit is generally determined by committeesthat review examination scores and past school records. Countries that wereonce British colonies most frequently use the merit system. Some LatinAmerican countries award scholarships on the basis of merit and need.
Most scholarships are given for higher education, but some are awardedat the secondary and even elementary levels. Scholarships at the secondarylevel are usually based on merit, but are often encumbered with residencyrequirements, sex and age preferences, and school specifications. Some
77
87
countries providing scholarships at the secondary level are Thailand, Ma-laysia, and some Latin American countries.
Few scholarships are awarded at the elementary level because mostcleve.oping countries are striving for "free" education. But Malaysia, Bots-wana, and Ghana have programs that remit fees to families who are toopoor to pay, so that their children will not he denied primary education.
Transfers for Student Maintenance Even if basic tuition is providedfree through public education or scholarships, many families are too poorto pay for texts and equipment, housing, clothing, transportation, and socialservices, including food. Consequently, much government support is allo-cated for these purposes.
Texts and equipment, such as books, paper, and pencils are a majoritem of government provision in many countries. Governments either givethe school, or occasionally the parent, the cash to buy books and materials,or provide them directly to the schools. As part of the push toward freepublic education, the costs of books and equipment are being increasinglyabsorbed by governments, as is the case in Malaysia, Nigeria and Taiwan.Latin American governments are just beginning to provide assistance inthis area at the elementary level.
Because of a limited number of secondary schools in many developingcountries, boarding facilities are needed for students from distant places.This is particularly frequent in countries of British background. Swazilandhelps pupils pay boarding' fees. Ethiopia and Malaysia provide boardingfacilities whose costs are absorbed in the schools' general financing arrange-ments. Most teacher training programs and agricultural schools in Latin
America provide boarding facilities or give monetary compensation to stu-dents boarding outside.
Clothing is another maintenance problem that has become a govern-mental concern in some countries. An agricultural school in Ethiopia pro-vides a clothing allowance to needy pupils. In Malaysia, clothing is pro-vided at the elementary and secondary levels to needy pupils, to assuretheir attendance.
Transportation is also supported. In Nigeria and Malawi individualsare reimbursed for transportation costs.
A few countries also provide social services in their educational pro-grams. The provision of meals and medical and dental services is becomingincreasingly common in such countries as Tunisia, Brazil, Colombia, andTanzania.
These benefits from government transfers to households do not alwayscome without obligation to the recipient. The most common type of obli-
78
88
gation is a commitment to work. in an Ethiopian agricultural school, stu-dents must work 12 hours a week in retur.1 for room, board, and a basicclothing allowance.
In addition to the types of assistance just mentioned, Central Govern-ments in some developing countries offer loans to students. These reducethe recurrent expenditures for government, reduce the tax burden for titi-zens, and increase educational opportunity. Kenya has increasingly offeredsuch loans as a major way of financing secondary education. Student LoanInstitutions are becoming popular in Latin America;'although their fundsare applied only to higher education.
PRIVATE FUNDING
in addition to government funding to the private sector, there has al-ways been private initiative in financing education.
Some private school systems are entirely financed by families, churches,foundations, corporations, and other groups in thq, private sector. But
public education systems commonly receive some private financial supportas well. This includes payments from families for school fees; grants from
private organizations often for developing experimental programs; andspecial grants from private industry, sometimes applied to industrial trainingprograms that become part of the public school curriculum. In developingcountries, private individuals often donate labor and/or materials and fundsduring construction of a local school. Such private contributions are a majorsource of educational capital finance in some countries.
The disadvantages of private funding involve the problems created bythe necessity of imposing school fees, which restrict access of educationto richer students. Stipends to poor students partly alleviate this problem,but stipends are rarely available to all potential students from low incomefamilies. Rich and elite groups usually dominate educational systems thatrely on school fees. Another disadvantage is that a public school systemdependent on private fundingfrom organizations or industrymay bepressured into promoting the private interests of specific groups or indi-viduals. But private funding from industry for vocational and technicalschools and cooperation between industry and public vocational educa-tional authorities would be a definite asset in planning and establishingthese schools.
Private Contributors to Education
In many developing countries, private contributions constitute a majorfactor in financing education. These contributions and the efforts behind
79
8 9
them are often neither specifically calculated nor adequately appreciated.These contributionsmonetary and materialmay be direct, indirect, vol-untary or involuntary. The four major groups of contributors to privateeducation are: families; business corporations; voluntary agencies; andcollectives.
Families Parents pay fees for tuition, examinations, registration, lab-oratories, and other purposes in most developing countries. Uniforms,books, paper and supplies, transportation costs, and lunches are among the"hidden" costs. Besides the obligatory expenses, some families contributemoney to schools. In Australia, the government will match amounts raisedby parents or organizations to encourage contributions from the privatesector. In Indonesia, wealthy parents loan money to schools.
Families can also meet their obligations to education by contributingproducts. Food is contributed to some schools in Nepal. Because govern-ment grants meet recurrent expenditures in many developing countries,capital expenditures must be met by the families. Land, labor, and materialsare contributed by communities to build or maintain schools in Mozam-bique, Tanzania, the Union of South Africa, Rhodesia, the Cameroons,Indonesia, Thailand, the Philippines, Nepal, some South American coun-tries, and elsewhere.
Business Corporations In developing countries, businesses have helpedstudents to attend school, and they have maintained and established schools.
Corporations have also directly sponsored a variety of schools, such aspre-primary, primary and basic literacy.
Often laws require businesses to undertake direct educational efforts.In the United Arab Republic, industrial establishments are required to payfor worker literacy programs, and to provide textbooks and materials.The Brazilian constitution requires that all industrial, commercial, and agri-cultural businesses employing more than 100 persons help provide free
;elementary education for employees and their children. In the 1950's,Malaysian rubber estates had to provide either primary education or arrangefor transportation to existing facilities when ten or more workers' childrenlived on the estate. In the 1972 Educational Reform Program in Peru, asimilar law was established. Business corporations also sponsor trainingprogramsmostly to meet their own manpower needs.
Voluntary Agencies These agencies comprise religious missions, secular
charitable organizations, parent-teacher associations, private foundations,and international organizations. They sponsor pre-primary, primary and sec-ondary schools, literacy programs, vocational training, and special educa-
80
9 0
tion, as well as provide meal programs, supplies and reading materials.Their major contribution is in the form of buildings and equipment. Theseschools receive government assistance, as well as support by student fees.
In Tanzania, as in other developing countries, voluntary agencies paylittle toward recurrent costs but provide considerable capital funding. Thesevoluntary agencies may even get occasional government assistance for largecapital expenditures. But they have more freedom than public educationalauthorities to spend grants as they see fit.
Collectives These are not as common as other types of educationalsponsors, but where they exist they are actively involved in education.
The People's Republic of China provides the most interesting examples ofcollective educational efforts. Because of the current emphasis on decen-tralized education, communes, factories, and local collectives sponsor theirown pre-primary and primary education. Secondary education is sometimes
jointly sponsored by several collectives. The funds for schooling are eithermanaged by the collective or sent to a higher authority.
Because of the work-study arrangements in the People's Republic ofChina where the collective is in charge of all production, collective re-sponsibility for education is most practical. Each collective is fully re-
spqnsible for both capital and recurrent expenditures. Primary school
teachers are active members of the collective; they are paid as workingmembers and assume work responsibilities, as well as teaching duties. They
are. often paid in goods and services, as well as with money.Several South American countries also provide collective forms of
education. Israeli kibbutzim at one time were another example of a col-lective system of education.
Schools in some developing countries also operate on a cooperativebasis. They are fully financed by members of the cooperative system.
81
91
CHAPTER V
Government Financingof Higher Education
THE problems of financing higher education are common to both devel-oped and developing countries. Rising costs and more slowly rising
revenue, inflation, increased demand for education, competitive demandscaused by expansion of the higher education system, demands for special-ized labor and expensive equipmentall create problems in financinghigher education.
In all countries, Central Governments take some responsibility for thecosts of higher education. The amount they choose to spend may varywidely, but Central Governments do have common patterns for distributingtheir share. This chapter discusses the common distribution patterns ofCentral Government funds to institutions, individuals, lower levels of gov-ernment, and councils for higher education. It compares the monetary andpower effects of each transfer type, clarifying the advantages and disad-vantages.
FINANCING PATTERNS OF HIGHER EDUCATION
Countries use various methods to meet the total costs of higher educa-tion. Before the utility of specific methods can be adequately evaluated,the components of higher education costs and the ways these costs are metmust he understood.
The costs of higher education are:
Total Costs
of EducationOperating Costs Expenses for
Room and Boardof the Institution
The components of the funds collected to meet these costs are:
Total Funds forHigher Education
GovernmentShare
+ Tuition
82
92
Private
Contribution
Room and
Board
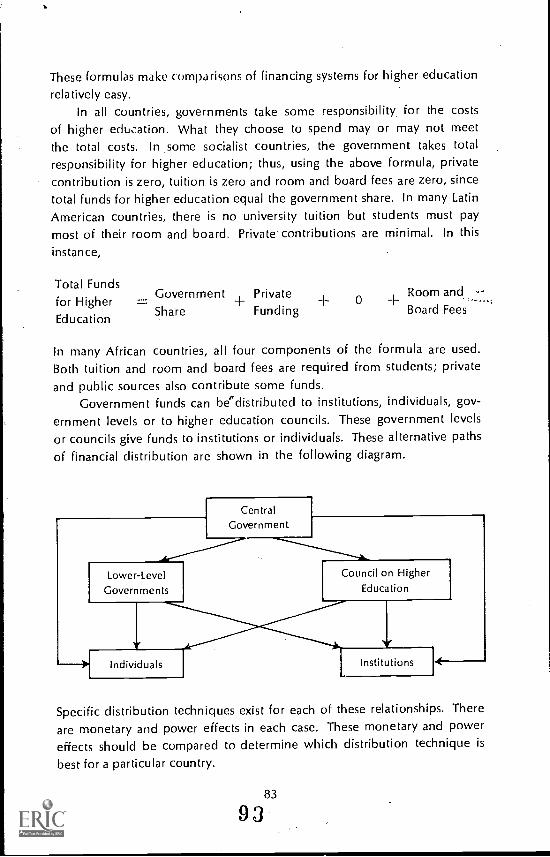
These formulas make comparisons of financing systems for higher education
relatively easy.
In all countries, governments take some responsibility for the costsof higher education. What they choose to spend may or may not meetthe total costs. In some socialist countries, the government takes totalresponsibility for higher education; thus, using the above formula, privatecontribution is zero, tuition is zero and room and board fees are zero, sincetotal funds for higher education equal the government share. In many LatinAmerican countries, there is no university tuition but students must paymost of their room and board. Private contributions are minimal. In this
instance,
Total Fundsfor HigherEducation
Government Private + 0 + Room andLL
Share Funding Board Fees
In many African countries, all four components of the formula are used.Both tuition and room and board fees are required from students; privateand public sources also contribute some funds.
Government funds can beedistributed to institutions, individuals, gov-ernment levels or to higher education councils. These government levelsor councils give funds to institutions or individuals. These alternative paths
of financial distribution are shown in the following diagram.
Lower-Level
Governments
Individuals
Central
Government
Council on HigherEducation
Institutions
Specific distribution techniques exist for each of these relationships. There
are monetary and power effects in each case. These monetary and powereffects should be compared to determine which distribution technique is
best for a particular country.
83
93
Government Transfer of Funds to Institutions
Governmental contributions. to higher education are made mostlythrough funds to institutions. The amount allocated is primarily determinedby the institution's operating expenses, tuition, and room and board fees.The government funds are given in the form of general or categoricalgrants.
General Grants to Institutions These can be given on the basis ofvarious costs: per capita; operation of the physical plant; as a compensa-tion for sliding scale tuitions; or on the basis of a formula or fixed sum perdegree awarded.
Categorical Grants to Institutions These are given by one or manygovernment agencies to institutions for study or research in specific fields.
Monetary and Power Effects of Government Grants to Institutions
The awarding of grants by the government has monetary and powereffects.
Monetary Effects When there are many competing institutions, politicalinfluence or skill in obtaining grants often influences the distribution ofboth general and categorical grants more than financial need or contributionto educational objectives.
General grants may lead to increases in teachers' salaries and otheroperating costs in the overall budget, if institutions believe that governmentwill always meet their expenses. Categorical grants also raise operatingcosts in particular areas of study, if personnel or equipment for these areasare not readily available. This may also lead to higher tuition.
Power Effects These involve the relative amount of control the CentralGovernment and institutions have over the educational process, and alsothe relative amount of control administrators and students have over theeducational process.
There are two problems of control: government versus institutionalcontrol; and administrative versus student control.
Government versus Institutional Control
Grant appropriations for higher education are obviously advantageousto government. They give government control over its resources. Theyallow the government to shift priorities and spending at its own conve-nience. There is an obvious corresponding disadvantage to institutions
84
94
because the financial status of education should not depend on the unpre-
dictability of government.
From an administrative point of view, institutional grants are advan-tageous to governments. There are fewer institutions than students; thus,
distribution of government funds is much easier through institutions than
through students. Institutions need only to deal with the government for
funds.
The effects of grants on an institution's autonomy and accountabilityhave been questioned for some time. Grants may result in excessive insti-tutional accountability to government, causing a loss of an institution'sautonomy. Most educational planners consider autonomy a necessary pre-
requisite for a creative education sector. But if grants call for general ac-countability, such accountability need not necessarily encroach on auton-omy. Government need not set educational policy by insisting on totalaccountability for appropriated funds. Political involvement could be lim-ited to lump-sum appropriations and to judgments based. on cost data,
rather than on policy priorities. If institutions relinquish some autonomy,
this need not affect their own internal policies. Only institutions with a
single dominant source of funds might lose autonomy.
What distinguishes the power effects of categorical grants from general
ones is that government has greater potential control of the direction ofeducation through categorical grants than with general ones. Selective
support of subject areas also allows for national planning, which is par-
ticularly important to developing countries. Institutions, in turn, may lose
autonomy, depending upon their influence over the "categories" to be
financed. But such a system is not necessarily bad for institutions. In addi-
tion, if institutions are not completely dependent upon categorical grants,
government influence can be limited. Students, however, may lose the
power to choose areas for study if the government chooses to finance
subject areas selectively.
Administrative versus Student Control
Grants to institutions also shift the power relationship of students and
institution administrators. It is much easier for administrators to retaincontrol of financial and curricular decisions when funds are given to them
directly, instead of to students.
Government Transfer of Funds to Individuals
Government transfer of funds to individuals has taken three forms:
85
95

tax credits, student subsidies, and student loans. Transfers of these kindsassume that both tuition and/or room and board fees are not free.
Tax Credit Tax credit to parents allows them to deduct from their taxbill a percentage of their educational expenses. Tax credits are of twotypes: a flat credit where every taxpayer deducts the same amount fromhis tax bill; and a progressive credit where each taxpayer deducts a specificamount determined by a progressive scale.
The flat credit provides some assistance to parents but in no wayattempts to equalize the burden of educational costs between rich and poorfamilies. On paper, the flat credit may seem to represent a greater percen-tage of credit, relative to income, for a poorer family than a richer one.But the proportion of income spent on education is usually greater for thepoor *nily than the wealthy one. Thus, the burden is not sufficientlyequalized in a flat credit method, and a flat credit is, therefore, regressive.
A progressive tax credit is intended to avoid the regressivity of a flattax credit. Families with higher incomes would get less credit; familieswith low incomes, more credit. A scale might even be established wherefamilies with income above a certain level would get no credit.
Student Subsidies These can be allocated on the basis of merit or need.Ideally, such a subsidy would be in the form of direct student aid with norestrictions whatsoever. It could compensate for the higher percentage ofeducational costs incurred by poor families than by wealthy ones. To easeadministrative problems, government could allocate the funds directly tothe institutions, rather than to the students. The choice of institution wouldbe left completely to the student and the amount would be based onstudent need.
Student Loans Loans used to finance higher education will be discussedin detail in the next chapter.
Monetary and Power Effects of Government Transferof Funds to Individuals
Both tax credit and student subsidy are methods of transferring gov-ernment funds to individuals. They have common monetary and powereffects that are useful in evaluating the utility of these higher educationfinance methods in developing countries.
Monetary Effects For the government, a tax credit for education is ashift of funds from the general budget to investment in human capital. Foran institution, government transfer of funds can cause instability of re-
86
96
sources because funds are not necessarily committed to an institution formore than a year at a time. Also, such transfers do not help institutionsmeet costs not currently reflected in tuition. This may cause tuition toincrease to cover all institutional costs.
With a tax credit, the student or his family must first lay out the cashonly at tax repayment time will he receive the tax credit. A subsidy providesthe individual with ready funds to spend on education.
Power Effects Thce power effects of government financing the individ-ual's education involve four relationships: rich versus poor; institutionversus Central Government; student versus institution; and student versusparents.
Rich versus Poor
In theory, the basic advantage of subsidy and tax credit is that they helpequalize access to education by giving low income people more powerto obtain higher education than they had previously. Also, when not re-stricted in location or purpose, they are neutral towards public and privateinstitutions. But these advantages are not always applicable in developingcountries where, in general, the number of private higher education institu-
tions is small. In addition, because students eligible for higher educationhave been screened throughout the educational system of many developingcountries, student subsidies or tax credits for higher education will do littleto increase access to education appreciably for poorer families, whose
children seldom reach the screening process for higher education.The subsidy has greater potential than the tax credit for helping the
poor because subsidies can reach families too poor to pay taxesi they
would, therefore, not be able to benefit from a tax credit system. Converse-ly, the wealthy would benefit from a tax credit more than the poor becausethey can afford to pay taxes and more of their children attend school.
Institution versus Central Government
Because tax credits and student subsidies provide only indirect financialassistance to institutions, they have the effect of reducing governmentpower over higher education. But there is nothing to prevent governments
from restricting the use of tax credits or student subsidiessay, to specificsubject areasthereby, significantly increasing control over the educational
process.
Student versus Institution
Some theorists fear that if there is more than one educational institu-
87

lion, substantial funds given to individuals would give students a dispropor-tionate control over the direction of education. Others believe that moniesstudents receive are government funds and could easily be controlled bygovernment. In fact, they assert that institutions should fear government,not student control. In addition, because consumers in a market with fewsellers have little control over the products they buy, there is no reason
- --to assume that consumers of education in a similar market will have a dis-proportionate influence over educational suppliers. In many developingcountries, there is only one university and it is substantially controlled bythe government. In such situations, the fear that students will control theuniversity through using what is essentially government money may beunrealistic.
Student versus Parents
In this relationship, tax credit and student subsidy have distinctiveeffects. A tax credit allows parents to maintain a significant influence overtheir child's choice of institution and expenditure patterns because it is
the parent who would most likely utilize the tax credit. With a studentsubsidy, the funds are used as the student chooses, making choices inde-pendent of parents, if the student wishes.
Government Transfers to Lower Level Governmentand Councils for Higher Education
Central Governments can transfer funds to lower government levelsor to councils for higher education which then allocate these funds to in-stitutions or to individuals. Such distribution is usually done through gen-eral or categorical grants. Such a system has monetary effects similar togovernment transfer of funds to institutions.
Power Effects Such transfers shift power from the Central Governmenteither to other government levels or to councils for higher education.
Giving funds to lower level government has the obvious effect ofincreasing regional or local authority over higher education. This maymake national planning for higher education more difficult.
National councils for higher education often have the advantage ofretaining control of higher education at a high government level, but theymay also exercise autonomy beyond that desired by the Central Govern-ment. If the effects of Central Government control are counter-productive,national councils may serve as buffers between institutions and the CentralGovernment.
88
9$
SUMMARY
Where Central Government finances the higher education sector, itcan choose from a variety of finance methods. It can give funds to in-dividuals, to institutions, to other government levels or to councils forhigher education. Each distribution mode has different monetary andpower effects. Decisions on which method or methods will be used should
be based on a clear evaluation of these two effects, considered within thecultural and political realities of the country.
89
99
CHAPTER VI
National StudentLoan Institutions
IN the past ten years, the costs of higher education have increased alarm-ingly. Coupled with budget cut-backs, this has led to reduced access
to education for the economically deprived segments of populations.Besides a search for more efficient uses of available resources, a new
method of financing which uses the credit system is being considered.Credit for investment has traditionally been confined to tangible goods,such as equipment and, buildings. The use of credit to invest in non-tangible goodsespecially, educationhas recently come to be consideredas a new way to increase the future income of individuals and society.
Student loan institutions provide credit for those who are workingtowards a higher education. Student loan plans within individual educa-tional institutions are widespread and have existed for a long time, butnational student loan institutions are quite recent. In 1972, only a littlemore than a dozen national student loan institutions (SLI) existed in devel-oping countries and, mostly, in Latin America.
NATIONAL STUDENT LOAN INSTITUTIONSAS INSTRUMENTS OF POLICY
National student loan institutions are not policies in themselves, butrather instruments of policy. As such, they should be evaluated in relationto other instruments developed to carry out policy. SLI affect four majorpolicy areas: inter-generational equity; social equity; shifting the financialburden from the public to the students; and generating funds for highereducation.
Inter-Generational Equity
Where higher education is financed by fees or taxation, the oldergeneration pays for educating its young by reduced consumption. If highereducation is financed through loans, each generation pays for its owneducation. After the first loan fund is set up (by taxation, reduced govern-
90
100
ment expenditures, or newly created credit), a large part of new loans would
come from repayments of old loans, over an extended period. Thus, the
fund becomes self-perpetuating. If the number of recipients expands, asmall amount of new funds is needed. Once a fund becomes self- perpetuat-
ing,ing, no generation pays for the next one's education.
Social Equity
Governments have become increasingly concerned with redistributionof income. There are humanitarian or ideological reasons for this, as well asa growing belief that increased income equality between social classes and
regions is good and even necessary for continuous economic development.Higher education can be made accessible to qualified students whosesocio-economic class or geographical location might otherwise prevent theirenrollment. Among the ways of achieving this equality are: grants andscholarships for tuition and maintenance; subsidies; and tax credits. Theseall require either additional public monies, or a shift of resources from otherareas designed to foster social equity. SLI allow shifting the cost, partially
or totally, of this policy of equity for higher education from the general
public to the student.
Shifting the Financial Burden from the Public to the Students
Increasing the student's share in the costs of higher education can beachieved by changing or raising tuition. When private resources cannotreadily meet such increases, or when students and/or their families cannotor will not pay for higher education's increased charges under presentconditions, money made available through SLI provides a way of lesseningcurrent burdens by extending them into the future.
Generating Funds for Higher Education
This policy is achieved in different ways: higher taxes that increasepublic funds; or fund raising campaigns directed at both large foundatiorigifts and at small donations through alumni associations.
SU provide new funds through credit and, also, increase private savingsthat divert additional monies to higher education because repayments of
student loans may create extra forced savings.
EFFECTS OF STUDENT LOANS ON THE INDIVIDUAL BORROWER
In the short run, the loan makes higher education possible. Whenactual charges are lower than the costs of education, the borrower is also
91
101

getting the subsidy that is granted only to those selected to go into highereducation. He also receives subjective benefits, such as enjoyment andpersonal fulfillment.
In the long run, compared with graduates from lower levels, those whocomplete their higher education obtain higher earnings, better job security,a wider choice of jobs, and more social mobility. In the short run, thefinancial burden of a loan and assumption of a long run economic riskmust be considered by the student when he contemplates the advantages.
Burden of the Debt and Assumption of Risk
The size of the debt and the rate of repayment (interest plus principal)determine the size of the burden of the debt. The ratio of repayment toincome determines the loan's effect on the borrower. If a debt exceedsa sizable portion of life income, it can become over-burdensome becauseof its duration, the psychological stress involved, and because it reducespossibilities of borrowing on housing or for major appliances.
By taking out a loan, a student assumes all the risks of his investment.The average expected return is high but it varies widely. Low income bor-rowers are further disadvantaged because their families cannot provide asmuch economic help at times of particular needs as those of high incomeborrowers.
The consideration of the burden of debt and assumption of risks is soimportant that several plans, such as income contingency forms of repay-ment, have been proposed which are considered on p. 97.
POSSIBLE EFFECTS OF STUDENT LOANS ON HIGHER EDUCATION
In general, the efficiency of higher education is increased by the op-eration of SLI. In particular, the following effects may be noted:
Reduced Dropout Rates Those who would be forced to drop out foreconomic reasons may continue. The student's economic commitment andgoals give him added incentive to complete his studies.
Raised Intellectual Capacity of Entrants Access to higher education hasbeen based on economic, not intellectual levels. Shifting the entrancecriteria from an economic to an intellectual one increases the efficiencyof higher education because the students are more qualified to benefitfrom it. The borrower's group as a whole does better than the generalstudent body, according to a consensus of researchers in this area.
Increased Efficiency Where low enrollments relative to capacity cause
92
102
a high cost per student, higher enrollments resulting from student loans
may lower unit costs.
Curriculum Reforms Where different universities offer similar programs,whose costs are covered mostly by tuition, administrations may respond to"student economic power" (acquired by student borrowers) and offer newor more relevant courses. Universities may also improve their efficiency byexperimenting with innovations, such as shorter duration of degree pro-grams, which reduce costs to students.
When SLI create competition through indirectly supporting new privateuniversities in developing countries, this may improve the quality of educa-tion and the efficiency of the system as a whole. But when monopoly con-ditions exist and administrations are not subject to economic pressures, anincreased availability of funds to students may only result in higher costsper student through uncalled for salary raises and wasteful expenditures.
Increased Demand for Higher Education The availability of studentloans on favorable repayment termsif not accompanied by excessivetuition raisesincreases the demand for higher education. Whether this
demand should be translated into an effective expansion of the system isdetermined by broader considerations than the availability of student loans.But when expansion is considered, the simultaneous availability of fundsfrom student loans is a favorable factor for expansion.
Increased Independence from Public Funds Monies made available tothe system through student loans not only provide tuition support; the',also make the system more efficient by making it less dependent on govern-
ment support or on public fundsboth of which may fluctuate.
EFFECTS OF STUDENT LOANS ON SOCIETY
Student loans provide lower socio-economic classes greater access tohigher education. These students bring the university closer to the realitiesof society. Such opportunities eventually include in a country's decision-making process persons who are better attuned to its social needs. Further,by basing entrance requirements on intellectual rather than economiccriteria, a program of student loans benefits society by making available
a considerably greater portion of talent and energy that might have been
lost due to lack of opportunity.
OPERATIONS OF A NATIONAL STUDENT LOAN INSTITUTION
The legal nature, administrative structure, and range of functions ofSLI should vary according to the political, cultural, and economic context
93
103

of a particular country. But there are useful criteria that can apply in generalto any type of SLI.
Legal Nature of SLI
Legality may be an important determinant of a program's success.There must be some characteristic of public ownership to fulfill the institu-tion's social goals. The implications of equalizing educational opportunitythrough subsidies and manpower goals achieved through loans for foreignstudysuggest public intervention. But characteristics of private enterpriseare also vital to effective management: administrative flexibility; the highlyspecialized banking function; action against defaulting borrowers; andgreater immunity from political pressures of university students in develop-ing countriesall are handled better by the approach of private enterprise.
Ideally, SLI should combine the positive aspects of both public andprivate institutions. Either a private or a public organizationwhere theCentral Government is represented on the board of directors and can vetocertain decisions--can accomplish this.
Administration of SLI: Policy Decisions
Top management's poiicy decisions deal with two broad areas: genera-tion of funds; and guidelines for operations, which include selection ofqualified applicants, formulating policy on interest charges, recovery ofprincipal, and amounts of lending.
Generation of Funds Funds may be accrued by selling bonds to publicand/or private agencies. This is facilitated by:
Tax incentives for purchasing the bonds
Requiring private investment corporations to maintain a certain per-centage of their portfolios in SLI bonds
The government acting as a guarantor of the loans, a common pro-cedure in foreign loans to SLI.
Funds may also be accrued from the central banking system. A specialre-discount credit line for education can be provided similar to those socialor promotional credits available to industry, agriculture, or home mortgages.
There are other methods of generating funds through the central bank.These include: guarantee of subsidy of SLI notes by absorbing the initialdiscount costs of the bonds' value; and accreditation of deposits of publicfunds from various ministries, social security, retirement funds, special re-serves, etc., so that banks can earmark these funds as credit for SLI (causing
94
104 uNr.^..^.1
such funds to expand automatically with economic growth and to adjustto changing price levels).
Funds may also be generated through the transfer of public monies.When SLI are public agencies, they normally receive national funds on arecurring fiscal budgetary basis. When they are private institutions, theycan receive public funds on a contractual basis or through other agreements.
Still other ways of generating funds are possible through donationsfrom private foundations, private corporations, or from individuals. Theestablishment of an endowment savings plan within the SLI is also possible.Such a plan is facilitated by the government underwriting a share of theendowment costs. Such a plan offers the government two important bene-fits: the government's future socio-economic burden is reduced becauseof a wider base of persons with a higher education, and lower-middle andlow income groups would be encouraged to participate in long run savings
plans.
Guidelines for Operations Policymakers have to reconcile the con-flicts between social goals and the principles of sound investment. Goodfinancial practice favors low risk borrowersstudents whose parents haveproperty and other assets. A concern for greater social equity through in-
creasing access to higher education for those in low income groups can becontrary to accepted investment practices.
Granting loans to students at different stages in their studies can alsopresent a conflict. Those about to graduate represent a lower academic risk
and a shorter repayment period. But this safer financial risk must be weighed
against the long-run social considerations. Increasing access to higher edu-
cation for low income groups calls for giving preference to freshmenstudents.
Loans
There are important aspects of the loans that must be governed byspecific rules. These are: coverage of loans; annual versus complete loans;
and rates of interest.
Coverage of LoansStudent loans can cover tuition and other direct educational expenses,
transportation, and living expenses (with an allowed increase for family
support in case of marriage). Standards have to be set on limitations ofloans, including yearly ceilings, total funds borrowable, or the restriction
of funds for foreign study when training is available domestically.
95
105
Annual Versus Complete Loans
Currently most loans are given annually for domestic study. But soundfinancial and social benefits may be achieved by a commitment that assurescoverage until the degree is completed, with funds withdrawn when a stu-dent's performance is below established academic standards. On a practicallevel, this policy would cause an overall reduction of administrative costs.
Rates of Interest
Usually the management and distribution of self-suppojting funds arebased on covering the costs of administrative overhead, depreciation, andbad accounts. It is standard for interest rates to include the coverage ofpossible future losses. But the social goals of the SLI concept can be sub-stantially impaired if decision-makers are conservative and cautious withinterest rates.
Yet, if the borrower's payments after training are too high, the verybenefits that should accrue from educational opportunity will be under-mined. There is also a possible loss to society through a "brain drain" whenother regions or countries offer higher earnings that lure the new graduateawaynot only for higher earnings, but also, partially, to escape repaymentof the loan.
In order to achieve the social and redistributive effects of SLI in devel-oping countries, the interest rate should be lower than prevailing rates forany other available long-range loan and should never exceed mortgage ordevelopment loan interest rates.
If the SLI charge interest rates lower than those prevailing in the moneymarket, a subsidy has to be provided. When SLI foster greater equalityand social mobility, equalizing education has an important additional socialfunction. But this has a cost. This cost is the difference between commer-cial interest rates and the "softer" social terms advocated for SLI. BecauseSLI are meant to replace fiscal funds, lower interest rates should alsobe supported because the SLI's function would otherwise fall largely onthe government.
Terms of the Loan: Repayment Schedule
There are two basic methods of repayment of the loan: fixed andvariable schedules.
Fixed Schedule Repayment Plan: Given the initial loan, the repaymentperiod, and the interest rate, the amounts payable every year can be cal-culated. The schedule could be linear with constant payments or payments
96
106-
at any pre-agreed schedule. This repayment schedule is the same as thatfor most mortgage payments. In this form of repayment, special care isnecessary to provide flexibility whenever circumstances impose an undulyheavy burden on the borrower. Such cases would be when a borrower failsin his studies, resulting in the fact that he will not have the same jobsecurity or as much earning power as graduates; or when a borrowerbecomes unemployed, involuntarily or voluntarily, whether to pursue ahigher degree or to have a child.
Variable Schedule Repayment PlansIncome Contingency Plans: Theburden of repayment of a student loan, even over long periods of time,varies. Some plans make repayment contingent on the borrower's income.This eases the burden of repayment and increases the attractiveness ofborrowing.
An income contingency student loan involves a percentage or rate,fixed or variable, applied to the borrower's income to determine the annual
payment. It can apply to total income, income above a minimum leveldetermined by a living allowance, or income above that earned by personswith a lower educational level. An income contingency student loan alsoinvolves a maximum liability preventing overly high repayment by highincome earners which encourages them to participate in the pool of bor-rowers. Upper limits are set on annual repayments, or on the accumulated
repayments. In either case, when the borrower's accumulated repaymentsreach this limit (sometimes set at a multiple of the original principal), theobligation expires. There is a maximum term limiting the years of repay-ment. Usually whatever is still owed at that time is forgiven.
Some income contingency plans equalize the burden and also mutual-ize risks among a group of borrowers. Because the fund is replenished atthe average rate, high income earners would subsidize low income earners.High income earners could also withdraw from the plan, paying a penaltywhere the maximum accumulated repayments are a multiple of the originalloan. These plans automatically take care of the contingencies discussed
above because they are usually related to income. Some cases of complete
forgiveness of the loan also occur.
A special case of repayment applies to women. In some countriesthere are few women in higher education, but women are comprising anever-increasing number of university students. If women repay a percentage
of their own income, this means a large subsidy for females because many
women do not work after marriage. But if repayment is based on thehusband's income, the woman enters marriage with a negative "dowry."
97
107
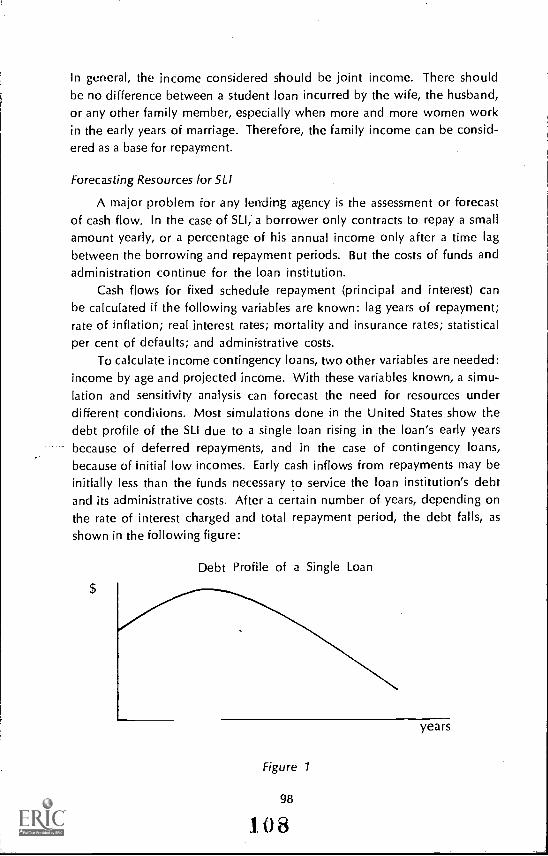
In general, the income considered should be joint income. There shouldbe no difference between a student loan incurred by the wife, the husband,or any other family member, especially when more and more women workin the early years of marriage. Therefore, the family income can be consid-ered as a base for repayment.
Forecasting Resources for SLI
A major problem for any lerrding agency is the assessment or forecastof cash flow. In the case of SLI, a borrower only contracts to repay a smallamount yearly, or a percentage of his annual income only after a time lagbetween the borrowing and repayment periods. But the costs of funds andadministration continue for the loan institution.
Cash flows for fixed schedule repayment (principal and interest) canhe calculated if the following variables are known: lag years of repayment;rate of inflation; real interest rates; mortality and insurance rates; statisticalper cent of defaults; and administrative costs.
To calculate income contingency loans, two other variables are needed:income by age and projected income. With these variables known, a simu-lation and sensitivity analysis can forecast the need for resources underdifferent conditions. Most simulations done in the United States show thedebt profile of the SLI due to a single loan rising in the loan's early yearsbecause of deferred repayments, and in the case of contingency loans,because of initial low incomes. Early cash inflows from repayments may beinitially less than the funds necessary to service the loan institution's debtand its administrative costs. After a certain number of years, depending onthe rate of interest charged and total repayment period, the debt falls, asshown in the following figure:
Debt Profile of a Single Loan
years
Figure 1
98
108
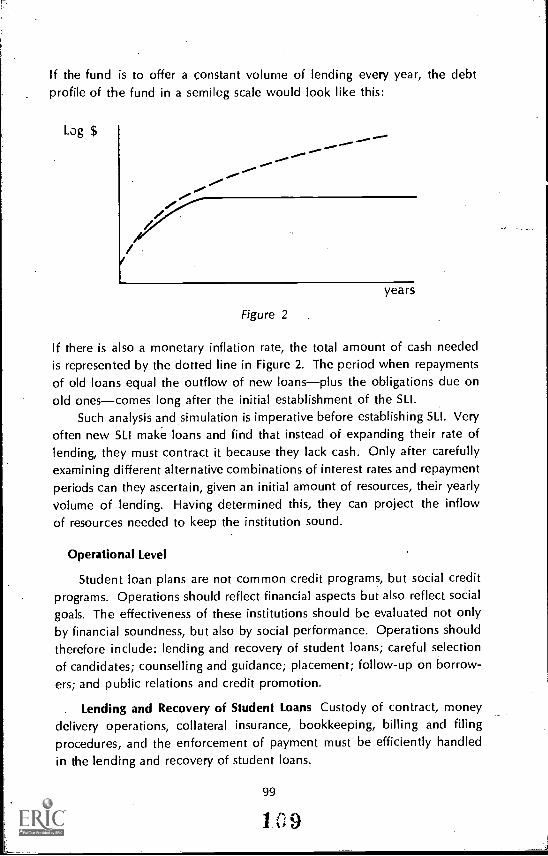
If the fund is to offer a constant volume of lending every year, the debtprofile of the fund in a semilog scale would look like this:
Log $
0
Figure 2
years
If there is also a monetary inflation rate, the total amount of cash neededis represented by the dotted line in Figure 2. The period when repaymentsof old loans equal the outflow of new loansplus the obligations due onold onescomes long after the initial establishment of the SLI.
Such analysis and simulation is imperative before establishing SLI. Veryoften new SLI make loans and find that instead of expanding their rate oflending, they must contract it because they lack cash. Only after carefullyexamining different alternative combinations of interest rates and repaymentperiods can they ascertain, given an initial amount of resources, their yearlyvolume of lending. Having determined this, they can project the inflowof resources needed to keep the institution sound.
Operational Level
Student loan plans are not common credit programs, but social creditprograms. Operations should reflect financial aspects but also reflect socialgoals. The effectiveness of these institutions should be evaluated not onlyby financial soundness, but also by social performance. Operations shouldtherefore include: lending and recovery of student loans; careful selectionof candidates; counselling and guidance; placement; follow-up on borrow-ers; and public relations and credit promotion.
Lending and Recovery of Student Loans Custody of contract, moneydelivery operations, collateral insurance, bookkeeping, billing and filingprocedures, and the enforcement of payment must be efficiently handledin the lending and recovery of student loans.
99
1.39
SLI's operations need a specialized technology in accounting, actuarialcomputation, filing systems, and data processing similar to that used inmanaging credit card operations.
Should administrative costs to recover funds be too high, the verybenefits of revolving funds will be threatened, if not completely offset.When operating expenses become excessive relative to collected funds, itmay be preferable to shift from loans to free grakits because of the system'sinefficiency. Sometimes the task of recovery of loans can be facilitatedwhen SLI are included in insurance legislation protecting other institutions,such as cooperatives, from bad debts.
Sometimes the national revenue service becomes the collection agency,whose effectiveness may be enhanced by special compensatory tax reliefor credit for loan recipients. Special tax credits for repayment of the princi-pal are desirable where the loan replaces a formerly free education. Herethe borrower is in the first generation to carry a higher burden. By repayinghis loan, the borrower pays for an education, which was formerly free orheavily subsidized, while he is concurrently obliged to meet, normal incometax payments. Special tax credits are a just compensation during therepayment period.
Selection of Candidates Established standards of student eligibility forthe level of education to be financed are applied in the initial evaluationof the applicant's ability to maintain academic standards and to completethe program. Eligibility conditions are normally of two kinds: socio-
economic status, and academic record.The first, socio-economic status, can be determined by parental income
or property and other assets.In evaluating the second, academic record, standards vary from coun-
try to country. The assessment of student ability also varies. Sometimesonly the transcript of grades is required. Sometimes, an examination isrequired. Sometimes there is an aptitude test to aid in giving vocationaladvice and counselling, as well as for determining ability to meet minimumacademic requirements. Some funds limit eligibility by restricting loans tostudents in the last two or three years of their higher education studies,especially when money is limited or when there is a reasonably low expec-tancy for repayment.
Another standard for selecting candidates is the level of education.Most funds cover a specific level: professional, post-graduate, or even post-secondary vocational training, such as nursing.
Recently, assisting the scholarship programs for secondary school stu-dents has been explored. This would increase the pool of secondary school
100
110
graduates from low-income families. Student loans may also induce border-line students to pursue higher education, when they know that at least theirfinancial barriers to further education are eliminated.
Evaluating a student's ability to meet academic standards is part of theselection process. Normally, universities also screen applicants, so thisadministrative burden can be left, partially or totally, to universities. Some-times, universities themselves create a common service, such as a nationaltesting service, to diminish. the per student cost. This service is sometimesestablished by the government.
. Counselling and Guidance Beyond the issue of SLI's making highereducation accessible is the problem of assuring 'a student's eventual success.The SLI need not maintain a vocational guidance service but it should beaware of its responsibility to assure that guidance is provided. Vocationalguidance and advisory services may already exist within the country andcan be utilized on a contractual basis. The SLI may initiate the developmentof an agency to perform such services. Counselling is especially importantto students in foreign countries, or to low-income students from rural areaswho come to the city.
Placement A specialized office with broad contacts in the governmentand private sector must help the graduates get suitable jobs. This is especial-ly true when the borrowers come from low income groups and have fewcontacts in the labor market for which they are trained.
Good placement benefits the borrower through higher incomes. TheSLI also benefits from higher paying jobs. There is less risk in their loansand they are better protected in times of unemployment.
Follow-Up on Borrowers Long-range, longitudinal supervision helpsindicate a program's success and should automatically be included in everyloan agreement. Addresses for many borrowers who move often must besystematically updated, especially for borrowers who study abroad. in
addition to data relevant to the redemption of the loan, the follow-upshould produce information, such as social mobility which shows thesocial impact of SLI.
Public Relations and Credit Promotion One management function ofSLI is to develop a good relationship with government, business, and thepublic. SLI's role in developing social equity and in promoting developmentmust be recognized and appreciated to secure financial support.
Promotional endeavors also have to be undertaken to "sell" this typeof credit to potential clients, lenders, and borrowers. Advertising the avail-
101
ability of loans to pursue higher education and its benefits to lower-incomestudents is necessary.
Credit promotion or public community relations programs can bethwarted by socio-economic and socio-cultural factors. Generally, in theless developed countries, the proportion of high school graduates in thelower income population is relatively low. Because this target populationis quite diffuse, advertisement becomes costlier than that directed at higherincom, groups.
Another obstacle is the prevailing negativism of low-income groupstoward the use of credit. Members of the so-called "culture of poverty"are exploited by dishonest moneylenders who charge illegally high rates.Parents of many of the eligible students may not have completed an ele-mentary education or are illiterate. In addition, their experience with thebanking system is largely confined to contracts with usurious "credit sys-tems." Consequently, such parents can frequently be expected to be sus-picious or, at least, reserved towards using any form of credit.
Any program aimed at "selling" the concept of student loans to thespecial groups in question will need to be designed sensitively and to becarried out carefully, so that the existing socio-economic and cultural con-straints will be overcome.
Other Functions of SLI
It has been argued that SLI should implement manpower plans. Whilesome of the student loan programs do in fact maintain a special officeresponsible for human resources, planning this activity appears to be beyondthe essential nature of the SLI. There are strong considerations against theinclusion of this function. SLI occupy only one specialized segment withinhigher education and, certainly, a very minor one in the entire educationalprocess, formal and informal.
If SLI are to operate at the low-income group level, then manpowerplanning within the SLI might have the undesirable effect of channellingonly low income students into certain types of professional training.
Undoubtedly, SLI must be aware of national manpower plans, but the taskof# implementing its own specific allocation of monies among academicfields and professions is complicated enough, without SLI's attempting toplan national human resources as well.
Most of the specially designed institutions for granting student loansalso manage scholarship programs. There are two important reasons forthis: there is a substantial economic saving because some administrativeaspects for management of student loans are quite similar to the manage-
102
112

ment of grants; and such management provides excellent flexibility in
modifying the student burden. Because individuals differ extensively andcredit norms need to be more standardized, a combination scholarship andloan can provide an almost tailored term, interest, and repayment schedule,based on individual circumstances. Such a combination also decreases theimbalance that could appear between grantsfree of future financial com-mitmentand student loans. Joining student loan and grant programsappears to be highly beneficial.
It is commendable for SLI to perform all the functions mentioned above,but they may become entangled in too many peripheral goals and neglecttheir main objective.
Keeping the operations simple is critical, and keeping overhead costslow is essential. Strict regulation of these peripheral activities through costaccounting is desirable to determine how costly they are. If they are verycostly, outside funding should be considered.
A SPECIAL TYPE OF SLI: THE STUDENT LOANDEVELOPMENT BANK (SLDB)
The lending capacity of the SLI could be increased by making it a devel-opment bank linked to the Central Banking System. Development banksare institutions created to channel resources into different sectors consid-ered strategic for economic development. National development banks areusually assisted by central banks which subscribe to their capital stock andbonds, re-finance their loans, and guarantee their obligations in the internal,as well as international markets. Development banks are also specializedinstitutions (like agricultural credit banks, industrial banks and mining banks)which mobilize resources for a specific sector.
The idea of a development bank for student loans is based on theneed to channel resources into education, which is a strategic developmentsector. It is based also on the need for a specialized institution to handlethese resources.
SLI have valid reasons to claim a recognized share in the formal creditsystem. They are specialized institutions that provide capital to a sectorthat is more complex and uncertain than the agricultural or industrial sec-tors. The complexity and uncertainty involve a higher degree of risk andcall for skillful technical specialization. SLI also have a function that is notonly associated directly with economic growth but also wth social improve-ment. Like other strategic activities that require long and special "soft"terms, the low income group students require special attention. All thisalong with existing imperfections in the capital market for education that
103
113
prevent the full exploitation of investment opportunities in this sector makeit desirable to include SLI as equal members in the organized credit systemof the economy.
The SLI as a Development Bank
The banking system requires that a chartered member undertake allthe responsibilities as well as privileges of membership. A student loaninstitution can do that. Foremost, a member of the banking system mustmake the structure of its capital conform to accepted banking norms. Thisstructure allows the multiplication of resources for lending, the so-called"financial leverage" of the institution.
Many existing financial development institutions have been formedwith the following capital structure:
Paid-in share capital 100 unitsRetained earnings
Net worthSubordinated loans
100'units150 units
Borrowing base 250 unitsOther debt (3 x base) 750 units
Total capital 1,000 unitsRatio of total debt to
net worth 9 :1
Total capital here is distributed mainly into outstanding loans andequity. The "other debt" of the institution is "balanced" by maintaininga ratio (normally 3:1) with equity. Equity, then, provides protection andsecurity to investors, earns income, and allows the institution to remainsolvent. The level of risk to investors is also reduced because of subor-dinated loans. These are loans granted by the Central Bank to a develop-ment bank, normally for 30 years without interest, and with a grace periodfor initial repayment of ten years; "subordinated" indicates that in case ofbankruptcy owners of this debt are paid after all other creditors. Thesesubordinated loans are counted in the borrowing base to subscribed capitaland, therefore, are subordinated to other debtors. The outstanding loans/equity ratio is used to guarantee the revenues needed for the institution
104
1 1 4

to meet current expenditures, profits, and to increase its reserves. Clearly,a similar structure can be used by SLI, if ways are found to obtain "otherdebts" at rates slightly lower than those charged to borrowersrates whichwould cover operating costs and still provide a rate of return to investors.
Sources of Capital for SLDB
These may include: domestic capital markets; savings generation; andinternational borrowing.
Domestic Capital Paid-in capital in the form of shares and "other debt"can be raised in the existing domestic capital markets. This can be accom-plished in three ways:
Government Enforcement
When public financial companies are started, the government com-monly dictates the amount and proportion of capital to be subscribed byother public agencies, financial or otherwise. Frequently, this type of institu-tion receives part of existing public funds, such as social security or stabiliza-tion funds. For constitutional reasons, Central Governments in most coun-tries cannot compel states and municipalities to subscribe to shares or buybonds but they can exert considerable pressure for them to do so.
Sharing in Privileges of Other Financial Institutions
Many financial institutions have special prerogatives for borrowing inthe money market. Savings banks are often required to purchase bondsissued by mortgage institutions up to' two per cent of their capital andreserves; commercial banks up to two per cent of their deposits. Sometimesmortgage bonds are tax exempt. The bank for student loans can be desig-nated as an institution that shares these important concessions with otherprivileged institutions.
Using Private Sector Resources
Private corporations might be allowed to increase capital reserves thatare tax exempt, whenever they underwrite or purchase SLI bonds. Theamount of the increase would be determined as a fraction of both presentceilings for reserves and the amount underwritten or purchased. This
mechanism might appeal to a private company because it allows the com-pany to retain bigger profits.
Generating Additional Savings It has been suggested that existingsources of savings, such as social security funds, be diverted to education-
105
1 1 5
especially for up-grading and re-training of workers. This system wouldprovide more resources for education, but would not generate more savings.Another way to provide funds for SLI would be for them also to becomesavings institutions that attract funds from lower income people. The SLIwould offer high interest rates tied into the cost index of higher education(in some developing countries inflation may run as high as 50 per cent ayear) but redemption would be given in educational vouchers or directpayments to a university for tuition, board and room, and other educationalmaterials. Redemption of savings for purposes other than education wouldbe at the usually lower normal banking savings rates.
Again, a compensatory system will have to be made available to justifythe high interest rates paid for savings for educational purposes. This canbe Rncially justified by the savings that will accrue later because of reductionof the number of future loans.
International Borrowing Foreign capital is an important source of funds
for SLI. Initiation of a student loan program has made it possible to obtainmonies from international agencies. The question of using internationalloans should be judged by its convenience to the lender and borrower.
The Lender's Point of View
The reasons international agencies provide aid are complex. Political
reasons will not be discussed here. Student loan projects are highly re-
garded in purely "developmental" terms.These loans are generally granted at less than commercial interest rates,
but they are attractive to international lenders because they represent aninput for a strategic sectoreducation; in administrative terms, the sizeof the loan is manageable, for it ranges between one and five million dol-lars; and it adapts well to the "specific project approach," as well as to themore modern "sectoral approach."
There are at least three drawbacks in making loans to SLI. First, it is
hard to shift the burden of a local currency devaluation onto the individualborrower because of equity; yet the SLI cannot alone assume the risk ofdepreciation of the exchange rate because a strong devaluation would im-
pair its capital structure.Second, the success of SLI rests mainly on the administrative capability
of the organization, and there is insufficient administrative talent in' devel-oping countries.
Third, loans for a politically sensitive sector like higher educationalways involve a considerable political risk that influences future repay-ments.
106
116
The Borrower's Point of View
Economists have lately stopped saying a country should borrow abroadonly for investments that yield exportable commodities, substitutes ofimports, or for "self-liquidating" projects. They now advocate a moreliberal- view of borrowing on the basis of the "general" effect on theeconomy. But, while there is an advantage of having more money at thebeginning, a loan also Means the disadvantage of having a sizable amountless some years later because of interest and handling charges.
A country should carefully weigh the cost of external aid against theeffects of an overall increase in productivity that will compensate forrepaying the loan in the future. It is unsound to borrow for a specificproject to solve a temporary difficulty in the balance of payments (althoughsometimes it is politically sound). Why borrow for an SLI in particular?Certainly, the import component of student loans does not seem to behigh. A country may consider foreign loans for an SLI if they have advan-tages over local financing and if conditions are more favorable than forother alternative projects. Normally, the terms for the SLI project would be"softer" than similar loans for other projects.
In any event, when the decision is made to borrow abroad, there isno justification for placing the burden of servicing a foreign credit on theindividual borrower. The reasons for using foreign credit do not pertainto the project itself, but to the economy at large. Neither can the burden
of servicing be placed on the banking institution itself because, as alreadyexplained, this would hamper its financial capabilities and, hence, its socialfunction. From the borrower's viewpoint, the burden of external servicingcan only be placed upon the Central Bank or the Central Government.
Finally, the impact of technical assistance for SLI should not be ne-
glected. The input of expertise and specialized knowledge is highly
valuable because it can prevent many blunders and can help overcomeresistances from private banking groups.
In general, national financing is preferable to the use of foreign funds.In the event of using foreign funds, external aid should not be used to sub-stitute national effort, but only to complement it.
Foreign Grants One additional financing device may have a short-runuseforeign grants. They are useful for the initial capitalization of SLI, butcannot be relied upon for the institution's continuous functioning. SLI must
function successfully with their own income and have their own structureand operations. No grant lasts. forever. Also, the knowledge that outsidehelp may rescue the institution may be detrimental to the efficiency ofits operations.
107
117
The Special Fund A student loan development bank deals with far morecomplex social problems than other development banks. To enable it toopera+e with financial solvency might require an additional method ofabsorbing extra social risks. This instrument is the special fund.
The special fund reduces the impact of the extra welfare and socialcosts and introduces a dear distinction between costs of social welfare,and the costs of financial risk. Thus, it may help prevent distortions in theallocation of funds and in the operations of the SLI. This special fund canbe underwritten by the government or by philanthropic institutions. Untilan actuarial history is available, it is important to have flexibility in the levelof resources for this fund, and financial policy must be reviewed at fre-quent intervals.
Concluding Remarks on Student Loan Development Banks
Once the principle of having an SLI is established, an institution mustbe found that can perform not only the tasks of a specialized lendingagency, such as many existing SLI do, but also generate an ever-increasingamount of resources for new loans. Public tax resources are held in checkby the competition of other public and private needs, identified througha variety of political processes. Resources available from donations aregenerally restricted by the willingness and ability of the wealthy patrons.It is only through the general credit system that an SLI has a chance of re-plenishing resources. It is better to finance SLI through the credit systemso that the SLI need not rely solely on public budgets. The burden of theincrease of credit is spread over the whole economy, sometimes througha general inflationary pressure. Thus, no more criticism should be put onhigher education than is put on other sectors because all sectors of theeconomy that get preferential treatment in the credit market exert inflation-ary pressure.
CONCLUSIONS
National student loan institutions have become important because ofincreasing budgetary pressures on higher education. But these programsinvolve a sizable amount of initial financing. Consequently, they swell thehigher education budget (or in the case of student loan development banks,they swell credit) unless an equal increase of money is received by in-creasing tuition.
In relatively well-to-do countries, the budgetary increase is offset
through government guarantee of loans granted by private banks, throughsemi-public agencies financed outside the government budget through sale
108
X18
of their own bonds, or through a semi-public agency to re-finance loansmade by banks to students.
In developing countries, where there is a shortage of investment fundsneeded for economic development, political leaders cannot ignore thecompeting sectors in spite of the strong priority of education in the alloca-tion of funds. They must look for measures to alleviate the strain on thebudget. But the easy alternative of increasing tuition to raise funds forthe loan programat least for the first ten years until repayments of anysize flow backis not readily available in developing countries.
The ideological commitment to free education in most developingcountries is strong and overshadows the broader goal of equal opportunitythat requires added resources. No wonder governments are reluctant toincrease tuition, even moderately, and content themselves with cautiousplanspartial support of subsistence costs and minimal tuition charges.
It is also not possible to generalize about the outcome of any studentloan plan because it may depend crucially on political circumstancesincluding how strong the students are as an organized political force.Where increases in tuition are possible (and under the best circumstancesthese increases must be gradual and slow), the creation of an SLI and, par-ticularly, that of a student loan development bank can be an importantfactor in increasing resources for higher education in the long run, and inincreasing the participation of disadvantaged social groups in higher
education.Where charging tuition is politically unfeasible but not coupled with a
strong opposition to private higher education, student loan institutions canbe directed at insuring the survival and growth of the private sector, whileequalizing opportunities of access to higher education.
In general, SLI offer a developing country a flexible method for provid-ing social equity in higher education, and for shifting part of the burdensof higher education from the general public to the student who is willingto risk by borrowing against increased future earning capacity. However,
the achievements of SLI should be compared with other instruments thatmay accomplish the same policy objectives.
109
119
CHAPTER VII
The Financing of OccupationalTraining
VOCATIONAL education trains persons for agricultural, industrial orcommercial occupations. Such education can be provided through a
variety of learning processes. These range from "picking up" skills on thejob to being trained in specially equipped shops by teachers using modernmachinery and teaching methods.
Because vocational training can be so diverse, its financing varies con-siderably, depending on the type of training and the institution that offersit. This chapter provides a framework for classifying different types of train-ing and reviews the financing of the most common types of programs:vocational schools, apprenticeship training, further training, retraining, andrural training.
Many countries have special national training institutions that areimportant in administering and financing different types of vocationaleducation. These types of institutions are also described. The advantagesand disadvantages of the payroll tax, the most common method for finan-cing them, are analyzed. Suggestions are also presented for overcomingsome of the disadvantages of the payroll tax.
DIFFICULTIES IN CATEGORIZING AND COMPARINGTYPES OF VOCATIONAL TRAINING
Classifying vocational education is extremely difficult because nodivision of levels and forms exists that is both satisfactory and mutuallyexclusive.
Names for vocational education often indicate different kinds ofinstitutions and student objectives. Some common names for vocationaleducation are: vocational high school training, vocational retraining, adultvocational education, industrial education, technical education, terminaleducation, cooperative education, comprehensive education, occupationaltraining or education, agricultural training, and commercial training.
Training has been traditionally provided by apprenticeship programs,
110
120

vocational, technical, and comprehensive schools, or ad hoc institutions.
But vocational and technical schools are becoming increasingly involved in
courses that upgrade and retrain. On-the-job training sometimes includes
part time study in educational institutions. Training can be administered
by government, private enterprise, or unions.
ALTERNATIVE TYPES OF TRAINING
Vocational training can be offered through educational institutions,
on-the-job training, and through a combination of both apprenticeship and
cooperative programs.
Training in Educational Institutions The main characteristic here is that
instruction occurs in a classroom environment and is completely structured.
It is usually administered by public education authorities, although it is
sometimes offered under the auspices of national training bodies or the
Ministry of Labor. Private profit-making and non-profit institutions also
provide this type of training.
The student is usually an elementary school graduate. After finishing
a pre-determined curriculum and taking examinations, he receives a degree
that attests to his knowledge and, sometimes, accredits him to further his
education in higher institutions of learning.
On-The-Job Training (OJT) This involves a program of training, but
usually lacks the pre-determined schedule of work assignments, the fixed
duration, and the related course-work of an apprenticeship. But the pro-
gram can range from structured training schedules to informal help
arrangements where the trainee works under a trained worker's guidance.
Related instruction is usually not required, but may be encouraged by the
employer or another responsible authority.
Upgrading is another form of on-the-job training. The worker is
transferred, usually to a harder job at higher grade levels. These transfers
continue until he accumulates a broad experience in his occupation.
Apprenticeship This combines on-the-job training with classroom in-
struction. The on-the-job training follows pre-determined work assign-
ments scheduled to give the apprentice broad experience in the trade's
important aspects. The classroom instruction can be given on the job, or in
privately or publicly operated schools. The apprenticeship period is fixed
and is known in advance by the trainee. An employer or public authority,
a worker's organization, or any combination of these may administer the
program.
111
121iz.

In some countries, only the apprenticeable craft occupations are in-cluded in training programs. In others, the range is much broader and in-cludes office, sales, service, and semi-skilled manual work. The apprenticeusually gets a certificate when he has completed the training and passedvarious tests of his technical knowledge and competency.
Cooperative Education Formal instruction in a particular trade, usuallyin a vocational or technical high school, is combined with employmentin that trade. In-plant training ranges from the highly structured to thehighly informal. .S.chool instruction includes subjects related to the trade,and academic subjects required for a diploma. Generally, the trainee isbelow the legal age for leaving school, and he receives a diploma when hecompletes the program. School personnel are responsible for placing thestudent and for overseeing his plant training.
The student may alternate between work and school on a weekly,monthly, or a semester basis. He may work part of the day and attendschool the other part, or at night; or he may work one or more days aweek and attend school the others. Such released-time ("sandwich instruc-tion") takes a variety of forms. In block-released programs, the traineeattends school several consecutive days, up to an entire week. This arrange-ment is consistent with both apprenticeship and on-the-job trainingmethods of vocational education. Normally, block-released time is partof the training for an individual older than the legal school-leaving age.The individual is mainly an employee, not a student. He is released fromhis job to attend related classes, which normally include only subjectsrelated to the job.
TRAINEE DIFFERENCES AND OTHER VARIABLES
Theoretically, each of these training alternatives can he given to
trainees who differ in age, education, employment status, income level,work experience, and physical and emotional health. Normally, apprentice-ship is reserved for young workers just out of school, while OJT andupgrading are intended for a much wider age group.
Shorter retraining programs for older experienced workers with ob-solete skills can be provided in an institutional setting. If a worker hasbeen out of school for a long time, emphasis upon practical shop orwork experience, instead of formal classroom studies, is appropriate.
Specially designed programs are also given to those with limitededucation, and with physical or other handicaps. The poorly educatedmight first receive basic education -and an orientation to working before
112
122
they receive specific occupational training. Likewise, special rehabilitation
programsperhaps, in shelter workshopsare held for the handicapped.
Types of trainees include not only youths, older workers and handi-capped workers, but also workers in upgrading and retraining programsWho may need special training.
Each training alternative can be classified by characteristics other thanthe kind of student. These characteristics help determine the training cost,the quality and practicality of the training, methods of financing it, and,possibly, the incidence of the costs. These characteristics include: thetraining site; administrative structure and responsibility for training; sourceof financing; the level, degree, and specificity of skill developed; the rela-tonship between formal courses and on-the-job learning; the amount ofstructure in the training process; and its duration and scheduling. Thefrequency with which elements of vocational education occur in modesof training is presented in Table 1 on pp. 124-126.
FINANCING OF VOCATIONAL EDUCATION
Such financing is very diverse and is generally influenced by theinstitution that provides or administers the training. (See Table 1.) The
financing of vocational education usually involves three parties: govern-ment, employers, and trainees. The government provides vocational educa-tion through various institutional arrangements. Public training is alwaysfinanced with fiscal resources. The revenues the public training agencyuses may come from the central budget or from earmarked taxes.
Employers provide training either in courses at the plant or withoh-the-job training. The employers contribute paid released-time, directcosts of training, and opportunity costs of men and machines. Privately
provided training may also be assisted with public funds.
The trainee helps defray the training costs by earning wages lowerthan he would if he were not in an apprenticeship program, and by goingto school on his own time.
Existing Financing Methods
The general patterns of financing occupational education by mode oftraining are presented in Table 1. The following section will give an over-view of existing financing systems, with selected examples to point outgeneral patterns and interesting variations. It will deal with vocationalschools, apprenticeship programs, programs for further training, programsfor retraining, and special rural training programs.
113
1,23:
Financing of Vocational Schools Vocational schools may be equivalentto formal secondary educational systems, or they may be particular branchesof educational structures, or sometimes completely independent sub-systems.
Vocational schools should supply skilled workers. But because of theirinability to deliver a finished product, vocational schools have becomeformal, pre-occupational systems. Most vocational schools are financedby the government. There are many interesting variations to be studied.
In the United States, the FedetdI Government provides the states withfunds on a cost-sharing basis. It also provides money for research andevaluation of vocational training programs. Funds allotteu to each stateare proportional to its population in designated age groups and to its
"allotment ratio." This "allotment ratio" depends on the state and nationalaverages of the per capita income. This type of allotment formula does nottake into account the manpower and training needs of the particular state,which is a weakness.
In Switzerland, vocational schools are financed by the cantons andthe Federal Government, which pays from 30 to 50 per cent of the costsin inverse relation to the canton's economic potential.
In the Netherlands, the Central Government bears all costs of eitherprivate or public post-primary schools on a budget proposal basis. Dropoutrates above certain limits may cause the loss of public support for schoolsin such a program.
In Sweden, vocational schools are part of the secondary comprehensivesystem and are publicly financed. Students at vocational schools get nofinancial support. Only when they are in post-secondary vocational schoolsdo they receive support.
In East Germany, the government not only finances instruction butalso provides lodging, personal allowances, and practical training in enter-prises. Sometimes businesses provide practical training and personal allow-ances to students. In other cases, instruction is financed by income fromthe student's production on the job,
In Bulgaria, training for production is being provided in schools byengineers, technicians, and skilled workers, supplied and paid by theenterprise through special arrangements with the school. One-third of theincome from student production goes to students, and one-half to improveschool facilities and equipment.
In Hungary, students get an allowance based on the occupationentered and on personal performance. The allowance is higher for those
114
12 -4
apprenticed in jobs that demand more technical skills, and for outstandingperformance.
In Thailand, public trade schools, commercial and industrial secondaryschools, and agricultural schools are financed by the Central Government.But privately financed training in vocational schools is also significantrepresenting 27 per cent of the total vocational school enrollment. Sim-ilarly, in Finland, more than 40 vocational schools run by industry areoperating successfully.
Financing of Apprenticeship Training Programs Formal apprenticeshiptraining programs usually bind employers and trainees to legal regulations,
either within the Labor Code or through special apprenticeship acts. These
regulations establish:
the wage scale during apprenticeship
the length of apprenticeship and subsequent indenture
fringe benefitsboard and room, released time to study
fees paid by the trainee.
In the Cameroons, the employer must pay an apprentice on an upward
sliding scale. The trainee gets at least one-third of the minimum wageafter the first semester, half of it after the first year, and the minimum wageafter two years. Room and board may also be provided by the employer,
who may deduct these costs from the trainee's allowance-up to 50 per centof the legal allowance. The employer may be guaranteed that the appren-
tice either continue in his service for two years or pay an indemnity.
Similar arrangements exist in Zaire, Gabon, Rwanda, Algeria, Mauritius,
Ceylon, India, and Australia. All of these programs place part of thefinancial burden on the trainee himself, in the form of lower wages and
long indenture.If this burden becomes too heavy, the dropout rate from apprentice-
ship increases. In Italy, apprenticeship regulations are most advantageous
to employers. They try to extend the apprenticeship as long as possible.
The result has been a high dropout rateoften as high as 60 per cent.
The payment of fees by the trainee is infrequent today, but the custom
of paying a premium to the employer in exchange for training is still prac-
ticed in Kenya. It was recently abolished in New Guinea and Papua.
In the Fiji Islands, free time for theoretical training is compulsory. The
employer must arrange for large blocks of released time. The programs
in the Cameroons, and other countries mentioned that have similar arrange-
115
125

ments, also entitle apprentices to free time for attending theoretical coursesor even for participating in literacy courses.
Government participation in apprenticeship training is usually morethan that of a monitoring agency because the government shares in thefinancing. In the simplest systems, as in the Fiji Islands, the governmentforms trade' advisory panels. These guide business enterprises on trainingmatters and also provide job training guides for specific trade apprentice-ships. An Apprenticeship Council, created and supported by the CentralGovernment, is made up of representatives of employers, trade unions,and government officials. The Council administers a tool allowance schemeand reimburses employers for the transportation costs of apprentices at-tending block-release courses.
In the more comprehensive systems of financing, the governmentfinances apprenticeship programs and other out-of-school training throughearmarked taxes, such as the payroll tax, the turnover tax, or a per workertax.
The degree of government cost-sharing depends on whether theoreti-cal courses are developed on an institutional basis, or whether the govern-ment compensates a private enterprise for expenses incurred. This
compensation can be made through deductions from the apprenticeshiptax, or through direct reimbursements by the levy board to undertakingsexcluded from the levy system, as in France.
Many governments finance the theoretical part of apprenticeshipprograms by paying for enrollment in vocational schools and correspon-dence courses. East Germany pays for special training schools and for thelodging of apprentices. Students in these basic training schoolsregulatedseparately from vocational and technical schoolsmay also receive amaintenance and training allowance, with a familial supplement if neces-sary. The decision on allowances is made by local committees, and thefunds are provided by the particular district.
In Denmark, both industrial associations and the Central Governmentfinance schools. These schools provide one to two years of basic theoreticaltraining. This reduces the financial burden of small-scale enterprises. Theydo not have to pay students wages during the pre-vocational period orduring a non-productive period. The on-the-job training period is also
considerably shortened.
Occupational education training in Finland has taken a differentapproach since 1967. Training is provided by employers on a voluntarybasis and the Central Government pays for theoretical instruction, a sub-sistence allowance for apprentices, and for books and other training aids
116
126
through a standard refund for all trainee expenses. Guidance and aid
services are still provided by public authorities. This approach has im-proved the overall system. The new system requires increased amounts ofpublic funds, but the anticipated reduction of money needed by vocationalschools will most likely produce an overall savings.
Financing of Further Training Programs Several countries have recentlyrecognized that workers must upgrade and update their knowledge andfurther their skills beyond the initial apprenticeship training programs,detailed in the four preceding sections. By definition, such further educa-tion and training is intended for large sectors of the population. Trainingmethods involve large-scale. operations and low unit costs, such as cor-respondence, television, and part-time courses.
Financial arrangements and legal provisions for further training havebeen generally flexible, cautious, and very openpossibly due to in-
sufficient experience. Central Government subsidies are generally available,
but heavy financial involvement tends to be avoided. Employers may re-ceive financial assistance from the Central Government towards costs of
training and wages of the trainee. The individual also contributes with his
opportunity costseither in time and effort, or by getting a lower salary
during part-time traiWng or cd kring a leave of absence.In France, "further training" programs involve a much deeper com-
mitment to study for a very limited number of workers. Those with more
than three years' seniority may take a leave of absence up to a year for full-
time study, or 1,200 hours off the job for part-time study to improve andupdate job skills. No more than two per cent of an enterprise's total
payrollif it has more than 100 workersis allowed such a leave. For
enterprises with fewer workers, the time limit is two per cent of the total
number of hours worked.In Norway, professional associations sometimes finance upgrading and
retraining outside the university system. Although existing educationalinstitutions cooperate, the program is essentially a private one. Vocational
and technical schools, financed by the Central Government, have also
participated in programs for retraining and further training.Rumania provides further training in an act enabling any enterprise
socialist organization, public body, or private undertakingto offer train-
ing. Both part- and full-time, this training covers all levels of workers, from
production to management, and all sectors, from public services to produc-
tion. The Ministry of Labor is responsible for coordinating and supervising
the length, form, and content of the courses. It also determines the kind
of financing arrangements.
117
127
Yugoslavia established a permanent system for further education thatplaces the entire responsibility and financial burden on workers and enter-prises. Training costs are covered by a tax on income. Training is no longera state service but a responsibility of all those involved. Such training isessentially community-managed.
In the Soviet Union, compulsory provisions for further training haverecently been made. Workers who did not attend vocational schoolsreceive special attention. The upgrading courses have three stages, eachleading to a higher skill category. Financing is determined by the appro-priate ministry for a particular enterprise within an industry.
In Poland, 3.5 million workers were annually enrolled in correspon-dence and evening courses by the end of the 1960's. These courses werefinanced by the Central Government through the ministries of eacheconomic sector, by central cooperative organizations, by worker-studentfee payments, or by enterprises paying for their own workers. It has alsobecome common for the enterprises to provide practical training concurrentwith correspondence courses. In 1961, out of 40 million Chinese industrialworkers, some 25 million were enrolled in spare-time educational courses.The televised University of Peking (which had 35,000 students in 1961)has had encouraging results.
The Ivory Coast recently established an initial and further trainingcommittee---without an independent budget. The committee's membersprovide needed funds from the institutions they represent. In Latin
America, the task of further training is sponsored mainly by the sameagencies that provide basic training, and the sources of funds are, there-fore, those of these institutions.
The Financing of Retraining Programs Retraining deals with the unem-ployed adult, with training those whose jobs are threatened (as in collectivelay-offs), and with "accelerated training"intended to correct certain im-perfections in the labor market and to make changing trades easier.
Provisions for retraining exist primarily in countries with advancedsocial legislation. Most trainees in these countries are unemployed andthe governments must generally finance the trainees' maintenance and theinstitutions' costs. Some enterprises have voluntarily met these costs,especially where collective lay-offs were caused by automation, use of newtechnologies, or shrinking markets.
In Austria, the Federal Government makes grants available for trainees'monthly allowances, and also to employers to cover up to 50 per cent oftheir direct and indirect costs. Interestingly, employers who do not profitfrom the retraining receive full reimbursement for the costs of retraining.
118
128
In West Germany, the costs of retraining are shared by the FederalGovernment and the Lander Statesa similar arrangement exists in Switzer-land between the Government and the cantons. West German personsunder 30 years of age receive living and training expenses. Besides standardminimums, they can obtain interest-free loans, repayable three years afterthe completion of their training.
In East Germany, either the Central Government or the enterprise fi-nances vocational retraining. If the enterprise finances the training, theCentral Government pays for teacher salaries and student lodgings. Traineesreceive allowances and familial stipends, even during the initial training.
In Russia, when automation, mechanization, or higher productivityputs workers out of jobs, the standard regulations provide for mandatoryretraining in new occupations. This type of training is financed by theministries of the participating sectors.
Many developing countries have recently begun to combat unemploy-ment through retraining and training programs. In Upper Volta, Gabon,Iraq, Ceylon, and Colombia, agencies and centers are providing vocationaltraining. In Brazil, the courses of accelerated training are financed by theFederal Government.
The Financing of Special Rural Training Programs The training of farm-ers and rural craftsmen involves different financing problems. Taxes onagriculture are generally difficult to administer and cannot be counted onto provide resources. Also, it is difficult to find employers or patrons toprovide training programs, as in the industrial and commercial sectors.For these reasons, most rural training is financed by government and self-supporting activities.
In Spain and Italywhere rural population still represents one-thirdof the total population, and where rural products are still an important partof exportsthe need for training programs and facilities has been recog-nized. There are proposals for training young persons in rural areas (where-ever they happen to live) which recommend using mobile units, the costsof which are to be financed by the Central Government. Special governmentfinanced apprenticeship programs have also been proposed, involving ag-ricultural enterprises and the active cooperation of several other agencies,that provide teaching staff and equipment.
Switzerland has also outlined a new policy for vocational training inagriculture, based on one to two years of apprenticeship and, at least, twosubsequent terms at an agricultural school.
In Poland, three levels of agricultural schools were established. Basic
119
129
r-
schools providing two or three years of post-primary training were not verysuccessful. There has been an increasing emphasis on post-secondaryschools to provide skilled staff for state agricultural enterprises or ruralcooperatives. In addition to pa-ying training costs, these schools offer boardto some of their students. Since 1960, several agricultural colleges have beenestablished to train agricultural technicians and to offer correspondencecourses for rural adults. Practical instruction on dealing with suppliers, cus-tomers, and local agricultural authorities are stressed. The colleges appearto be partially self- supporting.
In recent years, many African countries have created centersfinancedby the Ministry of Labor (Central Government)for the accelerated trainingof rural artisansmainly masons, blacksmiths, weavers, and carpenters.Trainees get a monthly allowance, and money to purchase a basic set oftools and materials.
Such a program has been initiated in Upper Volta. Senegal recentlyestablished a committee for rural training. This committee studies thespecial problems posed by rural vocational training, carries out research,finds solutions to agricultural training problems, and coordinates policyobjectives among different agencies. This committee's activities are financedfrom the budget of the Central Government.
SPECIAL NATIONAL TRAINING INSTITUTIONS AND THEIR FINANCING
As mentioned earlier, the financing of occupational education is relatedto the type of institution administering the training programs. Many coun-tries have special national training institutions that are important in admin-istering and financing different types of vocational education. These insti-tutions share common characteristics.
They compete with both the formal educational systems and the train-ing offered by the enterprises that have training programs. These ad hoctraining institutions may be the country's only vocational training body,they may co-exist with vocational, technical, and comprehensive schools,or they may even co-exist with apprenticeship programs. Generally, thesead hoc institutions are financially strong. Their most common source ofincome is the payroll tax, also called the training levy. Most of the institu-
ns financed by a payroll tax tend to provide the training themselves.rly of these ad hoc institutions have the legal power to force enterprises
0_ ,Ivide and to participate in the financing of vocational training.These ad hoc training institutions can be autonomous public agencies
or national private agencies that are created by law or decree. They canalso be established as central boards or committees responsible for training
120
130
instructors, researching vocational training, and distributing funds for
training.The organizational structure of these ad hoc training institutions varies.
In large countries, the institution may follow regional divisions. When theindustrial sector is well-developed, the institution may follow the patternof industrial sectors. The United Arab Republic has committees for bothregional and industrial activity.
In Dahomey and Gabon, a national labor council compels public andprivate enterprises to provide and pay for vocational training. In Iraq, theMinistry of Labor may compel employers with more than 50 workers tosupport training in an ad hoc vocational institution.
India has central training institutes and industrial training institutes indifferent regions. These serve smaller enterprises, which bear the costequally with the government. Employers with more than 500 workers arerequired to provide and finance the training themselves.
Most Latin American countries have ad hoc training institutions fi-
nanced directly from the national budget or through a payroll tax. In Brazil,
SENAI (National Service of Industrial Apprenticeship), a private autonomousagency, is financed by a payroll tax. SENA (National Apprenticeship Service)
in Colombia is a public autonomous agency. CENDAP (Centro Nacionalde Desarrollo, Adiestramiento y Productividad) in Guatemala is a semi-autonomous agency, financed by both government and contributions ofprivate industry, not by a payroll tax.
The Payroll 'Tax Method of Financing Vocational Education
This method has been extensively recommended by vocational educa-tion specialists and international organizations such as the ILO. It is beingadopted increasingly throughout the developing countries of the world.The effects of payroll tax financing on operating vocational training systems,and on employment and economic efficiency are significant and should be
analyzed.
The Payroll Tax as an Earmarked Tax Technically, a payroll tax is anearmarked indirect revenue tax. Earmarked payroll taxes are convenientbecause they assure revenue and are easy to collect. The history of edu-cational finance also shows the introduction of many innovations and im-provements in connection with the use of earmarked funds. But earmarked
taxes for education have been criticized for introducing both rigidity ingovernment decisions, and obstacles in planning.
Developing countries have an added objection to the payroll tax. The
121
131
wage-earning sector is usually the economy's fastest growing sector. Afixed levy on this sector means that resources for vocational educationalso would grow faster than those Of the rest of the economy. If funds areonly spent on the particular sector that is being taxed, as they usually are,there is a tendency to waste resources, just because they are available. Ifthe industrial sector payroll grows at eight per cent yearly, while employ-ment in that sector increases by only four per cent, and training is confinedto industrial training, available training resources will grow at eight percent, and available trainees will increase by only four per cent. Becausethe money available per trainee grows constantly, it leads to such ineffi-ciencies as perpetuating useless courses, higher overhead costs, and highercapital costs.
The effects of some of these inefficiencies can be overcome if the ear-marked features of the tax are mitigated to allow expenditures, not onlyfor vocational education in the same sector, but also in other sectors.Funds collected in the industrial sector could well be used to providevocational education in agriculture. Periodic revisions in the tax rate aremost necessary to insure that the rate is not unduly high. An earmarkedtax is only useful in providing a "safety net" for funding; it should notproduce a continuous windfall of funds.
Bad Effects of the Payroll Tax A major objection to using the payrolltax to finance training is the adverse effect it has on unemployment indeveloping countries. One of the major obstacles to job creation in de-veloping countries is the persistent use of technology that does not cor-respond to the availability of a country's resources. This difficulty arisesfrom the artificial distortion of the relative costs of capital (machinery) andlabor. Many factors cause distortion: preferred exchange rates that cheapenthe import of machinery; social benefits and policies, including minimumwage legislation, that push up the cost of labor; and high tariffs imposedto protect import-substituting industries that are mostly more capital-in-tensive. All these factors influence management to substitute labor withmachinery, thus increasing unemployment.
And the payroll tax exacerbates this problem. It raises the price oflabor and induces management to substitute machinery for labor. Thisdrawback could be improved if the tax-base were broadened to includecapital. The tax would then become a value-added tax (VAT) on theparticular industry. Special duties for training can also be imposed onimported machinery. This is appropriate since training is designed to usesuch capital and can be considered part of it.
A more progressive view, and one that would create more jobs, would
17.2
J32
fix different rates for capital and labor, taxing capital more heavily thanlabor.
The Impact of the Payroll Tax on Small Industries The modern sectorthat is heavily capitalized can more readily adapt to changing costs ofcapital and labor. Small factories are hampered because of lack of capitalor flexibility to choose methods of production. In many countries, the pay-roll tax excludes enterprises with ten workers or less. But this cut-off levelmay be inadequate, since it may include only a fraction of small industry.
The payroll tax penalizes small- and medium-sized enterprises -thatutilize overtime payments because they cannot arrange for different factoryshifts as easily as large firms do. Taxing overtime labor costs provides anincentive to mechanize, which contributes to unemployment.
Small industries also are penalized because they cannot provide on-the-job training. Most countries allow firms to deduct training expensesfrom the accrued payroll tax. This system discriminates against small enter-prises because they do not employ enough trainees to have even minimum-sized classes for needed training courses. Larger firms, on the other hand,can organize full courses for many different skills, including the upgrading
of management.Tax deductions for training costs benefit those firms that would have
been training their own personnel, in any case; especially when the trainingis for jobs that are specific to an industry, or where the industry is operatingin a monopsonistic labor market (i.e., where the industry is the only em-ployer in the area).
There are two basic corrective measures. One is application of a VATwith a graduated rate based on a firm's size. Smaller firms would be taxedproportionally less, which would solve the inequity of the tax burden be-tween small and large firms. Alternatively, small firms can be organizedinto "training cooperatives" to achieve economies of scale of training andgreater efficiency. But this type of cooperative effort requires strong gov-ernment support with finance and administrative resources.
SUMMARY
Vocational education involves many types of occupational training thatare difficult to define precisely. The type of training varies according tosite, administration, curricula, type of student, methods of teaching, andso on.
Financing these types of training is also varied. In spite of many varia-tions, recognizable patterns of financing vocational schools, apprenticeship,retraining programs, etc. exist. This is so because nations tend to imitate
123
133
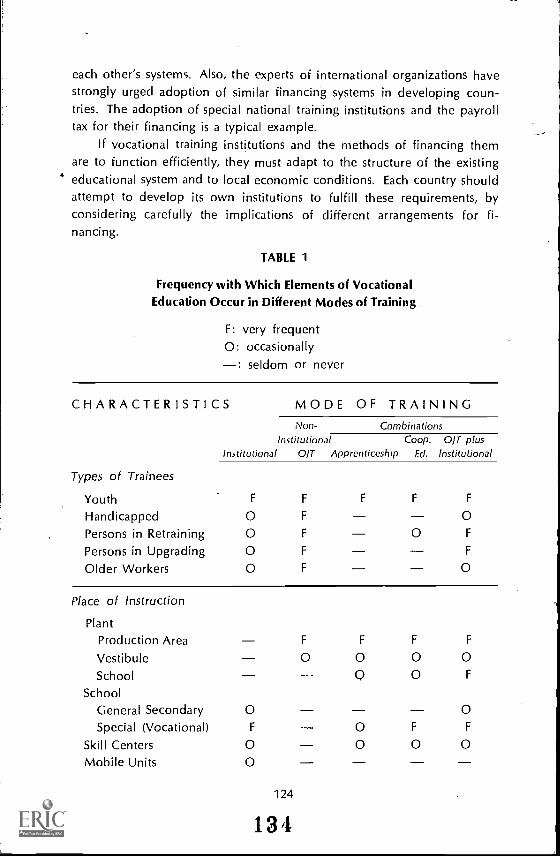
each other's systems. Also, the experts of international organizations havestrongly urged adoption of similar financing systems in developing coun-tries. The adoption of special national training institutions and the payrolltax for their financing is a typical example.
If vocational training institutions and the methods of financing themare to function efficiently, they must adapt to the structure of the existingeducational system and to local economic conditions. Each country shouldattempt to develop its own institutions to fulfill these requirements, byconsidering carefully the implications of different arrangements for fi-nancing.
TABLE 1
Frequency with Which Elements of VocationalEducation Occur in Different Modes of Training
F: very frequent0: occasionally: seldom or never
CHARACTERISTICS
Types of Trainees
Institutional
MODE OF TRAININGNon-
InstitutionalOJT
CombinationsCoop. OJT plus
Apprenticeship Ed. Institutional
Youth F F F F F
Handicapped 0 F 0Persons in Retraining 0 F 0 F
Persons in Upgrading 0 F F
Older Workers 0 F 0
Place of Instruction
Plant
Production Area F F F F
Vestibule 0 0 0 0School Q 0 F
School
General Secondary 0 0Special (Vocational) F 0 F F
Skill Centers 0 0 0 0Mobile Units 0
124
134
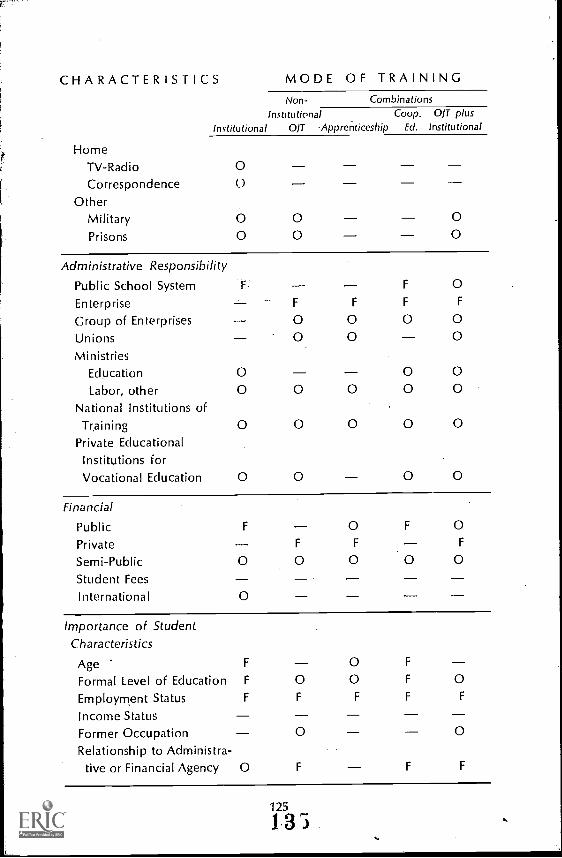
CHARACTERISTICS
Institutional
MODE OF TRAININGNon- Combinations
Institutional Coop. OIT plusOIT -Apprenticeship Ed. Institutional
HomeTV-Radio
CorrespondenceOther
MilitaryPrisons
00
O
000
00
Administrative Responsibility
Public School System F F 0Enterprise F F F F
Group of Enterprises 0 0 0 0Unions 0 0 0Ministries
Education 0 0 0Labor, other 0 0 0 0 0
National Institutions ofTraining 0 0 0 0 0
Private EducationalInstitutions forVocational Education 0 0 0 0
Financial
Public F O F 0Private F F F
Semi-Public 0 O O 0Student FeesInternational 0
Importance of StudentCharacteristics
Age F 0 F
Formal Level of Education F 0 0 F 0Employment Status F F F F F
Income StatusFormer Occupation 0 0Relationship to Administra-
tive or Financial Agency 0 F F F
125
1-3,
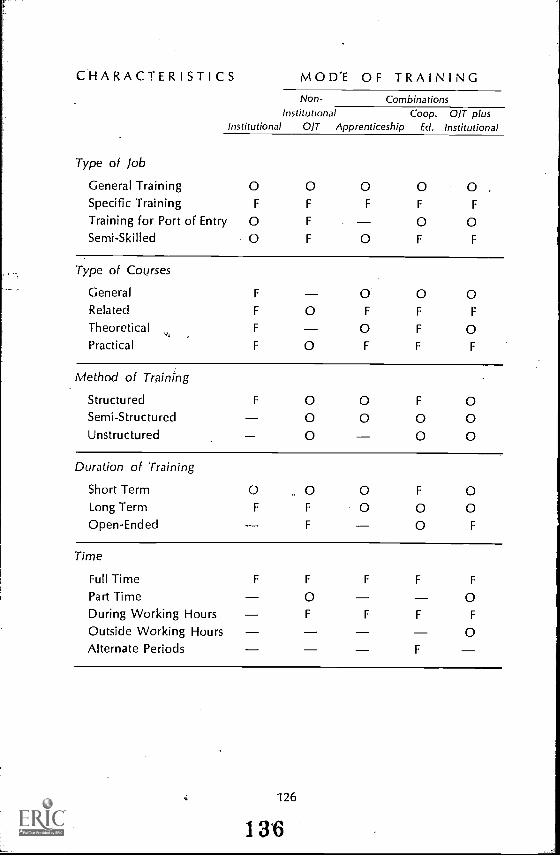
CHARACTERISTICS
Institutional
MODE OF TRAININGNon- Combinations
Institutional Coop. OJT plusOJT Apprenticeship Ed. Institutional
Type of Job
General TrainingSpecific TrainingTraining for Port of EntrySemi-Skilled
0F
00
0F
F
F
0F
0
0F
0F
0F
0F
Type of Courses
General F 0 0 0Related F 0 F F F
Theoretical,>,
F 0 F 0Practical F 0 F F F
Method of Training
Structured F 0 0 F 0Semi-Structured 0 0 0 0Unstructured 0 0 0
Duration of Training
Short Term 0 0 0 F 0Long Term F F 0 0 0Open-Ended F 0 F
Time
Full Time F F F F F
Part Time 0 0During Working Hours F F F F
Outside Working Hours 0Alternate Periods F
126
13'6
CHAPTER VIII'
Recurrent Education
USING education to achieve equality has been a powerful and persistingidea. Many countries have tried various strategies to improve
education's effectiveness. One approach stresses the equalization of re-sources, another stresses curriculum efforts. But all these strategies workwithin educational structures that prepare youth for the adult world.
Only recently have some questioned this approach, asserting that youthshould not monopolize educational opportunities for improving society.This new philosophy calls for a new way of relating an individual's life tothe educational system. In turn, this leads to a strategy that changes thebasic educational structure, rather than one that merely tries to patch updeficiencies. This strategy is called recurrent educationmaking educa-tional opportunities available throughout an individual's life.
This chapter will describe how a recurrent educational system mightwork; the changes necessary to implement a recurrent educational system;specific ways to finance such a system; and the feasibility of introducingrecurrent education in developing countries.
A RECURRENT EDUCATION SYSTEM
In a recurrent educational system, educational opportunities are avail-able throughout an individual's life. This eliminates the necessity of squeez-ing education into the early years of life.
Such a system should be differentiated from adult education programsand occupational training programs of many countries which are informal,part time, or concurrent with employment, and which usually involve spe-cific training or remedial work. A recurrent educational system is full time
and provides access to still further education. It attempts to combine formal
and non-formal education into one complementary system. In addition,it integrates the two worlds of school or university and work in order tobring aspirations in line with economic and social1 realities.
Recurrent education need not conflict with thp concept of compulsory
127
137
education. A system could combine both types of education. An individualwould receive 16 "educational tickets," ten of which are to be spent forcompulsory education between the ages of six and 16. The remaining six,each representing a year's tuition, might be used at any time in a person'slife. The curriculum could be arranged in units of study. If the studenthas been away from school for many years, he may first need refreshercourses. Units of study would allow for flexibility of interest and rate oflearning. A certain number of units would qualify him for a higher level ofinstruction.
Recurrent Education's Remedial Effects
Recurrent education may be an effective way to remedy the harmfuleffects of existing educational systems upon an individual, his society, andthe goal of equal opportunities.
Correcting Harmful Effects on Individuals Children from poor familiesnow enter the educational system disadvantaged. Their poor language andreading abilities and other handicaps result in lower levels of achievementand motivation. The influence of the homeoften stronger than in-dividual desire for educationif negative, can cause low motivation. Butin a recurrent education system, only those with high motivation participatethe system is not compulsory and an individual may leave at will. He
may also have a "second chance" for an education later in life. If he failedin school as a youth, all avenues for success are not closed.
Recurrent education has a broader motivational effect. It frees educa-tion from an occupational orientation. Learning may be pursued for learn-ing's sake during leisure time.
In addition, recurrent education would be highly beneficial to womenwishing to further their education or enter the labor market after raisingtheir children. This opportunity is denied a large number of women inpresent systems of many countries.
Correcting Harmful Effects on the Society The present system alsocauses occupational problems. Education is supposed to provide entranceinto the labor market. But in many countries, there is insufficient knowledgeof the nature and amount of education needed for various occupations,or of changes in demand for occupations.
A recurrent educational system would insure more effective interactionbetween education and the socio-economic sector than now exists. It wouldallow people to change their occupations more easily during their lifetimeand would give more specific information on a society's occupational needs.
128
138
Correcting Harmful Effects on the Goal of Equal Social OpportunitiesAt present, there is considerable sodal selection below the university level.This favors the upper class and the growing middle class, without offeringother avenues for social participation to the lower classes. A split andunequal society results.
Recurrent education offers increasing social equity because educationis available throughout an individual's lifetime. In addition, recurrent edu-cation will help equalize the value of human activities, will better the rela-tions between the generations, and will give different social groups in-creasingly similar experiences. More generally, a recurrent educationalsystem can reduce a growing irrelevancy of the educational system to othersectors of human activity, so that the values and standards of all activitieswill be more harmonious.
IMPLEMENTING RECURRENT EDUCATION
A recurrent educational system has not yet been tried in any country.Its advantages are only theoretical. Moreover, it is not a panacea for alldeficiencies of either present educational systems or social structures. In
addition, other societal structures would have to change to accommodaterecurrent education. This raises some concerns about implementing re-current education. Implementing recurrent education involves changes intwo areas: existing production systems and existing educational structures.
Changes in Existing Production Systems The most significant changeswould occur outside the educational sphere. Industrial work scheduleswould have to be more flexible so individuals could take leaves of absencefor full-time study. It would also be essential to insure that after a periodin the educational system, employment would be available. Being a studentwould again have to be considered a respectable pursuit.
Changes in Existing Educational Systems If recurrent education meanseducation after the basic compulsory level, changes in that part of theeducational system will affect secondary and higher education in particular.
Several changes might take place on the secondary level. Recurrent
education would probably tend to make the first part of secondary educa-tion comprehensive and possibly standardized. Upper secondary educationbeyond the compulsory level could become part of the recurrent system.Occupational skills could then be leaned without the stigma of being"tracked" at an early age. Recurrent education could also reduce thenumber of secondary trade schools which are often unresponsive to cur-rent needs of the labor market. Occupational skill courses could be a
129
139
part of the normal curricula offered in a recurrent educational system.There would also be effects on existing higher education structures.
Most likely, recurrent education could relieve some of the pressures forproviding mass higher education without diminishing opportunities forobtaining it. Recurrent education would also probably increase access tohigher education. Individuals will become more inclined to using the edu-'cational opportunities open to them later on in life. Existing adult educationprograms could be easily integrated into a recurrent educational system asparticular educational units.
FINANCING RECURRENT EDUCATION
Because financial resources are alwaYQ scarce, the availability of fundsfor recurrent education becomes a crucial area of concern. Recurrent edu-cation can be financed in four ways: from public funds, private enterprise,participant payment, and special funds.
Public Funds Funds from the public sector are already devoted toeducation. Some could be divehed to recurrent education but additionalfunds would still, have to be raised. This would raise taxes, and there isthe problem of who should pay these taxes. Probably the burden will fallon individuals in lower and medium income brackets. Even if private enter-prise is taxed, it can easily shift the tax onto the consumer through priceincreases. The capital market might provide financing, but the interestthe government must pay ultimately comes from taxpayers. Such a systemwould help financiers more than is necessary. There is still another problem.The way the government spends funds for recurrent education throughgrants, loans, stipends, or vouchers could either fulfill or hinder politicalintentionsand could benefit some participants but harm others.
Private Enterprise The willingness of private enterprise to invest inrecurrent education will depend on the goals and content of the educa-tional system and the amount of eventual profit. Private enterprise willinvest in a program if the results will be beneficial to them.
This might- cause private enterprise to favor recurrent education pro-,
grams with practical orientations. Further, their investments would probablynot involve programs for slower learners. Such private investments shouldbe carefully scrutinized by public authorities. Control over investments onthe part of private enterprise is only natural but may be detrimental to arecurrent educational system. If private investment is the sole source offinancing for recurrent education, it may come to be more an elaboratesystem of occupational training than a new system of general education.
130
140
Participant Payments If the other methods of finance are used, theparticipants already pay indirectly through taxes or cost-shifting by industry.Some assert that if the individual benefits most from educational programs,perhaps he should finance them directly. But those people likely to benefitmost from recurrent education may not be willing or able to pay. In gen-eral, the participant will probably be more unwilling to pay, the less rele-vant the contents and aims of the educational program offered.
There are additional aspects to participant financing. These involveopportunity costs of earnings foregone while participating in recurrent edu-cation. Also, there are problems of a person's financial responsibility forthe support of his family and for his contractual obligations while par-ticipating in recurrent educaticin.
Special Funds There has been a suggestion that combines the positivefeatures of the above three sources of finance and, at the same time,separates the control of the recurrent educational system from these sourcesof funds. This proposal suggests the pooling of resources from public andprivate enterprise into a fund. Money presently used for post-secondaryeducation could constitute the initial base of funds to be collected. Thisfinancing plan is particularly possible where private enterprises make in-creasing contributions to education. Moreover, policy decisions could beseparated more easily from the interests of donors, and participants mightbe granted decision rights, even if they do not make any financial con-tributions.
FEASIBILITY OF RECURRENT EDUCATION FOR DEVELOPING COUNTRIES
Recurrent education may provide an alternative for developing coun-tries wishing to change their present educational systems. But implementingrecurrent education can present several problems that must be carefullyconsidered. First, it requires several major changes in both existing produc-tion and educational systems that will probably be difficult to achieve.Second, a recurrent educational system would require a large amount offunds from a public finance system already burdened. Third, there aremany planning problems. In the initial years of such a system, it wouldbe difficult to plan curricula because of the difficulty in estimating potential"users." Because of the required curricular diversity and variation resultingfrom user demand, specialized teachers, texts, and equipment would raisethe costs of education significantly. Fourth, cities offering recurrent educa-tion reinforce the already strong rural-urban migration.
Because implementing a recurrent educational system requires such
131
141
a marked departure from existing educational systems, recurrent educationai.-7ears practical only if it is introduced gradually into a country whichalready has a firm foundation of adequate basic education and sound fi-nancing. Unfortunately, these conditions are seldom found in developingcountries.
132
142
CHAPTER IX
Financing EducationalBroadcasting
THE use of radio and television for education is increasing in most coun-tries. Consequently, techniques for financing such broadcasting are
receiving considerable attention among educators and government officials.These techniques are numerous. This chapter presents only those tech-niques which are linked specifically to the broadcasting industry. Financingeducational broadcasting from general budgets does not differ from thefinancing of any other educational expenditure through the general budget.Nor does private financing of broadcasting through donations and giftsdiffer from private financing of any other educational project. The alter-natives presented in this chapter are evaluated against criteria helpful indeciding which financing method is best for a particular country. Some ofthe methods presented here will be beyond the needs of developing coun-tries. But it is useful to see the wide rang," of possibilities when deciding ona financing alternative.
CRITERIA AND FORMS OF FINANCING
There are four basic criteria with which to evaluate financing of edu-cational broadcasting: the adequacy of funds, their stability and growthpotential, their neutrality in the economy, and payments and benefits. Thefirst three criteria were discussed in Chapter III. The fourth, paymentsand benefits, refers to the connection between those who pay for a serviceand those who benefit from it. This criterion is of particular relevance tofinancing educational broadcasting. Controlling the reception of programsis much more difficult in educational broadcasting than with any other formof education because of the potential availability for everyone to own orhave access to a radio or television set. On the other hand, all society'smembers may pay, but not all may benefit. Financial techniques of educa-tional broadcasting must, therefore, be justified differently from those mostcommonly used in educational financing.
The financing techniques that are either in use or have been suggested
133
14 3.4
by planners fall into two basic categories: non-governmental and govern-mental. Logically, any combination between or within categories is possible.Some alternatives in each category are:
Non-Governmental Financing:SubscriptionControlled advertisingSupport from a non-profit satellite service which transmits pro-
grams and collects fees from its other services.
Governmental Financing:
Annual license fees paid by owners of receiving setsExcise tax on the sale price of a receiver setTax on gross receipts of either commercial broadcasters or of
all long-distance communication systemsA fee for the use of the broadcasting channelTax on commercial advertising carried by broadcastersExcess profits tax applied to commercial stations.
Alternatives of Non-Governmental Financing for Educational Broadcasting
Subscription Individuals pay a set price to receive a given amount ofprogramming. He may either pay for specific programs or for access to allprograms on a channel. In television, it has been commonly called "pay-TV." If a person does not pay, he cannot tune in to programs.
This plan for financing educational broadcasting has several implica-tions in relation to the four basic criteria used to evaluate the financing ofeducational broadcasting. An adequate financial yield depends not onlyon the number of subscribers but also on the rate charged for the service. It
is not easy to determine the maximum that may be charged without losingsubscribers. Because an educational station obviously depends on such rev-enues, this plan does not give it the ready capital needed for flexibility orinnovation.
This problem of adequate funds leads to the second criterion, stabilityversus growth. Subscriptions may produce fairly stable income, but growthmay be slow and difficult. Growth can only be achieved through moresubscription or higher rates which, in turn, may cause a loss of subscribers.
This financial plan is not neutral in its effects on economic behavior,and it tends to be regressive. Because people must pay for programs, they
134
1.44
must choose between entertainment and educational opportunities. Low-income people will find such a subscription fee more burdensome thanwealthier people.
This leads to the fourth criterionthe nature of the connection betweenthose who pay for the service and those who benefit from it. Subscribing
to educational broadcasting directly links the two. But because the pro-grams would be directed to those who pay, the range of potential benefi-ciaries is severely limited.
Controlled Advertising Under this plan, the station would sell com-mercial advertising but retain control over its content and use, to preventits interference with educational programs. Such a plan would probablynot produce enough money to fully finance a broadcasting station. It couldproduce supplemental funds, but such funds are neither very stable noreasily increased since advertisers may change to other media, especiallywhen conflicts between program and sponsor philosophies arise.
In the controlled advertising schema, the link between those who payfor the programming and those who benefit from the programs is indirect.Companies who pay receive the benefit of advertising their merchandise.These companies do not directly benefit from the educational programswhich result from the use of their money. The program listeners benefitby exposure to educational programs. Yet they also pay for the broadcastingindirectly through commodity price increases due to advertising.
Non-Profit Corporation Satellite Transmission This financing alternativehas been suggested by the Ford Foundation and others. Basically, com-mercial stations pay a non-profit.corporation for use of the satellite. Theprofits are then used to support educational broadcasting. The Ford Foun-dation suggests that the sums collected could be significant, although notnecessarily enough to completely support a large educational network.
A non-profit corporation would provide a fairly stable source of in-come, but it would have slow growth potential, especially since expensivefees might cause the development of competitive modes of transmission.Its effects on economic behavior are fairly neutral. Once again the connec-tion between benefits and payments is indirect. Commercial stations receivesatisfactory satellite service for their payments which is one direct connec-tion of costs and benefits, but it is the public who receives the directbenefits from the educational programs which are paid for by profits fromthe satellite service.
Such a financing proposal has limited use for most developing countriesunless several nations were to share one satellite facility. It has some possi-
135
145
bility for financing international educational programs and internationalinformation and retrieval systems.
Alternatives of Governmental Financing for Educational Broadcasting
Annual License Fees This is a plan of payment by owners of receiversets similar to the subscribing plan, except that the money goes directlyto the government rather than to the educational broadcasting system. Themoney may or may not go into an earmarked government account. Theadvantages and disadvantages here are basically the same as those describedunder the subscription plan. Annual licensing also involves the practical andadministrative problems of collection and enforcement, as well as difficultiesof political and public acceptability.
Excise Tax on the Sale Price of the Receiver Sets Sold This tax could be
levied at the manufacturing and importing levels. It appears fairly simpleto administer. The adequacy of yield depends on the rate of taxation, onthe stage of growth of the broadcasting system, and on the volume of sales.Market fluctuations strongly influence stability and growth potentials. Tech-nological advances in broadcasting receivers increase sales and revenuesdue to higher priced sets. When sales level off, revenue falls correspond-ingly.
The excise tax's effect is not neutral because it is almost always totallyshifted onto the consumer. If it increases costs of broadcasting relative tocosts of other media of entertainment or communication, this could restrictconsumer preferences. The resulting level of the tax's regressivity appearsslight to some planners because the wealthy buy more broadcasting receiv-ers more ofte, and buy more expensive models than the poor. But this
logic is questionable. In some countries, poor people do buy televisionand radio sets on time payments more often than their means allow. Thismakes the tax regressive. But if the poor may benefit more from educationalbroadcasting than the rich, this lessens the tax's regressivity.
Tax on Gross Receipts of Either Commercial Broadcasters or of Long-Distance Communication Systems In this tax, the adequacy of yield againdepends on the tax rate. Potentially this tax will produce an adequate yield.Such a tax-base is stable. The long-distance communication systems areoften monopolies or near monopolies, and broadcasting networks are gen-erally quite stable. Such a tax-base may also increase revenue as taxed gross
receipts increase.
But such a tax is not very neutral in its potential impact upon an econ-
omy. In many countries, taxes on already heavily taxed monopolies may
136
145
discourage private communication systems from further investments. It is
also possible that much of these taxes would indirectly be passed on toconsumers through higher retail prices of products advertised in the broad-casting media. Whether such increases are consequential is debatable.
The connection between those who pay and those who benefit isindirect: the commercial broadcasters pay; society benefits. Some plannersrationalize this financing plan by asserting that it is the social responsibilityof the commercial networks to sustain educational broadcasting becausethey indirectly benefit from a better educated populace. Also, becausebroadcasters are given a monopoly on a resource by the government, thegovernment is therefore entitled to tax that monopoly for national purposes.
A Fee for the Use of the Broadcasting Wave-Length or Channel Someplanners also use the monopoly argument to justify taxing the use of wavelengths. Such a tax alone may not adequately finance an educational broad-casting system unless the costs of running such a system are very low. Butit is a good supplemental source of income. A charge for using an assignedfrequency does produce a good stable yield; but revenue growth couldcome only through increased fees, which may be politically unfeasible, orby rapid growth in the number of radio frequencies and television channelsgoing into service.
This financial arrangement appears to be the most neutral of all theproposals. The broadcasting networks will still behave in the same fashiondespite the added costs of the fee.
Like the controlled advertising alternative, the connection betweenthose who pay and those who benefit is not direct. The companies whopay the fee directly benefit by using the frequency. However, they do notdirectly benefit from the programs broadcasted; it is the listeners whobenefit.
Tax on Commercial Advertising The adequacy of yield again dependsupon the rate of taxation. The growth potential will be strongly influencedby substitute advertising media. Such a tax will also have a strong tendencyto be passed on to the consumer. The connection between those who payand those who benefit is weak. Potential advertisers pay more than neces-sary for a service and may receive only indirect social benefits from aneducational broadcasting station.
Excess Profits Tax Applied to Commercial Stations This tax is based onan established "reasonable rate of return." The' adequacy of yield is againbased on the tax rate. Many planners find excess profits an unstable tax-basethat will not assure adequate revenue over time. Because of its instability,
137
147
such a tax revenue has a good growth potential. But this may not be real-ized. Profits can be easily re-defined. Such a tax could also cause wastein production to avoid.extra- networks earnings. Such -a tax is-fairly neutralbecause it is less likely to be passed on to the consumer. The connectionbetween those who pay and those who benefit is again weak. Broadcastingnetworks would receive no particular, immediate gain and would benefitonly indirectly from a better educated society.
Special Fund
Related to all these financial plans is the constant issue of separatingthe control of funds from their source, whether it be the government orpowerful corporations. A trust fund approach for financial control has beensuggested to those countries who view separation as important. All taxesor appropriations collected would be controlled only by the fund. Govern-ment or special interest groups would, therefore, have less influence onhow the revenue is allocated.
SUMMARY
No one method yields enough revenue to finance an educationalbroadcasting network adequately. But a few may be used together. Thiswould make it possible to balance those financial plans having a stablerevenue but little growth potential with those having an unstable revenuebut high growth potential. The desirability of having a neutral financingscheme will depend on governmental policies toward affecting economicbehavior.
The financing alternatives presented here offer three types of con-nections between those who pay and those who benefit. A few financialplans have a direct connection: those who benefit from educational broad-casting must pay and those who cannot pay do not benefit; thus, severelylimiting the number of those who might benefit. Other plans have anindirect connection: those who pay receive direct intermediate benefits,such as the use of airwaves for advertising. Subsequent use of their moneyis beyond their control and their concern. But, if the fee charged is justifi-able in terms of the service rendered, then maintaining an educationalbroadcasting system for the whole society with those fees is justifiable;otherwise, their support of an educational broadcasting network is question-able. Revenue from financing plans based on intermediate services seemsmore appropriate as supplemental income to educational networks than as
main or sole sources.
138
148
Finally, other plans have a weak connection: certain groups are taxedwhich receive no direct intermediate benefit, but only indirect social bene-fits. These plans are justified mostly by appealing to one's sense of socialresponsibility.
In deciding which plan to use for financing educational broadcasting,only those criteria which most fit a country's economic situation andpolitical philosophy should be considered.
139
149
CHAPTER X
Self-Help as a Method ofFinancing Education
sELF-HELP is a concept that lies at the heart of social organizations, moti-vating both individual and group action. Of particular significance
today is the notion of people choosing to work together to provide servicesfor their countries on a communal-sharing basis and, thus, avoiding theprofit motive.
In the Euro-American tradition, the origins of formal education in largemeasure can be traced back to group self-help activities through suchagencies as religious institutions, trade guilds, township and village com-munities, and workingmen's organizations.
In many developing countries, the roots of self-help activity supportingeducation can be found in kinship groups and caste systems. As a part ofthe general process of colonialism, missionaries and colonial governmentsutilized local communal self-help to a great degree when they began to setup early industrial style formal school systems. Today many independentgovernments see the group capacity for self-help among, their people asa very important source in the creation and expansion of cheaper and moreeffective school systems.
THE PHILOSOPHICAL AND ECONOMIC PERSPECTIVES OF SELF-HELP
The current view of group self-help support for formal education indeveloping countries tends to involve two important perspectives: thephilosophical and the economic.
The philosophy of self-help for a developing country emphasizes theneed for the country or the people to be self-sufficient. This, of course,has important ideological implications for a developing country in that itemphasizes the independent identity of the country and, hence, engenderscommitment and confidence among the people. But, in practice, the or-ganization and application of self-help to education is a very complex affairwhich needs very sensitive handling. Indeed, the ideological advantagesare lessened if group self-help leads to competition between different areas,
140
150
if self-help is used as an excuse by the rich to avoid their financial obliga-tions, or if a Central Government forgets about its less advahtaged periph-eral areas.
While the implications of the philosophy of self-help or self-reliancemust not be forgotten, it is on the economic perspi ve that educationalplanners and financiers focus their major interest.
The underlying rationale of community self-help assumes that a com-munity can use its own local resources to produce the goods and servicesthat it requires. This is of considerable advantage in three areas: resources,equitable distribution of projects, and cooperation between citizens andthe government.
Local materials, labor and skill, which have a low opportunity cost,can be used to provide such things as school buildings, blackboards ordesks, in any area requiring them. Thus, scarcer resources for which thereare no substitutes can be released and used more strategically over a wider
range of projects.
The notion of spreading resources among more communities impliesa better sharing and, thus, a more equitable distribution of projects acrossthe country. Further, it is often assumed that if each area is given the oppor-tunity to gO ahead on its own initiative, there will be less room for competi-tion for national resources, as each area concentrates freely on its own plan.
The prospect of involving local people in the actual planning of theirschools in turn presents the prospect of a new basis for agreement betweenCentral Authorities and the local people over educational objectives, whichwill be much more relevant to local demand and local needs, while at thesame time fitting into national economic planning.
However, each of these advantages needs to be looked at carefully.
Resources
Resources can be considered under four sub-headings: capital re-
sources, recurrent resources, the way resources are raised, and the use ofself-help resources.
Capital Resources To erect a school, the basic needs are a site, building
materials, labor and the relevant knowledge and skills. Given the natureof rural communities, it is possible to conceive of schools being erectedout of mud, poles, and baked bricks. In reality, this is what happens almost
unnoticed in many developing countries today. In many areas, local com-mittees are formed not only to build schools but also to be responsible forongoing maintenance.
141
171
However, communities may decide to collect money according tosome locally accepted formula to improve the quality of buildings orbecause some members of the community prefer to offer cash, in lieu oflabor. Communities may then begin to impose voluntary taxes upon them-selves, thus, invalidating the whole notion of the low opportunity cost ofcommunity self-help resources. While planners may conceive of usinglabor-intensive methods as a substitute for capital, peasants may not agreebecause they consider their time valuable.
Thus, most rural communities press for heavy initial capital expendi-tures, not only for status reasons hut- also to keep down maintenance andto insure that when further governmental planning takes place, their schoolwill attract aid or, in any event, will not be easily removed.
Recurrent Resources Apart from raising money, self-help groups cando very little to help with recurrent costs. Some very limited substitutioncan take place with regard to equipment, such as sand trays or local slatesfor pupil writing practice, but there is little evidence that this significantlyreduces equipment costs. Perhaps the most effective method for reducingrecurrent costs is for a community to bring pressure through a sense ofcommunal obligation on local teachers to contribute their services cheaplyand to accept local products, such as food crops, as part of their payment.But this raises some very critical questions, both about the role and statusof teachers and, ultimately, the ideology of the society.
A general problem is that community goals usually exceed availableresources. Institutions collapse midway or are abandoned, often causingcommunity apathy. Indeed, the cash incomes of self-help schools canfluctuate considerably owing to changes in community attitudes, cash cropproductivity or to other unforeseen problems, such as a dishonest treasurer.Such resource instability causes many self-help schools to maintain them-selves precariously.
The Ways Resources Are Raised Self-help resources can be acquiredthrough different forms of organizations, such as local, family, religiousaffiliations, unions, and political parties. The way resources are raised largelydetermines both the type and amount available. Flat fees may make thesystem highly regressive, and forced contributions worsen it. But if volun-teer labor, time, and supplies are co-ordinated, this form of self-help financ-ing may be far more equitable than many forms of taxation. A methodthat considers individual capabilities will probably raise more resources thanan inflexible one.
The Use of Self-Help Resources In self-help financing, innovation
142
152
comes from local knowledge, initiative, and commitment. Ideally, innova-
tions develop spontaneously. But studies of self-help projects challengethis assumption somewhat. In general, local ingenuity offers little benefitto initial planning, but responds to practical problems. At the local level,
people meet difficulties with realistic improvisations, such as hardeningwalls or concrete pillars to counteract termites. But there is a critical needto develop school designs which make use of self-help resources, and a new
technology which relates to the capacity of self-help groups and enablesthem to use their resources as effectively and economically as possible.
But effective resource use cannot be determined by objective standards.
It depends on who interprets actions as "wasteful" or "economical." "Cut-ting costs" and "improving services" are judged by criteria established bythe evaluator. Thus, evaluations of self-help projects should not be madeonly from the outsiders' objectives. Resource use is determined mainly bythe objectives of those involved in self-help projects and these relate towhat the local community feels it needs in the way of educational insti-tutions.
Equitable Distribution of Projects
The argument that self-help techniques encourage local initiative and,thus, enable each area to make the best use of its own resources certainly
seems attractive. But the tendency in this situation is that the area withthe most resources will make the most progress. Thus, in order that therebe equality, governments should make positive efforts to help the areas
with the least resources. All too often government aid is related to theprojects that are created. Thus, once a self-help group creates a school ora hospital, the government begins to pay some of the recurrent costs. In
this situation, self-help can lead to a pattern of unequal distribution whichcan easily be exacerbated through an insensitive aiding policy. Another
problem occurs when individuals begin to offer assistance to self-help
groups in order to exploit self-help activity for personal or political prestige
or, worse, for commercial advantage.
Cooperation Between Government and Citizens
The argument that self-help techniques bring local people into closercontact with the government and, thus, create a climate in which objectivescan be realistically related to local needs, such as the improvement ofagriculture, has a number of aspects to it.
It is assumed that if a self-help group is involved in planning and usesits own resources, it car then use the informal and flexible techniques of
143
1 5 3.

the local community. Unfortunately, schools tend to be very formal institu-tions and are involved in the selection of students for national positions.Thus, local committees tend to be very formal in their approach to schoolingand expect their schools to be very formal institutions.
It is also assumed that the local committee will relate its schools tothe local ecology. But people tend to take the national perspective andsee schools as agents providing children with the opportunity to earn moneyin the modern sector of the society. They do not see their schools workingat the local level, without reference to national opportunities. Thus, lowlevel work in agriculture is seldom taken seriously, whereas certificate ordiploma studies in agriculture leading to better jobs are considered at-tractive.
It is also assumed that education in a rural community will have a
multiple orientation to needs, such as better farming, better hygiene andbetter housing, as well as basic education.
Unfortunately, ministerial structures do not think this way; they tendto have specific bureaucratic goals, such as more hospital places and morecash crops. Thus, there is little sensitivity in most ministries to working outjoint objectives with local people.
In most countries, there is tension between the Central Authorities'perspective of the way in which resources should be optimized and eachlocal area's view of what it wants and what it believes is possible. Therefore,it must be remembered that communal self-help is not merely a techniqueto be manipulated by planners; it is the product of a community's concernsabout its own development. Thus, it can only be used effectively wherelocal concerns and national objectives ire brought together in a meaningfuland sensitive way. Self-help cannot be exploited merely to save resources;rather it needs to be nurtured in order to expand resources in the contextof a fusion between local and national perspectives.
THE COOPERAPvi AS A SELF-HELP INSTITUTIONIN EDUCATIONAL FINANCING
Recently, cooperatives have gained attention because of increasedinterest in self-help institutions in educational financing. The use of coop-erative financing in education is relatively new. Cooperatives have dealtmostly with economic activity, but they may prove valuable in meetingeducational costs, from both the philosophical and financial viewpoints.
Cooperatives are particular types of self-help and mutual aid institu-tions. A cooperative is the voluntary and equitable association of members
144
15
to provide services that promote the collective economic and social interests
of those members.Contrary to an ordinary corporation where ownership is limited and
control is based on the number of shares held, membership in a cooperativeis open, and control is democraticone member, one vote. An ordinarycorporation's purpose is to maximize profitsdividends are limited onlyby the extent of profits and surplus earnings belonging to the corporation.A cooperative's purpose is to provide a service to membersdividends area fixed and modest rate of shared capital, and surplus earnings belong to
the members.
The Cooperative Concept Applied to Education
The application of the cooperative concept to education evolved thefollowing types:
Cooperative schools organized by consumers of education
Cooperative schools organized by producers of education
Cooperative schools organized jointly by consumers and produc-ers of education
Federated cooperatives organized by educational objectives
Schools as a function of a larger cooperative social system.
The Consumer Cooperative Parents form this type of educationalcooperative to purchase the service of education by hiring teachers and theproper administrative personnel. They might do so in order to overcomescarcity of school places, high educational costs, or unsatisfactory qualityof education.
The Producer Cooperative Teachers form an educational cooperativeto produce the service of education by establishing a school and enrollingstudents, as any private school might do. They do so to obtain higherstandards of living or to increase their independence and professional status.This is distinct from other teacher associations, such as unions, because thepursuit of economic gains, which pressures administrators, parents, orowners in labor-management conflicts, is excluded.
The Joint Consumer-Producer Cooperative Parents and teachers
become members of a common educational cooperative. They might or-ganize in a linear form where teachers and parents have equal status and
cooperate together in solving problems; or in a form where teachers and
145
13
parents belong to different sub-cooperatives where the school combinesthe two.
The Federated Cooperative In this type, institutions join to coopera-tively provide a service. The individual institutions may or may not bethemselves cooperatives. Universities ma)c have a cooperative computercenter. Cooperative schools may form a service cooperative to providetransportation or specific educational facilities. Also, parent cooperativesmay combine their efforts within a geographic region.
The School as Part of a Larger Cooperative Social System In the edu-cational system of a kibbutz in Israel, schools are one of the many ser-vices which the kibbutz provides for itself, financed directly from the coop-erative's general budget. School committees made up of community mem-bers administer the educational program. All major decisions are made bythe total kibbutz community.
The -Financial Effects of Cooperatives in Education
There are four basic considerations here: the biiirden, efficiency, scale,and supply of resources for financing education.
The Burden of Financing an Educational. Service By nature, a coop-erative assumes the entire financial burden. Such an organization may notrule out complementary governmental aid. Cooperative financing representsa significant shift of the burden of financing an educational service to theprivate sector.
The Efficiency of the Financial Arrangement To the extent that costsare borne privately, saving and reducing-expenditures will be stressed. Thismay cause competition with the publicly financed system and may createa reference point from which to judge real and superfluous needs.
The Scale of Operation of Financing a Service Where service is thefinal goal, it is reasonable for members to accept new members at marginalcosts, so that the scale of operations can cover what would otherwise befringe groups. At the same time, new members are not excused frommaking reasonable contributions.
The Nature and Supply of Resources The consumer, producer, andjoint cooperatives have a fairly low potential for capital investment, par-ticularly in cash form. This deficiency can be compensated for substantiallyby personal work and contribution of goods, which meet most capital needs,especially in rural areas.
146
156

Recurrent resources are, at times, even more difficult to obtain becausethey most often must be in the form of cash. The federated cooperatives,representing several institutions, or the large social system cooperativesobviously have a far greater capacity for both capital and recurrent resourcesthan the simpler forms of educational cooperatives. Their resource needsare correspondingly greater and most often must be met in cash. Thesetypes of cooperatives are fairly stable and they easily assimilate growth.
Social Effects of Educational Financing through Cooperatives
There are four basic, beneficial effects here: social interaction, closerrelationship between education and life experiences, human improvement,and social progress.
Social Interaction Cooperatives may create a highly beneficial close-ness between parents and teachers and, generally, between parents andthe educational process. The closeness of teachers to parents can beachieved through membership, or through the communal relationship thata cooperative tends to create among members and workers. Parents mightfeel the pride of ownership. In any event, the strengthening of these rela-tionships is a significant improvement in the educational process.
Closer Relationships Between Education and Life Experiences Educa-tional cooperatives are excellent vehicles in such fundamental educationas correcting or improving health habits, malnutrition, backward agricul-tural practices, and illiteracy. It is common knowledge that the basic educa-tion of children encounters enormous obstacles, when the family environ-ment does not reinforce the school learning experience. Adult educationalso loses meaning if it is unrelated to the environment and real-life sur-roundings.
Human Improvement Cooperatives originate in situations which mem-bers attempt to master by their own efforts. Any cooperative, therefore,by nature fosters self-confidence, self-reliance, and self-esteem. All of thesequalities benefit members of educational cooperatives and, in particular,give impetus to teacher performance.
Social Progress The sequential goals of economic and social improve-ments, which inspire educational efforts in presently industrializing soci-eties, can become a single, simultaneous target of educational cooperatives.
Undesirable Social Effects The undesirable effects that educational co-operatives may produce include: social segregation by income, ethnic orother social groups; national fragmentation by tribe or region; unplanned
147
157
or irrational expansion of the educational system; and, in some cases, theinability to foresee or pursue long-range goals. But these charges are com-mon to any decentralized, private form of financing.
Government Aid to Cooperatives
If government views cooperative efforts in education as one of manyprograms to improve the delivery and quality of education, government canproductively aid such institutions. Financially, government can help coop-eratives meet some of their current expenses, offer easy loan terms, or allowbeneficial tax credits. Administratively, government can release coopera-tives from excessive bureaucratic constraints, develop flexible curricula andschool attendance requirements and, generally, encourage the developmentof cooperatives. Government can also help cooperative leaders by helpingthem publicize their efforts through public information media. Peripheraleducational benefits, such as medical care and hot meals, can also besponsored by government in cooperative schools.
SUMMARY
In developing countries, self-help has great potential as an educationalfinancing method. It locates extra resources and is flexible in the ways inwhich they are raised and used. It is also compatible with governmentalassistance.
Cooperatives, a form of self-help institution, can develop into effectivemechanisms for financing education because of their flexible organizationalstructure and their willingness to meet the needs of the people who createthem. ...
Self-help is most effective where the concept is an integral part ofa country's culture and philosophy, where it can function compatibly withgovernment, and where it can meet both local and national goals. But carehas to be taken in planning to assure that financing is stable, that recurrentrevenue is adequate, and that waste is minimized.
148
158
CHAPTER XI
The Voucher System
THE voucher system is an experimental approach to regulate expenditureon education. Its general purpose is to equalize educational oppor-
tunities between diverse social and racial groups. It is a system of directsubsidies paid by the government to the parents who are given a certificateapproximating the cost of a school year of education. The underlyingtheory is that schools would improve or provide equal opportunity becausethey are competing for the vouchers.
This chapter discusses several models of vouchers and their advantagesand disadvantages. However, all these models are intended to help condi-tions mostly prevalent in developed countries. Presently, the mechanicsof operation of voucher systems and the conditions existing in developingcountries make vouchers unfeasible there
OBJECTIVES OF THE VOUCHER SYSTEM
Proponents of the voucher system believe in government financed butprivately provided education. They think that state provided educationmay not be the most desirable or effective way to educate people. Theypropose direct subsidies to parents who are given a certificate approximat-ing the cost of educating a child during a school year. The parents then"purchase" the child's schooling wherever they choose. Compensatory orselective vouchers could help specific population groups obtain educationmore satisfactory to them.
The voucher system introduces competition, choice, and consumerbuying power in the education market. Suppliers must be responsive ina free education market. The theory of this system is that schools wouldimprove in competing for the vouchers. Given the same private resourcesfor school expenditures as governments presently have in taxes, parents
could buy as much or more education, but with wider choices.Proponents of the voucher system believe it will: accelerate re-alloca-
tion of teachers, buildings, and instructional materials; mix diverse popula-
149
159
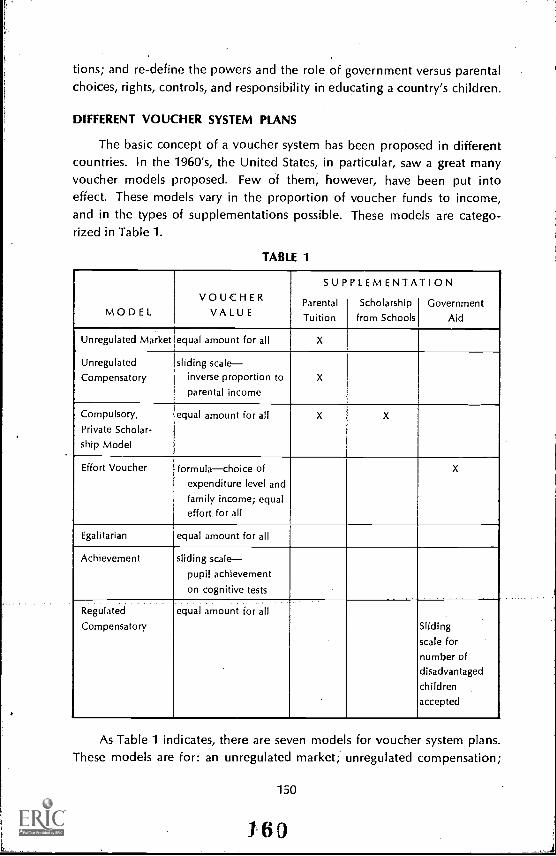
tions; and re-define the powers and the role of government versus parentalchoices, rights, controls, and responsibility in educating a country's children.
DIFFERENT VOUCHER SYSTEM PLANS
The basic concept of a voucher system has been proposed in differentcountries. In the 1960's, the United States, in particular, saw a great manyvoucher models proposed. Few of them, however, have been put intoeffect. These models vary in the proportion of voucher funds to income,and in the types of supplementations possible. These models are catego-rized in Table 1.
TABLE 1
MODELVOUCHER
VALUE
SUPPLEMENTATION
Parental
TuitionScholarship
from Schools
Government
Aid
Unregulated Market equal amount for all X
Unregulated
Compensatory
sliding scaleinverse proportion to
parental incomeX
Compulsory,
Private Scholar-
ship Model
equal amount for all X X
Effort Voucher formulachoice ofexpenditure level and
family income; equaleffort. for all
X
Egalitarian equal amount for all
Achievement sliding scalepupil achievement
on cognitive tests. ...........Regulated
Compensatory
. . . . .
equal amount for all
Sliding
scale for
number ofdisadvantaged
children
accepted
As Table 1 indicates, there are seven models for voucher system plans.These models are for: an unregulated market; unregulated compensation;
150
160
compulsory private scholarship; effort; an egalitarian plan; achievement;and a regulated compensatory voucher.
The Unregulated Market Voucher In this very early type, each childreceives the same value voucher, but schools may charge additional tuition.Critics charge that by adding to the voucher base, rich families will createhighly economically segregated schools. Also, state schools would be evenless able to exert "equalizing" functions.
The Unregulated Compensatory Model Here the value of the voucheris in inverse proportion to family income, determined on a sliding scale.But because schools may still charge additional tuition, this plan also failsto equalize the purchasing power of rich and poor.
The Compulsory Private Scholarship Model Schools set their own tui-tion, but most provide scholarships to the poor from their own funds.There would be enough scholarships so that no successful applicant'sfamily would pay more than it could afford. With fixed voucher value andcompulsory scholarship subsidization of needy applicants from the school'sown income, the necessary operating revenues could best be gotten byrecruiting more affluent students. But because even the wealthiest privateschools would be hard-pressed to support a high proportion of scholarshipstudents, the result would be like current wealthy private schools whichhave a token enrollment of disadvantaged students.
The Effort Voucher This plan establishes different types of schoolscategorized by varying levels of expenditure per pupil. Such a voucher planwould reflect the family's interest and willingness to sacrifice for educatinga child. The cost for each student would be determined by a progressive
rate structure. This would be based on a combination of the family's in-
come and its choice of a school that meets its preferred level of expenditure.
Schools at the lowest level would-be almost completely subsidized by thestate, with parents probably paying a token charge. Expensive schools
would charge rich families more than the level of expenditure per pupil,and poorer families, considerably less. The government voucher's valuewould be the difference between the family's contribution and what theschool spent per pupil. With a family whose income was $5,00G. theeducation agency might set a 1.2 per cent ($60) assessment to enroll a child
in a school that spends $1,000 per pupil. This might rise to 1.5 per cent
($75) if the school spent $1,200 per pupil. With higher family income,charges to rich families become higher than the level of per pupil expendi-ture of the school they have chosen. The assessment percentages become
151
16,1
progressively higher. These "extra" funds would be part of governmentsources of revenue for its effort vouchers. Thus, both family economicpower and the burden of educating its children become equalized.
The variety of choice is expanded under this plan. Schools operatingat any given expenditure level would attract an economically representativestudent body. Segregation by ability and performance might be enhanced.Children from families that value education and make economic sacrificesfor it will probably be diligent, disciplined, and easier to teach. Such
children will tend to concentrate in higher expenditure schools. Negatively,families that value education less will probably have children who are lessinterested in succeeding in school and who might exhibit performance andbehavior difficulties. The spread between best and worst schools wouldincrease. A promising child with disinterested parents would suffer a con-siderable injustice.
The Egalitarian Voucher Here all vouchers and all tuition charges areequal. Schools could solicit funds from national, local, or private agencies,churches, alumni, or foundations. This plan would encourage the survivalof church schools. It would, theoretically, equalize per pupil expenditurebetween rich and poor because expenditures above the voucher value arenot allowed. This value would be set at the level of per pupil expendituredetermined by school boards and town budgets. An egalitarian voucherwould tend to equalize allocations for education on children from differentincome groups within the same district, but it would not eliminate dis-parities between districts. Poorer areas will have lower value vouchers, asdictated by its taxpayers. Parents wanting to use vouchers and still spendan additional amount could not do this. Because schools would have finiteresources, they would probably admit children who are cheaper to teachthe able and talented. This again would foster segregation by ability.Furthermore, because it costs more to educate the disadvantaged, egalitarianvouchers, in practice, might not respond to the problem of allocating largerresources to needier areas.
The Achievement Model Voucher As in other models, the achievementvoucher is given to the parents so they can choose the school for theirchildren. But when the school cashes the voucher, its value depends on thepupil's achievement at the school. Unlike other vouchers, the value is notdetermined by a school's costs or by what parents want to spend, butrather by whether the school succeeds in teaching the child. Schools thatsubstantially raise test scores receive larger vouchers.
This approach is traditionally known as "payments .by results." The
152
l62

basic assumption here is that society can measure the effects of schoolingand that measured "good" effects should be rewarded. But the achieve-ment model has two defects. First, schools will tend to enroll childrenwhom they judge will improve most rapidly and to exclude problem chil-drenthose with low ability or motivation, or those whose scores mightnot rise as rapidly for whatever reason, . Second, test scores may be un-
reliable. They usually measure only cognitive gains to the exclusion ofattitudinal outcomes and do not often correlate meaningfully with lateradult success. Reliance on tests is often questionable.
The Regulated Compensatory Voucher This is the most comprehensivevoucher plan. Basic voucher values would be the same, but formulas wouldincrease the voucher value for children with special educational problems.No voucher school could charge tuition higher than the basic vouchervalue. Schools would admit students partly by processing applications andpartly by lottery. School income would be increased according to thenumber of disadvantaged children they enroll. For every educationally dis-advantaged child accepted, schools would receive a bonus, either directlyfrom. the administering agency or in the form of an increased voucherfrom these children. The increased voucher value for "problem" childrenwould provide financial incentive to schools and insure placement ofslow-learners, children with behavior problems or physical handicaps, low-income or minority group childrenthe "educationally disadvantaged."
This plan involves a regulatory agency to disburse funds, to gather,evaluate and disseminate information on schools to parents, and to regulateadmission policies. This agency would establish a loan fund to help startnew schools and to pay the costs of transportation to insure a geographic
mixture. The model would certainly provide for the educational needs ofthe disadvantaged and it would encourage a diversity of educational alter-
natives. But it would also create the potential for an obstructive bureau-cracy in an agency that would have enormous responsibilites for supervision,
inspection, fund disbursements, admissions, grading, expulsions, and pub-
licity.
Also, accepting more disadvantaged children from another localitywith their accompanying financial bonuses would limit the available numberof places for middle-class children in a particular neighborhood school.Middle-class parents might not be able to afford the much higher tuitioncharges of non-voucher private schools. They would be "frozen" intopublic schools whose expenditure level was below what they might bewilling to spend and they would have fewer choices of school location.
153
163
ADDITIONAL VARIATIONS OF VOUCHER SYSTEM MODELS
Additional variations of a more limited nature have also been sug-gested where the vouchers are confined to: public schools, to privateschools, to poor schools, or to non-profit schools. Though limiting thescope' may encourage wider public acceptance, each plan carries its ownfailings. Some undesirable consequences of these variations might be:less educational initiative and exploration of alternatives; neglect of thepublic schools; imprecise financial accountability; and a lack of carefullyregulated and defined standards.
The Lifetime Block-Grant for Education This plan would not restrictvouchers to schools. Rather, a fixed amount would be granted to be spentover a person's lifetime on anything educational: for instructional materials;paying teachers for neighborhood mini-schools; buying math games;research assistantships; music and other lessons; and so on. The premiseof this plin is a unique variation because it recognizes and encourageseducation beyond required schooling throughout adult life.
THE VOUCHER SYSTEM AND DEVELOPING COUNTRIES
The voucher system can be useful in a context where the provisionof education depends on an extensive, privately operated school system,and where the government is interested in improving effectiveness of familydecision-making in education and equalization of educational opportunities.
In these particular circumstances, the education voucher would modifynegative effects of a completely free .narket by regulating expenditure oneducation. Financially and distributively, it could meet the requirementsof those who favor universal subsidiessubject to regional income and agedifferentialsas well as the requirements of those who prefer selectivesubsidies. It is a potential method for rapidly equalizing educational oppor-tunities. It can also provide a way for mixing diverse social and racialgroups, offering parents a wider choice of schools, and for offering societya more responsive and efficient balance between educational consumptionand supply.
But some of the necessary general conditions for the success of thisfinancing system are rarely present in developing countries. Vouchers onlywork in areas with high population density. Most people in developingcountries live in rural areas. Because mobility and diversified choice arebasic to the plan, there is a continual need for excess capacity within thesystem. This is a luxury that few developing countries can afford. Admin-istering such a system requires a sophisticated system of communications,
16 4
154
a literate population, and a desire to innovate. Often these pre-requisitesare absent in developing countries. This would 'make the cost of admin-istrating such a complex system impossible.
Finally, hositility by politicians would result because of their reluc-tance to relinquish power over fund disbursement, plant construction,salaries, certification, curricula, and materials.
Ideally, the objectives of a voucher system are desirable. But themechanics of operation seem unduly bureaucratic and cumbersome; andfor this reason, they are generally not feasible in developing countries.
155
163
CHAPTER Xil
External Aid to Education
EXTERNAL aid has been received in various forms and under many aus-pices by developing countries for use in their educational programs. The
amount available over the last decade has been greater than both recipientand donor countries realize.
External aid to education includes technical assistance and capitalassistancegrants and loansto primary, secondary (general, technical,vocational), and higher levels of education, as well as for adult education,educational planning, research and administration, and scholarships tostudy abroad.
This chapter gives an overview of the types of aid received by develop-ing countries and presents some of the specific problems involved inexternal aid to education.
External aid to education will be discussed in terms of its donor-recipient relationship, its content, and its distribution within the educationalsector.
THE DONOR-RECIPIENT RELATIONSHIP
Some did is bilateralthere is one donor and one recipient country.Aid can also be multilateral wherein aid to developing countries is pro-vided by several countries banding together, or by international organiza-tions, such as UNESCO or the World Bank.
Bilateral aid may come from offi.cial government sources or it maycome from various private organizations in the donor country. Most aidgiven to developing countries is bilateral and sponsored by governments.Current information on the extent of aid compiled by the DevelopmentAssistance Committee (DAC) of OECD puts official bilateral aid to educa-tion from DAC members at about ten per cent of the total aid provided todeveloping countries. Unfortunately, there are few statistics and littleinformation available on aid to education to developing countries fromsocialist and communist countries, but estimates indicate that their aid iscomparable to that of Western countries.
156
165
Private bilateral aid is also significant, but difficult to estimate. Estimatesof private aid to education range from one-fourth to one-third of totalbilateral aid. This assistance comes from business firms and non-profitorganizations, such as foundations and churches. Religious missions have
.traditionally provided education. These have been curtailed somewhat, butthey are still very active, particularly at the primary level. Trade unions areactive in vocational education and private foundations are especially activein higher education.
Besides these private sources, business firms with foreign interests
frequently train their own personnel in countries where they transact busi-ness. Many firms also pay for training foreign personnel in their homecountries. Some enterprises also offer formal education and literacy classes;others send their personnel to developing countries as part of technicalassistance programs.
The geographic distribution of bilateral aid is partly a reflection ofthe cultural, traditional, commercial, and poltical relationship betweendonors and recipients. The French and the English supply most of theteachers working in Africa. African countries also receive much assistancefrom private non-profit organizations interested in education. Israel con-centrates its training programs in African countries, south of the Sahara.Spain focuses its aid in South America. Socialist countries concentrate aidmostly in Asia and Africa, although significant aid is also given to socialistregimes elsewhere, such as Cuba.
Aid distributed by multilateral agencies is steadily increasing. Thereis significantly greater activity by the World Bank group and by regionalbanks, such as the Inter-American Development Bank. Banks extend mostlyloans and credits. UNESCO provides primarily educational grants. Otherspecialized United Nations agencies also sponsor educational aid programs.Channelling aid to developing countries through multilateral agencies seemsto be a growing practice.
THE CONTENT OF EXTERNAL AID
The content of external aid falls into two basic categories: technicalassistance, and capital financing.
Technical assistance includes: personnel at administrative, technical,and volunteer levels; contributions for students and trainees; supply ofequipment and material for research, training and demonstration purposes;and other categories, such as the supply of technical support and contractservices.
Personnel such as administrators, advisors, teachers, and volunteers
157
167'
comprise the bulk of technical assistance for education. Statistically, it is
difficult to differentiate various personnel roles because one person mayadminister, teach, and advise.
The type of personnel that donor countries provide depends mostlyon their previous relationship with developing countries: the United Statesprovides mainly advisors; Germany, chiefly administrators; and France andEngland, primarily teachers.
Most scholarships are awarded for study in the donor country or inanother developed country. But, recently, there has been increasedemphasis on first, establishing schools and universities in developingcountries, and, then, providing scholarships to study at these institutions.
Teaching materials, such as books, audio visual aids, teaching machinesor programmed instruction are also provided. Most donors who sponsorteachers also provide the relevant materials. Few statistics are availableconcerning this type of aid because such costs are difficult to determine,but the total amounts in monetary terms are very small.
Capital financing is provided in the form of grants or loans. Much ofthis aid comes from multilateral agencies. Only ten to fifteen per cent oftotal DAC members' expenditures for education is provided in the formof grants or loans. Some wealthy private donors also provide capital in theform of grants. Whether loans or grants should be the predominant form ofsuch aid is still being debated.
DISTRIBUTION OF AID WITHIN THE EDUCATIONAL SECTOR
External aid to primary education is losing favor with donors andrecipients alike. It is thought that the needs of primary education shouldbe met by a country's own resources. This is owing to the fact thatexternal aid can make only marginal contributions to an educational levelwhere the numbers of students and teachers to be influenced is the great-est, and where knowledge of the culture and national language is vital.However, external aid at the primary level can play an important role incurriculum development, supply of materials, and introduction of newtechnology.
External aid has been substantial at the secondary level, mostly in theform of teachers and administrators of vocational and technical training.But, recently, because many more and better trained teachers are neededto satisfy the large increase in demand for secondary education, there hasbeen more emphasis on providing aid in the form of grants or loans thatwill permit the successful' training of teachers at the secondary level indeveloping countries.
158
168
There is also a growing emphasis on aid to improve teacher trainingand to provide equipment and teaching materials.
Higher education and high-level technical education has received greatemphasis because both donors and recipients increasingly felt that thosewere the levels where local human resources are least available, and whereaid could be most effective. Most external aid first consisted of scholarshipsto study in donor countries because the per student cost of higher educa-tion in many developing countries was prohibitive, or because highereducation systems in recipient countries were undeveloped. But aid is nowbeing allocated in an effort to keep higher education at home. The uni-versities in donor countries are working with developing countries to
provide financial, material, and technical help in se' ing up new universitiesand educational facilities, and in strengthening wh, _ cxists.
RATIONALE FOR ACCEPTING EXTERNAL AID TO EDUCATION
Justification of external aid to education has been debated since suchprograms began. The arguments are often enmeshed in the larger debateof justifying all types of external aid. But there are some strong argumentsspecifically related to education: namely, the need for breaking the cycleof educational poverty; the need for complementing the aid provided toother sectors with aid to education; the need to shorten the lag betweenobtaining financing for investment and the development of human capital;and the need of insurance against the risks involved in experimentation ineducation.
Proponents of aid for education consider educational developmenta prerequisite to economic growth and overall national development. Many
developing countries do not have the taxable capacity to support com-pulsory free primary education. This taxable capacity depends on nationalproduction, which is a function of economic development. This, in turn,depends on educational development in general because as more peopleare educated, they earn more and, hence, pay more taxes. Many propo-
nents of external aid feel that only liberal external aid can break this circle
of educational poverty. Once the educational system is developed, theproponents assert, developing countries will no longer be hindered in their
economic growth by the lack of education.External aid to education is also needed to complement other forms
of external aid. Efficiency in the use of capital assistance in any sectordepends upon the availability of able people to implement and administerprojects. Failures of implementation of many international assistance pro-grams can be traced to problems of improperly trained personnel. General
159
169
external aid to a country imposes, therefore, an extra burden on the localeducational system to provide the manpower required for the developmentprograms. External aid specifically for education may help alleviate thesituation.
But education and training take time. External aid can bridge the timelag either by providing possibilities for training abroad or by providing theinitial investment and technical knowledge needed for creating a localcapability for training the required manpower at home.
The introduction of innovations is indispensable for improving theeducational system. These innovations may apply to many developingcountries. But experimentation in education is risky. Poor countries can-not afford to gamble with their meager resources. External aid can providesome insurance against the odds. A donor country that provides aid forexperimentation and innovation in many developing countries can performthe function of an insurance company that spreads the risks over manyclients, thus lowering the private risks of each one of them.
ISSUES FACED BY DONORS OF AID TO EDUCATION
Issues in aid to education are similar to those arising from any typeof external aid, such as the relationships between donor and recipient, andthe control and administration of the aid provided. In education, however,these issues become more complex because education is intimately relatedto a society's culture, values, and traditions. But there are two issues basicto all external aid to education; namely, choice of educational area orproject to be supported, and vehicle by which this aid is to be provided.
Since there is not enough assistance to solve all the problems ofeducation, a decision has to be made whether to spread financial resourcesover the entire educational sector, or to allocate funds to only a few se-lected areas, where adding marginal inputs may have a sizable impact onthe system. Some related questions are: Should a specific area, such astechnical education, higher education, or the physical sciences be givenpriority over more general courses of study? Should aid go to strengthenresearch and innovation, or to provide resources to educate broadermasses? Should aid provide for capital expenditures or recurrent expendi-tures, or both?
After the object of aid is determined, the problem of choosing thevehicle to provide aid remains. Should aid for education be provided inthe form of teachers and advisory personnel? In the form of books, ortechnology? Should it be provided in the form of scholarships to study inthe donor country? Or should it be provided only in the form of foreign
160
170
exchange or credits, leaving the choice of what to do with the resourcesto the recipient country?
These few examples show the intricacy of the problems and, hence,the difficulty of finding clear-cut solutions. There are no easy answers, andeach countrydonor and recipient alikemust analyze the specific issuesin relation to the particular circumstances, surrounding aid to education.
SUMMARY
Although external aid for education can seldom become significantwhen compared with the amounts of local resources being spent oneducation, it can play a strategic role in breaking the circle of educationalpoverty by providing monetary resources and/or making accessible humanresources that would take a long time to develop locally.
If external aid, in general, is to be accepted by developing countries,then complementary aid to education is also required to provide theeducated personnel that this external aid requires. If innovations are to beintroduced, then external aid can reduce the risks, and thus encouragechange. The vehicle by which this external aid is to be provided should beadapted to the particular circumstances of the recipient country, and itsrelationship to the donor.
161
171
r
CHAPTER XIII
Forecasting Resources forEducation
THERE are no complete models describing current ways to forecast educa-tional resources for an intermediate term (of five to seven years) in
developing countries. This problem is caused in part by the lack of data onprivate educational expenditures, and the general difficulty of forecastinggovernment revenue in developing countries, which makes it difficult toforecast the educational component. If education is financed by local re-sources, the problem is made more difficult because of the many waysused to forecast local resources. The methods developed countries useto forecast resources for education are seldom useful to developingcountries. Relationships between the Central Government and local gov-ernments, tax-bases, and legal restrictions differ considerably.
Because of these difficulties, the approach here will not be to describeexisting ways of forecasting resources for education but to suggest differentways of forecasting. Their application will have to be tempered by localconditions and particular environments.
SOURCES OF RESOURCES FOR EDUCATION
These resources come mainly from government, central and local, andthe private sector. Education claims a sizable portion of Central Govern-ment budgetsup to 25 per cent in some countries. The proportion oflocal budgets is still higher when education is administered by local orstate authorities. Where there are private schools, or where public schoolscharge education fees, the private sector contributes directly to educationthrough fees and donations. Private expenditures on education are relatedto the level of disposable income, which should also be considered inmaking projections.
Forecasting resources for education requires first, a forecast of revenueof these major sources of funds: Central, state, and local government, andprivate, disposable incomeincome after taxes. Second, it entails a fore-cast of the share of education in the Central, state, and local governmentbudgets, and its relationship to disposable income.
172.
162
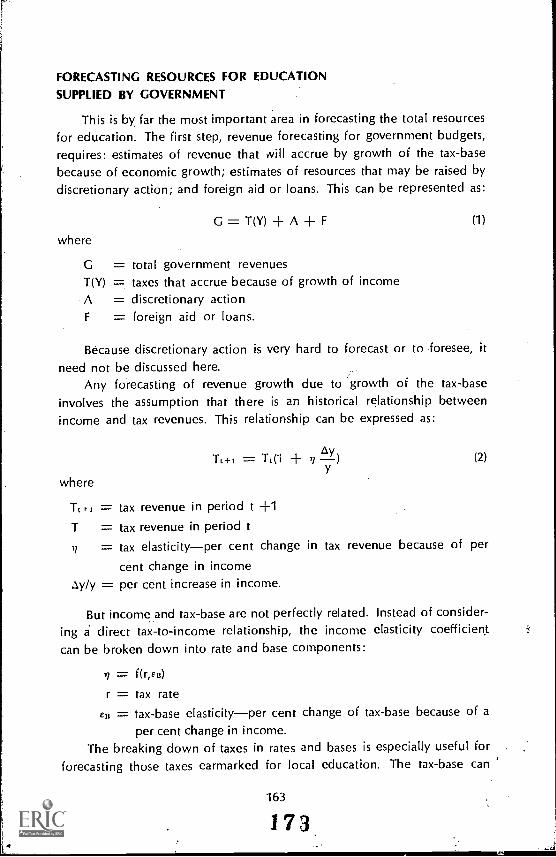
FORECASTING RESOURCES FOR EDUCATION
SUPPLIED BY GOVERNMENT
This is by far the most important area in forecasting the total resourcesfor education. The first step, revenue forecasting for government budgets,requires: estimates of revenue that will accrue by growth of the tax-basebecause of economic growth; estimates of resources that may be raised bydiscretionary action; and foreign aid or loans. This can be represented as:
G = T(Y) + A + F (1)
where
G = total government revenuesT(Y) = taxes that accrue because of growth of incomeA = discretionary actionF = foreign aid or loans.
Because discretionary action is very hard to forecast or to foresee, itneed not be discussed here.
Any forecasting of revenue growth due to growth of the tax-baseinvolves the assumption that there is an historical relationship betweenincome and tax revenues. This relationship can be expressed as:
It+, = TLCI + nAy)
y
where
(2)
Tt = tax revenue in period t +1
T = tax revenue in period t= tax elasticityper cent change in tax revenue because of per
cent change in incomeAy/y per cent increase in income.
But income and tax-base are not perfectly related. Instead of consider-ing a direct tax-to-income relationship, the income elasticity coefficientcan be broken down into rate and base components:
f(r,EB)
r = tax rateen = tax-base elasticityper cent change of tax-base because of a
per cent change in income.The breaking down of taxes in rates and bases is especially useful for
forecasting those taxes earmarked for local education. The tax-base can
163
173.
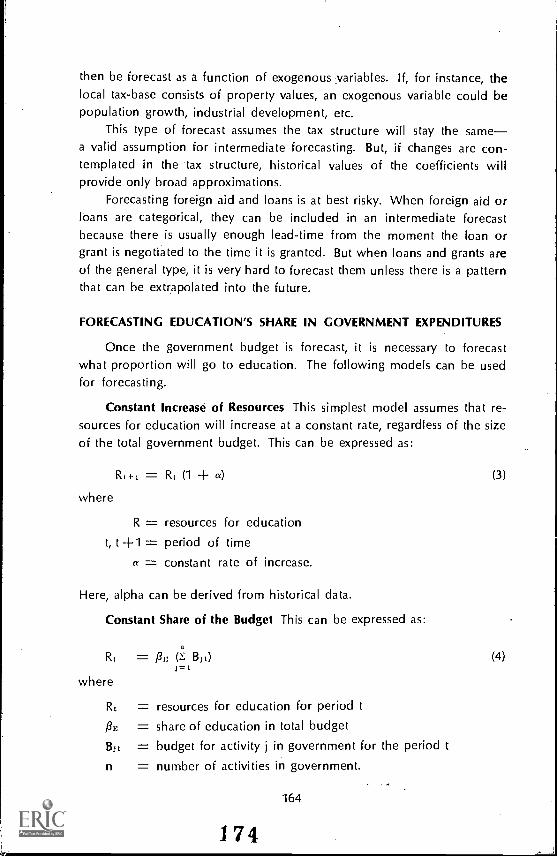
then be forecast as a function of exogenous variables. If, for instance, thelocal tax-base consists of property values, an exogenous variable could bepopulation growth, industrial development, etc.
This type of forecast assumes the tax structure will stay the samea valid assumption for intermediate forecasting. But, if changes are con-templated in the tax structure, historical values of the coefficients willprovide only broad approximations.
Forecasting foreign aid and loans is at best risky. When foreign aid orloans are categorical, they can be included in an intermediate forecastbecause there is usually enough lead-time from the moment the loan orgrant is negotiated to the time it is granted. But when loans and grants areof the general type, it is very hard to forecast them unless there is a patternthat can be extrapolated into the future.
FORECASTING EDUCATION'S SHARE IN GOVERNMENT EXPENDITURES
Once the government budget is forecast, it is necessary to forecastwhat proportion will go to education. The following models can be usedfor forecasting.
Constant Increase of Resources This simplest model assumes that re-sources for education will increase at a constant rate, regardless of the sizeof the total government budget. This can be expressed as:
= Rt. (1 + (3)
where
R = resources for education
t, t +1 = period of timeconstant rate of increase.
Here, alpha can be derived from historical data.
Constant Share of the Budget This can be expressed as:
Rt = /3s Bit)i =t
where
Rt = resources for education for period t
J3 = share of education in total budget
Bit = budget for activity j in government for the period t
n = number of activities in government.
164
174
(4)
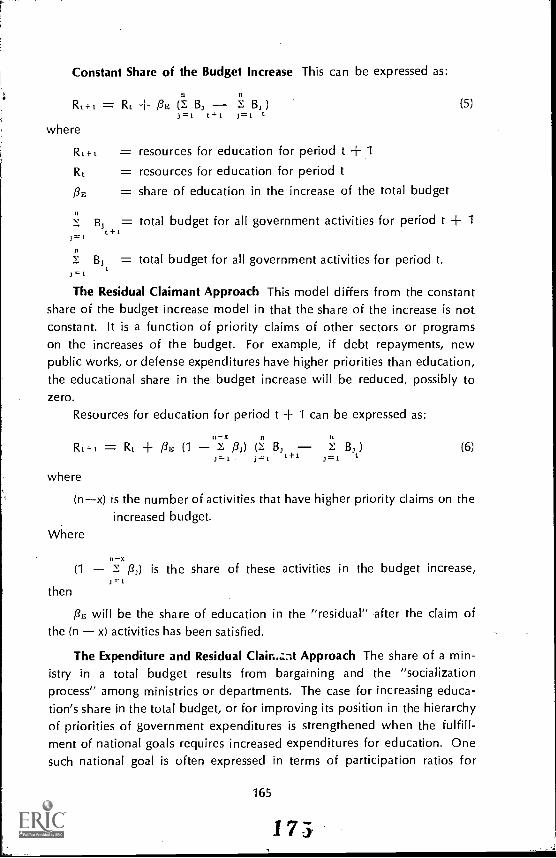
Constant Share of the Budget Increase This can be expressed as:
Rt+t = It + PE (1 B.; J B., )t4-1 .1=1. t
where
Rt+1 = resources for education for period t 1
Rt = resources for education for period t
share of education in the increase of the total budget
(5)
÷1=total budget for all government activities for period t 1
t
=1
Bit = total budget for all government activities for period t.=1
The Residual Claimant Approach This model differs from the constantshare of the budget increase model in that the share of the increase is notconstant. It is a function of priority claims of other sectors or programson the increases of the budget. For example, if debt repayments, newpublic works, or defense expenditures have higher priorities than education,the educational share in the budget increase will be reduced, possibly tozero.
Resources for education for period t 1 can be expressed as:
II-X it
Rt I = Rt i /31) (>. BJ 1 13;)J=t t+1 t
where
(6)
(nx) is the number of activities that have higher priority claims on theincreased budget.
Where
/31) is the share of these activities in the budget increase,
then
/3E will be the share of education in the "residual" after the claim ofthe (n x) activities has been satisfied.
The Expenditure and Residual Clair...Int Approach The share of a min-istry in a total budget results from bargaining and the "socializationprocess" among ministries or departments. The case for increasing educa-tion's share in the total budget, or for improving its position in the hierarchyof priorities of government expenditures is strengthened when the fulfill-ment of national goals requires increased expenditures for education. Onesuch national goal is often expressed in terms of participation ratios for
165
173
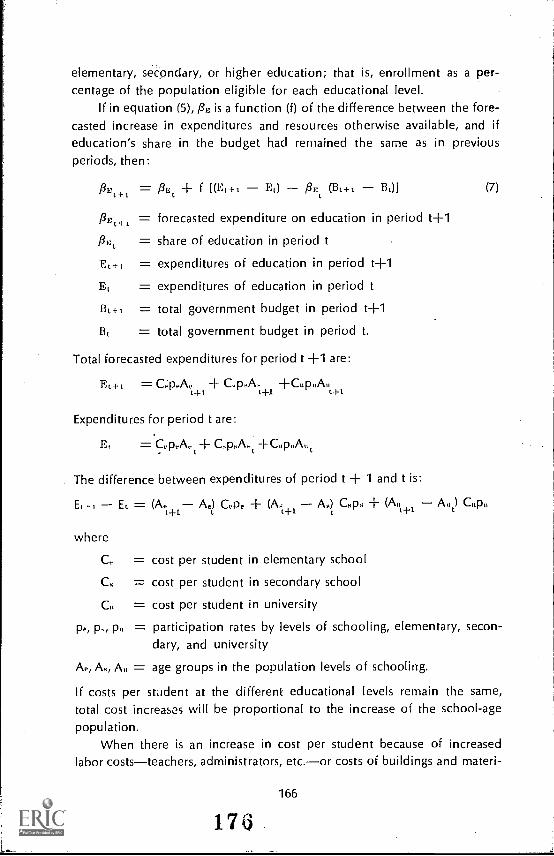
elementary, secondary, or higher education; that is, enrollment as a per-centage of the population eligible for each educational level.
If in equation (5), /3E is a function (f) of the difference between the fore-casted increase in expenditures and resources otherwise available, and ifeducation's share in the budget had remained the same as in previousperiods, then:
pot+, = 13E, f [(EL+, EL) 13EL (Bt.+, Boi (7)
/3EL+1 = forecasted expenditure on education in period t+1
/3N, = share of education in period t
= expenditures of education in period H-1
EL = expenditures of education in period t
BL = total government budget in period t+1
Bt = total government budget in period t.
Total forecasted expenditures for period t +1 are:
EL+, = CepL.A,4 C.p.,A,,L+1
Expenditures for period t are:
Et =C,,p,.A,.L+ CpA,,L
The difference between expenditures of period t + 1 and t is:
EL,- EL = (A,. Ae) Cepe +L-F1
C,,p,L (A,,L+1 A,,t) C,,p,,L-FL. I L
where
cost per student in elementary school
C = cost per student in secondary school
= cost per student in university
Pe, 13, = participation rates by levels of schooling, elementary, secon-dary, and university
A,,, = age groups in the population levels of schooling.
If costs per strident at the different educational levels remain the same,total cost increases will be proportional to the increase of the school-agepopulation.
When there is an increase in cost per student because of increasedlabor coststeachers, administrators, etc.or costs of buildings and materi-
166
176
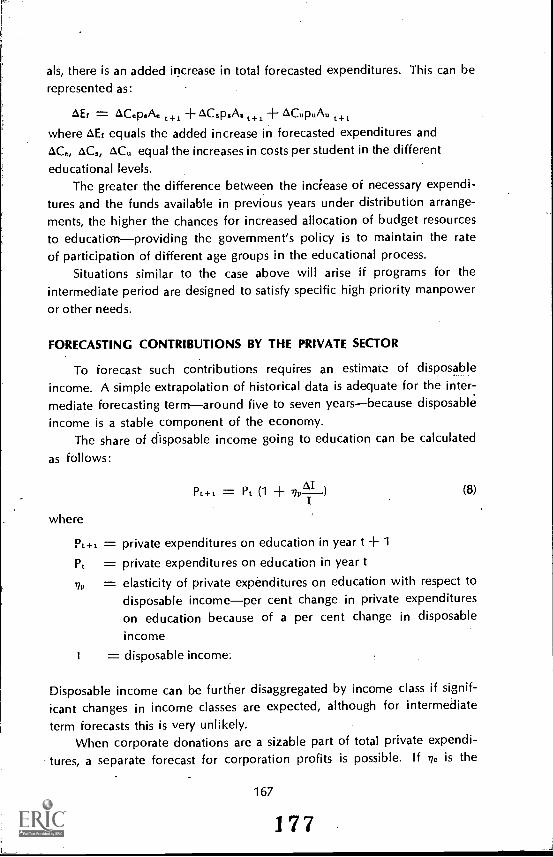
als, there is an added increase in total forecasted expenditures. This can berepresented as:
AEf = ACepeAe t+, +ACsPeAs t+, ACuPuAu t+,
where AEt equals the added increase in forecasted expenditures andAC., AC ACu equal the increases in costs per student in the differenteducational levels.
The greater the difference between the increase of necessary expendi-tures and the funds available in previous years under distribution arrange-ments, the higher the chances for increased allocation of budget resourcesto educationproviding the government's policy is to maintain the rateof participation of different age groups in the educational process.
Situations similar to the case above will arise if programs for theintermediate period are designed to satisfy specific high priority manpoweror other needs.
FORECASTING CONTRIBUTIONS BY THE PRIVATE SECTOR
To forecast such contributions requires an estimate of disposableincome. A simple extrapolation of historical data is adequate for the inter-mediate forecasting termaround five to seven yearsbecause disposableincome is a stable .component of the economy.
The share of disposable income going to education can be calculated
as follows:
= Pt (1 +
where
(8)
Pt+i --= private expenditures on education in year t 1
Pt = private expenditures on education in year t
= elasticity of private expenditures on education with respect todisposable incomeper cent change in private expenditureson education because of a per cent change in disposable
income
= disposable income:
Disposable income can be further disaggregated by income class if signif-icant changes in income classes are expected, although for intermediate
term forecasts this is very unlikely.When corporate donations are a sizable part of total private expendi-
tures, a separate forecast for corporation profits is possible. If 77. is the
167
177
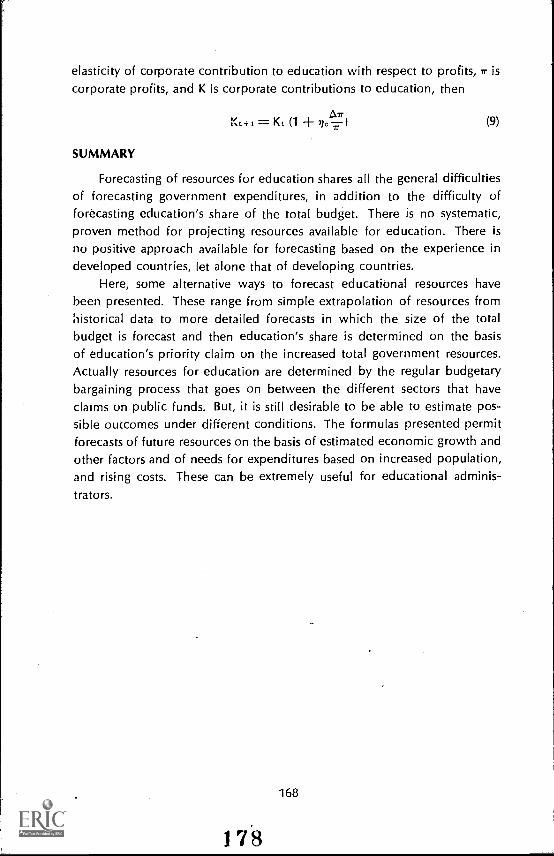
elasticity of corporate contribution to education with respect to profits, 7T is
corporate profits, and K is corporate contributions to education, then
ArrKt+i= Kt (1 r/c 7,r )
SUMMARY
(9)
Forecasting of resources for education shares all the general difficultiesof forecasting government expenditures, in addition to the difficulty offorecasting education's share of the total budget. There is no systematic,proven method for projecting resources available for education. There isno positive approach available for forecasting based on the experience indeveloped countries, let alone that of developing countries.
Here, some alternative ways to forecast educational resources havebeen presented. These range from simple extrapolation of resources fromhistorical data to more detailed forecasts in which the size of the totalbudget is forecast and then education's share is determined on the basisof education's priority claim on the increased total government resources.Actually resources for education are determined by the regular budgetarybargaining process that goes on between the different sectors that haveclaims on public funds. But, it is still desirable to be able to estimate pos-sible outcomes under different conditions. The formulas presented permitforecasts of future resources on the basis of estimated economic growth andother factors and of needs for expenditures based on increased population,and rising costs. These can be extremely useful for educational adminis-trators.
168
178
CHAPTER XIV
nItiCrex for MeasuringEducational Funding
IN their attempts to find ways of measuring a country's performance invarious endeavors or of comparing activities between countries or regions
within a country, economists have developed a variety of tools. One ofthese is an "index of effort." This index enables countries to compare theamount of activity exerted in a particular sector with an average of sectors,or with the same sector in different regions. This index can also be usedto compare a country's level of activity with that of other countries. For
analytical purposes, countries or regions can then be ranked by effort. Thistechnique has been applied to analyze the nature of activity in education ofboth developed and developing countries.
The most commonly used technique for comparing educational effortrelates educational expenditures to a measure of national income. Wheretwo countries have equal national income but one spends more on educa-tion, that country exerts a greater effort in education.
Economists have also used another index of effort which relates educa-tional expenditures to the size of the budget. Besides providing comparisonsamong nations, this index can be used to compare the efforts of different
sectors within a country. If, for example, the ratio of defense expenditureto total budget is larger than that of educational expenditure to total budget,the defense effort of the country is greater than the educational effort.
Both of these approaches have some problems. The first, involvingincome, assumes that the GNP is an accurate reflection of the country'staxable capacity, and that the GNP is a valid characteristic for comparingnations. But other indicators can be used, such as "tax capacity." Thereare also monetary conversion problems that distort inter-country compari-
sons. The second approach, involving budget expenditures, assumes that
willingness to spend for education is reflected in the share of education ascompared with other expenditures. It ignores the willingness of the privateconsumer to spend on education relative to other consumer goods and
also ignores the influence of political decisions, such as the extent of taxa-
169
179
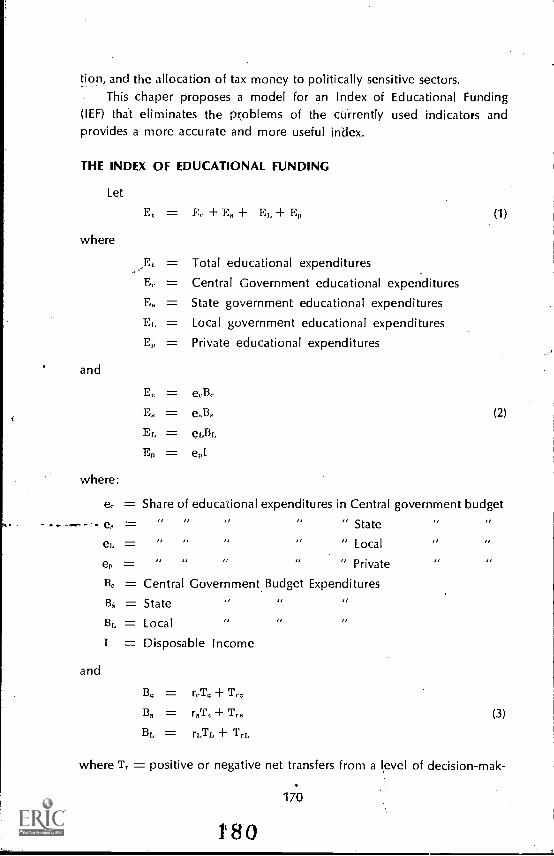
tion, and the allocation of tax money to politically sensitive sectors.This chaper proposes a model for an Index of Educational Funding
(IEF) that eliminates the problems of the currently used indicators andprovides a more accurate and more useful index.
THE INDEX OF EDUCATIONAL FUNDING
Let
Et = E. + + El, (1)
where
Et = Total educational expenditures= Central Government educational expenditures
E, = State government educational expenditures= Local government educational expenditures
E = Private educational expenditures
and
E = eeBE = eBEr, = eLEr.
Ep = epi
where:
(2)
ee = Share of educational expenditures in Central government budget,, ,, ,, ,, ,,- ee = " State ,,
,, ,, ,, ,,el, = " Local ,,
,, , ,, ,,ep = " Private ,,
Be = Central Government Budget Expenditures
B; = State ,, ,, ,/
B. = Local ,, ,, ,,
I = Disposable Income
and
Be = reT. + Trc
BH =BL = rLTr., +
(3)
where Tr = positive or negative net transfers from a level of decision-mak-
170
1'80
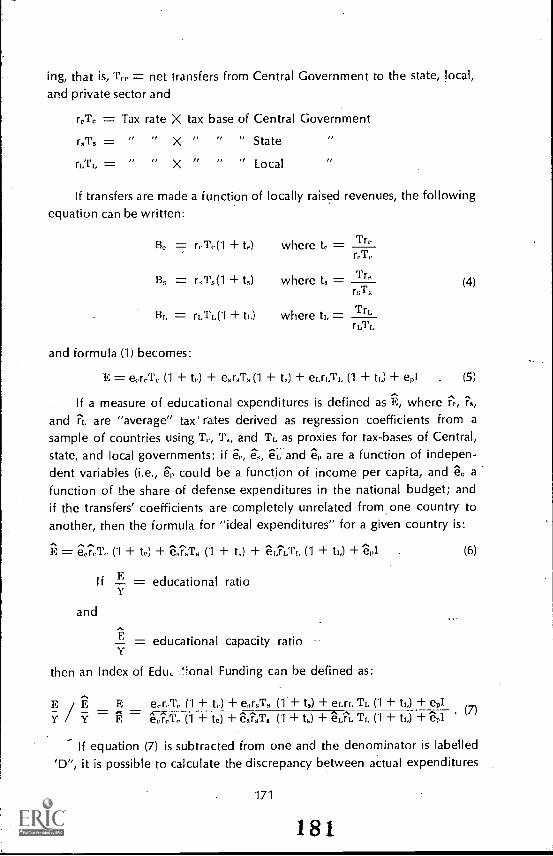
ing, that is, T. = net transfers from Central Government to the state, local,and private sector and
reT. = Tax rate X tax base of Central Government
X
= " " X "" " State
" " Local
If transfers are made a function of locally raised revenues, the followingequation can be written:
Be = re Te(1 + t,) where to = Tre
= r.T,(1 + t3) where Li ;Tr"
131, = rE,T1,(1 + where tr, Tr:
and formula (1) becomes:
(4)
E = erT, (1 + L.) + eo-;1'., (1 + + e1,1-,,Ti, (1 + + (5)
If a measure of educational expenditures is defined as "1-Z, where ise,
and Fr, are "average" tax' rates derived as regression coefficients from asample of countries using L, and Tr, as proxies for tax-bases of Central,state, and local governments; if "ri, and areare a function of indepen-dent variables (i.e., e,, could be a function of income per capita, and a
function of the share of defense expenditures in the national budget; andif the transfers' coefficients are completely unrelated from one country toanother, then the formula for "ideal expenditures" for a given country is:
E = eereT, (1 + te) + (1 + L,) + "er,ILTr, (1 + tr,) + (6)
and
If .LFii = educational ratioY
= educational capacity ratio
then an Index of Edu, 'ional Funding can be defined as:
E E eere're (1 + te) + eprT (1 + t,) + T1, (1 + + epIY / ZeieTe (1 + tc.) + (1 + ts) (1 +
If equation (7) is subtracted from one and the denominator is labelled'D", it is possible to calculate the discrepancy between actual expenditures
171
181
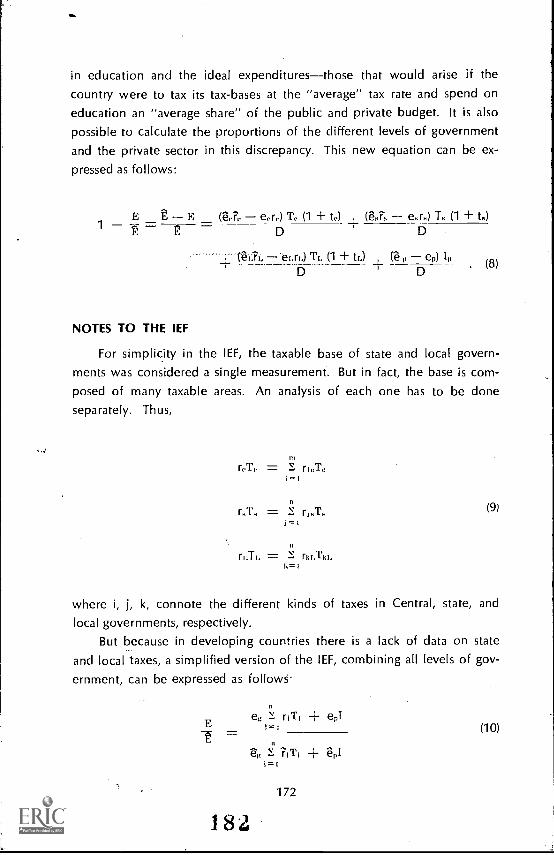
in education and the ideal expendituresthose that would arise if thecountry were to tax its tax-bases at the "average" tax rate and spend oneducation an "average share" of the public and private budget. It is also
possible to calculate the proportions of the different levels of governmentand the private sector in this discrepancy. This new equation can be ex-pressed as follows:
E P - E (ee l eere) TO (1 + te) (8,,F":, e.r.) L, (1 + t.)1 2 2 D-I-
D
tel ehro rrl, (1 + tl.) re p ep) Ii,+ . (8)D D
NOTES TO THE IEF
For simplicity in the IEF, the taxable base of state and local govern-ments was considered a single measurement. But in fact, the base is com-
posed of many taxable areas. An analysis of each one has to be doneseparately. Thus,
= rh,Tei=1
r,T, =y=1
ri.TI,k=1
(9)
where i, j, k, connote the different kinds of taxes in Central, state, andlocal governments, respectively.
But because in developing countries there is a lack of data on stateand local taxes, a simplified version of the IEF, combining all levels of gov-
ernment, can be expressed as followS
Eeg riTI eT
1=1
182
Z.g ?,TI=t
172
(10)
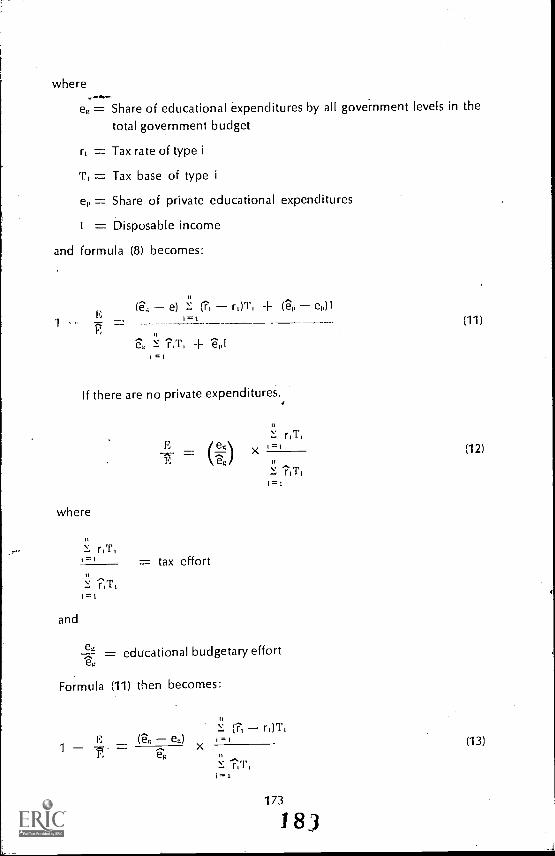
where
e.= Share of educational expenditures by all government levels in the
total government budget
r, = Tax rate of type i
T, = Tax base of type i
e,, = Share of private educational expenditures
I = Disposable income
and formula (8) becomes:
11
(6.; e) r,)T, e,,)1
-- = 1 = 1
= 1
If there are no private expenditures,
where
r,T,
and
= tax effort
= educational budgetary effort
Formula (11) then becomes:
177,
11
(1, r, )T,e.)
Xi=
j
1 = 1
173
183
(12)
(13)
MEANING AND USES OF THE INDEX OF EDUCATIONAL FUNDING
There is a tendency in developing countries and in internationalagencies to use international comparisons to gauge the development orthe performance of ci given country or sector. A Minister of Educationmay often demand that educational expenditures be a given percentageof national income because advanced countries spend such a percentagein their budgets.
This type of comparison ignores the "effort" made by the differentcountries. If countries A and B have the same income per capita, but alarge segment of the economy in A is not monetized, while in B mostof the income comes from miffing, then country B clearly has an easilyaccessible tax-base, while A does not. Therefore, collection of taxes willbe large in B and its public sector will also probably be larger. But, if thepublic sector is the same in both countries, the tax effort in A is clearlylarger.
If most educational expenditures are made locally in country A andat the Central Government level in country B, and if the taxable base oflocal government in country A is small but that of country B is large,
country A's tax effort may be greater than B's, even though B spends more.In other cases, the proportion of education in the total budget may behigh, but the tax effort small, or vice versa. It is therefore very important,for policy reasons, to ascertain in what area an effort is being made:whether in the tax area, in the budget area, or in the private sector.
The IEF describes the relationship of an actual effort to an "averageeffort" in the areas of taxation and educational budgets, at all levels ofgovernment and in the private sector. This average effort is not normative.It reflects the average practice of a group of countries. Its role is an ex-planatory one. If a country has an index less than one, the IEF explainsin what area this country makes a lower effort compared with the statisticalaverage of the sample because the same country may exert an aboveaverage effort in other areas. This does not necessarily mean that effortsshould be raised to reach the average in the particular area. But the IEFprovides an overview that may be useful in a more detailed analysis of aparticular situation. The choice tr tax or not to tax or to increase theshare of education in the budget may depend on dissimilar politicalvariables between countries, in addition to taxable capacity or educationalneeds.
This type of analysis may help the particular country consider thesources of financing e,penditures for education. The increasing demandfor addiiional funds fo education makes it imperative to see whether the
174
184
public or any particular sector of government is meeting the burden. In
this way, the country can avoid overtaxing an already overb.irdened sectorsolely due to historical precedents. There is no doubt that many factorssocial, cultural, historicalhave contributed to the differences of efforts
between countries. But when differences are made explicit, better criteria
for decision-making emerge.For developing countries where a federal system of government exists
that allows provinces to tax economic activity, the IEF can be used todetermine the effort that each province exerts in the educational sector.This relative measurement can provide a basis for distribution of fundsfrom the Central Government to provinces and insure that those provinces
making a stronger effort get a proportionately higher amount of resources.International agencies and donor countries can use the IEF as one of
Me many indicators to guide decisions on the proportion of aid to begiven to different countries in the same way that countries can deal with
their provinces. Classified by private and government sectors, the IEF will
clearly show the willingness of people to spend privately on education
compared with government financing, and thus clarify education's share
in the total budget.An index when measured over time for the same country or province
may help determine whether aid funds were used to replace or to increase
local resources.Finally, some grants-in-aid that require extra large commitments of
local funds can be appraised against the increased burden to the recipient
that this grant may imply.
175
183
PART II
Problems ofEfficiency and Finance
18'3
CHAPTER XV
Efficiency in Education
FINANCING of education concerns not only the analysis of sources offunds, but also the efficient use of these funds. The more efficient theeducational system is, the less funds it will require to fulfill its goals
and more can, therefore, be accomplished within a given budget.But efficiency is an elusive term, and it is imperative that educationists
have a dear understanding of its meanings. They should also know thebasic tools needed to analyze problems in terms of efficiency. By so doing,they will perform more effectively and increase efficiency.
This chapter discusses the concept of efficiency as it is viewed by adecision-maker. Broad areas for improving a system's efficiency are sug-gested.
The basic tools for evaluating the effectiveness of policies and pro-gramscost-benefit and cost-effectiveness analysesare explained. Typesof costs and benefits to be considered are 'dis'thssed in detail. Advantagesand disadvantages of the various ways of applying these approaches arealso discussed.
EFFICIENCY OF A TRANSFORMATION PROCESS
The concept of efficiency applies to a transformation process that goeson in a system. A system is a unit formed of many diverse parts that are
subject to a common plan or that serve a common purpose. A systemtakes an input, or inputs, which it transforms into an output, or outputs.
The efficiency of an educational process is the efficiency of the trans-formation process that goes on in a school system. The school system iscomposed of administrators, teachers, buildings, and equipment, etc. These
parts are combined and directed by economic and social rules. The com-
mon purpose that unites these parts is the education of students to achieve
educational goals. The student (input) enters the school system, fromwhich he later graduates or drops out. His achievement and the success
of the school system as a transformation process influences the economyand society at large.
179
187

itti
In a given school system, efficiency is the relationship between whatis actually achieved (actual output) and what could be achieved with theeconomic resources available (potential output). Conversely, inefficiencycan be defined by the difference between what can be achieved and whatactually is achieved. (Efficiency and inefficiency are always relative terms.)
For instance, a one-room rural school in a developing country thatserves four grades simultaneously and produces few graduates may notbe as inefficient as it looks. If it is impossible to produce more output,quantitatively and/or qualitatively, with the same type of student andeconomic resources available to the system, such a system is efficient.
Reasons for Inefficiency
These reasons can be grouped in two major areas: inefficiency ofoperations, and inefficiency of decision-making.
Inefficiency of Operations This type of inefficiency occurs when mem-bers of the system do not contribute their best potential to the transforma-tion process. In two classes with the same type of teacher, number andtype of students, materials, etc., if one class scores higher in tests, it is
more efficient. If in the same class; the same type of student scores higherat one time than another, the inefficiency exists at the time of the lowerscore.
The basic question here is: If systems are similar, why do results differ?Systems can be similar and yet not exactly the same. Some of the system'smembers may be different and these differences are hard to account for.There are different intangible elementsattitudes, motivation, cultural heri-tageand more tangible aspects, such as incentives for students andteachers which lead to differences in performance.
Inefficiency of Decision-Making Given the knowledge available to thesystem about different transformation processes that provide the sametype of output, and about different transformation processes that providedifferent types of outputs, an inefficiency in decision-making occurs whenchoices between processes are not based on a priori criteria of efficiency.Selecting from different combinations of teachers and training machinesthe most appropriate one to provide mastery of a foreign language involveschoosing between alternative processes to provide the same output. De-ciding what combination of teachers and equipment will prepare studentsto become theoretical physicists rather than engineers would involve theproblem of choice of a transformation process to provide different outputs.
The a priori criterion of efficiency for choosing a process to produce
180
188
a given output is to minimize the costs, implicit and explicit, of producing
a given output. When decisions are made which ignore this criterion, aneconomic inefficiency of choice occurs.
Take the previous example of teachers and teaching machines wheretwo processes produce the same result. One employs four units of teachertime and two units of machine time, the other employs two units of teachertime and four units of machine time. The price of a teaching time unit is$8 and the price of a machine time unit is $3. Since results are the same,the second combination, which costs $28, should be chosen over the firstcombination, which costs $38.
The a priori criterion of economic efficiency for choosing an outputis to choose processes that maximize the economic value of output withina given budget. Decisions which ignore this criterion lead to anothereconomic inefficiency in decision-making.
If different combinations of teachers and equipment costing the sameproduce either engineering graduates or graduates in theoretical physics,the efficiency of the process chosen depends on how an engineer is valuedeconomically in comparison with a physicist. If engineers are more valued,
then producing many physicists is inefficient.
It should be noted that in accordance with economic efficiencycriteria, decisions should vary with changes in either prices of the com-ponents of the process or in the valuation of its outputs. So a decision thatonce was efficient by then prevailing prices of components or outputs maybecome inefficient with changed prices.
It is also important to realize that non-economic criteriapolitical,cultural and, familialcan be a basis for judging efficiency. These criteriaonly affect the choice of a given type of output but not the criterion ofminimization of costs to produce a particular output. If the criterion ofefficiency is political, processes chosen should maximize political benefits.In the previous example of choosing between machines and teachers, un-doubtedly job patronage yields more political benefits and the methodusing more teachers should be chosen. Again, politically it might be moreefficient and beneficial to train graduates faithful to the political party inpower, even though other graduates may be more efficient economically.
In actuality, people seldom apply one "pure" criterion of efficiency.Economic criteria, such as minimization of costs, for providing educationmay be limited by political criteria, such as employing a certain number ofteachers and administrators who belong to a given political party. In
addition, political criteria may be limited by family loyalty, and so on.Analysis of efficiency cannot ignore such factors.
181
189
In summary, inefficiency of operations results from unwillingness orinability to apply one's full capacity in the service of the transformationprocess because of lack of motivation, poor attitudes, conflict betweengoals of the individual and the institution, etc. All these contribute differ-ences between what could be obtained with a given process and whatactually is obtained.
Inefficiency of decision-making results from selecting a process thatdoes not minimize production costs, or selecting a process that producesan output which a criterion of efficiency indicates is wrong.
Besides these inefficiencies, there are inefficiencies that are combina-tions of the above, such as inefficiency of operations combined with thechoice of the wrong process to produce the wrong output, or inefficiencyof choice of process and output.
The Sources of Inefficiency
Once inefficencies are found, it is important to determine their causeand who or what is responsible for them. To do this, the system beingscrutinized must be defined in terms of boundaries, environment, knowl-edge, and time.
The criteria for an educational system's boundariesgeographical,institutional, legal, organizational, etc.are varied. Boundaries affect theefficiency of decision-making and determine responsibility for decision-making. For example, if a high school is told to graduate a certain numberof students in vocational subjects, and the high school does this at thelowest possible cost, and the graduates do not find jobs, that high schoolwhose boundaries do not include the decision-making process thatdetermines the type of graduatecannot be held accountable for theinefficient decision-making in choice of output. If boundaries of theschool expand to include the decision-making process on the type ofgraduate, and the high school still produces the wrong output, then thereis an inefficiency, and the school is responsible.
The environment in which the system operates should also be spec-ified. Environment is the sum of external conditions and influences thataffect the functioning of the system. This definition of environment doesnot necessarily imply physical proximity. When dealing with elementaryschooling, the environment may be a neighborhood. With a university,it may be the nation or even the international scientific community.
The results of a transformation process, operating on given outputs ina particular system, vary as the environment changes. A school operatingin a peaceful environment produces a higher output than the same school
182
1 9 0

operating in a violent one. An environment with attitudes hostile to learn-ing will adversely affect the output of a system. An authoritative and in-timidating environment will inhibit innovationsa.'
Not only are a system's operations influenced by the environment,but also the system affects the environment to the extent that its outputbecomes part of the environment.
A process that goes on in a system where there is human activity de-pends on knowledge. Nature has many systems of transformation processesplants and organisms grow without human intervention. But the momenta person fertilizes the soil or harvests fruits, he introduces human knowl-edge into the natural system. The reason for organizing a system, the waythe system is organized to transform a given input into 'desired outputs,and the way it adapts to changing conditionsthese all depend on theknowledge available to the system's members. When the knowledge avail-able to the members of the system is inadequate or the data on whichthey base decisions are faulty, inefficiencies will certainly result.
All transformation processes require time. The analysis of a processmust allow for the time necessary to complete the process. Time is espe-cially important in the-'educational transformation process because thisprocess is generally superimposed on the human growth process.
Alleviating Inefficiencies
The inefficiencies of a process_can be alleviated through interveningto increase knowledge and to change the boundaries of the process andthe environment.
Increasing Knowledge Here knowledge is classified into two majortypes:
Skilled Knowledge: the way to do things
Informational Knowledge: having the facts and the understandingof them necessary to make the right decisions or to initiate actions.
How to make a choice between alternatives is part of skilled knowl-edge. The number of alternatives available or data on which technicalknowledge is based is informational knowledge.
Skilled knowledge is acquired through education and experience. Theway things are done at present is learned. At a higher level, knowledge
leads to solving new problems by creating new ways to do things. This
knowledge usually results from intuition which leads to research and ex-
perimentation.For a teacher, operational knowledge may be the knowledge needed
183
191
to teach effectively in a classroom. This can be acquired in a teacher'scollege, or through a teacher apprenticeship program.
Informational knowledge depends on generating information andconveying it. For an administrator, informational knowledge may be deter-mining the optimal number of students in the educational system. Thesedata have to be generated, most probably, by members of the process, andthen transmitted to the administrator.
More operational knowledge is always good. If it can be applied, itdecreases inefficiency. More informational knowledge does not necessarilyincrease efficiency because the'quality of informational knowledge has tomatch. quantity. If data generated are faulty, a larger amount of such datacauses greater inefficiency of choice. Similarly, if the information systemthat transmits the data is faulty, a larger system without improved quality oftransmission may also cause greater inefficiency. Even an improvement inthe information systemif the generation of data is faulty--may actuallyworsen the overall efficiency of choice. But, generally, an improvement inthe quality of knowledge generated improves the efficiency of choice.
Changing the Boundaries of a Process Sometimes, inefficiencies ofchoice of a process are decreased by changing its boundaries. Existing
processes can be merged. Different schools can be consolidated or aregional school can decide its own curriculum rather than accept it as
formulated by higher authorities. Changing the boundaries may also meanbreaking up larger processes into smaller independent ones. The issue ofcentralization versus decentralization falls under the category of changingboundaries.
Changing the Environment Processes are affected by the environmentand, in turn, affect it. The output of a process can be changed by interven-ing in the environment. The environment mainly affects the inefficiencyof operations. One way to improve this kind of inefficiency is to affect theincentives of the members of the process. The value that society places onthe teaching profession compared with other professions, the teacher'sfreedom of self-expression, the attitudes of parents and children, the waythe whole economic and social system outside the process operatesallthese affect operational efficiency. If these are changed, the efficiency ofthe process can he changed.
Summary of Efficiency Concepts
The concept of efficiency in education applies to a transformationprocess that goes on in an educational systemits goals, components, and
184
192
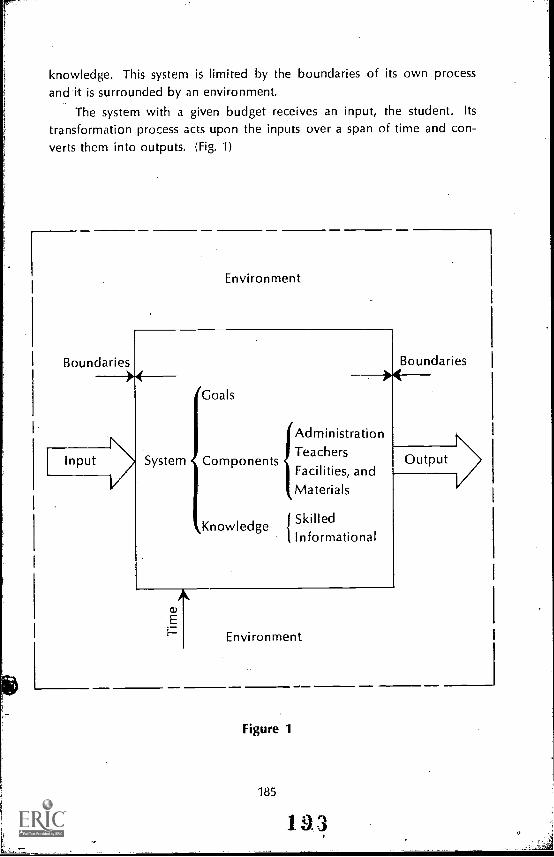
knowledge. This system is limited by the boundaries of its own processand it is surrounded by an environment.
The system with a given budget receives an input, the student. Its
transformation process acts upon the inputs over a span of time and con-verts them into outputs. (Fig. 1)
Boundaries
Environment
IAdministration
System ComponentsTeachers
Facilities, andMaterials
Goals
Boundaries
Knowledge j SkilledInformational
Environment
Figure 1
185
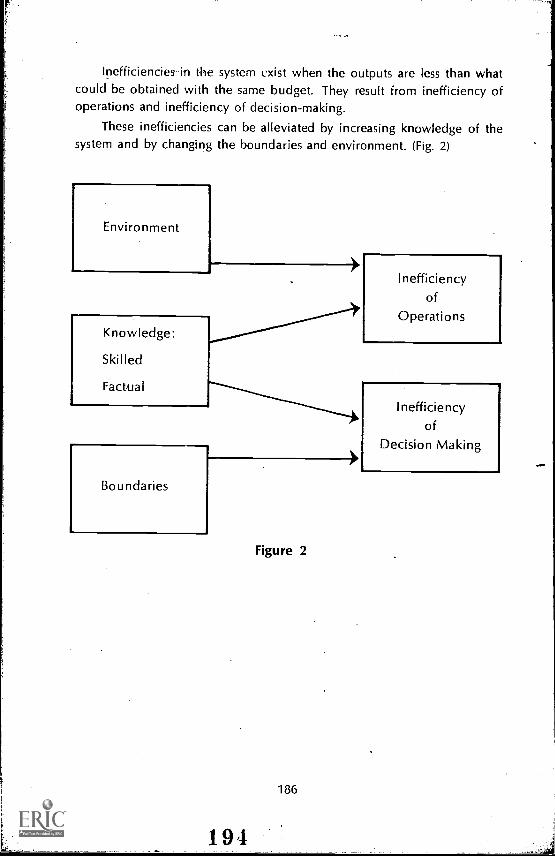
Inefficiencies in the system exist when the outputs are less than whatcould be obtained with the same budget. They result from inefficiency ofoperations and inefficiency of decision-making.
These inefficiencies can be alleviated by increasing knowledge of thesystem and by changing the boundaries and environment. (Fig. 2)
Environment
Knowledge:
Skilled
Factual
Boundaries
19,
Figure 2
186
Inefficiencyof
Operations
Inefficiencyof
Decision Making
INCREASING EFFICIENCY
Increasing efficiency through intervention in a system always involvescosts. Making an existing system into a different one by increasing knowl-edge, changing boundaries and environments, not only requires expendingextra resources but also threatens those who benefit from the status quo. Adecision to intervene and change the system must be based on a com-parison of benefits and costs of intervention. The use of two analytictoolscost-benefit and cost-effectiveness analysesleads to a productivedecision.
Cost-Benefit Analysis
Cost-benefit analysis compares monetary benefits with the costs ofcarrying out the program. In the early 20th century, cost-benefit analysis,which had reached a high level of sophistication, was used to determinethe profitability of canal construction. Later, river-basin and water resourcedevelopment decisions were based' on cost-benefit analysis. Since theSecond World War, it has been applied to a variety of economic and socialinvestments in developed as well as in developing countries.
Cost-benefit analysis involves three major areas: measuring or esti-mating costs; measuring or estimating benefits; and applying a criterionsuch as maximizing the ratio of benefits to costsand choosing the pre-ferred course of action.
Costs to be Considered in Cost-Benefit Analysis
There are four general types of costs to be considered here: marginalcosts; external or spillover costs; opportunity costs; arid shadow prices. (Fordefinitions of specific types of costs, see pp. 201-202.)
Marginal Costs
Only the extra cost of a new course of action should be considered.No matter what course is taken, the fixed costs already incurred will notenter into consideration. But average costs might differ sharply from mar-ginal costs. A decision between building two schools, one for $100,000,holding 500 students, the other for $120,000, accommodating 700 students,involves determining if an extra capacity of 200 students is worth an addi-ional $20,000.
External or Spillover Costs
Costs must include not only direct costs of a program but also "ex-ternal costs." These are costs imposed by the program on people or a part
187
193
of society outside the boundaries of the program. If a program requires theservices of teachers with particular qualifications who are already in scarcesupply or requires special or additional teacher training, these costs shouldbe included in total costs. If a new program of agricultural science educa-tion attracts teachers from graduates trained as agricultural extension agents,the cost of training more extension agents should be included when makinga cost-benefit analysis of a national program.
Opportunity Costs
Because every course of action or every program excludes other pro-grams or other courses of action, opportunity costs (that is, the foregonebenefits of not choosing another course of action) should be consideredin any cost-benefit analysis. Measuring costs of education should includethe "opportunity costs" of the student's timethe income foregone by thestudent while studyingin addition to costs of providing the education.In calculating the cost of school buildings, the accounting concept woulduse amortization. The opportunity cost concept would use the intereston the sale value of the facility or its rental value, whichever is higher.
Shadow Prices
Opportunity costs of production factors in the economy or the costof programs depend on what quantity of different components is used
and on their prices. Prices are given data in moat cases. Prices of personnel,services, and buildings are data a school administrator must base decisionson. But for the entire economic system, actual prices need not be taken asgiven data. Decisions do not have to be guided totally by market priceswhich may not reflect an economy's scarcities, or which may reflect onlymonopolistic practices. Under these circumstances, maximizing the GNPrequires using the factors of production according to their opportunitycost. Using these "shadow prices" disregards the actual cost accordingto market prices. Therefore, in cost-benefit analysis, the costs of nationalprograms should not be measured by actual or accounting costs.
For example, a Ministry of Education is considering Educational Tele-vision (ETV) for teaching science and has the following alternatives:
Alternative AIntroduction of ETV
Costs of equipment and programming $5,000,000
Interest rate on loan 5%/yearVariable teaching costs 100 pesos/student year
Official exchange rate 10 pesos/dollar
188
1.93

Alternative 13Local Retraining of Science Teachers
Training of teachers 10,000,000 pesos
Local interest rate 7%/yearVariable teaching costs 300 pesos/student year
Students 10,000
The total yearly costs of A would be:
5,000,000 dollars X .05 X 10 pesos/dollar + 10,000 students X 100pesos/student = 3,500,000 pesos.
The total yearly costs of B would be:
10,000,000 pesos X .07 300 pesos/student X 10,000 students =3,700,000 pesos.
Therefore, according to this analysis, ETV should be chosen. This wouldbe a good decisiotras long as teachers' salaries and the current foreignexchange rates are at optimum prices in a general economic context.
But if the "real" exchange rate or the "shadow" exchange rate is 15pesos/dollar, then Alternative A would cost
5,000,000 X .05 X 15 -F 10,000 X 100 = 4,750,000 pesos.
If the "shadow" wagesopportunity costs of teachers in the economyis only half of actual wages, then Alternative A would cost
5,000,000 X .05 X 15 -1- 10,000 X 100/2 = 4,250,000 pesos,
and Alternative B would cost
10,000,000 X .07 300/2 X 10,000 = 2,200,000 pesos.
In either case, the choice of Alternative A would not be efficient for theentire economy.
Benefits to Be Included in Cost-Benefit Analysis
There are two types of benefits to be considered: direct, and indirector external benefits.
Direct Benefits
Direct benefits of a program that can be measured in money shouldbe included. The benefits of vocational training programs are the differencebetween what the student would earn without the training and what hewill earn with it.
Many direct benefits cannot be expressed monetarily. The value of
189
1.97
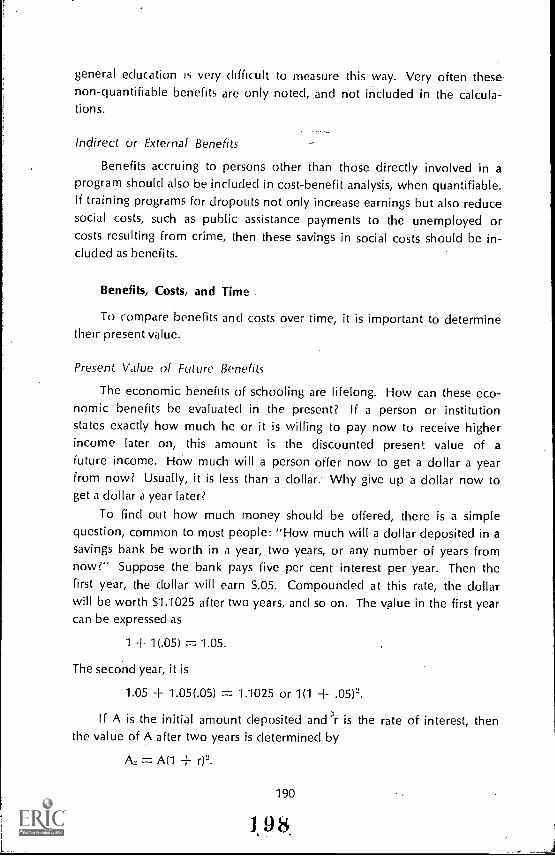
general education is very difficult to measure this way. Very often thesenon-quantifiable benefits are only noted, and not included in the calcula-tions.
Indirect or External Benefits
Benefits accruing to persons other than those directly involved in a
program should also be included in cost-benefit analysis, when quantifiable.If training programs for dropouts not only increase earnings but also reducesocial costs, such as public assistance payments to the unemployed orcosts resulting from crime, then these savings in social costs should be in-cluded as benefits.
Benefits, Costs, and Time
To compare benefits and costs over time, it is important to determinetheir present value.
Present Value of Future Benefits
The economic benefits of schooling are lifelong. How can these eco-nomic benefits be evaluated in the present? If a person or institutionstates exactly how much he or it is willing to pay now to receive higherincome later on, this amount is the discounted present value of a
future income. How much will a person offer now to get a dollar a yearfrom now? Usually, it is less than a dollar. Why give up a dollar now toget a dollar a year later?
To find out how much money should be offered, there is a simplequestion, common to most people: "How much will a dollar deposited in asavings bank be worth in a year, two years, or any number of years fromnow?" Suppose the bank pays five per cent interest per year. Then thefirst year, the dollar will earn $.05. Compounded at this rate, the dollarwill be worth $1.1025 after two years, and so on. The value in the first yearcan be expressed as
1 + 1(.05) = 1.05.
The second year, it is
1.05 + 1.05(.05) = 1.1025 or 1(1 + .05)2.
If A is the initial amount deposited aner is the rate of interest, thenthe value of A after two years is determined by
= A(1 +
190
1,98.
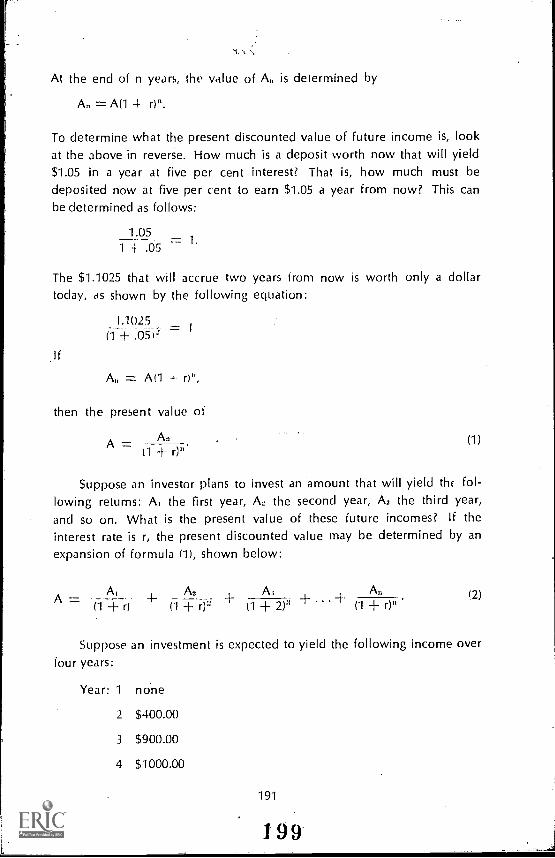
At the end of n years, the value of A is determined by
A,, = A(1 + 0".
To determine what the present discounted value of future income is, lookat the above in reverse. How much is a deposit worth now that will yield$1.05 in a year at five per cent interest? That is, how much must bedeposited now at five per cent to earn $1.05 a year from now? This canbe determined as follows:
1.051 .05
= 1.
The $1.1025 that will accrue two years from now is worth only a dollartoday, as shown by the following equation:
If
1.1025I.
A,, = Arl f r1 ",
then the present value of
AA
--= (1 + r)"(1)
Suppose an investor plans to invest an amount that will yield the fol-lowing returns: A, the first year, A, the second year, A3 the third year,and so on. What is the present value of these future incomes? If theinterest rate is r, the present discounted value may be determined by anexpansion of formula (1), shown below:
A2A =7: +A, A + A' F . . +(1 + (1 + r)- (1 + 2)' ` (1 r)"
(2)
Suppose an investment is expected to yield the following income overfour years:
Year: 1 none
2 $400.00
3 $900.00
4 $1000.00
191
199
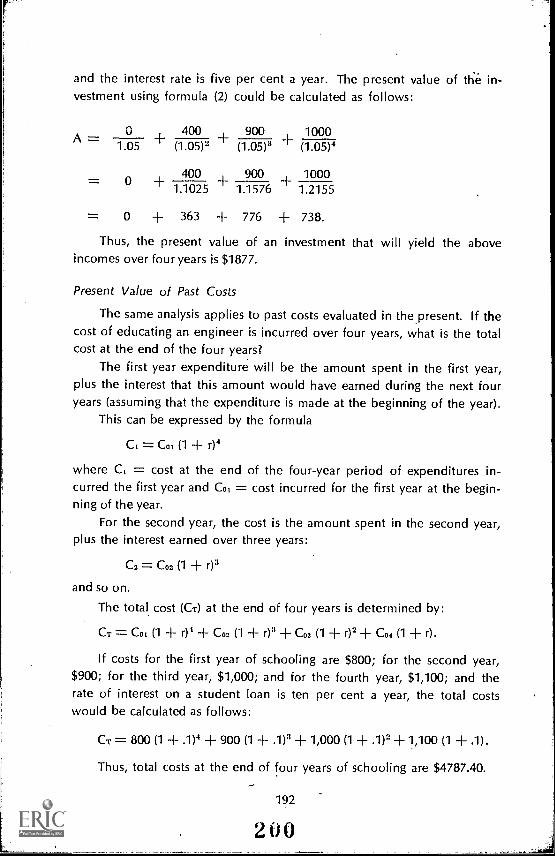
and the interest rate is five per cent a year. The present value of the in-vestment using formula (2) could be calculated as follows:
O 400 900 1000A =1.05 (1.05)2 (1.05)3 (1.05)4
O + 400 900 10001.1025 1.1576 1.2155
0 -I- 363 + 776 + 738.Thus, the present value of an investment that will yield the above
incomes over four years is $1877.
Present Value of Past Costs
The same analysis applies to past costs evaluated in the present. If thecost of educating an engineer is incurred over four years, what is the totalcost at the end of the four years?
The first year expenditure will be the amount spent in the first year,plus the interest that this amount would have earned during the next fouryears (assuming that the expenditure is made at the beginning of the year).
This can be expressed by the formula
C1 = C01 (1 + r)4
where C1 = cost at the end of the four-year period of expenditures in-curred the first year and Co, = cost incurred for the first year at the begin-ning of the year.
For the second year, the cost is the amount spent in the second year,plus the interest earned over three years:
C2 = CO2(1 r)3
and so on.
The total cost (Cr) at the end of four years is determined by:
CT = C01 (1 + r)4 + CO2 (1 + r)3 + CO3 (1 + r)2 C04 (1 r).
If costs for the first year of schooling are $800; for the second year,$900; for the third year, $1,000; and for the fourth year, $1,100; and therate of interest on a student loan is ten per cent a year, the total costswould be calculated as follows:
CT = 800 (1 + .1)4 -I- 900 (1 + .1)2 + 1,000 (1 + .1)2 + 1,100 (1 + .1).
Thus, total costs at the end of four years of schooling are $4787.40.
192
200
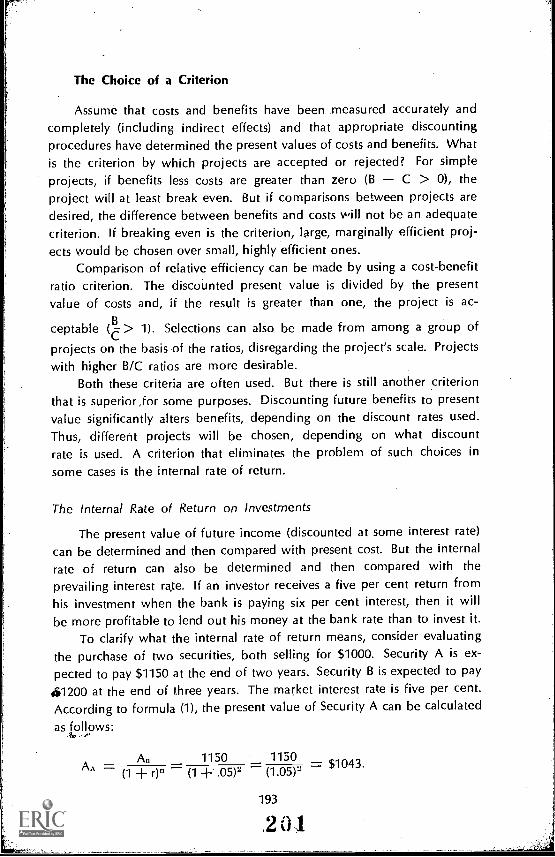
rThe Choice of a Criterion
Assume that costs and benefits have been measured accurately andcompletely (including indirect effects) and that appropriate discountingprocedures have determined the present values of costs and benefits. Whatis the criterion by which projects are accepted or rejected? For simple
projects, if benefits less costs are greater than zero (B C > 0), theproject will at least break even. But if comparisons between projects aredesired, the difference between benefits and costs will not be an adequatecriterion. If breaking even is the criterion, large, marginally efficient proj-ects would be chosen over small, highly efficient ones.
Comparison of relative efficiency can be made by using a cost-benefitratio criterion. The discounted present value is divided by the presentvalue of costs and, if the result is greater than one, the project is ac-
ceptable (C > 1). Selections can also be made from among a group of
projects on the basis of the ratios, disregarding the project's scale. Projectswith higher B/C ratios are more desirable.
Both these criteria are often used. But there is still another criterionthat is superior for some purposes. Discounting future benefits to presentvalue significantly alters benefits, depending on the discount rates used.Thus, different projects will be chosen, depending on what discountrate is used. A criterion that eliminates the problem of such choices in
some cases is the internal rate of return.
The Internal Rate of Return on Investments
The present value of future income (discounted at some interest rate)can be determined and then compared with present cost. But the internal
rate of return can also be determined and then compared with theprevailing interest rate. If an investor receives a five per cent return fromhis investment when the bank is paying six per cent interest, then it willbe more profitable to lend out his money at the bank rate than to invest it.
To clarify what the internal rate of return means, consider evaluatingthe purchase of two securities, both selling for $1000. Security A is ex-pected to pay $1150 at the end of two years. Security B is expected to pay
4$1200 at the end of three years. The market interest rate is five per cent.According to formula (1), the present value of Security A can be calculated
as follows:
An 1150 1150 $1043.(1 + r)" (1 + .05)2 (1.05)2
193
.2 0 1
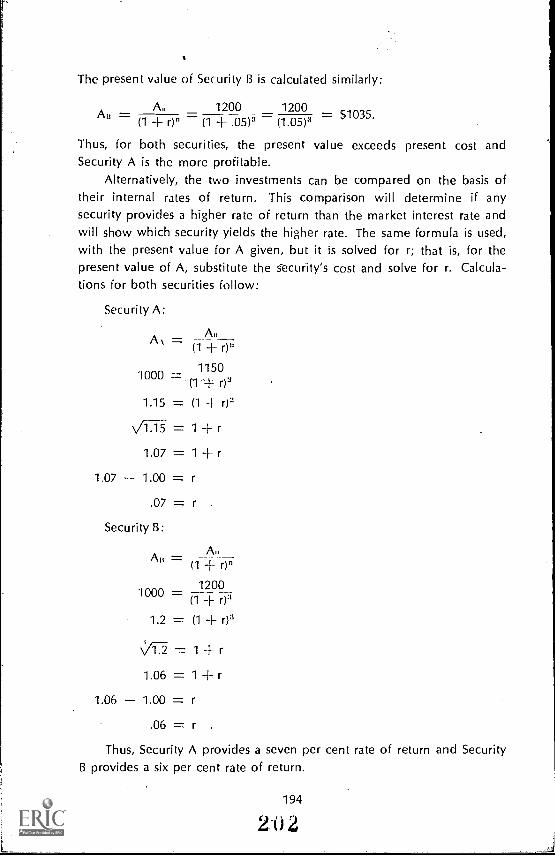
The present value of Security B is calculated similarly:
1200 1200A I = $1035.(1 + on (1 + .05)3 (1.05)3
Thus, for both securities, the present value exceeds present cost andSecurity A is the more profitable.
Alternatively, the two investments can be compared on the basis oftheir internal rates of return. This comparison will determine if anysecurity provides a higher rate of return than the market interest rate andwill show which security yields the higher rate. The same formula is used,with the present value for A given, but it is solved for r; that is, for thepresent value of A, substitute the security's cost and solve for r. Calcula-tions for both securities follow:
Security A:
AllA = (1 + On
10001150
=-(1-.1- 03
1.15 = (1 +
V1.13 = 1 r
1.07 = 1 r
1.07 1.00 = r
.07 = r
Security B:
AAB = n
(1 + On
1000 = 1200-f- 03
1.2 = (1 + r)8
= 1 r
1.06 = 1 r
1.06 1.00 = r
.06 = r .
Thus, Security A provides a seven per cent rate of return and SecurityB provides a six per cent rate of return.
194
2:02

Calculating the rate of return is not always as simple as the above.In this case, a lump sum was expected after a certain number of years.When the future receipts vary over a period of years, the same formula,formula (2), can be used:
A1
r)
A2 AA =(1 r) (1 (1 + r)"
A, A1, A2, etc. are given and the problem is to determine r, the rate ofreturn. But there is no easy solution, except to estimate r by tryingvarious values for it that will make the equation work. If 1 r is constant,
and it is assumed that r = .05; then 1 r will be 1.05. Square the equationfor the second year, cube it for the third, etc. In some cases, tables ofpresent values may make estimations more convenient.
To see how r is estimated in this case, assume the cost of the asset is$1500 and the estimated income for an investment over a four-year periodis:
Year: 1 None
2 $400.00
3 $900.00
4 $1000.00
Then,
400 900 1000+$1500 = 0(1 -+ r)2 (1 + r? + (1 + 04
Taking eight per cent as an experimental r yields:
400 900 1000 = 1792.Ti.0811 (1.08)' (1.08)
Since the result is greater than $1500, a higher rate of discount should betried. The following table summarizes these calculations.
Year Income Present Values at Different Assumed Rates of Return
6% 8% 10% 13% 14%
$ 0 0 0 0 0 0
400 357 342 331 313 308
3 900 756 714 677 611 608
1000 793 736 679 613 592
A6 = 1906 A8 = 1792 A10 = 1687 A13 = 1537 A14 = 1508
195
0.3
The rate of return that verifies the equation is approximately 14 per cent.This rate was arrived at by trying different rates until the present discountedvalue of future incomes equalled or approximated the cost of the invest-ment.
In summary, the internal rate of return is the annual percentage rateof discount that equates the present value of lifetime benefits resulting froman investment with the costs of the investment. Instead of choosing adiscount rate arbitrarily to compare the excess of benefits over costs, thiscriterion uses the data on costs and benefits to determine a discount rateor rate of return. The higher this "internal rate of return," the better theproject. Comparisons between projects based on their internal rates ofreturn are valid, regardless of the project's scale and regardless of anyarbitrary choice of discount rate.
A Modified Cost-Benefit Analysis
Many benefits in education cannot be quantified in money. It is usefulto adjust the methodology to include non-monetary benefits. The non-monetary benefits can then be appraised in terms of their costs and corn-,pared with other expenditures on non-marketable goods. This can be rep-resented symbolically as:
Bt =- Bn +
Bnp = Ct Bp
B, = total benefitsB,, = pecuniary benefits
B,, = .non-pecuniary benefits
Ct = total costs.
If the monetary benefits for a pre-school education of a child, asmeasured by employment opportunity of the mother, are $100 and the costs,$150, the non-monetary benefitssuch as the well-being of the child andthe happiness of the mothercan be said to cost $50. This imputed costfor non-monetary benefits can be compared with similar expenditures forother non-marketable goods, such as the provision of parks, cleaner air orpublic entertainment.
Summary of. Cost-Benefit Analysis
Macro-level applications of cost-benefit analysis may offer useful guidesto policy and sectoral strategy. But they are too general for detailed deci-sions on the best design of projects within the various education levels.
196
2 0 4
Cost-benefit analysis may be very useful at the macro-level, if applied withcare and sophistication.
As discussed above, cost-benefit analysis is complex. Decision-makersshould weigh the cost of making a cost-benefit study against the benefitsof the information. There are many possibilities of errors and omissions.Decision-makers should avoid taking the findings of cost-benefit analysisas absolute indicators of the worth of projects. ost-benefit analyses mayadd to available information. They do not reveal unequivocal, "right"answers.
Cost-Effectiveness Analysis
Cost-effectiveness analysis has a broader scope than cost-benefit anal-ysis which compares only monetary values. Cost-effectiveness analysisrelates non-monetary benefits to monetary costs. It does this by measuringhow effectively a specific program meets its objectives.
Cost-effectiveness analysis measures two aspects of a program: econ-omy and efficiency.
Program Economy as Measured by Cost-Effectiveness Quantitative goals
are set, then costs of different alternatives are compared. The less costlyalternative is the better one.
Program EfficienCy as Measured by Cost-Effectiveness With a fixed bud-get, different alternatives are compared. Levels of effectiveness are
determined, though these are not stated in terms of money. The alternativewith greater effectiveness yields more output and is better.
When alternatives differ in both costs and effectiveness, there is nodefinitive basis of comparison. A common fallacy is to choose an alterna-tive that minimizes the cost-effectiveness ratio. Assume that Alternative Araises reading scores from 500 to 600 and costs $10,000. Alternative B raisesscores from 500 to 540 and costs $5,000. The cost-effectiveness ratio for Ais $10,000/100 = $100/unit score. The cost-effectiveness ratio for B is
$5,000/540 = $125/unit score. Here the analysis does not indicate thatAlternative A should be chosen because the cost-effectiveness pe'r unit islower. Rather, the decision-maker should ask if an extra 60 units is worthan increased expenditure of $5,000. Cost-effectiveness analysis works bestfor lower level decisions because it focuses on specific program alternatives.I t helps the optimal allocation of the resources of a fixed budget to differentprograms.
The range of alternatives compared sometimes presents problems. Thewider the range of alternatives or the greater the degree of innovativeness
197
2C)5
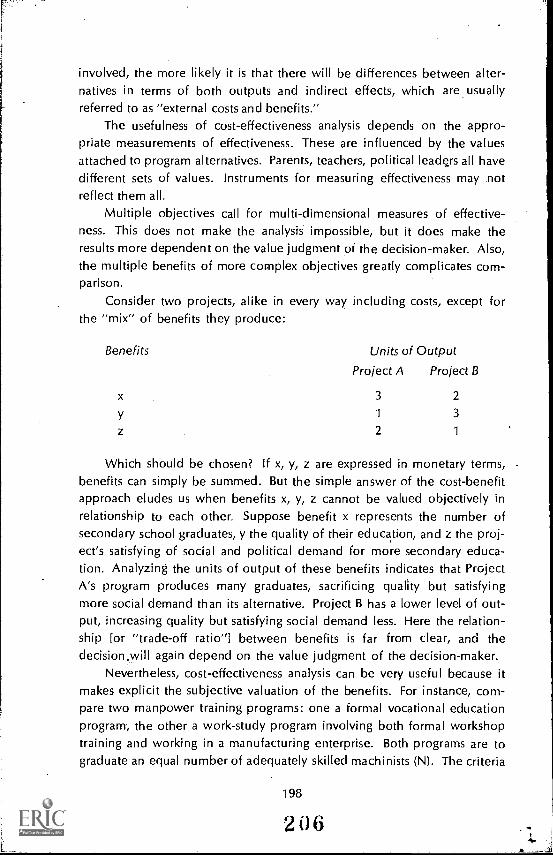
involved, the more likely it is that there will be differences between alter-natives in terms of both outputs and indirect effects, which are usuallyreferred to as "external costs and benefits."
The usefulness of cost-effectiveness analysis depends on the appro-priate measurements of effectiveness. These are influenced by the valuesattached to program alternatives. Parents, teachers, political leaders all havedifferent sets of values. Instruments for measuring effectiveness may notreflect them all.
Multiple objectives call for multi-dimensional measures of effective-ness. This does not make the analysis impossible, but it does make theresults more dependent on the value judgment of the decision-maker. Also,the multiple benefits of more complex objectives greatly complicates com-parison.
Consider two projects, alike in every way including costs, except forthe "mix" of benefits they produce:
Benefits Units of Output
Project A Project B
x 3 2
Y 1 3
z 2 1
Which should be chosen? If x, y, z are expressed in monetary terms,benefits can simply be summed. But the simple answer of the cost-benefitapproach eludes us when benefits x, y, z cannot be valued objectively inrelationship to each other. Suppose benefit x represents the number ofsecondary school graduates, y the quality of their education, and z the proj-ect's satisfying of social and political demand for more secondary educa-tion. Analyzing the units of output of these benefits indicates that ProjectAs program produces many graduates, sacrificing quality but satisfyingmore social demand than its alternative. Project B has a lower level of out-put, increasing quality but satisfying social demand less. Here the relation-ship [or "trade-off ratio "] between benefits is far from clear, and thedecision will again depend on the value judgment of the decision-maker.
Nevertheless, cost-effectiveness analysis can be very useful because itmakes explicit the subjective valuation of the benefits. For instance, com-pare two manpower training programs: one a formal vocational educationprogram, the other a work-study program involving both formal workshoptraining and working in a manufacturing enterprise. Both programs are tograduate an equal number of adequately skilled machinists (N). The criteria
198
206
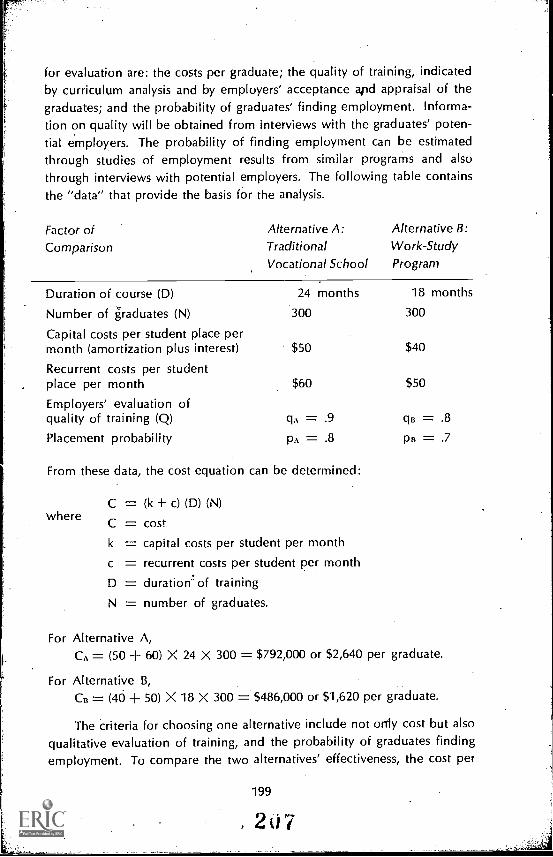
for evaluation are: the costs per graduate; the quality of training, indicatedby curriculum analysis and by employers' acceptance apd appraisal of thegraduates; and the probability of graduates' finding employment. Informa-tion on quality will be obtained from interviews with the graduates' poten-tial employers. The probability of finding employment can be estimatedthrough studies of employment results from similar programs and alsothrough interviews with potential employers. The following table containsthe "data" that provide the basis for the analysis.
Factor of Alternative A: Alternative B:
Comparison Traditional Work-StudyVocational School Program
Duration of course (D) 24 months 18 months
Number of graduates (N) 300 300
Capital costs per student place permonth (amortization plus interest) $50 $40
Recurrent costs per studentplace per month $60 $50
Employers' evaluation ofquality of training (Q) qA = .9 qB = .8Placement probability pA = .8 pB = .7
From these data, the cost equation can be determined:
whereC = (k + c) (D) (N)C = costk = capital costs per student per month
c = recurrent costs per student per month
D = duration.of trainingN = number of graduates.
For Alternative A,CA = (50 + 60) X 24 X 300 = $792,000 or $2,640 per graduate.
For Alternative B,CB = (40 + 50) X 18 X 300 = $486,000 or $1,620 per graduate.
The criteria for choosing one alternative include not only cost but alsoqualitative evaluation of training, and the probability of graduates findingemployment. To compare the two alternatives' effectiveness, the cost per
199
207
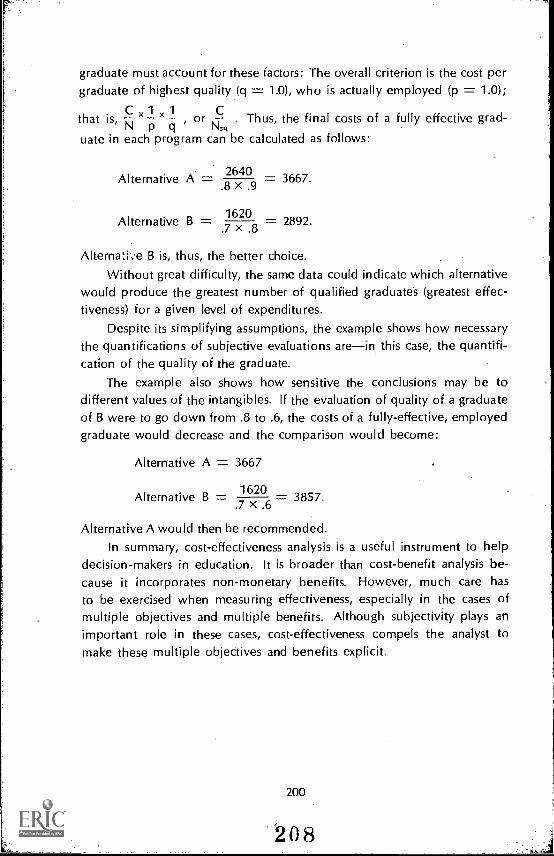
graduate must account for these factors: The overall criterion is the cost pergraduate of highest quality (q = 1.0), who is actually employed (p = 1.0);
that is, C 1 x 1Np
or Thus, the final costs of a fully effective grad-
uatep q
uate in each program can be calculated as follows:
Alternative A = 2640 = 3667..8 X .9
Alternative B = 1620 = 2892..7 x .8
Alternati,..e B is, thus, the better choice.
Without great difficulty, the same data could indicate which alternativewould produce the greatest number of qualified graduates (greatest effec-tiveness) for a given level of expenditures.
Despite its simplifying assumptions, the example shows how necessarythe quantifications of subjective evaluations arein this case, the quantifi-cation of the quality of the graduate.
The example also shows how sensitive the conclusions may be todifferent values of the intangibles. If the evaluation of quality of a graduateof B were to go down from .8 to .6, the costs of a fully-effective, employedgraduate would decrease and the comparison would become:
Alternative A = 3667
Alternative B = 1620 = 3857..7 x .6
Alternative A would then be recommended.In summary, cost-effectiveness analysis is a useful instrument to help
decision-makers in education. It is broader than cost-benefit analysis be-cause it incorporates non-monetary benefits. However, much care hasto be exercised when measuring effectiveness, especially in the cases ofmultiple objectives and multiple benefits. Although subjectivity plays animportant role in these cases, cost-effectiveness compels the analyst tomake these multiple objectives and benefits explicit.
200
208
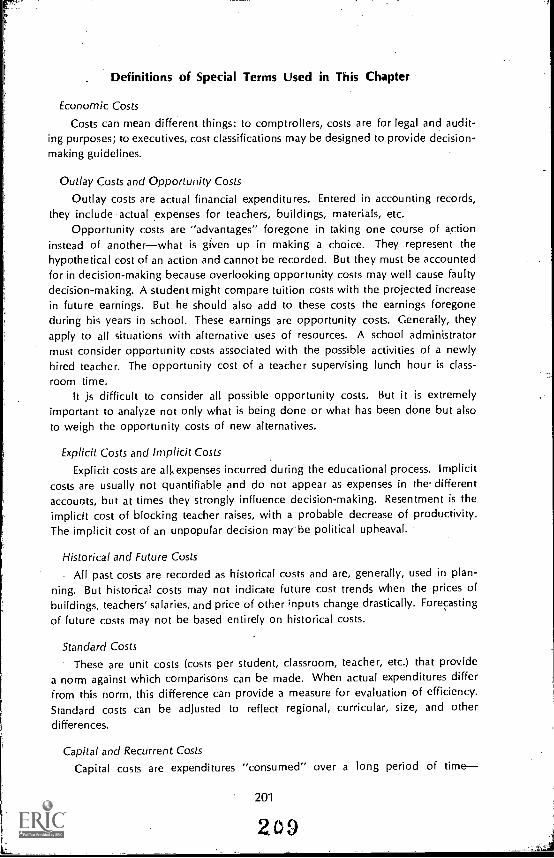
Definitions of Special Terms Used in This Chapter
Economic Costs
Costs can mean different things: to comptrollers, costs are for legal and audit-ing purposes; to executives, cost classifications may be designed to provide decision-making guidelines.
Outlay Costs and Opportunity Costs
Outlay costs are actual financial expenditures. Entered in accounting records,they include actual expenses for teachers, buildings, materials, etc.
Opportunity costs are "advantages" foregone in taking one course of actioninstead of anotherwhat is given up in making a choice. They represent thehypothetical cost of an action and cannot be recorded. But they must be accountedfor in decision-making because overlooking opportunity costs may well cause faultydecision-making. A student might compare tuition costs with the projected increasein future earnings. But he should also add to these costs the earnings foregoneduring his years in school. These earnings are opportunity costs. Generally, theyapply to all situations with alternative uses of resources. A school administratormust consider opportunity costs associated with the possible activities of a newlyhired teacher. The opportunity cost of a teacher supervising lunch hour is class-room time.
It is difficult to consider all possible opportunity costs. But it is extremelyimportant to analyze not only what is being done or what has been done but alsoto weigh the opportunity costs of new alternatives.
Explicit Costs and Implicit Costs
Explicit costs are ali.,expenses incurred during the educational process. Implicitcosts are usually not quantifiable and do not appear as expenses in the differentaccounts, but at times they strongly influence decision-making. Resentment is theimplicit cost of blocking teacher raises, with a probable decrease of productivity.The implicit cost of an unpopular decision may be political upheaval.
Historical and Future Costs
All past costs are recorded as historical costs and are, generally, used in plan-ning. But historical costs may not indicate future cost trends when the prices ofbuildings, teachers' salaries, and price of other inputs change drastically. Forecastingof future costs may not be based entirely on historical costs.
Standard Costs
These are unit costs (costs per student, classroom, teacher, etc.) that providea norm against which comparisons can be made. When actual expenditures differfrom this norm, this difference can provide a measure for evaluation of efficiency.Standard costs can be adjusted to reflect regional, curricular, size, and other
differences.
Capital and Recurrent CostsCapital costs are expenditures "consumed" over a long period of time
201
209
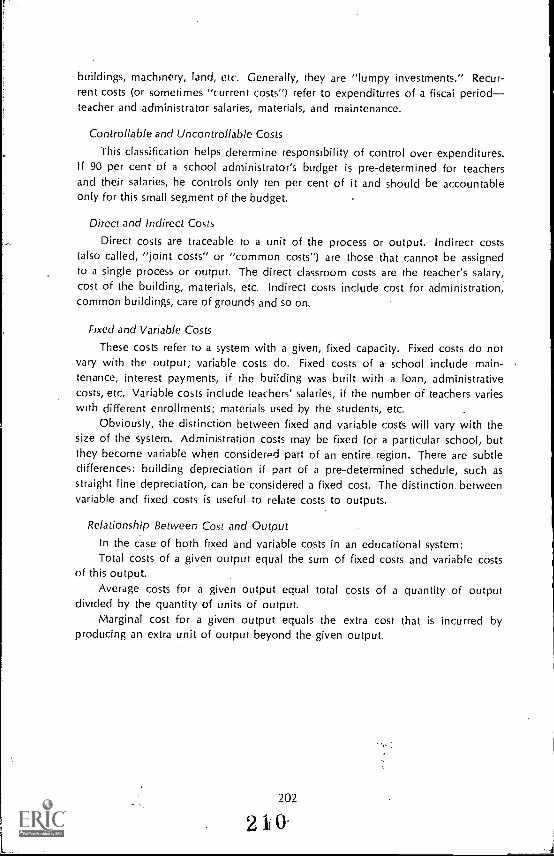
buildings, machinery, land, etc. Generally, they are "lumpy investments." Recur-rent costs (or sometimes "current costs") refer to expenditures of a fiscal periodteacher and administrator salaries, materials, and maintenance.
Controllable and Uncontrollable Costs
This classification helps determine responsibility of control over expenditures.If 90 per cent of a school administrator's budget is pre-determined for teachersand their salaries, he controls only ten per cent of it and should be accountableonly for this small segment of the budget.
Direct and Indirect Costs
Direct costs are traceable to a unit of the process or output. Indirect costs(also called, "joint costs" or "common costs") are those that cannot be assignedto a single process or output. The direct classroom costs are the teacher's salary,cost of the building, materials, etc. Indirect costs include cost for administration,common buildings, care of grounds and so on.
Fixed and Variable Costs
These costs refer to a system with a given, fixed capacity. Fixed costs do notvary with the output; variable costs do. Fixed costs of a- school include main-tenance, interest payments, if the building was built with a loan, administrativecosts, etc. Variable costs include teachers' salaries, if the number of teachers varieswith different enrollments; materials used by the students, etc.
Obviously, the distinction between fixed and variable costs will vary with thesize of the system. Administration costs may be fixed for a particular school, butthey become variable when considered part of an entire region. There are subtledifferences: building depreciation if part of a pre-determined schedule, such asstraight line depreciation, can be considered a fixed cost. The distinction betweenvariable and fixed costs is useful to relate costs to outputs.
Relationship Between Cost and Output
In the case of both fixed and variable casts in an educational system:Total costs of a given output equal the sum of fixed costs and variable costs
of this output.Average costs for a given output equal total costs of a quantity of output
divided by the quantity of units of output.Marginal cost for a given output equals the extra cost that is incurred by
producing an extra unit of output beyond the given output.
202
2 O.
CHAPTER XVI
An Evaluation of the Outputsof Education
IMPROVING the educational system's efficiency calls for a clear assessmentof the benefits that the improvements bring. These benefits are the
increased outputs of the educational system.Education has two kinds of outputs: those that fulfill stated goals; and
those that are the inevitable and unplanned by-products of education.There may be conflicts between goals. Learning experiences directed
toward one goal may develop traits incompatible with another goal. Anyevaluation of outputs must consider these potential conflicts.
This chapter provides a framework for evaluating educational outputs.Such a framework is needed to put the different measurements of educa-tional output into an overall perspective. Specific measurements can thendetermine both the benefits from improvements in an education system andthe overall effectiveness of educational policy.
Of particular interest here are methods of evaluating educationaloutputs. These measure individual learning achievements in cognitive,
psychomotor, and affective areas. These achievements, in turn, are mea-sured by standards that indicate the value of attaining goals, and thevalue of by-products of education to the individual and to society. Theseevaluations, together with a measurement of cost, provide the basis forcost-benefit and cost-effectiveness analyses.
EDUCATIONAL OU1'190illitLATED TO STATED GOALS
Societal goals generate instrument goals. The.se in turn call for process
goals. Similarly, where education is the instrument, there are three goallevels: societal, educational, and learning process.
Societal Goals These goals usually express a country's long-range aims.Because they express the aims of diverse groups, societal goals are usually
broad and diffuse.
Educational Goals These goals are more specific than societal goals
203
2 1 1
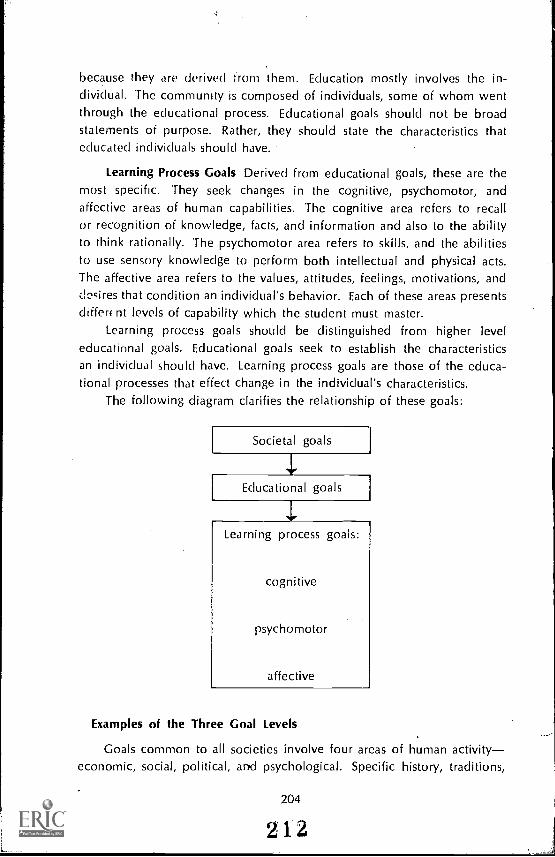
because they are derived from them. Education mostly involves the in-dividual. The community is composed of individuals, some of whom wentthrough the educational process. Educational goals should not be broadstatements of purpose. Rather, they should state the characteristics thateducated individuals should have.
Learning Process Goals Derived from educational goals, these are themost specific. They seek changes in the cognitive, psychomotor, andaffective areas of human capabilities. The cognitive area refers to recallor recognition of knowledge, facts, and information and also to the abilityto think rationally. The psychomotor area refers to skills, and the abilitiesto use sensory knowledge to perform both intellectual and physical acts.The affective area refers to the values, attitudes, feelings, motivations, anddccires that condition an individual's behavior. Each of these areas presentsdiffer( nt levels of capability which the student must master.
Learning process goals should be distinguished from higher leveleducational goals. Educational goals seek to establish the characteristicsan individual should have. Learning process goals are those of the educa-tional processes that effect change in the indiviclual's characteristics.
The following diagram clarifies the relationship of these goals:
Societal goals
Educational goals
Learning process goals:
cognitive
psychomotor
affective
Examples of the Three Goal Levels
Goals common to all societies involve four areas of human activityeconomic, social, political, arid psychological. Specific history, traditions,
204
212
,o.1":
customs, social patterns, economic and political systems, and experiencesdetermine a country's societal goals. These, in turn, determine its instru-ment and process goals. To show the interaction between societal, educa-tional and learning process goals, economic, social, political, and psycho-logical goals will be examined.
Economic Many countries have similar overall economic objectives,such as increased productivity, optimal use of human and natural resources,and an equitable distribution of goods. To achieve these goals, countries areplacing more emphasis on education.
Some educational goals are derived from the society's economic goals.A social goal of increased productivity might foster educational goals thatinstill punctuality, discipline, and industry. The educational process wouldthen initiate goals in the three capability areas to instill these desiredcharacteristics in individuals. In the cognitive area, knowledge of assemblyline procedures would foster discipline. In the psychomotor area, dexteritywould yield greater efficiency on the job. In the affective area, changes inattitudes on the importance of individual contributions to the country'seconomy might lead to greater productivity.
Social Despite cultural and political differences, most societies wantadequate living standards in health, welfare, and housing. Many societiespursue "social justice." This is achieved through positive interactions be-tween its diverse groups. The nature of the group's relationships dependsupon a society's accepted attitudes towards social stratification and mo-bility. Social tranquility is related to these two social goals and involvesrespect for law and the continued functioning of society.
Education creates goals based on these societal ones, such as produc-ing socially responsible, moral, and knowledgeable individuals. In turn,the learning process is based on the educational goals. Cognitive andpsychomotor skills that achieve better health, nutrition, and communica-tion are important. Affective changes, such as imparting a sense of socialresponsibility, commitment, morality, and strength of character, wouldhelp achieve the educational and societal goals stated above.
Political Despite diverse political institutions, most societies want stablegovernment institutions, non-violent changes in power, and secure inter-national stature. Moreover, many societies promote nationalism, patriotism,and public policies based on specific societal and political needs.
Education helps a society achieve these political goals. Educational
goals are directed toward creating effective citizens. Some countries mightinterpret this as effective decision-making; others, as encouraging docility
205
21.1
in serving the state. In any case, an important goal .for education is tostrengthen the acceptance of national political ideals and values.
Based on stated political goals, the learning process creates learninggoals. In the cognitive area, literacy skills might be stressedin additionto specific knowledge of a country's history. In the psychomotor area,gymnastics and marching could be used to emphasize political identifica-tion; speaking skills could be developed for political purposes. Attitudesand behavioral patterns which will promote desired political goals couldalso be encouraged.
Psychological Structured education probably has its greatest potentialimpact in this area. Many societies seek some personal fulfillment thatdeepens their members' humanity. In some societies, personal fulfillmentmay mean service to the state or the subordination or integration of theself into a stratified national order. In others, personal fulfillment maymean developing its individuals as far as possible within the limits ofsocietal requirements.
In some societies, educational goals might thus promote individualcreativity, aesthetic appreciation, morality, and rationality. The learningprocess, in turn, would develop goals to increase such capabilities. In thecognitive area, knowledge acquired at any age for its own sake wouldhelp fulfill the individual. In the psychomotor area, coordination andskillssay, in athletics, dance, and amateur performing groupsthat in-tensify sense perceptions would enhance individual achievement. In theaffective area, socially acceptable personal values could be instilled. Thetable on the following page summarizes examples of each goal level withinthe substantive areas just discussed.
Goal Conflicts
Goals may be categorized within a framework of specific levelssocietal, educational, and learning processacross four areas of a givensocial systemeconomic, social, political, and psychological.
To measure outputs against goals, all those changes in capabilitiesachieved in the effort to fulfill one particular goal should ideally be iso-lated and measured. But, the intermingling of learning experiences di-rected toward educational goals makes it difficult to relate acquiredcapabilities to specific goals. Further, efforts toward diverse goals oftenconflict. The nature of these conflicts must be nized in order todevise valid and reliable measurement techniques. Conflicts can exist ateach goal level in two ways: within one substantive area, and across allsubstantive areas.
206
21 4
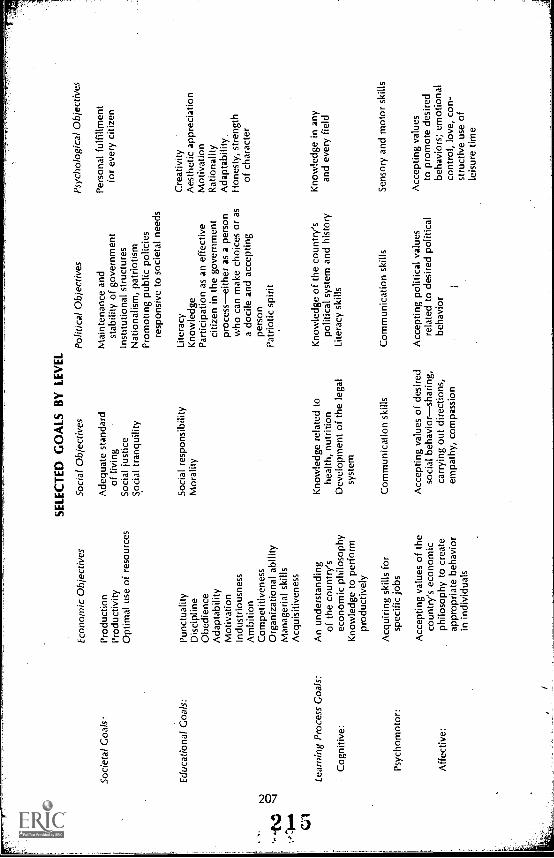
Soc
ieta
l Goa
ls:
Edu
catio
nal G
oals
:
Lear
ning
Pro
cess
Goa
ls:
Cog
nitiv
e:
Psy
chom
otor
:
Affe
ctiv
e:
Eco
nom
ic O
bjec
tives
Pro
duct
ion
Pro
duct
ivity
Opt
imal
use
of r
esou
rces
Pun
ctua
lity
Dis
cipl
ine
Obe
dien
ceA
dapt
abili
tyM
otiv
atio
nin
dust
rious
ness
Am
bitio
nC
ompe
titiv
enes
sO
rgan
izat
iona
l abi
lity
Man
ager
ial s
kills
Acq
uisi
tiven
ess
An
unde
rsta
ndin
gof
the
coun
try'
sec
onom
ic p
hilo
soph
yK
now
ledg
e to
per
form
prod
uctiv
ely
Acq
uirin
g sk
ills
for
spec
ific
jobs
Acc
eptin
g va
lues
of t
heco
untr
y's
econ
omic
philo
soph
y to
cre
ate
appr
opria
te b
ehav
ior
in in
divi
dual
s
SE
LEC
TE
D G
OA
LS B
Y L
EV
EL
Soc
ial O
bjec
tives
Ade
quat
e st
anda
rdof
livi
ngS
ocia
l jus
tice
Soc
ial t
ranq
uilit
y
Soc
ial r
espo
nsib
ility
Mor
ality
Kno
wle
dge
rela
ted
tohe
alth
, nut
ritio
nD
evel
opm
ent o
f the
lega
lsy
stem
Com
mun
icat
ion
skill
s
Acc
eptin
g va
lues
of d
esire
dso
cial
beh
avio
rsha
ring,
carr
ying
out
dire
ctio
ns,
empa
thy,
com
pass
ion
Pol
itica
l Obj
ectiv
es
Mai
nten
ance
and
stab
ility
of g
over
nmen
tIn
stitu
tiona
l str
uctu
res
Nat
iona
lism
, pat
riotis
mP
rom
otin
g pu
blic
pol
icie
sre
spon
sive
to s
ocie
tal n
eeds
Lite
racy
Kno
wle
dge
Par
ticip
atio
n as
an
effe
ctiv
eci
tizen
in th
e go
vern
men
tpr
oces
seith
er a
s a
pers
onw
ho c
an m
ake
choi
ces
or a
sa
doci
le a
nd a
ccep
ting
pers
onP
atrio
tic s
pirit
Kno
wle
dge
of th
e co
untr
y's
polit
ical
sys
tem
and
his
tory
Lite
racy
ski
lls
Com
mun
icat
ion
skill
s
Acc
eptin
g po
litic
al v
alue
sre
late
d to
des
ired
polit
ical
beha
vior
Psy
chol
ogic
al O
bjec
tives
Per
sona
l ful
fillm
ent
for
ever
y ci
tizen
Cre
ativ
ityA
esth
etic
app
reci
atio
nM
otiv
atio
nR
atio
nalit
yA
dapt
abili
ty.
Hon
esty
, str
engt
hof
cha
ract
er
Kno
wle
dge
in a
nyan
d ev
ery
field
Sen
sory
and
mot
or s
kills
Acc
eptin
g va
lues
to p
rom
ote
desi
red
beha
vior
s; e
mot
iona
lco
ntro
l, lo
ve, c
on-
stru
ctiv
e us
e of
leis
ure
time
Goal Conflicts at the Societal Level Few contradictions are likely herebecause aims are stated broadly and are determined by the samepeople. A system's economic and political objectives will at least becompatible with, if not support, efforts to achieve most social goals. Themost likely area of conflict will occur when personal fulfillment is in someway inhibited or restricted by broader social constraints.
Goal Conflicts at the Educational Level First, there are conflicts in ob-jectives within one substantive area. In the economic area, successfullyinducing punctuality, discipline, and obedience can conflict with thequalities of self-motivation, ambition, competitiveness, and accrisitiveness.In the political realm, literacy and knowledge might weaken the in-dividual's willingness to accept national culture and values that conflictwith newly-found rational attitudes. In the psychological domain, creativitysometimes requires escape from a rational approach. Also, excessive self-motivation could have negative effects upon moral character and adapt-ability to change.
The second type of educational goal-level conflict is among substan-tive areas. The potential conflict relationships are: economic with social,economic with political, economic with psychological, social with political,social with psychological, and political with psychological.
Economic and social goals may conflict. Economic and social under-standings, attitudes, and skills may be incompatible. Ambition, acquisitive-ness, and competitiveness, all of which can elevate productivity, can alsoundermine social responsibility or effect static economic power arrange-ments that minimize social mobility. Excessive ambition, acquisitiveness,and competitiveness by some may interfere with the securing of adequateliving standards for all.
Economic and political goals may conflict. Ambition, competitiveness,and acquisitiveness can be used by those with economic power to manip-ulate individuals' political actions. Political ideology may, in turn, inhibit theapplication of knowledge and skills to increase economic gains.
Economic and psychological goals may conflict. Managerial economicattitudes of industriousness, ambition, acquisitiveness, competitiveness, andorganizational ability theoretically to not conflict with self-motivation,rationality, and creativity. They can, however, weaken morality, honesty,and strength of character; and habits of punctuality, discipline, and obe-dience may inhibit self-motivation and creativity.
Social and political goals may conflict. Educational goals pursuedwithin social and political areas are less likely to produce conflicts because
208
216
political institutions implement policies supposedly responsive to socialneeds.
Social and psychological goals may conflict. Many desirable behaviortraits support the goal of social responsibility but self-motivation andcreativity may be impeded where social responsibility entails conformityor docility.
Political and psychological goals may conflict. Morality and rationalitysupport the knowledgeable citizen's participation in government by making
choices. But they can also give rise to serious reservations toward accept-ing national values.
Goal Conflicts at the Learning Process Level Within one substantivearea, i.e., an economic, social or political area, the usual difficulty at thislevel comes from improper emphasis on one capability area over theothers. Cognitive skills have often been stressed to the exclusion ofcoordinated, attitudinal and sensory capabilities. For example, knowledge
of racial, religious, and cultural differences may still leave a person hostile
toward minority groups, if he does not also have corresponding attitudes of
tolerance and respect for others.Learning process goals may also conflict when skills of one substan-
tive area are diametrically opposed to skills of another. The psychological
understanding that leads to personal fulfillment often opposes the social
understanding of a person's role as a responsible member of society. In
the affective realm, a society that restricts experiences in decision-making,
effecting choices, and independent thinking, in order to maintain a rigid
political system risks destroying the personal initiative needed for intelligent
and often crucial economic decisions. In addition, a society that teaches
respect and tolerance for diverse cultural values and extremes of cultural
independence may fragment its political unity.The process also affects the student's school careeroften a long
period of his life. If the student's well-being is an intended process goal,this may sometimes conflict with other more specific goals. For instance,
some cognitive skills can be acquired at less cost under rigid disciplinaryconditions. But rigidity in an institution's learning approach may be detri-
mental to the student's happiness and may inhibit his innovative capabilities.
THE BY-PRODUCTS OF EDUCATION
The fulfillment of societal goals creates by-products. Some of these are
inevitable side effects of pursuing societal goals; some are unintended
outcomes.
209
217

There are two prominent, inevitable side effects of education in manysocieties: the selective and custodial functions. By necessity, those edu-cated are selected, classified, and identified because education is directedto meet economic and social demands, such as occupational training andsocial tranquility. With demands for more women in the work force,educationespecially pre-primary schoolinghas taken on a custodialfunction. In some schools, hours are extended to enable mothers to work.
Concerning unintended by-products of education, providing moreyears of schooling per student in rural areas may accelerate migration tourban areas. More universal education often raises the formal educationalrequirements of jobs. It can also create a demand for more education,-,--tokeep up with one's neighbors. Another unintended by-product may bethe role of education as catalyst in changing society's goals.
Many of these by-products coattjawkb_a_country's societal goals.Migration of educated people may conflict with societal policies of well-balanced regional development. Shifting formal educational requirementsupward conflicts with minimizing occupational training costs. Some by-products may also interfere with educational goals. The selective functionmay interfere with the development of creative and knowledgeable stu-dents.
METHOD OF EVALUATING EDUCATIONAL OUTPUTS
As stated earlier, a complete evaluation of education must measuretwo kinds of outputs: those designed to meet goals; and the by-productsof the educational process. These outputs can only be quantified byassessing education's effects on the individual. The data for such measure-ment are individual indicators which reflect specific achievements at thelearning process level in the cognitive, psychomotor, and affective areas.Measurements of intelligence, aptitude, attitudes, skill development, andfactual knowledge are individual indicators.
The measurement of outputs by themselvds does not indicate theirvalue to society. To obtain this, the measurements must be related to astandard. In evaluating outputs of education, there are two standards ofmeasurements: the value of attaining goals (societal, educational, and learn-ing process); and the value of by-products to the individual and society.All of these must be measured by individual indicators, as well as by socialindicators composed of data quantifying conditions of society. The methodof evaluating educational outputs can be represented by the diagram onthe following page.
210
21S
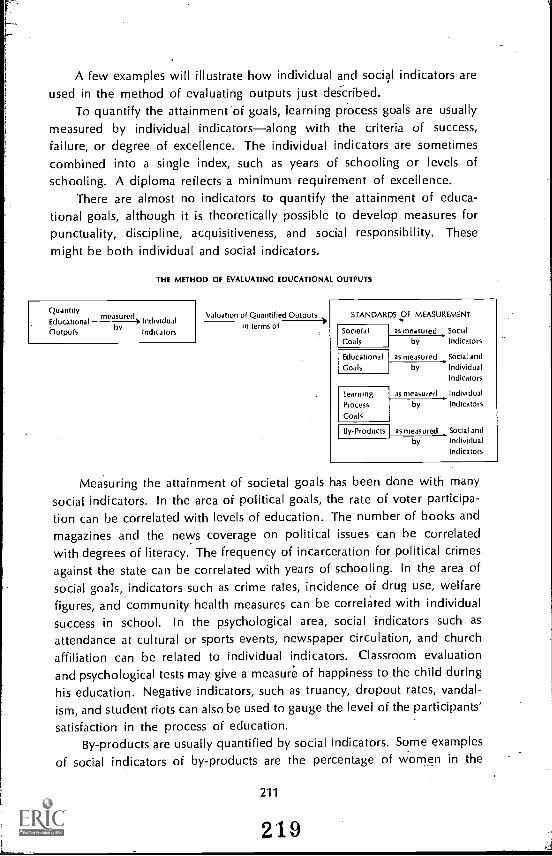
A few examples will illustrate how individual, and social indicators are
used in the method of evaluating outputs just described.To quantify the attainment of goals, learning process goals are usually
measured by individual indicatorsalong with the criteria of success,
failure, or degree of excellence. The individual indicators are sometimescombined into a single index, such as years of schooling or levels ofschooling. A diploma reflects a minimum requirement of excellence.
There are almost no indicators to quantify the attainment of educa-tional goals, although it is theoretically possible to develop measures forpunctuality, discipline, acquisitiveness, and social responsibility. These
might be both individual and social indicators.
THE METHOD OF EVALUATING EDUCATIONAL OUTPUTS
QuantityEducational measured> IndividualOutputs by Indicators
Valuation of Quantified Outputsin terms of
STANDARDS OF MEASUREMENT
SocietalGoals
EducationalGoals
Learning
Process
Goals
as measured Social
by Indicators
as measured Social and
by IndividualIndicators
as measured Individualby Indicators
4-Products as measured Social and
by IndividualIndicators
Measuring the attainment of societal goals has been done with many
social indicators. In the area of political goals, the rate of voter participa-tion can be correlated with levels of education. The number of books andmagazines and the news coverage on political issues can be correlatedwith degrees of literacy. The frequency of incarceration for political crimesagainst the state can be correlated with years of schooling. In the area ofsocial goals, indicators such as crime rates, incidence of drug use, welfarefigures, and community health measures can be correlated with individualsuccess in school. In the psychological area, social indicators such asattendance at cultural or sports events, newspaper circulation, and churchaffiliation can be related to individual indicators. Classroom evaluation
and psychological tests may give a measure of happiness to the child duringhis education. Negative indicators, such as truancy, dropout rates, vandal-ism, and student riots can also be used to gauge the level of the participants'
satisfaction in the process of education.By-products are usually quantified by social indicators. Some examples
of social indicators of by-products are the percentage of women in the
211
219
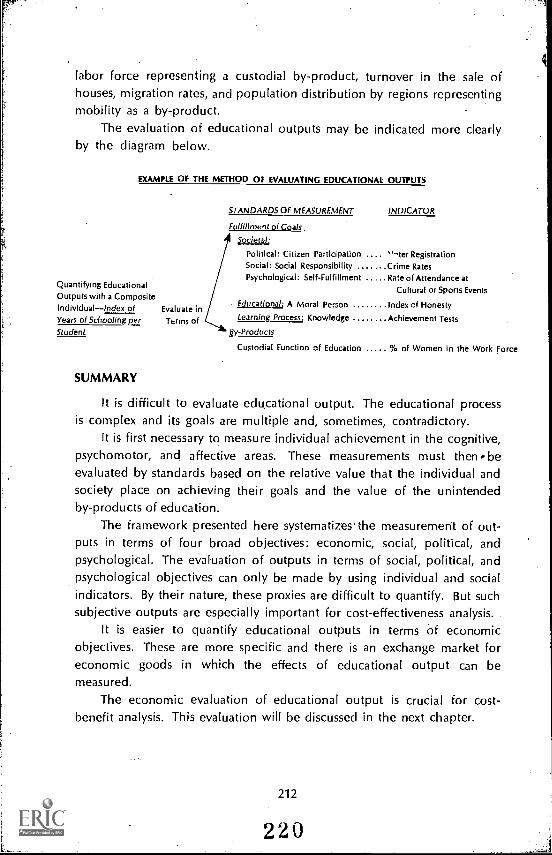
labor force representing a custodial by-product, turnover in the sale ofhouses, migration rates, and population distribution by regions representingmobility as a by-product.
The evaluation of educational outputs may be indicated more clearlyby the diagram below.
EXAMPLE OF THE METHOD OIF EVALUATING EDUCATIONAL OUTPUTS
Quantifying EducationalOutputs with a CompositeIndividualIndex of Evaluate inYears of Schooling per Terms ofStudent
SUMMARY
STANDARDS OF MEASUREMENT INDICATOR
Fulfillment of Coals
octet d:
Political: Citizen Participation .... "-'ter RegistrationSocial: Social Responsibility Crime RatesPsychological: Self-Fulfillment Rate of Attendance at
Cultural or Sports Events
Educational: A Moral Person Index of HonestyLearning Process: Knowledge Achievement Tests
By-Products
Custodial Function of Education % of Women in the Work Force
It is difficult to evaluate educational output. The educational processis complex and its goals are multiple and, sometimes, contradictory.
It is first necessary to measure individual achievement in the cognitive,psychomotor, and affective areas. These measurements must then beevaluated by standards based on the relative value that the individual andsociety place on achieving their goals and the value of the unintendedby-products of education.
The framework presented here systematizes' the measurement of out-puts in terms of four broad objectives: economic, social, political, andpsychological. The evaluation of outputs in terms of social, political, andpsychological objectives can only be made by using individual and socialindicators. By their nature, these proxies are difficult to quantify. But suchsubjective outputs are especially important for cost-effectiveness analysis.
It is easier to quantify educational outputs in terms of economicobjectives. These are more specific and there is an exchange market foreconomic goods in which the effects of educational output can bemeasured.
The economic evaluation of educational output is crucial for cost-benefit analysis. This evaluation will be discussed in the next chapter.
CHAPTER XVII
The Economic Value ofEducational Outputs
MEASURING the economic output of education within the frameworkused in Chapter XVI relates measurable achievements in the cognitive,
affective, and psychomotor areas, or a composite index of them, such asyears and levels of schooling or types of education to indicators thatreflect economic achievement of societal goalsproduction and produc-tivity.
Economic evaluation of educational outputs is difficult. An industryor firm's output is clearly measured in the exchange market. Prices gen-erally reflect the interaction between the value consumers place on theparticular good and its production costs. The prices, under particularconditions, reflect the value of the good to society.
An educated person's value to society far exceeds the economic valueas measured by income or increases in productivity. But even the deter-mination of the strict economic significance of the output of an educationalprocess is difficult. Each approach to measuring the economic value has
problems. In this chapter, the advantages and disadvantages of each ofthe major approaches will be discussed.
THE RATE OF RETURN APPROACH
Calculating internal rates of return has been widely used to justifyinvestment in educationcompared with investment in other sectorsor to promote investment of different types of education. The rate ofreturn to education is the discount rate that equalizes the present valuesof an individual's additional lifetime earnings due to attaining an additionaleducation level and the costs of that level of schooling.
Social versus Private Returns
Costs and benefits can be measured differently from the society's orthe individual's point of view. From a social benefit viewpoint, all costs,both direct and indirect, of providing the education are included as well
213
221
as all benefits before taxes. Private cost-benefit calculations would includethe costs to the individual of obtaining the educationtuition and othercosts, including foregone income and the after-tax benefits from increasedearnings. The following table indicates the major items included in publicand private calculations of educational costs and benefits.
Private Calculations
Tuition, other fees, andexpenditures related toobtaining education
Costs Opportunity cost ofafter-tax (i.e., net)income foregone
Discounted incrementin after-tax incomeover what would havebeen earned withoutthe education, adjustedfor the probabilityof employment
Benefits External private benefits(e.g., better style oflife, prestige, greaterjob, and social mobility)
Social Calculations
Cost of administrationCost of teacher trainingCost of capitalCost of instruction
Opportunity of before-tax(i.e., gross) income foregone
Discounted incrementin gross (before-tax) incomeattributable to the education,adjusted for the probabilityof employment
External public benefits
(e.g., better educatedcitizens, cultural values,reduced dependency, andcrime, etc.)
Private rates of return to education tend to be higher than public rates.Unless the tuition cost fully covers the several costs of producing theeducation, private costs will be considerably lower than public costs.This is an important finding of cost-benefit analysis. If private returns aremuch higher than public returns, the private "demand" for educationalplaces will be far greater than the supply of places based only on socialreturns.
Private and social rates of return can be applied to measure lifetimeearning differentials for elementary, secondary, and higher levels ofeducation. The rate of return for an additional year of schooling can be
214
2,22
measured by comparing earning differentials for each grade. Rate of returncalculations for elementary and secondary education can also include thevalue of the option to continue one's education. Earning differencesbetween literates and non-literates can also be used to calculate the rate ofreturn to literacy.
Advantages of the Rate of Return Method
The rate of return method includes both costs and benefits of invest-ments in education. Expressed as a percentage, the rate of return toeducation is easily compared with that of other investments, such asphysical capital.
Determining the private rate of return is useful primarily in individualplanning for education. Where the student pays large parts of the cost, acountry may use the private rate of return to determine how much ofthese costs a student should pay.
Using the social rate of return, .a country can decide optimum enroll-ments at different education levels. At the optimum enrollment level, therate of return of different educational levels should be the same. This ratecould be the rate at which the society discounts future increases in nationalincome.
In general, the rate of return method helps examine the quantitativeeffects of alternatives. The effect of different discount rates, and the relativeeffect of different abilities and other non-schooling factors on earnings canbe studied by comparing people with the same amount of schooling butwith different incomes.
Criticism of the Rate of Return Method
Some major criticisms of the rate of return method as a measure ofeducational efficiency question the assumptions inherent in the method-ology. Questions related to these assumptions are discussed below.
Is Schooling the Only Determinant of Earning? Not all differences inlifetime earnings of people with different levels of education are relatedto schooling. There are other influences at work: home, outside environ-ment, peer groups, etc. Ascribing the attainment of cognitive, psychomotor,and affective skills only to school experience is incorrect. The assumptionthat formal education increases productivity can be questioned. Formal
education may rather be a selection mechanism for higher-paying jobs. In
any case, other attributesability, personality, motivation, and familybackgroundshow positive correlation with both earnings and educationalattainment.
215
223
Do Earnings Reflect Productivity? Imperfections in the labor marketand external benefits duie to education do not justify equating increases ofearnings received because of higher education levels with increases in
productivity.In a competitive labor market in equilibrium, wages equal the marginal
productivity of laborthe extra value of production due to an extra use ofa unit of labor. But the allocation of labor does not necessarily occur asspecified in this competitive model. Firms may engage in "conspicuousconsumption"paying for levels of employee education higher than reallynecessary for efficient production. The wage structure may be rigid, ortradition-bound by the status value of higher education. Non-monetaryattractions tend to be greater in jobs reserved for the highly educated.Strong union practices in certain occupations restrict entry and keep wageshigh.
To correct for the inaccuracy of real wages as a measure of produc-tivity, shadow wagesnot actual wagesshould be used to measureeconomic value. In societies whose shadow wages are significantly lowerthan the market wage, this correction will lower the rate of return.
Can External Effects Be Accounted for in Earnings? When significantareas of production are outside the transaction or monetary market, thecontributions of education to productivity cannot be measured. Extra-
market production includes the household in industrialized Westerncountries, and subsistence farming in less developed countries. Nationalincome and wage accounting do not cover the productivity of workersin these non-market situations. Because of their education, workers maybe able to write letters or fill in tax forms themselves, instead of payingfor such work. Much of the economic effect of education may be inareas where production has no discernible monetary value, or where dataare not easily available.
The benefits of education extend to the student's family. Some schoolsprovide young mothers with child-care services. This increases the oppor-tunity of productivity for women outside the home. Because of theinfluence of education, the student's family may also benefit from hisschooling.
Schooling provides economic as well as social and political benefitsto the community. Better-educated people tend to hold jobs longer, thuslowering unemployment and welfare costs and perhaps also reducingcrime; thereby increasing political and social stability. Further, on the job,better-educated workers may have a positive influence on the productivityof co-workers, although negative effects have also been documented.
216
The increased technical innovation from the general spread of knowl-edge in the work force and from the research carried on at universitiesis another benefit. Widespread literacy facilitates more efficient markets ingoods, services, and in labor because fewer decisions are made on faultyinformation.
Education increases the efficiency of allocation of labor because better-educated workers are more mobile, geographically and occupationally. Asizable pool of skilled or educated labor also creates a favorable Climatefor foreign investment.
When studying the private rate of return, two other benefits of educa-tion should be considered. Educated people use more of their personalincome for investment in other forms of human capital, such as healthcare. There are also the effects of "culture" and the enjoyment gainedfrom being a student. Both of these effects increases a person's welfarebut are hard to quantify.
There might be also some negative external effects of education.Persons with secondary or higher education may have an aversion tomanual labor, whether or not non-manual jobs are available. Unemployedor underemployed workers with more schooling tend toward politicalunrest and disruption more than the less-educated, and their skills in
communication help them to spread their unrest more effectively.
What Should Be the Values for Social Discount Rates? The profitabilitycriteria of an investment in education is arrived at by comparing the rateof return to education with the social discount rate. Possible figures forthe social discount rate include the rates of return on business or govern-ment investment, the interest rates on personal loans, or the shadow costof capitaleach yielding a different result. There is also a question aboutthe funds that pay for educational costs. If educational investment comesfrom funds that would otherwise be spent on consumption, and if moneyspent on education were used for other investments even at a higher rateof return, comparing the rate of return on education with the rate of returnon other investments might be invalid.
Are Uncertainties Considered in Calculating the Rate of Return? Thepossibilities of unemployment, sickness, or death should be included in theevaluation of returns to investment in human capital. If only half of thegraduates find employment, then the earnings should be adjusted to reflectthe probability of 50 per cent being unemployed. The "shadow wage" thenbecomes a better indicator of benefits.
Is the Wage Structure Static? The use of cross-sectional earnings data
217
2 2 5
ti
to project lifetime earnings assumes a static wage structure. Also, thereare practical problems im computing the earnings of the educationalsystem's marginal output. Changes in educational policy could causechanges in the supply of labor at different educational levels, which wouldchange the relative wage structure. A sharp increase in the supply ofengineers might reduce considerably the returns to marginal incrementsto the engineering labor force.
Are Part-Time Earnings Considered in Calculating the Rate of Return?Rate of return analysis should include the part-time earnings of studentsin lifetime earnings projections. Including these earnings could raise therelative returns to education of secondary and higher education. This is
particularly true of professional education where students' part-time earn-ings can be quite high.
Are the Costs Those of an Efficient Operation? The calculation of therate of return assumes future costs will remain static and also assumesimplicitly that these are costs of an efficient operation. The rate of return,as usually calculated, indicates a, relationship between future earnings andcosts. A high rate of return may be due to high earnings or to low costs,or both; a low rate of return may be due to low earnings, or high costs,or both. It is the relationship between both earnings and costs that deter-mines the rate of return. If the rates of return are low, it might be anindication that costs are very high because of inefficient operation. Itmight then be better to try reducing costs, rather than curtailing the expan-sion of the system because of its small return. When costs of an inefficientoperation are cut, the rate of return increases. Because costs are so crucialfor deriving conclusions from a rate of return analysis, more attentionto the problem of costs must be given when calculating the rate of return.
Practical Measurement Problems in CalculatingRates of Return in Education
These problems center around two areas: measurement of costs andbenefits.
Measurement of Costs A basic requirement of rate of return analysisis accurate cost measurement. This appears to be a straightforward task,but it is often quite complex. Because Ministries of Education do not needto maintain detailed cost records for regular reporting purposes, the baskdata required are rarely available. Budget data, as discussed elsewhere,are too highly aggregated to reveal program cost in detail and are cat-
218
226
egorizecl by item of expenditure rather than by function. Thiis, recurrentcost data must usually be either obtained on the basis of special studiesor estimated.
Capital cost data are even more difficult to obtain. -if the-study con-cerns the benefits and costs of a new facility, then its total capital cost isneeded. But if the subject is the costs and benefits of a year's educationof a given sort, the capital cost attributable to that yearthe "use value"of the capitalis needed. Use value is based upon the original, or, in somecases, the depreciated cost of capital (or, for projects being planned, theestimated capital cost) divided by the estimated number of years of usefullife of the capital. Obviously, error or arbitrariness will affect such calcu-lations at several points: basic measurement of the capital cost, estimatesof future cost, and estimates of the useful life of the capital.
Measurement of Benefits One basic set of problems affecting rate ofreturn analysis concerns measuring and attributing returns to differentlevels and types of education. Data on returns to different levels of educa-tion are derived from various kinds of socio-economic surveys in whichboth income and education levels of respondents are reported. Broadly-
based surveys are rarely conducted for the specific purpose of providingdata for rate of return analysis. Thus, there are immediate problems oftranslating the data into usable forms. At the most basic level, the intervalsthat are used to measure education in the survey may notand often donotcorrespond to actual educational levels. Income definitions andintervals may also present problems. In large studies of entire educationsystems, limitations of sample size preclude very "fine" or micro-analyses
of different education levels, especially for higher levels or special typesof education. There are insufficient observations on graduates in specifictypes of education in general surveys to permit detailed analysis.
A complete data-base would include data on age and experiencelevels that would permit identification of education-age-income profiles.It is not usually known what portion of the slope of the age-income curvefor each educational level is attributable to changes in age, experience,and on-the-job learning and what portion is due to changes in the qualityof education through time, or to external market and institutional factors.
There is also a problem of too much aggregation. Highly aggregateddata do not provide useful information to sectoral planners trying to dealwith specific, subsectoral (or within-level) choices. Probing more deeplyinto the data for a specific education level may reveal that returns to thatlevel may vary by a factor of three or fourwith age and other variablesconstant. This raises many serious questions as to the usefulness of the
219
22.7
analysis. To avoid many problems in identifying and measuring the returnsattributable to education, a research program must be structured that willgather specific performance data on graduates in a particular type ofeducationor of alternative types being comparedon a longitudinalbasis. But special, mission-oriented research is costly.
Studies of the returns to specific skill training courses are more in-formative than studies of non-occupationally oriented education; thus, thearea of usefulness of rate of return tends to he limited. At present, the rateof return analysis makes it possible only to indicate ways in which usefuldata and analyses can be generated, and to hope that further research willproduce applications of the technique that extend and deepen its useful-ness for policy purposes.
Another Use of the Rate of Return Analysis
Because of the shortcomings of this method, it may be more profitableto reverse the approach. If the cost of a new, alternative educational pro-gram is known or can be estimated, it would be useful to determine theincome level of graduates needed to produce an acceptable rate of return.Even if an unrealistically high level of income of graduates seems necessary,
the difference between this and a realistic income estimate gives an indirectindication of how great the external benefits should he in order to justifya proposed program. This approach is particularly useful when planningnew programs and expenditures for new types of education. For example,the cost of producing a philosophy major is $15,000 and the rate of returnto other types of education is ten per cent. In order to jitstify this return forsociety, the philosophy graduate would have to earn $5,000 a year morebefore taxes than a high school graduate. If this graduate can only earn$3,000 a year more, should the program he offered? If the external benefitsof having a philosophy graduate are worth $2,000 a year to society, theprogram should be offered.
Summary of the Rate of Return Approach
The rate of return approach is useful to assess the economic valueof education because it takes into account economic benefits as well aseconomic costs.. But results of the analysis must be carefully interpreted.The following questions should be asked by decision-makers anticipatingevaluating studies of rate of return:
Is schooling the only determinant of earnings?
Do earnings reflect productivity?
220
Can external effects be accounted for in earnings?
What should be the values for social discount rates?
Are uncertainties and probabilities of unemployment consideredin the calculation?
Is the wage structure static, or is it likely to change in the nearfuture?
Are part-time earnings considered in calculating the rate of return?
Are the costs those of an efficient operation?
Rate of return has been used to decide the expansion or contractionof different levels of education. Because rate of return analysis helpsdetermine investments at different educational levels, it should takeinto consideration the interrelationships between levels. of education. In
order to expand elementary education, secondary education has to beexpanded also. In order to expand secondary education, higher educationhas to be expanded to provide the needed teachers for that level of educa-
tion.The rate of return approach can be profitably used when deciding
upon the economic feasibility of new programs. The forecasted costs can
indicate the level of earnings that should be expected by graduates tojustify the costs of their education.
Private rates of return can be used to determine if the provision ofplaces in a given level of education, or in particular careers, will attractthe necessary students. If the private rate of return is less than that ofother careers, the career should be made more attractive by providingscholarships or subsidies.
When studies show low rates of return for a given type of education,a sharp scrutiny of costs is recommended to determine if inefficient opera-tions rather than low earnings of graduates are the cause. If inefficientoperations are the cause, then a cost-benefit analysis to correct this
inefficiency should be made before curtailing this type of education, orbefore expanding those types that show higher rates of return.
THE MANPOWER APP'OACH
This approach is not directly concerned with measuring the economicvalue of the educational system's output, but it clearly indicates whetherthe output fits the country's economic needs. The manpower approachimplicitly places a high economic value on education that supplies thetrained personnel in occupations demanded by economic growth.
The manpower approach forecasts the supply and demand of occupa-
221
229
gl
tions. These forecasts can be translated into groups of people from variouseducational levels and compared with the educational system's forecastedoutput.
One way to compute the projected demand is to survey employersfor projections of the number of people with various qualifications theywill need within a certain period of time. The results of the survey arethen simply aggregated. This type of analysis is mainly used for short-termplanning. It is not recommended for long-term planning at the nationalLe'v'el because it would be very hard for the individual employer to takeinto account the interaction of macro-variables.
Other methods of forecasting the demand for occupations involve thefollowing steps:
the projection of output by economic sector
--estimation of productivity changes
estimation of employment in each sector implied by the outputgrowth and productivity changes
determination of the distribution of the labor force by occupation(skill profiles) of the labor force by sector by studying past trendsor comparisons between other countries
aggregation of results obtained in each sector.
Forecasting the supply of an occupation requires a knowledge of thefollowing: the number of people in the occupationsdata usually availablefrom censuses or derived from manpower surveys; estimated changescaused by new entrants,te the labor force from the formal and informalsystems of training; net transfers between occupations; and losses overtime caused by death, retirements, migration, disability, etc.
The demand for occupations is calculated. The difference betweensupply and demand over time provides the first indication of how largethe deficits and surpluses may be if the trends of supply continue, basedon projected demands. This deficit is a gauge of the "value" of theeducational system's output. A large deficit between supply and demandin some occupations and a surplus in others show an inefficient productionof outputs.
Advantages of the Manpower Analysis Approach
This method readily predicts potential surpluses or deficits in specificgroups of occupations that may be caused by the education system's out-put. It yields highly specific recommendations for educational policy in
222
230
the form educational planners need. High specificity quickly supports ordisproves pEjections, with rapidly available evidence.
There are also other important advantages in forecasting that themanpower approach provides. It may be extremely useful for analyzingspecific educational programs. Instead of indicating that a country willneed so many skilled workers or vocational school graduates, manpoweranalysts might examine particularly important industries to determine whatskills will be needed, and how many new entrants to their skilled labor forcewill be neededat what proficiency level and over what period of time.This will indicate whether creating one or more schools to supply trainednew entrants is justified.
A manpower analysis could also determine if most new workers enterthese industries from schools or if it would be more effective to retrainworkers in related fields. Such considerations strongly suggest job analysiswhich is generally considered part of administration and personnelmanagement--and relating educational needs to specific job requirements.
Manpower analysis can be coupled with job analysis to help modifyexisting educational curricula to suit occupational needs. It can be inte-grated with a general labor market analysis and lead to the development
of new systems of training, wage policies, etc.Another area in which the manpower approach can be made more
useful for program planning is analysis of demand for new entrants to thelabor force by industry, education, and skill levels. A point that is usuallyoverlooked in manpower studies is that while the whole labor force and
skill hierarchy changes with economic growth, opportunities for graduates
of various types of education may not be found at all levels of the skill
hierarchy. In all but a few atypical cases, recent graduates enter the labor
force via a relatively low-skilled or "entry-level" job and advance tohigher positions after on-the-job training and/or internal promotion. Careshould be taken not to bias estimates of skill needs toward higher skills
because many employment opportunities exist in the lowest ranks of thehierarchy. Disregarding this point leads to erroneous conclusions.
Disadvantages of the Manpower Analysis Approach
The disadvantages are basically three.The first is the assumption that employers cannot substitute workers
in one occupation with those of another. This may be correct for highlevel occupations or for those with very specific training, but it is not
true for a broad range of occupations.The second disadvantage occurs because the relationship of occupa-
223
tinn to specific education may be tenuous. Researchers assume that themost important economic contribution of education comes from thecognitive skills which it develops in students. But that assumption may beincorrect because the behavioral attributes which the student acquiresin adapting socially in school are just as important since they are a factorin increased productivity. Therefore, measures of educational efficiencyshould consider the effectiveness of education in providing or reinforcingbehavioral attributes, as well as cognitive skills.
The increased adaptability of educated workers is an economic benefitof equtation in that education increases elasticity of substitutiontheincreased capability of shifting production methods with changing factorprices. Therefore, manpower forecasting should use a behavioral as wellas a cognitive model of education to predict the number of highlyadaptable, generally educated workers needed in industries where tech-nological innovation is particularly frequent.
The third and most basic disadvantage of using the manpower ap-proach as a policy guide is that it does not take into account the costs ofproviding the needed skills. The existence of a future demand for a certainkind of trained manpower does not necessarily mean that investment in thatarea of education is worthwhile. Educational policymakers must be able tocompare the costs with the benefits of having the trained workers available.Therefore, manpower forecasting is probably only a useful approach toeconomically rational educational planning if used in connection withother economic tools that consider costs and benefits of educational in-vestment.
CORRELATION ANALYSIS
This statistical method relates an index of educational activity to oneof economic activity. A correlation analysis shows whether the twoactivities are closely related, although correlation does not indicatecausality. This method can be used in various ways: for comparisonbetween countries; for comparison of one country at different times; or forinter-industry or inter-firm comparisons of the relative levels of the educa-tional and economic indices.
Inter-country correlations usually use the GNP per capita as the indexof economic activity. The index of educational activity can be enrollmentat various school levels, percentage of literate populations, or expenditurelevels for education. A 1961 United Nations study on the world socialsituation used per capita energy consumption and percentage of the malelabor force in agriculture as the indices of industrialization; percentage
224
2,32
of literacy, school enrollment ratio, and level of urbanization were theindices of social development.
The correlation approach can be used to relate GNP and educationover time in a particular country. If education is considered only as aconsumer good, the income elasticity of demand for education can also becalculated.
Inter-industry and inter-firm correlations are similar to the inter-country correlations. They also relate the differing emphasis on educationby industries or firms to differing productivity levels. Indices of educationalemphasis include the percentage of the work force with secondary orhigher education, or the percentage of gross income spent on researchand development. Comparing indices of educational emphasis and pro-ductivity can be made over time, or on a cross-sectional basis within acountry or between countries.
Advantages of Correlation Analysis
The correlation approach gives a broad perspective. Inter-countrycomparisons give a developing country's planners an international per-spective. The comparison of countries at different stages of educationaland economic development reflects the changes taking place. Such com-parisons show the range of possible levels of investment in education at agiven level of GNP per capita,
Inter-firm and inter-industry correlations are less useful. The micro-economic theory of the firm suggests that different technological possi-bilities for firms in different industries, and differences in relative scarcityof inputs for firms in the same industry but in different locations mightmake differing "emphases on education" economically sound.
Disadvantages of Correlation Analysis
Correlation studies as measurements of education's contribution toeconomic growth do not show causality. A positive correlation of highlevels of educational development with high GNP per capita may meanthat a high GNP causes high expenditure on education or that high invest-ment in education causes a high GNP.
There are several problems in making comparisons between countries.First, if major areas of production are outside the market's operations, thenthe contribution of education in those areas will not be measured in theGNP.
Second, if a major function of education is to act as a selectionmechanism for higher-paying jobs, then the increase of educational levels
225
-2.3 3
with the increase of the GNP may simply reflect the greater need forselection that accompanies development.
Third, educational indices are not necessarily comparable. Percentageliteracy figures are comparable only if they are all computed with thesame standards. Enrollment figures may not be comparable because ofsubstantial differences within countries' educational systems.
Fourth, if expenditure data are used, they must include the productionforegone (opportunity cost) by keeping students out of work.
Fifth, equal resource expenditure does not mean equal educationunless different educational systems use resources with equal efficiency.Effective use of educational resources varies considerably within countries.Such variations should be taken into consideration and not assumed away.
Inter-country comparisons also do not relate educational costs toeconomic activity, except when expenditure figures are used. This mayshow differences in efficiency of resource use or factor prices rather thaneffectiveness of education.
When analyzing a particular country over time, the time-lag problemaffects the correlations. Presumably, education's positive economic effectsoccur after initial expenditures, but only if education is treated as an in-vestment and not a consumer good.
Inter-industry and inter-firm correlations do not have as serious a
problem with causality as do education-GNP correlations. Unlike in-dividuals, firms do not consume education for enjoyment, although veryprofitable firms may engage in conspicuous consumption by hiring morehighly educated workers and investing in more research and developmentthan profit-maximizing criteria would dictate.
The two' major drawbacks to inter-industry and inter-firm correlationsare market power and externalities. Industries placing a relatively heavyemphasis on education by hiring highly educated workers and investingin training and research may also have relatively greater market power.If these industries are relatively very profitable, the reason for theirprofitability is not certain. The correlation between market power, educa-tion, and profits may reflect the profitability of market power, rather thanthe profitability of emphasizing education.
The problem of the external economies of education becomes im-portant in inter-firm and inter-industry correlations. Correlations involvingGNP figures avoid much of this problem because they use the totalmonetary measure of production. But the profits of a single firm orindustry that heavily emphasizes education may reflect only a small part
226
234
of the economic benefits of educating its workers or of its research anddevelopment efforts.
THE RESIDUAL APPROACH
The total increase of a country's economic output over a given periodis only partly explained by increases in the measurable inputs of physicalcapital and labor. That part of economic growth not attributable to thoseinputs is called the "residual," and it is attributed to other inputs. Suchinputs include increases in physical strength and longevity as a result ofimproved health care and nutrition, increases in mobility and generalknow-how, and improvements in organization and technology. But quali-tative improvements in the labor force from education, and advances inscience and applied technology developed in schools, are probably themost important components of the residual. Thus, the residual has beenconsidered to indicate the magnitude of the contribution of education toeconomic growth.
There are several methods to calculate the residual. One comparesan aggregate input series with an aggregate output series. An input series
for the labor input and a constant price of labor and capital in GNP asweights is used to determine the overall arithmetic index of inputs. Tomeasure the economic contribution of the residual factors, the rate of
increase of the aggregate input series is subtracted from that of theaggregate output series. A study of economic growth in the United Statesusing this method attributes about 80 per cent of the increased output perunit of laborover 40 per cent of the increase in total outputto theresidual, for the period 1889 to 1957.
Another way to compute the growth attributable to the residual is touse a production function (see p. 230) which contains explicit assumptions
about the underlying nature of the economy in question. The productionfunction is assumed to be linear and homogeneous. It is further assumed
that technological change does not affect the rate of substitution betweencapital and labor, i.e., it is "neutral." The residual increase in output is thencalculated. A study using this kind of production function attributes over80 per cent of the increased output per manhour in the United States be-tween 1909 and 1949 to the residual.
A third technique for calculating the residual involves convertingchanges in the amount of formal education which the labor force has hadinto changes in the size of the labor force that would have had the sameimpact on output. This conversion is calculated using income differentials
227
235
between educational groups in a given base yearif marginal economicreturns to education are assumed to be constant.
The basic assumption here is that the income differentials are causedby differences in the number of years of education. This assumption isdebatable, as the previous section on rate of return shows.
A study made of the United States estimated the economic effect ofadvances-in knowledge by subtracting the rates of growth attributable to allother inputsincluding labor, physical capital, formal education, and econ-omies of scalefrom the total rate of growth. The computed rate of growthattributable to formal education was 20 per cent of the total growth rateof the GNP, or about 40 per cent of the residual.
Advantages of the Residual Approach
This approach is particularly useful because it shows the relative im-portance of factors other than accumulation of physical capital and increasein manhours in raising economic output. No matter which variation of theresidual approach is used, the unspecified inputs that make up the residualwill have been very important to economic growth. But it is not clear thatthe residual is dominated by the human factor or that qualitative improve-ments in labor are primarily attributable to formal education.
Disadvantages of the Residual Approach
The major difficulty is the nature of the residual itself. In addition toformal education, the residual measures increases in output attributable tolong-run improvement in the quality of capital, economies of scale, workexperience, improvements in health, informal education, changes in theproduct mix, increasing labor mobility, reorganizations of the economy orof production, and other unidentified inputs. It is not exaggerated for econ-omists to call the residual "the measure of our ignorance."
There are also technical difficulties in calculating the size of the re-sidual. The available indices of capital inputs do not account for theinteraction between advancing knowledge and improvements in quality ofcapital. Measures of capital inputs are deflated on the basis of indicesof the costs of labor and materials. This measurement of capital inputscannot reflect improvements in the equipment's productivity.
Computing the residual using production functions raises questionsabout the assumptions on which those functions are based. The requiredassumptions of linearity, homogeneity, and neutrality of technologicalchange are especially weak when used to describe a long-run, dynamicsituation.
228
Using broad historical data to compute definite percentage.figures thatrepresent relative contributions of factor inputs to growth is also problem-atic. The weighting of the labor and capital input series by the relativeshares of labor and capital in the GNP assumes that wages are equal to theworkers' contribution to production. This assumption is only valid if therehas been perfect competition over the period covered in the study. Theweakening of this assumption would entail a lowering of the accuracy ofthe percentage figures to percentage ranges.
The residual method is not particularly useful to educational planningbecause it measures only the magnitude of the economic benefits, and notthe relative costs in increasing or improving the inputs that make up theresidual. Residual data only show economic growth in the past in verylarge-scale economic terms. They do not suggest which areas of educationwill yield the greatest economic returns. Nor do they indicate if futureeconomic growth will follow past patterns. The results of residual studiesare primarily useful to point out the weakness of relying solely on capitalaccumulation for economic growth. They do not define the role of educa-tion for economic development.
REGRESSION ANALYSIS APPROACH
This is similar to the residual method. It shows the economic effectsof schooling on the individual. A general equation relates education andother independent variables to annual earnings. The independent variablesmay include age, industry, father's occupation, individual's occupation andplace of occupation. The size of the education coefficient indicates to whatdegree increased earnings are a function of additional schooling. The coeffi-cients of the other independent variables indicate how much those otherfactors determine earnings.
Regression analysis only measures the relative value of education forthe individual. It shows how much the individual can expect education toimprove his earning potential. Regression analysis can also give educationalplanners a general indication of the amount of schooling that individualsmay invest in.
Regression analysis has many of the same methodological difficultiesas rate of return analysis. Labor market imperfections may obscure therelation of actual wages to productivity. Only if actual wages equal shadowwages can educational planners use regression analysis studies to determinethe relationship between education and productivity. The regression coeffi-cient for education may include the effects of other factors positively cor-related with education, such as ability. These other factors, if not made
229
2 11
explicit, might make education seem to be a much more important deter-minant of earnings than it really is. Also, computing the education coeffi-cient assumes a fixed relative wage structure, but changes in educationalpolicy can change the relative supplies of educated labor which, in turn,change relative wages.
A general problem with regression analysis is that it measures only thebenefits of educationnot the private or social costs. But regression analy-sis data can he used in rate of return calculations. The regression coefficientfor education gives some idea as to what degree earnings are determinedby education, and it reduces uncertainty as to how much of the lifetimeearning differentials can be attributed to education.
PRODUCTION FUNCTION ANALYSIS
This concept has been used to determine the residual (see pp. 227-229),but it is mostly applied to analyze the educational process. Studies usingthis concept have been cited to justify policies on the allocation of resourcesin education. A production function is a schedule or table showing differentcombinations of inputs that will yield different outputs. The quantity of out-puts produced is a function of, or depends on, the quantity of inputs used.When the table or schedule can he expressed in algebraic form, this equa-tion is possible:
y = f(x,, x,, x:, x)where y is a measure of educational output or performance, xi, x2, . . . xare different measures of inputs (characteristics of students, teachers, build-ings and materials, etc.), and f is a mathematical function relating the x's to y.
To derive the relationship between the variables, multiple regressionanalysis is used. Generally, the equation is obtained from a least-squareestimate of the regression equation parameters. The coefficients indicatethe incremental effect of a unit change in an input on the output. Thecoefficient of determination (r2) also indicates how much of the variationin output is explained by the particular equation reflecting the educationalprocess. When the units of inputs can be translated into monetary terms,it is possible to relate the effect of monetary expenditure to the increaseof output.
To determine the production function of a school system, assume thata given test score reflects the educational output y. There are three factorsinfluencing this output:
x, = quality of teacher, reflected in salary schedulesx, = buildings and materials, reflected in their depreciated valuex, = socio-economic background of children.
230
238
The following formula can then be given:
y = ax, + 6)(2+ cx..
A statistical analysis will ascertain how much of the variation of ycan be explained by x,, x., and x,, and the relative importance of these threevariables derived from the coefficients a, b, and c. If the cost of changingx1, x., or x, can be evaluated in monetary terms, the cost of changing theoutput, y, can be calculated.
Advantages of Using a Production Function Analysis
This method explicitly describes the educational process and allowsthe introduction of diverse economic, social, quantifiable, non-quantifiable,and nominal variablesthose variables to which names have been assigned,such as region, race, etc. With sufficient data, alternative theories can betested. Theories about the differential effectiveness of schooling on differentsocial groups, or about the relative importance of attributes acquired out-side the school, can be evaluated.
Disadvantages of Using a Production Function Analysis
There-are five disadvantages to this approach.The technique does not test causality because the equation does not
derive from an educational learning theory.Most of the variables used in the regression analysis will be only
pr ')xy variables. Because no adequate learning theory exists, socio-economicclass is sometimes used as a proxy for motivation of the student, and salary-scale as a proxy for quality of the teacher. We must be careful to formulatepolicy with respect to actual variables and not with respect to proxies be-cause variations of the proxies may not always reflect variation in the actual
variables.
While the advantage of the production function is the inclusion ofnon-quantifiable and nominal variables, their scaling presents formidablestatistical problems.
This type of analysis has been applied to large educational systems.This presents grave problems with respect to the reliability of measuringinstruments (in most cases, tests) and aggregation of data. Any aggregationof heterogeneous data produces only an average function that may not beuseful to any particular situationa production function for the nationmay be useless in a particular region.
As in any statistical analysis with many socio-economic variables,
231
239

there is always a danger of multi-collinearity. When the independent vari-ables are highly correlated, there is no way to know the causal relationshipbetween independent and dependent variables. Expenditures on educationand economic class are related. If both variables are used, there is no wayto assign importance of one variable over another. Some insight on therelative importance of variables can be gained with different statisticalmanipulations, but the problem is still an important consideration in thistype of analysis.
Another Use for Production Functions in Education
Production functions may be more useful at the micro-level of educa-tion. The basic concept of having different combinations of inputs to pro-duce different outputs can be used as a framework to plan and evaluateeducational research, especially teaching technology and curriculum. Differ-ent experiments can be designed to achieve a certain level of proficiencyusing different combinations of teachers, media, and materials. The effectsof substituting one input with another can be studied and a cost-analysiscan follow, based on the relationship of prices of inputs and the relativecontribution of inputs to the output. This experiment and analysis can beextended to cover different types of students, different environments, andother inputs.
The basic difference between using production function for micro-analysis of education and for macro-problems is that the analysis of macro-problems involves mostly an ex-post-analysis of a process. By necessity,
this admits only a deductive approach. At best, the result provides onlyglimpses of the educational process. Use of the production function onthe micro-level may allow an inductive approach that could lead to innova-tion and a better allocation of resources.
SUMMARY
Besides the rate of return approach there are other methods for measur-ing the economic value of education. Each is suited to a particular purpose;
each has its drawbacks.The manpower approach is useful for predicting potential surpluses
or deficits that may be caused by the education system's output. It can also
serve as a tool for relating curriculum to job requirements. But the assump-tion of no substitution between occupations, and the relationship of occu-pation to specific education may be tenuous. Also the manpower approachdoes not take into account the costs of providing the needed skills.
232
2 0
Correlation analysis, the residual approach, regression analysis, and the
use of the production function concept to measure the value of educationare useful. They show the relative importance of education and other factorsin economic growth, and the importance of non-educational factors in theprocess. But they are less useful as instruments for planning and decision-making because they do not show causality and their application presentsmany diffitult methodological problems.
Nevertheless, these methods, in conjunction with the manpower andrate of return approaches, offer decision-makers a composite group of indi-cators to help make sounder economic decisions in educational planning.
233
241
CHAPTER XVIII
Educational Planning andProgram Budgeting
EARLIER portions of this book have considered techniques such as cost-benefit and cost-effectiveness analysis that indicate efficient courses of
action in individual programs and projects. This chapter addresses planningand program budgeting (which is one structural approach to planning), ashigher level approaches to achieving efficiency through allocations betweenprojects. Planning and program budgeting seeks internal coherence withinsectoral programs, permits accurate projection of resource needs, and pro-motes efficiency in resource use.
Sector-wide planning and program budgeting identify relationshipsbetween different programs and ways in which the sector programs can bemade more internally consistent and effective. They also view sectoral ex-penditures in a longer time perspective. This is especially important becausethe amount of resources needed over a long period of time determines tosome extent the means that must be used to generate the revenues.
Unfortunately, the major methodologies of educational planning ap-plied in. most developing countries have not been notably successful. Thishas been due to technical weaknesses in some of the methods used and,most importantly, to a top-downward orientation in planning rather thanan orientation toward internal efficiency.
This chapter, therefore, suggests a different orientation of planning,one which incorporates several continuing activities: formulating broadstrategies; developing and implementing programs and projects; and relat-.ing program plans to the annual budgeting process.
Most Ministries of Education follow traditional line-item budgetingprocedures rather than integrating planning and budgeting, but there hasbeen a major recent upsurge of interest in program budgeting as an ap-proach to allocating educational resources. A detailed discussion of pro-gram budgeting as a structural planning approach is therefore presentedand includes an assessment of the biases, advantages, and disadvantages of
program budgeting.
234
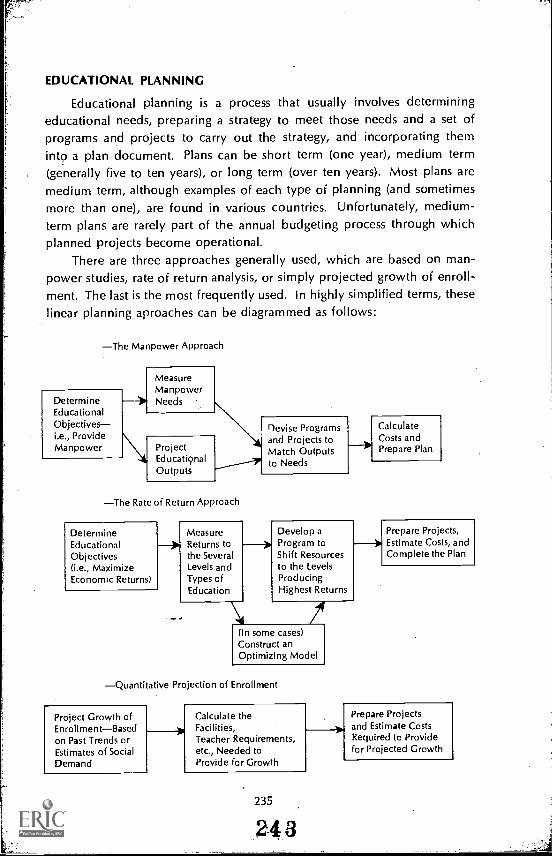
EDUCATIONAL PLANNING
Educational planning is a process that usually involves determiningeducational needs, preparing a strategy to meet those needs and a set ofprograms and projects to carry out the strategy, and incorporating theminto a plan document. Plans can be short term (one year), medium term(generally five to ten years), or long term (over ten years). Most plans aremedium term, although examples of each type of planning (and sometimesmore than one), are found in various countries. Unfortunately, medium-term plans are rarely part of the annual budgeting process through whichplanned projects become operational.
There are three approaches generally used, which are based on man-power studies, rate of return analysis, or simply projected growth of enroll-ment. The last is the most frequently used. In highly simplified terms, theselinear planning aproaches can be diagrammed as follows:
The Manpower
>
Approach
MeasureManpowerNeedsDetermine
EducationalObjectivesi.e., ProvideManpower
revise Programsand Projects toMatch Outputsto Needs
CalculateCosts andPrepare PlanProject
EducationalOutputs
The Rate of Return Approach
Determine Measure Develop a Prepare Projects,
Educational Returns to Program to Estimate Costs, and
Objectives the Several Shift Resources Complete the Plan
(Le., Maximize Levels and to the LevelsEconomic Returns) Types of Producing
Education Highest Returns
7(In some cases)Construct anOptimizing Model
Quantitative Projection of Enrollment
Project Growth ofEnrollmentBasedon Past Trends orEstimates of SocialDemand
Calculate theFacilities,Teacher Requirements,etc., Needed toProvide for Growth
235
Prepare Projectsand Estimate CostsRequired to Providefor Projected Growth
r-
All of these approaches have encountered many problems. In generalthese include:
The information neededeven basic enrollment datahas almostalways been inadequate. The scarcity and unreliability of data have beenespecially severe in the manpower and rate of return approaches.
Technical shortcomings in the actual planning have led to variousfaults, most especially.oversimplification. Conclusions have been unfeasibleor internally inconsistent.
The internal effectiveness of the education system has been ignored,largely because of unreliable indicators of effectiveness.
Cost-analysis and estimating have been crude or almost totallyinadequate.
Connections between the overall plan and the projects proposedhave been tenuous. A major weakness has been the lack of sound projectformulation.
Implementation of the plan, whatever its weaknesses, has usuallybeen neglected by local authorities.
The crucial relationship between periodic planning and annual bud-geting has usually been very weak. Medium- and long-term plans have notbeen included in Central Government's annual budgeting.
These problems seriously challenge sectoral planning. In general, plan-ning has been "from the top down" rather than "f7om the bottom up," andit has ignored specific needs and problems. Making a plan has been con-sidered to be a periodic effort based on deductive assessments of needsand the strategy to meet them. Because plans have not grown from centraladministrative perceptions of operational problems and solutions, they are
seldom implemented, and changes fall short of goals set in the plans.
What Planning Should Be
This section outlines a planning approach that may overcome someof the past problems. It covers decisions and allocations of public fundscontrolled by administrators of the education sector.
The terms "education sector" and "education system" create someambiguity. The boundaries of the "sector" may vary from country to coun-try and from one decision-maker to another. To an official in the Ministryof Education, the sector includes the activities of his own Ministry andsometimes private educational institutions over whose regulations, certifica-tion, standards, and subsidies, he may exert control. To a treasury official
236
244
who considers total expenditures on education, the sector might also in-clude the educational activities of other ministries, such as the Ministries ofLabor, Agriculture, and Defense.
The term "system" may be applied to either set of boundaries.' Fromcertain points of view, it can include all formal education plus non-formallearning of skills, including on-the-job training by private firms. In this sec-
tion, "system" refers to the formal education system, especially those inter-related activities of the Ministry of Education. Sectoral planning here refersto the application of systematic research and analysis to questions anddecisions in that part of the system over which public administrators canexert control.
Education Sector Planning Defined
Planning provides information to facilitate decision-making in con-tinuing program administration. It is not a merely periodic, linear activityleading to a single document that prescribes action for a number of years.Its definition is as follows: Educational sector planning should be a con-tinuous process of providing information to decision-makers on how wellthe system is accomplishing its goals, and on how the cost-effectiveness ofsuch accomplishment can be improved.
This definition implies that the existing system's performance shouldbe evaluated. Planning does not start from some zero-state in practice. It
considers ways to modify and improve existing activities. Evaluation iden-tifies problems and indicates ways to improve efficiency and effectiveness.Such information from the continuing evaluative process, together withanalyses of proposed new programs, gives administrators a basis for select-ing programs and projects that will strengthen and improve the educationsystem, as well as expand it to serve growing populations. Obviously, plan-ning is oriented toward the future, but it is based on evaluation of perfor-mance in the present and the recent past. Decisions and selections aremade through the annual budgeting process, and sectoral planning anddecision-making should be closely related to it.
Planning should lead to a general strategy, formally expressed in a plandocument, but it does this from many sources of empirical information,not from technically determined solutions. The strategy chosen may alsobe modified by altered circumstances, new information, and increasedunderstanding.
Planning departments may be at the top administrative level, but plan-ning and decision-making goes on at all levels. It is a process built up frommany lower-level choices affecting specific programs. The analytic tools
237
245

used differ, depending on the level of the planning-decision process, asdiscussed below.
A simple diagram illustrates the nature of planning, as conceived here.(This may be contrasted with the three linear approaches discussed anddiagrammed earlier.)
ExternalDemographic,EConomic,Political, andOther Inputs
1Strategy Formulation(and Modification)
Program _and ProjectDevelopment
Intormation-Gathering andAnalysis
What is the relationship between the process diagrammed above andpreparing an education sector plan? A plan for, say, five years is developedwith a strategy for sectoral development based on the findings of the con-tinuing planning process. The plan document is used as a guide for imple-mentation activities during the period in question. The annual budgets foreducation are drawn up on the basis of the plan, plus new information fromthe information-gathering and evaluation phases. The ongoing research,evaluation, and planning process continues to generate information for thenext plan. (Some countries use "rolling" plans which annually update thefive-year document, taking account of new information or changed circum-stances. Such rolling plans would be natural outgrowths of the continuingplanning process proposed here.) The plan sets forth explicit strategy foreffectively molding the public education sector to meet national needs. Thisstrategy indicates what specific action programs and projects should bechosen. Budgetary implications of the project list are projected and checkedagainst estimated financial resources. The results of evaluation of existingprograms and analyses of proposed changes are incorporated in the nextplan document, which serves as a blueprint for implementation in futureyea rs.
Preparation of a plan document will focus on and formalize thevarious aspectsof planning cited. But the plan essentially reflects the con-tinuing process of seeking and using policy-relevant information to makedecisions.
In the past, the plan has been seen as independent of the ongoingtasks of guiding and administering the system. Because administrators ofplans that have not grown out of the continuing process are inexperiencedin using research and analysis, they cannot evaluate the implications of
238
240
the proposed programs. They, thus, approve plans which have little relationto the main needs and problems of the education sector.
Several important points emerge from the preceding discussion:
Planningto
a continuous, non-linear process, not a one-way pro-cedure leading to a single output. All activities are -rried on continuously(although consideration of strategy questions is intermittent and largelyassociated with the annual budgeting cycle). If there is any priority, it is inthe information-gathering phase. But as practitioners know well, strategyformulation and program development must often proceed long before allthe information needed is available. The process of providing informationfor decisions must be an organic part of the administration of a developingeducation system. To date, most plans have been abstract. They weredirected largely toward high-level goals and strategies, which had littlecorrelation between the plan's content and ti e daily decisions that sectorofficials face. Only educational administrators who have directed a con-tinuing program of evaluation and research, absorbed its results, and
participated in lower-level choices based on those results can both compre-
hend the plan and effectively implement it.Planning does not go on in any one place. There should be a
planning unit, preferably linked with the highest level of decision-makingin the Ministry; but this unit does not undertake all the planning tasksindicated here. There is a hierarchy of decisions, in sectoral planning andnot all of them are made at the highest level. (See below.)
The frequency of decisions associated with each aspect of plan-ning varies greatly. Strategy formulation decisionsthe high-level choicesof major directions of educational developmentare made much morefrequently than every five years. But they are not as frequent as the de-cisions affecting implementation which are made almost daily. Budgetingdecisions tend to be made on an annual cycle. The process of information-gathering and analysis goes on continuously. Analyses may tend to beoriented toward the budget cycle, but much of the research is not appliedpurely to budgeting.
All phases of planning and decision-making are based on a system-atic (preferably quantitative) analysis designed to increase the efficiency orcost-effectiveness of the education system. This set of concepts has some-times been called a "systems approach" to planning. These concepts in-clude clarifying objectives, establishing criteria for choice, use of quantita-tive data, comparison of alternatives, and analysis in a cost-effectivenessframework. For a discussion of the advantages and disadvantages of thisapproach, see pp. 248-249.

Outlines of Sub-Activities within Major Planning Phases
Each major phase or aspect of planning shown in the diagram on p. 238is a complex process. Brief discussions of some key sub-activities withinphases of the planning process indicate the nature of the tasks in eachphase and some of the interrelations between the several phases.
Information-Gathering and Analysis The principal activities in thisphase include:
Comnpiling basic data on enrollments, flows of pupils, teachersupply, etc.
Identifying and studying key problems and subjects calling foraction by public agencies: impending teacher shortages, increas-ing wastage, curriculum weaknesses, or excessive costs.
Researching both problem-related subjects and general perfor-mance of different levels and types of education:
Monitoring and evaluating the implementation of previous pro-grams.
Reviewing information from sources outside the Ministryman-power and employment data, demographic data and projectionsand incorporating this information into the descriptive, eval-uative, and analytical stages of planning.
A major weakness of planning is usually the lack of policy-relevantdata and information. Attempts at "diagnosis" or sector analysis are rarelymore than highly aggregate descriptions Of the education system. Where....descriptive data indicate problems, such as excessive wastage or unemploy-ment among vocational graduates, they do not relate the problem to itscauses nor do they indicate the ways in which programs can help resolvethe problem. True diagnosis and evaluation depend upon more intensive,special studies. For this reason, information-gathering is a most impanintphase in planning.
The kinds of studies needed are fairly simple. They differ markedlyfrom most academic research on education. They can be called "mission-oriented research" (studies that explore a particular problem or question)or "policy research," "diagnostic studies," or other similar terms. Whateverthey are called, they offer specific data on the performance of operatingprograms. Very few countries include such information-gathering in plan-ning activities, although recognition of the need for special research effortshas increased.
240
248
It is unrealistic to expect extensive research on all aspects of educationto be done in conjunction with any particular plan. This is why investiga-tive efforts are stressed here. A program of special studies based on prior-ities of information needs should be planned like other aspects of theeducation system.
The subjects of such research are varied: an initial priority should becost studies of major levels and types of education to make sound costprojections, to determine the feasibility of enrollment targets, and toprovide the basis for various analytical tools. Another priority need is tomonitor the implementation of earlier plans to identify lags, obstructions,or cost-overruns.
Educational performance has rarely been studied in depth. Part of theinformation-gathering phase should produce improved performance indi-cators. The methods of such research would include longitudinal studies,sample-based investigations, case studies, in-depth interviews, and otherapproaches rarely used in developing countries. Not only specialists ineducation, but also economists, statisticians, sociologists and administrationexperts among others would he needed to analyze the causes of wastage
and managerial ineffectiveness of schools and other agencies.Information gathered on priority topics should facilitate strategy
formulation, program and project development, and budgeting phases ofplanning and should indicate ways to improve ongoing programs. Aneducation system is best improved by evaluating its performance and usingthis information to improve that performance. The usual information avail-able to planners and administrators does not permit analyses of programperformance. Special information-gathering activities are needed.
Strategy Formulation Major activities in this phase include:
Reviewing national goals for education, including provision for:
growing enrollments, greater equality of opportunity or regional equity,
meeting manpower 'needs for industrial and agricultural development, and
improving educational quality and efficiency.
Projecting the education system's desired quantitative develop-ment, and the implications of this growth for costs, teacher supply, and
other factors.Assigning priorities to problem areas identified in the informa-
tion-gathering phase, and developing good combinations of policies, pro-
grams, and projects that respond to the various priority needs.
Developing alternative strategies and incorporating sets of pro-gram and project alternatives.
241
249

Analyzing the feasibility, costs, and effectiveness of alternatives ofthe strategy and indicating preferred alternatives.
Integrating the goals, quantitative projections, and strategy intothe education plan.
Strategy formulation at the highest level of decision-making leads toan educational plan. It is the most important phase in the preparation ofthe plan document because it considers goals, relates programs in educationto major national policy issues (such as regional equity or national man-power needs), assigns priorities, and establishes guidelines of the programs.
Most of the approaches to educational planning discussed thus farhave been oriented toward strategy formulation in planning. Rate of returnanalysis tries to indicate which levels of education should be given highestpriority. Manpower analysis indicates the needs for different types ofeducation. But the aggregate figures which these planning tools provideoffer only general guidance and should be checked against each other andagainst other policy indicators, such as the budget, before they become thebasis for major policy commitments.
There are several important differences between the planning ap-proach suggested here and the way other approaches carry out strategyformulation. Strategy formulation is not based on one or two sources ofinformation and guidance. A multifaceted program of evaluation and re-search indicates, through very detailed data and studies, how various partsof the system are performing. Strategy formulation is closely related tothe program and project development phases. The final strategy in theplan is not an abstract statement of what ought to be clone. Rather, it hasspecific program content relating to strategy objectives. Further, strategyformulation is done in conjunction with the budgeting process.
Strategies such as universal primary education or placing an arbitraryproportion of secondary students in vocational courses have too often beenselected without considering their feasibility, cost, or effectiveness.
As noted ue:')re, the strategyand the planshould evolve from a
continuing evaluation of existing programs. Sound strategy formulates newalternatives and analyzes programs and projes on the basis of cost andeffectiveness.
Program and Project Development Program and project opportunitiescontinually arise in the course of evaluating existing programs, when con-sidering ways to overcome sector problems, and when formulating a set ofactions or a strategy designed to overcome the problems.
For example, when descriptive data indicate that few secondary
242
250
graduates can pass a rigorous university entrance examination (or that many
enter but most fail and drop out), and detailed research reveals poor
preparation in basic areas (such as mathematics, composition, or science),then several alternative projects might be suggested: strengthening cur-riculum and retraining teachers at the secondary level; establishing a uni-versity preparatory school for members of disadvantaged groups; andproviding an intensive university remedial program to tutor students. Thesealternatives would be developed in preliminary form, with estimates ofcosts and other resource needs; they would then be presented, together
with supporting analyses, to the top administrators responsible for newcommitments. If the inadequate preparation problem has high priority,as is assumed in this example, these alternative projects are then considered.
If one is selected, further work is necessary to specify the project's exactneeds: funds, space, teachers, teacher training, curriculum preparation,books and materials, and administrative orders and/or actions. The project'stotal costs (capital and recurring) are then calculated. Discussions with
budget officers about the project's impact on the budget for a given level
will probably be initiated. For example, the new project's costs mightbe compared with the high cost of over-enrollment, the subsequent in-
crease in dropouts, and/or the social costs of fewer graduates. If the project
wins support, it will become a specific part of the planin a strategy toovercome poor preparation for university education.
In general, a program and project development aspect of planning has
the following components:
Detailed specification of projects and programsin cooperationwith operating divisions within the Ministryto resolve key problems, such
as: meeting projected needs for the number of facilities, teachers, and
other inputs; increasing the effectiveness of existing programscurriculumdevelopment, improved laboratory facilities, administrative changes, incen-
tive systems; and developing new projects and programs to respond to
problems and needs identified in other phases of planning.
Feasibility assessments of proposed projects based on information
gathered, including cost projections and performance estimates, where`,, -
possible.
Detailed project preparationgenerally performed after its inclu-
sion in the current planincluding justification, quantitative description,
inputs required from other parts of the education system (teachers, for
example), expected outputs, performance and cost estimates.
243
251
Discussions with budget departments of the Ministry, of Educationand the National Budget Office on the program's general structure and size,and its cost implications.
The Budgetary Phase Budgeting has usually been distinct from planningactivity. Relationships between this new planning approach and budget-making are described below.
The budget indicates the total funding available for all public activitiesin education. In a sense, planning can support the sector budget requestby, providing indications of national need, analyses, and justifications forincreased funding, as well as a set of projects ready for implementation.Generally, the total sector allocation is determined outside the Ministryof Education.
Cost analyses permit detailed projections of funding needs for ongoingactivities and new projects. Detailed cost analyses by cost component mayindicate possible increases in efficiency that permit doing more with thefunds available.
Performance and cost information from the planning process are
essential to a program-budgeting systemif one has been adopted.
Rolling five-year plans, updated annually in continuing planning, pro-vide the medium-range time perspective that program budgeting tries tooffer. The full budgetary implications of program commitments over timeare clearly shown.
Once a set of projects has been selected and combined into a plan,this plan is reviewed by budget officials. Changes may be suggested be-cause of funding constraints. Eventually, perhaps after a series of dis-cussions, a project set and a budget are agreed upon and approval isgranted to proceed with implementation.
During the evaluation and monitoring of project and program imple-mentation, contact is maintained between budget officials, planners, andother administrators. If implementation lags are discovered, action. isinitiated to get the plan back on schedule. If this is not possible, budgetmodifications will probably be necessary.
The planning phases just discussed have been separated for clarity.They tend, however, to merge at their boundaries: project identificationand development occurs in the course of information-gathering; strategyformulation takes place in the context of budget constraints; decision-making goes on at all levels and in all phases, from choice of researchtopics, to proposal of alternative action programs, to decisions on mattersof highest policy.
244
25.2
Planning as a Hierarchical Process
The concept of planning set forth entails a wide range of continuingdecisions at various levels associated with each aspect of planning. Consid-ering these decisions in a hierarchy is useful.
At the top of the hierarchy are intersectoral allocation decisions thatare largely made outside the Ministry of Education. For the most part,the sectoral planner is concerned with allocations of resources within thesector budget which is largely determined from above by the nationaldevelopment plan and the treasury. The latitude for allocation changes isvery limited in the short run. Ongoing programs require continued sup-port. The margin of free resources for reallocationafter paying most of thefixed expenditures for salaries, ongoing construction programs, materials,pension programs and other commitmentsis quite small. But in the
long run, the cumulative effect of marginal resource allocation decisionscan be very large.
In any event, the sectoral planner's sphere of interest (and the subjectof this discussion) is how to utilize most effectively a limited budget tomake the various subsystems within the education system more efficient.Such lower-level analyses of improving the education system's componentshave usually been overlooked by the familiar, linear approaches to educa-tional planning. Yet, it is these "internal" problems that are of most pressingconcern to decision-makers in the education sector: how to make theprimary level provide basic science education more successfully, how toproduce enough able and effective teachers at a reasonable cost, and howto enable vocational education to equip its graduates with those skillsleading to ready employment and higher income.
The highest level of a hierarchy of planning activities involves national-level allocations of resources between the major sectors, including educa-tion. Below this levelassuming that a sector budget is fixed from outsidethere are other levels of decisions and planning that provide informationto decision-makers. The following list is not strictly hierarchicaldecision-makers at all levels of administration may concern themselves with variouskinds of decisions. A significant planning and administration problem inmany ministries is that the highest level officials are often overburdened
with low-level decisions, while the planning group that considers high-level'allocations lacks high-level authority. There is, however, a general hier-archical relationship between: inter-sectoral allocations (largely outsidethe scope of this discussion); allocations of marginal resources amongdifferent levels (these correspond to the strategy-formulation phase);
allocations within levels and types of education (corresponding to de-
245
cisions made at the program and project development level, say, betweenscience education and general education projects for secondary schools);and questions concerning efficiency and effectiveness within a level orprogram (such as analysis of pilot programs to increase cognitive learninggains among secondary students. or to reduce unit costs in teachers'colleges).
Distinguishing these types of planning decisions is useful for severalreasons. First, the analytical tools most usable at one level are not alwaysapplicable at other levels. Linear programming is most effective in obtain-ing optimal use of available resources, such as teachers or classroom space.Linear programming has been succ essfully applied to school managementdecisions, such as classroom scheduling, distribution of centrally providedtextbooks, and other low-level planning. One characteristic of suchdecisions is that objectives are clear and quantitative data are readily avail-able. In more sophisticated applications, such as controlling the flow ofpupils through the entire educational system to maximize total economicreturns to society, linear programming has had little success in guidingsectoral planning. Worse, because of technical weaknesses, inadequacyof aggregate data, and maximization of single objectives which oversimplifythe complex aims of education, the results of linear programming analysesmay be seriously misleading.
Second, the kinds of data needed for decisions of one type differfundamentally from those of another type, especially in the degree ofspecific detail needed for meaningful analysis. Manpower studies indi-cating the approximate' balance between graduates and jobs can utilizehighly aggregated data from national manpower surveys. But whethervocational education programs should stress general' or specific skills orshould include a work-experience semester requires much more detailed,longitudinal studies of vocational graduates. Estimates of enrollmentgrowth based on entrance trends and promotion rates may give generalprojections of places needed. But more detailed studies of populationgrowth, age, and residence are necessary to plan the location of newschool buildings.
Third, some decisionsthose dealing with day-to-day operationsare highly important. A five per cent saving in primary level unit costs hasa huge impact on the total education budget. Yet theoretical work onplanning and allocation has mostly addressed the highest level allocations,and most data gathered do not apply to low-level efficiency questions.National level rates of continuation (that is, the proportion of each enteringgrade cohort that remains in school) tell us little or nothing about how well
246
251
a curriculum experiment works in a local school district. Budget data onexpenditures do not indicate where the funds for secondary education orteacher training were spent or what was accomplished.
These last points are crucial to the problein of planning for sectoraldevelopment. Frequent and important decisions are usually made by sec-toral level administrators without analytical tools, and with .inadequatedata. There are of course exceptions. Cost-benefit analysis has. beenapplied in interesting and useful ways but, unfortunately, such exceptionshave been rare. Cost-benefit analysis has been used where monetarybenefits. such as benefits from manpower training programs, can be readilyidentified and causally linked with the education program.
In summary, planning relates to the question of financial resources foreducation in several 'ways: it permits accurate projection of resourcerequirements: it promotes efficiency in terms of high-level allocations be-tween major programs to achieve complementarities and consistency; andit promotes lower-level efficiency in the operation of individual projects.The best-known approaches to educational planning (that is, the man-power approach. the rate of return approach, and simple quantitativeprojection techniques) have serious shortcoming. These include emphasison high-level efficiency achieved only by altering the relative enrollmentsin different levels and types of education; inadequate attention to educa-tional costs, ways of reducing them or accurate projection; and almosttotal disregard of evaluation of program effectiveness at the lower level.These well-known approaches also tend to be one-way processes leadingto preparation of a medium- or long-term plan document, rather than tointegrated continuous processes based on feedback from the present educa-tional programs in action and closely linked to the annual budgeting andthe lower-level decisions that take place in the sector.
An alternative planning approach is proposed, emphasizing not onlyhigh -level strategy formulation but also considerations of educational pro-gram performance and internal effectiveness. Such an approach wouldprovide a better basis for projection of resource requirements, greaterefficiency in resource utilization, and a closer link to the annual budgetingprocess.
PLANNING-PROGRAMMING-BUDGETING (PPB)
Program budgeting is a formalized approach to educational planning.It focuses on developing and assessing alternatives, improving the contextof choice, and comparing the outputs of different programs designed toachieve the same objectives. It draws attention to the desirability of
247
253
spending for one objective in relation to other educational priorities. Pro-
gram budgeting leaves ultimate decisions about programs to the decision-maker; it hopes only to sharpen decisions by developing and displayingrelevant data.
Methodology: Systems Analysis
The underlying methodology of program budgeting is systems analysis.Systems analysis is any kind of orderly, analytical activity addressed to com-plex problems of choice. All such choice situations concern decisionsamong competing alternatives for educational investment that differ inpay -off or output. Clarifying the potential impact of such decisions notonly on the educational product (the student), but also on other parts ofthe educational and national environment, and on subsequent programdecisions, is one task of systems analysis. The effect of present systemdecisions on future ones is a crucial consideration of any good systemsanalysis. Here the close relationship between planning and systemsanalysis is clear: systems analysis determines the nature of the presenteducational system and defines the nature of the future system; planningindicates how best to move from one state to the other.
Systems analyses include five distinct stages. First, they try to rigor-ously define the problem at hand. This is a crucial undertaking, since theapparent problems may not be the real ones. Problems also may change asthe analysis attempts to define them.
Secondly, systems analyses attempt to work out a hierarchy of partic-ular, realistic objectives whose attainment will solve the problem.
Thirdly, systems analyses organize and display a range of alternativesfor achieving those objectives.
Fourthly, systems analyses associate costsor resource requirements--with each alternative. Often these costs are very similar, but they canvary widely.
Finally, systems analyses attempt to relate resource inputs to programoutputs; they explore the processes by which expenditures for differentprogram alternatives have more or less efficient and effective outcomes. Inthis final step, the crucial question of criteria for effectiveness arises. With-out such criteria, the analyst cannot evaluate program performance orrelate program performance to costs in order to measure efficiency.
In the program-budgeting context, these five basic steps of systemsanalysis are elaborated upon as follows:
formulating the problemarticulating the objectives
248
constructing alternativescosting alternativesassessing potential effectiveness of alternativesmodeling the relationship between cost and effectivenessimproving the effectiveness criteriaevaluating alternatives according to these criteria
reiterating this sequence
Despite the importance of cost and effectiveness modeling here, it isimportant to realize that systems analysis demands approaches other than
the purely quantitative. Quantitative approaches are most appropriatewhen enough is understood about the problem to he able to break it downinto discrete parts and to benefit from increased precision. Problems aboutwhich less is known can be dealt with through qualitative, heuristic, andanalog models. These models can increase one's understanding of theproblem and of the consequences of different alternatives for solving it.The important point is that quantitative methodologies are not the onlyfocus of systems analysis; the analytical technique actually used in a par-ticular case depends on problem complexity, validity of currently availabledata, and understanding of the process being studied.
Limitations of Systems Analysis
First of all, analysis is always incomplete. The time frames of short-and medium-range decisions leave the analyst little time to discover all
the detailed impacts of competing alternatives or to conduct a conclusiveanalysis. Also, since systems analysis continually cycles back upon itselfas problem dimensions change, a "definitive systems analysis" is impos-sible by definition. As emphasized in the preceding section, analysis and
decision-making are continuous processes.Secondly, analysis is limited to proxy or surrogate measures of per-
formance because projected program performance is a very elusive quan-
tity. Such measures are substitutes for the more refined evaluative
measures used after an alternative has been implemented. They only ap-proximate "actual" program performance, and they often will not supporthighly specific or refined quantitative manipulation.
Thirdly, since predicting the future is impossible, system:; analysis
cannot forecast or project absolutely reliable program performance data.
This is true even for programs similar to ones evaluated in the past because
each new implementation involves factors that may change performance
characteristics.Finally, the systems analyst may have attention bias; he may perceive
249
257
r
the problem in ways that depart from the real-world problem. Becauseevery analyst's interests and experiences bias his attention, the conscien-tious analyst attempts to assess and eliminate his attention bias. Thisattempt is important because a program structure that incorporates inap-propriate attention bias is often useless.
Documentary Elements of PPB
The program structure is a hierarchy of categories that accounts forthe various activities of a system, whether it is a federal government or arural school. It is possible to build program structuresi.e., to createcategories and subcategoriesbased on a number of different viewpoints.Program structures can be built according to curricular divisions, age-gradedivisions, goal and objective divisions, and many others.
The program structure determines the way in which data about variousprograms can be collected and analyzed. Hence, the program structuremust be designed to answer particular kinds of questions that the adminis-trator or policymaker asks. The inevitable attention bias of the programstructure must be the decision-maker's own bias.
Resource, cost, and effectiveness analyses are used to evaluate presentand potential programs and to fit them into the categories called for by theprogram structure.
The program budget is derived from the structure and the cost models.It costs out system activities by program.
The Multi-Year Financial Plan (MY FP) projects the cost implications ofcurrent programs over a period of years. These projections are crucial be-cause the long-range cost changes of competing alternatives can differgreatly from their near-term costs.
The crosswalk relates costs aggregated by program to costs aggregated
by more traditional line-item divisions. Such a document can show, forexample, how much is being spent for central administration in relationto each of seven programs. It can also help those unfamiliar with programbudgeting to make sense of the new budget in the old, line-item terms.
The program memorandum documents the alternatives that have beenconsidered, their rationales, the criteria used to evaluate these alternatives,the reasons why some alternatives look better than others, and the justifica-tion for recommending-one alternative over all others.
An issue analysis is used when an issue appears that does not seemdirectly relevant to the basic program structure but that is important andcuts across program lines. By conducting and publishing this kind of
253250
analysis, a systematic perception of the issue's resource, cost, and effective-ness implications can be derived.
Imbalanced Implementation of PPB
As already indicated, PPB is an elaboration of systems analysis de-signed to be of maximum utility in planning and management and its struc-ture is implicit in the series of program documents provided by that process.Both its structure and process are relatively straightforward and have excitedlittle controversy. In implementing PPB, however, many practitioners dis-
agree vehemently.It is very easy to emphasize one aspect of PPB at the expense of others,
forgetting that the PPB approach balances a range of planning, budgetary,control, analytic, and information issues. There are several biases in theimplementation of PPB.
Budgeting Bias Many imbalanced implementations stress budgeting anddefine PPB as a system in which the budget is operationally transformed.The budget not only aggregates and displays annual expenditure proposals,but also introduces goals and alternatives into resource allocation decisions.
It is used as an instrument for analysis and for incorporating analysis inactual resource allocation decisions.
Those who overemphasize the budget aspects of PPB cite three reasons
for their approach:
The budgeting process is the arena where resource allocationdecisions are scrutinized and analyzed.
Resource allocation decisions actually are made through the budget-ing process.
These resource allocation decisions are explicitly communicated,made operational, and effectively formalized through the budget.
Budgeting-oriented implementation has many shortcomings. . It pro-duces information more appropriate for accounting than for planning oranalysis. It is too rigid to improve decision-making in many organizations.In sum, it overemphasizes the importance of budgeting in the decision-
making process. Frequently, this kind of implementation produces nothingmore than a change of accounting procedures that use analysis only to
justify budget requests.
Goal and Objective Bias The basic idea here is to enable administratorsto see and define more clearly their own goals and objectives, and PPB is
defined as no more than a planning and control mechanism which states
251
goals and objectives and examines organizational activities to see how theycontribute to these objectives.
Those who advocate this form of imbalanced implementation cite thefollowing reasons for their approach:
The effectiveness of an activity cannot be evaluated unless objectivesare stated.
In competing for resources, organizational units often overem-phasize their parochial priorities and ignore the general purposesof the organization.
Trade-offs between objectives must he made. If the objectives arenot clearly defined, administrators may unknowingly weight someobjectives much more highly than others by incorporating theirown biases, by overweighting more easily measured objectives, orby utilizing an inaccurate intuitive model describing the relationshipsamong these objectives.
Yet goal-oriented implementation also has severe' shortcomings. In
many organizations, defining goals and objectives is extremely difficult andmay be very time-consuming. Goals and objectives often differ across thesame decision-making level and throughout the decision-making hierarchy.Moreover, since politicians are reluctant to define their real objectivesclearly, a goal-oriented approach to PPB can produce a very general,politically influenced set of pseudo-philosophical goals. Because suchgoals are unrealistic, they cannot aid decision-making or help to changeexisting activities.
Integration Bias A third common implementation error arises becausePPB is an integrated system that uses many familiar concepts and techniques.According to advocates of this form of implementation, the most importantaspect of PPB is that it combines these concepts and applies the total pack-age to decision-making.
Clearly, this integrated procedure approach to implementation doesnot overemphasize any one part of PPB, but it does have its own majorshortcomings.
First, it is difficult to apply this integrated approach to PPB in educa-tion. Secondly, attempting to implement all parts of PPB at once can heextremely costly in terms of manpower resources and monetary expendi-tures. Thirdly, some of the -procedures and required documents of PPBare absolutely essential, while others are useful but not essential.
The errors of integrated implementation may be avoided by askingone question: What are the central questions which educational managers
252
2 6
must answer, and what management concepts and techniques are neededto answer those questions? This qt.iery will prevent practitioners fromwasting too much effort on implementing documents and from ignoringmore helpful concepts and techniques.
Information Bias In this case, PPB is defined as a system to providemore and better information for planning programs and for choosing among
alternatives.The rationale of an overemphasis on information includes the fol-
lowing arguments:
More environmental information is needed for planning purposes.More evaluative information is needed to analyze present programs.More cost information for present and future years is needed.More research information is needed to predict impacts of alter-
natives.Present information flows need to be better structured and or-
ganized so that decision-makers can actually use the data.There is a need for more decision-oriented information-gathering.
The major shortcoming of this approach is that it may be even moreineffective and costly than the other implementation errors already con-sidered. More information does not necessarily imply better decisions.Without a conceptual framework for resource allocation decisions, or therealization that information is just one part of the decision-making process,vast stores of data are highly counterproductive.
Program Bias This approach overemphasizes the hierarchy of goal-oriented activities and the program structure that form the framework forplanning, systematic analysis, and budgeting. Unfortunately, program ana-lysts often emphasize a rational and comprehensive program structure atthe expense of a structure useful to decision-makers. Ideally, the program
structure should highlight key policy and budget decisions, stimulate ad-
ministrative reform, and enable decision-makers to confront specific activ-ities; but it is almost impossible for one program structure to serve decision-makers effectively in their diverse functions of planning, programming, and
budgeting.
Balanced Implementation of PPB
There are many forms of imbalanceci PPB implementation. The ex-amples already cited are only a sample of implementation errors. But what
is balanced implementation?
253
261

The meaning of balanced implementation can be clarified by exam-ining the most frequent criticisms of program-budgeting implementation.Most of them relate to two major problem areas: the distortions inherentin program structures and categories, and the behavioral obstacles toimplementation.
Structural Problems
Problem: One problem that occurs in many applications of programbudgeting is the lack of a clearly focused program structure. Governmentagencies can be confused about whether the structure is designed primarilyto assist top-level decision-makers or to help department or regional heads(middle management).
Solution: This confusion is neither likely nor serious when implemen-tation is balanced, gradual, and diversified. Such implementation beginswith a structure designed to serve the central office, but that structureevolves in a decentralized way as the lower levels of the education systemdevelop their variations on central office objectives and programs. Thus,the program structure comes to serve all organizational levels, though theprogram categories are oriented toward the central office. Althoughevaluation, analysis, and budgeting must remain central office functions,evolution of the program structure should be a cooperative effort. Sig-nificant aspects of program development should be a major responsibilityof lower-level departments and/or branches.
Problem: Many critics contend that program budgeting inherentlystresses the paperwork over the productthat building a program struc-ture, collecting data, and preparing program documents become moreimportant than developing more effective programs and improving resourceallocation.
Solution: The key to solving this problem is to explain the real mean-ing of the forms to be completed; ongoing workshops in the aims andmethods of program budgeting prevent overconcentration on paper-work. Also, implementing PPB at all levels of the organization, and notjust from the top down, can dispel the notion that PPB paperwork is nomore than "another bunch of forms for the central office." Thus, as lower-level programs emerge, personnel at those levels become aware that theprocedures they follow and the data they provide directly affect their ownactivities and achievements.
Problem: A third, and more serious contention is that program
254
20.2
f.
budgeting and program structures inherently direct analysis to budgetingand not to policies.
Solution: The problem seems to depend on bow the program struc-ture is built. If it is designed for management and control and shaped bybudgeters and the line-item budget, it naturally will reflect budgetary con-cerns and direct analysis toward those concerns. But if the programstructure is designed for planning purposes and built by structural analysts,analysis will focus on policies.
Still, the interpenetration of budgetary and analytic concerns canseriously hamper the development of better policies. To insure that anal-ysis will occur where it is needed for policy decisions, PPB implementationshould separate analytic from budgetary concerns by creating a centralanalytic staff sufficiently capable and independent to operate withoutrecourse to the budgetary branch.
Problem: Another objection is that program budgeting produces vastamounts of data that inundate the decision-maker but have little meaningbecause they are not causally related.
Solution: There is no reason to believe that this problem is inevitable.A meaningless flood of data results from poorly designed, understaffedPPB systems. Such systems do not have an analytic staff sufficiently large,skilled, and diversified to digest and interrelate data and to present specificrecommendations and alternatives. Hence, the distinction between theanalyst and the decision-maker is blurred, and the administrator must per-form analytic tasks for which he has little time or training. An effectiveimplementation effort solves this problem by relieving the analyst (oranalytic branch) of line responsibility, and the decision-maker of analytictasks.
Problem: The last of these structural problems is the supposed in-adequacy of program memoranda. Some critics say that program memo-randa are simple re-flections of current- policy or products of organizationalcompromiseinstead of careful analyses of alternative programs.
Solution: It is easier to write a standard program memorandum cal-culated to please the central office than to produce a searching analysisof program cost and effectiveness; and most organizations tend to take theeasier route. Yet program memoranda are stagnant and meaningless onlyif those who create them know little of what the memoranda are supposedto be and do, and have little stake in the documents or in improvingexisting programs. Implementation, therefore, should include training
255
23
sessions to educate people about the meaning and consequences of pro-gram documents. This training is reinforced by a decentralized, responsivesystem that will show all personnel that they have a real stake in thedocuments submitted to the analytic branch. PPB of this type helps lineoperators and administrators to articulate desire for change in terms thatare useful for program memoranda.
Behavioral Problems
The second major group of criticisms covers problems more be-havioral than those already considered.
Problem: First among these problems is the contention that programbudgeting exposes and increases organizational conflict by forcing oppo-nents to state their cases explicitly, in terms. of cost and effectiveness.
Solution: PPB does underline organizational conflicts; but unless suchconflicts are brought to light, they cannot be resolved rationally. Thoughit may be disruptive at first, clarifying conflicts ultimately benefits theorganization by illuminating the bases of decision-making.
Problem: Critics also contend that PPB increases organizational con-flict by disrupting the pattern of "budgeting by political bargaining" amongconflicting interests.
Solution: In many organizations, budgeting by political bargainingleads to gross inefficiencies; education can only benefit if this process isdisturbed and changed. Again, training sessions can facilitate change byhelping budgeters understand the purposes of program budgeting, andto realize that the greater power to secure funds comes from analyticalpresentation of budget requests. Moreover, separating the analytic fromthe budgetary organization insures that all bargaining (or trade-offs amongdepartments, districts, and programs) will relate to resources and effective-ness, and not just monetary costs. Comprehensive and balanced implemen-tation leads budgeters to advise analysts, to translate needed resources intodollars, and to refrain from bargaining that is susceptible to political con-siderations.
Problem: Closely related to the previous objection is the belief thatprogram budgeting poses a real threat to lower-level personnel andbudgeters. Critics contend that such people are accustomed to insularityand routine, and so resistant to change that program budgeting may beunable to involve them without being sabotaged.
Solution: Whatever resistance lower-level personnel may have should
256
264.
change to advocacy if they understand that a decentralized, responsiblePPB system offers them more and better opportunities to influence programdevelopment.
In summary, program budgeting is a formalized approach to educa-tional planning. As a result, it implies the implementation of an integratedmanagement system. The purpose of the system is the orgatization ofinformation about policy choices. The focus of the system is, therefore, onthe development and evaluation of options for the key decision- makerswithin the educational ministries of developing countries.
In order to organize and develop useful information for policy andmanagerial purposes, program budgeting uses system-analytical approachesand techniques as its fundamental mode of inqu' The development ofanalytically useful information concerning educ,..",ional options assumesconstruction and interpretation of relevant resource, cost, and effectivenessdata for all options under consideration. The analysis of alternatives forpolicy development is clearly the purpose and most important undertakingof the program-budgeting system. The distinctiveness of the program-budgeting system is that when well implemented it provides a regular andcontinuing scheme for the organization and reporting of critical data forthe analysis of program options. The system provides for the production ofseveral output documents: a program structure, a program budget, a cross-walk, a multi-year financial plan, and program memoranda. These docu-ments represent the results of activities in the five main areas of theprogram-budgeting system: analysis, management, budgeting, evaluation,and information retrieval.
Program budgeting is no substitute for decision-making. It merelyadds to the judgment of policymakers information which can assist themin determining the implications of the choices they must consider.
257
CHAPTER XIX
Data for Analysis andDecision-Making
THE preceding chapter discussed planning and program budgeting as waysto project fiscal resource needs and to promote efficiency for better
use of __resources. A change in the orientation of planning and the use ofprogram budgeting have been proposed here for the purposes of creatinggreater efficiency. An essential ingredient of the proposed planning ap-proach, and of program budgeting, is for availability of special kinds ofdataespecially, data on program performance. Most countries have a
superabundance of data of various types, but these data do not permitanalysis of program efficiency. They tend to be descriptive and to permitidentification of problems, but seldom indicate ways of remedying theproblems and increasing efficiency. In particular, the data available oncosts are incomplete and poorly organized and, as a result, they do notpermit program budgeting.
This chapter discusses criteria for determining usefulness of data.The general criteria for data include user-orientation, economy, flexibility,relevance, simplicity, timeliness, completeness, accuracy, and accessibility.Specific operational characteristics of data for planning and program bud-geting that include policy-relatedness, disaggregation, and cost-e.tectivenessof data gathering are also analyzed.
THE NEEDS FOR DATA
Inadequate educational planning and administration in developingcountries is often attributed to a severe lack of relevant data. Data merelydescribing education systems have been both incomplete and unreliablein many countries. Here, descriptive data include: data on enrollment,wastage, repetition; on the number, qualifications, and distribution ofteachers; and on the costs of existing educational programs. But even ifthese descriptive data were complete, systematic analysis of policy choicesand expenditure decisions require still other kinds of data.
Sophisticated data, such as performance data, are rarely available.
258
Z66
Performance data indicate how well various levels and types of educationachieve their goals. They include data on examination scores; on subse-quent performance in later schooling; and on employment and incomeafter leaving school. Data on program performance are essential for cost-effectiveness analysis, program budgeting, and other analytical approachesto improving system efficiencyincluding program planning, implementa-tion, and evaluation.
It is paradoxical to discuss a lack of educational data when mostcountries possess abundant statistical series and reports on education.Some ministries even suffer from data glut. A profusion of virtually uselessdata only clogs information channels, physically and conceptually. Someexisting data are useful or essential; many are not.
At best, data ordinarily available to ministries tend to permit theanalyst to say that something is wrong: enrollment and population datashow low enrollment ratios; wastage data show excessive dropouts; ormanpower data may show shortages or surpluses of a given type ofeducation. Usually, the data are highly aggregated and do not revealmore than the surface of a problem. It is impossible to tell from, say,national population and enrollment figures whether under-enrollment is ageneral probleM or mainly a rural phenomenon. Even in the unusual casewhere census and enrollment data are broken down by comparable urbanand rural zones, the relationship between variables such as parental incomeand attendance cannot be investigated. In short, standard gross aggregatesprovide no insight into the causes of the problem or where to seek asolution.
A different kind of data is needed to identify possible solutions to edu-cational problems. Different variables relating to programs or activitieswithin administrators' policy control are needed to transcend mere problemidentification and to begin to indicate positive solutions. For example, con-sider excessive dropouts. Assume that aggregated data indicate the prob-lem exists, that a school lunch program has been considered as a possiblesolution, and that a pilot program will be initiated in one or more clearlydefined regions. Some data determining the program's "starting point" mustbe gathered before beginning the pilot programa need that is rarely recog-nized. The prior data-gathering should include: census data available forthe pilot area, and the age groups involved; and the prevailing levels ofattendance and enrollment prior to the pilot program. Such data establisha basis for comparison with later data to show the program's impact. Whprea general upward trend in enrollment ratios exists, a control group may beuseful to check the program's impact against this general trend. Data on
259
2,67
changes in enrollment, attendance and dropouts will provide the basis forassessing the program's impact. Detailed data on cost variables will beneeded to determine not only the impact but also the cost-effectiveness ofthe experimental program. The combined data would permit decision-makers to ascertain the number of pupils which the lunch program inducedto attend or remain in school; the program's total cost; and the averagecost per additional pupil-years of attendance. The lunch program exampleshows the kinds of data that might be needed for analyses and policydecisions.
SOURCES OF DATA FOR MINISTRIES OF EDUCATION
There are two main sources of data in Ministries of Education. Thefirst consists of regular reports written for various administrative reasons.Enrollment data are maintained because financial grants or teacher assign-ments are often based on the number of pupils enrolled in a school. In
some countries, attendance data are also maintained and reported. Informa-tion on pupils repeating a gradea first or second timetends to be unnec-essary for administrative purposes, so full and reliable data on repetitionhave not been available in most countries, at least not until recently.
The second kind of data is that generated by special studies and re-search. Sometimes administrators have requIred that data be collectedregularly for added information, such as data on repetition, and notbecause some administrative function required the data. These special databecome part of the regular information base. In other cases, the Ministryof Education requests special, one-time studies, such as an inventory ofschool buildings and facilities. Such data continue to be available, butunless they are adjusted periodically through additions to and withdrawalsfrom the stock of school buildings, they quickly become outdated.
Other kinds of special-purpose data come from outside studies madeavailable to ministry policymakers. These studies may be performed byother public agencies, such as periodic household surveys of the CensusBureau or by private researchers. The special studies provide potentiallyuseful information to augment regularly reported data.
Data on program performance have not been gathered regularly inmost countries. The need for information on program accomplishmentshas not been recognized, so the "natural" or automatic reporting used forenrollment data has not occurred. There are also other reasons why per-formance data are not reported. First, there are technical difficulties. If
objectives are obscure, it is not clear what should be measured. Somemeasurements, such as examination scores, have questionable validity.
260
263

Second, there are bureaucratic reasons why educational personnelinclud-ing teachersand school administratorsresist performance measures. If
available, performance indicators might impose a burden of accountabilitythat does not now exist. Most everyone from teacher to school administra-tor to regional administrator would prefer to have full freedom of action,rather than be judged by such performance indicators. For these reasons,information on the results of educational programs are not generallyavailable.
All of the difficulties mentioned above are real. Gathering perfor-mance data is not easy. But there can be improvement on the present situa-tion. The movement to establish operational objectives and instrumentsto measure their accomplishments at the micro-level has gained consider-able momentum. Efforts to improve and extend these instruments arecontinuing. Applying economic analysis to education has led researchersto consider not only achievements in school but also future employmentand earnings as a measure of effectiveness. The same principle can be ap-plied to measurement of non-monetary objectives, such as future perfor-mance by graduates of specific programs in later schooling.
Administrators at all levels need questioning, and evaluation-orientedattitudes. These will not be developed easily or without costs, but it can bedone. The effect on educational data and, ultimately, on performancewould be highly significant and useful.
Practical problems cause difficulties with even the most basic type ofdata-gathering and they differ from country to country. In some countries,climatic conditions or harvest seasons create different scheduling of theschool year in different regions. This complicates the problem of providingbasic enrollment data on a uniform time-basis. Double-sessions make it
difficult to determine the student-teacher ratios. Universities with largepart-time enrollment and part-time faculties find it hard to measure eitherenrollment or staff on a full-time equivalent basis. Data on private educa-tion are also usually hard to obtain. These particular problems requirespecific solutions, but the principal focus of this chapter is on the generalcriteria for useful policy data.
General Criteria for Data
There are nine basic general criteria: data should be oriented towardthe user; economical to gather; flexible; relevant; simple; timely; complete;accurate; and accessible.
Obviously, some of these criteria conflict with others. No set of datacan be perfect, and administrators and planners must "trade off" improve-
261
269
y.
ments in one characteristic dimension against sacrifices in another. For
example, complete data may not be available on as timely a basis as partialdata; more detailed and "flexible" data may be more costly to gather thanmore highly-aggregated data.
The discussions below merely indicate the nature of the criteria. Onlyadministrators using the data can decide how the trade-offs should be made.
Data Should Be User-Related Analysts trying to use data often findthat they are compiled on a basis that prevents working with them. In
budget data, to cite an important example, expenditures are usually cate-gorized by itemsuch as "textbook expenditures," or "vehicle costs," or"chalk"rather than by function, by educational level, or by major itemof expenditure. A primary problem in implementing a program-budgetingsystem is that of categorizing expenditure data to permit meaningful analysisof expenditures. Any form of categorization has shortcomingsas program-budgeting practitioners have learned.
But it is possible to make major improvements in categorizing expendi-ture and other data on those patterns generally used in developing coun-tries. The basic step of calculating unit costssuch as teaching costs perstudent, or administrative cost per student or per schooloften greatlyimproves the information content or "insight value" of cost data. Gatheringdata in the most useful form is often hampered because administrators donot know what questions to ask, that is, for what purposes the data will beneeded. Time and effort spent in clarifying these questions at an early stageavoids costly and often useless data-gathering later on.
Achieving user-relatedness is a two-way process. Administrators needto give careful consideration to their information needs as much as plannersand statisticians. Some points discussed under operational characteristicsof data directly concern user-relatedness.
Data-Gathering Should Be Economical Information-gathering is costly."Automatically reported" data may cost less to gather than data requiringspecial efforts, but even automatically reported data must be compiled,transmitted, tabulated, stored, and retrieved. Costs of handling data shouldbe reduced where possible. But this has often been done by omitting detailwith a resulting loss of important information.
The most effective cost-saving method is to determine the variablesneeded for measurement and analysis before major new information systemsare established. Like efforts to determine users' needs, time spent in speci-fying variables can bring major savings later. In the majority of educationsystems, most pupil data include enrollment by sex. Knowing this may be
262
270
useful for some purposes, but the costs and work of gathering and tabulat-ing all pupil data by sex should be carefully considered. There may be lessexpensive alternative sources of the information needed, such as use ofsampling techniques or classification by sex only at specified levels.
Special-purpose studies are the most expensive source of data but theycan be the most cost-effective way to get needed information. If regularreporting sources do not yield data on key variables and if the information'svalue justifies gathering it, then special-purpose surveys or samples areneeded. If well designed, these can produceinfo-imation at reasonable cost.But the capability to design surveys has usually been scarce in Ministriesof Education. Again, the best way to reduce the costs of information is todetermine clearly what it is that needs to be known.
A Data System Should Be Flexible This can mean that some series maybe added or dropped on a flexible basis, and this may be desirable. Somenational statistical publications are burdened with tables and series that areno longer needed and that should be discontinued. There is a conflict here
between such flexibility and the need for consistency and continuity inpublished series. In some cases, series could be dropped from publicationwith the raw data maintained for a while in case a user may need it.
Data should also be gathered and compiled so that they can be usedfor many different purposes. This is not a simple or inexpensive task. Theprincipal way to accomplish analytical flexibility is to maintain a fairly highdegree of disaggregation and specificity. Maintaining detail on individualunits of analysissuch as the schoolpermits cross-tabulation and multi-variate analysis. If a survey of teacher qualifications is made, it should bepossible to relate its data to, say, studies of pupil performance or of educa-tional costs. Flexible relationship of variables for different analytical pur-poses greatly increases the usefulness of data.
Data-Gathering Should Be Simple Compiling data regularly or forspecial purposes can cost more than the benefits of the information gained.The cost and effort required to gather the data may not be worth it to theeducational system. This conflict between benefits and costs of data-gathering should be considered, when planning any regular series, or a spe-
cial study.
Data Should Be Available on a Timely Basis Obviously, informationneeded for an annual budget must be available at a certain time. In other
cases, rapid compilation and presentation of data are less critical but stillimportant. Data made available long after they are gathered may be obso-lete before they reach the analyst or decision-maker. Rapid feedback of
263
271
information is of great importance, especially in evaluating new or experi-mental programs. Timeliness of data availability conflicts with completeness,degree of detail and, to some extent, accuracy. Using sampling techniquesrather than full surveys, eliminating some detail, and using estimates insteadof definitive measurements, say, of costsall allow for more rapid data-gathering. But sampling-error, loss of important information by omittingdetail, and possible inconsistencies between estimated and directly mea-sured data reduce the effectiveness of these methods. The administratormust decide how to weigh these alternatives. Sometimes having imperfectdata when needed is better than having perfect data too late or no infor-mation at all.
Data Should Be Complete All too often data are regularly gathered formerely a portion of the education system. When a number of ministriesconduct educational activities (i.e., vocational training may be provided bya wide array of agencies), or when the private sector is significantly involved,compiling data on merely a part of the broad educational system may causeerroneous policy conclusions. In at least one country, overlooking the roleof private teacher-training colleges caused serious overinvestment in publicteacher-training facilities. While some uses of data may not require com-pleteness, comprehensive data should be available to provide a full pers-pective on the educational system's major aspects. The degree of com-pleteness of data series should always be made quite clear to the user.
Data Should Be Accurate The goal of accuracy is not as simple toachieve as it might seem. As noted earlier, sometimes using estimates ratherthan direct measurements gives greater speed or economy. One initial stepto improve accuracy is to identify and guard against possible biases inreporting. If grants or teacher assignments are based on enrollment, thereis a strong incentive to inflate enrollment figures. Attendance may likewisebe over-reported because low attendance rates reflect badly on teachersand administrators. Besides such biases, possible interpretation errors ormere clerical errors should also be checked. Spot verifications of accuracyare useful. There are also internal checks on consistency. Separate seriesshould give the same totals; tables can permit cross-checking of clericalaccuracy. But in many cases, accuracy is a relative, not an absolute matter.Data-users may have to accept a reasonable degree of reliability and shouldnot expect perfection.
Data Should Be Accessible Basically, this means data should be pub-lished to make them accessible to all types of users. Openness with datawill increase a user's trust in the data and allow verification. Accessibility
264
272
also involves quick availability of information internally for analysis. Elec-
tronic data processing and improved storage and retrieval have producedmajor improvements in this area. In cases where disaggregation leads tolarge quantities of detailed data, machine processing, especially, may makeit possible to minimize physical limitations of data handling. But establish-ing large "data banks" may be costly and useless unless the informationsystem is carefully planned to permit access to the data. Once again, it iscrucial to know the uses the data will be put to when the information systemis designed.
Operational Criteria of Data
Besides the general criteria already discussed, there are some charac-teristics needed for data used in policy analysis, such as policy-relevance;relevance to the unit being observed; relation to educational performanceand costs; and cost-effectiveness of data-gathering. Not all of these charac-teristics will occur in a single data series. But ideally the full set of data madeavailable to decision-makers should include all of these characteristics.
Data Should Be Policy-Relevant To further elaborate on the point thatdata should be gathered for specific information needs, data should relateto variables over which decision-makers have some policy control. A studyof the relationship between wastage and family income by region mayreveal strong correlations between the two. But because educational deci-sion-makers have no control over family income, such a study may providelittle more information than what intuition would have provided and offersno guidance for policy. Rather, studies measuring the burden of school fees,
private costs of education (clothing, books and supplies), and the subsidylevels needed for children to continue schooling would produce informa-tion that is a useful guide to action. The ultimate value of information for
planning and administration lies in the guidance it provides for action.
Data Should be Disaggregated and Specific to the Relevant Unit Ob-served Aggregated data cause information loss, especially of insights intoprogram performance and effectiveness. In some studies, the unit observed
may be the school or the class, but even this much aggregation may obscure
what happens to individual pupils. What is needed are data on the rela-tionships between "treatment" variables (teachers, texts, or experimentalprograms) and their impact on pupils' performance. Information on suchrelationships calls for micro-analysis of educational functions.
It should be possible to relate one variable to another in a particular
265
273
study, either in simple cross-tabulations or by multivariate analyses. Sep-arate studies of individual variables can be an improvement over what hadbeen a total absence of data. But the scope, flexibility, and usefulness ofdata are greater if two or more variables can be related. This calls for con-siderable, precise detail, which involves higher costs. The costs may nowbe.reduced by machine-processing of data.
Data Sets Should Measure Educational Performance The need for anddifficulties of obtaining performance data were discussed in the introduc-tion to this chapter. Once again, the key to improving data systems, analy-sis, and policymaking lies in asking the right questions. Questions concern-ing how well the education system is working, or what variables influenceits success, have not been askedoften because no data were availableon which to base answers. Well-designed research can prevent wrong orirrelevant policy questions based on inadequate data. This need has notbeen recognized or understoodeven in developed countriesuntil re-cently. The circle of wrong or irrelevant policy questions and inadequatedata for sound policy analysis can be broken with well-designed research.Data can help improve educational effectiveness by simply indicating whatis effective.
One means of gathering data on educational performance is throughlongitudinal studies which trace graduates of various levels as they progressthrough higher levels of education or in their work experience. Becausedirect measurement of an educational program's effectiveness is often diffi-cult, other indicators of accomplishment may be obtained from the laterexperiences of graduates. Cross-section studies cannot provide as muchinformation as longitudinal studies. Single evaluations of programs aftertheir completion often do not provide information on the causes of successor failure. But data obtained by tracing individuals are quite useful in
explaining the effectiveness of these programs. At the very least, "beforeand after" measurements should be made. But even this need has not beenfully acknowledged in education.
Data on Costs Are Necessary The need for data on costs has beenalmost as much overlooked as that for performance data. Cost data areimportant for the most basic tasks of management, budgeting, planning,and control of educational organizations from the school to the nationalsystem. Even the most straightforward projections of budget requirementsare impossible without sound, reliable cost information. But besides de-scriptive measurement and control uses, cost data have a most importantanalytical role. They are essential to cost-effectiveness analysis. Together
266
274
they provide the basis for informed choices on achieving the greatest possi-ble improvements with the resources available.
Data-Gathering Should Be Cost-Effective Cost-effectiveness analysisshould not only be applied to educational programs, but also to the devel-OPMent of a data system. If a study's costs are too high, it should not beperformed. Or, ways should be found to get the same information at lowercost.
One means of reducing data-gathering costs is through sample studies.The reliability of sample studies (given certain conditions) is not generallyunderstood by non-statisticians. Few administrators in developing educa-tional systems recognize that a well-designed sample survey can producepolicy information virtually as accurate as a complete census. Nor are ad-ministrators aware that sampling can improve the manageability of data(by avoiding data-glut), reduce costs, and increase the speed of analysis.Sampling can often produce useful policy information more effectively thanfull surveys. Proper design of the sample frame, randomization, stratifica-tion (if desired), and so on are not difficult to achieve. Unfortunately, manydeveloping countries do not have able statisticians to perform these tasksnor administrators sufficiently aware of the values of sampling.
Because special studies are often needed to obtain policy data onperformance costs, and so on, and because of the costs of ad hoc data-gathering, sampling is a way to reduce the costs and other burdens of suchstudies. As already noted, some criteria for data will conflict with others.Because sampling reduces costs and increases the ease of data-handling, itcan act to relieve some of the constraints on data-gathering and removethe need to trade one desired characteristic for another. Particularly withlongitudinal performance studies and investigation of costs, sampling tech-niques make possible policy research that has rarely been done before indeveloping countries due to cost, time, or manpower constraints.
The level of competence in data management and analysis in develop-ing countries is generally low. Considerable competence is needed todesign information systems efficiently, to minimize data-gathering costs,to provide the specific information policymakers need, to invesitgate per-formance and costs through sound analytical techniques, and to use sam-pling methods. This is an area where technical assistance and training effortsof international agencies can make a most significant contribution in im-proving the quality of information. This, in turn, can lead to major improve-ments in educational effectiveness in developing countries.
267
2 7
CHAPTER XX
The Administrative Context ofPlanning, Budgeting and
Implementation
THERE are many administrative and organizational issues that bear uponplanning and budgeting. One in particular concerns the way educa-
tional resources are distributed and the efficiency with which they are used.The degree of centralization or decentralization of the administrativeprocess affects the distribution and efficiency of educational resources.
Education systems in developing countries tend to be highly centralizedwhich may contribute to efficiency because decisions are more directlyrelated to implementation. But highly centralized administrative systemsmay be more rigid and difficult to change than decentralized ones andmay also involve serious inefficiencies-when breakdowns in communicationacross many hierarchical levels occur.
The degree of centralization affects not only efficiency in various waysbut also the equitable distribution of educational services to differentgroups. Centralization results partly from factors of power and politics.But it also results from the regional distribution of income, the ability ofvarious regions to generate fiscal resources for education, and the degreeto which tax revenues are drawn from export taxes and other centrallycollected revenues. There are various pressures for the decentralizationand "democratization" of educational administration, and these will befelt increasingly in developing countries as levels of education and politicalconsciousness rise in outlying regions. The issue of whether educationaladministration should be centralized or decentralized is complex.
The following discussion involves some major factors to be consideredin making this decision. These include the system of incentives that induceslower-level administrators to perform efficiently and implement programseffectively; the flows of information upward and downward in the admin-istrative hierarchy; and the interaction between administration and planning.Factors relating specifically to planning in a centralized or decentralizedsystem include goal hierarchies; qualitative standards; economies of scale;and interregional and inter-group equity.
268
276
The relationships between the degree of centralization, the ways inwhich resources are used, and the nature of the planning and budgetingprocess are also complex. This chapter will explore the various issues in-volved and will consider the factors that influence the degree of central-ization and the arguments for more or less centralized control. A recentexample of a decentralized, self-regulating system of financing education isincluded.
CENTRALIZATION VERSUS DECENTRALIZATION OF
EDUCATIONAL ADMINISTRATION
- Most educational systems in developing countries are highly central-ized. The reasons for this are partially political, partially economic, andpartially bureaucratic; but the concern here is not why systems are central-ized but what effect this has on educational finance and the efficiency ofdelivering educational services. There are also strong relationships betweenthe degree of centralization and the flows of information in the system,which will be discussed below. But first it will be desirable at the outsetto clarify what is meant by centralization and decentralization and howadministrators achieve efficiency in each organizational context.
Centralization implies that more than one level of authority exists.Educational administrative organizations are hierarchical. There are manyorganizational patterns, but most systems have a layered structure alongthe following lines:
An executive level: the Minister, Deputy-Minister, Director-General,Chief Financial Officer, etc.
Specialized executive agencies: planning office, inspection branch,etc.
----Functional or level-specific divisions: primary, secondary or voca-tional education, teacher training, etc.
Major geographic subdivisions: regional, state or departmentaloffices.
School-level administration: principals or headmasters of individualschools.
These major .; eels are sometimes subdivided with differing degreesof autonomy and authority. How much the decision-making authority isconcentrated toward the top of the hierarchy reflects the degree of theorganization's centralization. In a centralized administration, all decisionswould be top level. The lower levels would merely carry out directivesfrom above, without any delegated or discretionary authority.
269
27,7
There are two basic ways top-level administrators can promote effi-ciency: via directives to lower levels that require actions leading to highlevels of goal accomplishment; or through an incentive system that makeslower-level officials perform efficiently because it will be in their own bestinterests. A more highly centralized administration uses more directives,delegating relatively little .authority and allowing lower-level officials littlediscretionary action. In a fully decentralized system, few or no directivesare issued by higher-level officials. Choices by lower-level officials areguided by incentives. In such a system, top-level authority and individualautonomy are separate.
The degree of centralization or decentralization can also vary betweenlevels within a many-layered system. The executive level may delegatemuch authority to the functional groups. These may then operate in a verycentralized manner, issuing their own directives. The regional office mayexert rigid controls over schools, but this could still give teachers muchautonomy in classroom activities. Generally, however, a system that is cen-tralized at higher levels tends to be centralized at lower levels as well.
Centralization and decentralization rarely exist exclusive of each other.Even the most monolithic educational systems have many decentralizedelements. Policy decisions may be made centrally, but the implementationand interpretation of policy must necessarily be done by many functionaland regional administrators; thus providing a degree of decentralization.An important portion of the administrative and decision-making processtakes place at the most decentralized levelthe school, where educationoccurs between pupils and their teachers.
But even a highly decentralized education system is influenced con-siderably by different central bodies. Education in the United States issomewhat centralized at the state leveland some states are as large andpopulous as some developing countries. Other important sources of centralcontrol are the national examining bodies that administer the "CollegeBoard" examinations, which exert a strong influence on all schools. Regionalaccrediting boards have a strong voice on school standards. Federal fundingand regulation of categorical programs also serve as a centralizing force.
The question is not a distinction between total centralization or de-centralization, but one of degree. Most developing countries have relativelyhighly centralized education systems with national ministries that establishpolicies and procedures for all public schools, as well as regulations andstandards for most private education. One important reason for this is thatat low average levels of income and with relatively weak tax structures,individual communities cannot pay for education with self-generated re-
270
278
fFINWIFINI
sources. Central funding (often based heavily on export and import taxrevenues, taxes on major crops, corporate profits, etc.) is conducive tocentralized administration. So a consideration of centralization versus de-centralization as it applies to developing countries really involves a discus-SiQ,Q of an existing, relatively centralized pattern of administration versusa system with a somewhat lesser degree of centralization.
"There are several factors that should be weighed in choosing the degreeof centralization or decentralization in a particular national context.
The Incentive System A decentralized education system operates onbroadly delegated authority and decentralized decisions based on a work-able incentive system. But because educational systems, in general, haveunclear goals and outputs that are difficult to measure, an effective incentivesystem is difficult to achieve.
A corporate manager may leave product divisions quite free of direc-tives from above. He can give the division manager nearly total autonomybecause periodic statements of the amount and rate of profit clearly showhow well the division performs. The division manager will perform asefficiently as possible because pay, praise, and promotion are based on hisdivision's profits. But the high-level educational administrator cannot gen-erally operate in this way. He has few indicators of how well the systemis performingand none of them is as clear as profits. The administratorin developing countries tends to issue directives of an administrative natureonly, such as establishing teacher qualification requirements, class days peryear and hours per day, pupil-teacher ratio requirements, and textbook
choices, without specifying precise educational goalswithout which therecan be no valid measurement of performance. For this reason, an effective
incentive system is more difficult to achieve in the educational systems ofdeveloping countries than elsewhere.
Thus, there are definite limits to decentralization in the educationalsystems of most developing countries. But this condition may change withimprovements in goal clarity, and instruments for measuring accomplish-ment. Such changes, although minor, are happening already in some coun-
tries. In Malaysia, where the Examinations Syndicate operates a nationalsystem of standardized objective testing that permits measurement of cog-nitive gains, a first step in this direction is being taken. But much more work
is still needed to clarify goals, develop and adapt test instruments, andestablish performance incentives. As this work proceeds, some necessaryconditions for decentralization will be realized.
Information Flows One purpose of a decentralized educational system
271
279
is to gather and compile information on the functioning of the country'seducational system and on interregional differences in educational services.Such an overall view of the national educational system is most successfullyachieved by an administrative system that issues directives on what infor -.mation should be gathered and when. But there is no natural incentivesystem operating to produce a uniform and complete data-base, and thereis no automatic process for selecting or generating data which are usefulfor policy purposes. For example, a program-budgeting system requiresdata that is often difficult to gather. Such data may even reflect poorly onthe lower-level administrative unit. For these reasons, many agencies haveresisted implementing program budgeting. A strong centralized system maybe able to implement such an information and budgeting system moresuccessfully than a decentralized system.
An argument for decentralization concerns information flows. Hier-archical administration requires information flowing downward as direc-.tives and upward as responses to directives, indicators of activity, and gen-eral background data. Transmission of information is costly and tends toimpede effective administrative action. And in a centralized, many-layeredsystem, the information tends to get blurred v :th many transmissionsinformation is often lost, misinterpreted or distorted, and the message re-ceived and acted on may be quite different from the message sent. Finally,the flow of information down through the hierarchy and back up takes timewhich causes delays in decisions and implementation. Faulty or delayedinformation then leads to inefficiency costs, in addition to the costs of pre-paring and transmitting the messages. Thus, a centralized administrativesystem designed for efficiency has within itself the seeds of inefficiency.The more decentralized the system, the shorter the routes of information.
Planning Centralization may be necessary for effective planning. Cen-tral planning that takes into account the system's total operation can avoidwaste, duplication, and working at cross-purposes. Strategic national plan-ning can only be carried on when the highest level goals are taken intoaccount. Lower-level planning according to this argument tends to benarrow, since it may tend to overlook both broad national goals and de-velopments in other parts of the system.
But centralized planning may be too aggregative and general to beuseful to local-level administrators. Generalized plans are often ill-suitedto particular local situations. Plans made centrally often lack the valuableon-the-spot knowledge to make them effective locally and stimulate suc-cessful implementation. Centrally planned school building specificationsthat ignore local climate or geography or availability of materials are good
272
28j
examples. Therefore, it can also be argued that planning for expansionshould be made locally, guided by national-level objectives.
The best solution is a combination of centralized and decentralizedplanning. This requires delegating greater authority than most developingcountries' education systems now permit.
THE INTERACTION OF ADMINISTRATION AND PLANNING
There are several basic areas that must be considered in studying theinteraction of administration and planning. These include: hierarchies ofgoals; national standards of quality; economies of scale; equity and com-pensatory programs; possibilities for change; availability of scarce man-power; and social implications.
Hierarchies of Goals Goals differ at different levels of the administra-tive hierarchy. Top-level administrators are concerned with broad nationalgoals; lower officials are concerned with their own department or branchand with preserving their own position and perquisites. The specific prob-lems which administrators deal with also vary at different levels of the hier-archy. Top administrators, for example, may be concerned with possibleoverproduction of secondary-school graduates, while state administratorsmay be trying to meet more of the local demand for secondary places in re-
sponse to political pressure. While national officials are trying to reduce unit
costs, local officLls may be$rying to get as many luxuries for their schools
as possible. The issues differ and the analytical approaches that facilitate
decision-making also differ. If the incentive system operates effectively,then administrative planning and control can be highly decentralized. But,as indicated earlier, the system of.rewards in the local school system is not
linked to effective achievement of national goals.
National Standards of Quality A decentralized decision-making systempermits widely differing standards of quality. Even if funds are distributed
equally, they may be used differently. If funds are generated locally, com-munity willingness or ability to tax themselves to provide quality educationmay vary greatly. According to proponents of centralization, high standards
of educational quality can only be achieved through uniform nationally
set standards for class hours, pay scales, training requirements, textbook
supply, etc.- They also argue for a national system of accountability to assurecompliance with the standards. But the opposing argument holds that rigid
and pervasive standards stifle experimentation and alternative approaches
to providing educational services. National standards may, for example,
273
281
prevent using paraprofessional teachers and diverting resources thus savedto other useful purposes in the education system.
If reliable performance information were available, an incentive systemwould permit decentralization and foster local experimentation to give thechildren the best possible education with the available resources. Withoutsuch information and incentives, national directives that allow for justifiableexceptions may be the only recourse.
Economies of Scale Some functions and aspects of education involvereduction in unit costs with increased size of operationseconomies ofscaleand call for centralization. Local authorities cannot train teachersefficiently, particularly specialized teachers. Teacher-training institutes inlarge and populous regions may be feasible, but again may call for nationalstandards of quality in teacher education. Development and testing ofnew curricula can best be done through the research resources of nationalauthorities, although local improvements in methods of applying and imple-menting curriculum change may be very valuable.
For large'-scale purchases of materials and equipment, centralized pur-chasing agencies may achieve economy through their greater bargainingpower. But administrators should carefully consider the full costs of centrepurchasing because savings might not exceed the added costs of distribe--------tion. 'There are also possibilities of delays and loss of flexibility involvedin central purchasing. Finally, there is the use of scarce administrativemanpower to manage a purchasing and distribution operation that could behandled in the private sector.
Where there are possibilities for improved efficiency through larger-scale operations, moves toward centralization are justified. But, in general,some activities should be centralized, while others are handled better byrelatively autonomous lower-level administrative units.
Equity and Compensatory Programs rn.:Aecentralized systems such asin the United States, community differences in wealth lead to major differ-ences in educational services. The only" way to redress imbalances in adecentralized system lies in progressive general taxation and revenue trans-ferspossibly earmarked for educationto lower-income communities.
In a centralized system where most funds come from the nationaltreasury, equal funding on a per capita basis can foster greater equity.Where special compensatory programs offset some effects of socio-eco-nomic disadvantage, these can also be administered directly through cen-tralized education systems. Policies to provide equal educational servicesto all areas, or compensation programs for disadvantaged areas must by
274
2&2
their nature be made at the national level. This argument does not implythat the total administration of education should be centralized. But itdoes imply a need for centralization to achieve uniform national standardsof quality, centralized provision of teacher trainingwhich cannot besupported by poorer regions, some central funding of education, andan information system that fully measures the expenditures on education
in different regions.
Possibilities for Change Qualitative and quantitative development ofeducation systems means clianging established practices in various ways.It can be argued that smaller, decentralized administrative units can adoptand implement changes more readily. But there may be resistance toproposed changes by many local authorities, causing change on a nationalbasis to be slow or incomplete.
Centralized administrations, it would appear, can simply commandchanges and issue directives to implement new policies. But the changes
ordered at the top May not be actually carried out at lower levels. A newscience curriculum based on the teaching approach of "discovery" may be
adopted nationally. But even with workshops and in-service retraining,many science teachers throughout the country may continue to lecture as
always. Supervision of implementation can be carried out much moreeffectively by local administrators. The point here is that lower-level
administrators should be involved in decisions on a new policy, not simplyinformed from above, so that they will understand and be committed to thepolicy and strive to implement it.
Availability of Scarce Manpower It is sometimes argued that becausemost centralized systems in developing countries do not have enough able
administrators, decentralization would create impossible demands for ad-
ministrative talent. But from another point of view, managerial ability canhardly be developed in a highly centralized system. Initiative, decision-
making ability, and innovativeness are stifled when lower-level adminis-
trators have few choices. In a sense, demand for administrative ability will
create its own supply, although a hasty transition from a highly centralized
system to a highly decentralized system will probably create a manpower
vacuum. In the long run, managers who learned to exercise delegated
authority at lower levels would tend to assume central ministry positions
and ease the manpower shortage there. Thus, decentralization might serve
to strengthen all levels of the hierarchy.
Social Implications Transition from a centralized to a decentralizedadministration would significantly affect the attitudes and motivation of the
275
283
system's personnel. True participation in management and actual authorityin operating that part of the system they control would cause lower-leveladministrators to function more effectively. This would make the educa-tion system more efficient. There has been more participatory managementand democratic decentralization in business management in recent years.The same principles could be applied to public educational administration.
Greater decentralization would certainly bring the expertise of lower-level administrators into the decision-making process in a way that ahighly centralized administration would not permit. Effects on planning,quality of information, adaptability of broad policies to local circumstances,and, ultimately, on program implementation would be beneficial. But itshould be noted that the motivational effects of increased decentralizationare greatest when information on program performance and administrativesuccess is reliable, and where an effective system of rewards for efficiencyand effectiveness operates successfully.
SUMMARY
Neither extreme of centralization or decentralization is likely to workin practical situations. Mixtures of management by both directives andincentives will probably work best. The key factor is information onprogram performance and efficiency that would permit incentive-basedmanagement institutions. This in turn calls for development of clear goals,new instruments for measuring performance, and a high level of researchand information-gathering. These factors are also necessary for soundplanning and program budgeting. There are some indications that suchdevelopments will occur in time, but rapid changes are unlikely.
Even if the conditions for successful decentralization exist, there aresome cases in which centralization leads to greater efficiency than decen-tralization, such as in programs with economies of scale, in nationalstrategic planning, in the establishment of national standards of quality,and in the transferring of funds to achieve interregional equity.
But in other situations, the delegation of authority offers more im-portant advantages. Among these are shortened lines of communication,faster response, greater sensitivity to particular local problems, importantchanges in administrators' attitudes and motivation, greater freedom toexperiment and innovate, and closer control and supervision of programimplementation.
The educational systems of many countries operate under administra-tive arrangements that have not changed in accordance with changingcircumstances. Better information, better management techniques, and the
276
284
availability of more able junior administrators might facilitate decentraliza-tion. Greater economies of scale might be achieved by performing someactivities centrally that were once delegated to local authorities. The "best"administrative arrangement must be determined by particular local cir-
cumstances.This discussion has attempted to avoid prescribing a general pattern.
But it is hoped that it has indicated a basis on which to re-examine exist-ing administrative patterns. Changes in administrative organization cansignificantly affect the efficiency with which scarce resources are used, thesuccess of plan implementation, the equitable distribution of educationalservices, and the "environment" for educational innovation and change.These factors, in turn, have an important effect upon educational resourceneeds, and the benefits that derive from educational investments.
A RECENT CASE OF DECENTRALIZATION
A new mode of financing education has recently been instituted inYugoslavia. This plan decentralizes financing so that post-primary educa-tion can be better adapted to the needs of local and regional communities.The plan is intended to re-orient educational institutions toward a decen-tralized and self-regulating system of financing.
Principles of the Plan
This financial plan is based on the following principles, enunciatedin the law.
First, because education is one of the fundamental forces influencingproduction, it should be closely related to economic development.
Second, educational policy should be pianned for efficient use ofeducational resources. Conversely, a realistic evaluation of current re-
sources and a projection of future availability should influence policyplanning.
Third, locally oriented decision-making should foster self-managementand self-maintenance of educational systems. Such a decentralization ofeducational authority and implementation will help realize the first twoprinciples.
The orientation and implementation of the financing plan was devel-
oped from these principles.
Organizations that Finance Education
Education is financed within each Yugoslavian republic (similar to
277
285
provinces) through a series of four organizations: the worker associations;the educational associations; the republic associations; and the socio-political associations.
The Worker Associations All workers are organized by categories ofemployment. They form associations concerned with training futureworkers in their field. These worker associations are empowered to estab-lish the areas of educational need, formulate policy, set aside funds, andevaluate results. These worker associations are responsible for collectingthe majority of resources used for education, mostly in the form of taxes.
Educational Associations These associations administer the financingsystem. One 'educational association formed in each county within a
republic is composed of representatives from each of the worker associa-tions. Their administrative powers are left to the discretion of the workerassociations which chose to give up these powers when creating the countyeducational association. Through the worker representatives, these asso-
ciations determine how resources will be spent, and they administer thosefunds.
Significantly, an educational association determines what educationalprograms are needed in the county. Technically, they finance programs,not institutions. They contract with educational institutions That agree toprovide a certain program at a given per-pupil price. These contractsestablish long-term arrangements. Certain aspects are fixed in the con-tracts, such as categories and volume of educational activity; escalation ofcosts and mode of payment; other rights and obligations; and the percent-age of funds for physical and curriculum improvements and for expandededucational services.
The educational association integrates all social factions interested ineducation. Thus, it can influence the direction of specific educational pro-grams and, at the same time, coordinate an overall educational policywithin its jurisdiction.
Republic Associations These associations were originally establishedtemporarily as transitional committees to institute the new financial plan.There is one association for each republic. The republic associations arecomposed of representatives from worker associations, elected from theeducational associations. Republic associations influence the general di-rection of educational activity and also influence the allocation of resourcesfrom governmental budgets.
More specifically, they are concerned with the finances of universities,scientific research at these universities, and adult and special education.
278
2 8 5
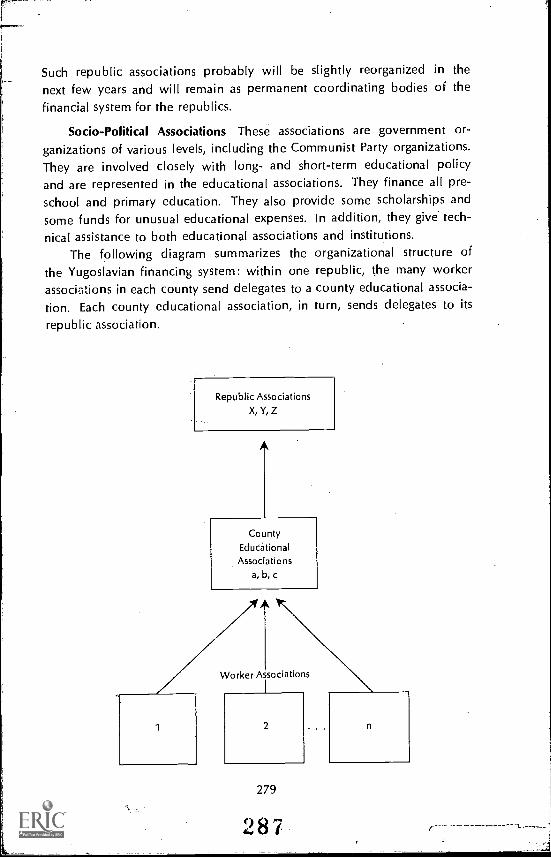
Such republic associations probably will be slightly reorganized in thenext few years and will remain as permanent coordinating bodies of thefinancial system for the republics.
Socio-Political Associations These associations are government or-ganizations of various levels, including the Communist Party organizations.They are involved closely with long- and short-term educational policyand are represented in the educational associations. They finance all pre-school and primary education. They also provide some scholarships andsome funds for unusual educational expenses. In addition, they give tech-
nical assistance to both educational associations and institutions.The following diagram summarizes the organizational structure of
the Yugoslavian financing system: within one republic, the many workerassociations in each county send delegates to a county educational associa-
tion. Each county educational association, in turn, sends delegates to its
republic association.
Republic AssociationsX, Y, Z
CountyEducational
Associationsa, b, c
A
Worker Associations
2
279
287
Resources for Educational Financing in Yugoslavia
Resources are collected by the worker associations. They are usedto fund educational programs of particular interest to the worker associa-tion, as well as some common programs designated by the county educa-tional assocation. Some funds collected may be set aside for investmentin education at a later date. The resources remain within each republicand, usually, within each county. There is neither a mandate nor anyeffort among counties to equalize their funds. The poor counties receivefinancial assistance directly from the government of the republic theybelong to.
Funds in this financial plan come from two basic sources: 70 per centcomes from a tax on personal income, and ten per cent is derived from atax on "transport." The remaining 20 per cent comes from other sources,including contributions from agricultural organizations, other socio-politicalorganizations, and from individual citizens. A few worker associations alsocontribute additional funds to build technical schools related to their work.Some citizens contribute funds directly to schools, rather than to educationalassociations. The amount of the revenue used to meet the operating costsof educational institutions is 94 per cent. Administrative costs of the educa-tional associations require five per cent of the resources. The remainingone per cent is invested. Educational associations allocate funds to educa-tional institutions on a per-pupil basis rather than on the basis of totalcosts of a curriculum. Allocation is essentially made on a .quantitativerather than qualitative basis.
Advantages and Disadvantages of the System
The main advantage of the Yugoslavian system of educational financeis its potential to decentralize both resources and decision-making. Workershave a potentially greater say about the nature and direction of the trainingfor their work, in particular, and the nature of education, in general, thanever before. This comes about through their tighter control of resources,matriculation policy, and curriculum content. As the first of the plan'sbasic principles indicates, resources are closely allied to communal needsand goals. But this advantage also results in a corresponding disadvantage.Decentralized activity and centralized long-term planning are basically in-compatible. Decentralization does not facilitate cooperation beyond verylimited boundaries. Educational problems are viewed from a local per-spective, not from a republic or national one. The decentralized focus alsomakes transferring funds from one educational area to another difficult,
280
288L
and transfer of funds between counties or republics impossible. Therefore,the advantage of a close link between resources and needs is easily negatedwhen needs beyond the local level become legitimate. Local control can
be both advantageous and disadvantageous, depending upon the goals.Another potential disadvantage of this Yugoslavian plan is the feasi-
bility of adequately representing all interest groups. The educational as-sociations may become too unwieldy to efficiently administer an educa-tional system. Other problems may develop when one faction dominatesthe others so much that some legitimate educational needs are unjustlysubordinated.
The Yugoslavian financial plan for education is still in its initial stages.In a few years, a thorough study will be necessary to evaluate in depth itsstrengths and weaknesses.
281
289
CHAPTER XXI
Educational Contracting
EDUCATION has been contracted for sincevancient times. Then, as now,a contractoften a written onecould learly set forth the learning
procedure and its goal: the master would agree to train a student inprescribed skills for a fixed fee. But there was no recourse when attainmentwas low; rarely did such contracts promise money back if goals were notachieved.
Since the second half of the 19th century, a new element of protectionhas been introduced in public education: the performance contract wherepayment depends upon results.
A BRIEF HISTORY
Education contracts existed in ancient Egypt, Babylon, and Greece. Forapprentice weavers, millers, baker,' stonecutters, cobblers and carpenters,the contract specified the length of service and fees. The study of medicineand law were also contracted for in a master-student relationship, as wassculpting and even flute playing.
Medieval apprenticeship contracts for merchant, trade, and craftguilds specified lengths of service and/or fees due in return for the skillsattained, in the slow progress from apprentice to journeyman to master.
In Elizabethan England, private and charitable apprenticeship agree:ments were common. Parishes were required to provide education for thepoor through apprenticeship programs.
In Victorian England, insufficient school places; an inadequatemonitorial system; the gradual prohibiting of child work (under ten) dur-ing school hours; demands for visible demonstration of value received' formoney spent; and general alarm at increased grant costsall led to a systemof payment by results.
Robert Lowe's "Revised Code of 1862" embodied the principle ofpayment by results. It decentralized treasury power and made the educa-tional system serve the nationindependent of the political and religiousideologies of the Whigs and Tories.
282
299
Standard tests classified children, and minutely detailed work sched-ules were provided for each level. Grants were paid to school managersand were determined by attendance and results on the annual exams.Grants could be withheld if the inspectors were dissatisfied with the school'sphysical condition or if teachers lacked certification.
This system did provide efficient and less expensive education inVictorian England. But it was discarded before the turn of the centurybecause its learning was mechanical and rote, and it neglected the verybright and the very slow childrenteaching was geared only for successon examinations. Teacher-inspector relationships were also disruptive tolearning. This system did prove, however, that performance standards canbe quickly raised if the goals were limited to only the mastery of a highlystructured content, especially one that tended to be examination oriented.
In America following Frederick Taylor's principles of efficiency andscientific management, his disciples criticized the American schools in1910 for their waste, losses, and inferior graduates. A business-conscioussociety pressured educators to experiment with standardized tests andefficiency ratings.
Taylor, himself, had made no claims of originality.for his shop-man-agement principles of workmen's tasks, which were prescribed in a definitetime with measured progress and accompanying satisfaction. Rather, he
spoke of those good results from his schoolboy days when the teacher setup clear-cut tasks for systematic progress.
The occasional dissenters against "shop-management" were ignored.The time for humanistic values, the arts, depth of scholarship, and mean-ingful interactions between pupils and teachers was yet to come.
PERFORMANCE CONTRACTING
Today basic educational philosophy and structure are being ques-tioned. Social, political, and economic issues, and demands for innovation,choice, efficiency, and accountability of results have intensified the searchfor new educational alternatives. Performance contracting is such an alter-native. It contains a basic control factoraccountability. This will be dis-cus3ed along with the scope of performance contracting, types of con-tractingexternal and internaland a sequential model of a performancecontract.
The Agreement The contractor agrees to improve student performancelevels in specified basic skills by set amounts; or, to achieve other specifiedgoals. He is paid according to his success in bringing student performance
283
291
up to pre-established levels. If he succeeds, he makes a profit; if he fails,he is not paid or is paid less. Within the guidelines of the school board orother educational authority, the contractor may use whatever instructionalequipment, techniques, or incentive systems he feels will work.
The nature of the agreement may vary widely in terms of proposalbidding (sole-source or competitive); sources of funds; procurement ofmanagerial support; and the schedule of payment.
The Basic Control Factor: Accountability All performance contractsinvolve an independent evaluafion to measure the results and paymentscontingent upon those results. A performance contract holds the education-al contractor accountable for results; it is awarded after bids and includeswarranties, penalties, and incentives; it requires that educational planners ____
quantify their goals and utilize such proven educational engineering tech-niques as system analysis and management by objectives.
The independent audit of resultsusually by a local, independenteducational audit organizationallows taxpayers and their representativesto judge the educational yield of a given appropriation.
Scope of Performance Contracts At present, educational performancecontracts are mostly limited to compensatory skill achievement programsin reading and arithmetic. These programs overcome differences in thestarting points of children from different social groups. They are intensiveand supportive, helping those children who perform poorly in normalclassroom work.
The potential for performance contracting beyond remedial educationshould be studied. Achievement scores may not relate directly to skillsneeded for ordinary schoolwork. Nor do they predict future studentachievementespecially, that of students motivated by an innovativecurriculum with wider choices based on individual needs. With a suffi-ciently high achievementat a rate of return that is equal to or betterthan conventional instructionperformance contracting could offer schoolsgreater flexibility and adaptability.
"Open schools" where outside firms are contracted to teach for aspecified payment, based on results, might also include released time forclinic or learning-center attendance outside the school. This would in-crease parental choices and competition between school systems andoutside contractors,
External and Internal Performance Contracting In an external perfor-mance contract, a private contractor enters into an agreement with a
284
292
school or school board to increase student achievement through the useof equipment and personnel brought into the system.
The internal performance contract is similar, but teachers replace theprivate contractor. They submit bidshandled by their teacher organiza-tionsto the board of education as subcontractors for the duration of theprograms.
A Sequential Model of a Performance Contract The local educationagency receives venture or development capital and hires a management-
support group to consult in drafting a request for proposals. This requestspecifies goals, services, money to be invested, penalties, observable con-straints, acceptable standards, and related matters.
A pre-bidding conference is held to exchange ideas and fully partic-ularize the request. The revised request is issued, bids are entertained andreviewed, and the performance contract is negotiated with the successfulbidder. After the performance contract is signed, an independent-educa-tional-accomplishment-audit group is hired to monitor contract executionand certify results to the local educational agency.
The program becomes operational and after a specified time andevaluation, the local educational authority will end, renew, "turn-key," orincorporate the program into the 'school's curriculum.
Recent Experience with Educational Contracting
Most models presently in use specify payments for results in dollar-defined bonuses and penalties. A testing audit is done by an agency other
than the performance contractor.Some of the key differences between various models center on per-
sonnel (comprising either an external private contractor, a learning center,or an internal staff already employed); pay formulas which include thedollar amount per child per grade advance; average increments and payin relation to time spent; and the contract's duration and mechanism forre-negotiation or termination.
Other differences include: measuring methods; reading or mathachievement scores; ways in which students are motivatedfree time,tokens, prizes, etc.and the basis on which students are measuredtheentire school, dropouts, disadvantaged students or those tested belowgrade equivalents.
Some Difficulties Encountered Thus Far The innovative approach ofperformance contracting programs has received national attention but thestudies so far have indicated some basic difficulties.
285
293
Evaluations found that these programs did not accelerate achievementamong the disadvantaged, regardless of the particular form, site, or thequality of the pupils. Evaluations also showed that the contracting programstended to emphasize gains in scores on standardized achievement tests.The programs did introduce curriculum changes and concentrate on in-dividual instruction, but students did not improve markedly. The costswere higher than conventional instruction but about the same as compen-satory programs.
Problems Common to All Types of Performance Contracts
Any new approach will raise problems. The overall existing structuresdo not have the flexibility of the small programs, which performance con-tracting introduces into the schools. The basic problems caused by differ-ences in approach center on three areas.
Problems in Testing Test scores have always been unreliable. Thephysical environment, the timing, instructions, and the student's attitudeall influence results. Specific achievement tests focus on particular typesof problems; conceptualizing and synthesizing are more difficult to test.Criterion-referenced tests measure specific competence but not the abilityto learn; as a result they are poor indicators of future school achievement.In general, they measure non-cognitive results sporadically, if at all.
Overall, the use of standardized testing in performance contract pro-grams involves an inherent testing weakness: long-term retention is ignoredand short-term learning is the basis for contract reimbursement.
Problems in Funding Central Government funds are the main sourcefor educational performance contracts today. If poor or negative resultsdry up these sources, a local school district may not be willing or able tofund its own performance contract. In needy areas, state financing mightreplace federal support. Private learning centers might also be operated,supported by parents and subject to their choices for various skill achieve-ment programs.
A Critical Analysis of Performance Contracts
The performance contract has a wide range of possibilities. Aware-ness of its flexibilities will permit an analysis of the basic advantages anddisadvantages common to all educational performance contracts.
Advantages The strong points of performance contracting include:precise identification and sequencing of needs and goals; greater efficiency
286
294
in determination of class size and in reduction of lost class time for slowstudents requiring individualized instruction; and innovation in teachingtechniques to help busyand especially inexperiencedteachers, super-vised by trained personnel.
Performance contracting also provides: financial incentive for teachersto excel, since compensation is based on quality of service, not hollowcredentials; opportunity for applying business management skills to savetaxpayers' money through open bidding and more efficient operation;opportunity for experimentation to explore curriculum innovation with lowcosts and low political and social risks; and independent evaluation as acontrol factor to make the performance contractors accountable for results.
The most important consideration should be the benefit gained bythe child. The tailored, individualized instruction based on diagnosedneeds captures the lost, the lagging, and the discouraged child. He can
compete only with himself. He works with proper guidance and at a ratethat is not frustrating. He is actively involved in learning and is aware ofprogress that is being measured by clear and attairiable goals. He becomes
a happier child in a less threatening situation.
Disadvantages The weaknesses of educational performance contract-ing include manipulation of the child to insure higher test performancesand higher profits, and total reliance on tests that measure only a narrowsegment of total learning objectives; thus disregarding attainments in the
social, psychological, and civic domain. There are also implementationdifficulties which occur because of inadequate training programs; use ofunqualified personnel to reduce overhead costs; and the reluctance ofcontractors to invest in or commit various resources because of the short-
term duration of the contract and its uncertainty of renewal.Other weaknesses include: relocation of personnel because of new
programs, with a resulting loss of continuity; modification of decisions ondistribution of school resources and on hiring and firing teachers, as wellas on selecting educational materials; and the violation of previouslynegotiated contracts by enforced transfers, changed pupil-teacher ratios,merit increases, or pay losses where experienced staffs risk low remunera-tion for low performance results.
There are other disadvantages that become evident to the child, theschool, and the performance contractor. One of the most significant ofthese is that the child may be encouraged by the program to expectmaterial rewards. In the school, the division of responsibility becomesconfused. It is not always clear who is in authoritythe principal or thelearning contractor. Sometimes, contract teachers and regular teachers
287
2
work at cross-purposes or are regarded differently by the children. The"original rapport" and "good will" do not always resolve such administrativequestions over an extended period.
The contractor may be forced to enter higher bids because of ex-tremely heavy penalty clauses. The need for starting simultaneous projectsmay decrease his supply capacity, or both decrease competition and raisebids. Contractors whose programs use learning systems may shift theiremphasis to straight hardware sales or consulting rather than follow throughin implementing the overall change needed.
Summary Discussion
The performance contract precisely defines the objectives and mea-sures the goals of new programs. These draw on ideas, talent, and tech-nology from beyond a particular school system. They can bring the bestnew ideas into operation within the traditional school system, with limitedrisks. The performance contract (which is a legal document, either withprivate companies, or, internally, with existing personnel) prescribes boththe student achievement and the payment for attaining these goals. Aboveall, a performance contract guarantees what students will actually achieve.
The most serious dangers of performance contracting involve the child.Scientific management that increases skills must not also inhibit studentcreativity and initiative. The sense of individual dignity and a respect fordemocratic values must be preserved. Children are not factory productswhose quality can be sacrificed for efficiency and economy. Scientificmanagement that makes the contractor accountable for results shouldadopt business values efficiently, but it must not dehumanize schools.
USES OF PERFORMANCE CONTRACTING IN DEVELOPING COUNTRIES
Educational performance contracting may be useful in developingcountrieswhen adapted to local conditions. Contracting with privatefirms to educate children in elementary and secondary schoolsas in theAmerican programs discussed hereis unlikely. The objections to thistype of contracting raised in the United States would be even strongerin developing countries. Inability of private firms to undertake sizableprograms in schools, and difficulty in identifying outputs and in evaluatingprograms will be much greater obstacles in developing countries. But,
educational contracting may be useful in two basic ways.
Internal Contracting When teachers replace the private contractor, themonetary rewards for students achieying higher proficiency levels go to
288
296
the teachers as a group. In developing countries, education programs areadversely affected by a compensation system that stifles teacher motivationand by an inertia within the system that opposes any change. Internal
contracting could provide an incentive to motivate the teachers to adopt
change. The changes in curriculum and staff needed to achieve new and
higher goals need not be seen as an added burden. Instead, these changes
could be welcomed as ways to help teachers get a bonus.The use of internal contracts would also impose discipline on the
teachers in the group. This self-discipline is very much needed to achievehigher educational goals because the results of one educational level, orsingle year, depend on the attainment reached during the previous level
or year.
Educational Contracting for Specific Training A government could con-tract with a private firm to train persons for a specific job. The goal could
be either gainful employment in the particular occupation, or passingentrance examinations required by licensing and hiring boards, unions, etc.Such contracts can produce a minimum level of income for the firm during
the training period, which is then supplemented with large bonuses whensatisfactory outputs are attained. This type of contracting could becomea particularly useful tool when a developing country wants to have training
for a number of specialized occupations done by foreign firms. Most con-tracts in the international training field today are of the fixed input typesuch as payments for a given number and type of inputs. A shift to theperformance and output evaluation type may very positively affect theoutcomes, producing better programs and better students.
A similar arrangement could be used to train technicians and specialistsin foreign countries. Today, when nationals are educated abroad, there is
no way for the government to insure the quality of its trainees. If an
educational contract is agreed upon by the government and foreigninstitutions whereby the institutions are paid according to results, these
institutions will take more care in selecting candidates and in providingsuitable curricula and teachers.
Although at the present time there are no performance contracts inoperation in developing nations, some special types of performance con-tracting should be given a chance. Pilot projects could easily be set up tosee if these types of education and training with explicit accountability are
feasible.
289
29?
CHAPTER XXII
Financial Distribution Formulasand Increased Efficiency
WHEN financial authorities have limited operational control over author-ities who provide education, the methods of distributing funds can
be an important factor in increasing the efficiency of an educational system.This chapter describes the most commonly used formulas for fund
distribution. It also suggests new ones for equalizing expenditures pereducational unit, equalizing educational processes, equalizing educationaloutputs, increasing participation rates, inducing curriculum changes, andfor reducing the number of dropouts.
Although these proposed new formulas are not presently in use, theymay serve as guidelines to help implement educational policy.
BASES FOR ALLOCATING FUNDS
Funds are generally allocated on the basis of fixed or variable amountsper educational unit. The educational units discussed below are the stu-dent; the teacher; and the class, or student place.
Allocating Funds on a Per Student Basis The most commonly usedmethod for allocating funds is based on some way of calculating the studentpopulation, and it is generally based on the number of students enrolledor the number attending.
The number of students enrolled in an individual school may becounted at the beginning of a school year, at mid-year, or even later. Thismethod for reporting students is very often used because of its administra-tive ease. But it is not a reliable method to use at the beginning of a termbecause it gives an inflated picture of actual enrollments, since it does notaccount for dropout and absentee rates.
A modificalion of this plan is to calculate the average daily member-ship. The student enrollment is counted daily during a designated reportingperiod. The count is then divided by the total number of school days duringthat period, which is generally a regular school term.
In the average daily attendance method, the total days of student
290
298

attendance at a given school during a given reporting period is divided bythe number of actual school days. The reporting period may be a full
regular school year, or selected weeks or days during a term.This method is preferable to the previous ones because it gives school
officials considerable incentive to maximize attendance, and thereby reducethe dropout rate: poor attendance may be improved by solving transporta-tion problems or by having teachers give better attention to student prob-lems. Students who are encouraged to attend regularly lessen the probabil-ity of their dropping out or repeating grades. There is also little incentiveto overcrowd classes, if administrators realize that overcrowding contributes
to poor attendance.In all funding based on the number of student units, local authorities
may try raising student-teacher ratios above reasonable pedagogical limits
to increase local recurrent budgets. Funding authorities should, therefore,
establish maximums for student-teacher ratios.
Allocating Funds on a Per Teacher Basis Because teachers' salaries aregenerally 60 to 95 per cent of the recurrent costs for primary and secondaryeducation in most countries, educational revenues and/or central aid areoften allocated to local school spending authorities on a per teacher basis.This method is either an alternative to the student unit, or a supplementto it.
Teachers are nearly always classified according to levelprimary; sec-ondary, lower and upper; vocational or technical; and higher education.Secondary and higher education teachers may be further classified bysubjects, such as science, math, language, and social science. Teachers
may also be classified according to their level of qualification, and/orwhether they teach in rural or urban schools.
Allocating a major portion of recurrent expenditures on a per teacherbasis may cause problems in student-teacher ratios. If the funding author-
ities do not establish minimums for student-teacher ratios at various levels,
such local authorities as school directors or area administrators may hire
too many teachers so they can fatten their local budgets. This can be
avoided by putting a minimum on student-teacher ratios.
Allocating Funds on a Per Class or Per Student Place Basis Capital costs
in education are often expressed as an average cost of building a primary,
secondary, or vocational school classroom. Funds for capital expenditures
are thus often allocated on the basis of a certain amount per class. Class-
rooms are sometimes differentiated by the school location (urban, rural,
or other regional classifications) and by level and type. The size of an
291
299
average class is generally implied in this unit: some 30-40 students forprimary, 20-30 for secondary, etc.
The disadvantage of using a standard classroom unit for allocatingcapital revenues comes from its tendency to force local school authoritiesand architectural planners to adhere to traditional building designself-contained classrooms of similar size and standard arrangements for hallways,offices, and plumbing.
When capital expenditures are allocated according to a standard cap-ital cost per student place (supplemented by appropriate local adjustmentfactors), the number of students in various categoriessuch as rural primarystudents or secondary boarding studentscan be used to determine overallfunding requirements over a specified time period in a particular region orarea. Capital funding based on a standard cost per student place couldfoster development of various kinds of "combination schools," such asprimary-vocational or secondary-general plus technical and/or vocational,and comprehensive schools.
Limits to funding based on capital costs per student place could dis-courage the building of uneconomical and inefficient small schools. But
these limits also frustrate local citizens' desires for village-level facilities,and thus cause political problems. In this case, Central Authorities wishingto discourage the proliferation of small schools could provide financial aidfor consolidated or regional schools and develop appropriate facilities fortransportation, meals, and boarding for students from sparsely populatedareas.
WAYS OF EQUALIZING AND FURTHERINGDESIRABLE EDUCATION GOALS
A variation in the amount of money allocated per educational unit canbe used to further different goals: equalizing expenditures per educationalunit, equalizing educational processes per educational unit, equalizing edu-cational outputs, increasing participation rates, inducing curriculum changes,and reducing the number of dropouts.
The variation in the amount of funds made available can be achievedby weighting the educational units, that is, the students, teachers, and stu-dent place. A weighting factor greater than one means that more financialresources will be allocated to that particular unit; weighting by a factorless than one means the opposite.
Equalizing Expenditures Per Educational Unit Financial authorities
should provide the same amount for every student in attendance, teacher,
292
3 t) 0
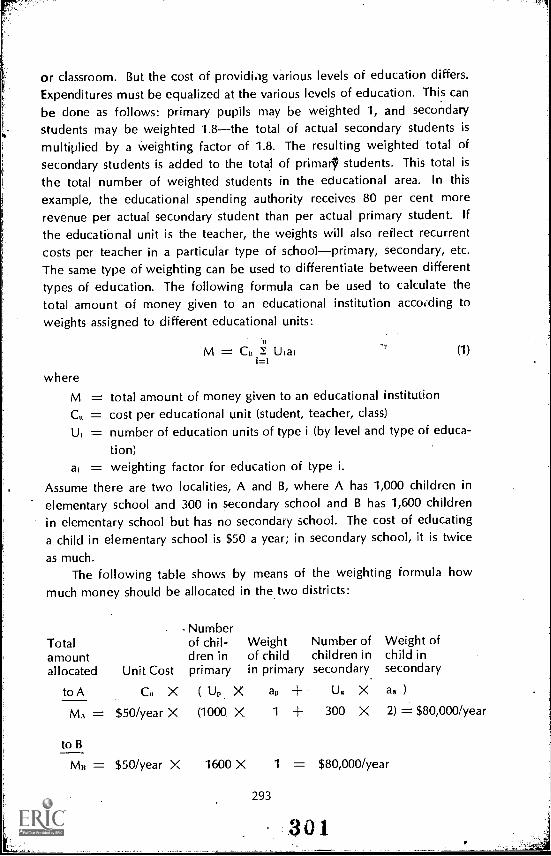
or classroom. But the cost of providiog various levels of education differs.
Expenditures must be equalized at the various levels of education. This canbe done as follows: primary pupils may be weighted 1, and secondarystudents may be weighted 1.8the total of actual secondary students ismultiplied by a weighting factor of 1.8. The resulting weighted total ofsecondary students is added to the total of primal! students. This total isthe total number of weighted students in the educational area. In thisexample, the educational spending authority receives 80 per cent morerevenue per actual secondary student than per actual primary student. If
the educational unit is the teacher, the weights will also reflect recurrentcosts per teacher in a particular type of schoolprimary, secondary, etc.The same type of weighting can be used to differentiate between differenttypes of education. The following formula can be used to calculate thetotal amount of money given to an educational institution according toweights assigned to different educational units:
M = U
i=i(1)
whereM = total amount of money given to an educational institutionC,, = cost per educational unit (student, teacher, class)
= number of education units of type i (by level and type of educa-
tion)a, = weighting factor for education of type i.
Assume there are two localities, A and B, where A has 1,000 children inelementary school and 300 in secondary school and B has 1,600 childrenin elementary school but has no secondary school. The cost of educatinga child in elementary school is $50 a year; in secondary school, it is twice
as much.The following table shows by means of the weighting formula how
much money should be allocated in the two districts:
Totalamountallocated
, Numberof chil- Weight Number ofdren in of child children in
Unit Cost primary in primary secondary
to A Cp X ( X ap
MA =
to B
$50/year X (1000 X 1
MB $50/year X 1600 X 1
293
+ Up X+ 300 X
Weight ofchild insecondary
)
2) = $80,000/year
= $80,000/year
301
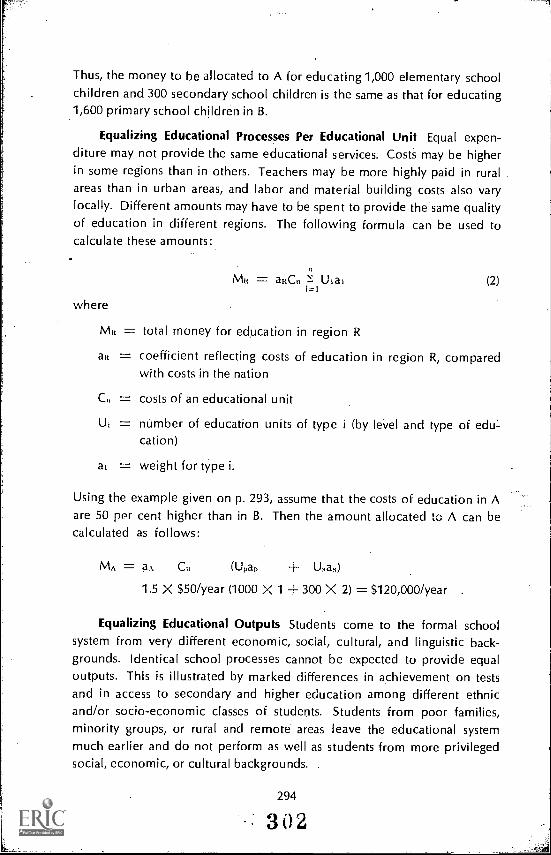
Thus, the money to be allocated to A for educating 1,000 elementary schoolchildren and 300 secondary school children is the same as that for educating1,600 primary school children in B.
Equalizing Educational Processes Per Educational Unit Equal expen-diture may not provide the same educational services. Costs may be higherin some regions than in others. Teachers may be more highly paid in ruralareas than in urban areas, and labor and material building costs also varylocally. Different amounts may have to be spent to provide the same qualityof education in different regions. The following formula can be used tocalculate these amounts:
it
MR = al(Cti Uiai (2)
where
MR = total money for education in region R
= coefficient reflecting costs of education in region R, comparedwith costs in the nation
Ct, = costs of an educational unit
U1 = number of education units of type i (by level and type of edu:cation)
at = weight for type i.
Using the example given on p. 293, assume that the costs of education in Aare 50 per cent higher than in B. Then the amount allocated to A can becalculated as follows:
MA = a. CI (UPar, Usas)
1.5 X $50/year (1000 X 1 300 X 2) = $120,000/year .
Equalizing Educational Outputs Students come to the formal schoolsystem from very different economic, social, cultural, and linguistic back-grounds. Identical school processes cannot be expected to provide equaloutputs. This is illustrated by marked differences in achievement on testsand in access to secondary and higher education among different ethnicand/or socio-economic classes of students. Students from poor families,minority groups, or rural and remote areas leave the educational systemmuch earlier and do not perform as well as students from more privilegedsocial, economic, or cultural backgrounds.
294
302
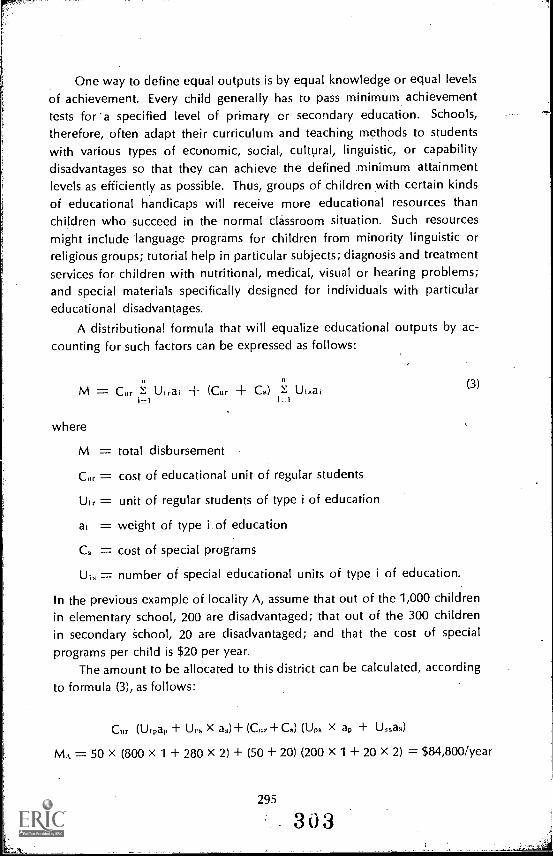
One way to define equal outputs is by equal knowledge or equal levelsof achievement. Every child generally has to pass minimum achievementtests fora specified level of primary or secondary education. Schools,
therefore, often adapt their curriculum and teaching methods to studentswith various types of economic, social, cultural, linguistic, or capabilitydisadvantages so that they can achieve the defined minimum attainmentlevels as efficiently as possible. Thus, groups of children with certain kindsof educational handicaps will receive more educational resources thanchildren who succeed in the normal classroom situation. Such resourcesmight include language programs for children from minority linguistic orreligious groups; tutorial help in particular subjects; diagnosis and treatmentservices for children with nutritional, medical, visual or hearing problems;and special materials specifically designed for individuals with particulareducational disadvantages.
A distributional formula that will equalize educational outputs by ac-counting for such factors can be expressed as follows:
M = Cur IS Utrat (Cur + C8) Ut.at (3)
where
M = total disbursement
Cur = cost of educational unit of regular students
Ut, = unit of regular students of type i of education
at = weight of type i of education
CS = cost of special programs
= number of special educational units of type i of education.
In the previous example of locality A, assume that out of the 1,000 childrenin elementary school, 200 are disadvantaged; that out of the 300 childrenin secondary school, 20 are disadvantaged; and that the cost of specialprograms per child is $20 per year.
The amount to be allocated to this district can be calculated, accordingto formula (3), as follows:
Cur (Urpap Urs X a.)+ (Cur + Cs) (Ups X ap Ussas)
MA 50 X (800x 1 + 280 X 2) + (50 + 20) (200 X 1 + 20 X 2) = $84,800/year
295
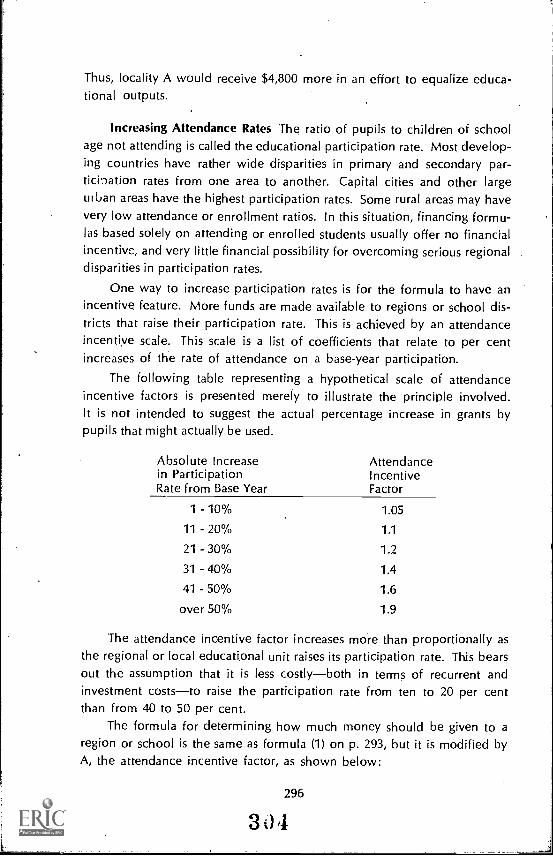
Thus, locality A would receive $4,800 more in an effort to equalize educa-tional outputs.
Increasing Attendance Rates The ratio of pupils to children of schoolage not attending is called the educational participation rate. Most develop-ing countries have rather wide disparities in primary and secondary par-ticipation rates from one area to another. Capital cities and other largeurban areas have the highest participation rates. Some rural areas may havevery low attendance or enrollment ratios. In this situation, financing formu-las based solely on attending or enrolled students usually offer no financialincentive, and very little financial possibility for overcoming serious regionaldisparities in participation rates.
One way to increase participation rates is for the formula to have anincentive feature. More funds are made available to regions or school dis-tricts that raise their participation rate. This is achieved by an attendanceincentive scale. This scale is a list of coefficients that relate to per centincreases of the rate of attendance on a base-year participation.
The following table representing a hypothetical scale of attendanceincentive factors is presented merely to illustrate the principle involved.It is not intended to suggest the actual percentage increase in grants bypupils that might actually be used.
Absolute Increase Attendancein Participation IncentiveRate from Base Year Factor
1 - 10% 1.05
11 -20% 1.1
21 - 30% 1.2
31 -40% 1.4
41 -50% 1.6
over 50% 1.9
The attendance incentive factor increases more than proportionally asthe regional or local educational unit raises its participation rate. This bearsout the assumption that it is less costlyboth in terms of recurrent andinvestment coststo raise the participation rate from ten to 20 per centthan from 40 to 50 per cent.
The formula for determining how much money should be given to aregion or school is the same as formula (1) on p. 293, but it is modified byA, the attendance incentive factor, as shown below:
296
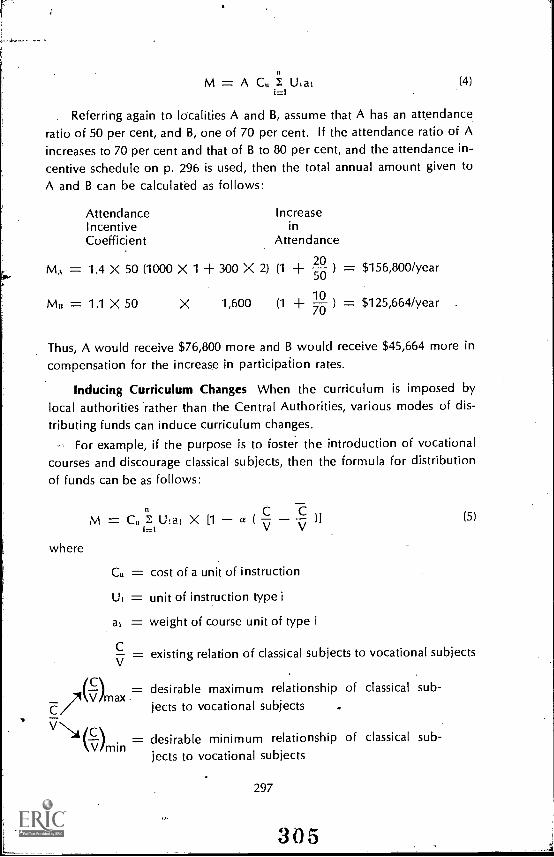
M A C.i=1
(4)
Referring again to localities A and 8, assume that A has an attendanceratio of 50 per cent, and B, one of 70 per cent. If the attendance ratio of Aincreases to 70 per cent and that of B to 80 per cent, and the attendance in-centive schedule on p. 296 is used, then the total annual amount given toA and B can be calculated as follows:
Attendance IncreaseIncentive inCoefficient Attendance
20M, = 1.4 X 50 (1000 X 1 + 300 X 2) (1 + 50) $156,800/year
Mu10= 1.1 X 50 X 1,600 (1 + ) = $125,664/year70
Thus, A would receive $76,800 more and B would receive $45,664 more incompensation for the increase in participation rates.
Inducing Curriculum Changes When the curriculum is imposed bylocal authorities rather than the Central Authorities, various modes of dis-tributing funds can induce curriculum changes.
For example, if the purpose is to foster the introduction of vocationalcourses and discourage classical subjects, then the formula for distribution
of funds can be as follows:
where
M = Cu I U: a: X aC
i=1 V V(5)
Cu = cost of a unit of instruction
Lit = unit of instruction type i
ai = weight of course unit of type i
C = existing relation of classical subjects to vocational subjectsV
(C\ = desirable maximum relationship of classical sub-_
j21V/max .
C/ ects to vocational subjects .. VN
'(C-0min
= desirable minimum relationship of classical sub-jects to vocational subjects
297
305
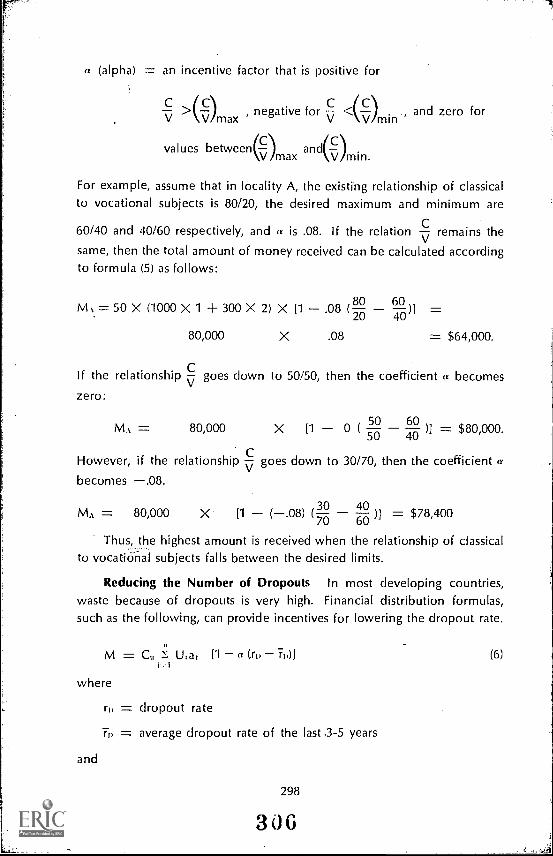
a (alpha) = an incentive factor that is positive for
C C(v)max, negative for C <(V/min
values between(C)max
and(v)min.\-/
, and zero for
For example, assume that in locality A, the existing relationship of classicalto vocational subjects is 80/20, the desired maximum and minimum are
60/40 and 40/60 respectively, and a is .08. If the relation v remains thesame, then the total amount of money received can be calculated accordingto formula (5) as follows:
0 60tvl% = 50 X (1000 X 1 + 300 X 2) X [1 .08 (8-20 40 )] =80,000 X .08 = $64,000.
If the relationshipV
goes down to 50/50, then the coefficient a becomes
zero:
50 60M.% = 80,000 X ,,50 40 1' = $80,000.
However, if the relationshipV
goes down to 30/70, then the coefficient a
becomes .08.
40MA = 80,000 X [1 (.08) (-3°70 60
)1 = $78,400
Thus, the highest amount is received when the relationship of classicalto vocational subjects falls between the desired limits.
Reducing the Number of Dropouts In most developing countries,waste because of dropouts is very high. Financial distribution formulas,such as the following, can provide incentives for lowering the dropout rate.
M = C,, Ual a (ri, 71)1 (6)
where
= dropout rate
rn = average dropout rate of the last .3-5 years
and
298
306
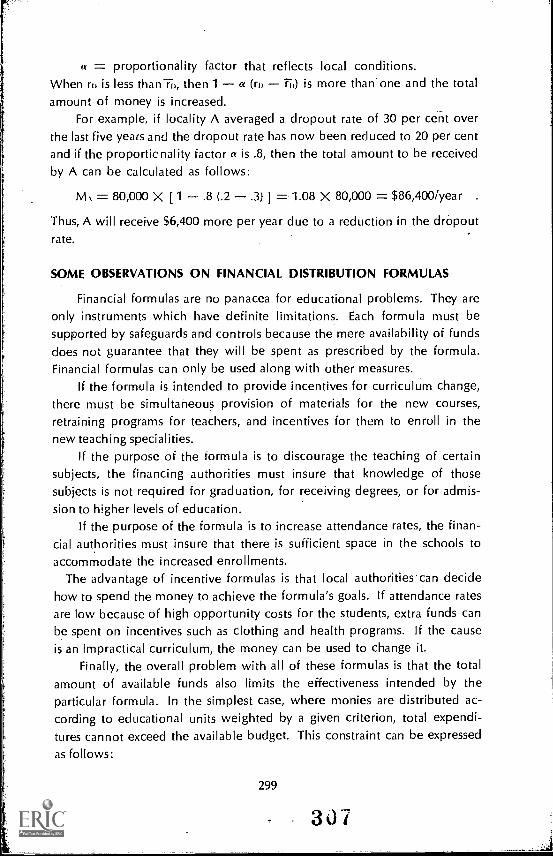
a = proportionality factor that reflects local conditions.When ru is less than-rl, then 1 a TD) is more than one and the totalamount of money is increased.
For example, if locality A averaged a dropout rate of 30 per cent overthe last five years and the dropout rate has now been reduced to 20 per centand if the proportionality factor a is .8, then the total amount to be receivedby A can be calculated as follows:
M = 80,000 X [ 1 .8 (.2 .3) ] = 1.08 X 80,000 = $86,400/year .
Thus, A will receive $6,400 more per year due to a reduction in the dropoutrate.
SOME OBSERVATIONS ON FINANCIAL DISTRIBUTION FORMULAS
Financial formulas are no panacea for educational problems. They areonly instruments which have definite limitations. Each formula must besupported by safeguards and controls because the mere availability of fundsdoes not guarantee that they will be spent as prescribed by the formula.Financial formulas can only be used along with other measures.
If the formula is intended to provide incentives for curriculum change,there must be simultaneous provision of materials for the new courses,retraining programs for teachers, and incentives for them to enroll in thenew teaching specialities.
If the purpose of the tormula is to discourage the teaching of certainsubjects, the financing authorities must insure that knowledge of thosesubjects is not required for graduation, for receiving degrees, or for admis-sion to higher levels of education.
If the purpose of the formula is to increase attendance rates, the finan-cial authorities must insure that there is sufficient space in the schools toaccommodate the increased enrollments.
The advantage of incentive formulas is that local authorities'can decidehow to spend the money to achieve the formula's goals. If attendance ratesare low because of high opportunity costs for the students, extra funds canbe spent on incentives such as clothing and health programs. If the causeis an impractical curriculum, the money can be used to change it.
Finally, the overall problem with all of these formulas is that the totalamount of available funds also limits the effectiveness intended by theparticular formula. In the simplest case, where monies are distributed ac-cording to educational units weighted by a given criterion, total expendi-tures cannot exceed the available budget. This constraint can be expressedas follows:
299
3 J
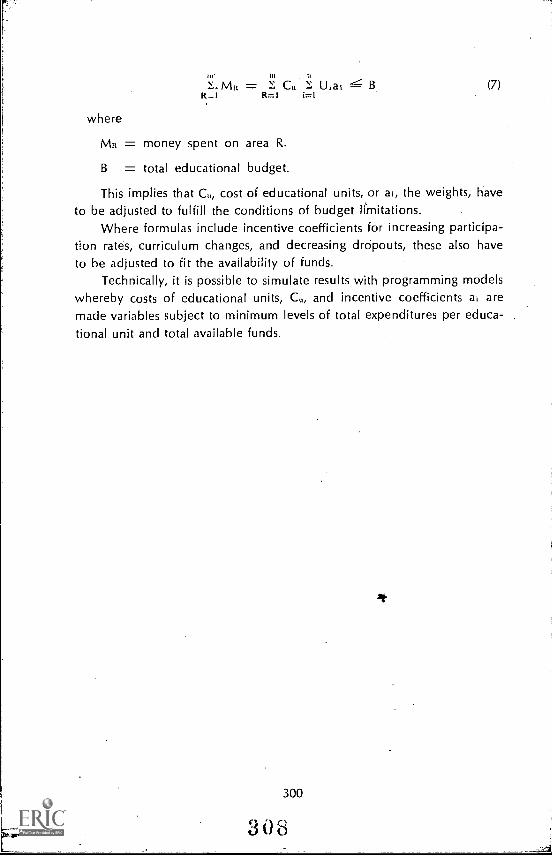
tviit = Uiai G BR=1 R=1 i=1
where
(7)
MR = money spent on area R.
B = total educational budget.
This implies that G, cost of educational units, or ai, the weights, haveto be adjusted to fulfill the conditions of budget limitations.
Where formulas include incentive coefficients for increasing participa-tion rates, curriculum changes, and decreasing drdpouts, these also haveto be adjusted to fit the availability of funds.
Technically, it is possible to simulate results with programming modelswhereby costs of educational units, Cu, and incentive coefficients ai aremade variables subject to minimum levels of total expenditures per educa-tional unit and total available funds.
300
3 0 8
CHAPTER XXIII
An Index for MeasuringEducational Expenditures
MEASURES that link educational expenditures to national income or togovernment budgets are based on the sources of funds rather than
on their use. The Index of Educational Funding presented in Chapter XIV
refers to the sources of fundsthe tax effort of the spender and thespender's willingness to budget for education. The Index of EducationalExpenditures (IEE) indicates how these resources are spent.
AN INDEX OF EDUCATIONAL EXPENDITURES
A nation's preferences for educational spending are influenced by thenation's preference for various types of education, and the costs per studentor graduate for these types of education.
For example, country A has a preference for elementary education,
and B for secondary education. Both countries have the same number ofchildren in the respective age groups, but per student costs for secondaryschool are much higher than per student costs in the elementary school.Under these conditions, country B will clearly have to make a larger finan-
cial effort to satisfy its preference.If both countries have the same costs per student and the same pref-
erence for levels of education, but for demographic reasons there is a larger
proportion of school-age children in country A, it will have to make a great-
er financial effort to satisfy its educational demand.
Derivation of the Index
Educational expenditures can be expressed as a function of cost perstudent and the number of students by level, as represented in the following
formula.
where
E = CsNI. +
301
3t,9
(1)

E = total expenditures
Co = costs per student in elementary c ot_ation
Cs = " secondary education
C1 = " higher education
N. = number of students in elementary education
N. = " secondary education
= " higher education
The number of students at each level can be expressed as the propor-tion of those enrolled in that level as a percentage of the total number ofpersons in the vespective age group, and the number of persons in the agegroup. These relationships can be expressed as follows:
No = n,.A0
N, = n,A.
Nu = nhAi,
where no =
where n, =
where
A,
Ns
A,
A1,
A, = number of people in the age cohort of elementary schooling
A = number of people in the age cohort of secondary schooling
Au = number of people in the age cohort of higher schooling
In turn,
A, = a,P where a, = A,
AsAs = aoP where ao =
AI, = ad' where al, =
P = total population.
Formula (1) can now be written as:
E = C,n,a,P ConsaoP ChnhahP (2)
Because educational effort is usually expressed s the ratio of educa-tional expenditures to a measure of national income, the ollowing equationcan be given:
Es = E = ConoY
ao C,n,a, Chnuah
302
310
(3)
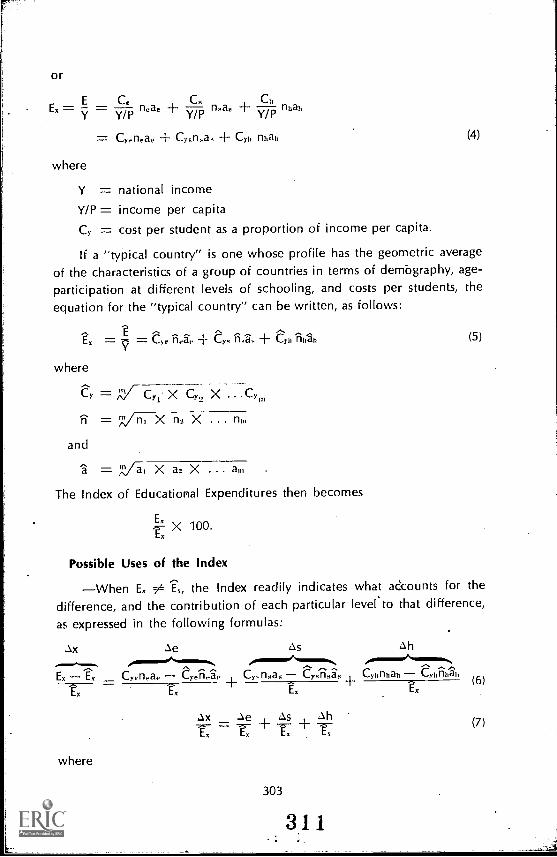
or
ExY
E Ce= = T nea,C .
r6as nban
= Cyeneae CyRnsas Cy,, nob
where
(4)
Y = national incomeY/P = income per capita
= cost per student as a proportion of income per capita.
If a "typical country" is one whose profile has the geometric averageof the characteristics of a group of countries in terms of demOgraphy, age-participation at different levels of schooling, and costs per students, theequation for the "typical country" can be written, as follows:
Ex
where
Cy
= = C, near Cy, ma. + C.n nhan
= fil, Cy, X Cy. X ... Cn,
= nilm X n2 X ... nin
and
a = Va, X a2 X ... an,The Index of Educational Expenditures then becomes
Er X100.tr
(5)
Possible Uses of the Index
When Er f the Index readily indicates what accounts for thedifference, and the contribution of each particular level'to that difference,
as expressed in the following formulas:
Ax Ae As Ah
Ex ix Cyeneae Celied-e Cy e nea ey.3.5; Chnhah eyharashE Ex Ex Ex(6)
where
303
311
(7)
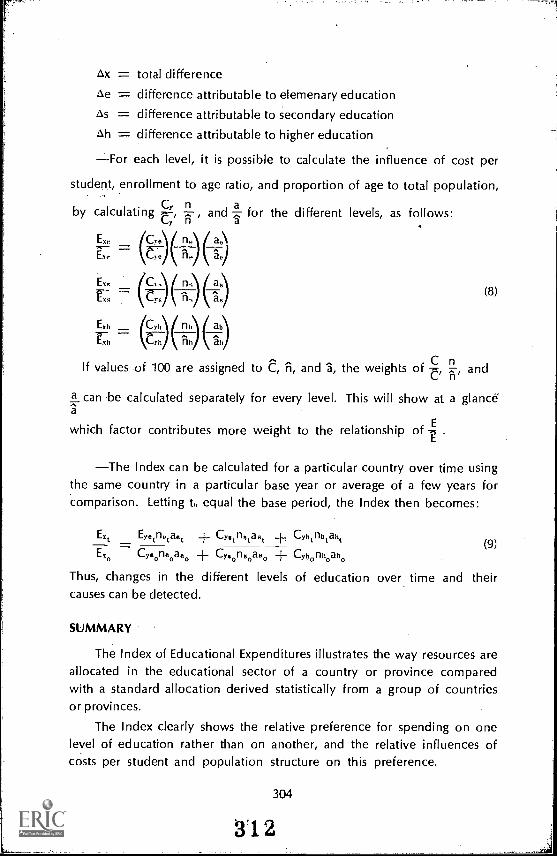
= total difference
oe = difference attributable to elemenary education
= difference attributable to secondary education
Ah = difference attributable to higher education
For each level, it is possible to calculate the influence of cost per
student, enrollment to age ratio, and proportion of age to total population,
nby calculating , and for the different levels, as follows:Cy,
a
Ext (Cey.
E: k 1)
E 7(K (C.) ( 1( a)K 7 -c-,7 FT. a,
Exh (Cy l) ni) ai
x; th
(8)
nIf values of 100 are assigned to C,C
1.,71and 1, the weights of -, and
a can be calculated separately for every level. This will show at a glancea
which factor contributes more weight to the relationship of .
The Index can be calculated for a particular country over time usingthe same country in a particular base year or average of a few years forcomparison. Letting t equal the base period, the Index then becomes:
Eyetnetae, Cyostas, Cyhtnhtah,
E,0 Cy.oneoaeo Cy.onsoaso Cyhonhoaho(9)
Thus, changes in the different levels of education over time and theircauses can be detected.
SUMMARY
The Index of Educational Expenditures illustrates the way resources areallocated in the educational sector of a country or province comparedwith a standard allocation derived statistically from a group of countriesor provinces.
The Index clearly shows the relative preference for spending on onelevel of education rather than on another, and the relative influences ofcosts per student and population structure on this preference.
304
3'1 2
Afterword
THE future development of education depends mostly on how different
sources of funds for educationold and newcan be found, and the
way these resources will be used.With a continuing reassessment of priorities in both developed and
developing countries, it is necessary to expand current knowledge in the
area of financing education.This book was prepared after surveying the considerable literature on
finance and economics of education, and after evaluating the most recentexperiences with educational change in these areas.
To clarify issues of financing education, this book began with a short
historical survey. The philosophies behind the issues of public versus
private education were discussed. The initial chapters were thought useful
in helping decision-makers more clearly perceive the beginnings of educa-
tional finance in their own country. This is especially true of those countries
that may have inherited or copied a colonial system, now unsuitable to
their changing social needs and political attitudes.But the task ahead cannot be met by merely studying the pastno
matter how recent. This book not only considered existing patterns but also
presented new theoretical approaches. Detailed arguments were given
for and against different approaches so that educational decision-makers
and administrators could themselves evaluate the usefulness of each ap-
proach in their particular situations.Considering this goal, the book reviewed the nature and effects of
different taxes being used or proposed for financing education: methods
for financing both private and public education at different.levels; special-
ized education, such as vocational training and recurrent education; the
financing of educational television and radio; and so on.
But all these varied methods will not produce much long-run success
unless the resources they raise are efficiently used. Increasing the efficiency
of educational programs depends upon all the components of a systemthe administrators, teachers, and students.
305
X13
The allocation of financial resources depends primarily on the de-cision-makers and administrators at all levels of the hierarchy. Theirefficiency increases when they know how to make correct decisions. There-fore, the basic tools of decision-making were systematically presented.Again, the advantages and disadvantages were pointed out.
Special attention was given to decision-making in a complex settingof large systems. Planning and program budgeting are essential for betteruse of existing and future resources, and for incorporating educationalprograms into the overall development program. designed to achievesociety's goals. Along with methods of evaluating outputs, planning andprogram budgeting provide useful instruments for designing future direc-tions.
Because methods of distributing funds deeply affect decision-makingby educationists, the social, economic, and political implications of differenttypes of fund distribution were analyzed.
These and many other aspects of the finance and efficiency of educa-tion were presented. The aim is to help decision-makers, in and out ofthe educational system, clarify the issues and provide guidelines for futureactions.
But such a comprehensive survey and inventory of existing methods,and even the presentation of some new methods developed in the courseof this survey, are not enough. Precise and specific knowledge in many ofthe areas investigated is still inadequate and inconclusive. There is stillmuch "ground-breaking" to be done. This is especially true in the areaof developing new resources for education. Bold new approaches areneeded if education is to meet its own goals, and those of rapidly changingsocieties in developing countries.
Where education is being viewed more and more as a social servicebecause it is influenced by many other social conditionshealth andnutrition, for examplenew ways of appropriating funds for educationwithin the framework of social service have to be explored.
One of the most significant areas where new forms and innovationsin education have occurred is in the private sector. In most countries,funding of education is relatively small, but it is an increasingly importantadded resource to public expenditures. New ways must be found to putprivate financing on a sound and continuing basis.
Historically, methods of financing education changed when the eco-nomic base used to finance education failed to expand with the demandfor education. Such changes in financing must be anticipated. New and
306
'314
'1
better methods for. forecasting financial resources for education must be
found.
A key concern of financing education involves the distribution of
burdens of financing and the equity of providing educational services.New methodologies have to be found to more efficiently and equitably
distribute educational benefits among the different regions and socialclasses.
More knowledge in these areas is certainly needed. But the area where
the need for more and better knowledge is greatest is that of making better
use of existing resources. Most important here is the need to improvedecision-making. Such improvement will occur only with better data tobase decisions on, and with the right type of data. A major weakness of
past educational programs has been the unsystematic generating of datafor decision-making. A systematic and selective generating of data at all
levels of the educational hierarchy is a critical need.
To make the right decisions, policymakers and administrators must
clearly know the educational system's outputs. They must also know how
to measure these outputs so that they can evaluate the costs and benefits
of different policies and programs. The goals themselves must be efficient
ones. The economic value of educational outputs has to be considered
within the greater framework of the country's overall planning and priorities.
To accomplish this, the workings of the labor market which thegraduates of the educational system will enter must be better understood.
Mechanisms for linking education to the world of work should be devel-
oped and utilized.
Decision-makers should also have more and better knowledge about
the cost-effectivenes of different types of training and learning. A precise
knowledge of the cost-effectiveness of different training alternatives will
allow a flexible and efficient choice.
Educationists should become aware of new instructional technologies,
as these are adaptable to local conditions. Technological advances have
been slower in education than in other sectors. If ways of increasing
technological progress are not found, no amount of financing can beadequate in the long run. Knowledge of the effects of new technologies
on educational outputs is inconclusive. In developing countries, more
evidence of their applicability and effectiveness is needed before instituting
large-scale programs using new technologies.
These new demands for increasing knowledge are by no means an
all-inclusive list. They merely map out broad areas for investigation in
307
315
developing countries. But each country will have to choose its own educa-tional research priorities based on its particular needs.
Knowledge is theoretical and is not enough for solving problems. Thesoundness of any theoretical program must be tested in specific situations.So the real challenge is for the decision-maker and the administrator.
This book will be useful in suggesting new approaches. But thesesuggestions will have to be tried out in the specific situations whichdecision-makers encounter in their own countries.
With a more flexible idea of program. possibilities and a more realisticviewpoint of the necessity of obtaining and efficiently using resources,decision-makers will be able to anticipate and solve more knowledgeablythe complex problems that education faces in the next decades.
But the real challenge is to make the ideas presented in this book a
part ofthe actual educational process. When these ideas are adapted andimplemented, providing education efficiently, equitably, and creatively willbecome more of a reality than a dream. Then, education will take its equalplace within the structure and priorities of the world's developing countries.
.308
IndexARV (see Annual rental value)Accountability (see Educational perfor-
mance contracting)Administration, educational
centralized vs, decentralized systems,268-277
decentralization of financing in Yu-goslavia, 277-281
government control of, 69-70interaction with planning, 245-247,
273-276Adult education (see Recurrent educa-
tion, Vocational education)Agricultural training (see Vocational train-
ing)Aid in kind, 53Aid to education (see Educational fi-
nance, External aid to education)Allocation of funds (see Finance, educa-
tional)Annual rental value (ARV), 32, 36-39Apprenticeship, 111, 115-117, 124-126,
282Attendance,
grants and allocations, 16, 290-291incentive formula, 296-297
Benefits of education (see Educationaloutputs)
Block release programs, 112, 116Borrowing (see External aid to education,
Student loan institutions)Broadcasting (see Educational broadcast-
ing)Budgets, educational, 244-245, 247-257Business corporations, 80CV (see Capital value)Capital costs, 201Capital equipment grants, 16, 292Capital expenditures, 72Capital value (CV), 32, 36-39Categorical grants, 52, 71-72, 74, 76, 84Centralization of administration (see Ad-
ministration, educational)Collectives, 81Colleges (see Education, higher)Commercial training (see Vocational edu-
cation)Consumption taxes (see Sales taxes)Contracting, educational (see Education-
al performance contracting)Controllable and uncontrollable costs,
202
Cooperative education, 112, 124-126Cooperative schools, 81, 144-148Correlation analysis, 224-227Cost-benefit analysis
use in economic evaluation of edu-cation, 213-215
use in increasing efficiency, 187-197Cost-effectiveness analysis
in data systems, 267use in measuring program efficiency,
197-200, 239Costs in education
cost-benefit analysis in, 187-189data on, 266-267definitions of types, 201-202measurement of, 218-219
Councils for higher education, 88Curriculum changes, inducing, 297-298Customs and excise taxes, 14DAC (see Development Assistance Com-
mittee)Data
criteria for, 261-267needs for, 218-220, 240-241, 258-262problems in obtaining, 271-272sources of, 260-262
Decentralization of administration (see
Administration, educational)Development Assistance Committee, 156Development banks (see Inter-American
Development Bank, Student Loan De-velopment Bank)
Diagnostic studies, 240-241Direct costs, 202Disposition of public wealth, 12Distribution of funds (see Educational
finance)Distribution of funds, equity in (see
Equity in distribution of funds)District-equalizing plan, 66-68Dropout rate, reducing, 298-299Earmarked taxes, 29, 113, 116Earnings, effect of education on, 215Economic valuation of education
correlation analysis, 224-227manpower approach, 221-224production function analysis, 230-
232rate of return approach, 193-196,
213-221regression analysis approach, 229-230residual approach, 227-229
309
317
Educationeffect of distribution of funds on,
53-69, 290-300effects on earnings, 215goils, 7-8, 203-210
table of selected goals by level,207
government intervention in, 19-26,84-89
social benefits of, 23-25, 216-217Education, higher
financial structure, 82-83government funding to councils for
higher education, 88government funding to individuals,
85-88government funding to institutions,
84-85government funding to lower levels
of government, 88student loan institutions and banks,
90-109Education, primary and secondary, fi-
nancing of and provision forgovernmental financing and govern-
mental provision, 50-52Examples of, 69-75
governmental financing and privateprovision, 75-77
philosophy of, 19-26private financing and governmental
provision, 79-81Education, vocational (see Vocational
education)Educational broadcasting, financing, 133-
134governmental, 136-138non-governmental, 134-135
Educational contracting (see Educationalperformance contracting)
Educational financeallocation methods and bases, 14-18,
52-53per class or student place, 291-
292per student, 290-291per teacher, 291-292
centralized vs. decentralized admin-istration, 269-277
example of decentralized financ-ing in Yugoslavia, 277-281
cooperative schools, 144-148efficient and inefficient use of funds,
179-202equity in distribution of funds for-
mulas, 53-69, 292-300forecasting resources for education
162-168
higher education, 82-89historical sources, 7-14Index of Educational Expenditures,
use of, 301-304Index of Educational Funding, use of,
174-175influence of government structure,
50Planning-program-budgeting in re-
source allocation, 234-257primary and secondary schools
government financing and gov-ernment provision, 50-52, 71-75
government financing and pri-vate provision, 75-77
private financing and govern-ment provision, 79-81
survey of present conditions, 1-3vocational education, 113-126Voucher system plans, -14/-155
Educational outputsdata sets to measure pencrmance,
use of, 266economic valuation of, 213'.32equalizing educational outputs, 294-
296evaluation of goal fulfillment, 210-
212Table of method of evaluating
educational outputs, 212goals, 203-210
conflicts, 206-209Educational performance contracting, 15,
282-289recent experiences, 285-286sequential model, 285uses in developing countries, 288-
289
Educational planning (see Planning, edu-cational)
Efficiency and inefficiency in education,179-202
Cost-benefit analysis, use of, 187-197Cost-effectiveness analysis, use of,
197-200inefficiency analyzed, 180-185Planning and program budgeting,
234, 239Elementary education (see Education, pri-
mary and secondary)Endowments, 12Enrollment
allocation of funds, 290-291planning, use in, 235, 247
Equalization of educational opportunity,23, 149
310
318
Equalization of social opportunity, 24, 91,127-132
Equity in distribution of funds formulasdistrict-equalizing plan, 65-68equalizing educational outputs, 294-
296equalizing educational processes per
educational unit, 294equalizing expenditures per educa-
tional unit, 292-293flat grants, 54-55foundation plan, 56-58, 68full central funding plan, 55-56guaranteed tax-base plan, 62-63, 68incentive formulas
attendance increase, 296-297curriculum changes, 297-298dropout reduction, 298-299
matching grants, 55percentage equalizing plan, 59-62, 68power-equalizing plan, 63-65
Evaluation of education (see Economicvaluation of education, Educationaloutputs)
Explicit costs, 201External aid to education, 156-161
data gathering, use in, 267distribution within educational sec-
tor, 158-159student loan development banks,
use in, 107types of aid, 157-158
External costs, 513Federal government systems, 50Fees, 10Finance, educational (see Educational fi-
nance)Fixed costs, 202Flat grants in equity formulas, 54-55Forecasting resources for education
government resources and expendi-tures, 163-167
planning and program budgeting,234
private resources, 167-168Foreign aid to education (see External aid
to education)Foundation plan, 56-58Foundations, 12Full central funding equity plan, 55-56Funding (see Educational finance)Further training programs, 117-118Future costs, 201General grants, 52, 70, 74, 84-85Goal's, educational (see Education, Educa-
tional outputs)Government
assistance to households, 77-79
311
assistance to individuals, 85-88assistance to private institutions, 75-
77, 83-85centralized vs. decentralized admin-
istration of education, 268-281financing or provision of education
higher education, 82-89primary and secondary educa-
tion, 20-26, 50-52central government, 51, 69-
73local government, 51, 75regional government, 51,
73-74forecasting resources for education,
163-167intervention in education
higher education, 84-89primary and secondary educa-
tion, 19-26role in equitable distribution of
funds, 53-69, 290-300Grants
higher education, 84-85types
attendance and per capita grants,16, 290-291
block, fixed and proportionategrants, 15
capital equipment grants, 16,292
classification grants, 17conditional grants, 17fee grants, 17matching or stimulation grants,
16, 55results grants, 15salary and direct teacher grants,
17specific subject grants, 16transport grants, 17
(see also Categorical grants, Generalgrants)
Gross national product, 169correlation analysis, use in, 224-227residual approach, use in, 227-229
Guaranteed tax-base plan, 62-63Higher education (see Education, higher)Historical costs, 201IEE (see Index of Educational Expendi-
tures)IEF (see Index of Educational Funding)Implicit costs, 201Incentive formulas
attendance increases, 296-297curriculum changes, 297dropout reduction, 298-299
Incentive system, 271
3 I 9
Income tax use in district equalizing plan,66-67
Index of Educational Expenditures (IEE),301-304 -
Index of Educational Funding (IEFT," 170-175
Index of Effort (economic measuringtool), 169, 174-175
Indirect costs, 202Industrial education (see Vocational edu-
cation)Inefficiency in educational processes (see
Efficiency and inefficiency in educa-tional processes)
Information gathering and analysis (seeData)
Inter-American Development Bank, 157Internal contracting (see Educational per-
formance contracting)International agencies (see External aid to
education)Land grants, 12-13Land tax (see Property tax)Loans (see External aid to education, stu-
dent loan institutions)Manpower approach
economic valuation, 221-224planning, use in, 235, 242, 247
Marginal costs, 187Market financing or provision of educa-
tion (see Private financing or provisionof education)
Matching grants, 16equity formulas, use in, 55
Mission oriented research, 240National student loan institutions (see
Student loan institutions)National training institutions, 120-121OJT (see On-the-job training)Occupational education (see Vocational
education)On-the-job training (OJT), 111, 124-126Opportunity costs, 188, 201Outlay costs, 201Outputs of education (see Educational
outputs)PPB (see Program budgeting)Parental choice of schools (see Schools,
parental choice of)Pay television, 134-135Payroll taxes, 116, 120-121
earmarked tax, 121-122financing vocational education, use
in, 121-122small industries, impact on, 123
Per capita grants, 16Percentage equalizing plan, 59-62, 68-69Performance contracting (see Educational
performance contracting)Philanthropy, 11Planning, educational
continuous plarining approach, 237-247
data gathering, 240-241interaction with administration, 272-
276linear planning approaches, 235-236,
246program and project development,
242-244program budgeting, 247-257sector planning, 236-247strategy formulation, 241-242
Planning-programming-budgeting (PPB)(see Program budgeting)
Policy research, 240Power-equalizing plan, 63-65Primary education (see Education, pri-
mary and secondary)Private financing or provision of educa-
tion, 20-26, 76-77,- 79-81forecasting private funding, 162, 167-
168higher education, 82-83
Production fUnction analysis, 230-232Program budgeting, 247-257
bias in implementation of, 251-253Cost-effectiveness analysis in, use of,
197-200documentary elements of, 250methodology, 248-249problems of balanced implementa-
tion, 253-257Program development, 242-244, 249-250Property taxes, 30-39
assessment techniques, 31-32, 36-39impact, 33implementation of, 36-39incidence, 34nature and characteristics, 31-33neutrality, 35-36use by local governments, 30(see also Taxes and taxation)
Public funding (see Educational finance,Government)
Radio, educational (see Educationalbroadcasting)
Rate of return (Economic valuation), 213-221
advantages and disadvantages, 215-217, 220
as criterion in cost benefit analysis,193-196
criteria for evaluation, 217-221measurement problems, 218-220planning, use in, 235-236, 242, 247
312
320
Real estate taxes (see Property taxes)Recurrent costs, 201Recurrent education, 127-132
financing, 130-131implementation, 129-130in developing countries, 131-132remedial effects, 128-129
Regression analysis (Economic valuation),229-230
Released time programs, 112, 116Residual approach (Economic valuation),
227-229Resources for education (see Educational
finance, Forecasting resources for edu-cation)
Results payments (see Educational perfor-mance contracting)
Retail sales tax, 41-42Retraining programs, 118-119Rural training programs, 119-120SLDB (see Student loan development
bank)SLI (see Student loan institutions)Salary grants, 17, 291Sale of public lands, 12Sales taxes, 39-49
Power equalizing plan, use in, 63-65Retail sales tax, 41ingle-stage tax at pre-retail levels,
40-41Turnover tax, 40, 116Value-added tax (VAT), 42-48
Sample studies and sampling, 267Scholarships, 15, 77-78, 86Schools, parental choice of
philosophy, 21-26Voucher system, use of, 149-155
Secondary education (see Education, pri-mary and secondary)
Sectoral planning for education (see Plan-ning, educational)
Self help projects, 140-148collectives, 81cooperative schools, 144-148resources, 141
Shadow prices, 188-189Single-stage tax at pre-retail levels, 40-41Social cohesion, 25Social equity (see Equalization of social
opportunity)Spillover costs, 187-188Stdfidard costs, 201Statistics (see Data)Student allowances and subsidies, 14, 77-
79, 86-88Student loan development bank, 103-108
sources of capital, 105-108special fund, 108
Student loan institutions (SLI), 90-109Debt profile of a single loan, Figure
1,98Debt profile of the fund, Figure 2, 99governmental use as instruments of
policy, 90-91higher education, effects on, 92-93,
108-109individual borrower, effects on, 91-92operation and administration of, 93-
102Subsidies, student (see Student allow-
ances and subsidies)Supplementary funds (see Grants)Systems analysis, 248-250Systems approach to planning (see Plan-
ning, educational)Tax credit, 86Taxes and taxation, 9-10, 14, 27-49
criteria for evaluating taxes, 27-28earmarked taxes, 29tax rates and tax-bases in equity fen.-
mulas, 53-67(see also Payroll taxes, Property
taxes, Sales taxes, Value-addedtax (VAT)
Teacher, allocations per, 291Technical assistance (see External aid to
education)Technical education (see Vocational edu-
cation)Television, educational (see Educational
broadcasting)Terminal education (see Vocational edu-
cation)Testing, 286Training levy (see Payroll taxes)Turnover tax, 40, 116UNESCO, 157Uncontrollable costs, 202Universities (see Education, higher)VAT (see Value-added tax)Value-added tax (VAT), 42-48
applications in financing vocationaleducation, 122-123
feasibility for developing countries,48
strengths and weaknesses, 43-48types
consumption, 43gross product, 43income, 43
Variable costs, 202Vocational education, 110-126
educational performance contracting,use of, 289
frequency with which elements of
313
321
vocational education occurs indifferent modes of training, Table1, 124-126
Manpower analysis approach, useof, 221-224
measurement of achievement in,219 -220
methods of financingapprenticeship training, 115-117further training programs, 117 -
118retraining programs, 118-119rural training programs, 119-120vocational schools, 114-115
National training institutions, 120-121
payroll tax in, use of, 121-123types of training, 111-112
Voluntary agencies, 80-81Voucher systems, 149-155
in developing countries, 154models, Table 1, 150
objectives, 149plans, 150-154
achievement model voucher,152-153
compulsory private scholarshipmodel, 151
effort voucher, 151-152egalitarian voucher, 152lifetime block-grant for educa-
tion, 154regulated compensatory vouch-
er, 153unregulated compensatory mod-
el, 151unregulated market voucher,
151Wages, effect of education on, 215Work-study programs, 81World Bank group, 157Yugoslavia, decentralization of educa-
tional finance, 277-279
314
322