document resume ed 362 499 sp 034 763 … resume ed 362 499 sp 034 763 author dereshiwsky, mary i.;...
TRANSCRIPT

DOCUMENT RESUME
ED 362 499 SP 034 763
AUTHOR Dereshiwsky, Mary I.; Packard, Richard D.TITLE When Words Are Worth More Than a Thousand Numbers:
The Power of Qualitative Research Procedures inEvaluating the Impact of Educational Programs &Practices.
PUB DATE Nov 92NOTE 14.; Paper presented at the Annual Meeting of the
National Council of States (17th, San Diego, CA,November 20-24, 1992).
PUB TYPE Speeches/Conference Papers (150) ReportsDescriptive (141)
EDRS PRICEDESCRIPTORS
ABS-RACT
MF01/PC01 Plus Postage.*Affective Measures; Data Analysis; Data Collection;Educational Practices; Educational Research;Ethnography; *Evaluation Research; Higher Education;*Program Evaluation; *Qualitative Research; ResearchDesign; *Research Methodology; Social ScienceResearch; Statistical Analysis
Research practitioners have traditionally collectedand analyzed data using experimental designs and inferentialstatistical procedures. In addition to being difficult to learn andapply, these quantitative procedures generally leave out suchvariables as attitudes, feelings, and emotions. This paper describesthe nature and role of qualitative data collection and analysisprocedures in the context of evaluation research or impactassessment. This method is often used by social service professionalsto determine if.a given program, process, or procedure has worked;focusing only on readily quantifiable outcomes would appear to leaveout quite a few essential social and behavioral elements. Thedocument provides a framework for discussing the two complementaryaspects of impact assessment, process and outcome, and relativestrengths and functions of quantitative versus qualitativeprocedures. Following this discussion, several commonly appliedqualitative procedures are identified, the power of combining numbersand words in the form of multimethod research designs is explained,and their applications are illustrated in a variety of actualevaluation studies. (Contains 23 references.) (LL)
***********************************************************************
Reproductions supplied by EDRS are the best that can be madefrom the original document. *
***********************************************************************

WHEN WORDS ARE WORTH MORE
THAN A THOUSAND NUMBERS
The Power of Qualitative Research Procedures
in Evaluating the Impact
of Educational Programs & Practices
U DEPARTMENT OF EDUCATIONaerce of iducahonal Resesrch and improvement
EDUCATIONAL RESOURCES INFORMATIONCENTER (ERIC)
o Ttus document has been teproduced as(eca.yed uom the Ofds On 0, Organashonor1g.nat.ng .1
0 M.not changes have been made lo nronoverawer:1..101On (Wanly
Poets of voeve o 00,Do3 valeta Irns 00C umeet dO oOt necessanty re0reSe0'1 &hostOF RI p05di00 Or pol,ch by:
Dr. Mary I. Dereshiwsky& Dr. Richard D. Packard,
Professors of Educational Research & LeadershipP. O. Box 5774
Northern Arizona UniversityFlagstaff, Arizona 86011
Ph: (602) 523-5852"PERMISSION TO REPRODUCE THISMATERIAL HAS BEEN GRANTED BY
TO THE EDUCATIONAL RESOURCESINFORMATION CENTER (ERICI"
Paper presented to:
The National Council of States17th Annual National Conference
San Diego, California
November 20 - 24, 1992 ,
BEST COPY AVAILABLE
Introduction
At some point, all research practitioners and students come face to face withneeding to acquire the necessary "tools of the trade" to collect and analyze their data.
Traditionally this has been done in the form of experimental designs and inferentialstatistical procedures.
Also, as those researchers who have "survived" a methods course would probably
admit, these quantitative procedures are generally considered difficult to learn and apply.
However, the precision, concise format (e.g., readily compilable as tables, charts and
graphs) and statistical generalizability of these numbers have, for most users, seemed to
justify any "pain" of learning them.
Recently, however, a number of researchers have taken a careful look at what
these numerical tools are actually telling them and have found quantitative procedures
sadly lacking. In particular, such inherently interesting and often critical variables as
attitudes, feelings and emotions have been stripped of much of their meaning and value to
the researcher when subjected to often-artificial quantification.
This would seem to be a material omission of information needed to address one's
research question -- particularly in the case of evaluation research designs. As defined by
Rossi & Freeman (1989), ... evaluation researchers (evaluators) use social research
methodologies to judge and improve the ways in which human services policies and
programs are conducted, from the earliest stages of defining and designing programs
through their development and implementation (p. 18)." As Kettner, Moroney & Marin
(1990) point out, "Designing effective programs requires that social service professionals
develop a more thorough understanding about social problems, people in need, and social
services than has been expected in the past (p. 14, emphasis ours)." In order toaccomplish such objectives of a valid and holistic impact assessment, focusing only on
readily quantifiable outcomes would appear to leave out quite a few essentialsocial/behavioral elements.
The purpose of this paper is to describe the nature and role of qualitative data
collection and analysis procedures iii the context of evaluation research. A brief overv;ew
of the two complementary aspects of impact assessment will be provided. Next, the
different relative strengths and functions of quantitative vs. qualitative procedures will be
described. Following this discussion, several commonly applied qualitative procedures
will be identified. Next, the power of combining numbers and words in the form ofmultimethod research designs will be explained, and their application illustrated, in a
variety of actual evaluation studies completed by the two authors.
1

"Did It Work?" The Key Ques_tion of Evaluation Research
The driving force of evaluation research, or impact assessment, is to see if a given
program, process or procedure "worked." As a number of prominent evaluationresearchers (Kettner, Moroney & Martin, 1990; Patton, 1990; Berk & Rossi, 1990; Rossi
& Freeman, 1989) have pointed out, however, the answer to this question is really made
up of two distinct parts:
1. Was the program, process or procedure executed according to plan?
2. Did the program, process of procedure lead to the desired outcomes?
It is critical to note the difference between these two questions. A program can
indeed "run by the numbers" and yet fail to produce the target outcomes for which it was
designed. In this regard, the "medical model" provides one such example. The patient
may be following his/her prescription to the letter and yet fail to recover from illness. The
solution, in both the medical and evaluation model cases, is to "change the prescription"
so as to improve the chances of "attaining good health."
Kettner, Moroney & Martin (1990) refer to these distinct aspects or phenomena as
"theory failure," vs. "program fajlure (p. 191)." Berk & Rossi (1990) employ the terms
"effectiveness (p. 54)," vs. "program integrity (p. 66)."
Process and Outcome: Two Distinct Evaluation Dimension
Regardless of the particular label, it is essential to distinguish between such
"process" and "outcome" aspects of program evaluation. Packard (1992) has referred to
the former phenomenon as ... teachers dancing in the classroom." Such a teacher can
indeed 'go through the motions' of his/her behavioral-objective evaluation checklist and
earn high ratings on all of the process criteria without any corresponding look at whether
these activities are in fact leading to the desired outcome of increased student academic
achievement. If the mere activity gets confounded with, or even worse substituted for, the
target outcome(s) it was originally designed to attain, then the evaluation activity has
badly missed its mark. In an often-quoted maxim regarding financial reporting, "The
only things that count are the things that get counted." While such prespecified "process"
activities (e.g., number of times a teacher positively reinforced a student's response in a
remedial reading tutorial inter vention) often rather conveniently lend themselves to such
numerical tallying and compilation, the danger lies in neglecting to measure the desired
outcomes that these process activities were designed to achieve. In particular, certain of
these outcomes may elude quantification yet may also be critically desired objectives
2
4

(e.g., did students acquire a more positive attitude about reading? and greater self-esteem
with regard to their reading skills?)
The Lure of Numbers; Precision at What Price?
Part of the blame for such a misguided "tallying mentality" approach to evaluation
research belongs to the overglorified image of quantitatively expressed information.Granted, numbers seem to be focused, precise and r( "(lily manipulable. As Patton (1990)
indicates, "Numbers convey a sense of precision and accuracy even if the measurements
that yielded the numbers are relatively unreliable, invalid and meaningless (p. 479)."Furthermore, as stated by Dereshiwsky (1992), "It's a sad fact that the unknown (antl
therefore scary) is sometimes also given undue glory and prominence. I've seen this
phenomenon at work with respect to statistics ... and statisticians (p. 5)."
Indeed, when properly applied, statistics may tell us a great deal. The problem lies
in using them for the wrong purpose, as well as in failing to recognize what theseelegantly simplistic statistics are NOT able to tell us.
Elliot Eisner (1991) illustrates the differential benefits of numbers vs .words (e.g.,
quantitative vs. qualitative data) in his colorful metaphor of the fox and the hedgehog.
The fox runs far and fast and covers a vast expanse of ground. However, in doing so its
paws barely skim the surface. This is analogous to using quantities and inferentialstatistics to generalize a rather limited set of values (e.g., test score averages) "with 95%
confidence" to thousands of cases. At first glance the fox may seem superior to the
hedgehog in terms of speed or surface covered. However, it is easy to forget that while
the hedgehog stays within a much smaller absolute area of ground, it (unlike the cox) can
burrow deep. As it does this, it gets a rich, closeup view of a wide variety of layers ofearth, plants, bugs, all of which make up the supporting structure to that surface. The
hedgehog's view is analogous to collecting and analyzing qualitative data.
Yin (1989) has referred to the distinction between quantitative and qualitative data
analysis purposes as "statistical" and "analytic" generalization, respectively. Qualitative
data allow for an in-depth understanding of the key ingredients contributing to success or
failure of the program being evaluated -- as opposed to a single, perhaps overlysummarized numeric indicator. As elaborated by Yin (p. 21):
...Case studies, like experiments, are generalizable to theoreticalpropositions and not to populations or universes. In this sense, a casestudy, .like the experiment, represents a "sample," and the investigator's
3

goal is to expand and generalize theories (analytic generalization) and notto enumerate frequencies (statistical generalization).
An evaluation researcher may, like the hedgehog, wish to "stay in a single spot"
and assess only a single locally based program, process or procedure. He or she may have
no need or desire to compare this one intervention to other, similar programs in distant
sites and with vastly different types of program participants. That activity can come later
with multiple replications and extensions of the study; e.g., "cross-case analysis" (Yin,
1989). But for the time being, a single program is bein3 assessed as to its effectiveness
for its locally based key stakeholders. In order to do so validly, the evaluation researcher
will want to collect data on the program from a variety of program and participant
perspectives. This is precisely where the versatility and context of qualitative datacollection and analysis come into play.
The Power of Words: Rich and Revealing
Denzin (1978), Marshall & Rossman (1989), and Patton (1990), among otherqualitative researchers, have consistently pointed out how simple, and yet wondrously
complex, words can be. Learning to collect and analyze qualitative data requiresrelatively little training, as compared with inferential statistical procedures (and, often,
related computer programming skill). vt-,t for all its surface simplicity, a quotation can be
tremendously revealing in terms of its wording, content, examples, detail and the like.
As ethnographers have known for quite some time, there is nothing quite like
letting subjects "tell a story in their own words." In doing so, the evaluation researcher
gains a valuable peek into the "world" of the key stakeholder and the full impact of the
program as he/she lived and experienced it from a unique and personal perspective. This
would include the often unquantifiable, and yet critically success-related, factors such as
attitudes, emotions, feelings, and perceptions. (Packard & Dereshiwsky (1992) have
provided a comprehensive listing of such key organizational climate variables.) Any and
all factors related to program impact need to be explicitly recognized, and their influence
scientifically assessed, in order to accomplish a complete and content-valid evaluation of
the full impact of a program, policy or activity.
Figure 1 (page 5) depicts the assessment of multiple facets of such a program. As
can be seen from this figure, the different graphically displayed 'layers' are analogous to
the sorts of multiple perspectives (key stakeholders, setting, objectives, and outcomes), all
of which need to be carefully considered in gauging the effectiveness of program impact.
4

Each of these factors can also be evaluated using a variety of qualitative data collection
procedures.
Figure 1.
The Importance of Context in Evaluation Research
(. . . . . . . . . . . . . . .
. Plarrners` CoatS' .. . . . . . . . . . . . . .
Goal
:ifteactions to
Strategies for Collecting and Analyzing Qualitative Data
Qualitative data collection and analysis procedures have recently gained a long-
overdue scholarly and scientific recognition in the educational and evaluation research
communities. As documented in a number of recent sources (Marshall & Rossman, 1989:
Krueger, 1988; Denzin, 1989; Patton, 1990), some commonly accepted ways to collect
data in words include the following:
1. focus group interviews;
2. individual in-depth interviews;
3. participant obser vation;
4. archival document content analysis;
5. proxemics and kinesics (e.g., 'body language' and spatial arrangements of settin2);
5

6. unobtrusive measures (e.g., collecting and analyzing artifacts).
Equally simple procedures have been developed to compile the results of such
data collection in words. Until recently, a major ban-ier to qualitative data analysis has
been lack of parsimony in presentation. That is, it was feared that the only way to report
such data would be to reproduce voluminous reports of page after page of verbatimquotes -- with the attendant concern that no one would ever bother to read a report of that
length. In contrast, the world of statistics was rather 'envied' for its succinct pattern of
presenting numeric findings in the form of tables, graphs and charts. That all changed in
1984 with the development of a procedure by Miles & Huberman known as the "matrix"
or "table-shell" method. The authors creatively proposed a pictorial way to representsummary patterns, themes or trends in qualitative data that often takes no more than a
page or two to"tell the story at a glance."
A second popular way to report qualitative data is the "summary narrativemethod" (Denzin, 1989; McCracken, 1988). This presentation style concisely interweaves
summary narrative with a sprinkling of key illustrative quotes to present key themes in a
more manageably readable way.
"Having the Best of BOTH Worlds:" Combininz_Words with Numbers
Given the differential strengths and insufficiencies of quantitative vs. qualitative
data, it is natural to want to attain the best of both procedures in a given evaluation study.
In fact, this is a relatively new and exciting branch of research methodology known as
"multimethod research." As pointed out by Brewer & Hunter (1989), "Its fundamental
strate2y is to attack a research problem with an arsenal of methods that havehonoverlapping weaknesses in addition to complementary strengths (p. 17, emphasis in
ori2inal text)." This convergence, or comparison from multiple perspectives, has also
been referred to as "triangulation" by a number of prominent research sources (Denzin,
1978: Jick, 1979). As elaborated in Brewer & Hunter (1989, p. 17):
Broadly speaking, measurement is the operation of assigning eitherqualitative or quantitative values (that is, either names or numbers) tosocial phenomena. Triangulated measurement tries to pinpoint the valueof a phenomenon more accurately by sighting in on it from differentmethodological viewpoints. To be useful, a measuring instrument mustboth give consistent results and measure the phenomenon that it purportsto measure. When two reliable instruments yield conflicting results, thenthe validity of each is cast into doubt. When the findings of differentmethods agree, we are more confident.
6

Figure 2 (P. 7) depicts a triangulation of quantitative and qualitative measurement
procedures (Packard & Dereshiwsky, 1992). Please note that the critical element is not the
three specific measurement processes; rather it is the application of a variety of alternative
data collection and analysis procedures to see if they "point in the same direction"regarding program impact and assessment.
Figure 2.
Triangulation of Data from Basic Psychological Needs,
Factor Analysis & Focus-Group Interviews
FactorAnalysis
PsychologicalNeeds
Focus-GroupInterviews
Multimethod research design and analysis procedures have been applied byPackard & Dereshiwsky to a variety of evaluation research activities. One such studyconstituted the pilot test of a picture booklet designed for use with Navajo familiesidentified as "at risk" for developing diabetes (1991). Figure 3 (p. 8) displays thetriangulation and convergence of findings regarding this booklet from three alternative
strata of interview subjects: program administrators; interviewers; and diabetes health
educators.
Figure 4 (p. 9) contains a matrix reporting results of a preliminary qualitative needs
assessment conducted in partnership with a private high school located in a southwestern
reservation community. As can be seen from this matrix, participants comments were
summarized and clustered according to their current professional affiliation (e.g., faculty,
staff, administrator, parent, S.tudent). Thus the reader can readily compare whetherdifferent key stakeholders had different perceptions. A conceptual model depicting the key
components of this organization (which in turn became the integral aspects of the holistic
needs assessment and appear as columns of the matrix) appears in Figure 5 (p. 10).
7

Figure 3.
Triangulation of Pilot-Test Results from Three Key Stakeholder Strata of Subjects:
A Diabetes Educational Material Needs Assessment
Administrators
simpucrre
IsICREASED AWARENESS
ATTRACTIVENESS OF PHOTOGRAPHS
EASE OF USE OF aoonErwrn4 ALL AGE GAOUPS
ADD MORE CULTURALLY RELEVANT ACTIV1T1ES AND MEAL CHOICE
EMEND STUDY ACROSS TIME TO TRACK APRUCATION OF FACTS LEARNED
ADAPT BOOKLET FOR USE WITH DIABETICS & FOR 071-1ER AT-RISK HEALTH ISSUES
Volunteer Interviewers
8
AZDA Represematives
0

Figure 4.
An Example of Matrix Reporting of Qualitative Interview Data:
Key Stakeholder Strata Comments for Key Organizational Components
of a School System
Group Cuniculum Teacher and
Students......Staff_Dzelopment
No comments Teachers need to help
individual studentsTeachers Need facilities, materials
and equipment
Need integration between
and across areas
Need help to assess
student progress
Improved orientation
inservice
Feelings of isolationSupport Staff No comments Teachers need to.help
individual students
Need valid and reliable
evaluation s stemDeans Focus on higher-level
learning skills (patterns and
processes)
Integrate cultural activities
into curriculum
Teachers need to help
individual students
More facilities, materials
and equipment
Improved orientation
inserviceSupport Administration No comments Teachers need to help
individual students
Extracurricular activities
beneficial
Academy Board Curriculum is well spelled
out
Had inEtiracurriculurn
No comments
Teachers need to help
individual students
Teachers need to help
individual students
Need help to assess
student progress
Parents
9
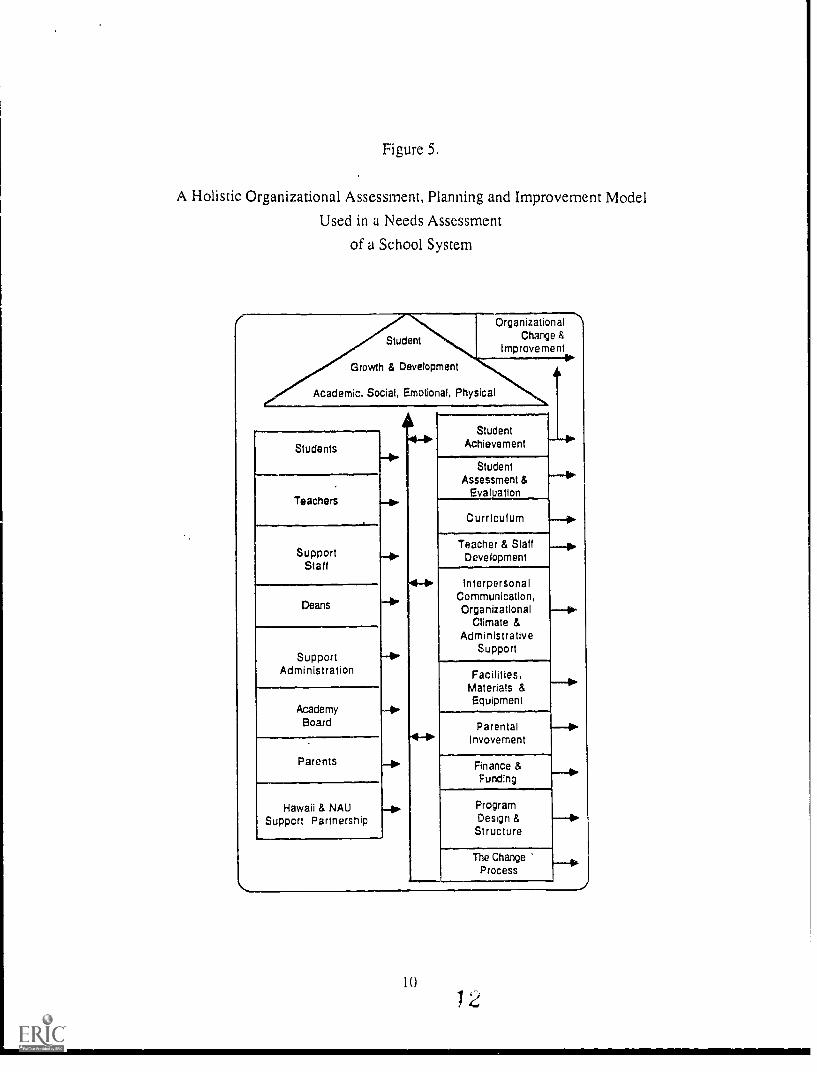
Figure 5.
A Holistic Organizational Assessment, Planning and Improvement Model
Used in a Needs Assessment
of a School System
Student
Growth & Development
Academic, Social, Emotional, Physical
OrganizationalChange &
Improvement
Students
Teachers .
SupportStaff
Deans,
Support ,
Administration
AcademyBoard
Parents
Hawaii & NAUSupport Partnership
StudentAchievement
StudentAssessment &
Evaluation
Curriculum
Teacher & StaffDevelopment
-Interpersonal
Communication,Organizational
Climate &Administrative
Support
Facilities,Materials &Equipment
ParentalInvovement
Finance &Funding
ProgramDesign &
Structure
The ChangeProcess
10
112

Additionally, Packard & Dereshiwsky have developed a data analysis procedureknown as "profiling." This procedure combines both words and numbers by tallying the,
net frequency of mention of a given idea or concept. In the case of an organizationalcomponent being evaluated, if the number of positive mentions exceeds that of negative
mentions, that component may be assumed to be currently functioning at a "healthy"operational level. On the other hand, if the negative tally outweighs the positive, then that
component is functioning "below par" and needs immediate attention or remediation.
This profiling procedure is depicted in tabular form with respect to studentachievement for the various key stakeholder groups in Figure 6 (p. 11). Figure 7 (p. 12)
contains a graphical depiction of the profiling procedure as applied to the organizational
"support factors" participating pilot-test districts of the Arizona Career Ladder Program
(Packard and Dereshiwsky, 1989). Please note that those components pictured below the
baseline are considered to be functioning at "relatively unhealthy" levels, and vice versa.
(A similar table was generated for the organizational "focus factors:" please see Packard
and Dereshiwsky, 1989, for additional details.)
Figure 6.
An Example of Converting Qualities to Quantities:
Relative Frequency of Positive and Negative Comments about Student Achievement
by Key Stakeholder Strata
Group Positives Negatives Net Subtotal
Students 1 25 -24
Teachers 3 18 -15
Support Staff 8 14 - 6Deans 4 2 + 2
Support
Administration
1 6 - 5
Academy Board 1 19 -18
Parents 1 7 - 6Hawaii & NAU
Support Partnership5 13 - 8
Subtotal -80
11
1 3
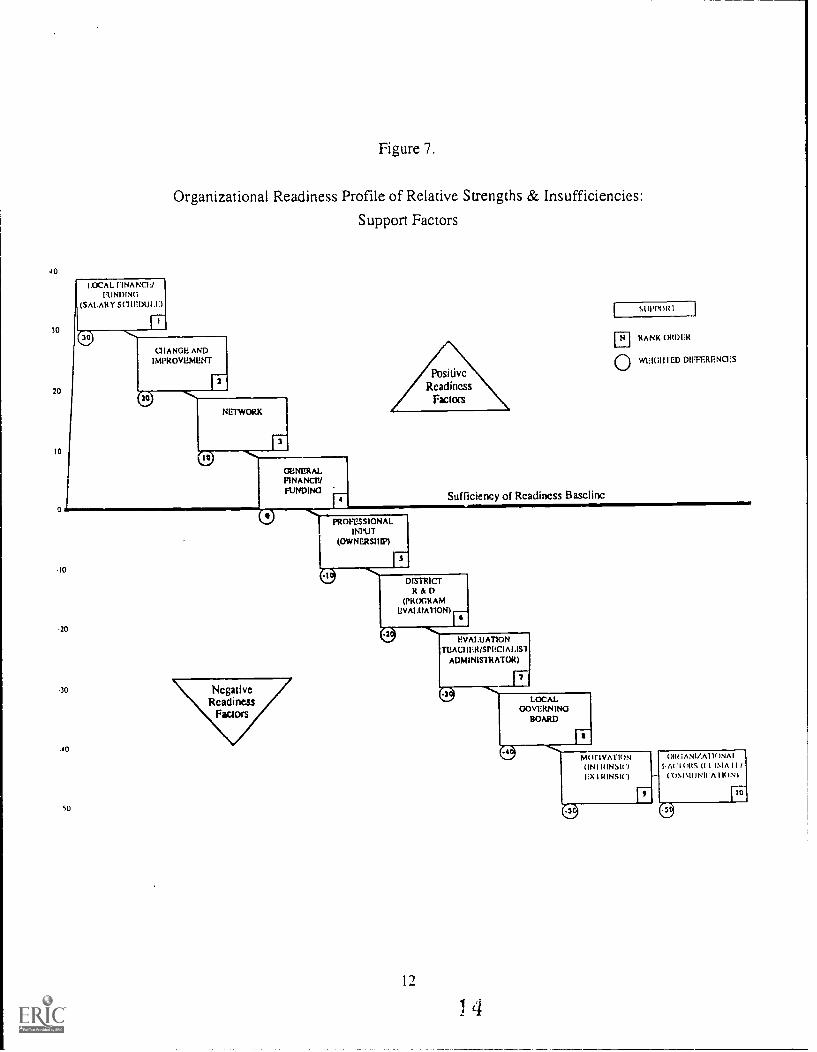
Figure 7.
Organizational Readiness Profile of Relative Strengths & Insufficiencies:
Support Factors
LOCAL FINANCE/FUNINNG
(SALARY S(111IDULF)
3030
aIANGE ANDIMPROVEMENT
2010
NETWORK
1010
GENERALFINANCE/FUNDING
10
30
.40
5U
PROFESSIONALINPUT
(OWNERS! tai
10
MIN.(
RANK OR)ER
0 WEIGI FED DIFFERENCES
Sufficiency of Readiness Baseline
DISTRICT& D
(P11(XnR AMEVAIAIATION)
12
1EVALUATION
I1IACIIER/SPECIALIS1ADMINISTRATOR)
14
7
LOCALGOVERNING
BOARD
MIITIVATION(INIRINSR'tL X I INSK')
F
010;AN1/.Allt/NAII.AI (IRS I INIA I I
CONIS0INWA I loN)
(19
concluding Comments
Longtime residents of the Northeast will recall a certain colorful ex-mayor of New
York City and his habit of stopping citizens on the street and asking them rather directly,
"How am I doing?!" As one can imagine (and this ex-mayor undoubtedly discovered in
very short order), this question is both basic and complex in its nature. Responses may run
the gamut from the courteously noncommittal, "Fine," all the way to a detailed laundry list
of kudos or complaints.
By its very focus on this key issue, evaluation is arguably the most "universal" and
versatile of research methodologies. It is difficult to imagine any branch of humanendeavor that does not involve some sort of improvement-oriented "intervention" and a
corresponding desire to assess its impact be it in such diverse areas as medicine,
economics, or education.
Traditional quantitative approaches have shown only one side of the picture -- and,
unfortunately, in some cases a rather limited one at that. The astute evaluation researcher
desiring to attain a more balanced, comprehensive and above all valid assessment would
be well advised to consider application of qualitative procedures. By balancing thegeneralizability of the numbers with the contextual richness of the words, the evaluator
will attain a more balanced, rich and in-depth perspective as to the entire range ofstrengths, insufficiencies and recommendations for improvement.
13
1 5

References
u 11- A G I t
Berk, R. A., and Rossi, P. H. (1990). Thinking about program evaluation. SagePublications, Inc., Beverly Hills, California.
Brewer, J., and Hunter, A. (1989). Multimethod research: A systhesis of styles. SagePublications, Inc., Beverly Hills, California.
Der. , N. K. (1978). The research act; A theoretical introduction to sociological models.
(2nd ed.) McGraw-Hill, New York, New York.
Denzin, N. K. (1989). Interpretive biography. Sage Publications, Beverly Hills, California.
Eisner, E. W. (1991). The enlightened eye: Oualitative inquiry and the enhancement of
educational practice. MacMillan Publishing Company, New York, New York.
Jick, T. D. (1983). Qualitative methodoloEy. (ed., van Maanen, J.) Sage Publications, Inc.,
Beverly Hills, California.
Kettner, P. M., Moroney, R. M.., and Martin, L. L. (1990). Designing and managingprograms: An effectiveness-based approach. Sage Publications, Inc., Beverly Hills,
California.
Krue2er, R. A. (1988). Focus groups: A practical guide for applied research. SagePublications, Inc., Beverly Hills, California.
Marshall, C., and Rossman, G. B. (1989). Designing qualitative research. SagePublications, Inc., Beverly Hills, California.
McCracken, G. (1988). The long interview. Sage Publications, Inc., Beverly Hills,California.
Miles, M. B., and Huberman, A. M. (1984). Qualitative data analysis: A sourcebook of
new methods. Sage Publications, Inc., Beverly Hills, California.
Patton, M. Q. (1990). Oualitative evaluation and research methods. (2nd ed.) SagePublications, Inc., Beverly Hills, California.
Rossi, P. H., and Freeman, H. E. (1989). evaluation: A systematic approach. (4th ed.)Sage Publications, Inc., Beverly Hills, California.
Yin. R. K. (1989). Case study research: Design & methods. (Rev. ed.) Sage Publications,
Inc., Beverly Hills, California.
14

Section B: Packard & Dereshiwsky Evaluation Resear_ch Studies and Other Papas
Dereshiwsky, M. I. (1992, April 8-9). Dare to do research! Hints for suryiving the"necessary evil" of computers and statistics. A paper presented to the Professional
Conference Honors Week Symposium, "A Celebration of Teaching: Electing to
Teach in the '90's," Northern Arizona University, Center for Excellence inEducation.
Packard, R. D., and Dereshiwsky, M. I. (1992, November 20-24). Identification. analysis
f h
performance of organizations: Positive and negative psychological variables ofcommunication within organizations and individual emotional response. A paper
presented to the National Council of States, 17th Annual National Conference, San
Diego, California.
Packard, R. D., and Dereshiwsky, M. I. (1992, November 5-6). ValidiLv of key factors
within the assessment instrumentation used for the evaluation of the Arizona career
ladders program. A paper presented to the Arizona Educational ResearchOrganization Annual Conference, Arizona State University West Campus,Phoenix, Arizona.
Packard, R. D., and Dereshiwsky, M. I. (1991, November). Program evaluation andorganizational change; A profile of strengths and insufficiencies in readinessimpacting policy recommendations. change and restructuring of a comprehensive
statewide educational reform movement. A paper presented to the Annual Meeting
of the National Council of States (14th, San Antonio, TX, November, 1989).(ERIC Clearinghouse on Educational Management, No. ED 328939.)
Packard, R. D., and Dereshiwsky, M. I. (1991, November 11). Executive summary:Baseline holistic assessment. restructuring, long-range planning & improvement of
Greyhills Academy. A paper presented to the Greyhills contract high school and
academy community, Navajo Nation, Tuba City, Arizona.
Packard, R. D., and Dereshiwsky, M. I. (1991, August). The "Beat Diabetes" Indian
Health Services pilot project: A summative evaluation. A report presented to the
Department of Health and Human Services - Public Health Services. Indian Health
Center, Winslow Arizona.
Packard, R. D., and Dereshiwsky, M. I. (1990, April 16-20). Evaluation research:Assessment of a rural Arizona school district using a case study model for single-
setting. embedded focus-group interview & analysis procedures. A paper presented
15

to the Research on Evaluation Special Interest Group, American EducationalResearch Association 1990 annual meeting, Bostom, Massachusetts. (ERICClearinghouse on Tests, Measurement, and Evaluatiin No. TM15545.)
Packard, R. D., and Dereshiwsky, M. I. (1989, November 11). evaluating & profiling
schools based on a model of organizational effectiveness: Professors andt ,es ..I S ut pi *V' PO I S 000 4.1 I
Paper presented to the Rocky Mountain Educational Research Association, Tulsa,
Oklahoma. (ERIC Clearinghouse No. ED 318 770).
Packard, R. D., and Dereshiwsky, M. I. (1989, November 3). 5 ummative report VII: A
matrix of legislative mandates. research findinzs _and policy recommendations for
11-is_Admact oisgr_l_addra_pmgram. Document presented to the Joint Legislative
Committee on Career Ladders, State Capitol, Senate Caucus Room, Phoenix,Arizona.
16 18