document resume ed 357 504 author title · pdf fileed 357 504. author title. spons agency. pub...
TRANSCRIPT
ED 357 504
AUTHORTITLE
SPONS AGENCY
PUB DATENOTEPUB TYPE
EDRS PRICEDESCRIPTORS
IDENTIFIERS
ABSTRACT
DOCUMENT RESUME
EA 024 944
Firestone, William A.; And OthersWhere the Money Went: Revenue, Expenditure, andProgrammatic Changes in the First Year of NewJersey's Quality Education Act.Andrew W. Mellon Foundation, New York, N.Y.; PewCharitable Trusts, Philadelphia, PA.Mar 9358p.Reports Research/Technical (143)
MFO1 /PC03 Plus Postage.
*Educational Equity (Finance); Educational Finance;Elementary Secondary Education; Equalization Aid;*Finance Reform; *Fiscal Capacity; *State Aid; *StateLegislation
*New Jersey; Quality Education Act :.990 (NewJersey)
Questions about inequities in educational fundingwere raised in New Jersey when the legislature enacted the state'ssecond major education-finance-reform law, the Quality Education Actof 1990 (QEA). This paper describes changes in revenues,expenditures, and programs in 11 diverse New Jersey school districtsduring the first year of implementation of the QEA, the school year1991-92. The sample included three types of school districts--specialneeds, transition aid, and foundation aid. District-level data werecollected through document analysis and interviews. Site-level datawere obtained through visits to at least four schools in eachdistrict, interviews with the principal and staff, and a teacherquestionnaire that yielded a 60 percent response rate. Findingsindicate that the QEA helped poor urban districts make significantbut incremental changes in their educational programs. In contrast,the reduction of state aid to wealthy suburban districts did notundermine educational quality. Although the QEA had a modest impacton equalizing expenditures between rich and poor districts, it didproduce noticeable increases in revenues and expenditures forspecial -needs districts. However, substantial disparities inexpenditures remain between the special-needs and transition-aiddistricts. Finally, increased aid given to special-needs districtsdid not appear to be misspent. Eleven tables and five endnotes areincluded. (Contains 16 references.) (LMI)
***********************************************************************Reproductions supplied by EDRS are the best that can be made
from the original document.***********************************************************************
11
WHERE THE MONEY WENT: REVENUE,EXPENDITURE, AND PROGRAMMATIC CHANGES IN THE FIRST
YEAR OF NEW JERSEY'S QUALITY EDUCATION ACT
William A. FirestoneMargaret E. Goertz
Brianna NagleMarcy F. Smelkinson
March, 1993
This research is supported by grants from the Mellon Foundation and the Pew CharitableTrust. The views expressed in this report are those of its authors and are not necessarilyshared by the foundations, CEPA-NJ or Rutgers, the State University of New Jersey.
2
U.S. DEPARTMENT OF EDUCATIONOffice d EducatiOnel Research end Imps...men!
EDUCATIONAL RESOURCES INFORMATIONCENTER (ERIC)
ler.1.171)s document hes been reproduced asraceme() from the person or orgerntabonondineting d
o Minor champs hews been merle to improvereproduction Quality
Pants of vow or °preen{ stilted in this docu.!nerd do not neCesunly represent offic,g1OERI oombon Or policy
"PERMISSION TO REPRODUCE THISMATERIAL HAS BEEN GRANTED BY
TO THE EDUCATIONAL RESOURCESINFORMATION CENTER (ERIC)."
WHERE THE MONEY WENT: REVENUE,EXPENDITURE, AND PROGRAMMATIC CHANGES IN THE FIRST
YEAR OF NEW JERSEY'S QUALITY EDUCATION ACT
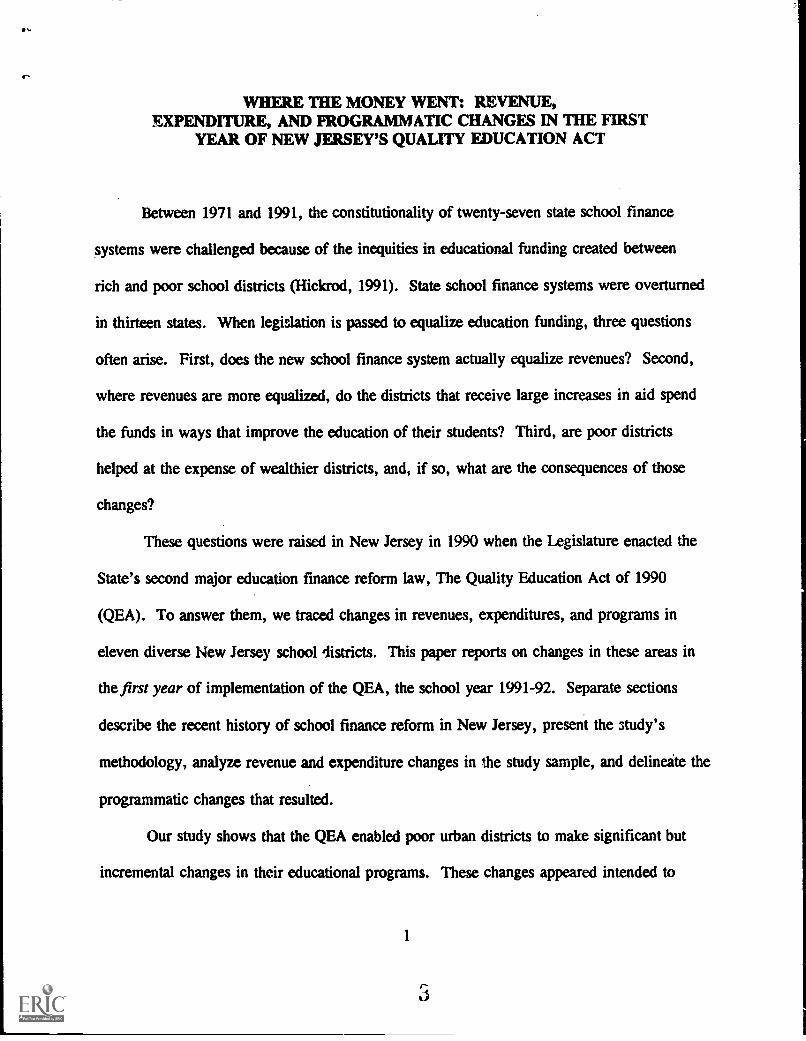
Between 1971 and 1991, the constitutionality of twenty-seven state school finance
systems were challenged because of the inequities in educational funding created between
rich and poor school districts (Hickrod, 1991). State school finance systems were overturned
in thirteen states. When legislation is passed to equalize education funding, three questions
often arise. First, does the new school finance system actually equalise revenues? Second,
where revenues are more equalized, do the districts that receive large increases in aid spend
the funds in ways that improve the education of their students? Third, are poor districts
helped at the expense of wealthier districts, and, if so, what are the consequences of those
changes?
These questions were raised in New Jersey in 1990 when the Legislature enacted the
State's second major education finance reform law, The Quality Education Act of 1990
(QEA). To answer them, we traced changes in revenues, expenditures, and programs in
eleven diverse New Jersey school districts. This paper reports on changes in these areas in
the first year of implementation of the QEA, the school year 1991-92. Separate sections
describe the recent history of school finance reform in New Jersey, present the study's
methodology, analyze revenue and expenditure changes in the study sample, and delineate the
programmatic changes that resulted.
Our study shows that the QEA enabled poor urban districts to make significant but
incremental changes in their educational programs. These changes appeared intended to
1
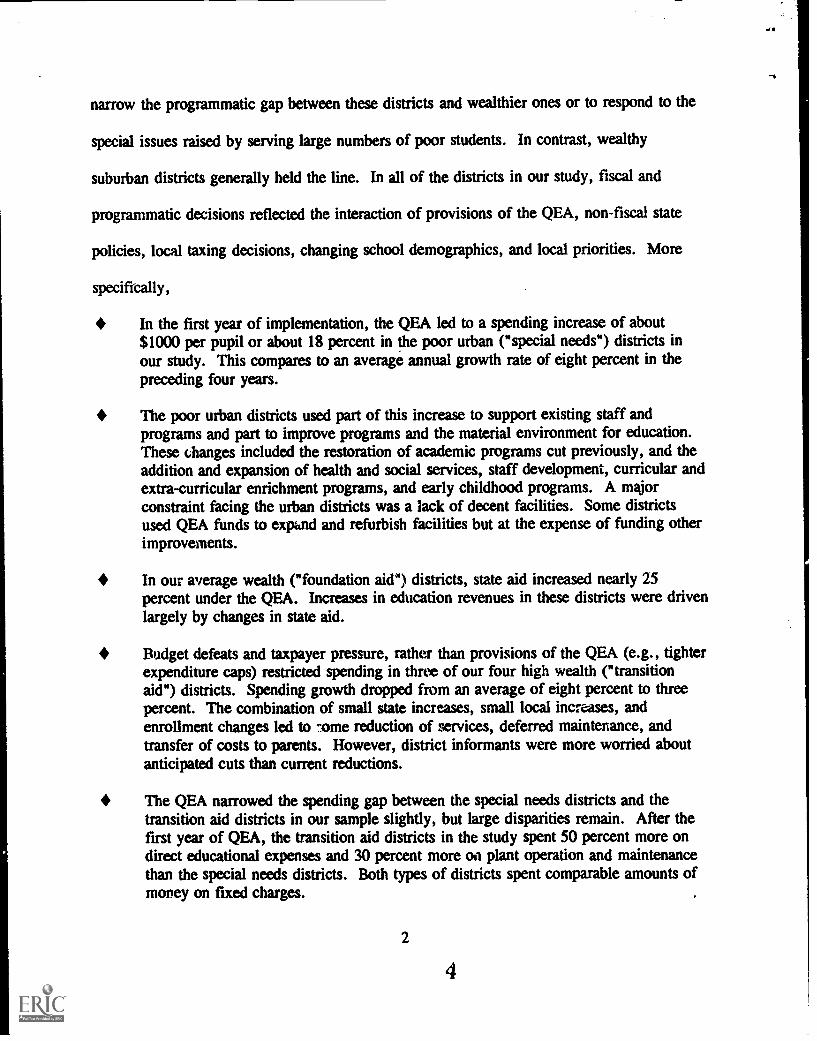
narrow the programmatic gap between these districts and wealthier ones or to respond to the
special issues raised by serving large numbers of poor students. In contrast, wealthy
suburban districts generally held the line. In all of the districts in our study, fiscal and
programmatic decisions reflected the interaction of provisions of the QEA, non-fiscal state
policies, local taxing decisions, changing school demographics, and local priorities. More
specifically,
In the first year of implementation, the QEA led to a spending increase of about$1000 per pupil or about 18 percent in the poor urban ("special needs") districts inour study. This compares to an average annual growth rate of eight percent in thepreceding four years.
The poor urban districts used part of this increase to support existing staff andprograms and part to improve programs and the material environment for education.These changes included the restoration of academic programs cut previously, and theaddition and expansion of health and social services, staff development, curricular andextra-curricular enrichment programs, and early childhood programs. A majorconstraint facing the urban districts was a lack of decent facilities. Some districtsused QEA funds to expand and refurbish facilities but at the expense of funding otherimprovements.
In our average wealth ("foundation aid") districts, state aid increased nearly 25percent under the QEA. Increases in education revenues in these districts were drivenlargely by changes in state aid.
Budget defeats and taxpayer pressure, rather than provisions of the QEA (e.g., tighterexpenditure caps) restricted spending in three of our four high wealth ("transitionaid") districts. Spending growth dropped from an average of eight percent to threepercent. The combination of small state increases, small local increases, andenrollment changes led to 7.ome reduction of services, deferred maintenance, andtransfer of costs to parents. However, district informants were more worried aboutanticipated cuts than current reductions.
The QEA narrowed the spending gap between the special needs districts and thetransition aid districts in our sample slightly, but large disparities remain. After thefirst year of QEA, the transition aid districts in the study spent 50 percent more ondirect educational expenses and 30 percent more on plant operation and maintenancethan the special needs districts. Both types of districts spent comparable amounts ofmoney on fixed charges.
2
In the paragraphs that follow, we first review the recent history of school finance
reform in New Jersey and then describe the methodology of this study. Succeeding sections
provide baseline information on the districts in the study, describe changes in revenues and
expenditures, and then report on changes.in personnel, materials, and programs.
RECENT EDUCATIONAL FINANCE REFORM IN NEW JERSEY'
In 1973, the New Jersey State Supreme Court was the second state court in the nation
to overturn a state school finance law and require that a more equitable school funding
formula be implemented. In response to that decision, Robinson v. Cahill, the New Jersey
Legislature enacted The Public School Education Act of 1975. This law ix...Teased the
state's share of educational revenues from 28 to 40 percent and improved fiscal equity in the
short run. However, starting in the. late 1970s, inequities increased again. Expenditure
disparities between the top and bottom five percent of districts grew from $900 in 1975-76 to
$2122 in 1984-85 and nearly $3500 in 1988-89.
In 1981, the Education Law Center, a public interest law firm representing 20
children in four of New Jersey's poorest cities, filed a new lawsuit, Abbot v. Burke. The
plaintiffs contended that the state's education finance system caused significant expenditure
and program disparities between the poor urban and wealthy suburban districts in the state,
leaving poor urban districts unable to meet the educational needs of their students. In June
1990, the New Jersey Supreme Court ruled in favor of the plaintiffs, stating that "under the
present system...the poorer the district and the greater its need, the less the money available
and the worse the education." The thrust of the decision was an order to equalize programs
and expenditures between rich and poor districts. However, the court also recognized that
3
5
students in poorer urban districts require more resources than those in wealthy communities:
It is clear...that in order to achieve the constitutional standard for the student fromthese poorer urban districts..., the totality of the district's educational offering mustcontain elements over and above those found in the affluent suburban district. If theeducational fare of the seriously disadvantaged student is the same as the "regulareducation" given to the advantaged student, those serious disadvantages will not beaddressed, and students in the poorer urban districts will simply not be able tocompete. (Abbott II at 374)
The Court did not invalidate the entire state school finance system, but it did find the
effects on twenty-eight poor urban districts unconstitutional and required changes to eliminate
disparities between those districts and the wealthiest districts in the state. More specifically,
it ordered the legislature to create a funding system that would:
equalize spending for the regular educational program between poor urban andproperty rich districts,
provide additional funds to meet the special educational needs of urban districts toredress their disadvantages,
assure funding certainty so. poor urban districts are not subject to the vagaries of localtaxing or budgeting decisions,
eliminate minimum state aid to property-rich districts, and
be implemented starting in 1991-92.
One month before the Court issued its decision, the new Florio administration
introduced the first version of the Quality Education Act (QEA I) into the Legislature. This
bill was one part of a four-part, $2.8 billion tax package designed to address a projected
budget deficit, income tax reform, and rapidly rising property taxes, as well as education
finance reform.'
With little discussion outside the State House and little opposition within his party,
Governor Florio and the state Democratic leadership pushed both the tax package and the
4
school finance reform bill through the Legislature by early July 1990. While the QEA I was
intended to increase overall support for education, a major purpose was to reduce
expenditure disparities between 30 "special needs districts" -- the poorest urban communities
in the state which educate about 25 percent of the state's students -- and the 108 wealthiest
school districts. Among other things, the school funding bill:
increased state education aid by $1.15 billion;
changed the state education aid formula from a guaranteed tax base to a foundationformula and set the foundation level at $6835 per pupil (including the cost of teacherretirement and social security);
added an income factor to the wealth measure used to allocate state aid;
.vplaced categorical compensatory education aid with aid for at-risk students,allocated according to the number of students eligible for the federal free lunch orfree milk program;
the distribution of minimum aid phased out over four years;
made teacher pension and social security costs the responsibility of local districts; and
set no caps on district expenditures, but limited overall growth in state aid to growthin per capita income in the state.
Opposition to the tax and school funding bills was immense, and formed even befize
the QEA I was signed. Motorcades converged on the state capitol. The Governor's
approval rating dropped 19 points after these bills were passed, from 42 to 23 percent.
Those who ranked his performance as poor more than doubled from 14 to 32 percent ("Tax
Hikes," 1990). The depth of this opposition became apparent in Fall 1990 when Bill
Bad ley, a very popular United States senator, almost lost re-election to an unknown
Republican challenger.
Most of this opposition was to the tax hikes, but a good deal was directed at the
5
ty
QEA. A poll taken shortly after the bill passed found that 56 percent opposed it while 35
percent supported it ("Most Jerseyans," 1990). The public's short term concern was that the
QEA would raise taxes. However, two more specific fears fed into this general concern.
The first was that money would be wasted in the urban districts. Newspaper commentary
shows various forms of this concern:
The state of New Jersey has a program of compensatory education. The federalgovernment has its Title 1 funding. These programs have poured millions uponmillions of dollars into various school systems with little, if any, effect. ("New
Methods," 1991).
But much of [Senator Lynch's] criticism of school professionals who seem to be moreconcerned about their own financial well-being than the welfare of children will strikea responsive chord in citizens overburdened by school taxes and deeply concernedabout the lack of satisfactory results. ("The Right Questions," 1991).
The conclusion here might well be different if every leap in expenditures brought anincrease in achievement. This has not been the case. In 1976, we were promised thestate income tax and the "thorough and efficient" regulatory system would improveschools; in 1990, we were told conditions had only deteriorated for all the money thathad been spent... to succeed in school, poor children need more than better-paidteachers and expensive improvement plans that guarantee the jobs of the superfluous.("More Dollars," 1991).
Taxpayers and educators are talking about a new book by...John E. Chubb and TerryM. Moe calling for a radical solution to the problem of public schools that don'tteach. "Politics, Markets and America's Schools"...concludes that educationalbureaucracy is not just a problem; its the problem...Governor Florio is driving theLegislature in an Alice in Wonderland direction: Sentence first--verdict afterwards.Enact a new school funding formula (and new taxes) now--worry about educationalreforms later. It flies in the face of common sense. (Italics in original.) ("TheDebate That Isn't," 1990).
The second fear was that increased aid to poor school districts would come at the
expense of richer ones. This fear was voiced by suburban superintendents, state legislators
and, somewhat later, by a potential gubernatorial candidate:
The problem with the funding formula passed by the Legislature, the superintendents
6
8
found, is that it goes beyond the mandate of the court decision. And the dolorousresult is that it could create serious problems for suburban schools by diluting thequality of education in those districts...While it was the intent of both the SupremeCourt and the Legislature to redress the funding of urban schools, it surely was notintended by either branch of government to do so by seriously undermining the viablecontinuity of delivering quality schooling for suburban children. ("Viewpoint,"1990).
Democratic Assemblyman Daniel P. Jacobson of Monmouth County..., summed upthe situation by saying that the legislature had to "strike a balance between themiddle-class taxpayersthe struggling taxpayers--and the kid who through no fault ofhis own has to go to an [urbari] school that nobody wants him to do to"...Jacobsoncomplained that the law seemed to be "punitive" in withdrawing state money from hisShore district's affluent schools. ("School Debate," 1990).
Cutting state aid to wealthier districts, as envisioned under the Florio formula, willunfairly tax people within those districts who are living on fixed incomes, [potentialgubernatorial candidate] Whitman said. Even in affluent Somerset County, "noteverybody's rich," she added. ("Whitman Criticizes," 1991).
The Democratic legislative leadership soon distanced itself from Florio's original
proposals and amended the QEA in March 1991, four months before the original law was to
take effect. The new bill, dubbed the QEA
reduced the increase in state education aid from $1.15 billion to $800 million andallocated the difference to property tax relief;
reduced the base foundation level by nearly $200 per pupil to $6640;
delayed local assumption of teacher pension and social security costs for two years;
changed the local "fair share" calculation for the specie) needs districts;
removed a provision requiring districts to tax to their "fair share" level to receive fullfoundation aid;
cut funds for at-risk aid and created a hold harmless provision so no district would getless at-risk aid than the compensatory education money received the previous year;
reduced annual increases in total state education aid by 20 percent; and
set more restrictive budget caps on districts' total budgets.
7
9
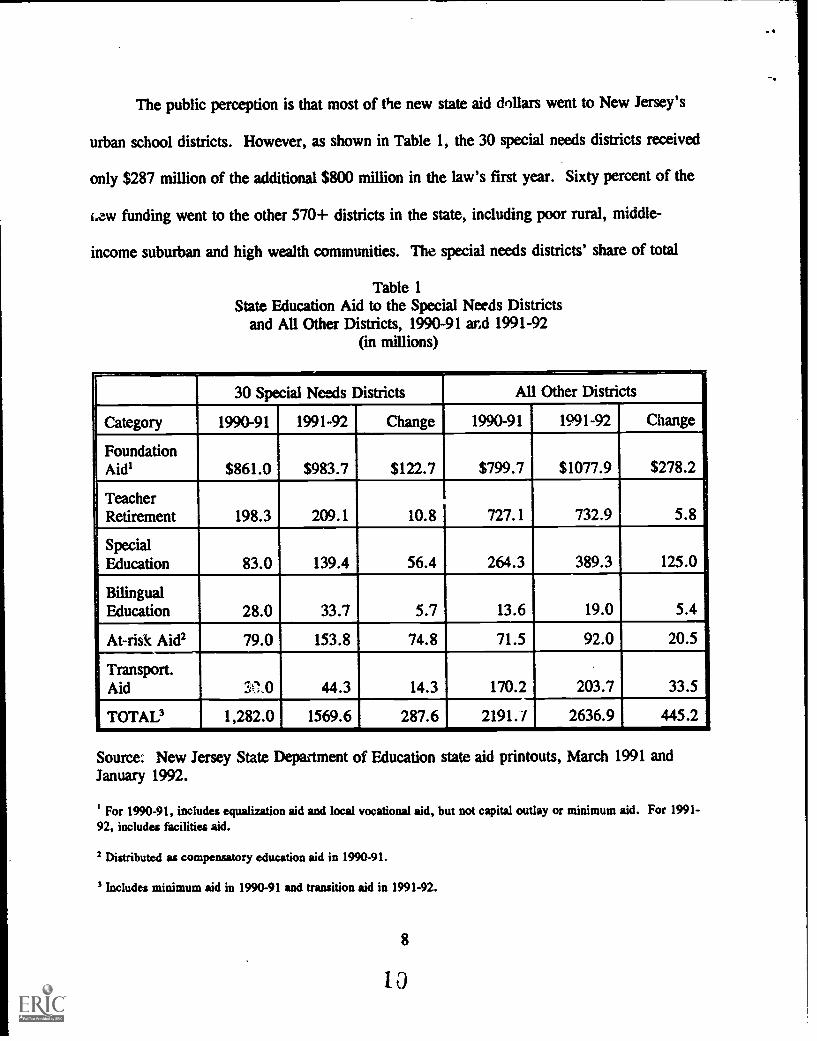
The public perception is that most of the new state aid dollars went to New Jersey's
urban school districts. However, as shown in Table 1, the 30 special needs districts received
only $287 million of the additional $800 million in the law's first year. Sixty percent of the
i.aw funding went to the other 570+ districts in the state, including poor rural, middle-
income suburban and high wealth communities. The special needs districts' share of total
Table 1State Education Aid to the Special Needs Districts
and All Other Districts, 1990-91 and 1991-92(in millions)
30 Special Needs Districts All Other Districts
Category 1990-91 1991-92 Change 1990-91 1991-92 Change
FoundationAid' $861.0 $983.7 $122.7 $799.7 $1077.9 $278.2
TeacherRetirement 198.3 209.1 10.8 727.1 732.9 5.8
SpecialEducation 83.0 139.4 56.4 264.3 389.3 125.0
BilingualEducation 28.0 33.7 5.7 13.6 19.0 5.4
At-risk Aide 79.0 153.8 74.8 71.5 92.0 20.5
Transport.Aid Y.,. 0 44.3 14.3 170.2 203.7 33.5
TOTALS 1,282.0 1569.6 287.6 2191.1 2636.9 445.2
Source: New Jersey State Department of Education state aid printouts, March 1991 andJanuary 1992.
' For 1990-91, includes equalization aid and local vocational aid, but not capital outlay or minimum aid. For 1991-92, includes facilities aid.
2 Distributed as compensatory education aid in 1990-91.
Includes minimum aid in 1990-91 and transition aid in 1991-92.
8
10
state aid did not increase between 1990-91 and 1991-92; the percentage of state aid going to
these 30 districts remained at 37 percent.
Concerns about waste and misuse of new money going to poorer districts created
demands that "the Legislature must build a strong monitoring and review system into the
formula that will finance the venture." ("Uncharted Territory", 1990) The Governor made
the avoidance of waste an important part of his defense of spending increases:
Let me make it very, very clear what this money is not for: It's not for anyone tobuild up flabby, lethargic bureaucracies. It's not for empire-building byadministrators. It's not for business-as-usual in systems that have been producingpoor results. [It's] not for anyone's patronage. [It's] not for anyone's personalagenda. It's for one thing and one thing only: our children...Education today will bemore than the three "R's." It also needs a "Big A": accountability. (Florio, 1990)
This kind of thinking led the Legislature to include a set of accountability measures in
the QEA. First, the law limits the annual growth in education spending through an "equity
cap." The cap for the special needs districts ranged from 8 percent to 20 percent in 1991-
92. In most districts, increases in state aid were greater than permitted increases in
spending, forcing the special needs districts to use $82 million of the new $287 million in
state aid for property tax relief. Second, the QEA required the State Department of
Education to appoint "external review teams" to examine the educational programs,
governance, management and finance of the special needs districts. These teams, composed
of staff from the State Department of Education and other state agencies, educators and
school board members from other local school districts, social service providers and
advocates, visited the districts during the fall of 1990.
Third, each special needs district was required to develop and submit an Education
Improvement Plan (EIP) to the Commissioner of Education which incorporated the
9
recommendations of the external review teams. The EIPs, which were developed with the
assistance of State Department of Education staff, identified educational goals for each
district, strategies for achieving these goals, and how new QEA dollars would be used to
implement the strategies. The first set of EIPs, which were to be implemented in the 1991-
92 school year, were developed assuming the districts would receive their QEA I allocation.
When the legislature reduced the proposed funding increases to the urban districts in March
1991, the districts were forced to revise their plans accordingly.
The non-special needs districts are also subjected to spending caps under the QEA.
These caps, which ranged from 7.5 percent to 9 percent in 1991-92, were designed to limit
the growth of rapidly rising local school district budgets.
Two other changes in state policy were initiated at about the same time as the QEA.
First, the state modified the High School Proficiency Test (HSPT) which students have to
pass to graduate from high school. The current test is given in ninth grade which gives
students who fail three additional times to pass it. The test includes sections on reading,
mathematics, and writing. The new test is designed to move away from the multiple-choice
format that characterized all but the writing section of the old test and to stress higher order
thinking skills. It will be given in the eleventh grade, reflecting better what graduating
seniors should know, and is accompanied by an Early Warning Test (EWT) given in eighth
grade to identify students at risk of not passing the HSPT. Districts were giving the new
HSPT during 1991-92 while field work was being conducted, but it would count first for the
class of 1995.
Second, the state education monitoring system, in effect since the late 1970s, was
10tir
partially suspended in 1991 while a new system was developed. Under the old system,
districts were monitored every five years on 51 process and performance standards, including
the percent of students meeting state minimum proficiency standards in reading and
mathematics at grades three, six and nine. Districts that passed this Level I monitoring were
certified for five years. Those that did not pass Level I monitoring went through two
increasingly rigorous remediation steps (Level H and Level III monitoring). Districts that did
not pass Level III monitoring could face state takeover, as in the case of Jersey City and
Paterson. With the passage of a new monitoring law in 1991, Level I monitoring was
suspended until the 1993-94 school year. Districts undergoing Level II and Level III
monitoring--as were most special needs districts--still had to gain certification. These
districts were thus subject to two state reviews: one from the Department of Urban
Education to ensure that new QEA funds were being used to improve education and one from
the county office to pass monitoring and become certified.
STUDY METHODS
To examine the fiscal and programmatic consequences of the QEA in detail, we
initiated a three-year study of eleven school districts in New Jersey. Covering the period
1990-91 through 1993-94, this study was designed to examine the impact of the QEA on
poor urban, middle wealth suburban, and wealthy suburban school districts in New Jersey.
How match woney did the poor urban districts receive under the QEA and how did they
spend k? k W did state oversight affect that spending? Did a school finance formula
designed to level-up poor, low spending school districts force high wealth, high spending
districts to level-down their education programs? What happened to the districts that fall in
11
13
between and were not subject to the Court mandate?
DISTRICT SAMPLE
The major criterion in selecting districts was the projected impaci of the QEA. While
a major focus of the QEA was on poor urban school districts, policy discussion in New
Jersey suggested that the QEA would affect the richest districts and middle income districts
rather differently. Our sample therefore includes three types of school districts: (1) "special
needs" districts--the poor urban school districts that are the target of the Court's mandate for
expenditure equalization; (2) "transition aid" districtsthe state's wealthiest school districts
that will lose their minimum aid over a four-year period; and (3) "foundation aid" districts- -
non- special needs districts that qualify for equalization aid and generally fall between the
special needs and transition aid districts in per pupil wealth.
Table 2 provides descriptive information on the districts in the sample. These ranges
reflect differences that are common in the state. As "special needs" districts are, by
definition, urban and low SFS, they tend to have larger enrollments and a much higher
concentration of minority students than the other districts. For the most part, special needs
districts are also poorer than others in the state, although Table 2 shows some overlap
between our special needs and foundation aid districts in per pupil property valuations. The
"transition aid" districts are smaller, wealthier and higher spending than either the special
needs or foundation aid districts in our sample.
1214
Table 2
The QEA Case Study Sample
Special Needs Foundation Aid Transition Aid
Number of Districts 5 2 4
Size 4,000 - 29,000 8,000 - 11,000 2,000 - 5,000
Percent Minority 71 - 98% 10 - 15% 13 - 20%
Equalized Valuationper Pupil, 1989(in $1,000s) $ 47 - 290 $192 - 356 $627- 1,136
Per PupilExpenditure,1990-91 $5000 - 6700 $5600 - 7400 $7500 - 9300
DATA COLLECTION
Because we were interested in tracing the impact of the QEA and related state policies
down to the school level, we collected data at both the district and school level. At the
district level, we collected district budgets for the period 1986-87 through 1991-92,
demographic information, plans for categorical programs (special education, compensatory
education, ESL/bilingual education) and the Education Improvement Plans for the special
needs districts. In each district we also interviewed the superintendent, business manager,
curriculum director, directors of categorical programs, a union leader, and the board
president. In most districts a reporter and/or a representative of the city government was also
visited. Interviews were structured by an interview guide (Patton, 1990) that specified all
topics to be covered, but gave interviewers some leeway to phrase questions in a manner
13
5
appropriate to the respondent. Topics included the previous programmatic and fiscal history
of the district, the nature of the student clientele and the basic program as it preceded the
QEA, the process of developing the 1991-92 budget (for the first year of the QEA
implementation), and changes that resulted in response to those budgetary changes.
To trace programmatic changes to the classroom level, we also visited at least four
schools -- two elementary, one middle, and one high school -- in each district.3 In each
district an effort was made to select elementary schools that varied in student wealth and
ethnicity. In each school all of the following that were present were interviewed: the
principal, the most senior people responsible for the compensatory education and
ESL/bilingual education programs, the head counselor, and individuals responsible for any
programs for special needs students. These interviews covered roughly the same topics as
the district interviews with an emphasis on events and changes in the schools. However,
because school personnel were often poorly informed about changes in school finance
policies, questions generally focused on changes the school experienced between 1990-91 and
1991-92. In addition, all teachers were asked to fill out a questionnaire asking about changes
in the last year in :availability of various supplies and other forms of support; the overall
response rate was about 60 percent.
STATUS IN 1990-91
When the QEA was enacted in 1990, sizeable disparities existed between the highest
and lowest spending districts in the state. Many of the low spending districts were special
needs districts. Table 3A shows the average current expenditure per pupil in 1990-91 for
each district in our sample, and how districts allocated these expenditures across five major
14
budget categories. The special needs (SN) districts in our sample spent, on average,
considerably less than the transition aid (TR) districts. For example, the lowest spending
special needs district in our sample (SN4) spent $4,323 per pupil less than the highest
spending transition aid district (TR1) in our sample. The lowest spending transition aid
district (TR3) outspent the highest spending special needs district (SN5) by $1,103 per pupil.
The two foundation aid districts (FN1 and FN2) in our sample have substantially different
levels of spending, in part reflecting differences in their tax base.
In spite of wide spending disparities, districts allocated their education dollars in
similar ways. For example, half of the districts in oul sample allocated 62 percent to 63
percent of their budget to direct education expenditures (the sum of instruction, attendance
and health services, student body activities, special education, and other special needs
programs). Most spent between 11 percent and 14 percent of their budgets on the operation
and maintenance of their facilities and three to four percent on the "other" category which
largely reflects the cost of central administration. The two areas in which the districts
differed were transportation and fixed charges. The geographically larger foundation aid and
transition aid districts spent a larger portion of their budgets on transportation, while the
special needs districts spent relatively more of their budgets on fixed charges.
15

Table 3ATotal Current Expenditures, by Category, 1990-91
District CurrentExpense/
Pupil'
Percent of Expenditures Allocated to Each Category
DirectEduc.
Expense2
Operat/Mainten
Transport-ation
FixedCharges' Other'
SN 1 $6,363 56% 9% 3% 27% 4%
SN 2 5,853 63%, 9% 3% 23% 3%
SN 3 5,549 60% 14% 4% 19% 4%
SN 4 5,001 63% 12% 3% 18% 4%
SN 5 6,377 63% 14% 4% 16% 4%
FN 1 5,585 58% 13% 6% 20% 3%
FN 2 7,357 62% 11% 5% 18% 3%
TR 1 9,324 62% 15% 7% 13% 3%
TR 2 9,048 65% 14% 1% 17% 4%
TR 3 7,480 60% 14% 6% 14% 5%
TR 45 8,798
Source: School district Advertised Budgets, Spring 1992. Figures are based on actual expenditures.
' Defined as J-1 Current Expenditures. It excludes teacher retirement and social security costs.
2 Direct Educational Expenses are defined as the sum of the following budget line items: instruction, attendance and
health services, student body activities, special education and other special needs programs.
3 Fixed Charges includes insurance costs and tuition paid to other school districts. It excludes teacher retirement and
social security costs.
The "Other" category is the sum of budget line items for administration, community services, sundry accounts and
special projects (local).
s Comparable figures were not available for this district because it uses program, rather than line item, budgeting.
16
18

Similar percentages do not translate into similar dollars, however. For example,
while SN2 and TR1 both spent 62 percent of their budgets on direct education expenditures
in 1990-91, in dollar terms, SN2 spent $2,1401 on this category than TR1 (Table 3B).
While allocating comparable shares of their budgets to operation and maintenance, the special
needs districts spent, on average, $550 per pupil J than the transition aid districts. This
table also shows that special needs districts have to allocate larger shares of their budgets to
fixed charges in order to generate the same level of spending as the non-special needs
districts.
As the Direct Education Expense category includes expenditures on special needs
programs (special education, bilingual/ESL, compensatory education), we developed a second
measure of spending on educational programs which adjusts for differences in the number
and mix of special needs students in each district. This measure, Education Expense per
Weighted Pupil, "weights" students with special education needs by some measure of
additional resources needed beyond those allocated to the average student.' Table 3B shows
that spending disparities widen when direct education expenditures are adjusted to reflect
differences in student need: SN2 spent $2,388 per weighted pupil less than TR1. On
average, the two higher spending transition aid districts (TR1 and TR2) spent nearly $2,500
per weighted pupil more on direct education expenses than the special needs districts in our
sample.
While the fiscal data provide an overview of initial revenue and expenditure patterns
in these districts, they do not describe how teaching and learning conditions varied.
Interviews provide some feel for these differences. The special needs districts faced a wide
17
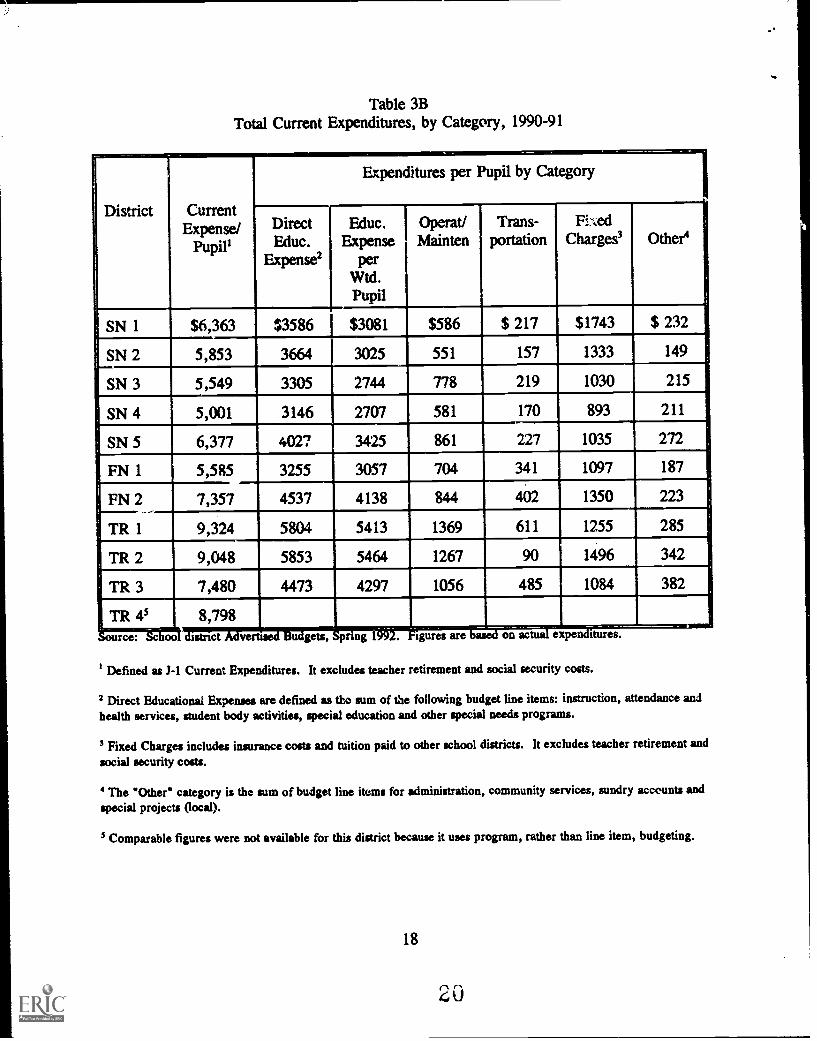
Table 3BTotal Current Expenditures, by Category, 1990-91
District CurrentExpense/
Pupils
Expenditures per Pupil by Category
DirectEduc.
Expense2
Educ. I
Expense 1per
Wtd.Pupil
Operat/Mainten
Trans-portation
FedCharges3 Other'
SN 1 $6,363 $3586 $3081 $586 $ 217 $1743 $ 232
SN 2 5,853 3664 3025 551 157 1333 149
SN 3 5,549 3305 2744 778 219 1030 215
SN 4 5,001 3146 2707 581 170 893 211
SN 5 6,377 4027 3425 861 227 1035 272
FN 1 5,585 3255 3057 704 341 1097 187
FN 2 7,357 4537 4138 844 402 1350 223
TR 1 9,324 5804 5413 1369 611 1255 285
TR 2 9,048 5853 5464 1267 90 1496 342
TR 3 7,480 4473 4297 1056 485 1084 382
TR 45u sets. print . laures are on ac exnen itures.
TL79x13rzrr4....wrr.....==7.=.§ource: School district verti
Defined as J -1 Current Expenditures. It excludes teacher retirement and social security costs.
2 Direct Educational Expenses are defined as the sum of the following budget line items: instruction, attendance andhealth services, student body activities, special education and other special needs programs.
3 Fixed Charges includes insurance costs and tuition paid to other school districts. It excludes teacher retirement andsocial security costs.
4 The "Other" category is the sum of budget line items for administration, community services, sundry accounts andspecial projects (local).
Comparable figures were not available for this district because it uses program, rather than line item, budgeting.
18
20
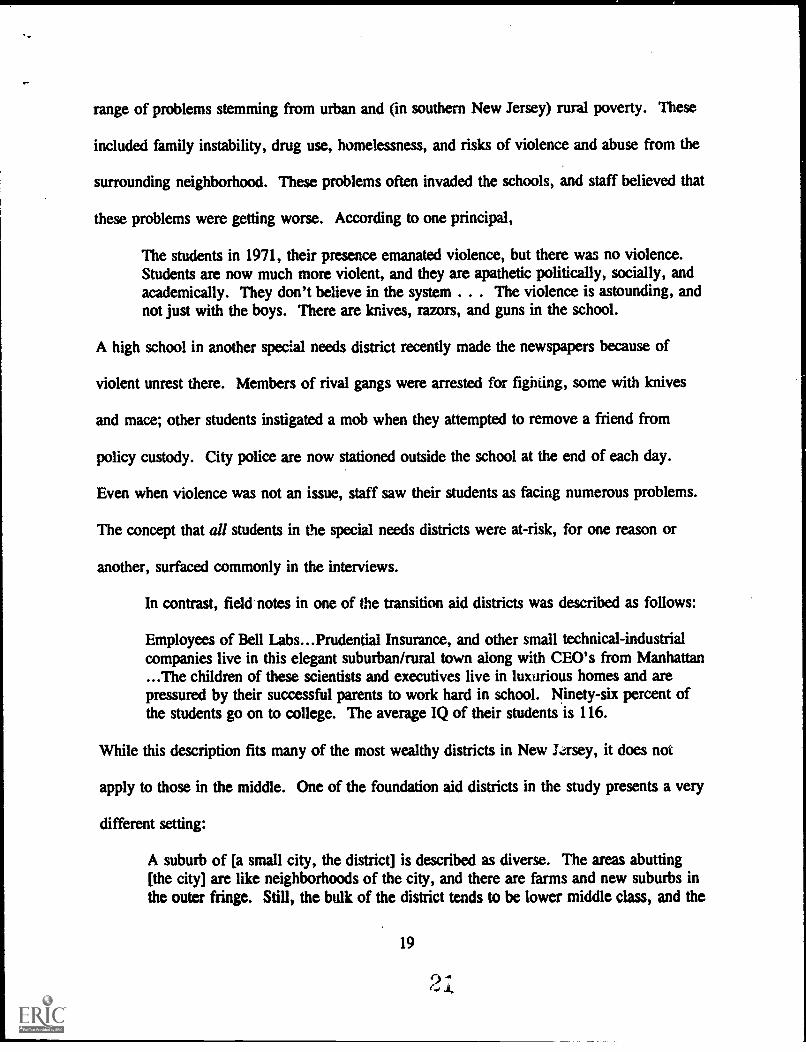
range of problems stemming from urban and (in southern New Jersey) rural poverty. These
included family instability, drug use, homelessness, and risks of violence and abuse from the
surrounding neighborhood. These problems often invaded the schools, and staff believed that
these problems were getting worse. According to one principal,
The students in 1971, their presence emanated violence, but there was no violence.Students are now much more violent, and they are apathetic politically, socially, andacademically. They don't believe in the system . . . The violence is astounding, andnot just with the boys. There are knives, razors, and guns in the school.
A high school in another special needs district recently made the newspapers because of
violent unrest there. Members of rival gangs were arrested for fighting, some with knives
and mace; other students instigated a mob when they attempted to remove a friend from
policy custody. City police are now stationed outside the school at the end of each day.
Even when violence was not an issue, staff saw their students as facing numerous problems.
The concept that all students in the special needs districts were at-risk, for one reason or
another, surfaced commonly in the interviews.
In contrast, field notes in one of the transition aid districts was described as follows:
Employees of Bell Labs...Prudential Insurance, and other small technical-industrialcompanies live in this elegant suburban/rural town along with CEO's from Manhattan...The children of these scientists and executives live in luxurious homes and arepressured by their successful parents to work hard in school. Ninety-six percent ofthe students go on to college. The average IQ of their students is 116.
While this description fits many of the most wealthy districts in New Jersey, it does not
apply to those in the middle. One of the foundation aid districts in the study presents a very
different setting:
A suburb of [a small city, the district] is described as diverse. The areas abutting[the city] are like neighborhoods of the city, and there are farms and new suburbs inthe outer fringe. Still, the bulk of the district tends to be lower middle class, and the
19
district is not known for its high achievement levels...For 20 years, residents wouldnot pass a bond issue for schools in spite of serious continual growth.
While property values and expenditures in foundation aid districts are sometimes close to
those in the "more wealthy" special needs districts, the former systems have fewer poor and
low achieving students so the educational problems they face are usually much less extreme.
The differences between districts suggested two ways that special needs districts could
use substantial revenue increases. First, they could use them for what special needs district
staff called "catch up" i.e., to help their districts offer the multitude of activities and
support that more affluent districts do. For example, one non-special needs district was
described in the following manner:
Many of the students are doing college level work in numerous A.P. courses...There is a large number of co-curricular and extracurricular activities with highparticipation. There is a program with ccunty technical school to study on state ofthe art equipment, a cooperative course at 6:30 a.m. Also, there are Saturdaymorning convocations that are open to anyone at various grade levels who wishes towork on problem solving skills, and enrichment programs in the earlier years.
"Catch up" implies obtaining for students in special needs districts that which is
available elsewhere, but students in these districts often have special needs that are much
more extreme than those in wealthier locations. As one district administrator in a special
needs district explained, "You can't educate a child who has to go home to cook for a parent
dying of AIDS. [Youl can't send home homework when parents can't read English or
Spanish." In many urban areas the out-of-school environment is especially hostile. Students
often need a place to stay in the early mornings or late afternoons while their pa:cents work.
Such services increase the safety and security for these students. As the reporter covering
one of the big city districts explained, "the schools in [name of city] are oases. A lot of
20
neighborhoods are really bad. The schools are orderly, clean, and warm. They provide a
respite from dysfunctional homes and neighborhoods." Thus, in addition to responding to
academic concerns, people making financial decisions in special needs districts were
influenced by both an interest in catching up and in dealing with the special problems created
by their surroundings.
CHANGES IN REVENUES AND EXPENDITURES
This section examines the fiscal impact of the QEA on the districts in our sample.
How did the QEA affect the level of education revenues available to the districts in 1991-92?
How did the districts choose to spend these new dollars? How much money was available to
the special needs districts for new and/or expanded programs? How did the transition aid
districts respond to the more restrictive spending caps? What was the status of the sample
districts one year after the QEA?
CHANGES IN REVENUES, 1990-91 TO 1991-92
The QEA increased state aid for education by $800 million, or nearly 25 percent,
between 1990-91 and 1991-92. At this same time, expenditure cap provisions forced some
of this new aid into property tax relief. How did these provisions affect our sample districts?
Table 4 shows changes in state aid, local revenues, and total revenues between 1990-91 and
1991-92 for the sample districts.
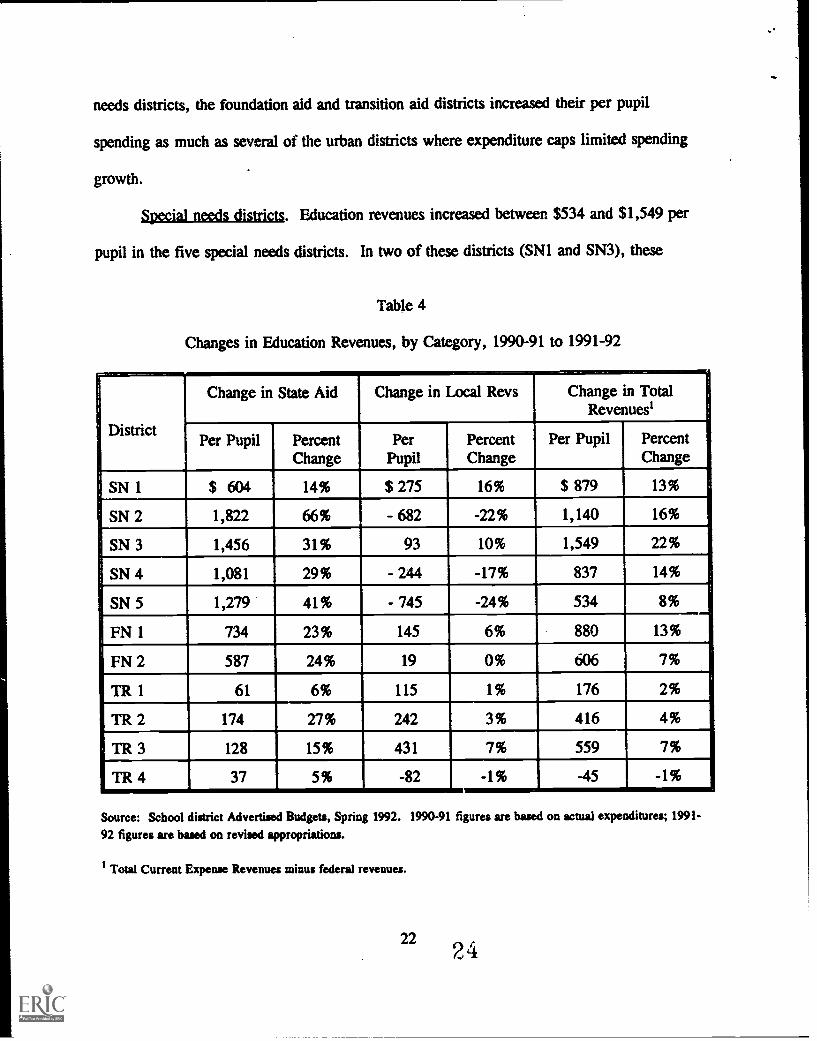
Changes in education revenues in the sample districts between 1990-91 and 1991-92
represensted the interaction of the state aid formula, the expenditure caps, and local taxing
decisions. While the percentage increases in revenues were generally larger in the special
21
2 3
needs districts, the foundation aid and transition aid districts increased their per pupil
spending as much as several of the urban districts where expenditure caps limited spending
growth.
Special needs districts. Education revenues increased between $534 and $1,549 per
pupil in the five special needs districts. In two of these districts (SN1 and SN3), these
Table 4
Changes in Education Revenues, by Category, 1990-91 to 1991-92
I
Change in State Aid Change in Local Revs Change in TotalRevenues'
DistrictPer Pupil Percent
ChangePer
PupilPercentChange
Per Pupil PercentChange
SN 1 $ 604 14% $ 275 16% $ 879 13%
SN 2 1,822 66% - 682 -22% 1,140 16%
SN 3 1,456 31% 93 10% 1,549 22%
SN 4 1,081 29% - 244 -17% 837 14%
SN 5 1,279 41% - 745 -24% 534 8%
FN 1 734 23% 145 6% 880 13%
FN 2 587 24% 19 0% 606 7%
TR 1 61 6% 115 1% 176 2%
TR 2 174 27% 242 3% 416 4%
TR 3 128 15% 431 7% 559 7%
TR 4 37 5% -82 -1% -45 -1%
Source: School district Advertised Budgets, Spring 1992. 1990-91 figures are based on actual expenditures; 1991-
92 figures are based on revised appropriations.
Total Current Expense Revenues minus federal revenues.
2224
increases reflected growth in both state aid and local revenues. In the other three, districts
received moderate to substantial property tax relief when increases in state aid exceeded their
capped budgets. In four of the special needs districts, revenues grew 8 to 17 percent from
1990-91. The fifth district (SN3), which voted a large cap waiver, saw its budget grow by
22 percent.
Foundation aid districts. Revenue increases were also substantial in the two
foundation aid districts--$880 and $606 per pupil, respectively. Again, revenue increases
were driven largely by increases in state aid; both districts had a 23 to 24 percent increase in
state aid. The overall change in revenues was affected by local taxing decisions, however.
One district (FN2) chose not to increase its tax levy, resulting in only a 7 percent increase in
total revenue. In this particular district, educational spending has never had great support.
For example, despite considerable student population growth over the last 20 years, residents
have refused to support a bond issue for schools. Further, they had not passed the budget
for the previous four years. The other district (FN1), which increased its local support of
education, had a 13 percent growth in education revenues, a rate comparable to most of the
special needs districts in our sample.
Transition aid districts. Revenue increases in the transition aid districts ranged from a
high of $55c" per pupil to a low of -$45 per pupil. All districts received more state aid.
Since state aid provides, on average, only 10 percent of these districts' revenues, the
magnitude of change in total revenue reflects local district taxing decisions. Three of the
districts (TR1, TR2, and TR4) chose to limit increases in their local taxes, spending below
the maximum permitted by the QEA expenditure cap. There are a variety of explanations for
23
?5
this behavior. In the past, local school budgets in the transition aid districts rarely failed to
win voter approval. Yet, in 1991-92, two of the districts spending below cap (TR1 and TR4)
did not pass their budgets. Further, one of these districts (TR4) had at least a four year
history of spending under cap. Finally, the other district spending below cap (TR2) had
developed a ten percent free balance because of a previously expected, but unrealized, rise in
special education costs. As a result, total revenues grew at a much lower rate in these three
districts than in the other sample districts. TR3 spent up to its budget cap, an increase of
seven percent. Although this rate of increase was lower than that of any of the special needs
districts in the sample, TR3 increased its per pupil spending by the s.me amount as SN5, a
special needs district that also spent up to its permitted budget cap.
CHANGES IN EXPENDITURES, 1990-91 TO 1991-92
We have chosen three ways of analyzing expenditure changes in the first year of the
QEA. First, we look at the percent of increased expenditures allocated to each of the five
major budget categories. Where did the districts choose to target their spending? Second,
we compare the percentage change in spending in three of these categories in the first year of
the QEA with the annualized rate of change for the prior four years. Relatively how much
more money was spent on education expenses? operation and maintenance? fixed charges?
Finally, what do these changes mean in dollar terms? On a per pupil basis, how much more
money did the special needs districts have to spend on education than the foundation and/or
transition aid districts in the sample?
Allocation of new dollars. Regardless of district type, most of the increased funds
were used for direct educational expenditures and fixed charges (Table 5). Four of the five
24
26

special needs districts spent about half of their increase on direct educational expenditures;
the fifth spent about 30 percent. Increases in fixed charges represented another 18 to 44
percent of increased revenues. The foundation aid districts also used 40 percent to 56
percent of their increased revenues on direct educational expenditures, and another 24 to 54
percent on fixed charges. Increases in direct educational expenditures and fixed charges in
the transition aid districts were made possible mostly through reductions in other areas of
expenditures (primarily operation and maintenance). The exact proportion of new dollars
allocated to the budget categories varied across districts, however, reflecting district
decisions on where to target new or expanded programs or where to protect ongoing
services.
Relative rates of change. Table 6 compares the annual rate of change in expenditure
for total current expenditures, direct educational expenditures, operation and maintenance and
fixed charge; ::-. the first year of the QEA (1990-91 to 1991-92) with the annualized rate of
change for the preceding four years (1986-87 to 1990-91). Prior to the QEA, growth in
expenditures in the special needs districts in our study averaged about eight percent a year.
In the first year of the QEA, expenditures grew an average of 18 percent. However, there
were considerable variations across the five districts. For example, the QEA provided
relatively little more revenue in SN1 and SN5, while the rate of spending increases grew
four-fold in SN3.

Table 5Changes in Current Expenditures, by Category, 1990-91 to 1991-92
District Changes
Percent of Increased Expenditures Allocated to Each Category
inCurrent
Expense/pupip
DirectEduc.
Expense2
Operat/Mainten
Transport-ation
FixedCharges' Other'
SN 1 826 28% 17% 3% 31% 20%
SN 2 1,197 44% 33% 2% 18% 2%
SN 3 1,542 53% 18% 2% 19% 8%
SN 5 645 46% 5% 3% 44% 0%
i FN 1 909 56% 12% 5% 24% 1%
2 341 125% -58% o%
TR 45urce: School district Advertised Budgets, Spring 1992. figures based on actual expenditures; -
based on revised appropriations.
Defined as J -1 Current Expenditures. It excludes teacher retirement and social security costs.
2 Direct Educational Expenses are defined as the sum of the following budget line items: instruction, attendance and
health services, student body activities, special education and other special needs programs.
Fixed Charges includes insurance costs and tuition paid to other school districts. It excludes teacher retirement and
social security costs.
The 'Other" category is the sum of budget line items for administration, community services, sundry accounts and
special projects (local).
s Comparable figures were not available for this district because it uses program, rather than line item, budgeting.
26
The QEA did enable the special needs districts to spend relatively more in the three
major budget categories. For example, prior to the QEA, the special needs districts in our
sample increased their spending on direct educational expenses by five to seven percent a
year. In the first year of the QEA, their spending in this category increased, on average, by
about 15 percent, although there was considerable variation across the special needs districts
in the sample. Similarly, spending on plant operation and maintenance jumped from an
average increase of about four percent to about 30 percent across the five districts (again
with considerable variation within the sample). Spending on fixed charges in our sample
doubled, going from an average annual increase of about 14 percent to about 28 percent.
Two of the transition aid districts (TR! and TR2) maintained their rate of spending on
direct educational expenses, an increase of about six percent a year. Since these districts
limited the growth in their education revenues to only two to four percent, respectively (see
Table 4), they had to limit spending growth in other areas. Thus, they chose to cut
expenditures on plant operation and maintenance and to reduce the rate of growth in fixed
charges. The third district (TR3), which spent up to cap, put relatively more resources into
fixed charges, and less into direct education expenses and plant operation and maintenance
than in previous years.
27
29
Table 6
Annual Rate of Change in Expenditures, by Category
.Annual Rate of Change in Expenditures, by Category
District TotalCurrentExpense'
Direct Educ.Expense'
Operation andMaintenance Fixed Charges3
FY87-FY91
FY91-FY92
FY87-FY91
FY91-FY92
FY87-FY91
FY91-FY92
FY87-FY91
FY91-FY92
SN 1 11%4 14% 11%4 7% -1 %4 26% 17%4 16%
SN 2 10% 21% 7% 15% 8% 74% 21% 16%
SN 3 6% 28% 7% 25% -2% 36% 12% 29%
SN 4 6% 20% 5% 17% 2% 15% 13% 36%
SN 5 6% 10% 5% 8% 6% 4% 9% 28%
FN 1 13% 17% 11% 16% 12% 16% 23% 23%
FN 2 9% 9% 8% 6% 5% 0% 19% 28%
TR 1 8% 3% 6% 5% 10% -3% 15% 3%
TR 2 7% 4% 6% 7% 6% -16% 12% 6%
TR 3 11% 6% 9% 4% 11% 2% 17% 28%
TR 45 8% -1%rce: School district Advertised Budgets, 1989 -1992. figures are based on actual expenditures;
FY92 figures are based on revised appropriations.
' Defined as J-1 Current Expenditures. It excludes teacher retirement and social security costs.
2 Direct Educational Expenses are defined as the sum of the following budget line items: instruction, attendance and
health services, student body activities, special education and other special needs programs.
3 Fixed Charges includes insurance costs and tuition paid to other school districts. It excludes teacher retirement and
social security costs.
Annual rate of change for FY89 to FY91. Data for FY87 and FY88 were not available.
Shows changes in Current Expense Revenues rather than Current Expense Budget. Comparable figures were not
available for this district because it uses program, rather than line item, budgeting.
28
30
Changes in per pupil expenditures. While the rate of change differed across the
districts, many of the districts in the sample showed similar per pupil changes in direct
education expenses and fixed charges (Table 7). For example, all but two of the transition
aid districts spent about $250 to $300 more per pupil on fixed charges. Thus, regardless of
expenditure level, wealth, or amount of new education revenues, districts were faced with
comparable bills for health insurance, special education tuition, etc. Increased spending on
direct educational expenditures ranged from $235 to $817 per pupil in the special needs
districts, $261 to $508 in the foundation aid districts and $186 to $425 per pupil in the
transition aid districts in our sample. The special needs districts did increase their spending
on plant operation and maintenance more than the other districts in the sample. Two of the
special needs districts increased their "other" costs by over $100 per pupil, but in both cases
less than half of that increase was in administrative costs.
WHERE THE DISTRICTS STAND IN 1991-92
How did these changes affect the districts' status in 1991-92? To what extent did the
QEA enable the special needs districts to catch up with the wealthier communities in the
state? Table 8 shows current expenditures per pupil for each of the sample castricts in 1991-
92. The QEA narrowed the spending gap between the special needs districts and the
transition aid districts in the sample, but large disparities remain. For example, the five
29
31
Table 7Changes in Current Expenditures, by Category, 1990-91 to 1991-92
District Changesin
CurrentExpense/
Pupil'
Change in Expenditures per Pupil, by Category
DirectEduc.
Expense2
Operat./Mainten.
Transport-ation
FixedCharges' Other'
SN 1 $826 $235 $142 $28 $256 $165
SN 2 1,197 530 399 29 212 27
SN 3 1,542 817 279 33 294 119
SN 4 966 517 87 58 315 -10
SN 5 645 298 32 18 280 6
FN 1 909 508 106 44 242 10
FN 2 677 261 - 2 48 366 4
TR 1 265 262 - 46 11 40 - 3
TR 2 340 425 -199 28 89 - 3
TR 3 420 186 19 -17 295 -62
TR 4' -45MININSI:
urce: School district Advertised Budgets, Spring 1992. figures are based on actual expenditures; -
92 figures are based on revised appropriations.
' Defined as J-1 Current Expenditures. It excludes teacher retirement and social security costs.
2 Direct Educational Expenses are defined as the sum of the following budget line items: instruction, attendance andhealth services, student body activities, special education and other special needs programs.
3 Fixed Charges includes insurance costs and tuition paid to other school districts. It excludes teacher retirement and
social security costs.
The "Other" category is the sum of budget line items for administration, community services, sundry accounts and
special projects (local).
3 Comparable figures were not available for this district because it uses program, rather than line item, budgeting.
30
special needs districts spent, on average, about $4000 per pupil on direct educational
expenditures in 1991-92, compared to $6,000 per pupil in two of the transition aid districts
(TR1 and TR2). This $2,000 disparity is $300 lower than the previous year (See Table 3B).
When these expenditures are adjusted to account for student needs (educational expense per
weighted pupil), we find that these two transition aid districts still spend about $2,300 more
than the special needs districts. Although several of the special needs districts used their
QEA dollars to increase spending on plant operation and maintenance, their average per pupil
spending in this category is still about $300 per pupil, or 30 percent, lower than that of the
transition aid districts.
While the special needs districts have fewer resources for direct educational programs
and plant operation and maintenance, they still spend about the same on fixed charges as do
the foundation aid and transition aid districts.
PERSONNEL, PROGRAM, AND MATERIAL CHANGES
The districts in our study made two kinds of non-fiscal changes in the first year of the
QEA: 1) changes in personnel, materials, equipment, and facilities; and 2) changes in
programs.
PERSONNEL AND MATERIAL CHANGES
Non-programmatic changes took several forms, including personnel, materials and
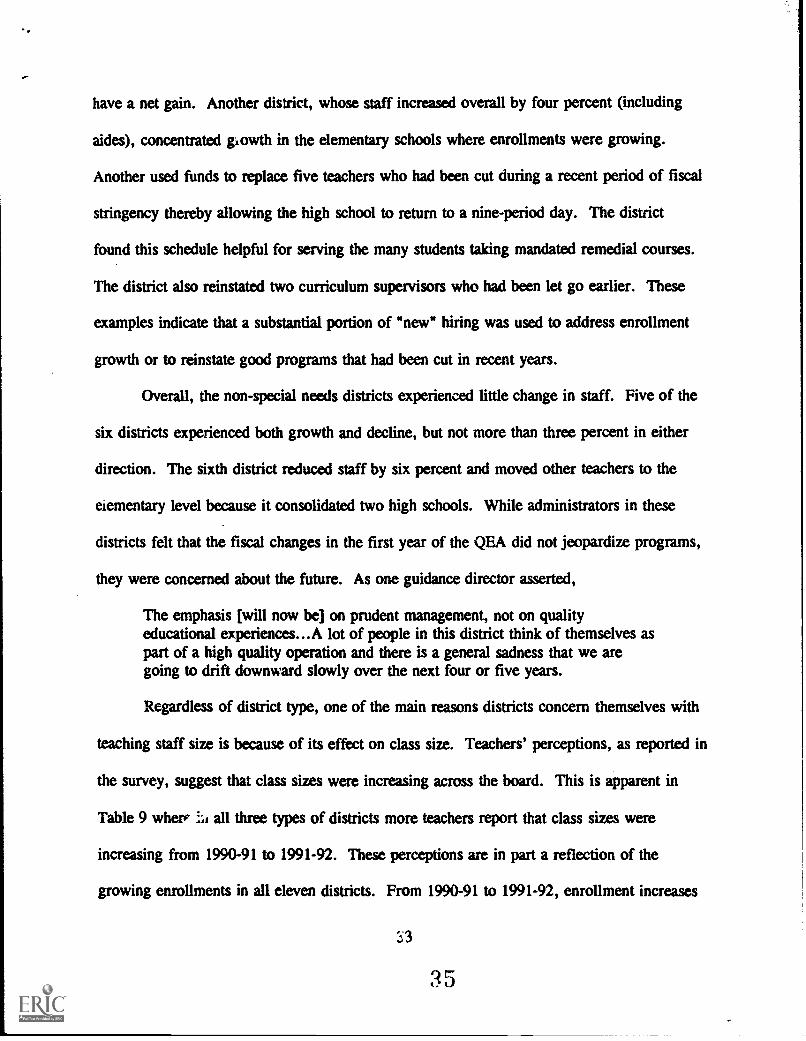
equipment, and space. Three of the five special needs districts increased the number of staff
by four to nine percent. The patterns of hiring differed substantially among districts,
however. For instance, the district that hired the fewest personnel cut teaching staff by two
percent at the high school level, but increased maintenance and secretarial staff enough to
31
33
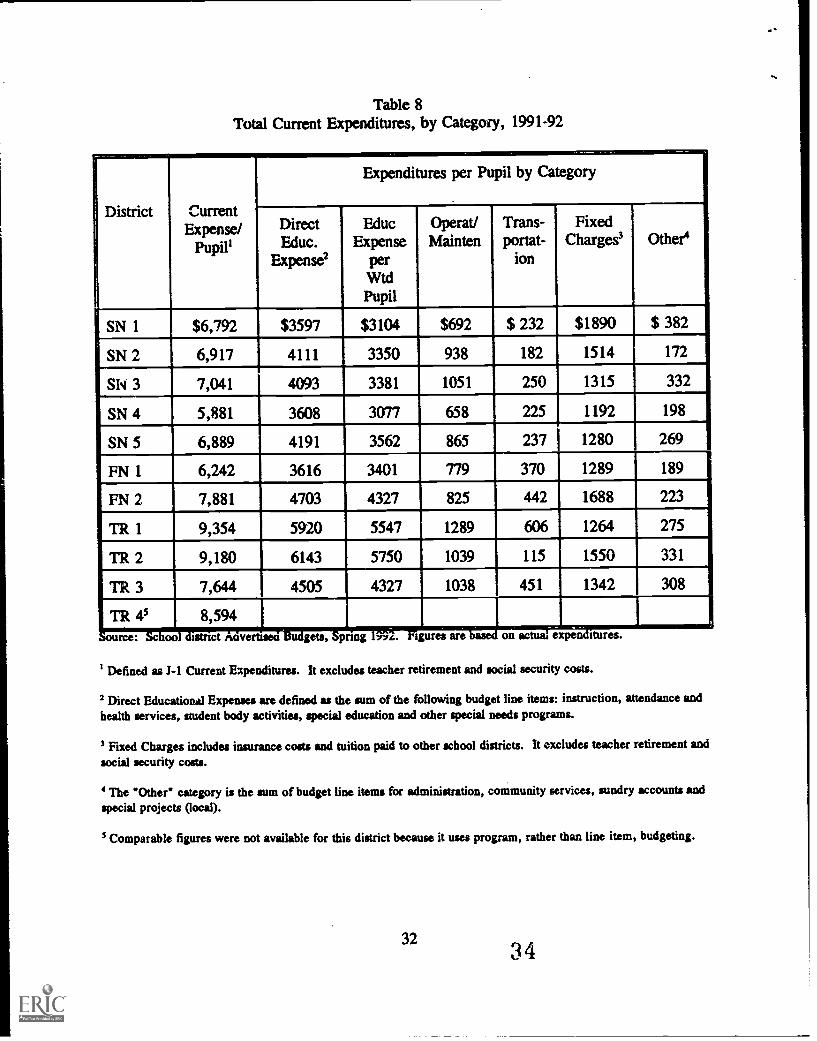
Table 8Total Current Expenditures, by Category, 1991-92
District
,
CurrentExpense/
Pupil'
Expenditures per Pupil by Category
DirectEduc.
Expense.'
EducExpense
perWtd
Pupil
Operat/Mainten
Trans-portat-
ion
FixedCharges' Other'
SN 1 $6,792 $3597 $3104 $692 $ 232 $1890 $ 382
SN 2 6,917 4111 3350 938 182 1514 172
SN 3 7,041 4093 3381 1051 250 1315 332
SN 4 5,881 3608 3077 658 225 1192 198
SN 5 6,889 4191 3562 865 237 1280 269
FN 1 6,242 3616 3401 779 370 1289 189
FN 2 7,881 4703 4327 825 442 1688 223
TR 1 9,354 5920 5547 1289 606 1264 275
TR 2 9,180 6143 5750 1039 115 1550 331
TR 3 7,644 4505 4327 1038 451 1342 308
TR 45 8,594.-rce: School district Advertised Budgets, Spring 1992. Figures are based on actual expenditures.
' Defined as Current Expenditures. It excludes teacher retirement and social security costs.
2 Direct Educational Expenses are defined as the sum of the following budget line items: instruction, attendance andhealth services, student body activities, special education and other special needs programs.
Fixed Charges includes insurance costs and tuition paid to other school districts. It excludes teacher retirement andsocial security costs.
The "Other" category is the sum of budget line items for administration, community services, sundry accounts andspecial projects (local).
s Comparable figures were not available for this district because it uses program, rather than line item, budgeting.
3234
have a net gain. Another district, whose staff increased overall by four percent (including
aides), concentrated growth in the elementary schools where enrollments were growing.
Another used funds to replace five teachers who had been cut during a recent period of fiscal
stringency thereby allowing the high school to return to a nine-period day. The district
found this schedule helpful for serving the many students taking mandated remedial courses.
The district also reinstated two curriculum supervisors who had been let go earlier. These
examples indicate that a substantial portion of "new" hiring was used to address enrollment
growth or to reinstate good programs that had been cut in recent years.
Overall, the non-special needs districts experienced little change in staff. Five of the
six districts experienced both growth and decline, but not more than three percent in either
direction. The sixth district reduced staff by six percent and moved other teachers to the
elementary level because it consolidated two high schools. While administrators in these
districts felt that the fiscal changes in the first year of the QEA did not jeopardize programs,
they were concerned about the future. As one guidance director asserted,
The emphasis [will now be] on prudent management, not on qualityeducational experiences...A lot of people in this district think of themselves aspart of a high quality operation and there is a general sadness that we aregoing to drift downward slowly over the next four or five years.
Regardless of district type, one of the main reasons districts concern themselves with
teaching staff size is because of its effect on class size. Teachers' perceptions, as reported in
the survey, suggest that class sizes were increasing across the board. This is apparent in
Table 9 whep' Li all three types of districts more teachers report that class sizes were
increasing from 1990-91 to 1991-92. These perceptions are in part a reflection of the
growing enrollments in all eleven districts. From 1990-91 to 1991-92, enrollment increases
35
in the special needs districts ranged from one to six percent, with an average increase of 2.7
percent. Increases in the non-special needs districts ranged from two to 4.5 percent, also
with an average increase of 2.7 percent. However, in the survey, the percentage of teachers
reporting increases in class sizes was larger in the non-special needs districts than in the
special needs districts.
Respondents in the special needs districts reported small increases in materials,
equipment, and facilities, often intended to "play catch up" with other districts. As one high
school teacher in a special needs district said, "There is such a disparity between urban and
suburban districts. We don't have QEA here. I'd like to see [this school] become like [one
of the state's best known high schools located less than ten miles away]. It would take
dramatic changes in funding to get us there." In responses to the survey (Table 9), most
teachers in the special needs districts did not note a dramatic change. However, of those
who reported a change, more teachers said the amount of materials and resources declined
than increased, although the difference was very small.
34

Table 9Percent of Teachers Reporting Various Forms of Support
had Increased or Decreased
SPECIAL NEEDS FOUNDATION AID TRANSITION AID
CHANGESIN
Incrsd Decrsd Incrsd Decrsd Incrsd Decrsd
Class sizes 35
14
44
7
48
5
Availabilityof materials
15
21
4
32
7
26
Resourceavailability
14
18
7
24
8
26
Preparationand planningtime
17
12
10
15
5
14
According to the interviews, changes in materials purchased in the non-special needs
districts were rather minor, although they were definitely in the direction of reducing
availability. Some districts delayed purchasing new equipment for a year, and one began
salvaging dysfunctional computers for parts to use on those that still worked. Several
districts reported that their supply purchases were more limited than in the past, but most
noted that they had enough stockpiled from past years to avoid problems during 1991-92.
This pattern of reduction is somewhat born out by the survey (Table 9). In fact, the large
majority of teachers report that the availability of resources and materials remained the same.
35
'37
Yet of those who had seen a change, most reported availability declined during the first year
of the QEA. In fact the proportion reporting declines is larger in the foundation and
transition aid districts than in the special needs districts. When one subtracts the percent
reporting material decreases from the percent reporting increases in the special needs
districts, the difference is -6 percent. That difference is -28 percent in the foundation aid
districts and -19 percent in the transition aid districts. The pattern is similar for resource
availability.
In a perverse way then, the gap between the special needs districts and the others in
resources and materials was declining. Yet, special needs districts still had some way to go
to catch up with the other districts. Table 10 uses survey data to illustrate the differences in
materials between the three categories of districts. Whatever materials teachers might need
were most adequately provided in the transition aid districts and least well provided in the
special needs districts with the foundation aid districts typically falling closer to the wealthier
ones.
The most striking problem in the special needs districts concerned space. None of the
districts had adequate space, and what was available had often suffered from hard use and
years of delayed maintenance. A typical comment from both principals and central office
administrators -- when asked about class size -- was that even if they could hire more
teachers, they had no place to put them. The QEA did not directly increase funding for
facilities; proposals for a state bond issue to fund new schools languished in the Legislature.
Several of the special needs districts used current expense funds to address facilities
problems. One district (SN2) decided to make facilities its top priority, building at least two
36
33
Table 10Reported Adequacy of Conditions in Different Types of Districts
SPECIAL NEEDS FOUNDATIONAID
TRANSITION AID
Textbooks 2.87 3.11 3.30
Computers 1.97 2.32 2.63
Notebooks andpaper
2.72 3.15 3.30
Pens and pencils 2.59 3.05 3.11
Workbooks 2.48 2.88 3.04
Lab equipment andcalculators
1.88 2.35 2.88
1 = very inadequate 4 = very adequate
new structures (through a lease-purchase agreement) and renovating several others to get
more space. This district minimized increases in other budget areas to support this priority.
Two other districts undertook efforts to refurbish existing buildings, sometimes on what was
a rather substantial scale. A fourth district expanded science laboratories in several
secondary schools and installed new computer laboratories.
PROGRAMMATIC CHANGES
The pattern of programmatic change in these eleven districts includes moderate
increases in some areas in special needs districts, and very small contractions which in some
cases may have been a reduction of waste or excess in some transition aid districts. These
changes are summarized in Table 11; boldface type is used to note cells where the largest
change occurred.
The biggest changes in the special needs districts were intended to help students
37
prepare for school and stay in school, and/or support the efforts of teachers inside the
classroom. The largest areas of program development was in health and social services. All
special needs districts undertook change in this area, but their specific programs differed
substantially. The two other areas with the high levels of activity were after school programs
(including summer and Saturday programs) and staff development.
Many changes affected health and social services in the special needs districts. To
begin, three districts expanded or created parent programs. Most of the programs were
designed in the form of small workshops, which met either on Saturday mornings, during the
day, or after school. These programs usually included a mixture of peer support, GED
courses, and open discussions of topics such as parenting skills, nutrition, mental and
physical health, and problem solving. Sometimes the programs were parent-run and
occasionally, day care was provided to make the services more accessible. In one district,
although all parents were welcome, many classes showed low participation rates. Still, some
schools did report regular attendance of 12 to 15 parents. Other types of programs were
large lectures or open houses. The reported goals of these programs included improving
parental trust in the schools, increasing parental involvement in the educational lives of their
children, and making the schools more "available to the parents" and more "family-
oriented."
Two districts made major investments in school-based health/social services centers in
their secondary schools. In one of these districts, both the high school and middle school
centers were funded by another state agency. The other district piloted and then permanently
established a clinic in one high school with funding from other sources. The clinic's success
38 40
Table 11Illustrative Programmatic Changes
SPECIAL NEEDS DISTRICTS OTHERDISTRICTS
HEALTH ANDSOCIALSERVICES
INCREASED COUNSELOR STAFF
3 DISTRICTS INCREASED PARENTPROGRAMS
2 CREATED OR EXPANDED TEENCENTERS/HEALTH CLINICS
2 INCREASED COORDINATION WITHSOCIAL SERVICE AGENCIES
SMALL REDUCTIONS IN STAFF
AFTER SCHOOL/SUMMERPROGRAMS
4 DISTRICTS ADDED NEW AFTERSCHOOL PROGRAMS
2 ADDED OR EXPANDED SUMMERPROGRAMS
1 DISTRICT CUT SUMMER SCHOOL
STAFFDEVELOPMENT
INCREASED FUNDS FORCONFERENCES AND IN-SERVICE TRAINING
FEWER CONFERENCES ANDWORKSHOPS
CURRICULARENRICHMENTPROGRAMS
2 DISTRICTS MADE SMALL ADDITIONSIN GIFTED AND TALENTED
1 DISTRICT SHIFTED SOME COSTS TOPARENTS
EXTRA-CURRICULARENRICHMENTPROGRAMS
2 DISTRICTS ADDED NEW SPORTS,BAND, STORYTELLING, DANCE
2 ADDED ENRICHMENT PROGRAMSFOR CHILDREN OF WORKING PARENTS
SMALL CUTS IN SPORTS, COACHES,INTRAMURALS
ALTERNATIVESCHOOLS
1 DISTRICT ADDED PROGRAM
1 DISTRICT REINSTATED PROGRAM
EARLY CHILDHOODPROGRAMS
2 DISTRICTS ADDED CLASSROOMS FORPRESCHOOL AND FULL DAYKINDERGARTEN
ELECTIVES/"SPECIALS"
SMALL INCREASES AT ELEMENTARYLEVEL IN 2 DISTRICTS
AT HIGH SCHOOL LEVEL IN 1DISTRICT
SMALL CUTS MADE OR ANTICIPATED
ACADEMICPROGRAM
NEW STATE TESTS CAUSED CHANGESIN BSIP
NEW STATE TESTS CAUSED MODESTCHANGES IN BSIP IN 2 DISTRICTS
39
so impressed the district that it decided to use the QEA funds to start such a program in
another high school.5
Three special needs districts have hired additional counselors, and the other twa have
redeployed staff in order to make more counseling services available in what are seen as
critical areas. Often these are substance abuse counselors. In addition, at least two districts
made active efforts to work with social service agencies to coordinate services for students.
Sometimes these efforts take the form of task forces to bring health, job placement, and
criminal justice workers together with educators. In other cases, new program and space
designs are being developed to incorporate these staff as regular parts of school operations.
Because the out-of-school environments in the non-special needs districts are more
hospitable than those in the special needs districts, the need for social and health services is
less pressing. These districts generally have the typical cadre of counselors, nurses, child
study teams and the like found in most American schools. The foundation aid and transition
aid districts in the sample made very few changes in these areas. The only noticeable change
was a small reduction in counseling staff, sometimes because people left and were not
replaced, sometimes because special support for substance abuse counselors not in the regular
budget was discontinued, and occasionally because full-time counselors were asked to teach a
few classes to help with the student load.
In addition to the major focus on social and health services, all special needs districts
extended the school day through voluntary after school, Saturday, or summer programs.
These took various forms. One district sponsored after school homework centers in all its
schools. These centers were open three days a week from 3:00 to 5:00 p.m. to help students
40
42
do homework. They were staffed by two teachers, two aides, and an administrator, all paid
extra for their work in the center. The programs provide incentives to get students to come,
ranging from snacks to tee shirts to a field trip for regular attendees. Another district which
had planned to hold a massive summer school, including both remedial and enrichment
activities, was constrained by lack of funds.
Two non-special needs districts had voluntary extended day programs that were
affected by the QEA. One chose to eliminate a K-12 summer school which had emphasized
skills maintenance and enrichment activities. Another district decided not to eliminate a
Saturday academic enrichment program, instituting instead a fee for participation.
Finally, the amount of staff development offered to teachers in special needs districts
expanded considerably in many schools. Districts focused this expansion in two main areas.
First, new funds were used to augment and improve traditional workshop settings -- during
the school day and Saturdays. States one teacher, "these [in-service workshops] are really
worth going to. In the past you just sat through them, but these are helpful." Second, new
funds created in-service training to support other new programs and reforms, such as
cooperative learning, whole language, Corner Schools, site-based management, and the new
high school graduation test. For example, one counselor asserted that her extended training
in site-based management "has developed into something fantastic." To support these types
of changes, one district has hired a full time staff development coordinator to maintain a
regular schedule of events for teachers.
Teachers in transition aid districts experienced either no changes in staff development
opportunities or very small reductions. For the most part, these did not appear severe. A
41
43
principal in one school said the district would no longer support "extras" when teachers
traveled to workshops. In another district, a principal reported that for the first time in
memory, there would be a spending cap on the amount spent on staff development. Still,
where there was a need, staff development took place. Another transition aid district that
introduced whole language instruction actually increased staff development spending to
support the effort.
Changes in staff development were also born out by the teacher survey data. When
asked about opportunities to develop new skills, twice as many teachers from special needs
districts responded that their chances had increased (29 percent) as said they had decreased
(12 percent). Approximately as many teachers from the other districts replied that their
opportunities had increased as decreased (21 percent versus 20 percent in foundation aid
districts and 21 percent versus 21 percent in transition aid districts). In the related area of
preparation and planning, differences were similar, although teachers were generally less
positive about this area. A few more of those from special needs districts reported increases
as opposed to decreases (17 percent versus 12 percent). However, more teachers from the
foundation aid districts reported reductions (15 percent) than increases (10 percent). The
difference was even greater in the transition aid districts where five percent reported
increases and 14 percent reported decreases.
Outside these three areas of focused attention (social/health services, after school
programs, and staff development), the special needs districts had great expectations, but were
not able to mount substantial changes. One area where developments were planned, but
moved slowly, was in academic enrichment programs operating during the regular school
42
44

day. Two districts made small additions to their gifted and talented program. One hired a
coordinator who was still largely planning new programs at the end of the year. Another
piloted a grant-funded program which expanded the definition of gifted and talented to
include students who are gifted creatively as well as academically. It was designed to
replace the more exclusionary pullout program. A third district did not change its gifted and
talented program, but did add a few additional Advanced Placement courses.
All the non-special needs districts had some form of academic enrichment programs
for academically talented students. These gifted and talented programs are very popular and
considered quite important, especially where the proportion of students going to competitive
colleges is high. One transition aid district had to cut staff in this area so the program was
reduced, but not eliminated. Another planned to make a similar cut, but did not have to do
so yet. The transition aid districts also had a variety of small special programs for students
not meeting district achievement standards. These students could be seen as at-risk in the
context of these highly competitive districts, although they probably would not have been in
the special needs districts. Two districts had to cut staff working with these students.
In addition to the gifted and talented programs during the regular day, three special
needs districts expanded their extracurricular offerings. in two districts, this expansion was
in non-academic areas. Some of these were in traditional high school activities; districts
added more sports and clubs and expanded their bands and cheerleading teams. There were
also some more novel developments like a storytelling program for younger children. Two
districts also created extracurricular programs with a more academic bent. For example, one
principal noted, "There is a Saturday morning enrichment program for students in grades one
43
5
to five to encourage them to think about staying at [name of district] High School for high
school, to prevent the best students from opting for private or. Catholic school." The
principal also reported that many of these extracurricular and enrichment programs preceded
the QEA, but because of new funds they "were able to almost double everything."
Non-special needs districts had to reduce their extensive extracurricular programs.
Three of the transition aid districts reduced their coaching staffs. These changes affected
minor sports, junior varsities, and intramurals, but left the major sports essentially intact.
One of these districts also reduced the amount of non-sports programming, including those
for younger students, and shifted the cost of other activities to parents by charging a fee.
For students who need even more help than extra programs can provide, two special
needs districts also added alternative programs. In one case, the program was not new, but
the reinstatement of an operation that had recently been cut out of the budget for lack of
funds. One district developed its alternative school to help alleviate discipline problems in its
middle schools. The new school was geared to middle school students who were two or
three years older than their peers, some of whom had recently been released from jail.
These students were described as not fitting into the regular school, but "not classifiable",
i.e., not eligible for special education. In the first year, new funds paid tuition to send
fifteen of them to a special facility outside the district. However, an old elementary school,
now too small to serve that purpose was being refurbished to house 200 of these students in
the future.
Early childhood education services was yet another area where development was
anticipated but forestalled. Four of five districts hoped to initiate or expand services in this
44
area, but all faced space constraints. One district tried to overcome this problem by
obtaining space in non-school facilities. The two largest districts in the study did manage to
expand their pre-kindergarten and full-day kindergarten services, but only by a few
classrooms. In one district, some private foundation money supported part of this
development.
Two kinds of changes were apparent in the regular academic program. First, three
districts expanded elective offerings. One district hired three new high school teachers to
expand home economics, industrial arts, and physical education offerings. To support this
change the high school reinstated its nine period day which had been cut previously due to
budget tightening. Thus, students with heavy remedial course loads could still take elective
courses. Two other districts added elementary art, music, and physical education specialists
so more specialized instruction could be offered in these areas.
The non-special needs districts experienced minor shrinkage in electives. All four
transition aid districts laid off some staff in this area. One district reduced the staff in a K-
12 music program that some people thought had become overdeveloped, and in a small
program for academically talented minority students. The other three transition aid districts
reduced high school art/music and foreign language staff. Such changes were not noted in
the foundation aid districts.
The most significant change in the core curriculum in the special needs districts was
not so much a response to the QEA as to the state's shift to the new high school graduation
test. This test will be more challenging than that used previously. Although the graduating
class of 1995 will be the first affected, districts are already changing both regular and
45
47
remedial curriculum. Teachers are finding these changes challenging, as shown by the
following statements of two high school teachers:
The problem is that the test is in flux. They are not sure how to train us...We'vebeen spoon feeding students in mathematics before. Now, we have to teach themhow to think. If you ask them a question, they can think it through, but they can'tput it on paper.
[The new test's] focus is different. The interaction of reading and writing. There isless teaching in isolation...In English we have to teach more drawing conclusionsfrom an entire package. In math there is more critical thinking, more "what if"questions, and more open-ended questions.
These changes did not require special funds although they did (or would) entail a substantial
amount of staff development and the purchase of textbooks better aligned with the new tests.
However, they were already absorbing a great deal of staff attention.
Two non-special needs districts anticipated that the new state graduation tests would
create additional academic challenges for their students, but these challenges were not
expected to be as grave as in the special needs districts. The typical anticipated effect was a
slight increase in the size of remedial high school classes.
STATE VS. LOCAL INITIATIVE
Because of the widespread perception that special needs districts were getting large
increases of funds that would be wasted and mismanaged, state oversight of program change
focused on the special needs districts. Both the county monitoring system that preceded
QEA and the new Division of Urban Education devoted a substantial part of their energies to
controlling the actions of these districts. Yet, considerable past research suggests that a
variety of local contextual factors can overwhelm policy initiatives (Fullan, 1991) and that
state policy leads to the most constructive change when it is accompanied by supportive local
46
43
initiative (Firestone, 1989). When one looks at the reasons for the changes special needs
districts made in 1991-92, several forms of state influence were quite apparent, but local
factors also played a major role.
One clear state influence was the Education Improvement Plan procedures established
by the Department of Education. As described earlier in this paper, the special needs
districts were required to prepare EIPs in response to recommendations generated by the
external review teams. The plan format required cost itemization and justification for
proposed items in terms of the External Review Team reports.
Clearly, this process had a great deal of impact on the districts. Although staff found
the process particularly frustrating because state aid allocations were reduced in mid-
planning, one superintendent reflected that the EIP was very useful because it encouraged the
district to take a longer term view when planning. Nevertheless, there were limits to the
usefulness of this process for getting special needs districts to make specific changes. For
instance, one improvement the Department of Education encouraged districts to adopt was
early childhood education, a special concern to the Governor. Yet, steps in these directions
were extremely slow. Because of space constraints, only two of the five districts added even
a few early childhood classrooms. There was also an interest in encouraging site-based
management. While we looked for evidence of this change, the main sign we found was
training on that topic listed in EIPs for all five districts. Interviews with teachers and
principals revealed no substantial delegation of authority to schools in what appeared to be
rather centralized districts.
47
49
Y
There were some other problems with the state directed planning process itself. For
instance, the state impeded the implementation of some recommendations. One theme in the
state's recommendations was that districts engage in more long-term planning. Yet, during
the planning year, one of the major obstacles to such planning was the state's inability to set
and stick with a figure for state aid for the coming year. Since most of the districts' income
came from the state, considerable instability resulted.
The other state policies that noticeably affected district efforts were state testing and
monitoring requirements. Districts' success at escaping Level II and Level Ill monitoring
and avoiding takeover depended in part on student test achievement in grades three, six, and
nine (HSPT). In the short run, two districts were especially concerned about the
achievement tests. One, which was undergoing Level III monitoring, had been told it would
be certified if it could slightly raise average scores on one test in one grade and maintain
scores in other areas. Another was at risk of being placed in Level III monitoring again
because scores in one grade in one subject had fallen too low. In the longer run, district
administrators remembered earlier times when they underwent monitoring and public
opprobrium because their graduation test scores were so far behind those in wealthier
districts. Special needs administrators feared that if graduation test scores fell dramatically
when the new, more challenging test was implemented, their districts would again be at risk
for state takeover at worst, or increased humiliation and loss of public support at best.
While concerns about testing and monitoring were most pressing in the special needs
districts, they were also apparent, although to a lesser extent, in other districts.
At the same time, local concerns played a major role in local planning. The
48
5i
1

bifurcation in state and local influences is quite apparent in one district where two local
themes ran through many initiatives in the EIP. One theme championed internally by an
associate superintendent was a series of workshops, text purchases, and other developments
intended to respond to state testing irindates. The other theme, advocated by the
superintendent, stressed expanding social services to shore up the child and its family. This
theme was apparent in efforts in some schools to integrate social services into their
operations through the introduction of health clinics with social service components, after
school programs for parents and students, and other programs. Moreover, several of what
were portrayed as new programs in the district's plans had their roots in pilot efforts or
related smaller scale programs from previous years.
More generally, five local influences affected district planning. The first was local
improvement agendas. Four of the five special needs districts had imnrovement goals that
preceded the QEA. These varied in their coherence. Moreover, sometimes an
"improvement agenda" included reintroducing what were locally perceived as good programs
that had been cut earlier, rather than creating truly new programs. Still, these districts also
had their own ideas that they were trying to implement. Often these ideas included
responding in varying ways to the difficult environment the schools were in and that students
faced in the rest of their lives.
The second influence was the strength of the local administration. The one district
that did not have its own agenda stood out from the others in its general lack of internal
coherence. There appeared to be two major reasons for this limited unity. First, the district
had an acting superintendent, and more than one central office administrator was
4,:) 9
campaigning for the top position. Second, the administration was divided formally because
the business manager reported directly to the board rather than to the superintendent. As a
result, program people often did not know how much money they had to spend. In this
climate, mid-level administrators were generally loath to take any initiative.
The third influence was contract requirements. The two districts that added
elementary music, art, and physical education taught by specialists did so primarily in
response to contract settlements giving elementary teachers preparation twie each week.
Also, a certain percent of increased aid was obligated to contracted increases in teacher
salaries. In one special needs district, where teacher salaries are among the lowest in the
state, salary increases absorbed about half of the district's new revenues.
The fourth influence was the need to restore, repair, and replace equipment or the
urge to "catch up" by getting things for students in poor districts that appeared more
regularly in other districts. Part of the catch up problem was in the facilities area where
creating enough space to house valuable programs was a major problem. Another part was
making the space more useable and inviting to potentially alienated students (and staff).
Some of these districts had years of backlog of deferred maintenance (and sometimes hard
use). One member of the study team visited two high schools with nearly identical facades
and of nearly identical age. One was in a very tough neighborhood in a special needs
district, the other in a blue collar neighborhood in a transition aid district. The first building
was grimy and had graffiti in the halls and holes in the walls on the upper floors. It was
depressing and looked unsafe. The second, while showing its age was clean and relatively
cheery. One dimension of "catch up" rarely mentioned was getting buildings like the first in
50
52
similar shape to those like the second.
In addition to facilities problems, equipment was extremely old and sometimes items
like science labs, that more affluent districts took for granted, were simply not present.
Restoration and "catch up" were a major concern in decisions to buy science equipment,
computers, and other equipment and supplies.
Finally, all of the districts experienced demographic changes. All eleven districts
reported increases in student enrollment between 1988 and 1992. As one respondent in a
foundation aid district noted, from Fall 1990 to Fall 1991:
total enrollment rose by nearly 400 students...The number of students eligible for freeand reduced lunches rose by over 150, more than what might be expected as a resultof the rise in overall enrollment. The number of special education students increasedby 29, an increase somewhat higher than might be predicted given the proportion ofspecial education [students] in 1990.
Besides growth, the interviews also show another type of change in the special needs
districts. At least two of the districts reported large increases in the number of Hispanic
students, requiring an expansion of bilingual/ESL services. In the non-special needs
districts, the interviews did not contain much discussion of rising population growth.
However, one district is experiencing a "bulge at the K-three level" where the average class
size has increased between two and four students per class.
CONCLUSION
Two caveats should be offered to the findings reported here. First, while the
intensive analysis of a few districts helps to understand the links between changing fiscal
patterns and educational practice, it is difficult to generalize from eleven school districts to
the state as a whole. Thus, findings should be interpreted with caution.
51
53
The second caveat should be that since we only examined the first year of
implementation of QEA things could turn out to be very different in subsequent years.
While that is true, the history of QEA is proving to be very short. Early in the second year
of its implementation (1992-93) and well before any systematic assessment had been done,
perceptions of problems with the law had become so strong that the Republican Legislature
began acting to change it. Because the Republican proposal would have seriously reduced
funding for education overall, a coalition representing the major education associations in the
state and both rich and poor districts (and in substantial collaboration with the plaintiffs in
the Abbott v. Burke case who are still contesting the QEA II in court) proposed an
alternative measure. After several weeks of discussion, all sides agreed that the QEA could
not be revised again in time to affect funding for the 1993-94 school year. As a
compromise, a one-year interim funding bill was passed and a commission was formed to
recommend a new school finance bill to replace the QEA. Thus, the observation that
findings from the first year of a new policy should be judged with caution is more than
normally appropriate because it is likely that the policy itself will be modified.
Still, a few observations on New Jersey's efforts to equalize educational expenditure
between rich and poor school districts are in order. The first is that while the contribution of
the QEA to equalizing expenditures between rich and poor school districts was rather
modest, it did lead to noticeable increases in revenues and expenditures for the special needs
districts, especially in light of the small expansion in previous years. Growth in foundation
aid districts was more or less what had been experienced in the past. Increases in the
wealthier transition aid districts were smaller, but not because of reductions in state aid. The
failure of transition aid districts to keep pace with past growth must be attributed in large
measure to the slow growth in local tax revenues. In fact, three of those four districts failed
to tax themselves up to the state permitted cap. However, substantial disparities in education
expenditures remain between the special needs and transition aid districts.
The second point is that the public expectation that increases given to special needs
districts would be misspent did not seem to materialize. Expenditures generally went for
three purposes. Two of these, equalizing services and facilities between special needs and
other districts, euphemistically referred to as "catch up," and responding to the special needs
of disadvantaged students, reflect concerns raised in Abbott II and by school administrators.
The third, responding to increased costs forced on all school districts, was not specific to
urban areas.
Much of the cost of "catch up" appeared in the direct educational expenses category,
the one that grew most during the first year of QEA. "Catch up" funds began to give
children in poor school districts the staff, extracurricular activities, and other programs that
their counterparts in richer districts take for granted and that may help entice them to stay in
school. "Catch up" also included increased supply budgets, although the survey data suggest
that a substantial gap among districts still remained in this area. With the exception of one
district till t decided to take on its serious facilities problems, most districts did not make
large increases in operations and maintenance, although they did begin to cut into years of
deferred maintenance.
The poorer districts also increased the special services that their disadvantaged
clientele require. A good deal of money went for special programs to provide students with
53
after-school homework centers, access to a wider array of social services, more counseling,
and alternative services, and additional direct services to parents. Special efforts to help
students pass the HSPT may also fit in this category, since this test has a greater impact on
urban than suburban children. Small efforts were made to increase early childhood
programs, but space limits as much as fiscal constraints inhibited this development.
Finally, the special needs districts, like their more affluent counterparts, had to devote
a substantial part of their budgets to health benefits and other costs that fall in the category of
fixed charges.
While the special needs districts began to improve their operations, the other districts
more or less maintained the status quo. Changes in the foundation aid districts were small.
Increased revenues in the transition aid districts often did not fully keep up with costs, but
most administrators did not see a short run problem. For the most part, they were able to
maintain their core programs by trimming at the edges, deferring maintenance, and in one
case charging a fee for services. Thus, public fears that loss of state aid would substantially
undermine programs proved unfounded in 1991-92. Moreover, in several cases, the fiscal
constraints experienced would have been overcome if local taxpayers had been willing to tax
themselves up to cap.
54
5U
Yt
REFERENCES
Braun, R. J. (1991, January 24). More dollars don't seem to improve public schools.Newark Star-Ledger.
The debate that isn't. (1990, June 21). ThtfAntrallgiscalbintlituv.
Firestone, W. A. (1989). Using reform: Conceptualizing district initiative.educational Evaluation and Policy Analysis, IX), 151-165.
Florio, J. (1990, July 15). State to demand more form schools when it pumps in moremoney. Newark Star-Ledger.
Fullan, M. G. (1991). The new meaning of educational change. New York: TeachersCollege Press.
Goertz, M.E. (1992, November). The development and implementation of the QualityEducation Act of 1990. CEPA-NJ: Rutgers, The State University of New Jersey.
Hickrod, G. A. (1991, May). School finance constitutional litigation: Classification ofstates. Normal, IL: Illinois State University.
Hrevnack, J. (1991, April 21). New methods needed for cleaning up old mess of aneducation system. Newark Star-Ledger.
Most Jerseyans doubt plan will aid schools or spur tax relief. (1990, August 6). NewarkStar-Lalger.
Patton, M. Q. (1990). Oualitative evaluation and research methods. (2nd ed.) NewburyPark, CA: Sage.
The right questions. (1991, April). The New Jersey Educator.
School debate pits city against suburbs. (1990, December 7). The Philadelphia Inquirer, p.Bl.
Tax hikes sink Florio's ratings. (1990, July 15). Newark Star-Ledger.
Tyrrell. J. (1991, January 23). Whitman criticizes school aid, tax relief. Newark StarLt, P. 27.
Uncharted territory. (1990, June 10). The Central Jersey Home News, p. Al2.
Viewpoint: flawed school aid? (1990, November 11). Newark Star-Ledger.
55
57
ENDNOTES1. The material in this section is abridged from Goertz (November 1992).
2. The 1990-91 State budget was paired with a one-cent increase in the state sales tax andincreases in several excise taxes, A $1.3 billion income tax increase provided additionalfunds for aid to elementary and secondary education, for restructured property tax rebates,and for the State assumption of several county social services costs.
3. Additional schools were visited in the two largest districts. Because the very largestdistrict had K-8 schools and no middle schools, we visited six of these and two high schools.In the second largest district, we visited one of two high schools, two middle schools, andfive elementary schools.
4. Weighted enrollments are calculated as follows: the number of students in eacheducational need category (special education, bilingual/ESL education, "at-risk" students) wasmultiplied by that category's additional cost factor as embodied in the QEA. The sum ofthese products is that district's total "educational need units." Weighted enrollment is equalto total educational need units and total enrollment in a district. Thus, a district with 1000students and 200 educational need units would have a weighted enrollment of 1200.
5. Actual start-up was delayed because the state was slow in approving space changes
needed.
5(3
56