document resume ed 269 402 · three different bases of comparison were applied to the earning...
TRANSCRIPT
DOCUMENT RESUME
ED 269 402 SP 027 586
AUTHOR Bird, RonaldTITLE An Analysis of Competitive Salary Levels for Teachers
in the Public Schools of the Southeast. OccasionalPapers in Educational Policy Analysis. Paper No.418.
INSTITUTY1N Southeastern Regional Council for EducationalImprovement, Research Triangle Park, N.C.
SPJNS AGENCY National Inst. of Education (ED), Washington, DC.PUB DATE Nov 85NOTE 26p.PUB TYPE Reports - Research/Technical (143)
EDRS PRICE MF01/PCO2 Plus Postage.DESCRIPTORS *Comparative Analysis; *Public School Teachers;
*Salary Wag, Differentials; *Teacher Salaries;*Teaching (occupation); *White Collar Occupations
ABSTRACTBased on earning data from the U.S. Census Bureau's
1984 Survey of Income and Employment, this study estimates annualsalaries of persons in teaching and nonteaching occupations. Data wasanalyzed using the variables of education, work experience, sex,race, marital status, weeks worked annually, hours worked weekly,urban or nonurban residence, and college degree holder status. Basesof comparison through a range of earning alternatives included:characteristics of the existing teacher work force, characteristicsof the general nonteacher work force, and characteristics of thewhite male college-educated work force. Findings indicated thatcurrent teacher salaries are below alternative earning opportunitiesin other occupations by $6,718 for persons with the samesociodemographic characteristics as present teachers. When comparedwith nonteaching college-educated workers with t'le samesociodemographic characteristics, the figure was $10,268 less. Incomparison to estimated alternative earning opv,ortunity of white malecollege-educated workers in nonteaching jobs, the amount was $16,563less. (JD)
***********************************************************************Reproductions supplied by EDRS are the best that can be made
from the original document.***********************************************************************

p
OCCASIONAL PAPERSIN
r.i01-.1- EDUCATIONAL POLICY ANALYSISaN
mi
2
PAPER NO. 418
AN ANALYSIS OF COMPETITIVE SALARYLEVELS FOR TEACHERS IN THE
PUBLIC SCHOOLS OF THE SOT ZHEAST
Ronald Bird
November 1985
"PERMISSION TO REPRODUCE THISMATERIAL KO BEEN GRANTED BY
gi,L24:
TO THE EDUCATIONAL RESOURCESINFORMATION CENTER (ERIC)."
U.S DEPARTMENT OF EDUCATIOYOffice of Educational Resevrch and Improvement
EDUCATIONAL RESCURCES INFORMATIONCENTER (ERIC)
O This document has been reprodu4s4 asreceived Irom the person or organizationoriginating q
0 Minor changes have been made to improvereproduction quality
Points of view or opinions stated m this doc ument do not nfICOSSarq represent off.cialOE:11 position or policy
Southeastern Regional Council for Educational Improvement15,4
41 P.O. Box 12746 200 Park Suite 204 Research mangle Park North Carolina 27709 (919) 549/8216
NN
2

This activity was supported in wh le or in part by the NationalInstitute of Education, U. S. Departmen, of Education. The contents do notnecessarily reflect the position or policies of the U. S. Department ofEducation or the Southeastern Regional Council for Educational Improvementmember states' Departments of Education or their Chief State SchoolOfficers.
3

OCCASIONAL PAPERS IN EDUCATIONAL POLICY ANALYSIS
PAPER NO. 418
AN ANALYSIS OF CCMPETITIVE SALARYLEVELS FOR TEACHERS IN THE
PUBLIC SCHOOLS OF THE SOUTHEAST
Ronald Bird
November 1985
Southeastern Regional Council for Educational Improvement200 Park Offices, Suite 204, Post Office Box 12746
Research Triangle Park, North Carolina 27709
919/549-8216

TABLE OF CONTENTS
Page
Executive Summary
INTRODUCTION 1
METHODOLOGY AND STATISTICAL ANALYSIS 4
ESTIMATES OF EARNING OPPORTUNITY INNONTEACHING OCCUPATIONS
CONCLUSIONS AND RECOMMENDATIONS
REFERENCES
5

LIST OF Ti.,LES
Paye
TABLE 1 Average Teacher Salaries, 1982-1984 3
TABLE 2 Average Values of Variables for EachEarnings Comparison Basis 10
TABLE 3 Earning Opportunity Estimates inNonteaching Occupations Based on GeneralWork Force Characteristics 12
TABLE 4 Earning Opportunity Estimates inNonteaching Occupations Based on CurrentTeacher Characteristics
TABLE 5 Earning Opportunity Estimates inNonteaching Occupations Based on WhiteMale Characteristics
6
13
15

EXECUTIVE SUMMARY
Recent education studies have indicated the nced for higher teacher
salaries to attract and retain qualified public school teachers. An
analysis of earning opportunity in the Southeast for both teaching and
competing occupations was undertaken to provide a basis of comparison of
the adequacy of teacher salaries based on data for the 1984-85 school year.
This study refines the principle of comparability and initial empirical
estimates and updates the data presented in a previous report "Competing
for Quality: The Comparability of Teacher Salaries Lo Earnings in
Alternative Occupations" (Bird, 1985).
Based on earnings data from the U.S. Censua Bureau's 1984 Survey of
Income and Employment, the study estimates annual salaries of persons in
teaching and nonteaching occupations. The data set was statistically
analyzed using a multiple regression technique to enter the variables of
education, work experience, sex, race, marital status, number of weeks
worked annually, average hours worked weekly, urban or nonurban residence,
and college degree holder status.
Observations were included only for workers who had completed four or
more years of college and who worked 52 weeks at 40 hours a week to
represent a cross section of the various alternatives to employment as a
teacher. Three different bases of comparison were applied to the earning
estimation equation to develop a range of earning alternatives. These
bases for the Southeast were: characteristics of the existing teacher work
force, characteristics of the general nonteacher work force, and
characteristics of the white male college-educated work force. Utilization
of these three bases provides policy makers with a range of comparable
salary data.

The analysis indicates that current teacher salaries, despite recent
increases, are below alternative earning opportunities in other occupations
by $6,718 for persons with the same sociodemographic characteristics as
present teachers. When compared with nonteaching college-educated workers
with the same sociodemographic characteristics, the figure is $10,268 less.
In comparison to estimated alternative earning opportunity of white male
college-educated workers in nonteaching fobs, the amount is $16,563 less.
This report offers a range of comparison, with the above variables, to
suggest beginning and maximum salaries for teachers' pay to be competitive
with nonteaching earnings. Based on this analysis, competitive beginning
salaries would range from $16,836 to $22,279; average salaries to attract
and retain teachers would be $27,022 to $36,767; and the upper end of the
teacher salary schedule would range from $34,166 to $45,210.
ii

AN ANALYSIS OF CCMPETITIVF SALARY LEVELS FOR TEACHERS IN THEPUBLIC SCHOOLS OF THE SOUTHEAST
INTRODUCTION
The role of the classroom teacher is central to the goal of achieving
excellence in the public schools. Quality instruction requires that
intelligent, highly motivated, and creative people be attracted to work as
public school teachers, but such talented people are capable of performing
many other tasks in our economy and are in demand by private industry, the
professions, and government for other valuable pursuits. The job alter-
natives available to college graduates in other sectors of the economy
provide the basis of income-earning opportunity against which the public
schools must compete to attract and retain able teachers.
Almost every recent reform commission report and special study on
education has pointed to the need for higher teacher salaries. In a 1984
report entitled "Staffing the Nation's Schools: A National Emergency," the
Council of Chief State School Officers called attention to an emerging
shortage of teachers in the nation's schools, particularly in th3 Sunbelt
states (1984, p. 2). Inadequate pay in comparison to other career
alternatives was identified as a key contributing factor to the trend.
That view was supported in the findings of th3 Rand Corporation study
"Beyond the Commission Reports: The Coming Crisis in Teaching" (Darling-
Hammond, 1984). That study, and others, recognized the earning
opportunities of college-educated workers in nonteaching occupations as
providing the basis for comparison against which the adequacy of teacher
salaries must be judged. A previous Southeastern Regional Council study
"Competing for Quality: The Comparability of Teacher Salaries to Earnings

in Alternative Occupations" (Bird, 1985) applied that principle of compara-
bility and offered initial empirical estimates of the actual comparable
earnings amounts for teachers in the southeastern states. This report
represents the results of refining that method and applying the technique
to more recent data.
Teacher salaries are rising. IL the South, every state has enacted
some improvement An teacher pay in the last three years. Region-wide
average teacher salaries have risen from $17,549 in 1982-83 to $20,204 in
1984-85 (SETS Data Profiles, publication in process). That amount
represents an increase at an average rate of 7.5 percent annually during
the past two years. The average teacher salary levels for the past three
yeare in each southeastern state are shown in Table 1. It is clear from
that data that each state has made progress, but it must be noted that
while teacher salaries have been rising, the earning opportunities in other
occupations have been rising also. Based on data compiled for this report
from Census Bureau samples, the average earning opportunities of all
college-educated workers in nonteaching jobs in the region have risen at
an annual rate of 5,,6 percent during the same period. Therefore, the
relative improvement in the position of teachers has not been as great as
the absolute increases imply. Nevertheless, some progress has been made.
Accurate estimates of the appropriate standard against which the
adequacy of teacher salaries should be measured is needed in order to
project how far improvement must b'. pursued in order to make teaching fully
competitive with other occupations. This report is a refinement and
updating of estimates developed in an earlier study (3ird, 1985). That
study, based on 1983 data, recommended that average teacher salaries be in
the range of $17,793 to $23,889 in order to be comparable to alternative
2
10

TABLE 1
AVERAGE TEACHER SALARIES1982-1934
1982-83 1983-84 1904-85
U. S. Composite 20,715 21,935 23,546
Scutheast 17,549 18,429 20,Z04
Alabama 17,650 17,682 20,209
Arkansas 15,029 16,929 18,933
Florida 18,275 19,497 21,057
Georgia 17,412 18,631 20,494
Kentucky 18,385 19,660 20,100
Louisiana 18,420 18,400 19,690
Mississippi 14,320 15,812 15,971
North Carolina 17,585 18,311 20,691
South Carolina 16,523 17,384 19,800
Tennessee 17,380 17,910 20,080
Virginia 18,535 19,676 21,536
West Vriginia 17,322 17,489 19,563
SOURCE: SEIS data reports
earning opportunities of the college-educated work force in the Southeast.
As shown in Table 1, in that year the average teacher salary in the
Southeast was slightly less than the lower end of that range. That study
also recommended a starting teacher salary level of $18,257 and a scale
reflecting merit, experience, and educational development ranging upwards
to $29,241.
3 11

This report continues the use of the technique developed in that
earlier study, but it improves the estimates in two ways. First, this
report analyzes more recent data (based on the 1984 Current Population
Survey). This means that the estimates are more relevant to the needs of
present salary policy discussions. Second, this report is based on a
refined metnodology of identifying the data base for analysis and for
defining the structure of the estimation equations used. Details of the
improvements adopted and of the techniques used are presented in the
following section.
METHODOLOGY AND STATISTICAL ANALYSIS
The principle used to develop estimates of the alternative earning
opportunities of teachers is to examine the earnings of a large sample of
nonteaching, college-educated workers in the region and to relate their
actual earnings statistically to a set of observable variables that are
relevant to the characteristics of the teaching market. The result is an
estimate of annual salaries earned in nonteaching occupations by
individuals who share the same education and work experience
characteristics as teachers.
The critical assumption of comparieble earnings analysis is that the
probability of a person's choosing to enter the teaching occupation will
rise as the average salary of teachers approaches (or surpasses) the
average salary available in nonteaching jobs held by similarly educated
individuals. The theoretical found ion for the approach used was ful...y
developed in the previously referenced paper (Bird, 1985).
The annual Survey of Income and Employment conducted by the U.S.
4
12

Census Bureau provides the data upon which this comparable earnings
analysis is based. Reuults derived from the 1984 survey are reported here.
That survey contained records of 1,489 workers in the twelve southeastern
states who had completed four or more years of college education. Those
recorde are a subset of the total set of survey records that were
constituted to be a representative sample of all households in the
Southeast Region.
To compile the set of records for this analysis, only observations for
workers who had completed four o.. )re years of college were included.
That restriction was adopted to provide a basis of comparison that is
equivalent to the minimum education required of teachers. The larger data
set was also screened to exclude persons who were under 21 or over 65, to
exclude persons who worked fewer than 40 weeks during the previotA year, to
exclude persons who worked fewer tnan 30 hours in the average week, to
exclude persons wao reported annual earnings less than the legal minimum
hourly wage rate times annual total hours worked, and to exclude self-
employed individuals. The rationale for each of these exclusions is
discussed in the following paragraphs.
Persons over 65 and under 21 were screened from the data set because
their labor market participation patterns were fudged not to be relevant to
a comparison for public school teachers. This was a continuation of the
procedure used in the previous study.
Persons who worked fewer than 40 weeks per year or less than 30 hours
per average week were excluded because their labor force participation was
deemed to be essentially part-time and substantially different from the
behavior patterns of persons participating in the markets for full-time
employment from which potential teachers are more typically drawn. This
5
1.q
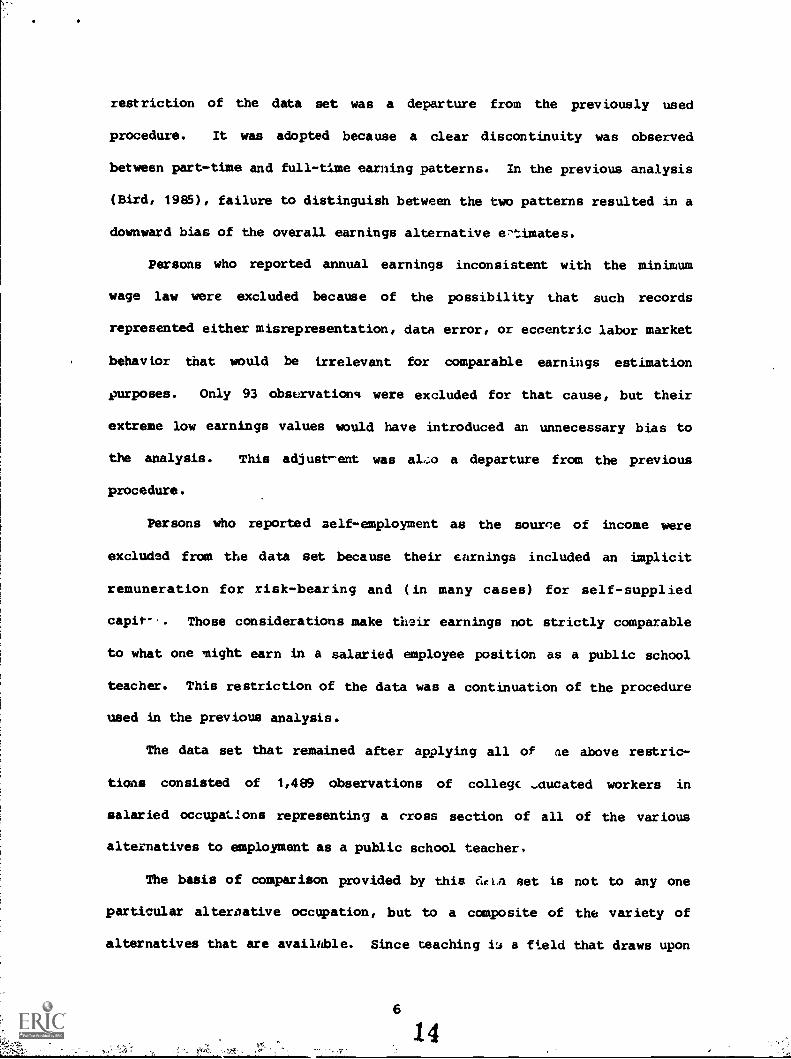
restriction of the data set was a departure from the previously used
procedure. It was adopted because a clear discontinuity was observed
between part-time and full-time earning patterns. In the previous analysis
(Bird, 1985), failure to distinguish between the two patterns resulted in a
downward bias of the overall earnings alternative e7'timates.
Persons who reported annual earnings inconsistent with the minimum
wage law were excluded because of the possibility that such records
represented either misrepresentation, data error, or eccentric labor market
behavior that would be irrelevant for comparable earnings estimation
purposes. Only 93 observations were excluded for that cause, but their
extreme low earnings values would have introduced an unnecessary bias to
the analysis. This adjust-ent was al6o a departure from the previous
procedure.
Persons who reported aelf-employment as the source of income were
excluded from the data set because their earnings included an implicit
remuneration for risk-bearing and (in many cases) for self-supplied
capit-,. Those considerations make their earnings not strictly comparable
to what one might earn in a salaried employee position as a public school
teacher. This restriction of the data was a continuation of the procedure
used in the previous analysis.
The data set that remained after applying all of (le above restric-
tions consisted of 1,489 observations of college -ducated workers in
salaried occupations representing a cross section of all of the various
alternatives to employment as a public school teacher,
The basis of comparison provided by this eicLa set is not to any one
particular alternative occupation, but to a composite of the variety of
alternatives that are available. Since teaching is a field that draws upon
6
14

a broad array of skills and talents and draws a very large number of
college-educated workers (over ten percent of all college-educated workers
in the SouthearA are employed as public school teachers), it was deemed
appropriate that the basis of comparison be a composite of the various
alternatives, rather than any arbitrarily chosen single alternative
occupation.
The data set was statistically analyzed using a multiple regression
technique. A single equation-reduced form of the marke;-. equilibrium
condition was used to express annual earnings as a function of several
labor force variables. After several functional specifications and data
sets were tested, it was f and that a logarithmic/linear specification of
earnings as a function of education, work experience, sex, race, marital
status, number of weeks unrked annually, average weekly hours worked, urban
or nonurban residence, and college degree holder status provided the best
fit to the data. Tb, function expresses the natural logarithm of annual
ear tngs as a linear function of the variables listed above. This equation
yielded an R-square measure of fit of .4147. All of the variables chosen
were found to have statistically significant T-values of .0026 or better.
The variable for work experience was entered in the function as both
its actual value and its squared value. The coefficient of the actual
value of experience was found to be positive (.03972), indicating that
increased work experience tends to raise expected earnings. The square of
experience was found to have a negative value (-.00071), indicating that
the effect of experience to increase earnings diminishes as experience
accumulates. This finding is consistent with economic theory; the same
type of relationship was found in the previous study. For the average
worker in the sample, one additional year of experience would, by this
7 15

coefficient, add $560 to annual earnings.
The education variable was found to have, as expected, a positive
coefficient (.0590). The degree status variable (equal to one if B.A.
degree present, zero otherwise) was found to be positive also (.1137). An
additional year of education beyond the baccalaureate would imply an
additional $1,831 annually for the average worker.
Race was found to be a significant predictor of earnings differences
among similarly educated persons. The variable that took a value of one if
the respondent was black and zero otherwise was found to have a negative
valued coefficient (-.1479), indicating that being black reduces average
worker earnings by $6,260.
Sex was also found to be a significant predictor of earnings
differences among otherwise similar individuals. The variable taking the
value of one for male respondents and zero for female was found to have a
positive coefficent (.2779). This implies that for workers having
characteristics as described by the data set averages for the other
variables, being male adds $8,092 to predicted earnings.
Marital status (one for married, zero otherwise) was found to have a
positive coefficient (.1421). Residence (one for urban, zero otherwise)
was found to have a positive coefficient (.1257). Number of weeks worked
was found to have a positive coefficient (0492). Average weekly hours
worked was found also to have a positive coefficient (.0110). The
intercept value of the regression equation was estimated as 5.3926.
For the model, the sum of squared error was 240.3124. The mean
standard error was .1626. The F-ratio was 104.73. The R-square value was
.4147. Ulditional variables tested, but discarded as not significant,
included number of persons in household, presence of second wage earner,
8 1 6

presence of children, home ownership status, and second job holder status.
An alternative specification of the model as strictly linear was found to
have lower explanatory power (R-square value of .3570).
The specification used here was consistent with the specification
found in the previous study of pay comparison (Bird, 1985), except that in
this case the household size variable was found not significant and was
eliminated. The previous differentiation among urban, suburban, and rural
resid,mce was reduced to a simple urban/rural distinction. The coefficient
values estimated from the 1984 data are, of course, different from the
values based on the earlier data.
ESTIMATES OF EARNING OPPORTUdITYIN NONTEACHING OCCUPATIONS
Three different bases of comparison were applied to the earning
opportunity estimation equation in order to develop a range of earning
alternatives. The bases used were the characteristics of the existing
teacher v3rk force in the Southeast, the characteristics of the general
nonteacher work force of college-educated individuals in the region, and
the characteristics of the white male college-educated work force. The
average values of the variables used for each of the bases of comparison
are shown in Tak014 2. Each different basis results in different estimates
of comparable earnings levels, primarily because of the different sex and
race compositions of the groups. As the basis of comparison is shifted
toward the white male composition, the estimated earnings potential
increases. This is a reflection of the fact that in our society white
males, for various reasons, tend to earn more than similarly educated and
experienced members of other groups.

TABLE 2
AVERAGE VALUES OF VARIABLESFOR EACH EARNINGS CCMPARISON BASIS
Variable Teacher General White Males
Education Years 17.7 17.4 17.9
Experience Years 16.6 14.9 17.6
Weeks Worked 1984 45.2 51.5 51.8
Average Weekly Hours 42.6 43.3 43.9
Percent Male 22% 66% 100%
Percent Black 24% 10% 0%
Percent Married 74% 69% 71%
Percent Urban 46% 68% 69%
Percent Degreed 100% 86% 92%
NOTE: The coding of Education Years was such that completion of four yearsof college is recorded as 17 years total.
A range of comparisons is offered because it is not possible to say
arbitrarily what basis of comparison is appropriate for developing public
school teacher pay strategy. The selection of a basis for application is a
matter of policy-maker judgment that depends on how aggressively it is
deemed necessary to recruit new teachers from the general labor force.
Selection of the existing teacher work force characteristics as the basis
of comparison would imply the least aggressive recruiting policy: the
policy to adopt if the numbers of persons and levels of ability presently
being attracted are deemed sufficient for the future. Selection of the
white male basis of earnings comparison would imply the most aggressive
policy if the intent of policy is to set teacher pay at a level that would
10
18

make the occupation attractive to the largest possible numbers of workers
and to the widest range of abilities. If teacher salaries are set at a
level that is comparable to the high earning opportunities of white males,
then the teaching occupation would be able to attract not only white males,
but also be superlatively attractive to females and nonwhites.
Table 3 shows the results of applying the earning opportunity
estimation model to the average characteristics of the nonteacher college-
educated workers in the Southeast. The results are derived based on 1984
economic conditions and data.
The average nonteacher with a college B.A. degree 4s estimated to be
able to earn $30,472 per year in nonteaching occupations. This estimate is
based on .42 years of postgraduate education, 14.9 years of full-time work
experience, and 52 weeks worked per year at 40 ,.ours per week. This group
is composed of 66 percent males and 10 percent blacks. It accounts for 73
percent of all full-time college-educated workers in the region. The
balance consists of teachers and self-employed individuals who were
excluded from the data set.
By allowing postgraduate education and experience to vary in
sequential substitutions of values into the earnings estimation equation,
it is possible to derive a salary schedule as displayed in Table 3. This
table indicates that a competitive average salary for full-time work during
the first year of employment of a B.A. degree holder would be $19,900.
Based on increases for merit related to additional education and experi-
ence, the analysis indicates that a competitive salary schedule should
range upward to $40,384. That top level would be the average earning
opportunity for a 30-year experienced worker with 3 years of postgraduate
education.
11
19

TABLE 3
EARNING OPPORTUNITY ESTIMATESIN NONTEACHING OCCUPATIONS
BASED ON GENERAL WORK FORCF, CHARACTERISTICS
Years of Experience Zero
Years of Postgraduate Education
ThreeOne Two
One 19,900 21,109 22,392 23,75?
Three 21,437 22,740 24,122 25,588
Five 22,964 24,360 25,840 27,411
Seven 24,462 25,949 27,526 29,199
Ten 26,614 28,231 29,947 31,767
Fifteen 29,783 31,593 33,513 35,550
Twenty 32,183 34,139 36,213 38,414
Thirty 33,833 35,889 38,070 40,384
The predicted earnings for the average member of the group based on 52weeks worked at 40 hours per week and degree holder status and othergroup average characteristics as listed in Table 2 were found to be$30,472.
The earning opportunity analysis was repeated using the sex, race,
residence, experience, education, and marital status values representing
the average characteristics of persons currently employed as teachers. For
purposes of analysis, the prior procedure of assuming 52 weeks of work at
40 hours per week was applied and B.A. degree holder status was specified.
This produced an estimate of the average earning opportunity in nonteaching
occupations for a group of persons having the sociodemographic charac-
teristics of the present pool of teachers. The results are reporter: in
Table 4. It was found that the average member of such a group would have a
12
20
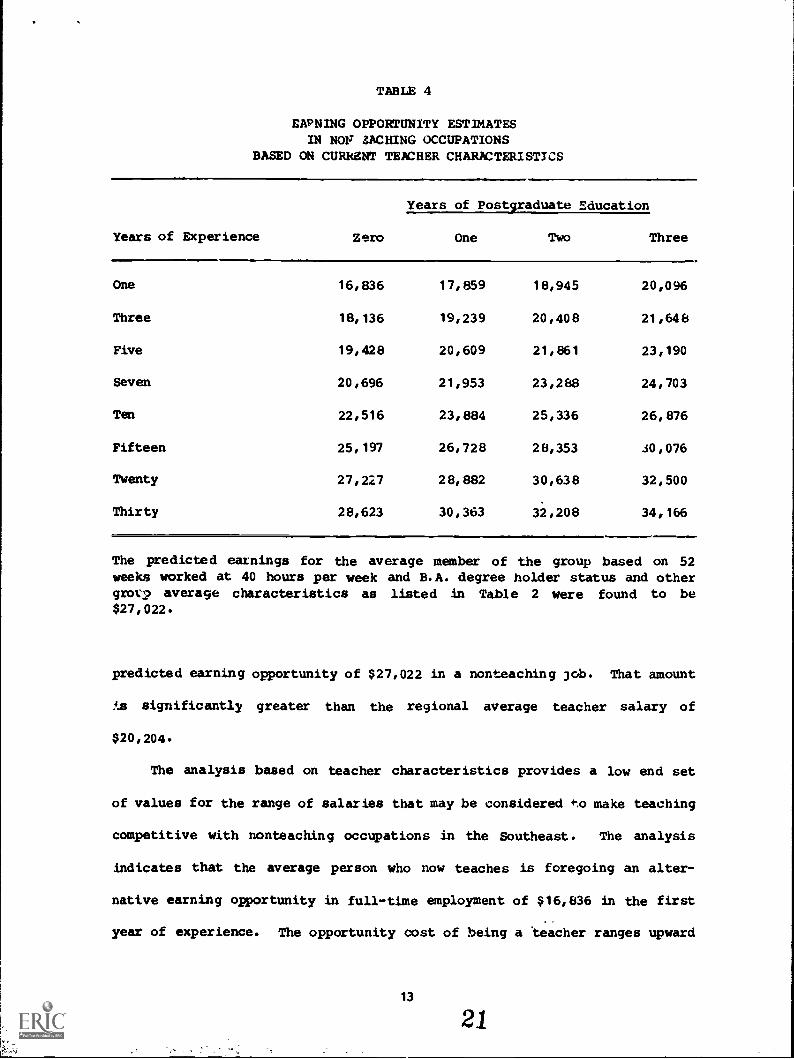
TABLE 4
EAPNING OPPORTUNITY ESTIMATESIN NOV LACHING OCCUPATIONS
BASED ON CURRENT TEACHER CHARACTERISTICS
Years of Experience
Years of Postgraduate Education
Zero One Two Three
One 16,836 17,859 18,945 20,096
Three 18,136 19,239 20,408 21,648
Five 19,428 20,609 21,861 23,190
Seven 20,696 21,953 23,288 24,703
Ten 22,516 23,884 25,336 26,876
Fifteen 25,197 26,728 28,353 30,076
Twenty 27,227 28,882 30,638 32,500
Thirty 28,623 30,363 32,208 34,166
The predicted earnings for the average member of the group based on 52weeks worked at 40 hours per week and B.A. degree holder status and othergrol9 average characteristics as listed in Table 2 were found to be$27,022.
predicted earning opportunity of $27,022 in a nonteaching job. That amount
is significantly greater than the regional average teacher salary of
$20,204.
The analysis based on teacher characteristics provides a low end set
of values for the range of salaries that may be considered to make teaching
competitive with nonteaching occupations in the Southeast. The analysis
indicates that the average person who now teaches is foregoing an alter-
native earning opportunity in full-time employment of $16,836 in the first
year of experience. The opportunity cost of being a teacher ranges upward
13
21

to $34,166 at the top of the experience/education scale according to this
analysis. It is the value of that foregone opportunity that the teacher
salary scale must compete against to attract and retain teachers similar to
today's group.
A third earning opportunity analysis was repeated using the residence,
education, and marital status values representing the average charac-
teristics of white male college graduates currently working in nonteaching
occupations. As previously, the procedure assumed 52 weeks of work at 40
hours per week and specified B.A. degree holder status. This analysis
produced an estimate of the average earning opportunity in nonteaching for
White males. Since that group has higher earning opportunities than any
other segment of the population, the earning opportunity for white males
represents the upper and of the range of slaries that may be considered to
make teaching competitive with nonteaching occupations in the Southeast.
It was found that the average member of the white male group had a
full-time earniag opportunity of $36, 767 per year. In order to become a
public school teacher, the average white male college graduate worker in
the Southeast would have to give up an alternative earning opportunity of
$36,767. That is the opportunity cost value against which public schools
must compete in order to attract teachers from the white male group on an
equal footing with other occupations. The results of the analysis for this
group are summarized in Table 5.
The salary scale shown in Table 5 indicates that at the beginning
experience level the earning opportunity in nonteaching is $22,279. The
earning opportunity estimate rises with education and experience to $45,210
at the highest level. This analysis indicates the upper range of the
salary schedule pattern that public schools might need to adopt in order to
14 22

compete effectively against nonteaching occupations to recruit
TABLE 5
EARNING OPPORTUNITY ESTIMATES IN NONTEACHINGOCCUPATIONS BASED ON WHITE MALE CHARACTERISTICS
Years of Experience
Years of Postgraduate Education
Zero One Two Three
One 22,279 23,633 25,069 26,592
Three 23,999 25,458 27,005 28,646
Five 25,709 27,271 28,929 30,687
Seven 27,386 29,050 30,816 32,689
Ten 29,795 31,605 33,526 35,564
Fifteen 33,342 35,369 37,518 39,799
Twenty 36,029 38,219 40,542 43,006
Thirty 37,877 40,179 42,620 45,210
The predicted earnings for the average member of the group based on 52weeks worked at 40 hours per week and B.A. degree holder status and othergroup average characteristics as listed in Table 2 were found to be$36,767.
college-educated personnel.
CONCLUSIONS AND RECCEMENDATIONS
This analysis has shown that despite recent gains in teacher pay in
the Southeast states, teacher pay levels still fall short of the alter-
native earning opportunities in other occupations. The 1984 average
teacher pay level in the Southeast was reported to be $20,204. That amount
is $6,718 less than the estimated alternative earning opportunity of
15

persons having the sociodemographic characteristics of present teachers.
That amount is $10,268 less than the estimated alternative earning
opportunity of persons having the sociodemographic characteristics of the
general population of college-educated workers in nonteaching jobs. That
amount is $16,563 less than the estimated alternative earning opportunity
of the white male population of college-educated workers in nonteaching
jobs.
The analysis indicates that a range of salaries for full-time work
that would make teaching competitive with other occupations in attracting
and retaining workers in the Southeast would be $27,022 to $3C1767 for
average salaries. The competitive beginning salary range for full-time
work would be $16,836 to $22,279 The upper end of the salary schedule
Should offer salary in the range $34,166 to $45,210 in order to be
competitive with other occupations.
The analysis was conducted in terms of full-time earning opportuni-
ties, 52 weeks of work at 40 hours per week. The typical teaching contract
in the Southeast is for only 44 weeks of work, one-sixth less than the
full-time basis used here. One might argue that the salary ranges
stggested here as competitive with nonteaching alternatives should be
reduced by one-sixth to reflect that difference. That adjustment would
make the recommended average salary range become $22,522 to $30,647. That
range is still above the current average salary level, but indicates a
significantly smaller difference.
The problem with the adjustment described above is that it ignores the
reality of the process of individual choices among occupations. In order
for an in,ividual to choose a ten-month job as a teacher, the individual
must forego the opportunity for twelve-month work in another occupation.

Therefore, the choice aoes involve an opportunity cost of the twelve-month
earning alternative. Unless the individual places a high value on leisure
time or can earn equivalent rates of pay in part-time summer work, or
unless the public schools can offer offsetting amenities in working
conditions, the twelve -month opportunity is the salary level that public
schools must match in order to compete for employees on an equal footing
with other occupations.
" 25

REFERENCES
Bird, Ronald. "Competing for Quality: An Analysis of the Comparability ofPublic School Teacher Salaries to Earning Opportunities in OtherOccupations." Research Triangle Park, NC: Southeastern RegionalCouncil for Educational Improvement, 1985.
Council of Chief State School Officers, Committee on Teacher Certification."Staffing the Nation's Schools: A National Emergency." Washington,DC: Council of Chief State School Officers, 1984.
Darling.-Hammond, Linda. "Beyond the Commission Reports: The Coming Crisisin Teaching." Washington: Rand Corporation, 1984.
Southeastern Regional Council for Educational Improvement. "SEIS DataProfiles." Research Triangle Park, NC: Southeastern Regional Councilfor. Educational Improvement (publicat:on in process).