document resume ed 113 663 - files.eric.ed.gov · consistent with this prevailing climate, the west...
TRANSCRIPT
DOCUMENT RESUME
ED 113 663 CG 010 167
AUTHOR. Moriarty, 'Joseph B;;,And OthersTITLE Resource for Evaluating VR [Vocational
Rehabilitation] Programs.INSTITUTION West Virginia Univ.,, Morgantown. Regional
Rehabilitation Research and Training Center.SPONS AGENCY Social and Rehabilitation Sprvice (DHEW), Washington,
D.C.PUB DATE (74)NOTE 144p.; Not available.in hard copy due to marginal
legibility of original document'
EDRS PRICE My -$0.76 Plus Postage. HC Not Available from EDRS.DESCRIPTORS *Evaluation Crite:'ayleasurement Techniques;
Mentally Handicapped; No Referenced Tests; .
Physically Handicapped; Pr m Descriptions;*Program Evaluation; *Rehabili ionCounseling;*Self Evaluation; *Vocational Rehabilitation
IDENTIFIERS PAT; *Profile Analysis Technique
ABSTRACT..
N. Operating under the assumption that: (1) stateagimcies routinely collect ]arge amounts of data;, (2) these datapossess significant potential for evalu tfng VR'programs; and (3) theprogra evaluation potential of-,the da a has been largely untapped,
...' the W. Va. Research and Train }nd' Center has been deiieloping'techniques for evaluating rehabilAttion programs. This publicationcontains three papers, the first of mhich details the basic rationalefor a techniqui developed in the Reedarch and Training Center that isdesigneCto,simplify tleultimate development of standards forself-evaluation of R programs. This technique, called ProfileAnalysis Technique, takes curre tlf existing data and foriats it insuch a way as to increase its i telligibility. The second paper,dealing with Marco and Micro Aap4cts of Program Evaluation inrehabilitation: takes the theoretical approach developed in theprevious paper and shows its applicat.on to a number of real-lifesituations. The-third paper, dealing With Measurement of ClientOutcomes, continues With a demostration of how routinely availabledati can generate .fine-grain analysis' of program functioning.(Author) I 3
************N******************** ************************************* Documents acquired by ERIC 4nclude many informal unpublished, *
4.matJrials not available from other sources. ERIC makes every effort'*.* to obtain the best copy available. Nevertheless, items of marginal *
* reproducibility are often encountered and this affects the quality *
* of the micrtfiche and Ordcopy repioductions ERIC makes available *
* via the ERIC Document 'Reproduction Service (EDRS). EDRS is not* responsible for the.quality of the original'ddcument. Reproductions ** supplied by EDRS are the best that can be made from the original. ************************************************************************
..

cc
Iig:MIA 411.'
tgkITC, 1104tEl lasuam32aw
i tZzu. ..-
apoZaD>. pr-1 2irga
:7
w, ww.0EZiE
..?ig4 Niv.a.g,.....
..... ...... x.
_
I IR..., ..._. N,-
---,
7411; aXg&OE,iLVW *VZ41"& -A
_
--4
in... a roatt0t;os 7owO4
Vii::111ga . .
t
I-
--4_,,,, 0
. :U .r. 2 ..... ( ) i- w 2
CC 4 4L. )
3 3 a i- ----71 AU
50 -1 0 .,/ k A
_ m a :( 0 --4 w
111 0 > it CC _..., ulCC U. ili > a
09CII03, 9T ci 33

PREFACE
Responding to both internal and external pressures, rehabilitation has developed a greatdeal of interest in program evaluation.
Consistent with this prevailing climate, the West Virginia Research and TNning Centerin Vocational Rehabilitation has been devoting an increasing amount of time and energyto the development of techniques for evaluating rehabilitation programs. From the outsetwe in the West Virginia Center have been struck with three facts.
Fact 1: State Agencies routinely collect gobs of data (R-300 etc.).
Fact 2: These data.possess significant potential for evaluating VR programs.
Fact 3: With some singular exceptions the program evaluation potential ofthese data If been largely untapped.
Struck by these three facts we in the West Virginia Center became convinced tha't beforeall kinds of new program evaluation strategies be developed, that the first task at hand wasto take a look at the value and potential of what was already under our noses.
Part of what we found under our noses is contained in this publication. This publicationrepresents a collection of three papers. The first paper details the basic rationale kir actechnique we have developed in the Research and Training Center that is designed tosimplify the ultimate development of standards for self-evaluation of V R programs. Thistechnique called Profile Analysis Technique takes currently existing data and formats itin such a way as to increase its intelligibility.
The second paper deals with Macro and Micro Aspects of Program Evaluation in rehabil-itation. This paper takes the Theoretical approach developed in the previous paper andshows its application to a number of real life situations,within Region
The third paper dealing with Measurement of Client Outcomes continues vith a dem-onstration of how routinely available data can.generate fine-grain analyses ot programfunctioning. Again, it is to be emphasized that all of the material presented in thispublication comes fr`Cim already existing data.
On'this score we have heard the argument that evaluation findings based on routinelycollected information is somehow automatically suspect. Time and again we have heardknowledgeable people within rehabilitation talk about either the inadequacies of currentforms or the lack of enthusiasm for accuracy among thosewho fill these forms out.
We respectfully submit that to dismiss out of hand routinely available data is at bestpremature. The fact that certain items on foins like the R-300 are error-prone is conceded.However, we believe
currentlyis an unwarranted inferential leap to go from,such a concession to
the broad dismissal of currenth, available data as providing at least a beginning for objec-tive program evaluation.'
e

t
. A.
In short, to use the slang of the day, until you try itdon't knock it. Or, try it, you'lllike it. .,
And Who knows. Maybe when thcse who are saddled with the responsibility for "allthat paper work"begin to see greater use being made of one paper, perhaps we will ex-perience a corresponding decrease (at least in part) in resistance to doing this very paper
work.
---
-.
1
C
4
Joseph B. Moriarty, Ph-, D.DirectorWest Virginia Research and Training Center
A
e
l'
e

PROFILE ANALYSIS TECHNIQUE (PAT): Developing Standards
for Self-yaluation of VR Programs
OR
A Possible Answer to the Age Old Question: :'But
What The expletive deleted) Does
All This Stuff Mean?"
by
Joseph B. Moriarty, Ph.D.Associate Professor, West Virginia University
Director, West Virginia Research and Training Center

-/
The following is a true story. The names have been changed just to be ornery. The cast ofcharacters include a Chief of Casework Services in a State Rehabilitation Ageicy, his assistant,and a data processing person.
Beginning of Episode
Chief: I tell you we have a problem with case flow. Clients are just spending toomuch time in certain statuses.
Assistant Chief: I've got an idea. Why not have Fred over in the Data Processing give us aprint-out on how long clients are spending in the various statuses.
Chief: Yeah. While he's at it, why don't we have Fred also give us a breakdownby districts within the state. And also by disability groups.
Assistant Chief: Right. That way we would have a good look at case flow. A good detailedlook
1
_.----A week goes by. Fred works diligently. He produces a computer print-out one inch thick.
It contains all the information asked tor and more. Fred, with thinly disguised feelings of-._...- pride at the wonders and alacrity of modern technology, drops the print-out on the Chief of
Casework Services' desk.
Fired: Well, here it is. I've given you a breakdown by disability and by district.I've also given you a breakdown by disability within each district.
Chief: That's exactly what we need. Thanks a bushel.
Moments later the Chief of Casework Services excitedly calls his assistant, giving him thegood news that the information they wanted has arrived.
The assistant immediately huddles with his boss. As they begin to pour over the computer'slargess, their interest and enthusiasm begin to wane.
Chief: Look here at these disability codes. People with these disabilities arespending 2.08 months on the average in Status 10.
Assistant Chief: Yeah. They are. But clients with the same codes are spending 3.17months in Status 24.
Chief: (Leafing through the rest of the print-out) Wall.. . .there it is. But whatthe (expletive deleted) does all this stuff mean?
End of Episode
6
0
4

-2-
Not Just Data. Reality.
In their data processing advertisements IBM, with pardonable immodesty, boast that theygive their consumer the Holy Grail of reality. Not just data.
I'm Joe Moriarty. I'm the Director of the West Virginia Research and Training Center inVocational Rehabilitation. In the Center we have struggled with the issues of data and realityfor some time now. It's our beaf that the Chief of Casework Services in that little episodestarted out with a reality question. He got back just data.
At the West Virginia Research and Training Center it's our belief that one of the majorissues confronting state agenciesin this era of evaluationis how to translate data intoreality. Or a view of reality. A view of the reality of program functioning demands thepresence of data. But the presence of data, even in abundant quantities, does not guaranteea view of program reality. Put another way: the presence of data is a necessary, but notsufficient condition, for viewing and evaluating a VR program.
Dataphobes vs. Dataphileste
The issue of translating data into reality becomes especially critical in the field of rehabil-itation. Research in the area of vocational interest suggcsts that those who go into helpingprofessions like rehabilitation tend to be people-oriented. Not data-oriented. Or thing-oriented. I'll go one step fUrther. I'll suggest the hypothesis that being people-orientedisnegatively associated with being data-oriented. If this is true, many people in rehabilitationare (pardon the word coinage) dataphobes. Dataphobes are, as the term implies, folks whoseresponse to data is a phobic one.
The world is peopled with dataphobes on the one hand and dataphiles on the other hand.You see, red in our little episode is probably a dataphile. Dataphiles are people who derivesensual pleasure from' manipulating data. Dataphiles are inclined to view the massage of dataas terminal rather than instrumental behavior. Dataphobes, by contrast, need to be nudgedinto accepting the possibility of data manipulation as having some instrumental value.
What's Needed
As rehabilitation moves into more formalized program evaluation techniques, the WestVirginia Research and Training Center thinks that the establishment of standards is one ofthe very first things that need to be done. But th_question comes up, "Where do you gofor standards?" In our judgment one of the answers to that question is: To state agencyprogram data.
Take our Chief of.Casework Services and his assistant in our little episode. He wasstymied. Why? Because he had no standards for evaluating whether or not time periodssuchas,2.08 months is long, short, or about average.
I.
7

-3-
What we are therefore talking about in more technical jargon is norm-referenced standards.It should be emphasized that norm referenced standards allow ore to make statements re-garding how usual or unusual a particular piece of program information is.
In the opinion of the West Virginia Rese4ch and Training Center, the standards that getdeveloped should have the follOwing characteristics:
1. Ease of interpretation.
2. Orientatiod toward rehabilitation.
3. Flexibility.
4. Simplicity in computation.
5. Permitting multiple criteria analysis.
PAT: Essential Idea
The essential idea behind PAT (Profile Analysis Technique) is to meet the above-mentionedfive criteria. What we have done is take information routinely collected by state agencies, onforms like the R-300. We have then formatted this information in such a way that a stateagency can readily compare its performance with Regional standards or national standards.This technique also permits the comparison of smaller operational units (e.g., districts) withina statetagainst a state standard. Finally, the approach allows for development of standajds foranalyzing individual counselor performance.
An Example iTo get a feel for how PAT works, look at the illustration on the following page. It details
a profile of a state agency (simulated data) on several significanffactors. As you look at theprofile, you'll see that the rows have numbers ranging from 1 to 9 and the columns are alpha-betic designations referring to specific aspects of program function, e.g., number of rehabili-tants, number per one hundred thousand, population, etc.
As you look at the Jefthand side of the chart, take note of the shaded area that is in themiddle of the chart surrounding the number 5. In PAT, 5 represents the exact average. Asyou go up higher you move above average. As you move below 5 you of course move belowaverage. For purposes of general discussion we suggest the following interpretation:
Profile scores of 9, exceptionally high,
Profile scores of 7 and 8 are high,
,3rofile scores from 6 to 4 are in the average range,
Profile scores of 3 and 2 are low,
Profile scores of 1 are exceptionally low,
8

-4.
With this background one would interpret the profiles presented on page 5 as indicating anagency whose raw closure production was right at the average based on national standards.However, theirfroduction of rehabilitants on a population and counselor basis was low. Incontrast the cost per rehabilitant was high.
If you were a state agency director, and you were to stop the profile analysis at this point,you might have sorhe concern as to what was happening in your program. Why? Well,because below average production is present despite high cost per rehabilitant.
But going on, the profile reveals other very significant evaluation factors. For example,on factor E (percent of caselotaaseverely disabled) this particular agency is exceptiogallyhigh. Consistent with that, the agency is also high in average case difficulty. Also, theclients of this agency are high in the amount of time it takes them to get rehabilitated(Factor G). But once rehabilitated, the clients of this agency have earnings that arellighfor rehabilitated clients (Factor H).
Putting all this together, the picture that emerges is that of an agency whose quantativeproduction is low but whose cost is high. But this high cost-low production seems to becaused by_ first of all taking clients who are more severely disabled to start out with;working in greater depth with those accepted with results showing up in the earningspicture at closure.
A Contrasting Example
If you look on page 6 you'll see a second example of PAT applied. This contrastingexample also represents simulated data for a second state agency. This second agency
is like the first in that it is right at average as far as raw number of rehabilitants is con-cerned (Factor A). But the similarity in the two profiles ends there. For one thing,this second agency really does an exceptional job from the standpoint of number perhundred thousand population (Factor B). They are also a high as far as production percounselor is concerned. Another contrast aspect to this profile is the low cost (Factor D)per rdhabilitant.
., .
ButT'AT shows this second agency to be well low as far as the percent of their caseload
being ge rely disabled (Factor E). Consistent with this is their low showing as far asaverage c se difficulty is concerned. And while they move clNts quickly to closure(indicated by j score of 3 under Factor G) the average earnings of clients once rehabili-tated are.exceptionally low for rehabilitated clients.
;;So the contrasting picture of this agency is that of one whose good showing in produc-
tion and cost areas may be due to accepting less severely disabled clients, doing less forthem and bringing about less improvement in earnings picture.
9

HIG
H8 4
1-2
BO
VE
'
LO
W
Mia
owa
A-B
CD
EF
GH
1K
L M
N
A. .
.NU
MB
ER
OF
RE
HA
B!L
ITA
NT
SB
..
.NU
MB
ER
PE
R 1
00,0
00 P
OP
ULA
TIO
NC
. ..N
UM
BE
R P
ER
CO
UN
SE
LOR
D. .
.CO
ST
PE
R R
EH
AB
ILIT
AN
T
E.
..%
SE
VE
RE
LY D
ISA
BLE
DF
..
.AV
ER
AG
E.C
AS
E D
H-F
ICU
LTY
G.
..A
VE
RA
GE
TIM
E T
O C
LOS
UR
EH
..
.AV
ER
AG
E E
AR
NIN
GS
AT
CLO
SU
RE

9 B 5 4 3 1A
BC
,CIE
FG
H Is
J K
LIM
NI-
A. .
.NU
MB
ER
OF
RE
HA
BIL
ITA
NT
SB
..
.NU
MB
ER
PE
R 1
00,0
00 P
OP
ULA
TIO
NC
. . .N
UM
BE
R P
ER
CO
UN
SE
LOR
D. .
.CO
ST
PE
R R
EH
AB
ILIT
AN
T
E..
.% S
EV
ER
ELY
DIS
AB
LED
F.
..A
VE
RA
GE
CA
SE
DIF
FIC
ULT
YG
. -A
VE
RA
GE
TIM
E T
O C
LOS
UR
EH
.. .A
VE
RA
GE
EA
RN
ING
S A
T C
LOS
IME
,
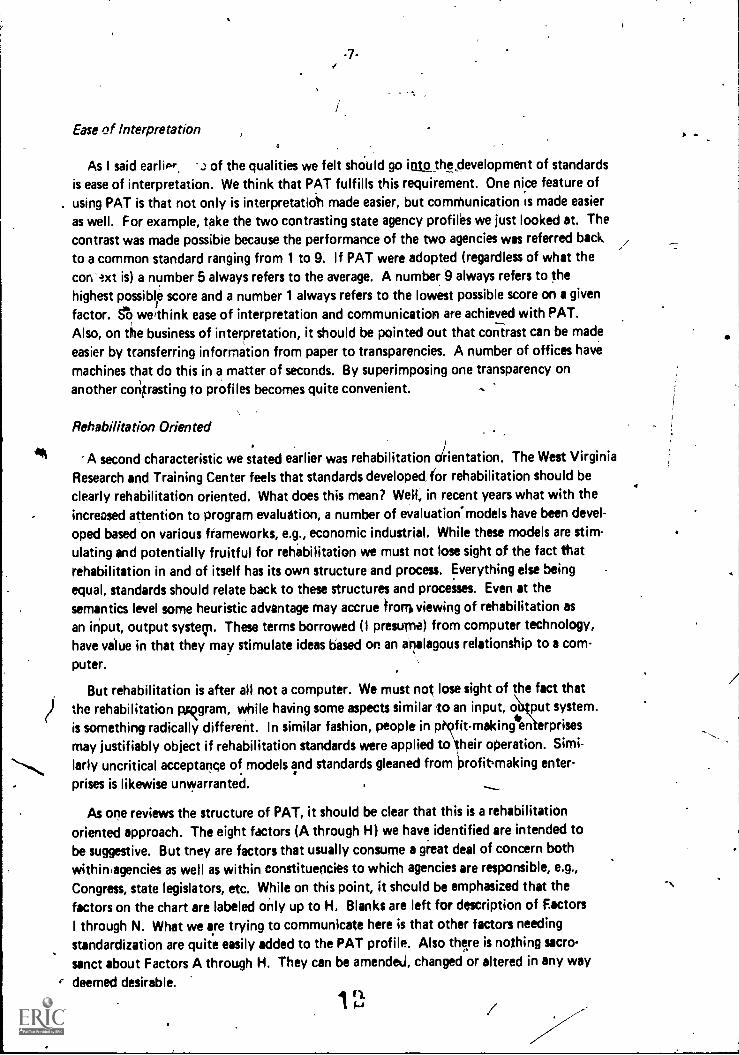
Ease of Interpretation
As I said earliP .) of the qualities we felt shoUld go into_thtdevelopment of standardsis ease of interpretation. We think that PAT fulfills this requirement. One nice feature ofusing PAT is that not only is interpretatioti made easier, but communication is made easieras well. For example, take the two contrasting state agency profiles we just looked at. Thecontrast was made possible because the performance of the two agencies was referred back
to a common standard ranging from 1 to 9. If PAT were adopted (regardless of what the
con' ixt is) a number 5 always refers to the average. A number 9 always refers to thehighest possible score and a number 1 always refers to the lowest possible score on a given
factor. we'think ease of interpretation and communication are achieved with PAT.Also, on the business of interpretation, it should be pointed out that contrast can be madeeasier by transferring information from paper to transparencies. A number of offices havemachines that do this in a matter of seconds. By superimposing one transparency onanother contrasting to profiles becomes quite convenient.
Rehabilitation Oriented
A second characteristic we stated earlier was rehabilitation orientation. The West VirginiaResearch and Training Center feels that standards developed, for rehabilitation should beclearly rehabilitation oriented. What does this mean? Welt, in recent years what with theincreased attention to program evaluation, a number of evaluatiorimodels have been devel-oped based on various frameworks, e.g., economic industrial. While these models are stim-ulating and potentially fruitful for rehabilitation we must not lose sight of the fact thatrehabilitation in and of itself has its own structure and process. Everything else beingequal, standards should relate back to these structures and processes. Even at thesemantics level some heuristic advantage may accrue frorm viewing of rehabilitation as
an input, output system. These terms borrowed (I presume) from computer technology,
have value in that they may stimulate ideas based on an analagous relationship to a com-
puter.
But rehabilitation is after all not a computer. We must not lose sight of the fact thatthe rehabilitation pc-foram, while having some aspects similar to an input, o put system.is something radically different. In similar fashion, people in profit- makingen erprises
may justifiably object if rehabilitation standards were applied to heir operation. Simi-lady uncritical acceptance of models and standards gleaned from profitmaking enter-
prises is likewise unwarranted.
As one reviews the structure of PAT, it should be clear that this is a rehabilitationoriented approach. The eight factors (A through H) we have identified are intended tobe suggestive. But tney are factors that usually consume a great deal of concern bothwithinsgencies as well as within constituencies to which agencies are responsible, e.g.,Congress, state legislators, etc. While on this point, it should be emphasized that thefactors on the chart are labeled only up to H. Blanks are left for description of FactorsI through N. What we are trying to communicate here is that other factors needingstandardization are quite easily added to the PAT profile. Also there is nothing sacro-sanct about Factors A through H. They can be amended, changed or altered in any way
r deemed desirable.
1 t'
I,

1
Flexibility
f-8-..
A
us
This brings us to the,thirdcharkteristic of the PATsystem: fle*ility. Earlier In our -,discussion we had alluded40 the fact ihat the PAT approach can be aced on establishednational staridaids. The two ilhistrations foundbon pages 5 and 6 we contrasted:two stateagencies against common national norms. We could, flowevet,,have just as easily con-
/ ttrasted the same,agencies simultaneoUsty against Regional port s. , '7= de
/I .
., - c.
'The norms for. a region could be presented as a graph line suparitnPosed on th? chart .
for 'either ()Nile agencies presented in the examples wand 2.. ,,. ,
..Moving one step further, it,would be possitilto contrast for example, counselor per
formance against state arwell as national or regional norms. , ,I. : .
With an appropilaie data base, for example, a single counselor .might score 9 in pro-, dLictiOn within his oim state agency.' That saMecounselor productivity may be the
equiiiiIrt of the 7 on a regional basis and an 8 on a national basis(
The above is intended to give a flavor as to the flexibility with which the PAT approach .
can be utilized.
Zimplicity in Computation
A desirable Characteristic to have in standards is that of computational simplicity. ThePAT system by limiting standards to integers ranging from 1 to 9 goesa long way toward
this computational simplicity.
Some statistical procedures (e.g., correlations) require taking existing data and squaring'
and summing the numbers after squaring has been done.
In the PAT approach the highest number is 9. This makes it a lot easier to square thannumbers whose values may be two or three digits or more with decimal points to boot.This Compqtational simplicity is particularly important where access to a computer is notavailable. But should a computer be available the PAT limit of 9 makes it more convenientto record and store informhtign on computer.cards and related devices...,
Multiple Criteria. Analysis
This aspect of PAT is one of its moat-important. As rehabilitation strives to developgreater specificity in its program evaluationNeorts, we mUs move away from single
factor thinking. By that I mean we must recognize that a rehabilitation program is amany-sided thing. It is inappropriate to ask; Is this Program good? So most issues
regarding the worthwhileness of a program no.4.1 to be pushed one step further. The
question needs to be further asked: Good according to what criterion? 'Good according
to what standards?
13
.11

PAT, by bringing together multiple standards allowithe agency evaluating iteelfto look at
more than vne dimension.einiultapeouily. Such an 45Proach depicting the dynamic interplay.
of multiple factors permits a view of\ reality that is closer to what is.
., / , NConclusion .
.. .t . .
4he PAT is not going tO sotye all of life's ills. Unliice IBM' the West Virginia - Research and
Training Center is loathe to claim that PAT will insure a view32f reality. Frowever, we'arl:in$. 'f . .
a position to state the adoAtionof toroceckuce liki PAT can do much.toverd accelerating, i
the healthy trend toward self-analysis and selftscrutiny; ,. e
, a rI
AO'
fig i
14
4

a
4
Macro and Micro-Aspects of Program
Evaluation in Rehabilitation,
Richard T. Walls, John D. Stuart, and M.S. Tsenq
West _Virginia Rehabilitation
Research and Training Center (RT-15)
I

4
1
Ma_ cro-Aspects of Program Evaluation
Program evaluation may be thought of as a numbertof relation-
ships and interrelationships. Some of these may simply reveal
relative positions of a state or program with regard to some
external standard such as a national mean. Other relations may
probe more complex interrelations among Variables. The first part
of this paper is devoted to examining a means for representing
Ample relations to a national, state,,or program average. We
have termed this macro-aspects in program evaluation. The second
part of the study addresses in depth such relations within a single
program. We have termed this micro-aspects in program evaluation.
The stanine is a convenient means of representing the relative
'standing of a given agency or program for a particular variable.
The stanine scale is simply a scale ranting from 1 to,9'with an ,
average of 5 and a standard deviation of 2.* A-profile of a state ,
or agency ley be'easily interpreted from such a chart. We have
illustrated this by plotting several variables taken froM the 1971
or 1973 national statistics for Delaware, District of Columbia,
Maryland, Pennsylvania, Virginia, and Mist Virginia. The variables
are listed on the stanine chaks on the following pages.
There are five general categories for each state:
(1) Population
(2) Case Load
(3) Cost
(4) Caseflow and Management
(5) Client Outcomesx-x
*Stanine * 5 + 2 rial 5 +2 (z)
1i

2
Each of the five general categories contains severalosubvariables
represented by letter on the chart. A through F under, Population
are for 1973; the remainder that are charted are for'1971. A
'Number of important variables are listed, but are not available
from currently published national data.
Several examples should facilitate the reader's interpre-
tation of these charts.
Example 1. - Number in Caseload Per Counselor a first chart).
Delaware was considerably below the national'average (Stanine 2).
District of Columbia was close to national average (Stanine 5).
Maryland was above average (Stanine 6).
Pennsylvania Was also above average (Stanine 6).
Virginia was slightly above average (between Stanine S mod 6).
West Virginia was about average (St 'anine 5).
Ex_ 2. -- Number of Aehabilitatits P, r Loo °coo
Disabled (E first chart).
Delaware was very high (Stanine 9).
District of Columbia was very high (Stanine 9).
Maryland was above average (Stanine 6).
Pennsylvania was average (Stanine 5).
Virginia was abo4e average (Between Stanine 7 and B).
West Virginfa was very high (Stanine 9).
Example 3. - Cost:piagnostic i Evaluation, (P second chart).
Delaware was below average (between Stanine 2 and 3).
District of Columbia was beywdaverage (between Stanine 3 and 4).
3
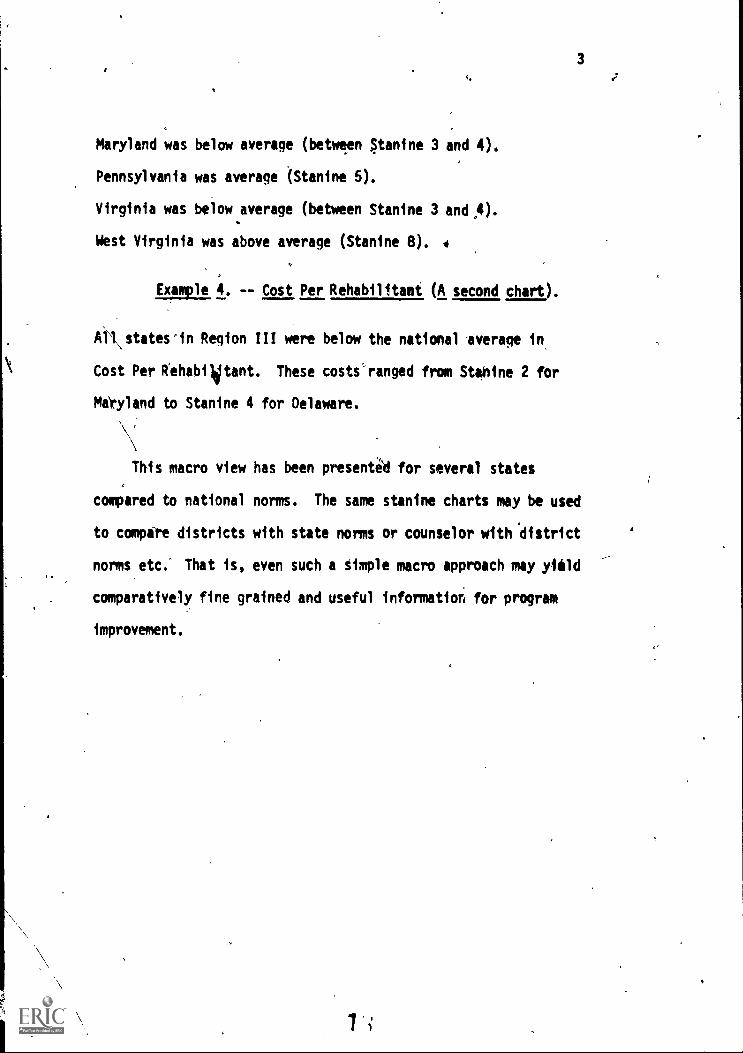
Maryland was below average (between Stanine 3 and 4).
Pennsylvania was average (Stanine 5).
Virginia was below average (between Stanlne 3 and ,4).
West Virginia was above average (Stanlne 8). .
Example 4. -- Cost Per Rehabilitant (A second chart).
Ail\states'in Region III were below the national 'average In
Cost Per Rhabilitant. These costs'ranged from Stanine 2 for
Matyland to Stanine 4 for Delaware.
This macro view has been presented for several states
compared to national norms. The same stanine charts may be used
to compete districts with state norms or counselor with *district
norms etc.' That is, even such a Simple macro approach may yield
comparatively fine grained and useful information for program
improvement.

.432
el
I
.
_
...--""e ---
_-44pr
1
t *".7r ,
,
4'1:`14.
,
r'r'. 'L;
...-
t
-..
''',,:.:',is
,r1"-",e ':
1f.
nAk..,sI.-
if
t,
;OP
.71:.
'11
''Itt4'
Tr
' t,, '
40
40
ii
---------
II
iA
....
,,
r
IP
_.
A
__
__
e._
,
AB
CC
IEP
G141 J K
LMN
(1)POPULATION AND (2) CASE LOAD ,PROFILE
FOR
DE
L/ I (.WE
(1stC
ithivr)
A..
Numbei- Served
97seF..
B..
Percent Accepted for
G..
Services
9Y9
H..
C..
Number of Rebabilitants /6.24/
I..
D..
Number otRehabilitants
per 100,000
J..
population
4,29%.1
E..
Number of Rebabilitants
per 10,000
Disabled
60g
'Success Ratio 26/08+28+30211J..
Case Difficulty
--
L..
Percent Severly Disabled --
M..
Number in Case Load
N..
per Counselor
SYNumber of Rehabilitarts
per Counselor
/4:._
National
Mean
Expenditures per CounselorAO,r44

432I
I.
*5....
.
ttS
;t...;:.
....
,.-%
N....
K.....
"r",5^'""N
or
'''14
',,,,.. ,..,...
....a
.,,,,,,...,.
-.:.,....,:l-.
.,
t'.'
-.1p
40
,...
AB
CC
IEF
GH
1J K
LM
N
National
Mean
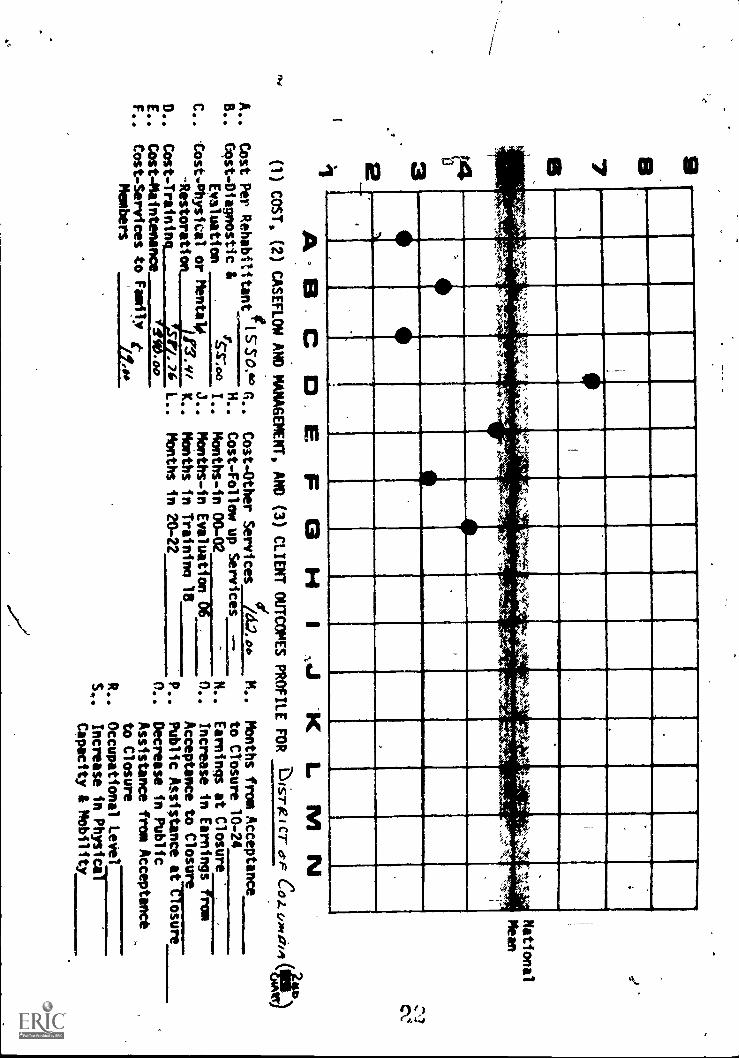
(1) COST, (2) CASEFLOW AND MANAGEMENT, AND (3) CLIENT OUTCOMES PROFILE
FOR
DL
AW
AR
E(2N
D C
HA
RT
)
A..
0Cost Per Rehabilitant
11n 7 1.6°G..
Cost-Other Services
i644..o0
M..
Months from Acceptance
B..
Cost-Diagnostic &
$H..
Cost-Follow up Services
to Closure 10-24
Evaluation
.7466 I..
Months-in 00-02
N..
Earnings at Closure
C..
Cost-Physical or Mentale
J.
Months -in Evaluation 06
0..
Increase in EarningTTNsro
Restoration
IlterK..
Months in Training 18 N
Acceptance to Closure
D..
Cost Training
1.344409
L..
Months in 20-22
P..
Public Assistance afirmimr-
E..
Cost-Maintenance
IFS oo
r0..
Decrease in Public
F..
Cost - Services to Family
Members
-934?..b
Assistance from Acceptance
6
to Closure
R..
Occupational Level
S..
Increase jn-ftyiica
Capacity 4 Mobility

97e32I
.1
1 .t*,',P.,4;.-.
--,..1,..'..;,
;"
1
-3:''-4`,:..,
--4-' 7'...,
<
.r...:.4.
-,4-
-:-.-
.
-..,,,
,
P---
,,,,,,, -,...:.
1
,4
..--7:-..A.`-v-=
,-..k
Ir.4
.
-4.-
,
rr
tu
I
AO
CO
0)POPULATION AND
A..
Numbt* Served
9/06.F..
B.. Percent
Accepted
for
G..
Sery ices,
Sy o
H..
C..
Number of RebabilitantsOSS7
I..
D..
Number of Rehabil i tants
per 100,000
.7J..
population
517:5
E..
Number of Nelabilitants
per 10,000
Disabled
114-
EF
IGH
IJKLM
N(2) C
AS
ELOAD
PR
OF
ILE F
OR
Dal-K
ierar
Co
4.04, fi A(at (A
iNitN
)
National
Mean
Success Ratio26/08+28+30V/ K..
Expenditures -per
CounselorR410/Y,
Case D
ifficultyL..
Percent SeverlyDisabled
M..
Number in Case Load
N..
per Counselor
/.27
Number ofRehabilitagi,
per Counselor
76
97B32'11
I111
i
111111
IP*,'
.l' .5.:,`" ,.1.71X
, : 'Zligl
WiA
`.: , 40!*
11111111M
1 III ME
III115
IIII IIII. 11.
.MI
1111
11111111
1111A
-131 CO
E F
GH
IA
LJK
L1111 N
National
Mean
(1) COST, (2) CASEFLOW AND MANAGEMENT, AND (3) CLIENT OUTCOMES PROFILE
FOR -61-rte
I CT
crFC
o.z.c/pfibi
A..
Cost Per Rehabilitanti5506' G..
B..
Cost- Diagnostic &
---7------H..
Evaluation
S;47.co
I..
C..
Cost-Physical or Mentalli
J..
Restoration
D..
Cost-Training
j12.VI K..
IS T1.76 L..
E..
Cost-Maintenance
1110.00
F..
Cost-Services to Family t
Members
/1...
Cost -Other Services
/6=406 _N..
Cost-Follow up Services
--
Months -in 00-02
N..
Months-in Evaluation 06
0..
Months in Training 18
Months in 20-22
Months from Acceptance
to Closure 10-24
Earnings at Closure
Increase in Earningr-rso
Acceptance to Closure
P..
Public Assistance aCeTirgr
0..
Decrease in Public
Assistance from Acceptance
to Closure
R..
Occupational Level
S.,
Increase in Physica
Capacity I Mobility
(t)

7134321
,I
..
I4.-
PI,`,...
-2.14.1:-.,' t
;', ?..:.:;->
st
.,*.i.',. '''
,-Z1
II
r
--,i..
a,i_
I-
.
.
AG
.CO
E F
GH
IJ
LM
N(1) P
OP
ULA
TIO
N A
ND
(2) CA
SE
LOA
DP
RO
FILE
FO
RN
,IKY
A4A
so "OA
T C
raftier)-
A..' N
umber S
ervedcq C
. 771P
.
i:rvrtrcertosAf itcceephatedbilfior
C.
a.S-72,B..
Number" of Rehabilitants
per 100,000
J.
population
E..
Number of Rehabilitants
per 10,000
u3-?Disabled
C.
D..
National
Mean
se-
.S
uccess RatiO
26/084-28+30Z
w, K
..E
xpenditures per Counselor
oid,S9r
.Case Difficulty
.=---
L...
Percent Severly Disabled
M..
.Number in Case Load
N..
per Counselor
!4"b.
Number of Rehabilitants
per Counselor_la_

32
J,.
,,),
C:..-
1_
,..1.e.,...,1
i".,';',..
.6.-.4
- " ''''''''.2'. '
<
.114,14;1+.:
-,'"-,: .s
s..:1,
,,';-
-..1-'7-4
4
..",r4-,
,. A
.,..,7,,.
I04.-...,
',..,,nef,"...4
.4.
'It,
-Z
'
'' .":41"
..::'
k'''tf
'" ": '
101 .,
I,
AB
CC
IEIr°
3 H IJK
L. 111N
National
Mean
(1) COST, (2) CASEFLOW AND MANAGEMENT,
AND (3) CLIENT OUTCOMES PROFILE
FOR
PIAKYLAAIIS (2No'CitkRT)
Months from Acceptance
to Closure 10-24
Earnings.at Closure
.
Increase in
rom
Acceptance to ClosUre
Public Assistance afTWIRFAT-
0..
Decrease in Public
Assistance from Acceptance
to Closure
Occupational Level
Increase in Physiiii---------
CaNcity & Mobility
A.. Cost Per Rehabilitant
igLSY.00 G..
6..
Cost-Diagnostic &
iH..
Evaluation
ifih" I..
C..
Cost-Physical or Mental,
J..
Restorati
42.2724 K..
D..
Cost-Training
71:97/L..
E..
Coit -Maintenance
gito00
F..Cost-Services to Family g
Members
1 .29. oct
Cost-Other Services_73.00M..
Cost-Follow up Services
Months-in 00-02
N..
Months-in Evaluation 06
0..
Months in Training 18
Months in 20-22
P..
R..
S..
3 Mil
111,
IN.
'.,1.
4
.
.
IN.,.....,,,
.,,........:
._.
.,..*._,, Pm4,':-
'`,
EM
I
.
,..\,4:r.at,*
illill
a..111111
ME
_IIII
AB
CC
IEF
GH
IJKLM
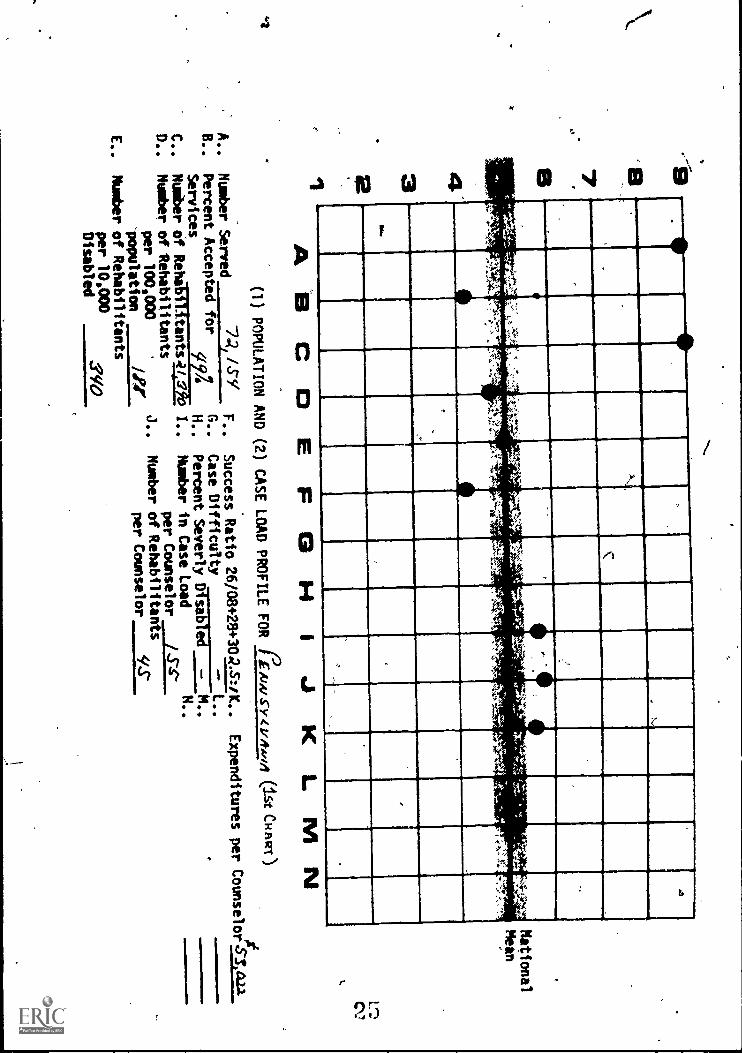
N(1) POPULATION AND (2) CASE LOADPROFILE FOR
ilAwslv.eteAvm (ist CHART)
A..
Number Served
74, /SY
F..
B..
Percent Accepted for
qG..
Services
c194
H..
C..
Number of Rehabilitants4c/Po
D..
Number of Rehabi ti tants
per 100,000
J.
population
E..
Number of Rehabilitants
per 10.000
Disabled
85/0
National
Mein
Success Ratio
26/08+28+304?-7:A..
Expenditures per
CounselorS
IAU
Case Difficulty
L..
Percent Severly
Disabled
M..
Number in Case Load
N..
per Counselor
/S-s`
Number of Rehabilitants
per Counselor
S/S-

aB7
A..
B..
C..
D..
E..
F..
32I
Em
ma
..,...
A,
...,4...,,r
-:>Y ",-r
';4,"'Ai.,Ar
41...=2*k
'No',
*,.,
..
4,,..
,,,..,4-....
___
National
Mean
A a
EJ K
LiV
I
PROFILE FOR
/0A.s.tyL14,Aq4 (2NotaftmT)-
(1) COST, (2
CAS
AND MANAGEMENT, AND (3) CLIENT OUTCOMES PRO
e-nr-noo
/Cost PerRehabilitant //:>7 - G..
Cost-Other Services,
ISS9.°°
Cost-Diagnostic &
H..
Cost-Follow up Services
Evaluation
tiek)..)
I..
Months-in 00-02
Cost-Physial or Mental)
3..
Months-in Evaluatiod,-06
Restoration,
4294,1eifN
Months in Training 18
.-...-
Cost-Training
k a2v_t: ir L..
Months in, 20-22
Cost-Maintenance
Cost-Services to Faailly
Members
/
11
N0P..
n.,
R..
S..
Months from Acceptance
to Cloiure 10-24
Earnings at Closure
Increase in Earnings
row
Acceptance to Closure
Public Assistance aftosr-rre
Decrease In Public
Assistance frcm Acceptance
to Closure
Occupational Level
Increase
Physica
Capacity & Mobility
C..1
7es42
NM
I.
IIII
, ,---
113111111111111,11111111111111111111
41e)' '4"-.4w
,,e,
'to-..
.xba;
-,
,,q.-
..'%.0
.-i
l' e*x
, , -:
''S...;
,X.
.t''
Yz
ItyIt:4:1
A't
r.7:
MI
IIM
IN
M111111
.
.MUMMIli
A B
C C
3E
FC
3II,
IJ K
L. M
National
Mean
c:
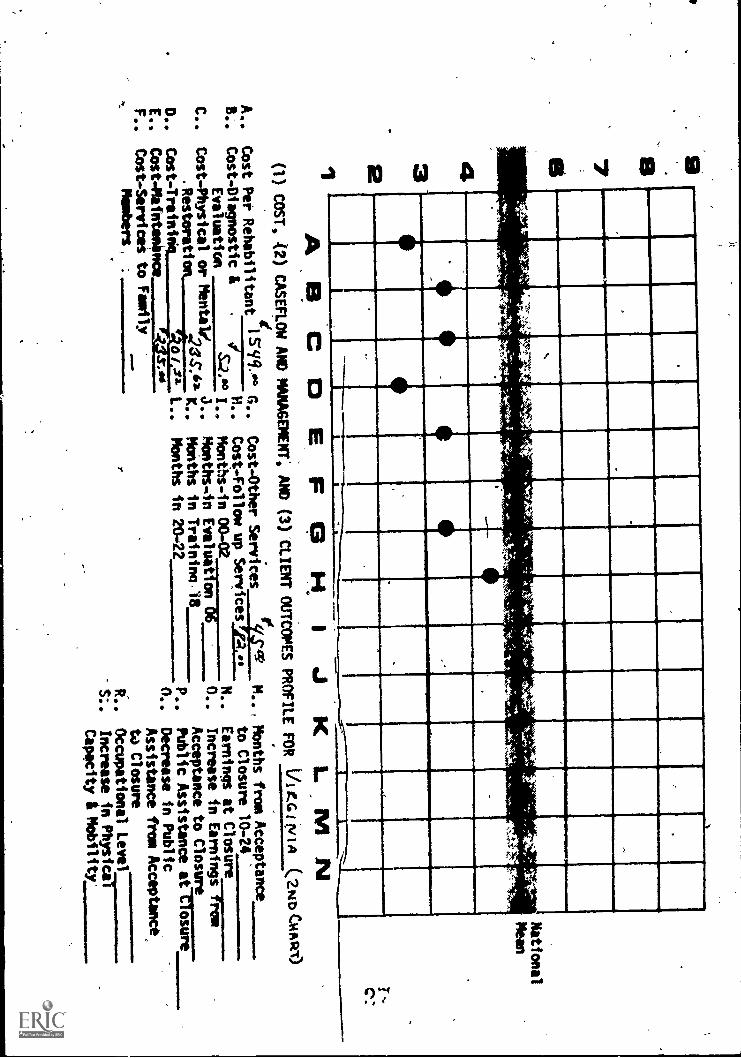
(1) COST, 12) CASEFLOW AND MANAGEMENT,
AND (3) CLIENT OUTCOMESPROFILE FOR
VI rG t tyi A (2> Clipt-v)
A
A..
Cost Per Rehabilitant
I=Y/.."° A..
R. Cost-Diagnostic &
Evaluation
S.4** I..
C..
Cost-Physical or Mental?
a..
.Restoration
D..
Cost Traininq
a/ 01 L..
E..
Cost - Maintenance.
F..
Cost-Services to Fawn
Members,
0.1121.
Cost -OtherServices
F'S'
M..
Cost-Follow up Services "..1.4
Months-in 00-02
N..
MonthsAn Evaluation 06
0..
MoMths In Training 18
Months in 20.22
P..
0..
,Months from Acceptance
to Closure 10-24
Earnings at Closure
Increase in Earningrfreiii
Acceptance to Closure
Public Assistance
aftostrireDecrease in Public
Assistance from Acceptance
t4 Closure
R..
Occupational Level
S:.
Increase in Physical`-"'
Capacity t Mobility'

97B4321
11116E11111111ip
kr
AB
CC
IE.F13.H
1J K
LM
N(1) P
OP
ULA
TIO
N A
ND
(2) CA
SE
LOA
D P
RO
FILE
FO
RL
OE
sr VIeG
INIA
(1ST C
HR
RT
)
A..
Number Served
MI 603
B..
Percent Accepted for
Services
7P%
C..
Number of
FtehatiliW
ria7tatD.. lumber of Rebabilitints
per 100,000
population
qr..?
E..
Number of Nebebilitents
per 10,000
=4#4,
Disabled
G.
N.
I.J.
National
Mean
.Success Ratio 26/08+20+3011:i
K..
Expenditures per
Counselort0,qa
.Case Difficulty
-- L..
.Percent
Severly
Disabled
M..
4Number in Case Load
N.
per Counselor
94.
Number of R
ehabilitaitiper Counselor
v49

B7B43-2
.......-.,
II..
-*.
.1..'"-,. --;"?'"
---';''"
,-r-v;.- ..r
i'
,,",,-'',
./
.4-
.
-!..--,
I
1s
-'
1
r_ser .l
--'''".
I.Y
'',:,.,...,
...:444,.
....
rt.".....-:--.
-,
1
,
..I
1
National
Mean
AB
`CC
IE.F
0H I
J(1) C
OST
, (2) CA
SEFL
OW
AN
D M
AN
AG
EM
EN
T, A
ND
(3) CL
IEN
T O
UT
CO
ME
S PRO
FILE
FOR
LA
-) Es'r U
Iea IA A
(2ND
CH
AR
T)
A..
Cost Per Rehabilitant1/S/90.°D
G..
Cost-Other Services
4_ia_%°°M..
8..
Cost-Diagnostic &
,H..
Cost-Follow up Services :Zit=
Evaluation
/7-44°° I..
Months-in 00-02
6.'
N..
C..
Cost-Physical or Mentale
J..
Months-in Evaluation 04 o./
04.
Restoration
3200.1° K..
Months in Training 18
1r,a
D..
Cost -Training
221.2!....L..
Months in 20-22 '
-7.s
P..
pos...
,0-
E..
Cost-Maintenance
F..
Cost-Services to Family,
Members
MA
",1,
R..
S..
Months from Acceptance
to Closure 10-24
Earnings at Closure
Increase in Earnings
rpm,
Acceptance to Closure
.24.519,K
Public Assistance at Closure yi's
Decrease in Public
Assistance from Acceptance
to Closure
Occupational Level
Increase in Physics
Capacity & Mobility
CN
:

16
MicroAspects of Program Evaluation
Ailother possible aspect of program evaluation activity
might probe more in depth into interrelationships. The same
general types of questions are applicable, however, relation-
.ships within such factors may be examined to gain Specific
information within a program or within potential rehabilitation
contributing variables. For example, these particular
statistical analyses were computed for 10% of all the clients
closed in any category from the fiscal year July 1, 1969 to
June, 30, 1970 in Wii/a.. Various questions about the program
were examined from information recorded on the standard
RSA-300 form. Who was accepted for services (Table 1), and
of those accepted, who were successfully closed (Table 2)?
What are the significant predictors of successful closure
(Table 3),'and what efforts, in time (Table 4) and money
(Table 5) were" needed to make them successful closurest What
factors or characteristics are associated with reduction
in public assistance'(Table 6), least public assistance at
closure (Table 7), greatest increase in weekly earnings
(Table 8) and greatest weekly earnings at closure (Table 9)2
Some other potentially helpful analyses could not be
conducted (e.q for gain in physical capacity or mobility)
since adequate information is not available from the RSA-300
form. Such demographic items as age, sex,'referral source,
:10

17
education, marital status, and type of disability, often suggested
as significant determiners of outcome, are however statistically
verifiable.
Stratified Random Sample
The 10% sample was selected as follows: The total
population was stratified into (a) the five closure types
(00, 02, 26, 28, 30), (b) the 6 major disability types
(1, 2, 3, 4, 5, 6), (c) the sex of the client (M, F) (d) the
age ofthe client into three classifications (under 30, 31 to 50,
51 and above years of age). For each of these 5 X 6 X 2 X 3
cells 10% of cases were selected. Finer stratification was made
within each of the six major disability types, and 10% random
seliction was made within these finer distributions to the
extent possible. The final stratified random sample was drawn
from the population giving a total of 1397 cases which was
10.06% of the total.
Table 1--Who is Accepted for Services?
Categories such as referral source produce statistically
verifiable differences as to whether a client is or is not
accepted for services. Within this category clients referred
from a Social Security Disability Determination Unit had a
31

18
remarkatIly poor rate of acceptance. Of the 283 clients referred
by this source only 27 were accepted when one should expect
146.4 acceptances. This difference between the expected and
observed values gives a chi-square value of 201.72 which is much
less than .01 chance. Of the subcategories having a greater
than expected rate of acceptance, those clients who were
self-referred were most accepted. Of the 273 clients who were
self-referred, 200 were accepted when only 141,2 would be
expected to be accepted. This produced a chi-square of
50.68 which is alsq significant to the .01 level.
Other cateoories effecting acceptance were Sex--
of the males 344 out of 804 were accepted when 415.9 should
be expected to be accepted. This produced a chi--square
value of 25.75 (significant at .01). Of the females 374 out
of 584 were accepted when only 302 were expected to be accepted.
This resultant chi-square value of 35.45 was also significant
at the .01 level. The category of Disability as Oeported had
significaft breakdowns (eq., only 2 out of 28 clients with
Emphysema (Code 651) were accepted when one would expect 14.5
acceptances.) This produced a chi-square value of 22.29
(p, <.01). Clients whose Disability as sported was Conditions
of Teeth and Supporting Structures (Code 660) were accepted
(148 out of 179) more often than expected (92.6) to produce
a chi - source value of 68.68 significant at .01. Analysis of
;32

19
variance Wls used on continuous variables such as Months in
Status 00 to 02. Clients in this status 8.7 months or more
(N*648) were significantly (2.< .01) less accepted than those
clients who were in that status 3.5 months or less (N=636). This
means that the shorter the duration of time between Referral
(status 00) and Application (status 02) the better the chance
of acceptance. Direct examination of Table 1 reveals many
other factors significantly*related to acceptante for services.
Table 2--Of Those Accepted, Who is Successfully. (Status 26) Closed?
This table represents the statistically discreet attributes
of those clients who were closed successfully. Chi-square
analyses were again used on non-continuous variables and showed
for example that the client's Major Disability affected his
chance of successful closure. Clients whose Major Disability
was classified as a psychotic disorder (Code 500) were successfully
closed in only 16-out of 34 instances when 29.2 should bt
expected to be successful. The resultant chi- square value of
41.86 is significant at the .01 level. A Major Disability
type with a greater than expected rate of success was Conditions
of 'teeth and Supporting Structures (660) which were successfully
closed in 136 out of 141 cases when only 121 would be expected
to be successful. This produced a chi-square value of 13.15
also significant at<.01.

20
The continuous variables were analyzed by analysis of
variance. Education proved to be a significaRt determiner
because the 607 out of 616 who were closed successfully
had a 9th grade or higher education while 101. oat of 102
unsuccessful closures had a less than 9th grade education.
This produced an F value of 5.81 which is significant at
the .05 level. As another example, the successful closures
were marked by taking significant less time (mean 13 months)
from acceptance to closure (status 10 to 24) than those clients
closed unsuccessfully (mean 24 months). The resulting
F value was 41.33 which is.significant at< .01. In this table
positive values were assigned to those items having a significantly
greater than expected rate of success while negative values
were given to those items Significantly less successful than
expected. The magnitude of the positive or negative value
was given to the level of.significance4:.06 was assigned a
value of 1 while< .01 had a value of 2.
Table 3-Predicting Successful (Status 26) and Unsuccessful
(Status 08, 28, 30) Closure from RSA-300 Intake Data
This table notes the rate of successful closures as
determined by information obtained in Part 1 and Part 2 of the
RSA-300 form (that information recorded at the completion of
the referral process and before acceptance). Referral Source
2 4

21
was again significant with self-referrals (70) having a greater than
expected rate.of acceptance--190 out of 273. This produced a
highly significant chi-square value of 70.32. Other referral
sources had poor rates of acceptance. Clients referred by-the
SSDI Determination Unit (50) were cloied successfully in only
20 out of 283 cases. The resultant chi-square was*159.63
which is significant at ..01. Further, those clients who
were not applicants for SSDI were successful more often than
expected 562 out of 1006 -(Chi-square value 44.92, significance( .01),
while the other SSDI statuses were less successful than expected
(e.g., allOwed benefits (1) 28 out of 140 successful giving a
chi-square of 33.71 with ae...01 level of significance).
Analysis of variance was used for computation with continuous
variables such as Months in Status 00-02. This analysis showed
that clients who were in this status longer (8 or more months),
were successfully closed significantly less than those in this
status a shorter time (3 months or less). This analysis
produced an F value of 101,6 which is significant at ..01.
The categories of Disability as Reported and Major Disability
were coveredin supplements 3A and 38 respectively to include
all 1, 2, or ,3 digit disability codes that were significant.
An example from 3A-Disability as Reported was code 5--, mental
disorders; gm of 289 successful, chi-square 84.58, EL<.01;
52-, other mental disorders 13 of 80 successfully closed; chi-
square 25.5, /l< .01; 520, alcoholism, 9 of 38 successful,

chi-square
disoiders,
shows that
52-'s have
successful
22
6.58, El.:( .05; 522 character, behavior and personality
3 of 37 successful, chi-square 19.72, EL(.01. This
while 5--'s in general are successfully closed, the
a poor rate of success, with 522's generally less
than 520's.
Table 4-Of Those Closed Successfully (Status 26), Which Cases'
Required the Most Time?
This table gives the mean time, in months from acceptance
to closure (Status 10-24) of the significant indicators. Since time
was a continuous variable, other continuous independent
variables were split into logical sub-categories so that they
and the non-continuous variables could be treated as independent
variables in the analyses of variance. Age was treated in
this manner. The analysis of variance yielded an F value of
15.8 significant at<.01. The Duncan multiple comparisons test
was used to compute the significance of the stratified subcategories.
The results showed that clients over 60 ook less time (8.1 months)
than those clients age 40-49 (10.6 month) end much less than
those clients age 19 or less (24.7 months.), Non-continuous
independent variables were treated in'the same manner except
in a category with only 2 parts such as sex where no Duncan test
was needed. Males took longer (15.4 months) than females (11.1 months),
F= 14.5, El< .01.
'26
23
This table has two major uses (a) predicting the length
of time to successfullriclose a particular type of case or
(b) as a standard to copipare a counselors efficiency In amount
of time expended.
Table 5-Of Those Clients Closed'Successfully (Status 26),
Which Cases Required the Most Mbney?
This table gives the mean cost of case services in dollars
of all services-total. The dependent variable._ dollar expenditure
was treated in the same manner as time in Table 4 in that analysis of
variance and Duncan multiple range test were used to determine
areas of statistical, difference. Age again was a significant
determiner (F 8.44, 1'' .01) with the youngest clients, those
19 years or less, requiring more money ($1015.81) than any other
age group. The client's marital status also proved significant
(F * 7.97, 2.4.01). The single clients cost more per person
($872.15) than any other group -- married $448.52, widowed $404.69,
divorced $577.82, or separated $415.38.
It has often 'been suggested that the more money PUt into
a case the greater the client's earning potential would be.
This idea did indeed hold up statistically (F 4.93, IL4L.01).
The 71 clients who earned $100 or more per week at closure cost an
average of $1001.63 while the 131 clients who had no weekly earnings
cost $525.96 per person. As expected, since earnings differ according
37

24
to type of occupation, the occupational code waslalso a significant
determiner (F = 3.71, 114,01). Those clients who were employed
in professional, technical and managerial occupation at closure
cost more to successfully rehabilitate ($1281.45 per person)
than any other major type, while those employed in faring and
related occupations cost the least ($295.43 per person)
to successfully rehabilitate. Since it would be expected that
the professional technical and managerial occupations generally were
more highly educated, it is consistent that those clients who were
college graduates would also have
the highest case cost. This proved to be true since they had a
mean cost of $1191.29 significantly (E . 7.29, /14.05) more
than any other educational category.
Table 6-Which Clients Showed the Greatest Reduction in Public
Assistance mi. Month?
This table displays the mean reduction in all types Of
public'assistance per *month between intake a d \ closure for
each significant category. Since Amount of Public Assistance
is a continuous variable, analysis of variance and Duncan
analyses were again used. Referral source, again a significant
determiner, (F 7.26, 2.4.01) revealed that those clients
referred by welfare agencies had the greatest reduction in
assistance at closure. The 80 clients were reduced by a mean
of $33.01(a total savings of $2640.00 per month). Clients

25 tir
Whose total monthly family income at entry was `ow (5150.00-199.99)
had greater reduction in assista ce $30.20 than any other entry
income category (F = 5.05, E s4bl). ,..4.ogically, if the source
of support at entry was Public Assistance the reduction would be
affected more. This notion was validated since-the 78 clients
whose support was Public Assistance were reduced $78.70 (a total
reduction of $6138.60 per monthL F = 58.7, iv..01. Remember rig
that this is a 10% sample and multiplying that savingYby 10
produces a saving of more than $60,000 per month in that category.
Table 7-Which Clients Showed Least Public Assistance Br:Month
at'Closure?
This table explores the characteristics of clients receiving
public a4Elstance at closure. Referral sourceis again a
significant determiner (F = 7.98, B1.4.01). The Duncan multiple
range tests were used to determine differences within the
category. Welfare agencies had the highest mean ($39.96
N.50), while those clients referred by private organizations
and health organizations and agencies had the lowest means
(0.0, N=15 and 0.0, N.20 respectively). Marital Status was
also significant (F . 4.87, EL<.05). The separated clients
had the highest mean assistance amount of $20.18 while the
single clients had,a mean amount of $2.68.

26
As expected from Table 6 those clients whose primary
south of support at entry was Pyblic Asiistante also had the
highest amount of assistance at'closure ($98.85). The overall
category of source of supportyas again significant (F 53.3, (7;01).
Table 8-Which Clients Showed Greatest Increase in Weeklv'EarAings?
This table-shows poSitive effetts of the rehabilitation'
process in terms of the difference between the client weekly
earnings at entry and at closure. Analysis of variance and the
Duncan multiple range test were used because increase in Weekly
earnings was treated as a continuous dependent variable.
The category Age was again a signifiCant variable.. F 5.05,
Itc.01). Acceptance or non - acceptance produced an F value of
165.6, 2.<.01. The clients who were not accepted actually
had an average reduction of $13.70 in weekly earnings while
the clients who were accepted increased their weekly earnings
by $23.10.
As suggested in Table 5, greater expenditures generally
resulted in a greater rate of success;, this proved to also, be
true in increaseAn earnings. The amounts of money spent by
Rehabilitation Facilities or by Social- Security Trust Funds
were significant determiners with &mean increase of $12.30
lye 12.3 and 4.47, both significant kl..01). These clients
on whom $1001 or more wes.sPent by Rehabilitation Feeilitiet
40
40.
Z7
(
had the greatest increase of $59.10 per week, and the clients
on whom $1001 or more was spent from Social Security Trust
Funds also had the greatest increase in weekly earnings in that
category ($114.00).
The indication from Table 4 concerning the length of time
being a significant factor was borne out by the category
Months in training (Status 18) (F 47.1, e.01). The clients
who were in this status 19 months or more had a weekly
increase of $77.70 while the lowest increase ($7.80) was shown
by the clients who were in this status 6 months or less.
Table 9-Which Clients Showed Greatest Weekly Earnings at Closure?
This table characterizes those clients who were earning
most per week at closure. Age produced an F 7.17, E.4.01 .
Clients age 19 or less earned the most ($63.20) per week while
the oldest clients (over 60 years of age) earned least ($20.10)
Per week. Major Disability was also a significant (F . 3.07,
L'<.01) determinec--Clients whose Major Disability was
absence or amputation (4--) earned most at closure ($61.30 per week),
while those clients whose disability type was mental or
personality disorder (5--) had lowest ($33.20) weekly earnings
at closure.
Education again proved to be a significant factor
(F * 15.5, EL<.01). Clients with the greatest amount of
41

28
education (16th or more - college graduate) earned most at
closure - $74.10 per week. However, those with least education
(less than 9th grade) earned $33.70 per week, which was the
lowest amount for this category. As indicated in Table 4
and Table 8 the greater the length of time spent the better
the results for category Mbnths in Training (Status 18,
F = 11.9, 2.< .01). The clients who spent the most time in
training (19 months or more) earned most ($85.20 per week),
while the clients who spent least time in Status 18 ( 6 months
or less) earned least ($40.70 per week).
Overview of Tables 1-9
There were several categoriesta number of which are often
suggested by counselors in the field, that were significant
determiners of rehabilitation outcome. That is, some variables
showed up in several tables as significant contributions to
rehabilitation or non-rehabilitation. The categories that
were most prevalent are summarized in the following chart.

29
TABLES 1 throrgh 9 SUMMARY
CATEGORY, 1
X
2
X
3
X
4
X
5 6
X X
8 9
XReferral Source
Age X X X X X X
Sex X X X X
SSDI Status X X X X
Disability as Reported X X X X
Major Disability X X X X X
Marital Status X X X X X X X
Education XXXX X
Cost X X X X
Time in Status X X X X X X X X
Weekly Earnings Entry X X X X X X
Weekly Earnings Closure X X X

P-300-Part& Letter Cateoory
TABLE 1
WHO IS ACCEPTED FOR SERVICES?
10% SAMPLE FY 69-70Subcategory Acc-
epted
Referral Source a. General Hospital (24)b. Other Hospital (29)c. S.S. Disability
Determination (50)d. Correctional
Institution (56)e. Artifical /
Appliance / (60)f. Self Referred (70)n. Physician (72)h. Other (79)
Sex
Disability AsReported
TOTAL
Male (1). Female (2)
TOTAL
Not
Acc-/eptad
17 4
16 3
27/ 256
10 25
X.2
or F Prob. Value
7.18 <.01 +28.03 <.01 +11
201.72 <01 f4 -2
7.52 <.01 -2
13 1
200 7392 33
112 58
718 670
344374
718
9.48 <.01 +250.68 4.01 , +223.95 <.01 +213.64 (.01 +2
460210
670
25.75 <.01 -235.45 <.01 +2
b.
c.
d.
e.
V.
1.
Ill Defined OrthopedicDiseases (383) 2Arthritis
Rheumatism (390) 3Accidents Ill Def. Ortho.Injuries (399) 30Lower Extremityaccidents (439) 14PsychoneuroticDisorders (510) 16Other BehaviorDisorders (S22) 7
Other Disorders ofNervous System (639) 7ArtereoscleroticHt. Dis. (642)
Emphysema (651)
Other Dis of Resp.System (659) 9
. Conditions of Teeth (660) 148Hernia (663) - 15Conditions of
Genito-urinary (670) 27SystemTOTAL 718
10
11
55
4
33
30
17
1 192 26
20
31
3
7
470
5.91 <.05
5.15 <.05 -1
9:19 401 -2
4.89 <.05 +1
7.14 <.01 -2
15.95 <.01 -2
4.89 <.05 .1
17.49 <.01 -22239 4.01
11.82 <.01 -268.68 <.01 +27.20 <.01. +2
10.43 (.01 +2

:TABLE 1 (con't)
k-300 Part
I Letter Category Subcategory
2 -B SSDI Status at a. Not applicant 0)Referral b. Applicant - allowed il)
c. Applicant - denied 2)
d. Applicant - pendinn (3)
e. Not known (4)
TOTAL
Months in
Status 00 to02
a. 8.7 moor moreb. 3.5 mo. or less*
- H1 Major Disability a. Ill-Def. Accidental OrthoInjuries (399) '
b. Low extremities
Acc. Injuries (439)c. Other Disorders of
Nervous System (639)d. Artereosclerotic
Deg. Heart Disorder (642)e. Emphysema (651)f. Other Disorders of:the
Resp.System (659)a. Conditions of teeth (660)-h. Hernia (663)
i. Conditions of
GenitotUrinary (670)SystemTOTAL
2-H2 Secondary a. Visual Impairments (1) -
Disability b. Orthopedic Deformity (3)c. Mental Disorder (5)d. Unknown Etiology (6)e. None (9)
TOTAL
2-I PreviousClosure
a. Yes, 'Rehab(2)
TOTAL
2-J Marital Status a. Divorced (3)
b. Never Married (5)
TOTAL
4 fj
I
NotAcc- Acc- x
2
epted epted or F Prob. Value
64638
18
16
0
718
380102112
61
12
670
51.8533.8974.72
29.54
12.86
<.014.01<.01
<01<.01
-2-2
-2
-2
648 F186.8 <.01 -2636 <.01 +2
28 37 9.09 <.01 -2
14 1 6.47 <.05 +1
9 16 6.73 <.01 -2
2 11 11.55 4.01 -21 15 20.15 4.01 -2
4 11 7.60 <.01 -2141 22 0.54 <.01 +217 3 4.73 <.05 +1
34 7 8.08 <.01 +2
718 454
62 9 8.91 <.01 +222 1 6.66 <.01 +227 2 6.73 <.01 +2
179 34 16.88 <.01 +2414 241 20.95 <.01 +2
718 290
55 9 9.19 <.01 +2
718 325
64 16 4.30 <405 +1227 128 4.78 <.05 -1
718 319

R-300 Part& Letter Category
2-N
TABLE 1 (const)
Subcategory
Work Status a. competitive (1)b. other (8)
2-0
2 -Q
2-R
3-A
WeeklyEarnings atEntry
Type of PublicAssistance
TOTAL
Not ,e
Acc- Acc- or Fepted epted
227 63 9.24
324 180 8.12
718 307
Prob. Value
a. j3.71 or lessb. $18.04 or more
a. APTD (3)
TOTAL
/
Source of a. Current Earnings (0)
Family Support b. Public AssistancePartly Fed. (3)
c. Other Insurance Benefits
(8)
Federal Pro- a.
gram Identif. b.
C.
TOTAL
None (0)S.S. Dis. Ben.Trust Fund (1)Public Offender (20)
TOTAL
200
45
69
700
55
33
12
301
8.63
5.62
8.89
i01
i05
i01
+2-2
-2
+2
-2
.2
413I

.
OF THOSE ACCEPTED,
P-300 Part& Letter Category
TABLE 2
WHO IS SUCCESSFULLY (STATUS10% SAMPLE FY 69-70
Subcategory
426imisi.j.2EULaaNINNII.10
26)
Succ-eesful
CLOSED?
Unita-essful
.
X2or F Prob. Value
1
/
1-0 Referral Source a. Mental Holspital (20) 27 31 73.28 <.01 -2
b. Public Welfare Agency (40)c. Correctional Institution
34 16 12.99 4.01 -2
(56) 4 6 17.21 <.01 -2
d. Self-referred (70) 190 10 13.91 <.01 +2
@. Other (79) 104 8 4.58 (.05 +1
TOTAL 616 102
1-F, Sex a. Male (1) 270 74 15.06 <.01 -2
b. Female (2) 346 28 13.86 <.01 +2
TOTAL 616 102
1-G Disability as a. Lower Limbs- Accidents (379 11 5 3.81 <.05 -1
Reported b. Psychotic (500) 20 18 34.29 <.01 -2
c. Alcoholism (520) 9 7 11.46 <.01 -2
d. Conditions of Teeth (660) 143 5 14.24 <.01 +2
TOTAL 616 102
2-B SSD' at ... Applicant-Allowed (r) 28 10 4.57 <.01
Referral . Applicant-Pending (3) 10 6 7.12 <.01
TOTAL 616 1021
)
..,-,--.....
2 -Hi Major-Disabilit .. Other yisual ImpairmentsIll Defined (149) 35 1 3.86 <.05 +1
. Psychotic Disorders (500) 16 18 41.86 <.01 -2
. Alcoholism (520) 7 8 18.84 <.01 -2
. Other Behavior Disorders(522) 16 7 10.15 <.01 .-2
'. Conditions of Teeth (660) 136 5 13.15 <.01, +2
.
.
TOTAL 616 102
2-J Marital Status a. Single (5) 183 44 4.99 < ,05 -1
TOTAL 616 102
MIONVIWNWO.NIIM$MMelIMMNININIMINI
2-M Highest Grade a. 9th grade or more 607 F"5.81 <.05 +1
Completed b. Less than 9th grade 101 <.05 -1

TABLE 2 (con't)
P-300 Part& letter Cateeory Suhcateaory
Succ- Unsucc- X2essful eefful or F
(26) (28 & 30)
Prob. Value
*2-N Work Status At a. Competitive (1) 218 9 19.53 <.01 +2
Entry b. Homemaker (5) 83 4 6.59 <.01 +1
c. Other (8) 245 79 27.53 <.01 -2
TOTAL. 615 102
_
2-0 Weekly.Earnings a. > $21.22 595 .F19.3, <.01 +2
At Entry b. < $ 5.88 99 <.01. -2
4
1.,II-
..1'Total Monthly a. > $225. 596 F10.4q <.01 +2
Family Income h. < $175. 94 <.01 -2
t-R Source of Famil3a. Current Earnings (0) 193 7 18.31 <.101 +2
Support b. Public Assistance.(3) 34 11 4.08 <.05" -1
c. Public Insitution (5) 23 34 98.65 <.01 -2
TOTAL . 586 98
3-A Federal Pro- a. S.S. Beneficiary
gram Ident. Trust Fund (1) 10 10 20.80 <.01 -2
TOTAL 587 98
, .
3-81 Cost of All . > $510.20 615 F19.8 <.01 +2
Services ,. < $185.67 101 <.01 -2
,
...E SSDI Status at a. Not applicant (0) 37 14 7.06 <.01 -2
ClosureTbTAL 566 95
4 .
3-F Work Status At a. Competitive (1) 434 6 41.25 <.01 +2
Closure b. Self employed (3) 25 0 4.09 <.05 +1
c. Hememaker (5) 120 3 9.21 <.01 +2
id. Other (8) 1 60 476.3 <.01 .2
TOTAL 612 75
3-G Weekly Earnings a. >$N9.45 594 F84.31 N.01' +2
At Closure b.4 5,88 99 e.01 -2
71'. /
R -300 Part
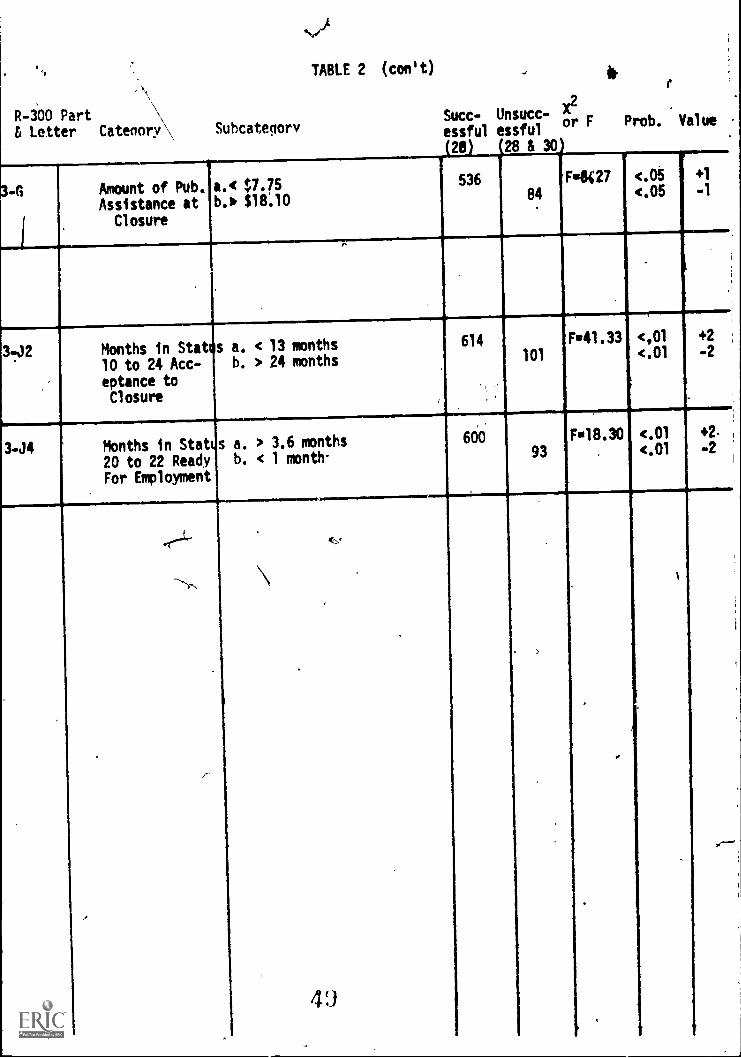
6 Letter Category
3-G Amount of Pub.Assistance at
Closure
Subcategory
a.< $7.75b., $18.10
TABLE 2 (con't)
Succ- Unsucc- X2r F Prob. Value
essful essful
20 28 & 30)
53684
FIRST 27 .05(.05
3.12 Months in Stat s a. < 13 months
10 to 24 Acc- b. > 24 months
eptance toClosure
3-J4
614
Months in Stet s a. > 3.6 months
20 to 22 Ready b. < 1 month-
For Employment
600
F41.33101
<,01
<.01
+2
-2
93
F18.30 <.01<.01
+2.
-2
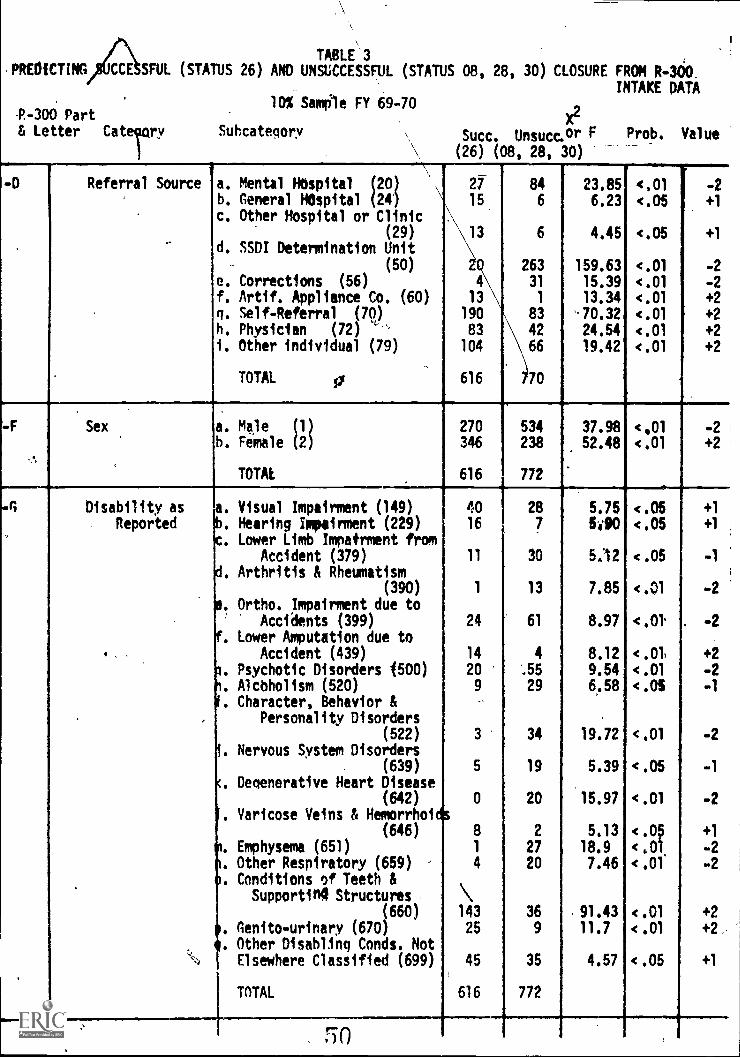
TABLE '3,PREOICTING CCE SFUL (STATUS 26) AND UNSUCCESSFUL (STATUS 08, 28, 30) CLOSURE FROM R-360.
INTAKE DATA
P.-300 Part& Letter Caterry
10% Sample FY 69-70
Subcategory
x2
Succ. Unsucc. or F Prob. Value
(26) (08, 28, 30)
-D Referral Source a. Mental Hospital (20) \
b. General HOspital (24 '
c. Other Hospital or Clinic(29)
d. SSDI Determination Unit
(50)
e. Corrections (56)
f. Artif. Appliance Co. (60)g. Self-Referral (70)
h. Physician (72)
i. Other individual (79)
TOTAL si
27
15
13
4
13
190
83
104
616
846
6
263
31
1
83
42
66
70
23.856.23
4.45
159.6315.3913.34
'.70.32
24.54
19.42
4,01<.05
<.05
<.01
<.01<.01
<.01
<.01<.01
-2
+1
+1
-2
-2
+2
, +2
+2+2
f .
-F Sex a. Male (1) 270 534 37.98 <901 -2b. Female (2) 346 238 52.48 <.01 +2
TOTAL 616 772
Disability as a. Visual Impairment (149) 40 28 5.75 <.05 +1
Reported '. Hearing Impairment (229) 16 7 5.90 <.05 +1
. Lower Limb Impairment fromAccident (379) 11 30 5;12 <.05 -1
,. Arthritis & Rheumatism(390) 1 13 7.85 <.01 -2
.. Ortho. Impairment due toAccidents (399) 24 61 8.97 <.0 -2
. Lower Amputation due toAccident (439) 14 4 8.12 <.01 +2
. Psychotic Disorders (500) 20 ..55 9.54 <.01 -2
. Alcoholism (520) 9 29 6.58 <.05 -1
. Character, Behavior &Personality Disorders
(522) 3 34 19.72 <.01 -2. Nervous System Disorders
(639) 5 19 5.39 .05 -1
. Degenerative Heart Disease(642) 0 20 15.97 .01 -2
. Varicose Veins & Hemorrhois-(646) 8 2 5,13 4.05 +1
. Emphysema (651) 1 27 18.9 <,01 -2
. Other Respiratory (659) 4 20 7.46 <.01 -2
.. Conditions of Teeth &Supportin4 Structures \
(660) 143 36 .91.43 <.01 +2. Genito-urinary (670) 25
. Other Disabling Conds. Not9 11.7 <.01 +2,
`4 Elsewhere Classified (699) 45 35 4.57 <.05 +1
TOTAL 616 772
rzn

TABLE 3 (coed)
P-300 Part& Letter Cateaory Suhcateaory
X2
Succ. Unsucc. or F Prob. Value
(26) (08,28,30)
!-B SSOI Status atReferral
a. Not applicant 0
b. Allowed Benefits 1
c. Denied Benefits 2
d. Pendina Benefits 3
e. Not known if applicant (4
TOTAL
562
28
16
10
0
616
464
112
11467
12
771
44.9233.71
54.1630.74
.9.58
<.01
<.01
<.01
<.01
<.01
+2-2
-2
-2
-2
Months in Status00-02
a. 8 or more monthsb. 3 months or less 540
774 F4101.f <.01
<.01
42+2
'-H-1 Major Disability a. Poliomyelitis (374)b. Arthritis & Rheumatism ,
(390)
c. Ortho. Impairment due toAccident (399)
d. Lower Amputation due toAccident (439)
e. Psychotic Disorders (500)f. Alcoholism (520)
a. Character, Personality &Behay. Disorders (522)
h. Nervous System Disorders(639)
i. Emphysema (651)
j, Other Resp. Disorders (65k. Conditions of Teeth &
Supporting Structures(660)
1. Hernia (663)
m. Genito-urinary (670),)
TOTAL
9
2
22
14
16
7
10
7
0
4
13616
32
616
1
9
43
1
42
19
27
18
16
11
27
4
9
556
5.61
5.20
9.12
10.01
14.496.84
9.65
6.0417.72
4.02
62046.0410:68
<.05
<.05
<.01
<.01
<.01
<.01
<.01
<.05<.01
<.05
<.01
.09<.01
+1.
41
-2
+2
-2
-2
-2
-1
-2
-1-J
+2
+1
+2
-H-2 Secondary Disab. a. Visual (1)h. Mental (5)c. Other Disablno Cone' (6)
d. None (9)
TOTAL
52.24 '157
352
616
19
6
56
303
392
4.386.5414.2360.78
---/
<.05(.05<.0T1
<.01,
+1
+1
+2+2
2 -I Previous Closure a. Yet: closed rehabilitated
TOTAL
49
616
15
427
8.08 <.01,
2 -J Marital Status a. Widowed (2)
b. Divorced (3)
c. Sin le (5)MAI ' 1
14-
65
57
183
Alfi
27
23
172
412,
4.87
4.68
9.09
<.05<.05
<.01
+1
+1
-2

TABLE 3 (cont,0)
R-300 Part,& Letter Category Subcategory
X2
Succ Unsucc or F
(26) (08,28,30)
Prob. Value
2-M
'
Grade
) fil
a. less than 9th gradeb. 9th grade,or more 607
422 F4.15 .
.
-1
+1
2 -N Work Status a. Competitive (1) 218 72 27.63 (01 +2
b. ether (8) 245 251 27.63 <AI -2
TOTAL 615 409
2-0 Weekly Earnings a. $11.73 or less 392 FB19.8 <.01 -2
At Entry b. $21.22 or more 595 <.01 +2
2-P Total Montle!). a. $199.00 or less 366 Fu9.49 <.01 -2
Family Income b. $200,00or more 596 <.01 +2
2-0 Type of Public a. Aid to Perm& Totally Dis. 5 11 'il';' 5.37 <.05= -1
Assistance .(3)
TOTAL 586 394
2-R Primary Source a. Current Earnings (0) 193 62 11.68 <.01 +2
Of Support b. Public Assistance (3) 34 44 8.75 <.01 -2
c. institution (5) 23 64 40,83 <.01 -2
d. Social Security 01 23 30 6.08 <.05 -1
e. Disability, Old Age, orUnemployment insurance (8) 67 14 17.41 <.01 +2
TOTAL 602 399
,
FOOTNOTE: The expected ',slues for the chi squares we - the to. 1 p rtions dosed'
successfully (26)
discarded.
.
versus not (08,28,30) when all,
4,
.
.,
.
incompl to (b1 nk) data were
.
r 4 )
1

TABLE 3 SUPPLEMENT AREDICTING SUCCESSFUL (STATUS 26) AND UNSUrCE3SFUL (STATM 08,28,30) CLOSURE FROM R-300
EXPANDED CATEGORY OF DISABILITY AS REPORTED
P-300 Part 10% Sample FY 69-70X2
& Letter Catenory Subcategory 4 Succ. Unsucc. or F
(26) (08,28,30)
Prob. Value
-G Disability asReported
.
.
a. 1--, Visual Impairmentsh. 149, Visual Impairments
due to unspec. causesc. 22-, Other hearing impair
52
40
71
28
38.47
6.75
<.01
<.05
+2
+1
menti-causes 24 11 8.36 <.01 +2d. 229, Hearing Impairment I
due to unspec. cause 16 7 5.90 <.05 +1
E. 3--, Orthopedid Impairmentf. 34-,35-, Upper Limb ortho
173 79 62.92 <.01 +2
impairmentq. 379, Lower 1.imb impairmen
7 25 6.52 <.06 1
due to Accidenth. 38-,39-,Other ortho impai
11 30 5.12 <.05 -1
ments 30 88 17.03 <.011 -2i. 390, Arthritis 1 13 7.85 <.00 -2
1. 399 Other impairments dueto accidents 24 61 8.97 <.01 +2
k. 43-,Lower limb amputation 16 4 10.33 <.01 +21. 439,Lower limb amputation
due to accident 14 4 8.12 <.01 +2m. 5--, Mental Disorders 206 83 84.58 <.01 +2
n. 500, Psychotic Disorders 20 55 = 944 <.01 -2
o. 52-, Other mental disorde 13 67 25.50 <.01 -2
p. 520,\Alcoholismn. 522, Character, Behavior .'
9 29 6.58 <.05 -1
Personality Disorder 3 .34 19.72 <.01 -2
r. 6--, Other Disabling Cond-,s. 63-, Other specified dis-
317 330 5.53 <.05 -1
orders oP nervous
m
13 37 6.78 <.01 -2
.t. 639, Nervous System Disou. 64-, Cardiac & Circulato
" 5 19 5.39 <.05 -1
, 3 Condidttos 29 67 7.72 <.01 -2v. 642,Deaenerative Heart Di
w. 646,Varicose Veins &. 0 20 15.97 <.01 -2
Melnorrhoids 8 2 5.13 <.05 +1
x. 65-,Respiratory Diseases 8 64 32.15 <.01 -2
y. 651,Emphysema 1 27 18.90 <.01 -2
z. 659,Other respiratory dis 4 20 7.46 <.01 -2
. AA. 66- ,Digestive Disorders 182 71 78.31 4.01 +2
AB. 660,Conditions of teeth& Slidporting structu s143 36 91.43 <.01 +2
AC.,670,Genito-urinary .o) 9 11.77 <.01 . +2
AD.-69-,Disabling Conds.(NEC 8 38 4.61 <.05 +1
AE. 699,Other Disabling Cqnd . .
Not elsewhere classif d.45 35 4.57 <.05 +1
TOTAt 616 772
. 58

TABLE 3 SUPPLEMENT B
EDICTING SUCCESSFUL (STATUS 26j AND UNSUCCESSFUL (STATUS 08,28,30) CLOSURE FROM R-300
P-300 PartEXPANDED CATEGORY OF MAJOR DISABILITY
X2& Letter Category Subcategory Succ. Unsucc. or F Prob. Value
041-1 Major Disabil4ty
N
a. 1 - -, Visual Impairments 72
b. 11-,Blindness, Both eyes 11
c. 2--,Hdaring Impairments 32
d. 22-,Other Hearing Impairs. 23
e. 229,Hearing Impairs. I11-Defined Causes 13
f. 3--,Orthopedic Impairment 81
q. 34-,35-,Upper Limb ortho.impairment 7
h. 374,Piliomyelitis 9
i. 38-,39-,Other or Ill-defi d
Ortho. impairmenti 30
j. 390, Arthritis & Rheumeti 2
k. 399,OrthopediC Impairmentdue to accident . 22
1. 4--.Amputation 21
m. 43-,Lower limb amputation 16
n. 439,Lower limb amputationdue to accident 14
o. 5--,Mental Disorders 92
p. 500,Psychotic Disorders 16
q. 52-,Other mental disorder, 17
r. 520,Alcoholism 7
s. 522,Character, PersonAlit,Behavior disorders 10
t. 6--,Other disabling conds.etiology unknown 318
u. 62-,Other specified dis-orders of nervous sys 15
v. 63990ther nervous systemdisorders not elsewhe
classified 7
w. 64,,Cardiac & CirculAtaryconditions 29
x. 65-,Respiratory Diseases 5
y. 651,Emphyseme 0
z. 659,Other Respiratory dis
eases 4
aa. 66-,Diaestive System disorders 177
ah. 660,Conditions of teeth& supporting structu 136
ac. 663,Hernia 16
ad. 670,Genito-urinary systdisorders 32
ae. 999 None 0
TOTAL 616
5,1I
36
3
11
7
4
119
t8
1
58
9
43
3
1
1
155
42
50
19
27
2.16
31,
18
4237
16
11
47
27
4
9
16
556\
8.693.81
8.277.02v-
3.9011.54
6.025.61
'11.96
5.20
9.12
11;7811.79
10.01
23.0514.49
19.786.84
9.65
10.64
1.29
6.04
3.87
25.6317.72
4.02
63.16
62.346.04
10.687.72
<.01 +2
.0:-1 +1
<.01 +2<.01 +2
,g.06 +1
<.01 -2
<.05
<.05 +1
<.01
<.05
-2
-1
-201 -2
<.01 +2
<.01 +2
<.01 +2
<.01 -2
<.01 -2
<.01 -2
<.01 -2
<.01 -2
<.01 +2
<.01. +2
<.05 ..1
<.05 -1
<.01 -2
<.01 -2
<.06 -1
<.01 +2
<.01 +2
.i905 +1
<.01 +1
<.01 -2
go

TABLE 4111
OF THOSE CLOSED SUCCESSFULLY (STATOS 26), WHICH CASES RFOUIRED THE MOST TIME10% Sample FY 69-70
P-300 Part& Letter Catennry Subcategory
Mean TimeIn Mos. N Va5 ue Prob. Value
1-0 Referral Source a. Fducational Institutions1 (1)
b. Hospitals or Sanitoriums30.9 35 <.01 -2
i2) 11.2 56 <.05 +1
c. Health Organizations (3) 20.3 24 <.05 -1
d. Welfare Agencies (4) 16.3 39 <.05 0
e. Public Organizations (5) 14.8 68 <.05 0f, Private Organizations (6) 9.8 /6 <.05 +1
g. Individuals (7) 10.6 3E6 <45 +1..
TOTAL 13.0 614 F=14.9 <.01
....
1-E Age a. 19 or less 24.7 78 .c .2
b. 20 to 29 years i 14.3 134 <.05 -1
c. 30 to 39 years 10.8 111 -:.05 0
d. 40 to 49 years 10.6 132 <.05 0
e. 50 to 59 years 10.6 101 <.05 0f. Over 60 years 8.1 58 <.05 +1
TOTAL 13.0 614 Fu15.8 (.01
11-F Sex a. Male (1) 15.4 268. (.01 -2
b. Female (2) 11.1 346 <.01 +2
TOTAL 13.0 614 F.04.5 <.01
1-G Disability as a. Visual Impairments (1) 12.8 71 <.05 +1
Reported- b. Hearing Impairments (2) 10.8 32 <.05 +1
c. Orthopedic Impairments (3 15.6 79 t.05 0
d. Amputations (4) 13.5 21 <.05 0
e. Mental Disorders(5) 20.1 83 <.05 -1
f. Other Disabling Ands. (6' 10.8 328 <.05 +1
TOTAL 13.0 614 Fm6.7 t.01
2-H-1 Major Disability a. Visual Impairments (1) 12.7 72 <.05, 0
b. Hearing Impairments (2) 11.0 32 <.05 0
c. Orthopedic Impairments (3) 15.3 81 <.05 0
d. Amputations (4) 13.5 21 <.05 0
e. Mental Disorders (5) 19.5 92 <44 -;
f. Other Disabling Conds. (6 10.7 316 ..05 +1
TOTAL 13.0 614 Fu6.3 <.Q1
r-r-0.)

TABLE 4 (con't)
P-NO Part& Letter Catenory Suhcategory
Mean TimeIn Mos. N F Prob. Value
Value
2-I Previous Closure a. No (1)
b. Yes, Rehabilitated (2)c. Yes, Not Rehabilitated (3)
TOTAL
13.57.5
12.5
13.0
55249
13
614 *4.11
<.05<.05
<.05
<.05
-1
+1
0
e-3 -Marital Status a. Married (1) 10.3 278 <.05 +1
b. Widowed (2) 9.8 65 <.05 - 41.
c. Divorced (3) 11.5 56 <.05 +1
d. Separated (4) 9.6 '32 <.05 +1
e. Single (5) 19.3 183 <.05 .1
TOTAL 13.0 614 '14.2 <.01
..0 Weekly Earnings at a. No weekly earnings (0) 15.1 357 <.05 -1
Entry b. $1 to $34 per week (1) 9.2 75 <.05 +1
c. $35 to $68 per week (2) 9.7 94 <.05 +1
d. $69 to $99 per week (3) 7.1 47 <.05 +1
e, $100 or more per week (4) 11.8 20 <.05 0
TOTAL 12.8 593 .01
' -8 -2 Rehabilitation a. $0 - $100 (1) 12.1 561 <.05 +1
acilities Total h. $101 - $500 (2) 14.0 18 <.05 0
Dollars c. $501 - $1000 (3) 23.6 9 <.05 0
d. $1001 or more (4) 27.5 26 <.05 -1
TOTAL 13.0 614 .01
'4.3 Social Security a. $0 - $100 (1) 12.6 606 <.05 +1
Trust Funds Total b. $101 - $500 (2) 50.8 4 <.05 -1
Dollars c. $501 - $1000 (3) 24.5 2 <.05 0
d. $1001 or more (4) 52.0 2 <.05 -1
TOTAL 13.0 614 F*16.3 <.01
3-A Weekly Earnings at a. No Weekly Earnings (0) 10.9 130 <.05 +1
Closure b. $1 to $34 per week (1) 11.8 110 <.05. +1
c. $35 to $88 per week (2) 11.9 184 <.05 4-.l
d. $69 to $99 per week (3) /3.0 91 <.05 +4
a. $100 pr more per week (4) 21.2 71 <.05 -1
TOTAL 12.97 593 F7.5 <.01
3-I Occupational Code a. Professional, technical,or managerial (0) 20.P 25 .05 -1
G. Professional, technical,or managerial (1) 17.3 20 <.05 0
c. Clerical or sales (2) 13.4 66 <.05 0
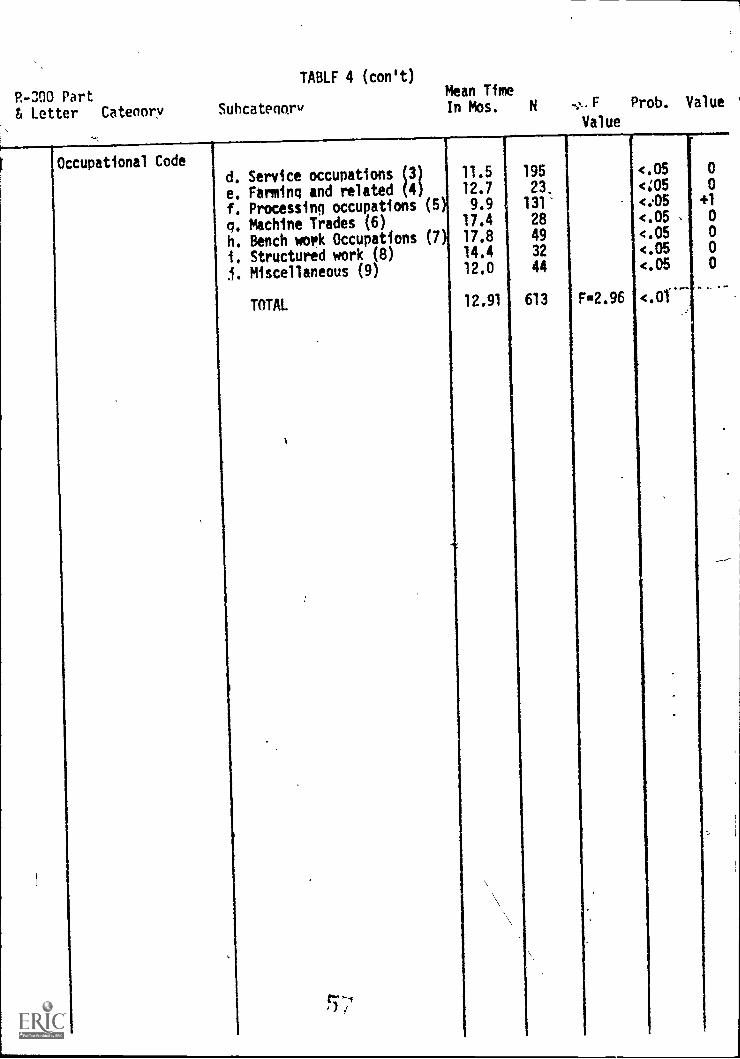
P-300 Part& Letter Catenary Subcatenory
TABLF 4 (con't)Mean TimeIn Mos. N ..,,,_.F Prob. Value
Value
Occupational Coded. Service occupations (3 11.5 195 <.05 0
e. Farming and related (4 12.7 23. <;05 0
f. Processing occupations (5 9.9 131- <..05 +1
q. Machine Trades (6) 17.4 28 <.05 , 0
h. Bench work Occupations (7 17.8 49 <.05 0
i. Structured work (8) 14.4 32 <.05 0
.1. Miscellaneous (9) 12.0 44 <.05 0
TOTAL 12.91 613 F2.96 <.Of
I
t--,

TABLE 5OFIME115IENTS CLOSED SUCCESSFULLY (STATUS 26), WHICH CASES REQUIRED THE MOST MONEY
& Letter Catenory ,Subcateaory Mean N F Prob. Value,
Cost in $
.E Age a. 19 *ears or less (1)b. 20-29 years (2)
c. 30-39 yearsd. 40-49 years 4
e. 50-59 years 5
f. Over 60 years (6)
TOTAL
1515.
783.2
415.4
399.5. 446.6471.1
580.2
79
135ill
132
10058
615
.
F=8.44
--------w----
<.05
<.05
4.05
4.05<.054.05
v.01
-1
-1
' +1
+1
+1
+1
J Marital Status a. Married (1)b. Widowed (2)
c. Divorced (3)d, Separated (4)e. Single (5)
TOTAL .
448.5
404.6577.8415.
872.1
580.2
27865
57
32
183
615 F=7.97
4.05<05<.05<.05<05
<:01
+1
+1,
+1
+1
-1
Highest Grade Can-plated
,
,
a. less than 9th grade (1)h. 9th -12th grade (2)
c. 12th -15th grade (3)d. College Graduate)16th (4)
TOTAL
473.07480.00815#913
1191.29
580.20
287
147174
7
615 F=7.73
<.05<.05<.05<.05
<.01
+1
+1
-1
-1
Weekly Earnings atEntry
ad.No weekly earnings (0)h. $1 - $34 per week (1)c. $35 - $68 per week (2)d. $69 - $99 per week (3)e. $100 or more per week (4)
TOTAL
717.40328.27344.15
345,43358.75
568.35
35974
94
4720
594 F=7.29
<.05<,05<05<.05<.05
<01
-1
0
+1
+1
+1
I-G Weekly Earnings atClosure
a. No weely earnings (0)b. $1 - $34 per week (1)c. $35 - $68 per week (2d. $69 - $99 per meek (3e. $100 or more per week (4)
TOTAL
525.96553.86477.08582.39
1001.63
582.20
131
10918498
71
593 Fm4.93
<05<.05<.05
..<.05
(.05
<.01
+1
+1
+1
+1
-1
j.3 Months in TrainingStatus 18
a. 0 to 6 months (1)b. 7 to 12 months (2)c. 13 to 18 months (3)d. More than 18 months (4)
TOTAL
r--,.I _a
417.781799.381538.20
1807.66
580.20
r
541
32
10
32
615 F=69.5
<.05<.05<.05<.05
4,01
+1
-1
-1
-1

TABLE 5 (cont'd)
R-300 Partg Letter Catenary Subcatennry Mean Cost N F Prob. Value
In $
1-I Occupational Code a. Professional, Technical,
and Managerial (0) $ 998.4
b. Professional, Technicaland Menagerial (1) $1281.4
& Sales (2), $ 694.7
d. Service Occupations P) 1.432.48
e. Farming & Related (4) $ 295.4
f. Processing Occupations (5); 541.7
q. Machine Trades (6) $ 723.8
h. Bench Work Occupations (7); 724.8
i. Structural Work (8) 1 680.6
j. Miscellaneous (9) $ 432.3
TOTAL $ 578.7
3 J 4 Months in EmploymenStatus 20 & 22
20
66
194
23
131
28
4932
44
<.05
<.05
<,05<.05.c.05
<.05
<.05-<.05<.05
<.05
F3.71 <.01
b. 7 to 12 months (2)
544.32856.1
a. 0 to 6 months (1)
c. 13 to 18 months (3) 247.17
d. tilpre than 18 months (4) $ 953.91
TOTAL $ 580.2
52852
12
23
F.4.07
0
-1
0
+10
<.05 +1
<.05 -1
<.05 +1
<.05 -1
<.01

TABLE 6WHICH CLIENTSOPWED THE GREATEST REDUCTION IN PUBLIC ASSISTANCE PER MONTH?
P. -300 Part 10% Sample FY 69-70& Letter Catenory Subcategory Mean F
Value
Prob. Value'
D Referral Source a. Educational Institution 5.74 54
4). Hospitals & Sanitoriums 2 3.26 114
c. Health Organizations &Anencies (3) 4.00 35
d. Welfare Agencies (4) 33.0 80
le. Public Organizations (5) 4.52 161
f. Private Organizations (6) 1.29 17
q. Individuals (7) 6.76 522
TOTAL
1-E Age a,t 19 or less years
b. 20-29 years
c. 30-39 year's
d. 40-49 yearse. 50-59 years
f. 60 or more years
7.87
7.704.3317.8
10.41.82
0.91
983 F-7.26
<?.05< .05
< .05.05
.05
< .05
<
< .01
150
221
476198
16970
TOTAL 7.86 984 Fm4.71
.65 -1< .05 -1
< .05 +1
< .05 0
< .05 -1
.05 -1
.01
2-G Outcome of Referral a. Not Accepted (1) 15.2 299
Process b. Accepted (2) 4.64 685
TOTAL 745 984
.01 - +2
.01 -2
F17.5 .01
2-P Total Monthly Family a. $0.00-149.99 (0) 6.25 401
Income b. $150.00 - 199.99 1 30.2 102
c. $200.00 - 249.99 2 5.50 103
d. $250.00 - 299.99 3 7.28 78
e. $300.00 - 349.99 4) 2.78 69
f. $350.00 - 399.99 5) 5.41 32
h. $450.00 - 499.99g. $400.00 - 449.99 6 0.0 35
1.95 38i. $500.00 - 599.99
1. $600.00 & over 9 '0:0 40
5163 24
TOTAL 7.91 922
.05 -1
.05 +1
.05 -1
.05 -1
.05 -1
.05 , -1
.05 -1
.05 -1
.05 -1
.05 ; -1
Fu5105 .01
2 -Q Type of Public .a None (0) 1.26 847
Assistance Old Age Assis. (OAA) (1) 31.3 3
Aid to Blind (AB) (2) 26.0 1
. Aid to Perm. TotallyDisabled (APTD) (3) 42.4 16
Aid to Families withDependent Child (AFDC)(3) 81.8 71
. General AssistanceOnly(AA) (5) 38.4 19
. AFCE in Combination withOther Type(s) (6) 60.1 8
. Anv other combination (7) 108.0 5
h()
(05. -1
<.05 +1
<.00 0
<.05 +1
.05 +1
.05 +1
< 45 10
< .02 +2

TABLE 6 (cont'd)
P-300 Part ,
& Letter Catenory Subcatenory Mean 1 N F Prob. Value'Value
-o Type of PublicAssistance
. Unknown type(s) (8)
TOTAL
96.8
7.61
1
971
<.05
F=100.9 <.01
r
R Source of Support a. Current Earnings (0)
b. Family (1),
c. Private Rellief (2)d. P.A. (3)
e. P.A. without Fed. (4)
f. Institutional (5)q. Workmen's Comp. (6)h. Social Security (7)i. Disab., Old Age, Unemp.
(8)
5. Private (10)
TOTAL .
1.11
.54
0.078.759.3
- 1.01
0.01.26
3.190.0
8.02
249
395
2
78
15
866
50
77
6
964
<.05 -1
<.05 -1
<45_<.01 42<.05 +1
<.05 -1
<.05 -1
<.05 -1
<065.4.05
P=58.7 <.01
34 Federal ProgramIdentification
a, None (0)h. SS Disab. Ben.Assigned
to Trust Fund (1)
c. Armed Forces Rejecteed. Public Offender (20)
e. Work beemitive Program(WIN) (40)
TOTAL
6.76
0.830.0
0.0111.7
7.12
912
36
2
166
971
e.05
<.05
<.05
4.05'.<.05
F=17.3 <.01
-1
3-E SSDI Status atClosure
a. Not applicant (0)b. Applicant -Allowed Ben. (
c. Applicant Denied (2)d. Applicant-Pending (3)
e. Not Known (4)
TOTAL
3.42 580
) 3i32 50
10.9Y- 15
0.0
81.0
3.92
3
3
651
Weekly Earnings atClosure
a. No Weekly larninns (0)
h. $1 to $34 rr w2ek (1)
c, $35 to $68/week'(2)d. $69 to $98/week (3)e. $99/week or more (4)
TOTAL
-2.433.52
6.795.604.72
2.96
203109
17395
69
649
<.05 -1
<.05 -1
<.05 -1
<.05 .-1
<.05 +1
F=5.03 < . 01
< . 05
<.05< .05
< .05
< .05
FR2.52' <.05
+1
0.0

TABLE 6 (cont'd)
P-300 Part, & Letter, Catenory Suhcateanr" Mean N F Prob. Valu
Value
3-H Type of Assistanceat Closure
,
a. None (0)
h. Old Age Assistance OAA (c. Aid to Totally Perm.
Disabled (3)d. Aid to Famiats with Dep.
Children (AFDC) (4)e. General Assistance (5)f. AFDC in Combination with
Other (6)
A. Any other combination of.types (7) .
h. PA Received Between Rif.& Closure (9)
4.1d
i 0.0
-4.33
-2.28
.34.3
-35.0
0.0
29.3
5841
6
28'6
4
1
3
<;05<.05
<.05
<.05<.05
<.05
<.05
<.05
+1
C
C
0
-1
-1
0
+1,
TOTAL 3.28 633 F2.68 <.01
3-K Outcome of VR a. Closed From Ext. Eval. 08 15.2 299 <.05 +1
Services ' b. Closed: Rehabilitated.25 4.69 588 <.05 -1
,b. Closed: Not,Rehab. 28d. Closed: Not Rehab. 30
2.725.92
4750
<.05(.05
-1
0
TOTAL 7.86 984 F.5.90 <.01
,
r
.
,
/ .
,.

TABLE 7
P-300 PartWHICH CLIENTS SHOWED LEAST PUBLIC ASSISTANCE PER )ONTH AT CLOSURE ?
& letter Category SubcateaoryMean N
F Prob. Valu
1-0 Referral Source
1 -E Age
.4*
a. Educational Institution (1b. Hospitals & Sanitoriums (2c. Health Organizations &
Agencies (3)d. Welfare Agencies (4)e. Public Organizations (5)f. Private Organizations (6)a. Individuals (7)
TOTAL
a. 19 years or lessb. 20 to 29 yearsc. 30 to 39 yearsd. 40 to 49 yearse. 50 to 59 yearsf. over 60 years
TOTAL
2 -B SSDI Status atReferral
a. Not applicant (0)
b. Applicant-allowed (1)
c. Applicant-denied (2)d. Applicant-pending (3)
TOTAL
2-J Marital Status a. Married
b. Widowed 2)
. Divorced (3)d. Separated (49e. Single (5)
TOTAL
2-0 Type of AssistanceAt Entry
a. Nene (0)
b. Old Ape Assistance (OAA)(1
c. Aid to Blind (A8)(2)d. Aid to Perm. & Totally
Disabled (MD) (3)e, Aid to Families with Dep.
Children(AFDC) (4)f. General Assistance Only (C
5). AFCE in Comb. with other
types (6). Any other combination (7)
i. Unknown type(s) (8)
TOTAL
8
0.28
9.52
0.0
39.969.750.0
6.16
9.13
32
86
20
50
75
15
344
622 F7.98
< ,05
< .05
< .05
< .05
< .05:
< .05
< .05
< .01
+1
+1
+1-1+1+1
+1
.11 82 < .05 +16.15 133 < .05 0
16.37 111 < .05 -1
12.74 136 < .0510.09 110 <.053.80 50 < .05 0
9.13 622 Fu2.76 < .05
9.250.0
30.93
55935
14
< .05
< .05
< .05
+1
.15.43 14 < .05 0
9.13 622 Fu2.63 <.05
14.63 275 <.05 -14.93 61 <.05 02.91 55 <.05 +1
20.18 33 <.05 -12.68 197 <.05 +1
9.14 621 Fu4.87 <.05
1.95 550 <.05 +164.0 1 <.05' 00.0 1 <.05 +1
52.0 6 <.05 0
81.95 38 <.05 -1
)
32.44 9 .05 +1
88.43 7 <.05 -1
91.0 2 <.05 -1
0.0 1 4.05 +1
9,19 615 F1149.6 <Al

TABLE 7 (contti)
P-300 Part& Letter Catenory Suhcatenory
Primary Source of a. Current Earnings (0)
Support h. Family (1)
c. Private Relief (2)
d. P. A. (3)e. P. A. without Fed. (4)
f. Institutional (5)
g. Workmen's Comp. '(6)
h. Social Security (7)
. Disab., Old Age, Unemp.(8)
j. Private (10)
TOTS
Mean N
3.41
2.260.0
98.8533.147.200.00.0
.93
0.0
F Prob. Value
181
246
1
--397
51
4
26
56
4
9.23 615
<.05 +1
<405 +1
<.05 +1
-<.05 -1
<.05 +1
<.05 +1
<.05 +1
<.05 +1
<.05 +1
F53.3, <.01
Weekly Earnings at a. No weekly earnings (0) 4.30 193
Closure h. $1-$34 per week (1) 0.72 101
c. $35-$68 per week (2) 6.44 159
d. $69-$99 per week (3) 0.98 86
e. $100 or more per week (4) 4.64 61
TOTAL 8.72 600 F=2.82
Type of Assistance a. None (0) 0.12 564
At Closure b. Old Ane Assistance (0AA)(1 64.0 1
c. Aid to Perm. & TotallyDisabled (APTD) (2) 94.7 6
d. Aid to Families with Dep.Children (AFDC) (3) 27.5 28
e. Aeneral Assistance (tA)(5) 64.8 6
f. AFDC in comb. with others(6) 167.0 4
n. Any other comb, of types(7) 182.0 1
h. P.A. received betweenref. & Closure (9) 56.0 3
TOTAL 9.26 613
Services ProvidedI
-a. With cost (1)
b. Without cost (2)
c. With & Without cost (31
TOTAL
0.8858.0
0.0
6.16
26
3
3
32
<.05 -1
<.05 0
<.05 0
<.05 +1
<.05 0
<.05
(.01 +2
<.05 0
<.05 -1
<.0t -2
(.05 0
Al -2
.01 -2
<.05 +1
F=411.1 <.01
(.05<.05(.05
F23.2 (.01

TABLE 8Which Clients Showed Greatest Increase in Weekly Earnings?
P. -300 Part
& Letter Catenory Subcateaory $Mean N F Prob. Yalu(
1
1-E Age a. 19 years or less 26.7 155 <.05 +1b. 20 to 29 years 15.0 228 <.05 -1-c. 30 to 39 years 9.44 178 <.05 -1d. 40 to 49 years 814 199 <45 -1e. 50 to 59 years ' 6.51 168 <.05 -1f. over 60 years 4.31 72 <.05 -1
TOTAL 12.3 1000 5.05 <.01
'-G Cole a. 00 1 - 4.37 8 z. ,06 0b. 02 2 -14.0 285 <.05 -1
1c. 04 3 15.0 3 <.05 0d. 06 4 3.16 6 '<.05 0e, 10 5 23.3 698 <.05 +1
TOTAL 12.3 1000 41.8 <.01
'-G Codena a. Not accepted (1) -13.7 OM 401 -2
Cb. Accepted (2) 23.1 707, <.01 +2
TOTAL 12.3 1000 165.6 <.01
'-H2 Secondary a. V,isual Impairments (1) 1,10.2 68 <.05 -1Disability b. Hearing Impairments (2) 15.1 14 <.05 -1
c. Orthopedic Impairment(except amputations) (3) 14.6 23 <Ad -1
d., Absence/Amputation of
Major/Minor Members (4) 43.0 3 <,06 0e. Mental, Psychoneurotic, &
Personality Disorders,(5) 46.8 29 <Jis +1
f.' Unknown Etiology (6) 13.0 203 <.05 -1
q. None (9) 12.0 622 <.05 -1
I )
TOTAL 13.3 962 3.19 <.01
-N Work Status at a. No earnings 0 0.0 2 <OS 0,/
Entry b. Competitive 1 10.6 285 <.06 -1
c. Sheltered' 2 42.0 3 <.06 0d. Self 3 6.1 13 <.06 -1
,. Stitie BEP 4 0.0 1 . <.05 0f. Homemaker 5 5.0 121 <.05 0g. Unpaid Family (6) 9.0 1 6 <.05 0h. Student 46.8 71 <.05 +1
1. Other 8 23.2 485 <.05 0j. Trainee 9 12.5 6 <.05 0
TOTAL,
12.4 993 20.1 <.01

R-3110 Part
& Letter Cateoory Suhcateoory
TABLE 8 (cont'd)
$ Mean N F Probi Value
-B2 REH Facilities a. $100 or less (1)
b. $100 to $500 (2)
c. $501 to $1000 (3)d. $1001 or more (4)
TOTAL
$10.517.235.6
59.1
12.3
93425
14
27
1000 12.3
<.05<.05<.05
<.05
<.01
-1
0
0
+1
-83 Social Security
Trust Fund
,
a. $100 or less 1)
b. $100 to $500 (2)
c. $501 to $1000 (3)d. $1001 or more (4)
11.924.857.5
114.0
98882
2
<.06<.05<.05
<.05
A-1
-1
+1
TOTAL 12.3 1000 4.47 <.01
rF Work Status a. No Earnings 0 35.4 5 <.05 0
At Cloiure, b. Competitive 1 36.8 440 )( <.06 +1
c. Sheltered 37.3 8 <.05 +1
d. Self 3 17.7 24 <.05 0
e. State BEP 4 0.0 1 <.05 0
f. Homemaker 5 1.9 118 <.05 -1
q. Unpaid Fignly (6) 2.2 20 <.05 -1
h. Student (7? 0.0 2 <45 0
I. Other (8) 5.0 58 <.05 -1
TOTAL 24.4 676 16.6 <.01
OccupationalCode
a. Professional, Technical,and Managerial (0)
b. Professional, Technical,and Managerial (1)
66.4
41.3
26
20
<.01
<.01
+2
0
c. Clerical and sales (2) 41.2 67 <.01 0
d. SerAce Occupations (3) 25.8 197 <.01 -1
e. Farming and Related (4) 25.0 23 <.01 -1
f. Processing Occupations (5 1.3 129 <.01 -2
q. Machine Trades (6) 49.6 28 <.01 0
h. Bench Work Occupations (7 18.3 49 <.01 -1
i. Structural Work (8) 51.4 33 <.01 +1
1. Miscellaneous (9) 39.1 44 <.01 0
q TOTAL 27.3 616 12.2 <,01 '
-J-3 Months in Training a. 6 months or less (1) 7.8 919 <.01 . -1
(Status 18) b. 7 to 12 months (2Y 53.7 34 <41 +1
c. 13 to 18 months (3) 47.6 11 <.0, +1
d. 19 months or more (4) 77.7 36 <.01 +2
TOTAL 12.3 1000 47.1 <.01
qv)

Part
6 Letter Catary
TABLE Vcont4d)
Suhcateooru $ Mean N F Prob., Value
- 13-4 Months in
Employment(Status 22)
a. 6 months or less (1) 10.1 909
b. 7 to 12 months (2) 38.1 53
c. 13 to 18 months (3) 36.8 12
d. 19 months or more (4) 26.4, 26
TOTAL 12.3 1000
<.05<.05<.05<.05
9.05 <.01
- K Outcome of Reh.
Services(EXTEV)
t:
08 1
26 2
c. 28 (3
d. 30 (4)
TOTAL
13.7 293
27.5 608
7.4 49
1.4 50
12.3 1000
-1
+1
+1
0
<.05 .1-
<.05 +1
<.05 -1
<.05 -1
76.3 <.01
K (EXT CODE) a. Unable to locate orcontacts Moved (1) 1.5
b. Unfavorable medical
prognosis (2) 0.2
C. Refused services orfurther services (3) 5.2
d. Death (4) -35.9
e, Client institutional-
ized (5) 0.0
f. Transferred to another
agency (6) 0.0
q, Failure to cooperate (7) - 2.8
h. No disabling condition (8'100.0
i. No vocational
handicap (9) 0.0
TOTAL 3.5
24
21
21
7
1
3
18
1
1
<.01
<.01 0
<.01 -1*
<.01 -2
'<.01

Which Cl
P-300 PartEl Letter Catenorv-
TABLE 9cents Showed Greatest Weekly Earnings at Closure?
10% Sample FY69-70
Suhcatenor, $ Mean
t 1-0 ReferralSource
1-E Age
. EducationalInstitutions (1)
b. Hospitals and
Sanatoriums (2)
c. Health Organizationsand Agencies (3)
d. Welfare Agencies (4)
e. Public Organizations 5
f. Private Organization 6
q. Individuals 7
10TAL
$59.4
29.3
58.637.3
50.353.844.0
43.9
IM,=ftm*..1010.mi,a.
b.
C.
d.
e.
19 years or less 1
?0 to 29 years 2
30 ',t) 29 years 3
4 to 49 years 4
50 to 59 years 5
over 60 years 6
TOTAL
63.247.040.946.537.820.1,
.9
2-H-1 Major Disability Visual Impairments (1) 47.7
. Nearing Impairments (2) 5g.2
. Orthopedic ,
Impairments (3)
. Absence or Amputation (4)
. Mental or Personality.
Disor.
Unknown etiology
(5
2-H-2 secondaryisabillty
r
48.761.3
33.243.5
43.9
7isual Impairments (1) 38.8
!),aring Impairments (2) 27.9
thopedjcboairments (3) 38.1
A'osence or Amputation (4) 165.0
VAtal or PersonalityDisorder's i5 59,0
None (9i) a5.4Unknown Etiology .6 40.6
TOTAL 14.0
...111.m..1.1.1.17.1.1..1111,1111111M1f....1111%110 .11M.111
r
N F Prob. Value
37
87
22
4981
16
380
<.01
<.01
<.01
<.01.
<.01<.01
+2
-2"
+1
-1
0
0
672 3.26 <.01
84 <.01 +2
147 4.01 +1
122 <.01 +1
144 <.01 +1
120 (.01 +1
55 <.01 -1
672 7.17 <.01
67 <.05 +1
32 <.05 +1
93 <.05 +1
19 <.05 +1,
128 <.05 -1
333 <.05 +1
672 3.07 <.01
59 <.05 -1
11 <.05 r -1
19 <.05 -1
2 <.05 +1
26 <.05 .1
165 <.05 -1
389 <.05 -1
671 3.56 <.01

p-2,(:O Part
S Letter Catenory Subcatenory
!Ant ,J (contd)
$ Mean Prob. Value
.
.
2-J Marital Status a.b.c.d.e.
Married 1
Widowed 2-Divorced 3Separated 4Single 5
TOTAL
$47.424.941,1
46.1
45.8
43,9
296
6959
35
273
672
;
1
3.70
<.05<.05<.05<.05<.05
<.01
f...-...
+1-1+1
+1+1
, 2-L Number in Family a.. 1 35.3 130 <105 -1
b. 2 42.0 124 <.05 0
.: c. 3 47.0 143 <.05 0
. d. 4 54.8 89 <.05 0
e. 5 41.1 72 <.05 0
f. ,6 45.2 41 <.05 0
g. 7. 52.8 28 <.05 0
h. 8 26.9 17 <.05 -1.
i. 9 35.6 12 <.05 0
j. 10 43.8 8 <.05 0
k. 11 .
\61.8 4 <.05 0
1. 12 100.0 3 <.05 +1
m. 14 75.0 1 <.05 0
TOTAL 43.9 '672 1.72 <.35
. , 2-M :1 fghest 'Grade. a. less than 9th grade 1 33.7 313 -1
Completed b; 9th to 12th,grade 2 43.3 162
<.05.05 +1
,..c. 12th to 16th grade 3 60.0 188 <.05 +1
..d, 16th or more 4 74.1 9 <.05 +1
..
TOTAL 43.9 672 15.5 <.01
2-0 Weekly Earnings a. No weekly earnings 35.0 418 <.01 -1
at Entry b.
$0
$1 to $34 per week '1 33.2 74 <.01 -1c. $35 to $68 per week 2 55.8 97 <.01 0
d. $69 to $99 per week 3 76.5 50 <.01 +1
:. e. $100 or more per week (4) 119.3 ?0 <.01 +2
TOTAL 43.6 659 32,1 <.01
..... C ri

TABLE 9 (cont'd)
P.-300 Part
Letter Cateaor, Suhartenory
2-P Total MonthlyFamily Income
a. $0 to $149.99 (0)
c. $200 to $249.99 2
b. $150 to $199.99 1
d. $250 to $299.99 3
e. $300 to $349.99 4
f. $350 to $399.99 5
q. $400 to $449.99 6
h. $450 to $499.99 7
i. $500 to $599.99 8
j. $600 or more 9
TOTAL
$ Mean N F Prob. Value
2-R Source of a. Current earnings
Family Support b. Family 1
4. Private relief , 2
d. Public Assistance (3)
e. P.A. without Federal (4)f. Institutional
q. Workmen's Comp. 6
'h. Social Security 7
i. Disability, Old age
Unemployment (11. Private (10
TOTAL
a. 6 months or less3-J-3 Months in
Training b,
(Status 18) .
3-B-2 Rehibilitation
Facilities
Total $
7 to 12 months 2
13 to 18 months 3
19 months or more
TOTAL
$100 or less 1
$100 to $500 2
$501 to $1000 3
$1001 or more 4
TOTAL
(4)
$32.0 262
45.1 6842.1 74
54.6 64
44.8 54
72.2 29
59.2 24
52.6 18
65.3 31
65.8 27
44.0 651
60.5 196,
41.0 263
30.0 1
39.1 36
11.1 7
21.6. 54
91.7 3
31.3 30
28.1 63
62.8 4
43.4/ 657
40.7 593
56.4 34
49.9 11
'5.2 34
43.9 672
<.01
<.01
<.0I
<.01
<.01
<.01
<.01
<.01
<.01
5.82 <.01
<.05<.05<.05<.05<.05<.05
<.05<.05
<.05<.05
7.09 <.01
+2+1
+p.
+1
0
00
-1
-1
+1
0
11.9
<.05<.05
<.05<.05
.01
-1
-1-1
+1
43.1
34.1
58.467.5
43.9
61423
10
25
672 3.06
<.05 -1
<.05 -1
< .05 0
<.05 +1
< .05
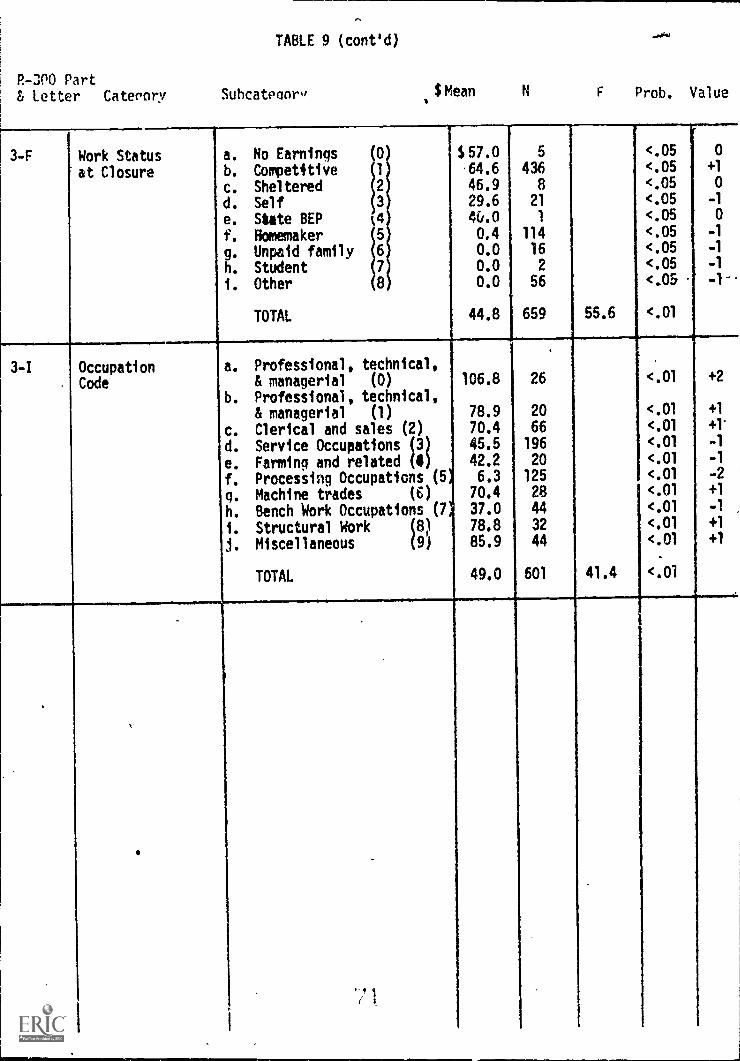
TABLE 9 (cont'd)
P-300 PartLetter Caterory Suhcateaor" $Mean F Prob. Value
3-F Work Status
at Closure
a. No Earnings (0
b. Competitive 1
c. Sheltered 2
d. Self 3
e. State REP 0f. Homemaker 5
g. Unpaid family 6
h. Student 7
. Other 8
TOTAL
$57.0,64.6
46.929.64&.00.40.00.00.0
44.8
5
4368
21
1
11416
2
56
659 55.6
<.05<.05<.05<.05<.05<.05<.05<.05<.05
<.01
0
+1
0
-1
0
-1
-1
-1
-1-
3-I OccupationCode
a. Professional, technical,& managerial (0) 106.8
b. Professional, technical,& managerial (1) 78.9
26
20
<.01
<.01
+2
+1
c. Clerical and sales (2) 70.4 66 <.01 +1'
d. Service Occupations (3) 45.5 196 <.01 -1
e. Farming and related (4) 42.2 20 <.01 -1
f. Processing Occupations (5 6.3 125 <.01 -2
q. Machine trades (6) 70.4 28 <.01 +1
h. Bench Work Occupations (7* 37.0 44 <.01 -1
i. Structural Work (8) 78.8 32 <.01 +1
j. Miscellaneous (9) 85.9 44 <.01 +1
TOTAL 49.0 601 41.4 <.01
1

Postscript
In the course of these analyses several additional suggested
items emerged that would be helpful for practical program evalua-
tion. The following may not currently be recovered from the
RSA-300, but could be objectively measured and recorded with little
additional counselor4ffort. Such items might be included on a
mIsed RSA-300 form.
A. Information source in self referrals.
B. Client-counselor contact hours.
C. Total hours (all services) for a given client.
D. A case difficulty indication (so that % of severely
disabled, creaming, etc. could be determined).
E. Follow-up information.

oF
Richard T. Walls and M. S. Tseng
West Virginia University
Rehabilitation Research and* Training Center RT-15
I. A PARADIGM OF THE REHABILITATIOU SYSTEM
A. Conceptual Framework
In order to maintain a proper perspective while dealing with
the issues of measuring client outcomes in rehabilitation, the
rehabilitation system will be viewed in this chapter as an input-
intervention-output paradigm (see Figure 1). A paradigm is con-
ceived as a model or pattern that portrays the temporal, spacial,
causal, or logical relationships of events by boxes, connecting
lines, and positions on vertical and horizontal dimensions. The
primary reason for conceptualizing an input-intervention-output
paradigm of rehabilitation is that more systematic, orderly, and
useful approaches to the identification and assessment of issues
involved in the measurement of client outcomes can be attempted.
Insert Figure 1 about here
As can be seen in Figure 1, this paradigm of the rehabilitation
system a.3sumes three basic .zes, input, intervention, and output
which complete a looping cycle. Included in the "input" end are
1 4 1

tie components of (1) general population, (2) A sub--)opulation
con3istinr of peolde who nec,d rehilitation, 46 ()) anotq-r sub-
pooulaLion of .,itufie wio scrve t,,.aabil talton rtn,oticet-s.
The second stage, intervention", represents a phase durin
which rehabilitation takes place. The disabled person may complete
this state (1) entirely on his own resources, (2) through the assis-
tance of public and private agencies other than those of vocational
rehabilitation, or (3) via the services of vocational rehabilitation
agencies. The primary role of the vocational rehabilitation agencies
is portrayed in Figure 1 by the largest box (formed by broken lines)
in which diagnostic and evaluation, counseling and guidance, physical
restoration, training, placement, and follow-up services ara to serve
as vehicles, for intensive client-rehabilitation agent interactions.
`L he client comes into this box Prirwinr, with him his physical, psycho-
logical, educational, social, and ozcupational stren,r,ths and weaknesses.
Ale rehabilitation agent who is to help the client, also brings his
background and personal attributes into the picture. Interactions
between the client and the rehabilitation agent through various services
allow pooling of the client's own resources and the environmental
resources to facilitate his rehabilitation.
The client then moves on to the "output" stage where ideally his
dependency is lower, self care improved, self support attained.or
retained, and family life strengthened (taken from the SRS program
objectives, 1968). The client then reenters the general population.
From a strictly client-centered perspective, this input-intervention-
output paradigm may be viewed as a rehabilitation intake-process-outcome

3.
model where rehabilitation intake, rehabilitation process, and rehab-
ilitation outcome constitute rehabilitation input, intervention, and
output, respectively.
To illustrate how the client goes through the rehabilitation
process (or intervention) stage with the assistance of the state voca-
tional rehabilitation agency within the paradigm, Figure 2 is presented.
Notice that this flow chart (Leary & Tseng, 1974) makes use of the
rehabilitation statuses (00-30) which are currently in use by vocational
rehabilitation agencies across the nation. Every two digit number in
the chart represents a rehabilitation status which identifies a p:ir-
ticular phase in the rehabilitation system.
0100M111.
Insert Figure 2 about here
The first status at which the client enters the intervention (or
process) stage is 00 (REFERRAL). A client is a referral once the
agency records his name, address, disability, age, sex, date of referral,
source of referral, and social security number.
When the client indicates that he would like to work with voca-
tional rehabilitation and signs the application he moves to status 02
(APPLICANT).
It is sometimes necessary to determine eligibility for sertices.
He goes to status 06 when extended evaluation up to 18 months is needed.
The 04 status has recently been deleted.
If the client is not eligible for rehabilitation services, or
eligibility cannot be determined, the ease is closed at status 08.

14.
He, therefore, goes back, through the exit point W, to the general
population in the "input" stage of the paradigm.
0The client moves to status 10 if he eligible for rehabilita-
tion services and a rehabilitation plan is being prepared. He goes
on to status 12 whenthe rehabilitation plan is approved.
For some reason, a case may have to be closed from statuses 10
or 12. He leaves the "intervention" stage, as far as the vocational
rehabilitation agency is concerned at this point, through status 30.
The client moves on to status 14 when receiving counseling and
guidance, to status 16 while receiving physical restoration service,
or to status 18 when he is being educated or trained.
After all necessary services have been provided, the client is
ready for employment.. He is in status 20 if he does not return to or
obtain employment immediately. He goes to status 22 if he obtains
employment or returns to former employment.
At times, the client's services can be interrupted. lie moves
to status 24 and remains there during the period of service inter-
ruption.
When the client has been provided with the services that were
planned for him and has reached the point in his rehabilitation process
where he cannot be additionally assisted by the agency, his case is
closed. If the client is not employed and the case is closed,.he moves
to the "output" stage,of the paradigm through status 28. On the other
hand, when the client is productively employed and the case is closed,
he moves out of the system through status 26 and enters the "output"
stage of the paradigm.

5.
It is clear from the above description that clients who enter
this vocational rehabilitation system are to rove out of It fter
intervention thro= four exits, or outcome status. '_hey are
statuses 08, i0, 23, and 26.
While status 08 signifies the reiection of referred cases for
services, statuses 30, 28, and 26 provide exits for thsse referred
cases accepted for services.
Of the cases'accepted for services, those who have received
some assistance and are closed unemployed are routed to status 30
which signifies unsuccessful closure, those who have received all
necessary services and are closed unemployed are branched t status
28 which indicates another unsuccessful closure, and those who have
received all necessary services and are employed do reach the desired
exit point status 2( which represents a successful closure. The
various catc,,ories of e:-.1oy;1,.n* induced w14-qin tl;e reap
ilitation and their associated interpretation difficulties are dis-
cussed later in this chapter.
Obviously, rehabilitation intervention (or process) should have
positive impact not only on the client employability but also on a.
host of other aspects of this individual's functioning, including his
occupational, physical, economic, educational, social, and psychological
well-being. An specific attributes in these different dirensions which
are operational defined to yield valid and reliable measures can be
used as criteria of success for assessing the effectiveness of rehab-
ilitation intervention (or process).

Jk ve determine the effect of rehnbiltntion interventinn
(or process) on, say, client nt.tribute A, u,:icn been operntionAlly
defined, us Isle? the input-intervention-output (Cr intake-procecs-
outcome) paradigm? Table 1 shows a general confiruration, known as
the one-group pretest-posttest design (Campbell and Stanley, 1963),
with which the effect of intervention may be investigated.
Inset Table 1 about here
Notice that "X" in the table indicates the presence of inter-
',
vention during the rehabilitation process phase and "Os" represent
observations of a specific criterion attribute, in our example client
attribute A, conducted for a given group of clients. 01 denotes
observation made at the intake (or input) point which yields a quan-
titative measure for each client. This pre measure constitutes a
baseline for the individual as far as the attribute A is concerned.
02 indicates observation made \mmediately after intervention. This
yields a Rat measure of attribute A for each client.
With the pre and post measures taken, we can thus determine the
change that occurred in criterion A (02 - 01) and attribute it to
intervention (x). In a real sense we are using each individual client
as his own control in this particular design.p
However, from purely experimental view point the one-group design
has certain built-in imperfections. For instance, how do we know that
extreneous variables, that is variables other than the rehabilitation
intervention (X), did not influence the post measure (02) and, there-
fore, the change in criterion (02 - 01)? Maybe without rehabilitation
intervention a change could take place in the criterion over an equivalent

"f 7.
period of time. We are saying tat part of 0,, - 0A
(criterion change)
may be due to the effect of factors other than X (intervention).
Whenever we adare.,.s' ourselves to this question: 'To what extent
can we attributeA 02 - 01 to X?", we are concerned with the so called
internal validity of an experimental design. The one-group pretest-
posttest design does not provide the mechanism necessary for sorting
out that amount of criterion change due to factors other than inter-
vention, and because of this, its internal validity suffers (for
in-depth discussion on issues concerning the internal validity of an7
experiment readers are referred to the work of Campbell and Stanley,
1963).
In order to account for the amount of criterion change (0 - 01)
that might be due to factors other than rehabilitation intervention
(X) and, therefore, increase the internal validity, one may want to
consider another design uhich is shorn in Table
Insert Table 2 about here
/This,time we are applying what is known as the pretest-posttest
control group design to our rehabilitation intake-process-outcome
paradigm. notice that there are two equivalent groups of clients in
this design.
Clients in the first group, as-represented by the firpt rpw in
Table 2, are to be pre- observed (denoted by 011 with the first sub-.
script representing Group 1 and the second subscript Time 1 at the
intake) as to an operationally de4fined client attribute A, subjected
to rehabilitation intervention (denoted by X). Post observation

(1
(donote4 by , it t!'e s,t-Indin- for Grow-
Lr, 'i1 ( 11 c J1 r r l qrtr t,-)
cli.erioa attriuute ,) toca
Client: in the second 0.oup, ri,nresented the second row in
Table 2, are to be pre-ohserve (denoted by °21 with the first subscript
representing Group 2 and the second subscript Time 1 at intake) in terms
of the same criterion (client attribute A), receiving no rehabilitation
intervention (denoted by a blank, or non-X). They are then post-observed
(denoted by 022 with the first subscript standing for Group 2 and the
second subscript Time 2 immediately- after an equivalent period of non-
intervention) on the same criterion.
In essence, Group 1 in Table 2 is the experimental group which
allows us to Attribute 0 - 011 (change in criterion measures for thea
experimental prolp) to tfl_, or X (reL.6ilitltion interveation).4.0"*".161
Group 2 1'; th- c'ontroi enlhles U5 t,1 attribute J_
21
(change in criterion measures tor the control 71.oup) to the absence of X
(no rehabilitation intervention). Sorting out the effect of the absence
of X from that of the presence of X would give us the net gain due to X
(rehabilitation intervention). Therefore, (012 411)(022 021)
represents the net gain attributable to rehabilitation intervention
using the pretest-posttest control group design as shown in Table
where the two groups (one experimental and one control) are -equivaLnt.
We have just examined two specific designs that do fit nicelyC
within the framework of therehabilitatron input-intervention-output
paradigm. There are, of course, more designs of experimentarand
quasi-experimental types that are available anu should be considered.

9.
it any rate, tau input-iatrv,.1-0,Lnn-ou',,n'A :,--tradip7 of r,,Aliii-
tation doe:, nrovil,c a eon;,relloi,,v,: coac'enta l'rt,..-ror!=. vith
*La rt.Laloilitation thor,z: oa the ty:'.1,rer,p2nt of c11 r it
outcoce: c,.:n be sytematieully ant orderly investigated.
B. Rehabilitation Agency Outcome Criteria
The standard RSA-300 Case Service Report form is currently used
by Vocational Rehabilitation "to summarize the statistical data nec-
essary to describe the various aspects of the program, to prqvide an
adequate basii for sound planning, and to provide a minimum amount of
uniform case progress information (Nosp Statistical/Wanual,.1971,
p. VI-E-1). This one page report form which is tbe filled out by
the rehabilitation counselor for each individual client is reproduced
in Figure 3. All individuals classified as referrali must be recorded
and reported by this form. It includes basic intake or referral infor-,
Insert Figure 3 about here
oration and follows the client from referral to ease closure as was
illustrated in Figure 2 (Flow Diagram).
As noted, there are only four points ofexit from the rehabilita-
tion system, Status 08, Status 26, Status 28, and Status 30. These
-outcome statuses are defined more specifically below.
)
The 08 status identifies all persons not aricepted for vocationalf
rehabili'ation services. This includes individuals who (1) are
referred to the agency by letter, telephone, or other means (00) but
for one reason or another never apply for services (08); (2) apply for
services (02) but aee determined inelligible (08) through

evaluation (06). '.11c stets to :'42tu3
, re (0 have been decl.iriA Oiribl?, (2)
recei e,.1 1pproprOt,: 6t;) 3n3 (3) ";'1!
eplan for vocational railitAn services fornIllated, (4) hav co-1-
pleted the plan insofar as possible, (5) have been provided counseling
as an essential rehabilitation service, and (6) have been determined
to be suitably employed for a minimbm of 30 days. If a client achieves
(1) and (2) above but drops out, dies,^moves away, or for some. reason
does not begin (3), he exits_as Status 30, "closed other reasons before
rehabilitation plan initiated." However, if (1) and 11 above are
completed and (3) has begun, but for some reason one or more of th
other three criteria, (4), (5), or (6), were not met, he,5-'"closed'
othe- reasons after rehabilitStion plan initiated" in Status 25 (NCSS
Statistical :lanual, 1971).
A careful examination of the RSA-300 Cdse Service Report form
(Figure 3) reveals that there are two different types of outcome vari-
ables that are routinely tapped. One type yields only the post-data,
and another type provides both the pre- and post-measures.
Statutes 08; 26, 28, and 30 constitute an outcome variable which
belongs to the first type. As it is defineby the four exit statuses,
this outcome variable does-not need any pre-measures in order to
account for the effect of rehabilitatiOn intervention. Since it yields
frequency data, several indices may be developed to assess the efficiency
of the vocational tehabilitation system as tollows (assuming that a
particular population or a sample of clients served during a given

11.
fiscal yel-fr ipvoived): (l V1r, :xobability for a client to 1)f
reject ,:d rc r vocational rehaoint'Iti3n qetvicen is riven by rb's/
(03's + 26's + 28's + 30's), we my call this the rfjection ratio.
(2) The probability for a client to be accepted for vocational rehab-
ilitation services is expressed by 1 - 08's/(08's + 26's + 28's + 30's)
or by (26's + 28's + 30's)/(08's + 26's + 28's + 30's), we may call
this the acceptance ratio. (3) The probability for a client who is
accepted for services to be successfully rehabilitated can be repre-
sented by 26's/(26's + 28's + 30's), we may name this the rehabilitation
success ratio. (4) The probability for a client who is accepted for
services to be unsuccessfully rehabilitated is 1 - 26's/(26's + 28's +
..',31s) or (28's + 30!s)/(26's + 28's + 30's), we may call this the
rehabilitation 'allure ratio. (5) The probability f'r a c'ient who
has receivi 11i necesnary services to be successfully rlacei is
expressed by 2o's /(2u's + this may be named as the Placement
success ratio. (6) The probability for a client who has received all
necessa7 services to be unsuccessfully placed is given by 1 - 26's/
(26's + 28's) oA by 28's/(26's + 28's), we can call this the .acement
failure ratio.
Zhe second type of outcome variables which yields both pre- and
post casures incl4des (a) work status, (b) weekly earninn, (c) public
assistance type, and (d) public assistance monthly amount. Change
occurring in each of these four outcome critclria as represented by the
'fiifference bcween referral (or pre) data and closure (or post) data
can over b-2 attributed to rehabilitation intervention. This can be

12.
accomplished by usinr onfcrouo dcsi(n Yit-out control (a':'
:snon in '.:a:1c 1) or t%ap-,,r,)u', .n 2,y.trol f,t.; dr2s,!ribed
,:ahle 2).
Criterion variable ''!.or).: stats' consists of nine levels and
yields frequency (discrete) data. The nine categories of this criterion
are (1) competitive labor market, (2) sheltered workshop, (3) self-
employed (except BEP), (4) state agency-managed business enterprises
(BEP), (5) homemaker, (6) unpaid family worker, (7) student, (8) other,
and (9) non-competitive labor market, trainee, or worker. e pre (or
referral) and post (or closure) data on work status are recorded in
Part 2-N and Part 1-F respectively, of the Case Service Report RSA-300
(sde Figure 3).
Criterion "weekly earnings" is a continuous (nondiscrete) variable
yieldinp: measurement (or metric) the referrnl..(or nre) '1111 c1osure
(or post) data are fount in Part Dart 3-'1, respectively', or the
Case Service Report, R3A-300.
Criterion ''public assistance type' is a nominal variable consisting
of ten categories and yielding frequency data. The ten categories are
(0) none, (1) Old-Age Assistance (OM), (2) Aid to the Blind (AB),
(3) Aid to the Permanently and Totally DisaW.ed (APID), (4) Aid to
Families with Dependent Children only (AFDC), (5) General Assistance
only (GA), (6) AFDC in combinat!on with other type(s), (7) any other
combination of abov,z. typist, (8) typc(s) not known (9) PA received
wecn referr1 and closuie only, pre- and post-data are recorded
in Part 2-Q aria Part H re5pcctively, of *ale Cate Service Report
BCC-

13.
Finally, criterion "public assistance monthly amount" I-, a
continuous variable yieldin,, motrie data. The referral ana closure
data on-this variable are recorued in Part 2-0, and Part respec-
tively, of the Case Service Report RSA-300.
The above outcome criteria are those routinely handled quan-
titatively by vocational rehabilitation agencies through the Form
RSA-300 (Case Service Report). They do fit in the input- intervention-
output (or intake-process-outcome) paradigm and provide readily avail-
able data for the assessment of client outcomes in rehabilitation.
II. REVIEW OF OUTCOOF VARIABLES
The broad mission of the Rehabilitation Services Administration
(RSA) has been stated as "In conjunction with other public and volun-
tary agencies, to stimulate, develop, and implement Programs which
nrovide services for the disablei in maximizing their potential for a
full and, to the extent possible, a productive life ( A Long -Range
Plan, 1973)." A full and productive life is of court!e subject to
varying interpretation.
Productivity in terms of raw numbers of rehabilitants is obviously
aa agency program goal. They propose to increase this gross number of
rehabilitations to 400,000 in 1975 and to 680,000 in 1979. This pure
quantity measure'of outcome refers to the total number of °Status 26
Closures."
Vocational Rehabilitation has traditionally operated within this
`~numbers" framework and has been widely accused of "creaming off the
top" or taking the easier cases. There is a natural inclination for
. .
14.
3t4t. J-. Orof-y.'strIC, to ;;;!... r(2;oure,-, to :.01n tic
74,0ri, 4,11 ''(') appeqr fqVOra:
,u 'Ld!roniti'rnA- it
:vAve t)--euJ- a traditioh ,ti t2;1 then
evidence of genuine concern for ,.veloping outcome criteria to more
adequately represent client accomplishment. This increased concern
emerges as vocatiogl rehabilitation be,ins to reach more deeply into
areas of the severely disabled.
The primary concern for improving outcome in terms of earning
levels and employment stability is apparent in the sub goals listed
by RSA. Services should, ". . . lead to full or partial participation
the labor force . . . to the extent individually possible, become
productivt. in the econoq.y. such otht-r outcomes re enun-
,rated a, ruductiorl a. an*t.hir
J,2iervir-nc:: on .-.ocr-t (
Additionui c 're'. of j ency nur1,7uit (-Nt' a)ternativer, and
suppler,crito to 'tbsoluti- rocor succes5fla CPS(' closure:7. romf:n from
thv cor iJcrahlr r ectrc pro,ect:, nrog,Am:, nd centers supported
by The Social and ?ehabilitation rvices. RSA also recognizes the
need for viable outcome alternativos tv the 26 closure status system
and encourages research n general, as well as suggesting directions
for specifically ncedeu research.
General criticisrrz and resentzent of the closure system and the
, ,rnumbra rase" tirlye ben groYinr. ;teadily tn rehabilit;ttion for mon2
than two deender,. Vtatjlle (1068) contended th:,t the agency closure
reportinc, encourarS%:, (I) r.onur OV c10.urf!5 rather th'In qmslit7,
S"'s
. of ner.n...,
15.
(2) f!oncomple..; cares reluirint 1ca7t c!oun7;,1,..- ;He,
(3) c,Lbe cIor,ure to _ and
uneven Clow, (5) aistortion eTi
reportio,-, because of special ca;e5, etc., (f:,) no reco nion for
effort expended in cases closed nonrehabilitated. Similar objections
have been noted by other authors (Hauryluk, 1972; Muthard & Miller,
1966; Si.ver, 1969; Westerhelde & Lenhart, 1974) .
Pre.pent and past attempts to develop weighted closure systems
have been seriously damaged by the inadequate closure classifications
used as outcome measures. Prerequisite to weighted closure is estab-
lishment of clear, unequivocal, operational, outcome variables. Such
1
research makes the prominent error of assuming homogeneous groups
exist with regard to both outcome and prediction variables. The'
typical crt'ort attem-nt,1 t-o factors to the cross
trolt-r1 cc-folational re:rre;IsIon,
factor anal:;sic) techniquen.
It is thus justifiably imperative that,h:7h priority he given to
development of accurate and more objectively descriptive outcome
criteria for rehabilitation. To date, however, an alternative account-
ability scheme, acceptable to all concerned, has not'emerged. The
gross concept of the "26 closed rehabilitated" remains. Even such a
F.
macro criterion is preferable to no criterion at all.
With such di:ficulties noted, the following work is presented to
provided a context for further discurealin and model expltcation. The
great majority of research has utilized closed-rehabilitated 'vet.,sus

16.
not rehabilitate:a al the eriterioi. 'iowever, "ev havo
atto,u creativ- dearfures to ot%er Oil/A. 7 it
A. :',tucks with a "ulosed ::ehabilitatad' Criterion
The present discussion is nut intended as a descriptive or inte-
grative literature review. Several good reviews of success prediction
and client characteristics associated with outcome are extant (Day,
Cummings, Anderson, & Iverson, 1969; Grigg, Holtmann, & Martin, 1970;
Hammond, Wright, & Butler, 1968; Sankovsky, 1968). Rather, the intent
here is to summarize briefly the criterion variables used in such
studies. As noted, the vast majority have utilized 26 Status (closed
rehabilitated) as the success criterion.
Some potential prediction variables are continuous in nature and
.:ay be constuor at least (Viral. _hat is, the oracr of two data
bits may be specified by treatin,- one az rreater than the other. Vari-
ables such as age at disablement and years of education approach the
equal-appearing interval or even a true interval scale with a true
zero point. Such scales are considered additive and are appropriate
for use in analysis of variance, product-moment correlation and similar
statistical models discussed subsequently. Some variables are clearly
noncontinuous. Examples are marital status and sex. Of course, a
continuous variable such as age may be split into below age 30 and
above age 30 or some such partition, to create discrete categories. A
success versus nonsuccess criterion is also obviously noncontinuous or
discrete. Although reader sophistication in statistical concbpts is
r. r,'

17.
by no neans required, the note'i distinction between noncontinuous
(nominal or discrete) and ostersibly continuous variables is heinful
t4 be advised of as the discussion continues.
Demographic variables have been the most available data across
large numbers of clients. Further, demographic characteristics are
in large part relatively Objective and have thus been used in a number
of research efforts. In one study or another, depending on the local
sample or population studied, the scale or split utilized, and the
statistical technique employed, all of the following have been found
related to successful closure-rehabilitated. The,list as reported here
is in no way instructive to the reader who wishes to know which level
or end of a scale is predictive of success in rehabilitation. It
simply indicates that a lot of demography has been found related to
the present closure status system. ::orne variables identified have been:
major disability, are, af-s! at Esaoility onset, marita: status, number
of dependents, education, race, referral source, SSDI status, public
assistance, source of income, mobility, socioeconomic status, employment
history, home ownership, sociocultural disadvantagement (Aiduk & Longmeyer,
1972; DeMann, 1963; Heilbrun & Jordan, 1968; Miller & Allen, 1966; Tosi
& VesotskY, 1970; Westerheide & Lenhart, 1974).
Less readily available is inforMation of a social and psychological
nature. Several studies have atc.empted to use such factors in predicting
successful rehabilitation closure. The MMPI, Army General Classification
Test, Rorschach, Kuder Personal Preference Record, and Wechsler Adult
Intelligence Scale have been used as predictors with little success

18.
(Ayer, i'noreson, 1'4 Butler, 1966; Jrasgow a Drelp-r, 1965; Gilbert r.
Lester, 1)70; Goss, 1960; cireszett, 190; Jeff, 1955; Pearlman
Hylbert, 19o)). Social Vocabulary Index, the Interaction Scale, the
Edwards Personal Preference Schedule (Clayton, 1970; Goss, :lorosko,
Sheldon, 1963; iacGuffie, 1970; HacGuffie, Janzen, Samuelson,
McPhee, 1969) have also yieNa. marginal success. It appears that
more acceptable psychological adjustment and health as well as mental
agility may be associated with successful closure and placement.
However, such general and weak relationships from psychological tests
go
probably contribute minimally o
\increased understanding or prediction.
A few investigators have al attempted to study social or psycho-
social constructs related to client outcome (Barrytilalinovsky, 1963;
Lane & Barry, 1970; Salomone, 1972; Westerheide & Lenhart, 1974;
Wright, 1968). For example, social and religious participation, family
relationships, motivation, vocational goals, personal characteristics,
and employer attitudes toward physical impairment have been discussed
as possible predictors. The operational definitions of motivation,
for example, are often too broad or variable to facilitate measurement,
interpretation, or communication. In short, ego strength and similar
social-psychological attitude constructs in the absence of defining
and vocationally relevant behaviors appear to hold little promise of
reliable aid in prediction of rehabilitation outcome as it pti.esently
exists.
Bolton (1972) suggests that aIthowth prediction of outcome studies
have been popular, the single greatest need in such research is standard-
ization of research procedures and uniformity of reportinl format.

10.
Bolton states, "erediction studie.1 in rehabilitation are f-enerall:.r not
comparable due to z.ixeu disability saroles and differences it referral
criteria, criterion definitions and measurements, predig.tor variables
(even biographical data is not comparable because every agency collects
slightly different information or records it differently) and methods
of data analysis (p. 17)."
Case difficulty ratings have also been primarily based upon the
08, 26, 28, 30 closure criterion. Muthard (1965) stated:
4. . . it seems reasonable to assume that fewer difficult
and complex cases result in . . . closures (successful). In
fact, an operational definition of case difficulty and com-
plexity could be the number of cases -- of all like these --
which achieved rehabilitation status. Thus, the question of
buildir a set of complexity weights, or 'norming' case
difficulty, becomes one of figuring out what variables within
cases 'make a difference in terms of later success. We can
then build sub-populations of 'cases-like-this' to see what
percentage of each sub-population is achieving . . closure
(successful) status. On the basis_ of these percentages
can then 'norm' the cases for complexity (p. 31).
Both Miller and Barillas (1967) and Wallis and Bozarth (1971)
utilized this general approach. The former system considered major dis-
ability, referral source, age, and ye s of education -- with closure
,/-
status as the outccme. Wallis Bozclrth (1971) us .d major disability,
age, years of education, and tyre of previous rehabilitation contact --
also with a successful closure criterion.
,3.
Sermon (1972) developed a case difficulty indeA from the perc -.nt
rehabilitated natiNlatl- for an; -7Iven ..!atepory. This plan
uses the previous year's national statistics to establish the diffi-
culty associated with each disatility while disregardin g,. other quali-
fying demographic, psychologiT.al, or social characteristics. Obviously
the criterion is the agency rehabilitation, successful versus unsuc-
cessful ciciture. Several states (e.g. Florida) are experimeting with
or incorporating the difficulty index into their data procedures.
Florida uses a Composite Difficulty Index that includes (1) time
(2) cost (3) number of services provided and (4) Sermin's index (Znyada,
1973). Zawada reports this composite index to be valuable for program
evaluation studies in Florida.
In a study relating case service expenditures to the number of
successful closures per counselor, Lawns and Bozarth (1971) attempted
to differentiate-quantity from nullity. They proposed that increased
quantity or number of successful 26 closures' is associated with aore
funds spent on a larger number of clients. In the latter circumstance
more complex cases are assumed to require greater appropriations.
Possible sources of inaccuracy in such assumptions, have been noted
(Westerheide & Lenhart, 1974).
. Studies with "Other" Criterion Variable's
Several departures from the 26 closed-rehabilitated criterion have
been attempted. Silver (1969) obtained counselor estimates of diffi-
culty of rehabilitating various disabilities in terms of counselor time
and effort. Paired comparison and semantic differentia41techniques

1
were in an attemvt to in ori-T ;,?1,i a 1-,v
ond effort ,11.11,el 0! coln-0-lorz
closure. ;h1thouith silver obtaine0 flirly cousistr.nt orklerin- from
cerebral palsy (most difficult) throurh hernia and dental repair, such
measures contribute little to objective case outc9q study.' Inifact
the judgements are made in reference to standard closure criteria.
Similarly, a difficulty index taking account of total time from client
acceptance to closure has the same terminal reference. Goff (1969)
computed difficulty in terms of months from acceptance to closure, but
of course counts the agency closure status as the end point in the
process.
In addition to their previously noted criterion, !tiller and
Barillas (1967) unsuccessfully attempted to'relateseir index to a
measure or client Satisfaction. Kynce, -ahon Camia,e1] , and Finley
(1969) reported a sirmiricant reJltionlhinbeteen treatm.ent time and
job level, but none between treatment time Ind job placement or salary,
Utilizing variables from the RSA-300 having a common sense contribution
to gainful employment, Kunce and Miller (1972) sought relationships to
three outcome criteria. The 12 predictor variables were age, selective
service, race, number of de ndents, years of education, eNnings at
acceptance, welfare status, SSDI status, number of isabilities, marital
status, and previous rehabilitation client. The three criterion varit
ables were closure status, work status 'at closure, and earnings ato.
closure. Those authors report a number of significant chi square, car-
relation, and stepwise regression findings in relation to these three
outcome metrics (Westerheide Lenhart, 1974).
nit)n),

If
22.
ti
0Eben (D6o) derived` two criterion measures from closure and
follow-up information. "Vocational Adenuacy 21 Closure" involved
differential weights for (1) work status at closure, ( ) 1)0 job
code at closure, (3) weekly earninvr at closure, and (4) closure
code. His "Vocational Adequacy at Follow-up", similarly involved ir
, 4(1) employment at follow-up, (2) work* atus improvement from closure,
(3) j satisfaction, and (4) counselor estimate of success. An 11
step composite work adjustment criterion was used in a follow-up study
of former VA clients by Stein, Bradley, and Buegel (1970). These 11
briefidescriptions of work adjustment provided indication of (1) current
job status, (2) job time, and (3) number of jobs since discharge
(Bolton, 1974). However, as with other novel outcome criteria these
have been sed by few researchers or agencies except those developers.
'The Regional Rehabilitation Research Institute (RRRI) at Oklahoma
University constructed ftems designed to measure client satisfaction
.with speed of service, medical service, train,ing service, employment,
a 04
participation in planning, counselor effort in placement, agency
policies, physical facilities, and personal treatment in the Consumer's
Measurement of Vocational Rehabilitation (Hills & Ledgerwood, 1972).
While such follow-up attempts are laudable, their Percent of questionhaire
41et;rihas beln low (13% and 27%). Further, the unreliability of such
judgmental items as, "The quality of training I received" and 4my
counselor's ability to help me" may preclude the usefulness of these
responses.
11 .
In addition to closure status, Ayer, Thoreson, and Butler (1966)
used DOT occupational level and.an upward mobility rating as outcomes.
' 9.1

4.
23.
Lb*
McPhee and Magleby (1.)oii).twod sastantial, unsuastantial, ac,!; Linimal
employNenL. one criterion vlriablo for 1.eff, ":torn .000)
was percent of time worked during a one year follow-up period. Tsenr
(1972) found a number of personal and skill characteristics related
to successful versus unsuccessful completion of vocational training.
Rehabilitation success was in terms of ambulation and self care skills
for Ben-Yishay, Gertsman, Diller, and Hans (1970). Several employment
related criteria (level persistance, tenure, stability, looking for
work, employer/employee satisfaction, have been examined in relation
to various handicaps (Barry, Dunteman, & Webb, 1968; Kilburn, &
Sanderson 1966; Miller, Kunce, & Getsinger, 1972; Schletzer, Dawis,
England, & Lofquist, 1959; Weiner, 1961)). For sheltered voi.ksholo
clients ra.dler (1957) used a composite criterion of (1) number of
jobs client could perform. (2) his productivitys (3)'his steadiness
of work, (4) attendance and punctuality, (5) independence, and (G) work
quality. Cunningham, Botwinik, and Weickert (1969), Taylor (1963),
Lowe (1967) and Lorei (1967) fOnsideredremainingiout of the hospital
and in the community a success criterion for mental patients, while
Burstein, Soloff, Gillespie, & Haase (1967) considered discharge and
semplOyment outcome for a similat sample. Noble"(1973) suggests the
current U. S. minimum wage as the success closure criterion.,in.,-.-
Many authors and professionals are presently sUggesting that a
measure of cliedt, improirement or change from be 'inning to end of the
rehabilitation process is thp most profitable outcome consideration.
The agency closure criterion or economic indicators are surely inadequate
for reflecting accomplishments of an unpaid family worker or homemakers.

ho*ever, it is the very economic add vocational chants-es that are Most
readily measured, e.g., increase in weekly earnings, reduction ,in
welfare, grants,- job level. Valil physical and psychological improve-
ments are more difficult, but probably not impossible to measure
reliably. Several suggestions for incorporating such cha gefactors,
(i.e., social, community, and personal living competencies) in outcome
metrics liave been broache (Cook, 1967; Kelman & Willner, 1962; Krantz,
1971). The States Advisory Committee for Service Outcome, ;%ieasurement
Project, (RSA/EV-3-73)' listed criteria for administratively feasible
change outcomes as (1) being measured for all cli/
2 (2) requiring
no changes in servic delivery systems, (3) requiring no sophisticated,
./data processing equipment, (4) being easily/interpreted, (5) requiring
little t/aining, and (6) not requiring more,than 10 minutes df counselor .
1 1 time per case. While researchers shol9:d "Attend to such administrative
requests for parsimony, the developmt/nt 6k suitable rehabilitation out-.
comes should be the overriding, consideration at this point.
A Rehabilitation Gain Scale was constructed by Beagles, - Wright,.and
Butler (1970) (University of Wisconsin Regional Rehabilitation Research
Institute) as part of the Woad County Project for rehabilitation of
persons with environmental, or nonMedical disabilities. 'The Rehabilita-.
tion Gain Scale requires the client to respond to items reflecting voca-c
tional success and personal-Aocial adjustment. While client self reports.
of, for .example, source of income or weekly earnings may be accurate,\
/
serious methodological problems exist in self estimates of such items
\as physical condition, chance of getting a job, and emotional adjustment.
The scgle yieldb a pre-score, a post-score and a composite pre minus post
change score.

25.
t
Baton (107h) notes that the aterNYing of slici-7.separate dimensions as
.
vocational success and personal adjusthent into a sincle connosite, .
probably limits the interpretatiOn and,meaninr. of the gain score.
The Rehabiltation Gain Scale was expanded by Human Service
Systems, Inc., into the Human Service Scale, a self reported degree of
.. \
change instrument for clients served'through various human services.,,e- .
.
.
From an initial pool of 300 items, 80 were selected following item '
1
analysis, and counselor ratings.,' .These ,f80 items are designed, to- reflect
Maslow's (1954) kiierarchyi.ofj'ive basic" needs,"$ysiological, safety
,
4 A
.afid ecurity, love and beiongingneds, esteem, and.self-actualixation.II
.' .
For example, "How often are you bothered by muscle
or.sfitkes?" presumiblyrefated to the individual's
twitches;-tretbling, .
physiological needs.
Although the internal cundistenckes of these separate HSS scales are 9
largely acceptable, they do not appear to support the hierarchical
otdering sitggested above by;Nhslow's theory (Bolton, 1974).1 The
Virginia. Department of Voc tional HehabilitatrOn modified the Wisconsin
by deleting extravocational items '
EMI scale of rehabilitati n gain
and adding 10 self percep ion items (Hawryluk, 1974)'. In general,00ne
year after referral clients Close! in status 26 did not differ signifi-
Cantly in composite gain from thoSe still...in process oe closed not
. . I , «,,
rehabilitated. Otber,statits and reSearch centergh,(e.g. California,;'
West Virgnia) and Michig ) hiye developed questionnaires that coMbine
objective and subjective in rmation:about client outcome that
%,
used ins the pr&..pOst cliefit g in paradigm.
The Rehabilitation Services-Outcome Measure was developed try the
be*
Oklahoma Service Outcome'Measurement Project to-eipmine client gain in
974
a
4
0
26.
six aspects of rehabilitation change, (1) difficulty, e.g. employment
prognosis, A2) educational statu.i, e.g. months of op-the-job training,
(3) economic and vocational statu. s, e.g. weekly earnings, (4) Physical
s, - *functioning e.g. mobility, (5) adjustment to disability, e.g. client's
ge,confidence in himself as a worker, and (6) social competency,
decision making ability. The Rehabilitation Services Outcome Measure0
is-recorded by the counualor, but the same criticisms apply with regard
to unreliability of judgmental items. Although a* fewcounselors par-
ticipating in a reliability study might produce acceptably reliable4
ratings from expanded case folders, the possibility exists of grosso
distortion and =errors in judgement in such ItesimHas client's confiOence
or decisiOn making ability 4Westerheide & Lenhart,1973). The' Arkansas
Division of Rehabilitation Service has been txperillentIng with an adapted
form of the Oklahoma service outcome measure (Thurman, 1973. finis
adaption has eliminated some of the unreliable items !rem the OklaheMa
SeFvice Measurement Outcome Project, Form.A (e.g., Physical Tunctioning
Compensatory Skills with an inter-counselor reliability of .31). However,
- Arkansas; retained some unreliable items from the, Oklahoma Form A (e.g.,
Work Tolerance, General Hedth Status Other Than Disability, Employment
Prognosis, Mobility and Vocational Level, witiCinter-counselor
abilities of .554 47, .56,'.57, and .42 respectively) (Thurman, 1973-
Westerheide & Lenhart, 1973);
. .
Thus, some authors have tried to make a case for use of professional
judgement or client juUgement in evaluation Of rehabilitation, gain or
outcome. They fact that,such6judgmentai-data have been used in att empts
to demonstrate imprchements in psycholOgical'ane" cial functioning ih.
r139
`44,-

27.
_thethe fields of social work and payeltherapy is, not convincinL.7.. This
whole tact of judgmental evaluation is frau41, with diffinaties of
definition) validity and reliabilities. These issues are aiscusaed in-
greater detail in,asubseque'nt section. Sufficient at this point is
the caution that interjudge'reliability of "about ..60," as well as
,veik definitions and validity of such area as "personal meanings,and
Operiedoing" are &adequate separately (Rogers, 1961; TOmlinson &
Hart, 1962). Taken together they-are lethal to, any such attempted
Aeasurement.,6imilar,comment may be directea to'ihe estimated ient1- A
movement scale develoOed by Hunt and Kogan (1952):
,Hetiler (/963) came nearer to recording of objective inf'ormat'ion
in his socialcase-work movement survey. He counted the presence in
/
the home of such things as bed space, telephone, and alarm clock befOre
and after scivices. While th validity of some of Hetzley s items may
be questioned, cross rater reliability in such tabulation would be high.
e
The issues of reliability and validity of outcome measures are'paramount
and integral to assessment of the effect client, counselor, and
administrative Success,
/fi. PELIABILITY,AND V IDITY 0)2/ OUTCOME METRICS
tl ,,
The topics of reiiability;ad validitY of tests and measurement
Iare treated lin depth in.earlie" chapters,. The purpose here is to con-
. 0
eider these : concepts as they; relate tp outcomes in rehabilitation.
/ ''' :iReliability of a meirring ins indicateNhe accuracy with
7 ,,. .
which it measures whatever i mealUres.. If we know how reliable a/
seasurexiSs we can kn how much[ certainty to place in it. If we
0

11.11
i
measure len,y,th 07 a t;st. 3.nr:!ral tfte,$ :tit., a
tare,' s
wou,j Atain airnJt is, hsve
obtained 't :itch de6ree'ofrelipbilitj, and so ue have conalence that
. the length is accurate. However, measuring the house by hand snarl-. p
would be less reliable. The methods of reliability estimation tradi-
.tionally presented are (a) the test-retest method, (b) the parallel-
test method, ('c) the split -half method, (d) the internal-consistency
method, and (e-).the inter-rater method.-
Let us rev see how these reliability methods relate to the types
of repabilitatidn-outcome measures previously discpssed. The following
outcomes are sufficient for illustration:'
1. VR,StatuiA4losure 08, 26;28, 30.
2. .Earnings at Closure'(;:unce & Hiller, 1972; Noble7.1973).
3. Percent of Time worked during a fcilfbw-up neriodeff,
o
Rovick, and Stern, 1960).
4, ,Rehabilitation Gain Scale (Beagles, Wright &,Butler, 1970).
0
a 5. Consumer's Measurement of Vocatio01 Rehabilitation (Hills &
. Ledgerwood, 1972).
6. Rehabilttatiop Services Outcome Measure, Form A (Westerheide &
tenhart, 19741..
The test-retest method of estimating reliability simply requires
that the same test be given/twice. Usually the same test is givento
the same pebple a week or tw6 after its first adanis ration. If their.
scores from the two testing sessions correlate high1y, performance is
stable, and the test has high test - retest, reliability. (1) VII Status
1
t`
V
Closure, (2) Earnings; at Closure, and (3). Percent of time should have
near perfect test-retest reliability Over a tiro week interval,
(4) Rehabilitation Gain Scale, (5) Consumer's Measurement of Voca-
tional Rehabilitation, and (6) rehabilitation Services Outcome
Measure would each probably show fairly high test-retest reliability,
.,,although some items in each measure would be unstable. Such suppo-
sitions of course are not data based, and work should be done to, ro=
videmecessary.reliability anevalidAy data.o
4
The parallel-test method is similir to test-retest., A parallel
form, of the test is administered and persons' scores on the two forms
of the same test are correlated. There is probably no parallel form
for outcome measures (1), (2), and (3,). These criteria are in most
cases clearly determinable and no such attempted 'reliability assess-,
, merit is required. For outcome rtes (4),(5),arid (6), it would-
not be difficult to construct parallel forms. With relatively short
Ntests.such as (4), (5), and (6) if a.shOrt time interval between the0 ,
tests, is used, high reliability ii likely./
Split-half reliability and internal consistency are similar to
parallel tests. Essentially, each /tali has a parallel item in another
form, but items from the two forms are mixed and present& as a single
.
test. In a homogeneous scale all items are,supposea to measure the
swim cOnstruct. So the itemsmsyl)esplit in any manner (°e.g. odd
Versus even), and they should correlate. Internal consistency estimates
simply take into account all possible split-halves. Outcomes (1), (2),
.
and (3) are single item measures and thus require no such reliability
101 0

30;
estimat;s- however, outcome measures (4), (5), and( ) are multi-
item, and they are heter9cencous. The items are dcslmled to tap several
constructs onaspects of successful adaptation. .In order to compiate a
split-half reliability- coefficient, each item would be matched in
y
difficulty and content with a parallel item. Outcome measures (h),
(5), and t6) would yield low internal consistency reliability. As
noted,. they are multi-dimensional, heterogeneous,. and would not be
expected_to- have items that correlate highly with each other.
Probably the most important kind of reliability for outcomes in
vocational rehabilitation is inter-rater reliability. For ex-ample,'sup-
Rose three counselors were told that.a given client had been accepted
for services, provided services, plated. -in employment, and was gain-,
fully employed one month later. The question asked each pf.the above
0
eckselors is, "Would you close ti:e client as 03, 26-, 28, or 30 ?"
Counselor 1, and 3 each say ":!().' The inter-rater reliability is4
perfect: Similarly there would be high agreement about such objective
outcomes as (2) Earnings at Closure and (3) Percent of Time. 'In the
(6) Rehabilitation4Services Outcome Measure, Form A, inter-counselor
reliability was good for objective items such as weekly earnings (.98),
work status (.92), primary source of support (.92) to dependency on
others for financial support k.92). Poor inter-counselor reliability was
obtained for anticipated change (.35),'employment prognosis (.56), avail:-
abiliIy of facilities (.45), vocational level (.42), general health
status'other than disability, (.47), mobility (.57), work tolerance
(.55), compensatory skills (.31), and employment expectations (.59)
(Westerheide & Lenhart,a973).
1 0 2G

31.
Inter-rater reliability is inapplicable to many self report julie-
mental item _.in (4) liltereaS both counselor and client might
show close correspondence in reporting, "the time it, took to get the
servicesostarted," there could well be major discredanciel in percep-
tion of "OY counselor's ability to help me." Although such discrep-
ancies are instructive for feedback, they, are characteristic of unre-
-liable-outcome-measures.
Validity generally refers to whether the-measurement actually
measures the trait or phenomenon it vas intended or designed td measure.
There are also several different kinds of validity: predictive valid-,
ity, concurrent validity, content validityPond construct validity- are
usually recognized. Predictive validity is achieved if the measure
can predict another outcomeafter a given time. If two different but
concurrent mea'stres or the same phenomenon corroLate;, concurrent
validity is establishea. Gnlike predictive or concurrent validity,
content validity is not expressed as a correlation coefficient. Con-.
tent validity is simply the appearance that the test or criterion des
indeed measure what it, as designed to measure. Similarly, construct
validity is not a single correlation coefficient, but is based in the
theory that surrounds the variable that refers back to the theoretical0 .
and hypothetical definitions of the Construct in question and. tteMpts
to relate, it to -other measures -of that, or related constructs.
Now, let us consider. the previously noted sample outcome measures
in terms of their validity. (1) The VE Status Closure appears to have
at least-moderate predictive Validity. Follow-4-studies usually
Indicate Somacorrelation between whether clients were closed.26 and
whether they are working now in a similar capacity. It certainly halt
0

32.
concurrent validily since it is, correlated with such other outcomes
as higher earnincs at closure aril reduced:oublic.. assistance. The
status closure has every good content validity for most clients and-.
employment situations. However, it should be expanded to give dif-/
ferential successful closures to such categories as homemakers and
heltered employment.' The concept or construct of vocational rehab-
.ilitation is real. The 26 status closure system, with the above noted
tlexceptions, 10 g_short,range epitome' of vocational rehabilitation;
can we take a disabled individual and provide services to facilitate
his productive employmentf The closure Systemtasgood validity,
.
but should be expanded to inCrease.prediCtive and content validity for
the diverse, client popu4tion.
Some similar comments maybe ,made aboat (`2) Earnings at Closure
and (3) Nrcent..of a follow-up rui.lod. Several.
.follov-ups Pit expander.` int,ervaz s,ould be part of the pr?cess ana
should allow for service and status modifications to inc'ease.predic-
tive validity. Like the status Closure DJ, ouicome m asures (2) and
(3) have high concurrent validity. They have good content validity
and certainly are related ,$o the vocational rehabilitation construct.
Outcome measuret (4),,_ (5), and (6) do.not fare as well. Partly
because of their recent vintage, and in part because of their inclusion
Of unreliable items, we have little or no,information about predictive 0
validity. It would also be interesting as well as viluable'to s e how
these measures relate, to concurrent outcomes such as (1), (2), al
(3). These measures appear to have good content validity, but vaaidity
cannot exceed the. square Toot of the reliability. That ii,, if the
reliability of a measure 1st) the ,greatest possible validity
S.
J
.

033.
would be .60. With the incluSion of subjective wAd7emental items in
ou ome measures (4), (5), and (C) validity is reduced. Constructh
*
/Validity of the'Rehabilitation Gain Scale appears to be poor in that
several constructs or dimensions are considered. A similar situation
Wets with Consumer's Measurement of.Nrocational Rehabilitation and
Rehabilitation Services Outcome Measure Form A. Perhaps separate'
reliability and validity should be determined for each sub scale, or
*dimension. Westerlheide and Lenhart-(1973) have laudably attempted to'
provide reliabilities for each of the items and subsection as well as
the total instrument.
0
*A
The foregoing discussion of reliability and validity leads to the,
following recommendations: We'should seek creative expanded , outcome0.
criterion measures that would be-broad er.ouvh to adequately describe
7/
diverse client groups and employment or, occupational placement com- r
and-criteria aTe paramount for reliable assessment and are integrallyi ,
, I
related tOthe potential validity of any outcome measure. Objectivity.
of outcomes and elimination of ambiguity tik-7 been emphasized by a
number of authors (e.g. Bolton, 1972; Coone i\!3arry 1970). Careful
consideration of the vocational fehebilitation conceit must accompany
iidevelopment
and seleCtion of valid outcomes.
mensurate with services and training provided. 3b4ective recording
IV. TOWARDASYSTEMIOF REHABILITATION OUTCOME
ANALYSIS AND EVALUATION.
Program evaluation, Weighteii.,closure, case difficulti, and gain
scale have become popular "catch" terms in vocational rehabilitation.'
a 105

3h1
As previottsly noted there !.--ve been sewcrql attemptti to operationlli;e
tase.uifficulty-or develop weighted closure systems based on :the 26
closure concept (e.g. :1iller 3arillas, 1967; Sermon, 1972; Wallis
Bozarth, 1971). Such attempts have been handicapped by that inadequate
closure status system. The 1974 IR; Prime Study ppcument on Neasuremeat
of Rehabilitation Outcome notes tliat the 26-closure as a measurement
concept fails to consider any success short of WeightiAs systems4
---have naedcasedifficulty ala this ideal as a primary determinant of
quality. ThuS), in most weighted. closure procedures a sleverely retarded
client is more difficglt and hence more desireable to rehabilitate,
from the counselor's VandpOint, than a slightly didabled client.
Mortover recent legislation this factoi. While onemsy be
more difficult, if rth are genuine rehabilita t ion s that would not have
occurred by spon4tn ous remission or by 'some other mgchanism, is one of
these individuals in re important to rehabilitate than the other? The
hetefogeneous 26 ca egory does not provide sufficient outcom informs-
tiOn about ihlese two clients so that case difficulty may Wviewed'in
context. Moreover, ;he IRI group states that analysts debunk the idea
of "rehabilitating" X thousands of .persons; they ask instead for data
which measure impact in specific terms of earnings) loillevel, and.
. reduction of blic assistance.-t
The IRI Prime Study Croup (1974), suggests taking first things
first. COnclusive and comprehensive outcome variables and measures
are prerequisite to, not decendentunon, effective program evaluation,
effective counselor evaluation, and effective client service, delivery
evaluation. The IRI group essentially endorsed areas proposed

7
35,
by the °I:10116m Service OutCor.o 'easurement ??.ioject: Physical, _,ducts -... \ .
..
.
s
ttonal vpcational, .,:condmic,.aad Isychosocial. '.:1,:. Ir.. group rivisedLc
slightly as follows: Ps:tchpsecial Functioning; P?:ysical Functipnin?,;
Economic Inde endence; and Vocational Functioning and Potential.'
a
of these may presently ;be measured reliably ,and validly within
a revised YE outcome context. PsychoaRcial has been omitted for reasons
noted' previously., It is indeed possible that obctive and reliable-
2.
.
psychosocial rndices may be developedYThe current state otpueh
'4'i .
indaces does Aot *arrant inclusion at this,time..Bowevee, researchers
4.
0 -,
,
.
and praCtitioneralhOuld b encodraged to continue to seek and develop
, . ,o
.
accurately relieal measure& of psychosocial functioning and gain. The
examples injable for,four area Sheull be consideredtenativegat.
best, but illustrative of the possibilities that exist.
\ ,
Physical capaci y may be measured objectively and Tenably.
Sevelal fairli godel' neck lists alrcaQ,existi Forexample, the West.
.
. 1..
Vir inia Rehabilitati n Center uses a "Funct4nal Capacity Evaluation"
' .,
with five general acLVity areas: (1) Mobility, (2) WOrk Positio4ing,
\ .
.
(3' Str\ ength, (4)R4ctg, and (5) Skilled lictivity. Each of these
filie activitf areas Includes several objecti4A behavioral assessments.', , 0, ,
Under Mobility, for example,ole item is Stairs (5 steps client can
\ I.
I
go u and down three times\). Under Work Positioning one item is
,b
. r.,..,
Kneeling (client can assum a kneeling position and maintaln it 'for a .
I..
one7minute period). The aildwers to such items e clearly yes or no.
1
Physical capacity may,thus b objectively determined and r deporte.4\
At',
i
Other gain or change sco as may also lie coded from Table 3. To
illustrate, assume Client A wa closed )632. We an readily see from0
Insert Table 3 about here
1 ( 7
4'

4
4
.r It ...,... ' a-t to . 4 i
.2able 3 'that he'or she had ho physical incapp.city atacceptancf: ('li)f
.. . . ' t (,. , ,
\as reauced in' publicassistance.b, 96 to 100 ,Iollats ner mon!.n (:1),,
'increased earnings by/200 to otiO dollars per.montli (3), rm a result1/, k
...-
t.. I* .,
of being; placed in part time cdmpetitivegmPloyment (0.4 , SupposeA t ' .
a. .
.5 t tr ,`, ,,. - -
Client B was closed ICX5rhis,client increased by 6. to '10 points.il
, .. ,
physical capacity (41, was not. receiving pub licilsistance (X), wasa ,
N
,..s
. 4i ''s N... ,
not 4arning money (i), and, was closedas a sliceessful hremakei or1
4 4...
t, s .
t I__
. . /.'unpaid family,worker (5): , Various closure profiles' may-thus be cbn---. .
. ,
/ t! 4 . /, ,
4 _, .structed to accuratelrrepiesent client gain:. Si,es are ,provided at
14\ 1r aJ4 , .the bottom of Table g forludicatiOn drqdihtitative closure infor-
mation: 1
/ ' i * I A II
1 V iWa
$ ' 104 .
l'\ )k more descriptive
.outcome scheme Suchas the one noted IFT ble,3
' .' '-, II\ .' i 4
, would theta open the way for effective developmentiof weighted closure
.,
and proqram eval1uaiion. "In pro,ral evaluatIOn, agenv resbrche
.* k
shou,14 be ehol.ram.ito 100% fo primeindic40-.c" iJaf voa'x, to or.. .
.,
, ,..
chude,thos outcomes. These pri.ne indicator's q;4ould be sourI,Ut from
.: ,, ... . 0 i
input (inta''.1.0) as well as from intervgation (process), variables.
4 PAP , 1 1 % ... ft.... 4
Examples from our research attheiWgpt Virginia Rehabilitation Researdh,
, . ,
. . . 4
,
.-
and.Training Center are cited sere 'to illuftrate'the-liearch for prime
.1%1
6% % . 1 .
indicators of variousspecitiedNontcomesthroughfour statistical
4
models:. (1) Chi Square, (2) Analysis of Variance, (3) Correlation, and
(4) Multiple Linear Regression.
1:4*
A. Chl'ku. re Model.0.
\ . .
There are a total of 6? .Variables 1A RSA-300 Case Service Reportti,,
pinviding client-Specific data. Of the 62 variables, 42 are nominal. 1
4%1 1 f 0 ' . 1 i, .0/
lie
4.,
s'

.5
(noncontinuous or discrete) variables and, therefore, yield frequency
data. They include county code, referral source, sex, status 'ita
referral, race,, .major disabling condition, marital status,'wbrk status
aV referral,, public-assistance type at referral,_eto.
Whenever herd is alneed for examining rehabilitation outcowes`
4inferentially, connection with any of these nominal variables, chi
54i4are senifYsiaan be useful.IL
For example,. we 'have"drawn a 10% stratified random sample, con-
sisting of 1,388 cases, from all the cases.served duringthe fiscal
year 1969-70 in the state of West Virginia. The breakdown of this
sample in .terms of closure statuses is as follo.ws:' 670 08's (clients
not accepted for service's), 616 26's (clients accepted for services.\.
(clients accepted for:and received idr
/
!,(-
and closed employed), 51 28'd. .
necessary services but cloSed unemployed) and 51 3-lb (clients accented)1j
c4sfuliy closed) . To answerfor and receiveU some services but uns4C
the question, "What cparactericd
1.4
tional rehabilitation, services atj:ntak
characteristics which
,accepted group,-(26's,
. ,
are by nature nom*,
28's, and .30's) hn
'.be carried out using chi square statistica% Table.4 shoils the result
.
s who were acceptedefor voca-
?" comparisons of those intake- - ,
al variables between the.
-rejected group (08's) may
\-.
of such.cOmparisons
Notice that one-way
on variable REFERRAL SOURCE and variable SEX..
chi'square'analysis, with one degree of freedom,
was conducted for each
.Insert Table 4 about !lere7 '"'" ,
Category Or the nominal variable separately.
caie orA!!,orvariable REFERRAL SOURCEThat is, each of the seven
TO 9
."

33.
A
'(e.thicational institutie)hs, hospitals, health afrerleics, welfare arencies,
. .
/public.orrtions, private ori:anizations, %nd individuals) .1.nd ;:3c^
1 .
_ .
1/ of the two c..tegories of Variable .75X (male.3 and remaleS) was analyzed.,-.I A .
in terms ofactual'versus expetted numbers ()yeses for the accepted
and,rejected,groups. Notice, also that the expected numbers of cases,
,
for the two:groups were determined on the basis of the distribution of. ..0
.
, ;,/. 0.'.li
718 clients Who ere accepted (reRresenting 51.7%) and 6700cliepts who
were not a opted (representing 48,3%) tn the , sample of 1j88 client
(1Q0
-14
Consider for instance the category "educational institutions" of
variable REFaRAL SOURCE the actual number of cases obsekved for the
if
,accepte4 and rejected groups were..37-and 41, respectively
to maintain the null hypothesis we would;expect 51.76 and
and in order
of the
73 ?lieut.:, (ths-! sum of 37 !tni I, I. referred'b,t.wiuc.t4onal institution.;
:!(:),xnA. 1.4e .tcoe;,L-a 2;11 r-..tedLea,-roupr,i. erefore, tLe ex-
- I
pected frequencies for the accepted and rejected. groups were 78 x 0.517=
40.3 and 78 x.0.483= respeC tivelyl. As you can sle, the discrep-.
ancies between the. actual and expected frequencies for the two groups,^.1
,
07 versus, 40.3 and 44. versus 37-.1) wire rather small AUTi the resultant
chi.square value of O.5) is not significant, indicating that clienti
retrred,by educational Institu ons did:notproduce unexpectedly smaller
k
AF greater numberS of accepted eases.
Let us take.a loo at the category "males" of variable SEX: Of
'7 ,. .
7 the,804 malesdn the sample, 344 were accepted And 1160 were rejected.
. .
, ..
The expected frequencies ,for the tw' groUis were 804 x 0.5176'415.7 an
110
a.
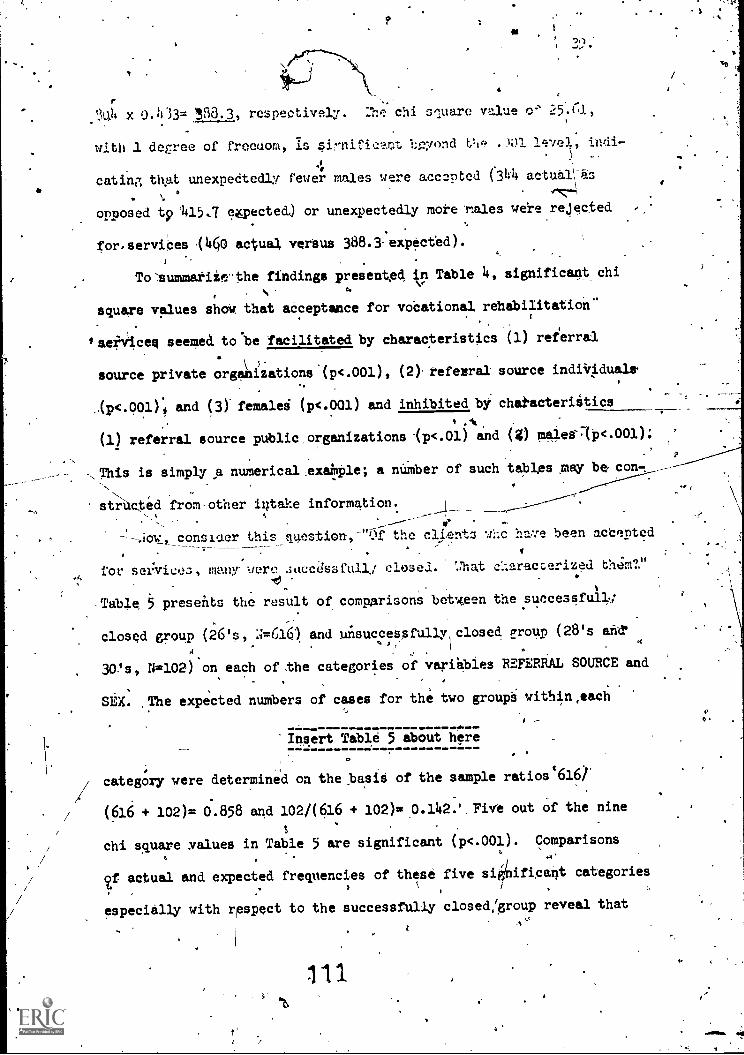
ris
md ,
10,A X 0.103= 133.3, respectively. :he chi seluare value $2' 25.61,
with .1 degree of freedom, Is sinificat Leyond .)01 14vel, indi-
eating thAt unexpedtedly fewer males were accented (344 actualas
opposed t9 '415,7 corected) or unexpectedly more males we're rejected
for.serviCes (440 actual, versus 388.3:expected).
To'summariie.the findings presented in Table 4, significant__ chi
.
square values shdw that acceptance for vocational rehabilitation"
'services seemed to be facilitated by characteristics (1) referral
-7-
source private orgaitizations.(p<.001), (2)' referral source indiViduals,
,(p<.001); and (3) femaled (p<.001) and inhibited by chatacterirtics
referral source public,organizations -(p<.01) and (t) p.sdes-Its<.00th
This is simply jet numerical :example; a number of such tables may be con-,
strUcted from other intake information.,,,
,iewtconsiaer this ageation,-"a the clients whe ha7e been actented
for sei:vieoz, many were .weedss Cull.; closed. .1.1at characterized them?."
.Table 5 presefits the result of comparisons betNgen the successful41
. .
closed group (26's, :;=616) and unsuccetafully,closed group (28's and',,,
,4
A ,
30's, N=102) on each ofthe categories of variables REFERRAL SOURCE and
'-
SEX. The expected numbers of cases for the two groupi vithin,each
`Insert Table 5 about here
. _
category were determined on the basis of the sample ratios'6167'
-
.
(616 + 102)= 0.858 and 102/(616 + 102)=0.142.'. Five out of the nine
chi square values in Table 5 are significant (p<.001). Comparisons
/ of actual, and expected frequencies of these five significant categories
, .
especially with respect to the successfully closed*oup reveal thatA,
111

1.
ho.
(1) referral source individuals and (2 females were facilitatncr.
'characteristics, while (1),referral source hospitals, ( ) referral
scarce yelfare agencies, and (3) males were inhibitinr dharActeristics-
for successful rehabilitation.
D. Analysis of Variance Model
/--In the RSA-300 Case Service Report, measurement (or metric) data
on these,20 continuous and/or ordinal variables are available: age,
months in statuses 00-02,eiloonths since last closure, number \of depen-
dents* total numper in family, highest grade completed, weekly earnings
at referral, total monthly family income at referral, public assistance
monthly arount at referral, months on public- assistance it- referral,
all services total cost, rehabilitation facilities total cost, socialo
security tru.A, funds tot-i cost, o.:aendedseval.I.Istla tr)tal cost, ::cekl:r
clo.;nrt, rIL.11.0 a;sijtn.nc,:.. nonth1 anonnt.at
months in extended 'evaluation (0). or 06), months from acOectance to
closure (10-24), Months in training (18), and months ready. for or in
employme-nt .(20 or '22) .
The analysis of variance (ANOVA.) approach can be taken when dif-
ference between groups (for instance, males versus females, .clients
accepted versus clients rejected, clients successfp47 closed versus4
. t e
clients unsuccessfully closed, etc.) on any of the ab ve continuous
variables is to be investigated inferentially. . '\
The question, "What characterized clients who were-accepted for
vocational rehabilitation services at intake? 1! can us be answered by
comparing clients who were accepted for services w th_those who were
14,

la.
not on each or the ten continuous variables tapped Pt referral usinei,
the one-way analysis of V*riance technique. fable ,., 314unari7,.es the
results of such.comvarrsons conducted nor the West Tivr,inia FY 69:,70
ime ',A ..
caPqa'.
0 ;nsert Table 6 s.b Out here
Of the ten variable* examined, twn significantly differentiated the
two groups. As cOmparedto those who were not accepted, clients who
were accepted for services are characterized by significantly lower
mean months 3n statuses 00-02 (pg.001) and higher mean weekly earning*
at referral (p<.05). Moip specifically, data showed significant mean
differences between the accepted'and rejected groups, on (1) months in
statuses 00-02, period of time from referralptatus to applicant status,
(mean 3.6 for the former group versus man 3.7 for the latter group,0
with F=1.)6..)>, Ldf/1262df, r.001) and (2) wceAly earnincis at referral
(mean- 19.0 for the former groUp versus mean 13.7 for the latter group,.
-
with F=5.37, ldf/9854f, p<.05).
Table 7 summarize4 the results of"26 one-way analyses of variance
comparing clients who were successfully closed with clients who were
unsuccessfully closed (all clients had been- accepted for. vocational
rehabilitation services) on the 20 continuous variables for. he same_
I .
West Virginia FY 69-70 ten percent sample. The analyses were under-
taken-to answer this question: "What,characteriked clients Who were
successfully closed ?"
.......Insert Table 7 about here
11 a

42.
The findings reveal that there were significant mean differences
between the successfully closed and unsuccessfullyclosed,groups on\
9*variables: (1) the highest grade completed (neap 9.2 for the formergroup verrus mean 8.h for the latter group, F=5.81, ldf/706df, p<.05),(2) weekly earnings. at referral (mean 21.2 versus mean 5.9, F219.39,
ldf/692dfi. p<.001), (3) monthly amily income at referral (mean 2.5'versus mean 1.5, 1%110.42,
ldt /689df, p<01), (4) all services total
cost (mean 580.2 versus mean 185.7, F319.81,ldf/714df, p<.001),
(5) weekly earnings at closure (mean 49.5 Versus mean 1.9, F44.31,,
ldf/669df,lp<,001), 16) public assistance monthly amount at closure1(mean 7.8r versus mean 18.1, P=6.27,
ldf/618a, W55), (7) months in.
extended evaluation (metn 0.1 versus mean 0.6, F=15.57,1df/576df,
p<.001), (8) months from acceptance to Closure (mean 13.0 versus meanA
23.9, Fmh1.33; ldf/713df, n<.001), and (9) nonthsready for /or in
4employment(meAn 3.6 versus,nean ).), F=15.30, ldfN,91dt D<.001).'
In otter words as compared to those who were udsuccessfull.y.
closed, clients who were sucCessfully'ciosedare characterized by
.significantly-higher' mean grade level (p<.05), higher mean weekly
earnings at referral (p<.001), higher mean monthly family income-at
referral,(p<.01),-higher mean cost for services (p<.001),higher mean
weekly earnings at closure (p<.001), lover mean public assistance0
a
tmonthly amount at closure (p<.05), lower mean months in extended
evaluation (p <.001), lower mean months from acceptance to closure'
(p<.001), and higher -mean months ready for or in employment (p<.001).'4,
114

143.
C. Correlation Model
0 01 the 20 continuouS varial)les in the %a-300 Case Uervice Ilenort,
10 are intafte variables (age, mouths in statuses 00-02,, months singe'
last closure!, number of dependents, total number infamily, highest.,
grade Co7pleted, weekly earnings at referral, total monthly family
income at referral, public assistance monthly amount at referral., and
0months on ublic assistance at referral). Theother 10 are'either
process orioutcome.variaples (all services total cost, rehabilitation\
facilities total cost, social security trUs:.. funds total cost, extended
evaluation total cost, weekly ,earnings at closure, publicissistande
monthly amount at closure, months in extended evaluation, mo ths from
.e.
. . \acceptance to closure, months in training, and months ready for or in
0
employment).
/ .
Whenever there. is a need to determine, bescriptively, the extent
to whicu any two, these continuous variables may be associated with
. /
each other, the product-moment correlation coefficient (Pearson 04 . .
can be used. A 20 x 20 correlation matrix presented in Table' 8 shows4 0
intercorrelations among the 20 continuous variables for the West .
Virginia FY 69-70 10% sample.
Insert Table 8 about here ,
t
We may want to chick'how som of the process and outcome variables
correlated with intake variables, For
examplq, Variable 11 ALLSERV (tab." cost fOr'all ces) represents
the Most important 'cost variable. This process variable showed signifi-
cant correlations with these intake variables: (1) age (-1. -.13,
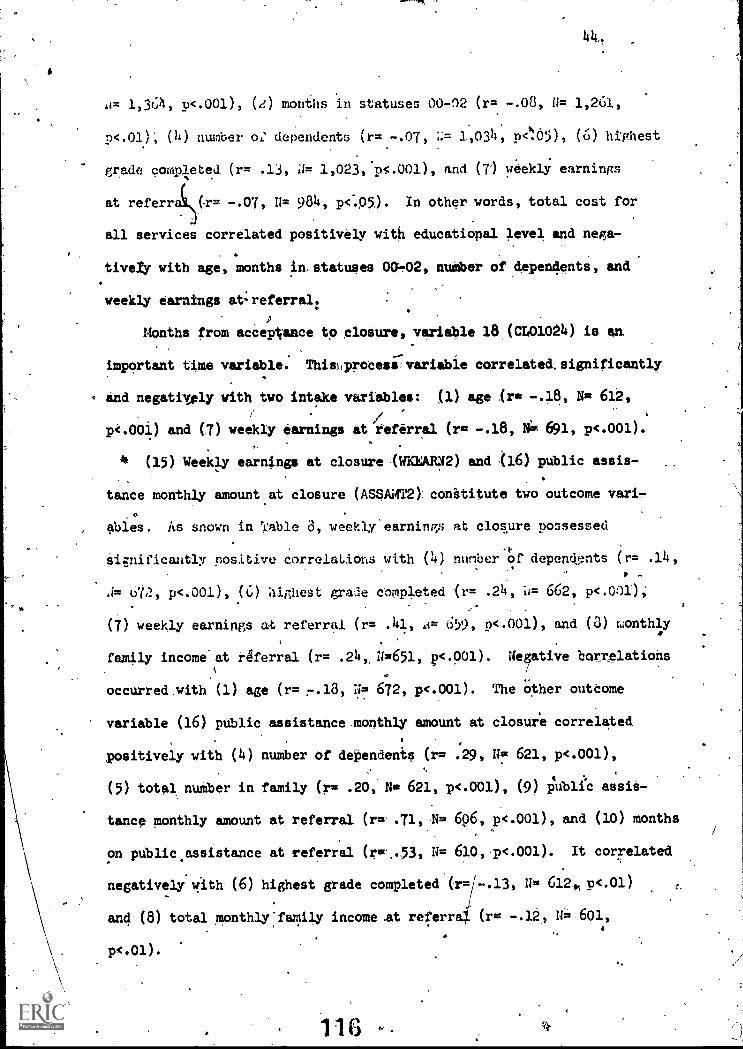
A= 1,36h, D<.001), (2) months in statuses 00-12 (r= -.08,, II= 1,261,
p<.01); (h) number oA7 dependents (r= -.07, 4= 1,034, p<''.65), (6) highest
grade competed (r= .13, a= 1,023,'.001), and (7') weekly earnings
at referr (-r= 11 984, p<-.05). In other words, total cost for
all services correlated positively with educational level and nega-
tively with age, months in. statuses 00.702t number of dependents, and
weekly earnings at- referral:
onths from acCeAance to closure, variable 18,(CL01024) is am
important time variable. Thialprocess,variabie correlated. significantly
and negatively with two intake variables: (1) age Cr" N= 612,
p<.001) and (.7) weekly earnings at referral (r= -.18, NI. 691, p<.001).
* (15) Weekly earnings at closure (WKEARN2) and (16) public assis-
tance monthly amount at closure (ASSAMT2): conititute two outcome vari!-
ables. As snown in 'gable 8, weekly'earnings at closure possessed
SizniCicantly positive correlaLions with (ii) number of dependents (r= .14,
A= 672, p<.001), (6) highest grade Completed (r= .24, ii= 662, p<.00i);
(7) weekly earnings at referral (r= .41, d= 659, p<.001), and (3) raonthly
family income at referral (r= .24, a=651, p<.001). Negative borrelations
occurred with (1) age (r= 7.13, N= 672, p<.001). The other outcome
variable (16) public assistance monthly amount at closure correlated
positively with (4) number of dependents (r= .29, II= 621, p<.001),,
(5) total number in family (r= .20, N= 621, p<.001), (9) PubliC assis-
tance monthly amount at referral (r= N= 6p6, p<.001), and (10) months
on public assistance at referral (r.,.531 N= 610,,p<.001). It correlated
negatively with (6) highest grade completed (r=/-.13, 11= 614 ,p<.01)
and (8) total monthly family income .at referral. (r= -.12,, N= 601,a
116 -

145. .
, 0
Unear Repressigri
Capitalizing on the availability of the RSA-300 data on the 20
continuous variables covering the rehabilitation intake, proceso"i. , and, 1
III". , ; ..
.
outcome stages, we may address ourselves to a general question such as
"What combination of iniake variables would provide an optimum predic-/
tioncif a' given outcome variable?", This question can be answered
statistically by ide tifying in optimum multiple li..4ar regression
equation Y=a+bly iy- bkX,' where Y is a dependent variable
(i.e..
an outcome 4rlable),'a denotes a constant, bk represents, the
kth regression coefficient, old Xi stands for the kth predictor vari-
Able (i.e. the -kth intake variable).
t//.
.4kFor ins Ave, weekly earnings at closure (W !2, an outcome,
variable =), shy be predicted by using the 0 intake variables As combined..t..
predictors./
Table 9 summarizes the results- of a step-vise multiple
linear/em'ession -analysis involving clients in the *Yest Virginia. 4.
4T:60770.1W; sample who had all the data on the dependent variable.
,
(weekly earnings at closure) and the 9 predictor variables.
Insert Table 9-sbout here
As can be seen in step 1, the best iingle.predict this out -
come variable (WKEARN4 was weekly earnings at referral 6110EAkN),with
the correlation coefficient 1R)' of 0.40 (Ns 539,p<.001). When all::
the 9 predictor4ariables were used for prediction (.see Step 9), the
resultant multiple correlation coefficient was hiked to
p<.001) which is not significantly different from '0.46,
'7
0.47 ,(N= 539,
the coefficient-

" '
I 46.
0
for Step 3. This means that the, multiple linear regression determined
by Lltep 3 would provide an optimum prediction. The.equation is as
follows:
Y=040.140 + 0.557 X1 -.0.560'X2 + 1.572 X3'
where Y = weekly earning* At closure (WIT.10112)
X1
= weekly earnings at referral (WKEARN)
X2
=age (AGE)
X3
= highest grade completed.(GRADE)
What. combination of intake variables would provide an optimum0,
prediction of public assistance monthly amount at closure (ASSAMT2, \\
another outcome variable)? The results of,a step -wise multiple linear.l,
regression analysis with the West Virginia FY 60-70 10% sample are
/(
summarized in Table 10.
Insert l'able 10 about here
Step 1 shows, that public assistance monthly amount at referral
1SXA11T) was the best single predictor of the dependent variable
(public assistance monthly amount at closure, ASSAMT2), with a core-
/lation coefficient of 0.69 (N= 511, p<.001). When all the 9 int
vriables were used as combine& PPedictors (Step 9) the multiple ilinea?
tegr;asion coefficient (R) reached 0.71 which is the same as th t of
e .,/
the 3 predictor variables combined (sed Step 3). In other vdr. ,
Step 3 gives the.,optimum predictive model which is as follows:i
Y=t 8.895 + 0.552 X, + 1,825 X2 - 1.007 X3
were Y 7 public 'assistance monthly amount at closu l'ASSAW2)
Xi = public assistance monthly Amount at referral (ASTAMT)
number of dependents (NODEP)
X3
= highest grade completed (GRADE)
3 11 8
a
a
.
Overview
Ca
*4.
47.'0
The rehabilitation system is viewed herein as an input (intake) -
-intervention (process) - output (outcome) paradigm. Sound methods exist
tormoseseing relations of intake and process variables to rehabilitation
outcomes. Adequate experimental methods and statistical proCedures are
available for the-explication of such relationships.
There exists, however, a criterion problem in rehabilitation. Al-
though few would quarrel with productive employment as an ultimate crit-
4erion, many bmve.called for a-more broadly descriptive taxonomy of oui=.
comes. Outcome classification Should also take into account such factors
as gains in physical functioning and dependenei reduction. It:is of.
paramount importance that such outcome coasuri, be valid and reliable.
That is, ,any criteria selected must contribute in a substantiai manner
to the rehabilitation construct and they cuit be objectively Oeisurablei
Outcomes of thiasortlasy be examined through chi oqUare, analyeis
of variance, correlational, and,stepwise regression procedures. Program
evaluation should consist in determining hew well specified-criteria,
are achieved end in modifying or adjusting to prime indicators of those
outcomee.vhdre needed.
1 1 a
I

. -References
I
48.
\ /
1. Aiduk, R., and Longmeyer, D.:- Prediction of clieht suce/eit with
vocational,reheilitation in a state mentalhogpital. Rehabili-
tation Counseling Bu1lettn4:1-10,71972.,
2. Ayer,. M. J., Thoreion, R. Wri, and Butler; A. J. Predicting
rehabilitation success with the MMPI and demographic data. Per
soma. aael duldance Journal 40:634-63T, 1966.
3. .Barry; J. Rol, Dunteman, G. H., and Webb, M. -W.: Personality and
motivation in rehabilitation, Journal of Counseling, Psychology,
12g37.444, 1968.1
Barry, J. R., and Mlinovsky, M. R.: 6lient motivation for rehab-
ilitation: A review. Gainesville: University of FloridaRegional
Rehabilitation Research Institute, 1963.
5. Ben-Yishai, Y., Gertaman, L., Diller, L., and Hans, A.: Predic--
tion of rehabilitation outcomes from psychometriCparemeteri in
left hemiplegics. Journal of Consulting and Cliaical:Paychology,
-34:436-441, 1970.
6. Bolton,
7. Bolton, B.: The predi tion of rehabilitation outcomes journal
of Applied Rehabilitation Counseling, 3:16-2!4, 1972.
.11
12()
A
8. Burstein, A., SoloffA., Gillespie, H.., and Haase, M.: Predic:tv,..s,
.
tion of hospital discherge of mental patients by psychomotor per-
formance: Partial replication of Brooks and Wearer. per6eptualS
and,Mbtor Skills,. 24:127-134, 1967. f1 r
9. Campbell, D. T., and Stanley, J. C.: EXverimental and 9uasi-
iiiental Design for-Research. Chicago, Rend McNally, 1963.
layton, W. H.: Correlatts of client`- counselor interact/On and,,. \ .
.
habilitation outcome. DisiertationAbsttscts International,
10.
31(4-e):1572rA, 1970:
49.
t ' N 4
11. Cook, T. E.: Psycho-social barriers to rehabilitatiOn in Ap-it
paiachia. Rehabilitation Counseling Bulletin, 110-105, 1967....,,
12. ,.Coone, J. G., and Barry, J. R.: The oscillating? phenomenon ini
t prediction of rehabilitation outcome. Rehabilitation Research, .0 .4.0"
..:' t-Nc
and Practice. RevieV, 1:1 '
.
13. Cunningham, M: K4i':Botvinik, J. D.., and WeiCkert,"A. A.: om-
munityllacement of released mental patients:
SOcial Work, 14154-61, 149.
Cummings, 1. Anderson,
A five-year study.
and Iverson,
Client characteristic* and their relation to outcome: A'reviev
of previous research. Unpublished manuscript. _Minneapolis, Min-,
inititute of Interdisciplinary Studies, American Rehabill-
tatiOn Foundation, 1969..
15. DeMann, M. M.: A predictite study of rehabilitation counseling
outcomes. Journal f Couiiing Psychology, 10:340-343, 1963.
^
4
ot"
. . 16. Draygov, J., ind Dreher,, R.: .Prbdicting client readiness for
training and placement in vocations& rehabilitailion. Rehhaabili
tatiolCounseling.HulletinVt9144.1965:
47. Eber, H. W.t 'Multivariate analyses of 'a vocatiOnal rehibilitation'f
*stem. Multivariate BehavioralRestarch ?imograpb, No. 66-41'1966.
18. Gilbert, D. H., and tester, J. T.: The relationship of certain
. ,personality and demoiraphici variablecto success in Vocational re-
- a
.
19.
'habilitation. Unpublished manudcript, Orthopedic Hodpital4 Los
Angeles: ,1970.
Goff, C.: An oklective index for,measuring the vocational
r
Ooupseloes case - load, difficulty. Unpubliihed,doc-
toranissertatiob, Univeretty of Oklahomi. 1969.
20. Goss, Predicting work success gor psychiatric patients with
0
Kudir Preference Record. Educational and tsc12221aCclL1Measiare
meat, 28:571-576, 1968: r..
21. Goss, 4.,'Mbrosko, T., and-Sheldob,,R.: Use of the' Edwards Per-
sobal Preference Schedule
tationtprogram. Thjour
22. pressett, J.: Prediction
With alcoholics -in a vocation*1 rehabili-
Lal P clgexAo 68 :287- 289, 1968.
of job success .,following heart attack.
Rehabi litation Counsilibo Bulletfh, 13:1A-14i 1969._
.\
234, Grigg, b. Mel, Holtmann, A.)Q., and Martin, P. Y.: Vocational:"
r 1
1- .° .' j
Rehabilitation for the Disadvantued. D. C. Heath and Company,
Lexington, Wftssachusetts, 1970..'4
50.'
47)
A
51
24. Hammond, C. D., Wright, G. N., utler, A. J.': Caseload fens --
ibility in an expanded vocational rehabilitation program, Wis-
consin_Studies in Vocational Rehabilitation, Monograph VI, VadiSon:
The University of Wisconsin,. Regional. Rehabilitation Research In-,
---stitute, 1968.
25, Hawryluk, A.: Rehabilitation gain: A better indicatOr needed.
O
Jburnal of Rehabilitation; 38:22-25, 1972.
. A. B., and Jordan, B. T.: Vocational rehabilitation of
the SoCiati disadvantaged: Demographic and intellectual correlates
of outcome. .Personnel and Guidance Jourdal 47 :213-217 1968
27.. Hetzler, S.: A scale for measuring case severity and case move-
pent in public ssmistance. 'Social Casework, 44:445-451, 1963.
28. Hills, W. G., and Ledgerwood,,D. E.: Consumer's measurement of
vocational rehabilitation in New Mexico. (and in North Dakota).
Unplublished manuscripts, Norman, Oklahoma, H'egional Rehabilitation,
Research Institute, University of Oklahoma, 1972.,
29. Hunt, J.14., and Kogan, L. F.: Measuring results in social case-
work. New York, Family Service Association of America, 1952.
30. IRI Prime Study Group.: Measurements of Outcomes. Washington,
D. C., S.R.S. 1974.
31. Kelman,.H. R., and Winner, A.: Problems in measurement and eval7
uation of rehabilitation. Archives of Physical. Medicine and Re-
habilitation, 43:172-181, 1962.
r-` 26. Hawryluk, A Rehabilitation gain: A new criteVlon for an old
concept. Unpublished manuscript,'Ilichmond, Va., Old Dominion
University, 1974.
1q2

32. Kilburn, K. L., and Sanderson, R. E.: Predicting success in a
vocational rehabilitation program with the Raven Colored Prog-
ressive Matrices. Educational and PaYcholo&ical Measurement,
26:1031-1034, 1966.
33. Krantz, G.: Critical vocational behaviors: Journal of Rehabili-
tation, 37:14-16, 1971.
34. Kunce, J. T., Mahoney, R. J., Campbell, R. R., and Finley, J.:
Rehabilitation in the,oncrete jungle. Research Series No..3,
University of Missouri - Columbia, Regional Rehabilitation Re-
search Institute, 1969.
35, Kunce, J. T., and E.: Simplified predictioni:L
follow-up study. Journal of Couniaelia. Psychology% 19:5057508, 1972.
36. Lane, J. M., and Barry, X. R.: Recent research on client motiva(
tion. Rehabilitation Research and Practice Review, 1:5-25, 1970.
37. Lawlis, G. F and Boprth, J. D.: Considerations for the develop-
ment of weighting systems for the evaluation of counselor effac-
Itiveness. Rehabilitation CounselArm Bulletin, 14:133-140, 1971.
38., Leary, P. A., and Tseng, The vocational rehabilitation
process - explained. Journal of Rehabilitation, 40:9-34, 1974.
39. Lorei, T.: Prediction of community stay and employment for released
psychiatric patients. Joanal of Consiltinii Psychology, 31:349-
357, 1967.
1 2 4
52."
Q
. ;Lowe, C. M.: Prediction of posthospital work adjustment by
use of psychological tests. Journal of Counse2.1.NPsychOloKy,.
14:248-252, 1967.
41. MacGuffie, R. A.: Relationship between the Social Vocabulary
Index and. the Interaction Scale and rehabilitation success. Jour-
nal of Counseling Psychology, 17:289-290, 1970.
42.. MncGuffie4 R. A., Janzen, P. V., Samuelson, C. 0.3..and McPhee,
W. N.: Self- concept and ideal-self in assessing the rehabilitation
applicant. of Counseling Psychology, 16:157-161, 1969.
43. Maslow, A. H.: Motivation and Personality. New York,4Harper,.1%54.
44. McPhee, W. M., and Magleby, F. L.1 Success and failure in voca.,
tional rehabilitation. Personnel and Guidance Journal, 38:497-499,
1960.
45. Miller, D. E., Kunce, J. T., and Getsinger, S. H.: Prediction of
job.suce6s for clients with hearing loss. Rehabilitation Coun-
selin 16:21-28, 1972.-;*'
46. Miller, 'L. A., and,Allen, G.: The prediction of future-outcome
among OASI referrals using NZ Scores. Personnel and Guidance
Journal45:349-352, 1966.'
47* Niller, L.. A., and Barillas, M. G.: Using weighted 26-closures
aas a more adequate measure of counselor and agency effort in
tation. Rehabilitation Cow.......011,
Bulletin, 11:117-121, 1967*

54.
48. Muthard, J. E. (Ed.): Training guides in case load management
for vocational rehabilitation staff, final report, Committee on
Caseload MFgement, Rehabilitation Services Series No. 66-22,
U. S. Department of Health, Education,, and'Welfare, Vocatioxial
Rehabilitation Administration, Washington, D. C., 1965.
49. Mithard, J. E., and Miller, L. A.: The criteriii-15ioblem in
rehabilitation counseling. Iowa City: College of Education,
State of Iowa, 1966.
50. Nadler, E.: Prediction of sheltered shop work performance of
individuals with severe physical disability. Personnel and
Guidance Journal, 36: 95-98, 1957.
51. Neff, W. S.: The use of the Rorschach in distinguishing Voca-
.
tionally rehabilitable groups. Journal of Catinsel Psychology,
2:207211, 1955.,
, , ,
. i,.
524 Neff, W. S., NoVick41B., and,Stern, B.: A follow -up counseling I
i
program. Final report, Jewish, Ocdupational Council, New York: 1968.1
53. Noble, J. H.: Actuarial system weighting case closures. Rel. 1
habilitation Record; 14114-37, 1973.
54. Pearlman, L. G. and Hyibert, K. W.: IdentifyingTotentialdX.op-
outs at a rehabilitation center. Rehabilitation Counting Bullet no
13:217-225, 1969.,
1 26

55,
55. Beagles, K. W., Wright, G. N., and Butler, A. J.: A tale of re-
habilitation gain for clients of an expanded vocational rehabili-%
.tation program.' Wisconsin Studies in Vocational Rehabilitation,
. Monograph XIII, Series 2, Madison, Wisconsin; The University of
Wisconsin, Regional Rehabilitation Research Institute, 1070. 4
56. Rogers, C. Rt: The process equation of psychotherapy. American
A
Journal of Psychotherapy, 15:27-45,104,
57. Rehabilitation Services Administration: RSA Emeasts Plan,
Part I, 1973.
58. Salomone, P. R.: Client motivation and rehabilitation counseling
. outcome. Rehabilitation cossejailBulletin, 154/-20, 1072.
59. Sankovskyo R.: Predicting' successful and unsucceseul rehabili-
tation outcome: A review of literature. Grant No..BT-14, Pitts-
burgh: University of Pittsburgh, December, 1968.
60. Schletzer, V. M., Dawis, R. V., England, G. W., and T,ofquist,..Li. H.:
Factors related to employment success. Minnesota Studies in Voca-
tion.al Rehabilitation, Bulletin 27, University of Minnesota: 1959.
61. Sermon, D. T.: The Difficulty Index: An expanded measure of
counselor performance. St. Paul:' Minnesota Division 'ofybcational
Rehabilitation, 1972.t
62. Silver, D. Lo; A look at evaluation of vocational rehabilitation
counselor performances. Journal of Rehabilitation, 35:13714, -1p60.
63. Stein, C. T., Bradley, A. D.,:and BUegel, B.: A test of basic assum-
ptions underlying vocational counseling utilizing a diff4ential
criterion method. Journal of Counseling Psychologr, 17:93.-97, 1970.

46
64. Taylor, F.: The general aptitUde teat battery as predictor of
vscationel readjustment by psychiatric patients. Journal of
Clinical Pavchology, 12.:130, 1963.
65. Thurman, D. G.: Outcome measures progress report. Division
of Rehabilitative .Service, State of Arkansas, 1973.
66. Tomlinson;T. M., and Hart, J. T.,Jr.: A validation study of
the process scale. Journal of Consulting Psychology, 26:74-78,
1962.
67. Tosi, D. V., and Vesotskyo L. R.: Successful rehabilitation as
68.
69.
70.
71.
72.
O
0
a function of client status: EmaholzVAL1Tuons, 27:37-68, 1970.
Tsang, M. S.: Predicting vocational refiabikitation drop-outs
from psychometric attributes and work behairiors. Rehabilitation
Cot_Lnali.LE: pulletin.2. 15:154-159, 1972.
Viati1le, H.: Operations research program in the Oklabomi Voca-
tional Rehabilitation Agency. VRA Grant Ho, RD-946, Oklahoma City:
Oklahoma Vocational Rehabilitation Agency, 1968.
Wallis, J. H., and Bozarth, J. D.: The !development and evall.F4
ation of weighted DVR case closures. Rehabilitation Research-and'
Practice Reviev, 2:5540;1971:
Weiner, H.: Characteristics associated with rehabilitatip success.
Personnel and Guidance Journal, 42:687-694, 1964.
Westerheide, W. J., and Lenhart, L.: Case difficulty and client
change: A review of the literature. Oklahoma City, Department of
%nstitutiOns, Social and Rehabilitative Services, 1974. 1
o
56.

A
73. Westerhei4, W. J., and Lenhart, L.: Development and reliability
-4k
iof a pretest posttest rehabilitation services outcome measure.
Rehabilitation Research:and Practice Review, 4:15-23, 1973'.----------- ... .
.
74. Wright, G. N. (Ed.):. Clinical versus Statistical prediction,in"
Wisconsin Studies iq vocational rehabilitation. 6eries I, Mono-,
graph VII, Madison; University of Wisconsin, 1968.
75. Zawiaa, A. R.: Florida Difficulty Index in achieving rehdbili-.
tation. Unpublished manuscript, Division of Vocational Refiabili-
-.
tation, Tallahassee, Florida, 1973.
0
0
120
57..

Footnotefl
1Preparation of this manuscript was supported-in part by the
Social and Rehabilitation Services (HEW) through the West Virginia
Regional Rehabilitation Research and Training Center (W.V.U. and
W.V.D.V.R.). Appreciation is expressed to John Stuart, David
Hassick, James DiFebo, and William Plaice for their'aid.
a
130
S
t.
58.
pl
.;)

. 4
x
59.
TABLE 1
The One -Group Pretest-Posttest Design as Applied
To The Intake-Process-Outcome Paradigmin Rehabilitation
*
4
p
' 'Process
X .
Outcome
02
t:
181
C
AA
C 1

O
a
TABLE 2 4
The Pretest4dsttest Control Group tegign asi,ApPliedTo The Intake-Process-Outcome Paiadigm
In Rehabilitation
Intake
611
Process
X-
....1=w1.M.P.=ms.w61.21
./`n
)82
/14
Outcome
012'
4
022
O
t
. 060.
a

TABLE 4
Chi Square Model Numerical Example 1 -
What Characterized Clients Who Were Accepted For VR'Services?
WV FY69-70 10% Sample
Variable
61.
Those Accepted (N=718) Those Not Accepted (N=670 x2
Actual N Expected N Actual N Expected N
REFFERAL SOURCE
Educational Institutions 37 40.3 41 37:7 0.59
Hospitals 93 85.3 72 79.7 '1:44
Health Agencies 25 21.2 16. 19.8 1.41
Welfare Agencies 56 51.7 44 48.3 0.74
Public Organizations 87 .215:6 330 2017.4 .., 7.85**
..
Private Organizations 16 8.8 1 8.2 12.21***
Individuals 404 293.7 164i
274.3 85.78***
SEX?
Males 344 415.7 46o 388.3 25.61***
Females 374 301.9 210 282t1 35.65***.
p<.01:
4/"I'P'4.001
e .138
I

A Tentative V,R..OutcOMeclassification Proposal
4*)
.
Physical Capacity and
Mobility Increase From
Acceptance to Closure
Public Assistance
Deci4ase Per Month
From' Acceptance to Closure
Earnings Increase
Per Month From
6cceaotance to Closure
------_
Vocational Placement
At Closure*
1 = 21 to 25 points Gain
1 = more than $200
1 = more than $400
1 = Competitive full time
2 = 16 to 20 points Gain
2 = $150 >$200
2 = $300>$400-
2 = Competitive part time
'3 = 11 to 15 points Gain
3 =$1004240
.3 = $200>$300
3 = Self Employed or BEF,
4 = 6 to 10 points Gain
4 = $50 >$100
4= $100 >$200
4 = Sheltered
5 = 1 to 5 points Gain.
5 = 40 > $50
5= $0 > 4100
5 = Homemaker or Unpaid
Family Worker
6 = No Increase or Decrease
6'= No Increase or Decrease
6 . NoIncrease or Decrease
6 = Student, Trainee, or
Other
7 = Decrease in P.C.
7 = Increage in P.A.
7 = Decrease in Earnings
7 = Unsuccessful-Other_
Reasons (Status 28)
X = Not Applicable Because
X = Not Applicable because
X = Not Applicable because
8 = Unsuccessful-Other
No Physical Incapacity
.,
At Acceptance
tP
No P.A. at Acceptance
yop. Closure was 5, 6,
7', 8, or 9
Reasons(Status 30)
9 = Unsuccessful- Not
Accepted (Status 08)-
Physical Capacity Points
At Closure
P.A. Amount per month
At Closure
Earnings per month
At Cloeure
Occupational Title
At Closure
4:r
*This column reflects changes recommended by the IRI Prime Study Grbup,
Measuroment"of Outcomes, 1974.
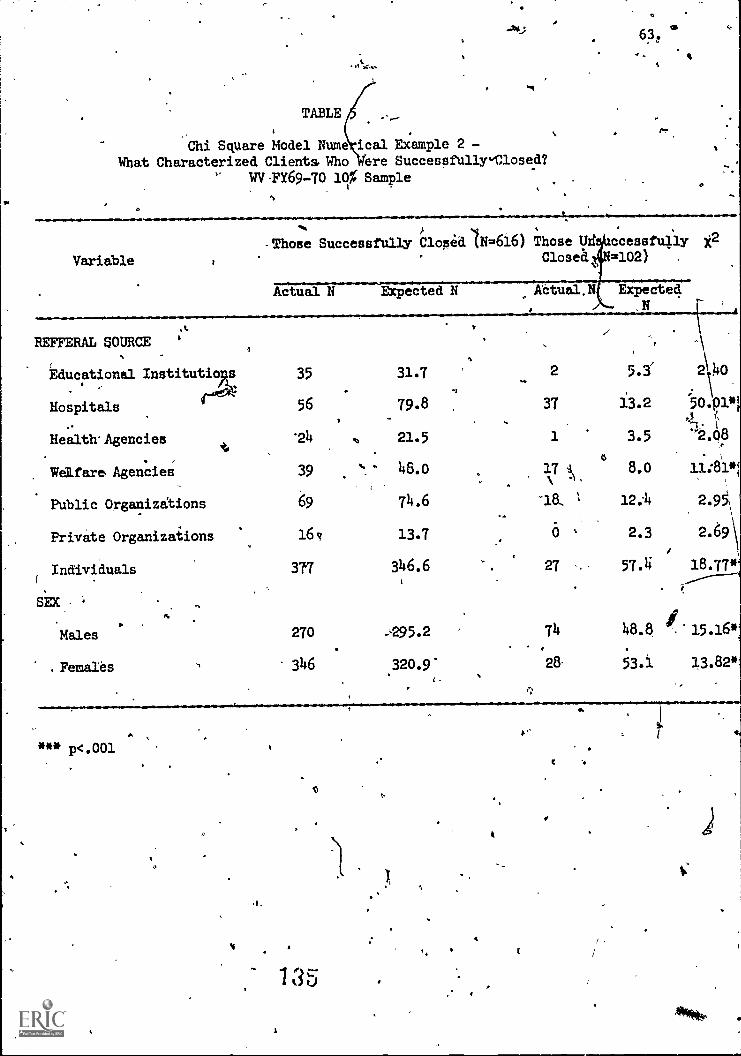
TABLE
Chi Square Model Nume ical Example 2 -What Characterized Clients. Who Were Successfully"Closed?
WV-FY69-70 10% Sample
ti
63
Variable
REFFERAL SOURCE
N-Those Successfully Closed (N=616) Those Uri ccessfully y,2
Closed =102)
O.Actual N EXpected N Aetual.N
Educational Institutio 35
Hospitalsa 56
Health' Agencies '24
Welfare Agencies 39
Public Organizations 69
Private Organizations 16
Individuals 377
Males 270 74
.Femaies 346 320.9
31.7
79.8
21.5
46.o
74.6.
13.7
346.6
**it p<.001
3 5
2 5.3' 2)O
37 13.2 5o.Olm
1 3.5 '2.q8
,
V0
8.0 11:81*1
-18. 12:4 2.95\
0 , 2.3 2.69
i
27 57.4 18.77*
48.8 sf. 15.16*
2853.1 13.82'
e
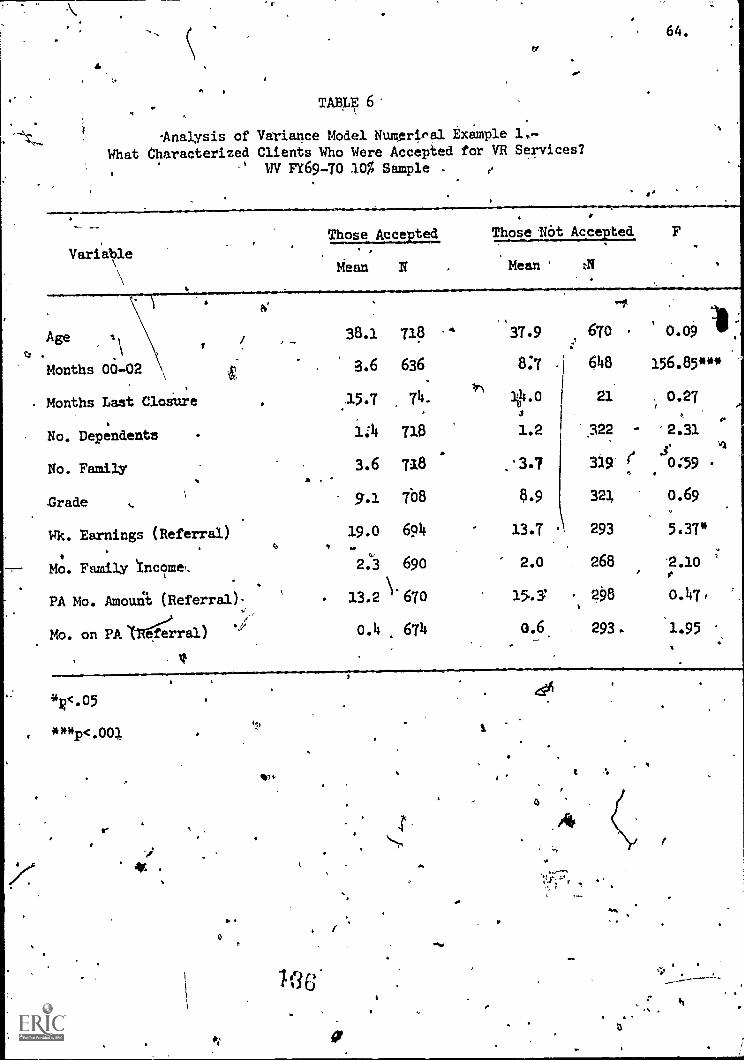
TABLE 6.
-Analysis of Variance Model Numeriral Example 1.-What Characterized Clients Who Were Accepted for VR Services?
WV FY69-70 t0% Sample -
adIaam.ara.
64.
Those Accepted
VariableMean N
Age =I
t?
Months 00-02
Months Last Closure
No. Dependents
No. Family
Grade
Wk. Earnings (Referral)
Mo. Family Ync9mg,
PA Mo. Amount (Referral)
Mo. on PA trg:rral)
V
Those Not Accepted F
Mean.
aaa.allaloaaaaaaaaalana*aaaasaaaalihaaamana.
38.1 718
3.6 636
15.7 74.
1:4 718
3.6 718
9.1 708
19.0 694
2.3 690
13.2 \'670
0.4 674
'37.9 670
8:7 648
21
1.2 322
'3.7 339
8.9 321
13.7 293
2.o 268
' 298
o.6 293.
0.09 1.156.85***
0.27
2.31
0:59
0.69
5.37*
2.10
0.47,
1.95
4411.05
***p<.001
h
iU
a
t
4
a
t

TABLE 7'
Analysis of Variance Model Numerical Example 2 -
Wnqt Characterized Clients Who Were Sucdessfully Closed?
WV FY69 -70 10% Sample
. .
..65.
Variable ISuccessfully Closed UnsuccessfUlly ClOsed
Mean N - Mean
Age .
38.3 616.,
37;4 102
Months 00-02.3.7 540 - 2.9 96
Months Last Closure15.8 .62 '15.3 12
No.,
Dependents4.3 616 1.5 102 .
110,..FamilY&.6 616 3.5 102
-
.
Pnule.
Wk. Earnings (Referral)21.2
9.2 =60/
595
8.4 101
., 95.9
Mo. Family pcome2.5 596 1.5 94/ ".,
0
PA Mo. .Amount (Referral)12.0 574 '201A 96
,
Mo. on PA (Referral)*'0.4 579 0.5 95
All Cost580.2 615 185.7 101
Cost142.4 542 69.3 96
-.; SOtnicl Coi___..s*,--
23.6 525 8.9 92
.EXt. Ewell. Cost504 512, 8.7
49.5 594 1.9 ,**Wk.
Earnin0 (Closure)
PA Mo. Amount (Closure)7.8 536 18.1 84
Mo. inn EXt. Eval.0.1 487 0.6 , 91
Mo. Acceptance - Closure13.0 614
.
23.9' 101
,
Mo. in Trainirig .
3.4 518 -1-.9.--- 94'
Mo. featly "far or in Empl.3.6 600 0.9 93
41.
**p<.01***p.001
787
0.30
2.43.
0.02,
0.50.
0.31
A59.83::**,
10.42!*
2.84
0.29'
19.81rn ',
1.40 ,
0.20
0.09
:
6.27'
1 3 ***)9
, 2.13
18.30"

I 12
4
TABLE 8.
Correlation Model Numerical Example 1 -
iHT
ER
GO
RR
ELA
TIO
NS
AM
ON
G C
ON
TIN
UO
US
VA
RM
BLE
S
101
San
cte
(FT
697
0)
810
1112
967
892
6-
7
AG
E12
8495
1040
1037
1029
987
958
968
2.$9
0002
-.08
"84
955
) 95
2'
944
909
878.
895
3.N
CLO
SU
SH
S95
9592
9191
89
4.. N
2DE
P.1
41"
NS
US
1037
1029
984
957.
967
5.K
IFA
Ji-.
28."
.094
'H
S-
.455
""10
2698
195
696
5,
6.G
RA
DE
-.27
..4 -
.12'
" H
S-.
064.
NS
973
946
956
7.IIK
EA
Rit
.07'
-.11
". N
S.2
0."
HS
.17.
44v
930
'939
t.}'.
ZIN
C'
-.19
"N
S,
NS
HS
..2
9""
.274
.4.
.444
..90
7..
9.A
ST
AK
NS
NS
NS
.33"
." .2
5".-
.10.
. -.1
1" -
.12.
4'.
,0
'.
44.#
t -.'
#4"
10.
AS
ITI_
E--
NS
.10"
NS
.19"
.18-
.15#
AI-
.1.7
0
<.1
0.
"<.0
5"<
.01
".<
.001
1314
1516
17-
-18
-19
20
1364
'125
912
4197
567
262
257
871
561
2
1261
1171
1155
909
598
554
517
633
549
8995
'81
'81
7070
-64
5974
61
966
1034
.93
591
578
067
2'
621
578
715
612
964
1031
932
912
779
672
621
578
715
612
955
1023
924
,90
476
916
261
256
970
560
3
940
984
906
890
763
659
615
573
691.
601
905
954
865
848
729
651
601
561
687
592
956
963
899
881
754
636
606
558
667
588
962
901
884
799
'64
261
056
567
159
4
HS
"H
S12
5912
4197
567
062
057
771
361
0
HS
NS
.62.
"12
3597
5.6
0658
554
9.63
557
2
HS
HS
HS
.37"
*.H
S97
559
057
053
811
555
8
HS
Ns
.08"
.114
",N
S57
656
052
959
954
9
.24"
. LS
'NS
.20'
" .0
8'.0
9.R
S60
055
266
958
5
-.12
" .7
r- .5
3,--
.084
NS
115
NS
-.1
Te
540
617
569
HS
'NS
US
.091
NS
.6e
577
573
NS
-N
S.2
94"
.19*
" .1
4"'
HS
.08.
HS
HS
611
HS
NS
.46"
. .19
". .1
7". M
S.2
4."
HS
HS
-.50
"
HS
,H
S.1
2"'
.07-
HS
HS
.09"
OS
-H
S.3
ff".
1.4.
I.SE
RV
12.
RE
HF
AC
13.
SS
FU
ND
14.
ExT
EV
A
15.
NK
EA
RN
2
If.A
SS
AX
T2
17.
EY
0406
18.
CL2
1024
19.
TR
AIN
IG
2;9.
9202
2
-.08
"W
OO
NS
NS
NS NS
NS
-.19
"
HS
-.07
"H
S.7
3...
-.07
',
HS
HS
HS
.08"
HS
NS NS
HS
NS
NS
NS
NS
.14"
* .0
7
.104
NS
.MS .24"
'N
SN
SN
S.2
9'"
.20"
. -.1
3"N
SN
SH
S-.
07H
SN
SN
S 1
NS
--.1
-84*
#H
S'
NS
HS
NS
-;18
...N
S
-.33
4".1
5`..
NS
-.16
4"N
S'.1
6."
.09'
-.07
NS
NS
NS
HS
'''.0
7"
t4.4
.
NS
NS
"1r
693
616
71
693
693
683
674
667
652
657
691
623
607
594
656
607
575
693
604

,
TABLE
Multiple Linear Regression Model Numerical Example 1 7What Combination of IntakeNariablesVould Provide
An Optimum Prediction of Weekly Earnings at Closure?WV FY69-70 10% Sample
66.
PredictorStep Variable
87'b S. E. of b fRJ
9
1 WEEARN 32.648 0.550 0.055 0.40
2 WICEARN 57.353 0.579 0.054 0.45AGE -0.657 0.118
3 'WKEAEN 401140 0.557 0.04 0.46AGE -0.569 0.123GRADE 1.572 0.649
MARE 38.540 0.538 0.056 0.46AGE -0.579 0.123GRADE 1.642 0.650 t.NODE? 1.268 0.909
,- WO a " .al a.* VI 01. ..11111 U11/0 .1111 IPM .1110 I
WEEARN 48.443 0.466 0:063 0.47AGE .40.648 0.134GRADE 1.294 0.672.NODEP 2.725 1.112NOFAM -2.186 1.029MOINC- 1.717 '0.8101+00002 -0.248 0.413ASTAMT -0.036\ 0.064ASTTIME 0.775 1.726
N= 539
139

1TABLE 10
Multiple LineAl. Regression Model Numerical ample 2What Combinatio of Intake Variables Would rovide An
Optimum Prediction o 1Public Assistance Monthly ount At Closure?
WV-TY69-70 10% SampleI
Predictor-Step . Variable a
1 ASTAMT 1.829 0.581/
. /7, -o.48o 0.557
/ 1.930
3 ASTAMT 8.895 // 0.552NODE? /
/1.825
GRADE / -1.007/
ASTAMP 2A28 0.556NODEP / 1.71.1
GRADE / - -0.822,
AGE / 0.132
AMAMINODE?
S.E. of b
o.O27
6.028'(4574
IRI
0,69
0.70.
0.027 0.710.5720.392.
0.027 0.71
o.4o60.575
I
0.078
* *4 * * * * * * */
%
9 ASTAMJ -1.278,
0.518. 0.039'
NODEP 1.650 0.702GRADE I -0.602 0.46AGE . . 0.14 0.085
ASTTIME 1.241 1.067kEARN -0.024 0.041
mom ..0.395 0,519
NOFAM 0,410 0.633
M06002 0.099 0.261
N = 511
j74()
WI& moda
't
0.71.
67. :'
.1

O
Figure Captions
Fig. 1. 4 inPut,,intervention, output system.
Fig. 2. Flow diagram of vocational rehabilitation.
Fig. a, po6t. RSA-300.
468.

VO
CA
TIO
NA
LR
EH
AB
ILIT
AT
ION
SY
ST
EM
INP
UT
INT
ER
VE
NT
ION
4,...
...._
ouT
puT
j BA
CK
GR
OU
ND
aI P
ER
SO
NA
L
!AT
TR
IBU
TE
S`1
....
......
......
....-
.."...
......
RE
HA
B.
113
AG
EN
TS
i
iV
OC
. RE
NO
. SE
RV
ICE
S1
'di
agno
stic
a; s
vcil
'lotio
n
Ico
unse
ling
a i g
uida
nce
phys
ical
stqr
atIo
n7re
ttial
ning
follo
w u
p
..
.pl
acem
ent
. .-
4
PO
PU
LAT
ION
NE
ED
ING
RE
HA
BIL
ITA
TIO
N
OT
HE
RP
UB
LIC
!Br
PR
IVA
TE

FLO
W D
IAG
RA
M C
FC
LIE
:NT
S IN
VR
. PR
OG
RA
M
-C-
itigA
RR
AL
. ST
AT
US
.;;SE
CE
CO
MiL
ET
ED
AC
KN
OW
LE
DG
E A
PPL
ICA
TIO
NS
UN
SKC
ESS
FUL
CL
OSU
RE
(RE
CE
IVE
DSO
) HE
LP)
EL
IGIB
LE
RE
ED
. PL
AN
CO
MPL
ET
ED
UN
SUC
CE
SSFU
LC
LO
SUR
E
RT
-I5,
%W
M.
SUC
CE
SSFU
LC
LO
SUR
E
0

FrunC!**11:1 7.69
ASency Cud 43
A. 1.a44 Name
U.S. DEPARTMENT OF HEALTH, EDUCATION, ANDIvELFA RENational Ccn ter for Social Statistics. Washington, D.C. 20201 .
Case Service Report: Fedaral.State Program of Vocational Rehabilitation
PART 1 ITO BE RECORDED AT ithlE OF FIRST REFERRAL)
Firs: Name Initial C. Referral DaleD. Werra,' Source
E. Age DOB F. Sek: I 0 Male; 2 1:::1 Female
b. Addrem: Scree and Number
City
r Of trl manrovetaBudget BureauNo. 53410040
ICounty Zip Code
PART 2 ITO B'a RECORDED AT COMPLETION OF REFERRAL PROCESS)
G. Outcome of Referral Plocesi(coned.) I. Previous,Closura within 36 Months:
G. Disability as Reported (describe)
A. Soc. Sec. Nr.
Code
B. SSD1 Status at Referrs1---. * ACCEPTED 03 0-6-mo. Ext. Eval. (04)
C. RaceFOR: 04 0 ExL Eval. (06)
D. Date Re fertal Process Completed 05 0-- VR &Mose (10)
E. Months in Stituies 00.02 ..-..-...F. Spanish Surstaine--Yes 1; No 0 2
G. Outcome of ReliwalProcesu
NOT ACCEPTED:
. 1 0 from (00)12 0 from (02)
Client Refuted
OR,
Referral Not ApPeciptiato.-- 000 2. Secondary
Compute items 2ii through 2R. DO NOTCOMPLETE ANY. OF PART 3 AT THISTIME.
IL Disabling Condition (ductile):
1. Maio!
if closed from Status00, complete toms3A through 3C. If closedfrom Status 02,complete Items 2H through 211. and
Thee ne ori PA *
ems 3A through 3C.
A.
No 0 I; Yes-OulcOmet Rehab. 2Not Rehsb. j 3
if Yea. Months Since Last Closure..._
J. Marital Status-K. Number ofDeptndartts---7-7._L. Total NumberioM. Highest Grade Completed.---N. Work
*
0. Weekly EafhilIP---- +P. total Monthly 'aitisly Income -
Code --* P-Onetuding F.arri(nes1
Q. Public
Assistants' Mo. Amt.-- S.
COds* R. Primly Sou ceof gupoott.------
PART'3 (TO BE RECORDED AT TIME OF CLOSURE)
Federal Special Propam Identificastion*J. Number of Months on Agencif Roils:
1. In Extended Evaluation (Status 04 or 06)----one TF AFR MMS mAw/ps WIN SUM
i .,boo 001 002 004 OM 020 1)40 f00 200 400 I.
111. Cost Vase Services
1. All Services -Total
2. Rehabilitation Facilities-Total
3. Social Security Trust Funds-Total
(Dollars)
4. Extended Evaluation-Total
C. Social Security Trust Fund Casa oNLY:
1. Social Sieutity Claim Type----If Claim Type Cods 2, 3, of 4, enter Wage Earrwes:
Last tame First Name Ini
Social Security iYumbet
2. Check (x) ifAdministrativel Costs Only-0
D. Date Est. Eve. Complete%) tit applicable)
E. SSDI Status at Timed Closure
P. WorkStatus----.1:-k--7.-_____*
. C. Weekly Eacnings-----I-----4iH. Public Assistance TypMo. Amt.
.0.4..........5
I. th:t 1110.1tiOil (title)COtte___
Itall,:ied to he Coiled. t tocludds cohoill4,4J10.tn4....tnit olJcittnent.
2. From Acceptance to Closure (Statuses 10.24) ----
3. In Training (Status 18)
4. Ready for or in Employm.Sit (Status 20 or 22).
K. Outcome of Extended Evaluation or VR Services
1 *0 Closed from Ext. Eval..(Status 08): Rcasiim
2 0 Closed Rehabilitated (Status 26) .
3 0 Closed Not Rehabilitated (Status 28): Reason---- *
4 0 Closed NotRehabilitated (Status 30): Re3.1011-.--
L. Services Provided: Indicate (x) if applicable
Type of Service Providedor Arranged for by Agency
1YithCost
only (ICost
Only (2)
With &WithoulCost (3)
I 9 iagnostic an valuation
11
12,..."14
15
16
47
18
Reno
-1.
ftAN
N0
tioi2(11r._s. or hlental)
College or University.Wit AtauffBusiness School or College
Vocational School
OntheklobPersonal and Voc. Adjustment .
Miscellaneous t.,_.
Maintenance.19
20 Other Services c_ .
21 Servicestto Other Family Members
11.Nt..,.1;iSt.taateIdentification'
i
6011'70:1-157-11.. ' gito I 6-6R)- No 11(7266" 400
sot I