document of the world banksiteresources.worldbank.org/.../resources/cassenegal20072010.pdf ·...
TRANSCRIPT
Document of The World Bank
FOR OFFICIAL USE ONLY
Report No. 36608-SN
INTERNATIONAL DEVELOPMENT ASSOCIATION
AND
INTERNATIONAL FINANCE CORPORATION
COUNTRY ASSISTANCE STRATEGY
FOR
THE REPUBLIC OF SENEGAL
FOR THE PERIOD FY07-FY10
May 2, 2007
Poverty Reduction and Economic Management 4 Country Department AFCF1 Africa Region This document has a restricted distribution and may be used by recipients only in the performance of their official duties. Its contents may not otherwise be disclosed without World Bank authorization.

ii
CURRENCY EQUIVALENTS (As of January 31, 2007)
Currency Unit = CFA Franc (CFAF) US$1 = CFAF 482
FISCAL YEAR January 1 – December 31
ABBREVIATION AND ACRONYMS
AAA Analytical and Advisory Activities AAP Africa Action Plan AFD Agence Française de Développement (French Development Agency) AFDB African Development Bank AG Accelerated Growth AGS Accelerated Growth Strategy APIX Agence de Promotion des Investissements et des Grands Travaux
(Investment Promotion and Infrastructure Agency) BASICS Basic Support for Institutionalizing Child Survival BCI Budget Consolidé de l’Investissement (Consolidated Investment Budget) BOAD West African Development Bank BOT Build-Operate-Transfer CAS Country Assistance Strategy CDD Community Driven Development CEM Country Economic Memorandum CESAG Centre Africain d'Etudes Supérieures de Gestion (Regional Training Institutions in Financial Management) CFAA Country Financial Accountability Assessment CIDA Canadian International Development Agency CPAR Country Procurement Assessment Report CPIA Country Policy and Institutional Assessment DFID Department for International Development (UK) DPL Development Policy Lending DTC3 Diphtheria Tetanus Whooping-cough 3 ECOWAS Economic Community of West African States EU European Union FDD Fonds de Dotation à la Décentralisation (Decentralization Fund) FAO Food and Agriculture Organization of the United Nations FECL Fonds d’Equipement des Collectivités Locales (Fund for Local Governments Equipment) FIAS Foreign Investment Advisory Service FMG/C Financial Management Group/Conference FSAP Financial Sector Assessment Program GDP Gross Domestic Product GEF Global Environment Facility GIRMaC Gestion des Ressources Marines et Côtières au Sénégal
(Integrated Marine and Coastal Resources Management Project) GNI Gross National Income GNP Gross National Product HIPC Heavily Indebted Poor Countries HIV/AIDS Human Immuno-deficiency Virus/Acquired Immune Deficiency Syndrome IBRD International Bank for Reconstruction and Development ICA Investment Climate Assessment ICS Integrated Controller’s System ICT Information and Communication Technology ICS Industries Chimiques du Sénégal (Chemical Industries of Senegal) IDA International Development Association IFAC International Federation of Accountants IFC International Finance Corporation IPP Independent Power Producer JICA Japan International Cooperation Agency

iii
KfW German Cooperation MCA Millennium Challenge Account MDG Millennium Development Goals MDRI Multilateral Debt Relief Initiative MIGA Multilateral Investment Guarantee Agency MOU Memorandum of Understanding MTEF Medium-term Expenditure Framework MW Megawatts NGO Non-Governmental Organization OECD Organization for Economic Co-operation and Development OED Operations Evaluation Department OMVS Organisation de la Mise en Valeur du Fleuve Sénégal (Senegal River Basin Organization) PAMU Projet d’Amélioration de la Mobilité Urbaine (Urban Mobility Improvement Project) PCG Partial Credit Guarantee PDMAS Programme de Développement des Marchés Agricoles (Agricultural Markets and Agribusiness Development
Project) PEFA Public Expenditure Financial Assessment PEP Private Enterprise Partnership PEQT Projet Education de Qualité pour Tous (Quality Education for All) PER Public Expenditure Review PHC Primary Health Care PIPP Private Investment Promotion Project PNDL Programme Nationale de Développement Local (National Local Development Program) PRECOL Projet de Renforcement et d’Equipement des Collectivités Locales (Local Authorities Development Program) PROGEDE Projet de Diffusion de l’Accès aux Services Electriques Ruraux
(Sustainable and Participatory Energy Management project) PRS Poverty Reduction Strategy PRSC Poverty Reduction Support Credit PRSP Poverty Reduction Strategy Paper PSAC Private Sector Adjustment Credit PSAOP Programme des Services Agricoles et des Organisations de Producteurs (Agricultural Services and Producer
Organization Project) PSD Private Sector Development REER Real Effective Exchange Rate ROSC Report on the Observance of Standards and Codes SENELEC Société Nationale d’Eau et d’Electricité (Electric Company of Senegal) SIP Small Investment Program SLM Sustainable Land Management SME Small and Medium Enterprise SOE State-owned Enterprise SSA Sub-Saharan Africa STEP-ILO International Labor Organization SYSCOA Système Comptable Ouest Africain (Integrated Financial Management Software) UNDP United Nations Development Programme UNESCO United Nations Educational, Scientific and Cultural Organization UNICEF United Nations Children's Fund USAID United States Agency for International Development WAAP West Africa Agricultural Productivity WAEMU West African Economic and Monetary Union WBG World Bank Group WBI World Bank Institute WDR World Development Report WHO World Health Organization
IDA IFC
Vice President Country Director
Sector Manager Task Team Leader
Obiageli Ezekwesili (AFRVP) Madani M. Tall (AFCF1) Antonella Bassani (AFTP4) Jacques Morisset (AFTP4)
Vice President Director Director Country Manager
Eduard Nassim (CAMVP) Thierry Tanoh (CAFDR) Richard Ranken (CEAHK) Aida der Hovanessian (DKRIFC)

iv
THE REPUBLIC OF SENEGAL
COUNTRY ASSISTANCE STRATEGY
TABLE OF CONTENTS
EXECUTIVE SUMMARY ...................................................................................................................................... VI 1. INTRODUCTION ................................................................................................................................................1 2. COUNTRY CONTEXT .......................................................................................................................................1
A. POLITICAL AND INSTITUTIONAL BACKGROUND ...............................................................................................1 B. RECENT ECONOMIC DEVELOPMENTS ...............................................................................................................2 C. MEDIUM-TERM OUTLOOK AND SUSTAINABILITY.............................................................................................4 D. POVERTY PROFILE AND UNEQUAL PROGRESS TOWARD MDGS .......................................................................4
3. SENEGAL’S MAIN DEVELOPMENT CHALLENGES.................................................................................7 A. IMPROVING PUBLIC SERVICE DELIVERY ..........................................................................................................8 B. ENHANCING PRIVATE SECTOR DEVELOPMENT ..............................................................................................13
4. SENEGAL’S LONG-TERM VISION AND MEDIUM-TERM PRIORITIES.............................................17 5. WORLD BANK GROUP ASSISTANCE.........................................................................................................20
A. LESSONS FROM PAST EXPERIENCES AND CONSULTATION STRATEGY..............................................................20 B. PROPOSED BANK PROGRAMS AND EXPECTED OUTCOMES .............................................................................21 C. DELIVERY OF THE BANK’S ASSISTANCE PROGRAM ........................................................................................36 D. LENDING AND THE AAA SUPPORT PROGRAM.................................................................................................38
6. COUNTRY RISK MANAGEMENT AND MONITORING ..........................................................................42 A. MAIN RISKS AND MITIGATION REMEDIES......................................................................................................42 B. PERFORMANCE MONITORING & EVALUATION ...............................................................................................44
7. CONCLUDING REMARKS.............................................................................................................................45
v
List of Annexes Annex 1: Results-Oriented CAS Matrix .................................................................................................. 47 Annex 2: CAS Completion Report FY03-FY06...................................................................................... 58 Annex 3: IFC Strategy (CAS Annex B8)................................................................................................. 84 Annex 4: MIGA’s Program (CAS Annex B3)......................................................................................... 89 Annex 5: Joint Fund-World Bank Debt Sustainability Analysis ............................................................. 92 Annex 6: CAS Consultations and Outreach........................................................................................... 104 Annex 7: CAS Harmonization and Coordination with Other Donors ................................................... 106 Annex 8: Senegal at a Glance (CAS Annex A2) ................................................................................... 111 Annex 9: Key Economic Indicators (CAS Annex B6) .......................................................................... 113 Annex 10: Key Exposure Indicators (CAS Annex B7) ........................................................................... 116 Annex 11: Operations Portfolio (IBRD/IDA and Grants) (CAS Annex B8)........................................... 117 Annex 12: Selected Indicators of Bank Portfolio Performance and Management (CAS Annex B2)...... 118 Annex 13: IBRD/IDA Program Summary (CAS Annex B3) .................................................................. 119 Annex 14: CAS Summary of Non-lending Services (Annex B4)............................................................ 120 Country Map IBRD 33475........................................................................................................................ 121 List of Tables Table 2.1: World Bank Institute (WBI) Governance Indicators in 2004-05................................................ 2 Table 2.2: Senegal Compared to the Rest of Sub-Saharan Africa ............................................................... 3 Table 5.1: Summary of CAS Results-Based Framework........................................................................... 33 Table 5.2: Proposed World Bank Group Program (Base Case)................................................................. 40 Table 5.3: Senegal in comparison of other Sub-Saharan Africa countries 2005 CPIA scores .................. 41 List of Figures Figure 3.1: Contributions to Economic Growth by Sector (2000-04)........................................................ 16 Figure 5.1: Ongoing and proposed IDA Lending Program up to FY10 .................................................... 42 List of Boxes Box 2.1: Street Children in Senegal............................................................................................................. 6 Box 3.1: Main Achievements in Public Financial Management and Remaining Issues............................ 12 Box 3.2: Constraints to Growth in Senegal: What do private investors tell us? ....................................... 14 Box 5.1: Gender Development in the CAS................................................................................................ 35
The following World Bank Staff contributed to the preparation of the CAS: Jacques Morisset (TTL), Francoise Perrot, Iradj Alikhani, Fily Sissoko, Bourama Diaite, Leif Jensen, Sidi Boubacar, Ronnie Hammad, Suzanne Otis, Adama El Hadj Toure, Renato Nardello, Vincent Palmade, Peter Mousley, Moctar Thiam, Moukim Temourov, Eric de Roodenbecke, Aissatou Diack, Julien Bandiaky, André Ryba, Ibou Diouf, Christian Diou, Michel Layec, Awa Seck, Isabelle Huynh, Yann Burtin, Tomas Vis, David Bridgman, Manievel Sene, Peter Kristensen, Yves-Andre Prevost, Sonia Plaza, Guy Darlan, Mademba Ndiaye, Lily Mulatu, Geraldo Martins, Demba Balde, Matar Fall, Antonio Estache, Raymond Bourdeaux, Deo Ndikumana, Aisha Kahn, Basma Ammaari, Elizabeth White, Menno Mulder-Sebanda, Philip English, Marc Blackden, Sambagor Gueye, Hawa Diop, Quentin Wodon, and Brice Jean-Marie Quesnel, Eduard Nassim (CAMVP)Thierry Tanoh (CAFDR) Richard Ranken (CEAHK) Aida der Hovanessian (DKRIFC). Judite Fernandes provided valuable assistance. Peer reviewers are: Gaiv Tata (FRM), Brian Ngo (PRMVP), and Jan Walliser (OPCS).

vi
EXECUTIVE SUMMARY
1. By historical and regional standards Senegal has achieved good economic results over the past decade even though its performance was weaker in 2006. Not only did GDP growth average almost 5 percent per year, but poverty in households also declined by almost 15 percentage points between 1994 and 2002. Nevertheless, Senegal remains a poor country, with a GDP per capita of US$710 in 2005, and major deficiencies in its infrastructure and human development. It also failed to report major improvements in man-made outcomes such as governance, ease of doing business, and technology development, which are crucial for a country that cannot rely on significant natural resources. 2. The Government is well aware that it needs to do more and better to reach its MDGs and reduce poverty by half by 2015. The implementation of the new Poverty Reduction Strategy (PRS), as well as of the Accelerated Growth Strategy (AGS), is expected to lead to higher economic growth rates, and to greater equity through improvements in the delivery of basic social services and in the protection of the most vulnerable population groups. The Government has also announced its intent to improve governance and strengthen participatory processes and decentralization. This medium-term vision has been approved by stakeholders in Senegal and is aligned with its Millennium Development Goals (MDGs). 3. The proposed outcome-based Country Assistance Strategy (CAS) for the period FY07-10 seeks to support Senegal’s effort in achieving its ambitious development agenda. It is the result of a participatory process through which the World Bank Group (WBG) aims to (i) optimize its experience in Senegal; (ii) align its support with the Government’s PRSP priorities and the Bank’s Africa Action Plan (AAP); and (iii) find synergies with partners. The new CAS recognizes that more efforts are needed to address the challenge of weak governance in Senegal, and introduces a “governance filter” comprising four core principles to ensure that governance considerations are mainstreamed into all WBG’s programs: (i) improve transparency and efficiency in the use of public resources; (ii) increase public sector accountability; (iii) strengthen and modernize the judicial system; and (iv) enhance mechanisms for private sector governance. This focus should help Senegal to close the gap with successful emerging countries. 4. The CAS program is selective by focusing on three pillars:
a. Pillar I: accelerated growth/wealth creation. Strengthening GDP growth to an annual rate of 7 percent, which is 1-2 percent higher than the historical average, is perceived by Senegal as one of its prerequisites for reaching MDGs. WBG support will include a series of IDA and IFC instruments organized to achieve the six following outcomes: (i) promoting a competitive investment climate; (ii) building and maintaining basic infrastructure for growth; (iii) facilitating access to financial resources by small and medium enterprises; (iv) promoting a modern and diversified agricultural sector; (v) fostering sustainable development and management of natural resources; and (vi) developing skilled labor and use of technology.
vii
b. Pillar II: human development/shared growth. Increasing access to social services and creating opportunities for poor and vulnerable groups, as growth performance is improved, is at the heart of Senegal’s PRS agenda. Improved equity is crucial, not only to ensure social and political stability, but also to achieve long-term economic growth. WBG assistance will include a mix of financial and analytical support in the education and health sectors, as well as in the area of the protection of vulnerable groups.
c. Pillar III: rural and urban synergies. The rapid pace of urbanization in Senegal —six out of ten people are projected to live in cities by 2015—raises a key challenge for the authorities who will need to find the right balance between urban and rural development. To support the Government, the WBG will shape its program around three major outcomes: (i) balancing the provision of infrastructure between urban and rural areas; (ii) reducing the vulnerability of immigrants and emigrants; and (iii) improving the quality of life of the population through better management of natural resources and improved access to water and sanitation.
5. As a tangible step toward achieving these medium-term outcomes, the proposed CAS recognizes the regional dimension of Senegal’s development as well as the importance of enhancing gender development and building local capacity. Several regional operations and analytical studies are envisaged in the energy sector, the promotion of the Senegal River area, the road sector, with the development of corridors with Mauritania and The Gambia, and social sectors through regional initiatives in health and education. Success in the development of Senegal will not only depend greatly on its capacity to provide women social protection and equal access to social services, but also to secure for them more and better jobs. Last, but not least, the focus on capacity building is justified because Senegal’s progress will be shaped by the quality of its labor force and entrepreneurs as well as the effectiveness of its public administration.
6. A focused lending program is proposed, in the range of US$420 million over the four-year CAS period, which will complement ongoing operations and seek to optimize WBG assistance given government priorities and partner programs. The proposed CAS program will aim at balancing WBG lending across the above three key pillars and the governance filter. It will seek to maximize Bank assistance in Senegal through: (i) the use of various financial instruments such as budget support, single investment projects, and community driven development initiatives; (ii) leveraging financial resources beyond the country IDA allocation through partnerships and donor coordination; and (iii) enhancing regional economic externalities.
7. The CAS includes a core program of AAA which aims at supporting the Government’s vision, and focuses on three main issues: (i) labor market and productivity; (ii) protection of vulnerable groups (notably youth and street children and activities in rural areas such as in the groundnut basin); and (iii) fiscal policies, expenditure efficiency, and civil service reforms. In collaboration with IFC and WBI, other analytical studies are expected to be carried out on the development of the knowledge economy, the regional housing finance market, and a review of the fiscal regime of financial operations.

viii
8. The program is designed to mitigate risks that could limit the effectiveness of WBG support. These risks can be grouped into three main categories: (i) lack of governance and vested interests; (ii) vulnerability to political and economic external shocks; and (iii) weak capacity for implementing reforms. The measurement of results is an essential component of improving mutual accountability and mitigating risks. The WBG will primarily depend on three complementary channels to monitor CAS progress over time. The first channel is the current PRSP institutional framework for the compilation and verification of results and milestones. The second channel consists of periodic portfolio reviews, in close coordination with the authorities and other partners. The third channel is to ensure that the strategic AAA program and intermediary outcomes (or milestones) help track results over time, including a CAS progress report in early FY09.
1. INTRODUCTION
1.1 The proposed CAS activities are clustered around three pillars and one cross-sector governance filter. The three pillars are: (i) fostering economic growth through support to private sector development; (ii) improving human development through better delivery of social services, notably to the most vulnerable groups; and (iii) enhancing rural and urban synergies. Transparency will be mainstreamed in all programs and projects supported by the CAS to help improve public and private governance. The CAS will employ a selected mix of Bank and IFC financing instruments and a targeted program of WBG Analytical and Advisory Activities (AAA).
1.2 The proposed CAS is (i) based on the WBG experience since the early 1990s; (ii) oriented toward results; and (iii) aimed at supporting Senegal’s second generation Poverty Reduction Strategy (PRS) with the ultimate objective of attaining the Millennium Development Goals (MDGs). It reflects the various phases of the consultation process within the WBG and in Senegal.
2. COUNTRY CONTEXT
A. POLITICAL AND INSTITUTIONAL BACKGROUND
2.1 Senegal is located on the West Coast of Africa and is part of the West African Economic and Monetary Union (WAEMU). With a population estimated at about 10 million, its economy is dominated by a few strategic sectors, including groundnuts, fisheries, and services. The role of the agricultural sector has declined over time, from almost 15 percent of GDP in 1960 to 7 percent in 2004. The informal sector accounts for about 60 percent of GDP. Its rural economy frequently suffers from drought, and lacks access to basic services and infrastructure, leading to low productivity, high emigration and higher poverty rates in rural areas. As a result, it is estimated that almost half of the population lives in cities.1 This ratio is projected to increase up to 60 percent by 2015.
2.2 Over the past decades, Senegal has enjoyed a stable political climate, and has remained largely unaffected by regional instability. According to a recent World Bank study, every year one out of eight countries will suffer from an internal political conflict in Sub-Saharan Africa.2 By contrast, Senegal has shown a remarkable political stability since independence, which was strengthened by the successful transition to a new President in 2000 and the Casamance peace agreement at the end of 2004. This stability is viewed as the result of a relatively free and diverse media (with numerous newspapers and radios) and an active civil society (with hundreds of NGO), as well as the ability to preserve the historical social equilibrium between modern institutions and religious communities. Several indicators used by the international community such as World Bank Institute (WBI) governance indicators (Table 2.1) and the Freedom House ranking of civil liberties and political rights reflect the relatively good health of Senegalese institutions, and show that Senegal compares favorably to most 1 Including 30 percent in Dakar. 2 P. Collier et al., Breaking the Conflict Trap: Civil War and Development Policy, Washington, D.C., World Bank, New York: Oxford University Press, 2003.

2
African countries. However, the quality of its institutions still lags with respect to that prevailing in emerging and OECD countries.
2.3 The last few months have seen an increase in political activities linked to the preparation of the Presidential elections in February 2007 and the legislative elections scheduled in June 2007. Events such as shifts in the Cabinet’s composition, and disputes between the President and one of the former Prime Ministers, have led to some government spending irregularities, weaker budgetary controls by the judiciary and legislative powers, and fragile governance in public and quasi-public enterprises (see more details in para 2.6). Furthermore, the Government is now perceived as less efficient than a few years ago (the Government Effectiveness WBI indicator declined from 61.2 in 1998 to 49.8 in 2005). Helping Senegal reverse this trend will be at the center of the WBG agenda.
Table 2.1: World Bank Institute (WBI) Governance Indicators in 2004-05 Governance Indicator
Senegal
Percentile
Sub-Saharan Africa Average
Percentile
OECD Average
Percentile Voice and Accountability 53.1 32.7 91.3 Political Stability 41.4 33.4 82.5 Government Effectiveness 51.8 27.3 89.8 Regulatory Quality 41.8 28.8 91.5 Rule of Law 47.3 27.8 90.6 Control of Corruption 47.8 29.6 90.9
Source: Kaufmann D., A. Kraay, and M. Mastruzzi 2006: Governance Matters V: Governance Indicators for 1996-2005.
B. RECENT ECONOMIC DEVELOPMENTS
2.4 Today, Senegal is viewed as a good performer in Sub-Saharan Africa with its economy growing at a steady rate of about 5 percent since the devaluation in 1994. The Government has shown a capacity to generate economic growth, in spite of exogenous shocks (such as droughts and natural disasters). Inflation has remained well under control, at around 1-2 percent per year. The fiscal position has been strong, with an unprecedented low indebtedness and growing tax revenues. Similarly, the current account deficit has been over-financed by official and private capital inflows, resulting in substantial foreign exchange reserves equivalent to over 3 months of imports at end-2006. The monetary and exchange rate policies have been kept in line with regional agreements.
2.5 Senegal has received significant capital inflows over the past decade. It has continued to be one of the most assisted countries in the world (the level of official aid per capita exceeded US$100 in 2004). Furthermore, the growing number of Senegalese living in industrial countries (and the increasing facilities to send money across international borders) has generated a steady increase in remittances, estimated at around US$500 million in 2004,3 which have helped to
3 This figure does not include non-official transfers.
3
promote economic growth and social protection in Senegal.4 Overall, these two sources of foreign capital are now estimated to be equivalent to about 25 percent of GDP.
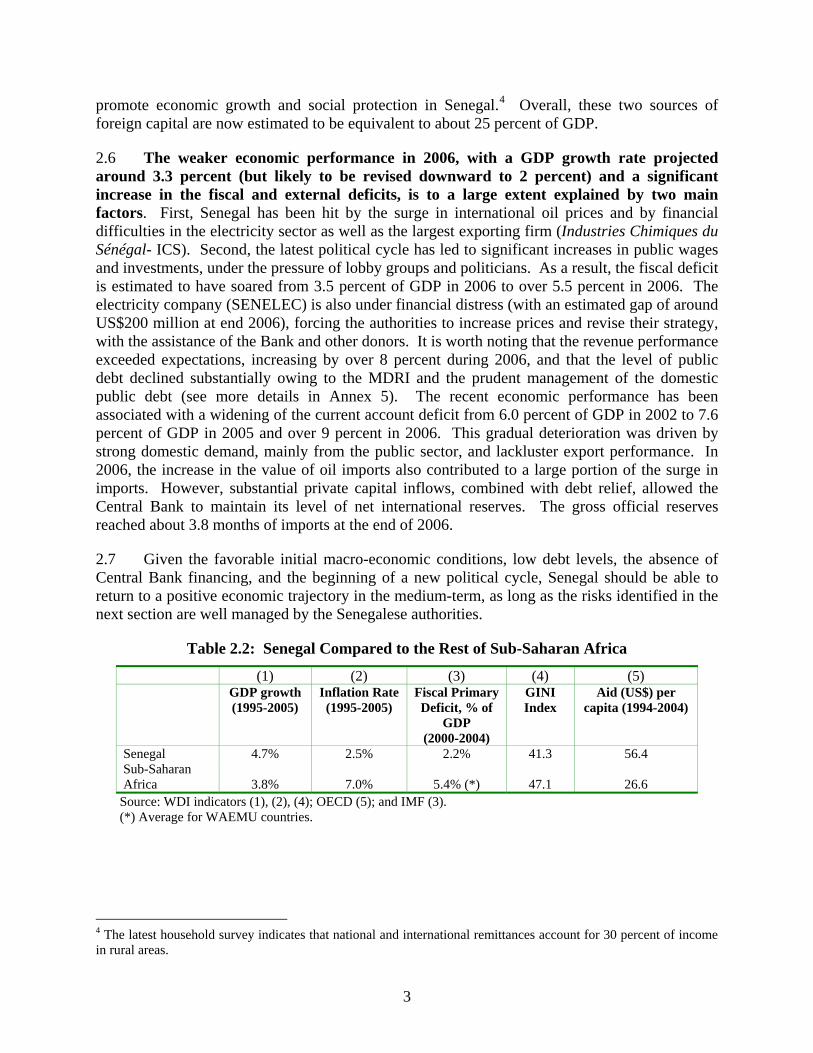
2.6 The weaker economic performance in 2006, with a GDP growth rate projected around 3.3 percent (but likely to be revised downward to 2 percent) and a significant increase in the fiscal and external deficits, is to a large extent explained by two main factors. First, Senegal has been hit by the surge in international oil prices and by financial difficulties in the electricity sector as well as the largest exporting firm (Industries Chimiques du Sénégal- ICS). Second, the latest political cycle has led to significant increases in public wages and investments, under the pressure of lobby groups and politicians. As a result, the fiscal deficit is estimated to have soared from 3.5 percent of GDP in 2006 to over 5.5 percent in 2006. The electricity company (SENELEC) is also under financial distress (with an estimated gap of around US$200 million at end 2006), forcing the authorities to increase prices and revise their strategy, with the assistance of the Bank and other donors. It is worth noting that the revenue performance exceeded expectations, increasing by over 8 percent during 2006, and that the level of public debt declined substantially owing to the MDRI and the prudent management of the domestic public debt (see more details in Annex 5). The recent economic performance has been associated with a widening of the current account deficit from 6.0 percent of GDP in 2002 to 7.6 percent of GDP in 2005 and over 9 percent in 2006. This gradual deterioration was driven by strong domestic demand, mainly from the public sector, and lackluster export performance. In 2006, the increase in the value of oil imports also contributed to a large portion of the surge in imports. However, substantial private capital inflows, combined with debt relief, allowed the Central Bank to maintain its level of net international reserves. The gross official reserves reached about 3.8 months of imports at the end of 2006.
2.7 Given the favorable initial macro-economic conditions, low debt levels, the absence of Central Bank financing, and the beginning of a new political cycle, Senegal should be able to return to a positive economic trajectory in the medium-term, as long as the risks identified in the next section are well managed by the Senegalese authorities.
Table 2.2: Senegal Compared to the Rest of Sub-Saharan Africa
(1) (2) (3) (4) (5) GDP growth
(1995-2005) Inflation Rate (1995-2005)
Fiscal Primary Deficit, % of
GDP (2000-2004)
GINI Index
Aid (US$) per capita (1994-2004)
Senegal 4.7% 2.5% 2.2% 41.3 56.4 Sub-Saharan Africa
3.8%
7.0%
5.4% (*)
47.1
26.6
Source: WDI indicators (1), (2), (4); OECD (5); and IMF (3). (*) Average for WAEMU countries.
4 The latest household survey indicates that national and international remittances account for 30 percent of income in rural areas.

4
C. MEDIUM-TERM OUTLOOK AND SUSTAINABILITY
2.8 The medium-term scenario is based on real GDP annual growth of about 5 percent and continued low inflation during 2007-11 (see Annex 9). This growth rate is at about the same level as the average growth rate since the devaluation of the CFAF in 1994, and consistent with the low base scenario presented by the authorities in the second Poverty Reduction Strategy Paper (PRSP-II). Its attainment would require the continuous implementation of sound macroeconomic policies, market-oriented structural reforms, and an efficient Government investment program. Private savings should increase moderately, facilitated by rising real per capita income and financial sector development. Reflecting these trends, the external current account deficit (including official transfers) would decline marginally from the projected 12 percent of GDP in 2006, to around 7.5 percent of GDP by 2010.
2.9 The medium-term outlook is subject to a number of downside risks, but could also be upgraded under specific conditions. On the one hand, Senegal’s economy remains vulnerable to exogenous shocks, including higher oil prices, severe droughts, locust invasion, and severe political strife in the WAEMU region. It will also be highly dependent on the ability of the authorities to address the current crisis in the energy sector and chemical industry (which still needs to be properly evaluated). The relative fragility of the current account deficit also emphasizes the need to promote private sector development, especially export-oriented activities, which is at the center of the new Accelerated Growth Strategy (AGS).5 On the other hand, the rapid implementation of the AGS may accelerate economic growth to the range of 7-8 percent assuming it creates better conditions for the development of private sector activities and thus stimulates higher private investment and exports. New private activities could also arise from opportunities in potential sectors such as tourism, Information and Communication Technology (ICT), and agriculture.
2.10 The second positive feature of the medium-term outlook is that Senegal has exited the recent enhanced HIPC Initiative and MDRI with a good basis for maintaining sustainable external debt levels over the medium term, especially if borrowing remains at concessional terms and the level of the fiscal deficit remains below 4 percent of GDP (see Annex 5 for details). The recent Debt-Sustainability Analysis (DSA) conducted jointly by the IMF and Bank staffs has shown that the level of public external debt was as low as 13 percent of GDP at the end of 2006. Public domestic debt is estimated at about 3 percent of GDP, of which two-thirds is long term. The DSA highlights the need for Senegal to continue to adopt strict fiscal discipline, a prudent strategy regarding borrowing.
D. POVERTY PROFILE AND UNEQUAL PROGRESS TOWARD MDGS
2.11 Senegal remains a poor country, with a GNI per capita of US$710 in 2005.6 The latest household survey indicates that the proportion of the population living in poverty decreased from 67.9 percent in 1994 (61.4 percent of households) to 57.1 percent in 2001 (48.5 percent of households), which represents a significant achievement by both historical and 5 A clear indication of the concentration of Senegal’s exports is that in 2002, the top five exports at the 8-digit Harmonized System level represented over 40 percent of total exports (petroleum, crude vegetable oil, phosphoric acid, lobster and shrimps). 6 World Bank’s Atlas methodology.
5
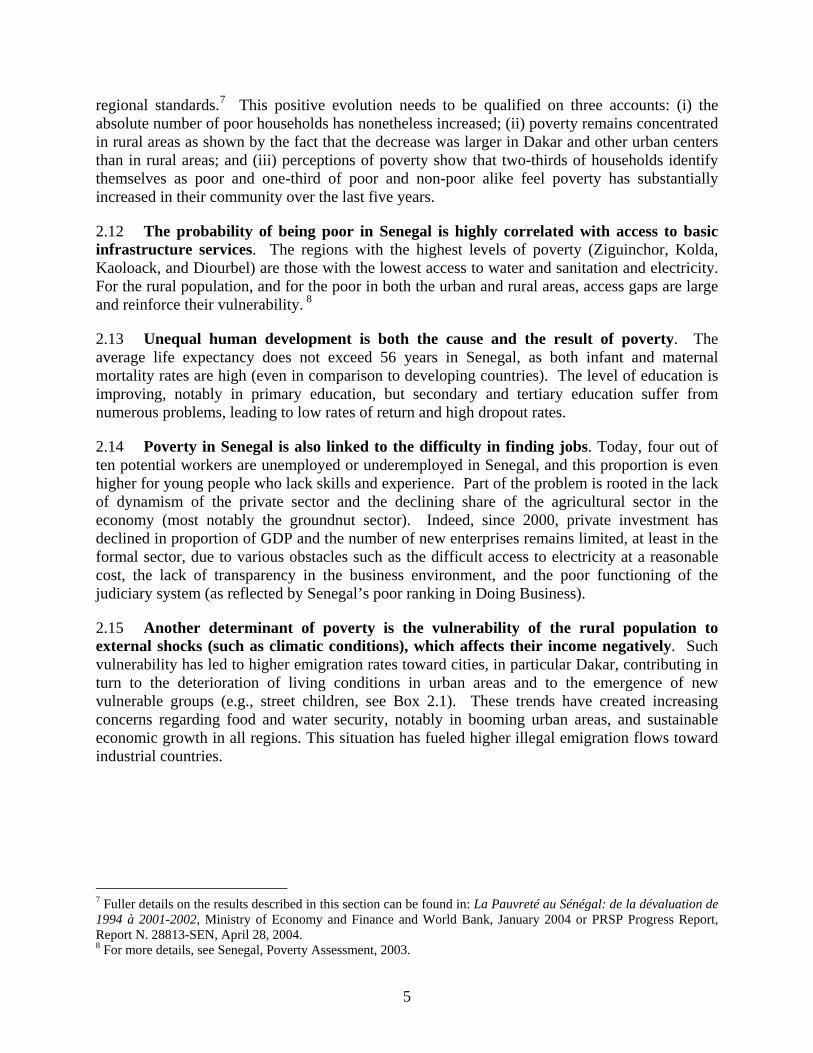
regional standards.7 This positive evolution needs to be qualified on three accounts: (i) the absolute number of poor households has nonetheless increased; (ii) poverty remains concentrated in rural areas as shown by the fact that the decrease was larger in Dakar and other urban centers than in rural areas; and (iii) perceptions of poverty show that two-thirds of households identify themselves as poor and one-third of poor and non-poor alike feel poverty has substantially increased in their community over the last five years.
2.12 The probability of being poor in Senegal is highly correlated with access to basic infrastructure services. The regions with the highest levels of poverty (Ziguinchor, Kolda, Kaoloack, and Diourbel) are those with the lowest access to water and sanitation and electricity. For the rural population, and for the poor in both the urban and rural areas, access gaps are large and reinforce their vulnerability. 8
2.13 Unequal human development is both the cause and the result of poverty. The average life expectancy does not exceed 56 years in Senegal, as both infant and maternal mortality rates are high (even in comparison to developing countries). The level of education is improving, notably in primary education, but secondary and tertiary education suffer from numerous problems, leading to low rates of return and high dropout rates.
2.14 Poverty in Senegal is also linked to the difficulty in finding jobs. Today, four out of ten potential workers are unemployed or underemployed in Senegal, and this proportion is even higher for young people who lack skills and experience. Part of the problem is rooted in the lack of dynamism of the private sector and the declining share of the agricultural sector in the economy (most notably the groundnut sector). Indeed, since 2000, private investment has declined in proportion of GDP and the number of new enterprises remains limited, at least in the formal sector, due to various obstacles such as the difficult access to electricity at a reasonable cost, the lack of transparency in the business environment, and the poor functioning of the judiciary system (as reflected by Senegal’s poor ranking in Doing Business).
2.15 Another determinant of poverty is the vulnerability of the rural population to external shocks (such as climatic conditions), which affects their income negatively. Such vulnerability has led to higher emigration rates toward cities, in particular Dakar, contributing in turn to the deterioration of living conditions in urban areas and to the emergence of new vulnerable groups (e.g., street children, see Box 2.1). These trends have created increasing concerns regarding food and water security, notably in booming urban areas, and sustainable economic growth in all regions. This situation has fueled higher illegal emigration flows toward industrial countries.
7 Fuller details on the results described in this section can be found in: La Pauvreté au Sénégal: de la dévaluation de 1994 à 2001-2002, Ministry of Economy and Finance and World Bank, January 2004 or PRSP Progress Report, Report N. 28813-SEN, April 28, 2004. 8 For more details, see Senegal, Poverty Assessment, 2003.

6
Box 2.1: Street Children in Senegal
2.16 Progress toward MDGs has been unequal due to the mixed performance of Senegal in addressing the main factors behind poverty and inequalities. As summarized in Table 2.3, Senegal is likely to reach its goals in terms of universal primary education and its combat against HIV/AIDS at the current pace of progress. Senegal is also well on track to achieve its MDGs in the urban water sub-sector, even though challenges remain in rural areas where about 3 million people still need access to water and sanitation services. Furthermore, recent actions in terms of nutrition and immunization programs (Diphtheria Tetanus Whooping-cough 3 (DTC3) coverage reached almost 80 percent in 2005) provide some encouraging signs of progress. The number of people utilizing HIV/AIDS voluntary counseling and treatment also increased significantly, from 9,900 in 2002 to 94,000 in 2006. However, major concerns remain with respect to the long-term objectives of eradicating extreme poverty, fighting malaria, and reducing infant and maternal mortality by 2015. Senegal is off- track on these goals.
Most observers agree that the number of street children increased significantly over the past two decades, but no data is available. Preliminary estimates of a 2006 census of street children in the metropolitan Dakar area put their number at over 10,000, and at least as many are likely to be found in other urban centers throughout the country and particularly in the southern regions (e.g., Kolda, Kaolak). These children are among the most vulnerable as they generally lack a caring and enabling environment providing the psycho-social support they need. Living in abject poverty, they are often malnourished, don’t go to school, are victims of violence and have no access to health care. Barefoot, in rags and tatters, they are now part of the urban landscape.
The vast majority of street children, mostly boys of 3-14 years, come from rural areas, and over a third come from other countries (Guinea Bissau especially). They include children entrusted to Koranic teachers by their parents (talibés) who are forced to beg for a living, children whose families live in the street, and children who have broken up with their families (e.g., runaways, victims of family violence, abandoned children). The talibés are by far the most numerous and visible group, easily recognized by the tomato cans they carry to collect alms. A 2006 survey suggests they actually spend very little time learning the Koran, and there are numerous cases of child trafficking disguised as Koranic schooling.

7
Table 2.3: Senegal’s Uneven Path Toward its MDGs
1990
2000
2003
2004/5 Goals 2015
Projected 2015
Goal 1: Eradicate extreme poverty and hunger Population below Poverty Line (%) 58 55.8 54 35 45 Prevalence of underweight children (under three years of age)
21 17.3
10 14
Goal 2: Achieve universal primary education Net primary enrollment ratio (% of relevant age group) 47.1 68.3 75.8 79.9 100 100 Primary completion rate, total (% of relevant age group) 42 46 44 48.3 100 53.4 Goal 3: Promote gender equality and empower women Ratio of girls to boys in primary and secondary education (%)
68.5 83.9 87.1 100 96.7
Goal 4: Reduce child mortality Immunization, DTC3 (% of children ages 12-23 months) 51 41 70 93 85 85 Infant mortality rate (per 1,000 live births) 90 80 78 61 30 45 Under age 5 mortality rate (per 1,000) 148 139 137 121 49 102 Goal 5: Improve maternal health Births attended by skilled health staff (% of total) 38 52 75 75 Maternal mortality ratio (modeled estimate, per 100,000 live births)
510 434 127.5 380
Goal 6: Combat HIV/AIDS, malaria, and other diseases Malaria Prevalence rate 40.7 Prevalence of HIV, total (% of population aged 15-49) 1 1.5 1.7 3 3 Goal 7: Ensure environmental sustainability Access to an improved water source (% of urban population)
66 78 90 95 95
Access to an improved water source (% of rural population)
65 82
Access to improved sanitation (% of urban population) 35 56 60 78 69 Access to improved sanitation (% of rural population) 19.1 59 Source: Government and World Bank
3. SENEGAL’S MAIN DEVELOPMENT CHALLENGES
3.1 Senegal has yet to fully live up to its development potential. At the current economic growth rate of 5 percent, it would take Senegal more than 12 years to reach a per capita income of US$1,000 (the level recorded today by countries such as the Philippines or Paraguay) or nearly 25 years to move ahead of Tunisia and Brazil (assuming that these countries were to remain at their present levels). Senegal’s development is hindered by serious deficiencies in terms of both human and infrastructure development. For example, electricity consumption per capita remains significantly lower in Senegal than the average in Sub-Saharan Africa. The road network is underdeveloped and of poor quality. Senegal was ranked at the 156th position by the United Nation Overall Human Development Index in 2006.

8
3.2 The international experience has revealed that one pre-requisite for success in a country such as Senegal, with limited natural resources, is to perform better than others through a combination of man-made achievements in four main areas: (i) transparency and governance; (ii) Government efficacy; (iii) ease in doing business; and (iv) capacity to adapt and adopt new technologies through innovation and human development.9 Senegal has not yet reported significant improvements in these four areas (see Table 3.1). Today it is ranked at approximately the same level as Ghana and Vietnam but lower than successful emerging countries in the world (Ireland, Singapore, and Estonia) and in Africa (Mauritius, Tunisia).
Table 3.1: Senegal Lags Behind Emerging Countries in Man-Made Areas for Economic Development (Country Ranking)
(1) (2) (3) (4) Countries
Transparency
Government Effectiveness
Ease of Doing Business
Technology Development
Singapore 5 1 1 17 Ireland 19 18 10 20 Estonia 27 39 17 15 Mauritius 51 62 32 69 Tunisia 43 66 80 72 Vietnam 107 117 104 92 Ghana 65 101 94 104 Senegal 78 97 146 103
Source: Transparency International (1), WBI (2) and (4), Doing Business (3) 3.3 The recent economic performance provides Senegal with the opportunity to break with its history of relatively mixed results in terms of growth, equity and poverty alleviation. Seizing this opportunity will require determined actions in two key areas: (i) improving public service delivery; and (ii) promoting private sector participation.
A. IMPROVING PUBLIC SERVICE DELIVERY
3.4 Senegal enjoys a historical opportunity to increase the role of its fiscal policy owing to the sound public management of the Central Government’s financial equilibriums in recent years, strengthened by the recent external debt relief.10 It would nonetheless be incorrect to believe that an expansive fiscal policy will necessarily trigger accelerated growth in Senegal. Experience over the past two decades shows that public spending and economic growth are not necessarily correlated or, at least, not as much as private investment because of persistent weaknesses in terms of allocative and operational efficiencies of public spending.11 If budgets
9 These four dimensions reflect the current literature on economic growth. The emphasis nowadays is given to the role of the quality of institutions (as reflected by Government effectiveness and transparency). This approach complements the more traditional view that has stressed the role of technology, human capital, and private investment (which are captured by technology and the business environment indicators). 10 Such an increase should stay within reasonable limits in order to avoid exaggerated pressures on the current account balance, which could deteriorate in the event of an overly ambitious fiscal policy. For details, see Public Expenditure Review, June 2005. 11 Allocative efficiency refers to the consonance of budgetary allocations with the strategic priorities of the country. Operational efficiency, on the other hand, refers to the provision of public services at a reasonable quality and cost.

9
are misallocated and/or misappropriated, the services that people need (and presumably desire) may not get adequate levels of funding. And, if funds are misappropriated, both the quality and quantity of services that are offered will suffer.
Improving the allocative efficiency of public spending
3.5 The Government has increasingly recognized that the lack of allocative efficiency of its spending is one of the main constraints to achieving its poverty reduction objectives. A recently completed Bank study on the effectiveness of public investment, prepared in close collaboration with the authorities, presents a selected set of areas for reforms.12
3.6 The first area is to consolidate public spending on infrastructure so as to close the infrastructure gap. Senegal lags in terms of the development and quality of its road and electricity networks, which are lower than the average in sub-Saharan Africa. The inadequate supply of infrastructure services has also contributed to the low productivity of the private sector, notably by raising transport and energy costs. World Bank estimates indicate that by modernizing the road network and electricity grid to the levels achieved by Botswana, Senegal could increase its annual growth rate by almost 3 percentage points.13
3.7 In response, the authorities have allocated an increasing share of expenditure to infrastructure, accounting for 40 percent of total investment in 2004 and 2005 versus 25 percent in 2000-03. Building new infrastructure has also become the centerpiece of the President’s vision, with the planned construction of a new airport and an industrial platform located about 30 kilometers from Dakar, which will help to decentralize activities away from the Dakar area. The adequate provision of infrastructure in rural areas will also help promote agricultural activities and reduce poverty, which is highly correlated with access to water and energy services.14
3.8 Fundamental issues remain to be addressed to meet the investment challenge in the infrastructure sector. Not only an increasing share of public resources needs to be allocated to providing and maintaining these services but it will also be necessary to attract private funds to preserve the fiscal space. Such an orientation has already been initiated in the energy and road sectors, but with mixed results over the past few years. The recent adoption of the BOT Law and the creation of the Infrastructure Council have provided the basic elements for boosting private sector participation in infrastructure projects in Senegal. Lastly, the authorities will have to improve their capacity to plan recurrent costs over time as well as to assess the expected impact of large infrastructure projects on the environment and land management.
3.9 Second, the Government will have to upgrade the intra-sectoral allocation of resources within the education and health sectors. The share of education and health expenditure in total public expenditures has increased significantly over the past few years, up by 0.9 and 0.5 percentage points of GDP respectively between 2000 and 2004. This effort has
12 For fuller details, see Senegal’s Public Expenditure Review, 2004 and Public Expenditure Review Update, op. cit. June 2005. 13 For more details, see Public Expenditure Review, 2005 and “Recent Development in Infrastructure”, the World Bank Group, Private Sector Unit, 2005. 14 Senegal: Moving out of Poverty, 2006 and “Water reforms in Senegal: A regional and Interpersonal Distributional Impact Analysis”, 2006.

10
begun to produce positive results as illustrated by the recent increases in primary gross enrollment (up from 67 percent in 2002 to 77 percent in 2004) and in immunization coverage (DTC3 rate up from 54 percent in 2002 to over 80 percent in 2005). Yet, this effort must be enhanced to help these sectors meet their MDGs. In the health sector, the Plan National de Développement Sanitaire, revised in late 2004, provides the roadmap for the next few years. The Government will continue to improve access and utilization of basic health services through the strengthening of outreach activities, the implementation of its infrastructure development plan, and the implementation of the regulatory and legal frameworks for private health service provision and funding. The Government will also need to reinforce priority actions in the areas of preventing infectious diseases and utilizing reproductive health services.
3.10 In the education sector, there have been important gains in achieving higher enrollment rates and gender parity in primary schools, including a higher registration rate for girls than for boys as first graders in 2005, with 91.5 percent admission into grade one (girls represented 51 percent of those admitted). The ratio of girls to boys has consistently improved, reaching 97.2 percent and 86.6 percent in primary and secondary education respectively in 2005. To consolidate this progress in terms of access to education, the Government must improve the quality of primary education. There is also a need to improve quality and performance of secondary education as well as to reduce inefficient expenditure policies (e.g., generalized scholarships to all university students). The authorities have started to give more attention to vocational training by developing new partnerships with the private sector. 3.11 The third area is to increase and harmonize budgetary support to vulnerable groups. In a country where about half of the population live in poverty and are de facto excluded from formal social protection systems, social inclusion is at the center of the development agenda. However, vulnerable groups have only received marginal attention from the Government, as recognized by the authorities in their last two PRSP Progress Reports. The recent review realized by the Bank has revealed that the existing lack of coordination across programs reduces their effectiveness, most notably in rural areas.15 As a result, the Government has developed a new Social Protection Strategy that was adopted at the end of 2005. It stresses three main objectives: (i) strengthening and extending existing social security systems; (ii) improving the prevention and management of major risks and catastrophes; and (iii) increasing social protection of the most vulnerable groups. The document also calls for better targeting of vulnerable groups and understanding the factors behind their vulnerability and exclusion. At this stage, the Government seeks to mobilize further internal and external funding so as to make significant progress toward protecting the most vulnerable groups in the country.
3.12 The last area emphasizes the need to improve the allocative efficiency of public spending not only across sectors but also across regions. Inequalities in the delivery of social goods and infrastructure are rooted in the unequal allocation of human and financial resources by regions. For example, a large proportion of teachers and health workers are located in the Dakar areas, at the expense of remote areas where needs are pressing. The Senegalese Government has initiated the decentralization of decision-making regarding the management of human and financial resources, including the strengthening of local Governments’ capacities and the gradual transfer of a number of responsibilities to local communities, especially in the education and 15 For more details, see “Rural Protection Strategy”, July 2005.
11
health sectors. Decentralized execution of the investment budget was initiated in the 2006 Budget Law for the health and education sectors. Nevertheless, Senegal remains a very centralized country with limited tax revenues for local Governments and financial transfers (FECL and FDD) equivalent to less than 1.5 percent of the central Government budget in 2005. Clearly, the decentralization process needs to be accelerated over the next few years.
Upgrading the operational efficiency of public spending
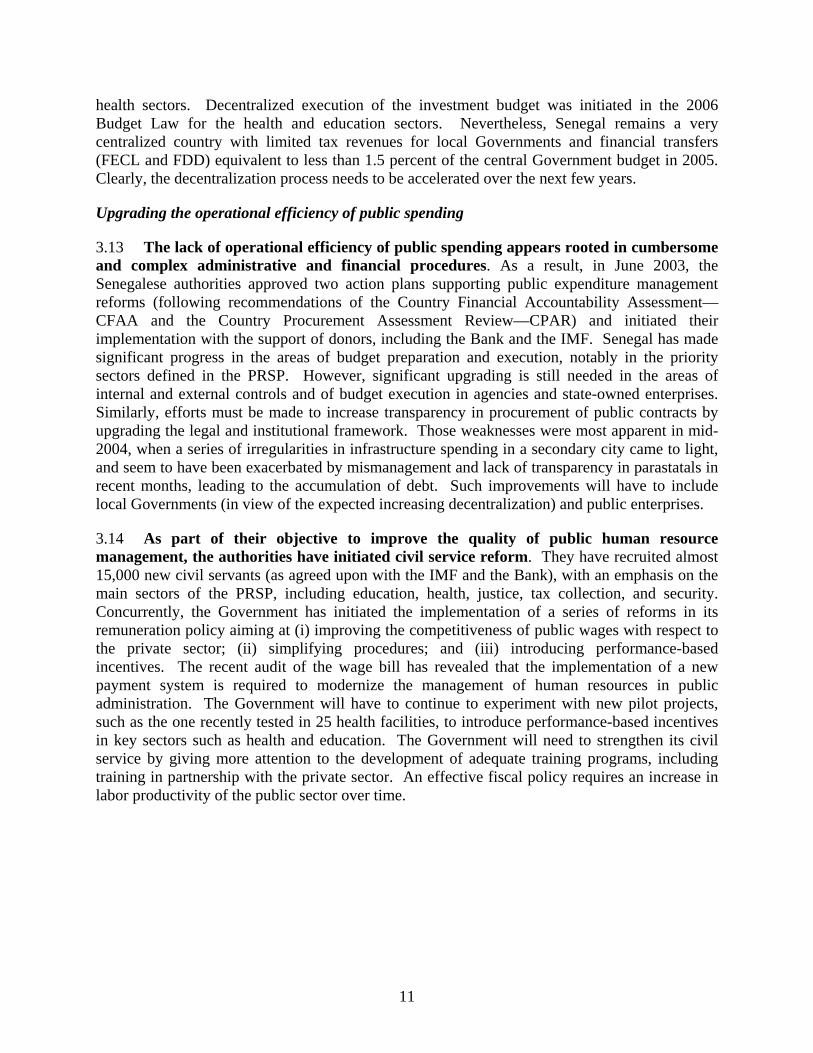
3.13 The lack of operational efficiency of public spending appears rooted in cumbersome and complex administrative and financial procedures. As a result, in June 2003, the Senegalese authorities approved two action plans supporting public expenditure management reforms (following recommendations of the Country Financial Accountability Assessment—CFAA and the Country Procurement Assessment Review—CPAR) and initiated their implementation with the support of donors, including the Bank and the IMF. Senegal has made significant progress in the areas of budget preparation and execution, notably in the priority sectors defined in the PRSP. However, significant upgrading is still needed in the areas of internal and external controls and of budget execution in agencies and state-owned enterprises. Similarly, efforts must be made to increase transparency in procurement of public contracts by upgrading the legal and institutional framework. Those weaknesses were most apparent in mid-2004, when a series of irregularities in infrastructure spending in a secondary city came to light, and seem to have been exacerbated by mismanagement and lack of transparency in parastatals in recent months, leading to the accumulation of debt. Such improvements will have to include local Governments (in view of the expected increasing decentralization) and public enterprises.
3.14 As part of their objective to improve the quality of public human resource management, the authorities have initiated civil service reform. They have recruited almost 15,000 new civil servants (as agreed upon with the IMF and the Bank), with an emphasis on the main sectors of the PRSP, including education, health, justice, tax collection, and security. Concurrently, the Government has initiated the implementation of a series of reforms in its remuneration policy aiming at (i) improving the competitiveness of public wages with respect to the private sector; (ii) simplifying procedures; and (iii) introducing performance-based incentives. The recent audit of the wage bill has revealed that the implementation of a new payment system is required to modernize the management of human resources in public administration. The Government will have to continue to experiment with new pilot projects, such as the one recently tested in 25 health facilities, to introduce performance-based incentives in key sectors such as health and education. The Government will need to strengthen its civil service by giving more attention to the development of adequate training programs, including training in partnership with the private sector. An effective fiscal policy requires an increase in labor productivity of the public sector over time.
12
Box 3.1: Main Achievements in Public Financial Management and Remaining Issues
The Bank’s fiduciary risk assessment rated public financial management as “moderate” in Senegal, in line with the result from the Government’s comprehensive evaluation of the CFAA and CPAR action plans carried out in June 2006. Overall, progress was judged encouraging, with 70 percent and 44 percent of the CFAA and CPAR actions respectively completed by end 2005. Major achievements were realized in terms of preparation and execution of the budget, notably through the use of programmatic budgets in key ministries and the gradual decentralization of budget execution from the Ministry of Economy and Finance to line ministries. The implementation of the software system SIGFIP was also perceived as a major step forward. On procurement, the first ever audit was published at end 2005 and key Ministries have started to develop annual plans to help streamline procedures and avoid concentration of contracts in the last quarter of the calendar year. With regard to controls, it was noted that the Treasury had been able to transfer all state accounts accumulated from 1997 to the Cour des comptes, eliminating the backlog accumulated over the years. In turn, the Cour des comptes has evaluated the state accounts for 1997, 1998 and 1999 and is on the pace to review remaining accounts during the next 18 months. The evaluation report recommended that the authorities should focus their efforts in the following areas: (i) improve wage and human resources management; (ii) harmonize procedures between projects funded on internal and external resources; (iii) accelerate the use of programmatic budgets in line Ministries; (iv) improve the preparation and execution of the investment budget; and (v) strengthen internal and external controls of agencies, public enterprises, and local governments. The authorities, and partners, were also encouraged to launch the Public Expenditure Financial Assessment (PEFA), as it should provide useful benchmarks for measuring progress in Senegal over time and compared to other countries. Such an exercise is expected to be completed by October 2007.
3.15 The Senegalese authorities need to be made more accountable for the use of public funds by strengthening checks and balances and by disseminating relevant information to media and interested parties. The Government needs to ensure that allocated resources reach their intended final beneficiaries. A recent tracking survey has reported that only 58 percent of teachers could be identified on active duty, raising doubts about the efficacy of the system to educate children. Similarly, leakages and inefficiencies are numerous in the health sector.16 Efforts to strengthen checks and balances are under way through the implementation of the CFAA/CPAR actions described earlier. The Treasury has finalized the consolidated state’s accounts and recently forwarded them to the General Accounting Court (clearing the significant backlog). The Court has reviewed these accounts for 1997-99 and a timetable was set up to send its avis de conformité to the National Assembly for the remaining years. The Court has relatively limited resources and a Multidonor Trust Fund is funding short term accountants to assist in accelerating the review. There is a need to strengthen the controls of independent agencies and public enterprises as emphasized in the recent Public Expenditure Review Update and the ROSC on corporate governance produced by IFC in early FY2007. The Government has also established a number of new institutions aimed at improving governance in both the public and private sector (e.g., Commission contre la Corruption, Infrastructure Council) but efforts are needed to make them more effective. Finally, the authorities have taken the initiative to strengthen information systems and further empower final beneficiaries, notably through the development of Community Driven Development (CDD) initiatives supported by the Bank.
16 For details, see “Senegal, Policies and Strategies for Accelerated Growth and Poverty Reduction”, A Country Economic Memorandum, April 3, 2003.

13
B. ENHANCING PRIVATE SECTOR DEVELOPMENT
3.16 The performance of the private sector has been uneven in Senegal as evidenced by the decrease in private investment from 17 percent of GDP in 2000 to 15 percent in 2004 and the relative stagnation of exports, around 27 percent of GDP. This lack of dynamism is also reflected at the micro level since labor productivity of manufacturing in Senegal, while high compared to neighboring countries, is estimated to have declined over the past two decades, and is today equivalent to one fifth or one third of those achieved in Korea and South Africa, respectively.17 Job creation has been minimal with the unemployment and under-employment rates stagnating at around 40 percent of the labor force. Such a performance needs to be turned around so that the private sector can play its expected pivotal role in the PRS agenda.
3.17 Policymakers face major challenges to improve Senegal’s investment climate and promote sector development. Streamlining bureaucracy and improving transparency are key challenges as illustrated by Senegal’s poor ranking in Doing Business Indicators and the Bank’s recent ROSC on accounting practices by the private sector.18 While some specific initiatives have been launched, a more concerted, broad based strategy is required. The Senegalese Government finalized its new Accelerated Growth Strategy in January 2007, which is part of the second-generation PRSP (see next section for details). This new approach is expected to help address further cross-sector issues related to the investment climate and promote five specific clusters that are perceived by the Government to have the highest comparative advantage for Senegal: (i) agribusiness; (ii) tourism; (iii) telecommunications and new technologies; (iv) textiles; and (v) fisheries.
3.18 Many surveys, diagnoses and studies, including those emanating from the Bank Group, have already helped to reach a consensus regarding the major constraints faced by the private sector in Senegal (Box 3.2).19 Building on recommendations from the Presidential Investors’ Councils, the authorities have improved the business environment by streamlining regulations concerning business registration and taxation. In January 2004, the National Assembly adopted reforms simplifying the corporate income tax and investment codes. The tax basis was broadened by eliminating several tax exemptions, and a single tax replacing the income tax, the value-added tax, patent contributions, and social security charges was introduced for small enterprises. The new investment code broadened the scope of eligible sectors to take into account PRSP priorities and it streamlined the system of investment incentives.
17 See “Senegal: Investment Climate Assessment”, World Bank, 2004. 18 World Bank, ROSC on auditing and accounting practices, 2005. 19 A non-exhaustive list of studies from the WBG on the business environment in Senegal includes: “Senegal, Investment Climate Assessment” (2004), FIAS studies on taxation and administrative barriers (1999, 2001, and 2003), MIGA’s studies on benchmarking (2005).
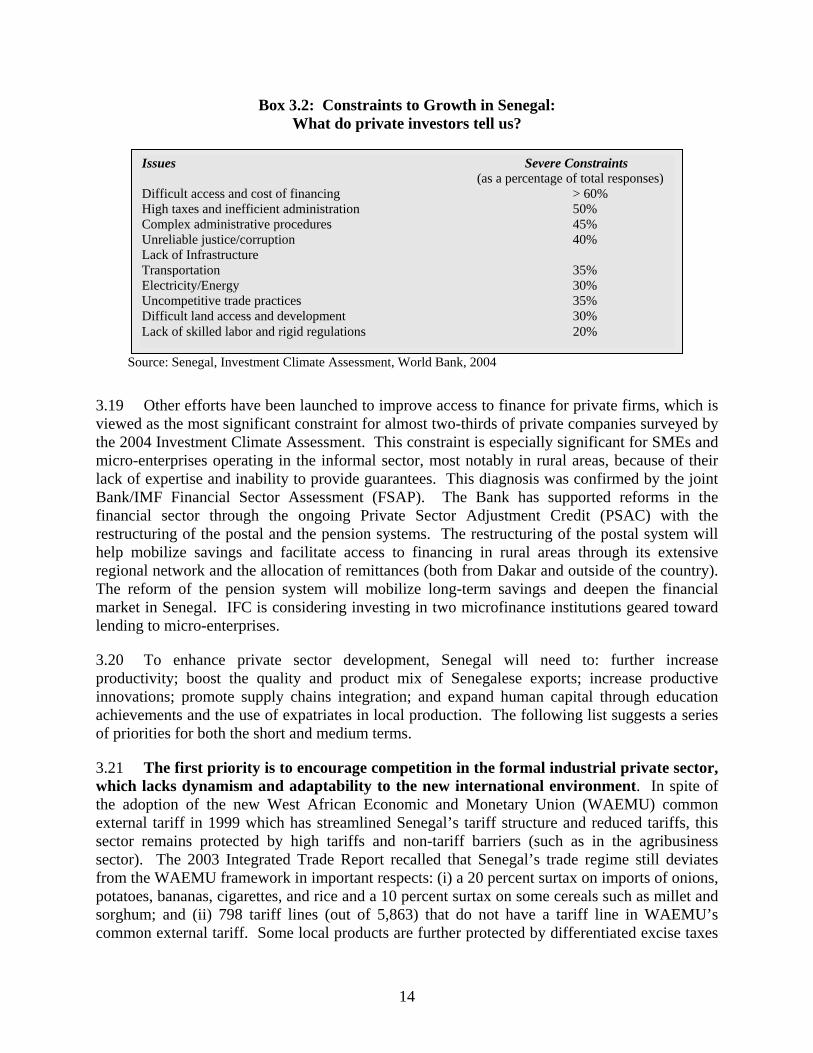
14
Issues Severe Constraints (as a percentage of total responses) Difficult access and cost of financing > 60% High taxes and inefficient administration 50% Complex administrative procedures 45% Unreliable justice/corruption 40% Lack of Infrastructure Transportation 35% Electricity/Energy 30% Uncompetitive trade practices 35% Difficult land access and development 30% Lack of skilled labor and rigid regulations 20%
Box 3.2: Constraints to Growth in Senegal: What do private investors tell us?
Source: Senegal, Investment Climate Assessment, World Bank, 2004
3.19 Other efforts have been launched to improve access to finance for private firms, which is viewed as the most significant constraint for almost two-thirds of private companies surveyed by the 2004 Investment Climate Assessment. This constraint is especially significant for SMEs and micro-enterprises operating in the informal sector, most notably in rural areas, because of their lack of expertise and inability to provide guarantees. This diagnosis was confirmed by the joint Bank/IMF Financial Sector Assessment (FSAP). The Bank has supported reforms in the financial sector through the ongoing Private Sector Adjustment Credit (PSAC) with the restructuring of the postal and the pension systems. The restructuring of the postal system will help mobilize savings and facilitate access to financing in rural areas through its extensive regional network and the allocation of remittances (both from Dakar and outside of the country). The reform of the pension system will mobilize long-term savings and deepen the financial market in Senegal. IFC is considering investing in two microfinance institutions geared toward lending to micro-enterprises.
3.20 To enhance private sector development, Senegal will need to: further increase productivity; boost the quality and product mix of Senegalese exports; increase productive innovations; promote supply chains integration; and expand human capital through education achievements and the use of expatriates in local production. The following list suggests a series of priorities for both the short and medium terms.
3.21 The first priority is to encourage competition in the formal industrial private sector, which lacks dynamism and adaptability to the new international environment. In spite of the adoption of the new West African Economic and Monetary Union (WAEMU) common external tariff in 1999 which has streamlined Senegal’s tariff structure and reduced tariffs, this sector remains protected by high tariffs and non-tariff barriers (such as in the agribusiness sector). The 2003 Integrated Trade Report recalled that Senegal’s trade regime still deviates from the WAEMU framework in important respects: (i) a 20 percent surtax on imports of onions, potatoes, bananas, cigarettes, and rice and a 10 percent surtax on some cereals such as millet and sorghum; and (ii) 798 tariff lines (out of 5,863) that do not have a tariff line in WAEMU’s common external tariff. Some local products are further protected by differentiated excise taxes

15
on imported and local products such as edible oils and cigarettes.20 In some sectors, collusive behaviors by a few dominant firms have produced significant costs for local consumers, raising prices above their international levels (for example, sugar, transportation, and groundnuts).21 Such behavior and weak governance have also led to financial mismanagement in key sectors (ICS mining and SENELEC electricity). At this stage, the Government will push for the elimination of the remaining specific taxes and non-tariff barriers in the sectors mentioned above and for improved governance in public and private enterprises.
3.22 To foster competition, the Senegalese Government has promoted the participation of new private operators, notably in the infrastructure sector. After two failed privatization attempts in 1995 and 1999, in March 2005 the authorities sold the groundnut processing and vegetable oil refining company (SONACOS) to the only bidder that made an offer. In the electricity sector, the Government concluded the process of selecting an independent private producer (IPP) to increase generation capacity by 67.5 Megawatts (MW) (equivalent to about 14.6 percent). In the future, the Government will promote higher private sector participation in infrastructure sectors (transports and energy). A necessary condition will be to improve the accounting and audit systems for public (and quasi public) enterprises and regulated private operators when there are residual monopoly powers. An effort will also be pursued to upgrade accounting and reporting practices in the private sector, along the lines suggested in the recent ROSC produced by the Bank.
3.23 The second priority is to support micro and small and medium enterprises, which account for more than half of the Senegalese economy. Perhaps the greatest challenge facing Senegal, as the country attempts to move from economic stability to accelerated growth with equity, is to generate sustainable sources of opportunity for the marginalized groups in society. This effort will require the expansion of micro-enterprises and small and medium firms, which are the main providers of jobs. Such firms face a variety of constraints, including lack of access to capital, weak technology and labor skills, and poor integration within supplier and distribution networks. Most small and medium-sized firms do not have access to property rights (including land) and to inexpensive conflict-resolution mechanisms, due to the lack of efficiency of the judiciary system and complex administrative procedures. There is no simple answer to these challenges but they have to be at the center of the new AGS.
3.24 The third priority is to optimize the perceived comparative advantage of the Senegalese economy in a few strategic sectors, and thus promote exports and/or job creation. The business principle is to push “what is already moving” and to give priority to the sectors that have contributed to two-thirds of GDP growth in the recent past. Those are by order of decreasing importance: communications, trade and financial services, real estate and construction, and agriculture and agribusiness (Figure 3.1). This focused approach has already been adopted in the AGS (at least for two sectors) and should be strengthened over the next few 20 For details, Senegal: Diagnostic Trade Integration Study, March 2003. 21 A recent Bank study indicates that the sugar sector in Senegal is under the monopoly of one company employing approximately 3,000 permanent employees (plus 2,000 temporaries), which benefits from relatively high protection levels. As a result, the consumer price of sugar is about US$1 per kilogram in Senegal, while it is US$0.4 in Sri Lanka and US$0.5 in The Gambia. Such a price differential has significant implications for poverty levels in Senegal since it is estimated that the number of people living in poverty would decline by 200,000 or by almost 2 percentage points if the sugar price were cut by half or equal to the one prevailing in The Gambia.

16
years. Over time, success in these sectors will spread over the rest of the economy, creating new synergies and investment opportunities.
Figure 3.1: Contributions to Economic Growth by Sector (2000-04)
0.0% 5.0% 10.0% 15.0% 20.0% 25.0%
Communication
Trade andfinancial services
Real estate andconstruction
Agriculture andagrobusiness
Source: World Bank
3.25 A stronger, more competitive agriculture sector combines the second and third priorities. Assisting small farmers and entrepreneurs in rural areas is essential because they are among the poorest segments of the population and the most exposed to climatic and natural shocks. As a result, these groups are the main sources of emigration toward urban centers, especially Dakar.22 The emergence of new exports (such as fresh vegetables of which exports boomed by 130 percent between 2003 and 2005) appears promising and should help diversify production and agricultural exports away from groundnuts. The recent increase in competitiveness of the agricultural sector in Senegal is nonetheless limited to a few locations (Niayes, Senegal River Valley, and Casamance regions) and products. It is also penalized by complex relationships between traditional and modern powers that make difficult access to land and discourage site development because of the lack of guarantees and financial resources. Furthermore, resource degradation is a growing challenge for Senegal, ranging from deforestation to land degradation associated with poor water resources management and the depletion of fish stocks. The Government has set out plans for addressing these issues and the Bank is currently finalizing its Country Environment Analysis, in close collaboration with donors and civil society.
3.26 The fourth priority is to increase the level of skills and technology used by the private sector in Senegal. As mentioned earlier, to be successful Senegal will have to boost and diversify its exports, suggesting that its local production in key sectors (such as ICT, exports, and agriculture) will have to be aligned with quality standards defined by consumers in industrialized markets. The recent knowledge assessment produced by World Bank Institute (WBI) on Senegal reveals that it ranked poorly even among other Sub-Saharan countries (see Table 3.1). Senegal has improved compared to 1995 but not as fast as other countries. Its main weaknesses appear to be related to the poor quality of its Research and Development (R&D) institutions and relatively 22 Rapport de la synthèse de la deuxième enquête sénégalaise auprès des ménages (ESAM-II), juillet 2004.
17
low education attainments. Fostering technological development will have to rely on a multi-faceted approach involving education establishments and research institutes, partnerships with private firms (local and foreign), and the State. A specific effort, supported by the World Bank, has been made by the Government to upgrade the National Fund for Agricultural Research (FNRAA) and to foster the links between the education system and the labor market. Concurrently, actions will have to be taken to upgrade the legal and institutional environments as well as to promote new channels for information and knowledge dissemination (notably through Senegalese expatriates, and partnerships with foreign universities and colleges).
3.27 The fifth and last priority is to take advantage of the presence of many Senegalese abroad (7 out of 10 Senegalese families report having one of their members living abroad). Senegal already benefits from significant remittances sent home by migrant workers and expatriates. While these funds help generate economic growth on a national scale by financing the purchase of consumer goods and real estate, they also represent a potential source of financing for more infrastructure projects and productive activities on a larger scale. A closer connection with the local banking system has to be developed to help monetize the economy since only 10 percent of the population is estimated to have a bank account today. The ongoing reform of the postal system and sustained growth of microfinance institutions will help achieve this goal. In parallel, actions should be taken to reverse the brain drain23 and to motivate expatriates to bring back new skills and technology to Senegal. The Government has started to focus on expatriates by launching a combined effort through the Ministry of Foreign Affairs and the Investment Promotion Agency (APIX).
4. SENEGAL’S LONG-TERM VISION AND MEDIUM-TERM PRIORITIES
4.1 The Senegalese Government is well aware that it needs to achieve more and better to address the above challenges in the next few years, and thus increase economic growth, create jobs, and reach the poor. This commitment is reflected in the second generation Poverty Reduction Strategy Paper (PRSP-II), which was presented to the Board on January 30, 2007, through which the authorities offer their vision for the next five years. At the outset, it is worth underscoring that this vision is well aligned with the MDGs agenda, and its formulation has benefited from inputs from donors, local Governments and representatives of the civil society as well as from the private sector.
4.2 Senegal’s medium-term vision is articulated around four pillars: (i) wealth creation; (ii) access to basic social services; (iii) protection of vulnerable groups; and (iv) greater transparency and participatory processes. The first three pillars were already included in the first PRSP, while the last one has emerged as a new priority for the authorities. Below is a presentation of the Government’s priority areas. These specific programs show what the Government is committed to accomplish.
4.3 By placing the Accelerated Growth Strategy (AGS) at the center of the first pillar of the PRSP-II, the authorities have rightly emphasized the need to encourage private sector-led growth and to expand and diversify exports. The AGS is based on two key objectives: (i)
23 An IMF study shows that 60 percent of African immigrants living in the US have a tertiary education (source: William J. Carrington and Enrica Detragiache, “How Extensive Is the Brain Drain?, Finance and Development”.
18
improving the overall investment climate in the economy by focusing on a series of cross-cutting issues (including in the areas of justice, taxes, infrastructure, and administrative barriers); and (ii) promoting the development of five cluster sectors with a presumed good export growth and job creation potential, including through measures to enhance sectoral competitiveness.24 In parallel, wealth creation will rely on the implementation of national sectoral strategies for the agricultural and livestock sectors aimed at promoting activities in rural areas. The PRSP-II discusses the large infrastructure projects that the Government plans to put in place over the next few years, including the Diamniadio industrial platform, the Dakar-Thiès highway, and the new airport. These projects will not only provide the necessary basis for private sector development, but will also help diversify economic activities away from Dakar and its suburbs (which account for about 80 percent of GDP on less than one percent of the national territory).
4.4 The second pillar based on human development will continue to promote access to basic social services by a growing share of the population. The implementation of the national strategies in the education and health sectors, as well as new commitments to enhance nutrition and access to sanitization and water are the key elements of the Government’s strategy.
4.5 The third pillar of the PRSP-II emphasizes the need to improve the lives of vulnerable groups, an area which has been neglected so far, and prescribes actions to ensure that these groups benefit from wealth creation and have better access to social services. Vulnerable groups are numerous and diverse in Senegal, including children, handicapped, elderly, and refugees. The recent finalization of the National Protection Strategy has helped build a consensus on a selected set of priorities, including the need to increase the coverage of existing safety nets, provide direct financial assistance to targeted groups, and improve the Government’s capacity to respond to natural catastrophes and shocks. Such a concerted approach has helped improve coordination between various stakeholders.
4.6 The fourth pillar on transparency and participatory processes is justified by the need to strengthen the effectiveness of public spending (through efficient budgetary procedures and controls) as well as to promote private sector development (through less distortion and better access to justice). Improvement in governance will be achieved through reforms in the areas of capacity building and financial management in the public sector. The Government intends to pursue implementation of two action plans supporting public expenditure management reforms, as a follow up to recommendations of the Country Financial Accountability Assessment (CFAA) and the Country Procurement Assessment Review (CPAR). As part of their objective to improve the quality of public human resource management, the authorities have initiated civil service reforms. They will strengthen civil servants by providing training in education, health, justice, tax collection, and security. Concurrently, the Government has initiated the implementation of a series of reforms in its remuneration policy aiming at: (i) improving the competitiveness of public wages with respect to the private sector provided productivity increases and compatibility with macroeconomic stability is ensured—particularly in light of the rapid increase of the wage bill in recent years; (ii) simplifying procedures; and (iii) introducing performance-based incentives. The PRSP-II also proposes an agenda of reforms for the justice sector, in line with the national sectoral strategy endorsed by key stakeholders in the country.
24 The five sectors include agro-industry, fisheries, electronic customer support services, tourism, and textiles.

19
4.7 The Senegalese Government has initiated the decentralization of decision-making with regard to the management of human and financial resources, including the strengthening of local governments’ capacities and the gradual transfer of a number of responsibilities to local communities, especially in the education and health sectors. It will pursue the gradual decentralization of the execution of the Consolidated Investment Budget, and strengthening capacity building at the local level, which is a prerequisite for successful decentralization.
4.8 Beyond the four pillars mentioned above, the Government has based its strategy on a number of guiding principles that can be summarized as follows:
(a) Preserve macroeconomic stability and reduce vulnerability to external shocks. The authorities recognize that maintaining fiscal and external balances is crucial for the success of their medium-term vision. They intend to pursue prudent fiscal policies so that inflation and debt levels will remain in line with the IMF and WAEMU targets. At the same time, they will continue to give special attention to the management of external shocks by developing preemptive instruments, by diversifying export revenues, and by building up financial reserves to protect the agricultural sector and the most vulnerable groups.
(b) Promote equity and protect vulnerable groups. Not only will the authorities aim at increasing the delivery of basic social services (education and health), but also at reducing existing inequalities in their access, which varies significantly depending on the users’ income levels, gender and location. They will launch a new employment strategy that should help promote jobs for youth and women. The protection of vulnerable groups will remain at the center of the agenda, reflecting the need to broaden the coverage of existing social safety nets beyond five percent of the total active population, and to secure better living conditions for important groups of children, women, elderly, and disabled, most notably in rural areas.
(c) Balance growth between rural and urban regions. As of today, most economic activities (about 90 percent of GDP) and a large fraction of the population are concentrated in the Dakar area, which represents less than 1 percent of the national territory. Such a disproportionate outcome has resulted in the deterioration of living conditions and infrastructures in the Dakar agglomeration, and has raised issues in terms of food security and the environment. The Government has launched a two-fold strategy that aims simultaneously at improving conditions in the Dakar area and promoting economic opportunities in secondary cities and rural areas. The delocalization of economic activities outside of Dakar is under preparation, through the construction of a new industrial platform, a toll road highway, and a new airport. The development of new investment opportunities in the agricultural sector is being promoted in the Senegal River and Casamance regions.
4.9 The Government has stressed the need to increase its capacity to monitor progress and remove constraints that may emerge over time. The second PRSP, as well as the AGS, provide the roadmap for the next few years. At this stage, this broad policy framework needs to be translated into a strategic set of actions, with a precise timetable and clearly assigned responsibilities, and a full set of monitorable actions and results with an appropriate pro-poor focus. The authorities will also need to clarify the link between their strategic choices and budgetary processes and allocations, not only at the sector level, but also within sectors and
20
across regions. Improved prioritization of actions, clear leadership by decision makers, and continued dialogue with donors and stakeholders will be key to a successful implementation of the PRSP.
5. WORLD BANK GROUP ASSISTANCE
5.1 The Government and the WBG share a common vision on the overall objectives to be achieved in Senegal over the next few years. The WBG assistance program will therefore support the Government’s key priorities identified in PRSP-II. This assistance will nonetheless be selective and will focus on concrete actions where the WBG has a comparative advantage, given its past experience and other donor programs. The specific activities of support will be clustered around one cross-cutting filter and three pillars to maximize impact, enhance synergy, increase the efficiency of WBG support, while avoiding fragmentation and providing flexibility over the CAS period.
A. LESSONS FROM PAST EXPERIENCES AND CONSULTATION STRATEGY
5.2 This CAS capitalizes on lessons from the Bank’s past experience in Senegal and from a series of directions derived from global and regional assessments. With regard to past experience, the recent IEG evaluation suggests that WBG assistance should aim to: (i) strengthen the dialogue and consensus with the Government; (ii) improve harmonization with donors; and (iii) promote synergies between rural and urban areas, notably in the infrastructure sector. The CAS Completion Report has also identified a number of lessons (for details see Annex 2). First, Bank programs must be aligned with government objectives to alleviate poverty, especially with the fourth PRSP pillar devoted to governance and the need to promote further decentralization and participatory mechanisms. Second, Bank programs must give special attention to the design and choices of lending instruments, including clear, measurable outcomes. Third, close coordination with the Government and partners is important, since the most successful Bank projects have been those that have demonstrated a clear ownership by the authorities and synergies with other donor programs.
5.3 The CAS incorporates guidance from recent experiences at the regional level. For example, Senegal has been selected as a pilot country in Sub-Saharan Africa to implement the Paris Declaration agenda which stresses ownership, harmonization, alignment, results, and mutual accountability as crucial ingredients to maximize aid effectiveness.25 The Bank plays a key role in assisting the authorities in this regard (see Annex 6). This CAS also incorporates lessons from the Africa Action Plan, including the promotion of concrete results, quick wins for demonstration impact, and a focus on economic growth.
5.4 This CAS accounts for progress made in the management of the existing Bank’s portfolio in Senegal. The number of projects and the portfolio composition have remained relatively stable over the FY03-06 CAS period (about 20 projects under supervision in a given fiscal year), with support to infrastructure (55 percent), agriculture and rural development (23 percent), human development (16 percent), private sector development (12 percent), and economic management (4 percent). By end FY06, there were no active projects rated as
25 For details, see Paris Declaration on Aid effectiveness, March 2005.

21
unsatisfactory and commitments at risk declined to US$65 million from a high of US$210 million in FY03. The overall control risk26 for Bank-Funded projects was rated as “moderate” in February 2006, emphasizing the need to (i) address the project accounting and internal control framework before effectiveness; (ii) update regularly the necessary actions to be taken during implementation; and (iii) improve the quality of the audit reports transmitted (which remains the main issue).
5.5 Consultation strategy. The Bank, in full coordination with the Government, held a series of consultations with various segments of civil society and development partners in Senegal (see Annex 6 for details). The consultations started at the end of April 2006, and culminated in a one-day seminar in Dakar in mid-June 2006. A preliminary version of the CAS was also presented in the quarterly journal published by the Bank’s office in Dakar and benefited from a wide coverage from local media. In parallel, thematic consultations on each specific pillar were organized to encourage a discussion of issues that are of particular importance to a wide range of stakeholders, such as governance (notably through the GAC consultations). The Bank, in close coordination with the authorities and in line with the Paris Declaration agenda, also launched a survey of donors operating in Senegal. The survey has helped to identify: (i) current and planned disbursements; and (ii) ideas for strengthening cooperation with the Government and coordination among donors. The results, summarized in Annex 7 have helped shape the new PRSP and this proposed CAS program.
B. PROPOSED BANK PROGRAMS AND EXPECTED OUTCOMES
5.6 The proposed CAS platform for FY07-10 is based on one governance filter and three main pillars. This platform aims not only at addressing the country’s challenges but also at maximizing synergies with the Government’s PRSP and the Bank’s AAP by using the WBG comparative advantage. The CAS seeks continuity with the ongoing reform programs, while moving gradually toward a more programmatic approach. It also promotes selectivity by leaving aside some key aspects of the PRSP agenda, such as support to the livestock sector, the banking sector and telecommunications, which are likely to benefit from assistance from other donors during the CAS period. The WBG is expected to be engaged through active partnerships with the private sector and other donors, including in the water and road sectors. In other sectors, complementarities are sought in terms of lending instruments with, for example, the Bank providing budgetary support in the health sector, while other donors focus on investment projects. The reverse is planned in the education sector where the World Bank will carry forward an investment project in FY07 and CIDA a budgetary support operation.
GOVERNANCE FILTER 5.7 Strengthening governance is widely recognized as an essential element for the success of the development strategy in Senegal. Such a focus is crucial for improving public service delivery --the first key challenge identified earlier. Weaknesses have emerged in public financial management systems over the past few years, such as the growing use of non-
26 Control risk is the risk that the project’s accounting and internal control frameworks are inadequate to ensure that project funds are used economically and efficiently and for the purpose intended, and that the use of funds is properly reported.

22
competitive procurement procedures in public contracts (almost 60 percent of projects funded by domestic resources) and mismanagement in public and quasi-public enterprises (e.g., in the energy sector and the largest industrial firm operating in Senegal) has led to the accumulation of substantial debt over the past year.27 Strengthening governance will also be crucial in the effort to promote private sector development by strengthening the legal and institutional frameworks in areas such as land, property rights, labor, and environmental policies.
5.8 The governance filter will work in two ways in the WBG strategy: First, the proposed emphasis will help improve the efficiency of sectoral operations and mitigate their risks. Some examples of the cross-cutting impact of this filter are, inter alia: (a) fiduciary reforms of the State, by strengthening budgetary procedures and securing better financial transfers across sectors, will help to improve the efficiency of the Bank’s lending operations in the education and agricultural sectors; (b) better involvement of local governments, through the development of participatory processes, will help optimize the spending allocation and the delivery of basic infrastructures throughout regions; (c) improved functioning of the justice system will impact significantly the development of the private sector, through better access to land and financing –two major constraints in the current business environment in Senegal. Second, the inclusion of governance aspects in the design of sectoral projects will contribute to improve overall transparency in Senegal. Examples of such an approach can be found in paras. 5.28 and 5.40.
5.9 Overall, the WBG will use three guiding principles to ensure that governance considerations are mainstreamed into its programs in Senegal.
1. Greater transparency and efficiency in the use of public resources
5.10 There are several constraints to achieving greater transparency in the use of public resources that will be addressed during the CAS period. The WBG will support the removal of these constraints through lending support, targeted assistance through the use of trust Funds, and Analytical and Advisory Work in key areas, in partnership with the Government, civil society, and donors. These constraints and related Bank support are described below.
5.11 Ensuring transparent public expenditure management and procurement procedures at both the central and local levels. The CFAA/CPAR action plans have been instrumental in placing this item on the agenda of both the Government and donors over the past few years. Progress was realized in: (i) budget preparation through programmatic budgeting in seven key ministries at end 2006; and (ii) budget execution through decentralization from the Ministry of Economy and Finance to line Ministries. Coordination between the Government and donors has been enhanced by the creation of the Multi-Donor Trust Fund which aims at improving capacity building in the above areas. Coordination continues to be a key factor with the preparation of a new Public Expenditure Financial Assessment (PEFA), to be carried out jointly by key donors in FY07. The Bank will continue to support this effort through a series of ongoing and planned budgetary support credits. Concurrently, a number of initiatives have been undertaken to reduce the risk for investment operations. These include: (i) assistance to the accountancy and auditing professions through an IDF grant (to be effective in FY07);28 and (ii) further collaboration between the Bank and the Ministry of Economy and Finance to improve the internal audit 27 More details on these issues are reported in the latest Bank’s Public Expenditure Update (June 2006). 28 One of the key recommendations derived from the 2005 ROSC.

23
function and evaluate better the need for closing risky projects. Over time, the gradual move toward programmatic budgets in all key ministries, as well as a more rationalized preparation of the investment budget,29 will enhance coordination across sectors and will lead to a better budgetary allocation across ministries and regions.
5.12 Strengthening control institutions for the sustainability of effective governance. Although the preparation of the budget and its approval by the Parliament come under scrutiny in Senegal (the budget is published on the Government’s website), ex-post controls by the judiciary and the legislative power are deficient. The Bank will provide support to the Supreme Audit Institution (Cour des comptes) to ensure that executed state accounts are examined in compliance with international standards, including regional regulations. Concurrently, public accountability will be increased through a sustained effort to strengthen the role of Parliament and civil society in overseeing and controlling the use of public resources. In particular, these efforts will take place through the WBI program. The involvement of civil society will be further encouraged through the establishment of anti-corruption hotlines in Dakar and in the regions. A special emphasis will be given to strengthening compliance with the 2001 environmental law and regulations. The outcome sought is that investments in Senegal are systematically screened according to existing regulations, and monitored for environmental compliance by the Government.
5.13 Promoting higher quality of public administration. The effectiveness of the Government in using public funds will largely depend on its capacity to manage its human resources and boost labor productivity. The Bank aims at providing both financial and analytical support by placing this item at the center of its next series of poverty reduction support credits and by making it the central theme of the Public Expenditure review planned for FY08. The Bank will support pilot projects in the education and health sectors to provide performance-based incentives and motivate key staffs to locate in underserved regions. Further reforms based on the recent audit of the wage bill will improve transparency and modernize the payment system.
2. Increasing public sector accountability
5.14 Enhancing delivery of basic services through devolution to local governments and empowerment of communities. Experience has shown that public sector accountability is increased when decision makers are closer to beneficiaries, thereby justifying the shift toward greater decentralization in Senegal. Yet, the central Government still controls close to 90 percent of public resources even though significant spending responsibilities (especially in the health and education sectors) were assigned to local Governments back in 1997. Clearly, the decentralization process needs to be pushed ahead based on the need to: (i) reinforce capacity of local Governments; and (ii) improve the relations between the central and local Governments. The first objective is and will be supported by several Bank-financed operations, including the Participatory Local Development Program and Local Authorities Development Program that aim to provide support to local governments in delivering a basic platform of basic social and infrastructure needs. The second objective is part of the PRSC program through two concomitant actions: (i) the decentralization of the execution of the investment budget; and (ii) increasing and more predictable financial transfers to local Governments, leading to the adoption of a new law
29 See recommendation from the 2005 “Bank’s Public Expenditure Update”.

24
by Parliament in January 2007. In parallel, the gradual increase in` financial resources allocated to local Governments should be accompanied by stronger financial management and procurement procedures at the local level as well as reinforced independent controls and audits.
5.15 Strengthening institutions responsible for fighting corruption and promoting good governance in the public and private sectors. Over the past few years, the Government has established a variety of public/private institutions with the aim of increasing public sector accountability. The Bank program will put special emphasis on the Infrastructure Council responsible for ensuring that all PPPs are in conformity with the BOT law. This would be in line with IDA projected support to private sector participation in the Dakar-Diamniadio Highway project and in the electricity sector. Strengthening the institutions responsible for implementing the new procurement code will be supported by the Bank through technical assistance (IDF grant) and will continue to be integrated into the PRSC agenda. The Bank and other donors will also monitor the performance of the Commission against corruption because it is viewed as a key channel to foster public-private partnership and to send a positive signal to local and foreign investors about the Government’s commitment to fight corruption. The Bank is also expected to support the authorities in improving controls over public agencies and public enterprises, which have suffered from lack of governance over the past few years. This will be done through the PRSC program and targeted assistance in infrastructure sectors.
5.16 Improved communication and information strategies. Monitoring mechanisms are a critical element in improving accountability. The Government has given a new impulse to this agenda by creating the National Statistical Agency in early 2006. The Bank and other donors will actively support data collection through a new household survey and will help the Government to improve its capacity to monitor PRSP implementation. In parallel to increasing statistical monitoring and collection capacity, information and communication channels between the public and private sectors as well as other stakeholders will be enhanced by distance learning programs envisaged on critical issues such as PPPs, in close collaboration with the Government. The Bank plans to enhance its outreach program, including the quarterly publication of its journal (Echos de la Banque mondiale) and periodic meetings with the media and civil society.
3. Strengthening and modernizing the judicial system and mechanisms for private governance
5.17 Encouraging respect for the law and access to justice. The PRSP has emphasized that a better environment for justice will not only promote economic growth but also favor a more equitable distribution of wealth within the country. Aware of the deficiencies in the current system, the Government finalized a sectoral strategy at the end of 2004 that calls for a long-term capacity building program and greater financial resources, notably through the national budget. The objectives of this program include: improved performance of courts, accelerated processing of cases and making judgments available to the general public to enhance consistency and transparency. This program would also expand access to courts for the most vulnerable groups, and thus generate greater empowerment of the poor. As a result, the budgetary allocation to the justice sector has doubled from 2002 to 2006. The Bank has supported this effort through the ongoing PRSC series, leading to improvements in the institutional framework and the adoption of a new law that aims at streamlining legal assistance to the most vulnerable groups. The Bank also plans to provide assistance to the Government through a judicial sector project starting in

25
FY08, which will build fuller capacities in this sector and foster synergies with other sectors. A well functioning justice system will create a variety of positive externalities in terms of economic growth, human development, and equity.
5.18 Strengthening commercial courts and conflict resolution mechanisms. The recent Investment Climate Assessment conducted by the Bank revealed that the large majority of firms operating in Senegal have little confidence in the judicial system and existing conflict-resolution mechanisms because of the lack of transparency and slow decision processes. The Bank supports the Government in addressing these issues through its Private Investment Promotion Project, which provides assistance to the company’s register and to the development of alternative arbitration mechanisms through private sector associations. Technical assistance is and will be provided by the Bank and IFC, including on the issue of land access that penalizes severely investors in specific sectors such as agriculture and tourism.
5.19 Improving compliance with international accounting and audit standards. The large majority of firms (mostly SMEs) operating in Senegal are reluctant to use standard accounting practices because they do not have the internal capacity and the right incentives to use them. Recent distress in public or quasi-public enterprises (such as ICS, the largest industrial plant in the country) has revealed weak independent financial controls and audits. The WBG has already conducted a ROSC on accounting practices that has identified several options for improvements (simplified procedures, enforcement, and publication). The WBG has undertaken a ROSC on corporate governance, including a section on State-Owned Enterprises, in coordination with the authorities, that has recommended to draft a code of corporate governance for Senegal and to strengthen monitoring and controls of public enterprises by reinforcing their board of directors and generalizing independent and periodic of their accounts. Following these recommendations, IFC will be designing PEP Africa programs to assist the authorities.
5.20 Encouraging competition in strategic sectors. WBG support during the CAS period will focus on two interrelated outcomes. First, emphasis will be given to increasing private sector participation in the electricity and road sectors. This support will be at the center of the planned Dakar-Diamniadio highway project and the central element of the dialogue in the electricity sector. Second, the Bank will continue to push the agenda for greater international competition by reducing tariffs and non-tariff barriers in key sectors such as the groundnut and sugar sectors. A more encouraging investment climate, by lowering entry barriers, will be supported through assistance to the Investment Promotion Agency (APIX) and the implementation of the Accelerated Growth Strategy, notably through the PIPP project. WBG assistance will be provided, not only through the country program, but also at the regional level since these issues are largely dependent on WAEMU regulations.
PILLAR 1: ACCELERATED GROWTH/WEALTH CREATION/STRENGTHENING THE DRIVERS OF GROWTH
5.21 Strengthening poverty reduction will require greater emphasis on the domestic growth environment since an annual GDP growth rate of at least 7 percent is viewed as one of the prerequisites for reaching the MDGs. Such an emphasis is also at the center of the AAP, supported by the WBG. The CAS will seek to address Senegal’s growth constraints by focusing on a series of specific outcomes taking into account: (i) PRSP and AAP objectives; (ii)

26
key challenges identified earlier for the promotion of private sector development; and (iii) WBG’s capacities and comparative advantages. These outcomes as well as the instruments designed to support them are described below.
1. Promoting a competitive investment climate
5.22 The CAS plans to support the implementation of a competitive investment climate in Senegal through a series of analytical and financial initiatives. On the analytical side, IFC/FIAS will support the authorities in addressing existing administrative barriers that firms face when they want to establish themselves and operate in the country. This will be done by sharing the Doing Business methodology and indicators. The Bank will support the implementation of Senegal’s Accelerated Growth Strategy (AGS) through the ongoing Private Investment Promotion Project (PIPP) and a planned new operation in FY09. A new Investment Climate Assessment is expected to be conducted in FY08, which will help to monitor progress over time. Furthermore, the Country Economic Memorandum (CEM) will focus on the current constraints on employment and the development of skilled labor in Senegal. MIGA is assisting APIX to target potential investors by conducting a benchmark study comparing advantages and obstacles in key export sectors in Senegal. Over time, Senegal should be able to attract more investors (local and foreign) as well as to boost and diversify its exports.
2. Building and maintaining basic infrastructure for growth
5.23 Senegal lags in terms of the development and quality of its road and electricity networks, which in turn reduces the competitiveness of its private sector. The CAS will aim at assisting the Government in its effort to upgrade the access of firms to these two basic infrastructures through a series of ongoing and planned projects. On the road sector, the Bank and IFC will provide financial support to the Dakar-Diamniadio Project, which is viewed as a central element of the Government’s program to promote private sector participation in this sector. An integral part of the design of this PPP is the provision of an IFC Partial Risk Guarantee, which will help mobilize private sector funding, and therefore limit public/multilateral resources. Over time, the CAS will seek to enhance policy dialogue through new sectoral projects (AGS, Transport III, the Senegal River Multimodal Navigation Project, and the Regional “Mauritania-Senegal-The Gambia” Integration Project), especially on the crucial needs to: (i) improve the quality of the rural road network (through adequate maintenance); and (ii) develop road corridors between Senegal, Mauritania and The Gambia.
5.24 The Bank Group has been actively involved in the energy sector through ongoing projects in the rural sector (electricity services for rural areas project) and in supporting the construction of a new generation unit as a means of alleviating the overextended power supply in the country (electricity sector efficiency enhancement project and IFC financing of the Kounoune project). This support is embedded in the medium-term sector strategy which sets clear objectives in terms of price regulations and restructuring of the national electricity company, SENELEC, including private sector participation. CAS support in this sector will be strengthened to assist the authorities in implementing their strategy by developing a new project (the final choice of the type of instruments is not yet determined) in FY08, subject to the availability of additional IDA resources. This new project will aim at providing budget support to SENELEC, increasing power production, and supporting the institutional and legal reforms in the sector. As noted in para 5.8, this will help support government efforts in strengthening the

27
environment for improved governance. At the regional level, the ongoing Senegal River Basin Organization (OMVS) Felou Hydroelectric Project aims at increasing the supply of low cost hydroelectricity from the OMVS Power System to the national power utilities of Mali (EDM), Mauritania (SOMELEC) and Senegal (SENELEC).
5.25 Access to modern information and telecommunications infrastructure is viewed as essential for Senegal’s future economic development, notably for the success of the AGS. Over the past few years, this sector has led Senegal’s good macroeconomic performance, accounting for about one-third of GDP growth over the period 2000-03. The CAS will seek to continue to support this sector through the ongoing PIPP, centering on policy, regulation and institutional reforms.
3. Facilitating access to financial resources by small and medium-sized enterprises (SMEs)
5.26 To support the reforms of the financial sector, a close collaboration is envisaged between the Bank, IFC, and MIGA. To facilitate lending to SMEs, MIGA has launched a Small Investor's Program (SIP) that offers a three-point country risk package (Expropriation, War & Civil Disturbance, Transfer & Inconvertibility) on a streamlined basis for investments under US$5 million. Concurrently, MIGA, the International Development Association (IDA), and the Agence Française de Développement (AFD) are working towards implementing a joint Guarantee Facility in the context of the West Africa Capital Market Development Project, which was approved by the boards of the World Bank, and AFD in 2004. Such a facility is designed to be a catalyst for the private financing of small and medium-sized infrastructure projects in WAEMU countries, and to mitigate critical Government performance risks, which currently constrain the interests of investors. The Guarantee Facility seeks to speed up the processing, and lower the cost of access to these instruments for relatively small projects. The development of the financial sector will also rely on two ongoing regional projects: (i) the regional payment system project with the introduction of the real time settlement system for large transactions and electronic clearing has modernized the payment system; and (ii) the regional financial markets development projects will facilitate the recourse of Senegalese firms to the regional market by significantly reducing costs (replacement of obligation of a 100 percent guarantee by the rating of issuers, reduction of transactions costs) and contribute to the development of PPP infrastructure projects through partial guarantees. Senegal is the first country to benefit from such a guarantee within UEMOA (for a rural electrification project).
5.27 One of the options contemplated by the Government for improving access to finance has been the introduction of new financial instruments adapted to the needs of SMEs. The Bank’s ongoing PPIP project has involved two local commercial banks for which IDA/IFC PCG is provided on their new loan portfolio to SMEs. Similar facilities are being discussed with other donors to cover SMEs in the education, housing, and agribusiness sectors. IFC funded a leasing market study and seminar to determine the feasibility of investing in a leasing company in support of SMEs. Senegal's tax treatment of financial operations has hindered the development of efficient private sector financing mechanisms and has no positive impact on fiscal revenues. A review and simplification of the fiscal regime of financial operations is under consideration by IFC, as it would encourage more efficient financing of the economy.

28
4. Promoting a modern and diversified agriculture sector
5.28 The WBG has traditionally given special attention to the agricultural sector in Senegal because it is the major occupation of close to 60 percent of the active workforce. However, declining productivity and lack of diversification in production have led to rising poverty, which in turn has fueled high emigration to cities over time. Bank support over the CAS period will cover three major areas. First, the second phase of the Agricultural Service and Producer Organization project (PSAOP II) will support the establishment of a network of producer organizations and advisory services in all rural areas, facilitating producers’ access to agricultural services and knowledge, with the ultimate goals of increasing agricultural productivity and diversification and improving household food security. Bank financing will also help to prepare a medium term expenditure framework for the Ministry of Agriculture and the Ministry of Livestock from year 2008, as part of Bank support to Government efforts in strengthening governance, as noted in para 5.8. Along the same lines, support to infrastructure and basic social needs in rural areas will be provided through the Participatory Local Development Program. In parallel, the Agricultural Markets and Agribusiness Development Project will promote access to regional and international markets through the development of efficient supply chains in a few selected activities (e.g. horticulture and non-traditional products), in line with the AGS. The planned regional project (Senegal River Multimodal Navigation) will help finance the modernization of St. Louis waterways, and entry of agricultural exports from the Senegal River Basin. Recent studies have indeed demonstrated that Senegal’s agricultural sector is penalized by deficiencies in the logistics chain from the farm to consumer markets (in urban centers and abroad).30
5.29 The second area will emphasize access to water and irrigation by farmers through the ongoing Agricultural Markets and Agribusiness Development project and the regional Senegal River Basin Multipurpose Water Resources Development project.
5.30 The third element seeks to improve the sector’s productivity by increasing the quality of production, especially of groundnuts. Bank support is provided through a variety of projects, including the ongoing Agricultural Services and Producers Organizations (PSAOP2) and planned initiatives such as the GEF supplemental to the PSAOP under the SLM program as well as the regional Biosafety project and West African Agricultural Productivity Program (WAAPP). The Bank aims at helping Senegal to achieve the following two outcomes: (i) reconstitute the groundnut seed capital to at least 50,000 tons by 2010; and (ii) improve the quality of non-traditional export products up to the standards of consumers in industrial markets.
5. Promoting sustainable development and management of natural resources
5.31 The fisheries sector employs 10 percent of the rural population and generates 30 percent of exports. However, this source of employment and revenue is threatened because of declining fish stocks, resulting from overcapacity and overfishing. The Bank will provide support over the CAS period through the ongoing Integrated Coastal and Marine Resource Management Project (GIRMaC), to improve the management of small-scale fisheries, in close cooperation with partners (Japan, European Union, France, Switzerland, Spain). In parallel, the GIRMaC will support a recasting of the framework for protected marine areas and biodiversity 30 See for example, “Recent Development in Infrastructure”, the World Bank Group, Private Sector Unit, 2005.

29
management around the principles of co-management and the provision of ecological services. With supplemental financing under the Global Environment Facility (GEF) sustainable fisheries management, the Bank will strengthen the regulation of access to fish resources and implement the presidential decision to establish 10 new marine protected areas. Finally, the Bank will support the preparation of a regional fisheries project in partnership with the West Africa Fisheries Commission (WAFC), the European Union (EU), Food and Agriculture Organization (FAO), and Department for International Development (DFID), to reduce illegal or “pirate” catches, increase local landing of catches and strengthen small-scale fisheries.
5.32 In a country like Senegal, with relatively few natural resources, sustainable development is a priority. Such a priority is reflected in the Bank’s proposed program over the CAS period. The ongoing Country Environmental Analysis will help to define better the issues at stake and pave the way to closer collaboration with the Government and partners. In addition, the Bank will provide support to the objective of improving the sustainability of agro-ecological systems in rural areas, in close coordination with partners (Netherlands, France, Norway, UNDP, TerrAfrica, etc.) and thanks to a GEF/Sustainable Land Management (SLM) supplemental to PSAOP2, with a focus on reversing land degradation in regions such as Tambacounda, Velingara, and Kolda. Finally, Bank support during the CAS period will also aim at establishing community forest management units to fully meet household wood fuel needs in the country by 2010. These efforts to develop sustainable energy sources in rural areas have already been actively supported by the Bank through the Sustainable and Participatory Energy management (PROGEDE) project, with a second phase expected to start in FY09.
6. Developing skilled labor and use of technology
5.33 Developing a knowledge economy is one of key objectives of the ambitious agenda set up by the AGS. Bank support during the CAS period will be sequential, with a first phase under the CEM, especially in terms of the enhancement of skilled labor and the capacity of the labor force to absorb and adapt new technologies. The second phase will be to integrate the derived recommendations in the planned support to the AGS in FY09. This support will complete the ongoing assistance provided through the PRSCs to improve the functioning of the labor market, with an emphasis on vocational training through private-public partnerships. It will also boost the research agenda in the agricultural sector, supported by the ongoing PSAOP2.
PILLAR 2: HUMAN DEVELOPMENT/SOCIAL SERVICES/SHARED GROWTH
5.34 Increasing access and opportunities for poor and vulnerable groups, as growth performance is improved, is at the heart of the Senegal’s PRS agenda. Not only is equity crucial for ensuring social and political stability but it is also a key ingredient for achieving long-term economic growth as demonstrated by the Bank’s 2006 World Development Report. The Bank’s contribution will include a mix of financial and analytical support in the education and health sectors as well as in the areas of the protection of vulnerable groups.

30
1. Improving quality of and access to basic education
5.35 Senegal is in a good position to meet its MDG target of achieving universal primary education completion by 2015. The Bank has had a long-term involvement in this sector, and will continue its support through the ongoing Quality Education for All, Phase 2 project, in close coordination with other development partners operating in this sector. During the CAS period, the first main objective will be to improve quality and access to primary education, notably by identifying and enrolling children currently not in school, and reducing gender and regional disparities that remain prevalent in Senegal. The Bank program will also aim to reduce the number of repeaters and dropouts through an active collaboration with the Government and civil society associations; a special effort will be made to expand access of street children to education, among other things. The second objective will focus on attaining higher enrollment rates in middle schools, notably by ensuring a better allocation of budgetary resources toward this level of education. Such an objective will complement the ongoing and planned efforts in vocational training, and research and development supported by the PRSC program, which ultimately aim at producing a better educated labor force in Senegal over time. Improving financial and human resources management in this sector will be supported by the ongoing sectoral investment project and the ongoing and planned PRSC series, both of which give special attention to: (i) budgetary procedures, including procurement; (ii) improved human resources management; and (iii) decentralization across sectors but with a special attention to the education sector, which is one of the largest ministries in terms of spending. All these activities will help support Government efforts toward improving the environment for better governance, as noted in para 5.8.
2. Improving health services provision for women and children
5.36 The second phase of the national health strategy aims at addressing current constraints on both the supply and demand sides as well as improving accessibility, effectiveness, efficiency, quality and sustainability of health services, including in remote areas. These objectives have been fully integrated into the Bank’s PRSC series, and have and will be complemented by other investment projects in this sector, including the ongoing MAP and APL community nutrition projects II. A series of technical assistance projects and ESW are also planned so that the Bank can share its experience and help build local capacities in this sector.
5.37 During the CAS period, the Bank will aim at assisting the Government to achieve five outcomes. The first outcome will seek to increase adequate financing, provision and utilization of health services by: (i) achieving better service delivery through performance-based contracts at all levels with specific emphasis on health districts; and (ii) increasing human resource productivity in all facilities (notably through better human resource management). Financial support will be provided through: (i) the PRSC; (ii) a study on the effectiveness of health financing strategies (in FY08); and (iii) technical assistance through a program conducted by WBI on contracting and financing in the health sector. The second outcome, which is at the center of the PRSC program, aims at reducing maternal mortality by increasing the number of assisted births, with an emphasis on the five poorest regions. The third and fourth outcomes are to reduce two of the main (current and potential) sources of morbidity and mortality in the country: maintain the rate of HIV prevalence below three percent and reduce by one-third the
31
numbers of malaria deaths. In addition to the PRSC series, the Bank has and will support the authorities through the ongoing HIV/AIDS Prevention and Control project, the Senegal River basin project, and the Nutrition Enhancement II project. The fifth outcome is to reduce child mortality below 13 percent during the CAS period through a series of actions aimed at reducing underweight malnutrition rates in children under 5 years old, in line with the MDGs and the PRSP objectives.
3. Improving protection of targeted vulnerable groups
5.38 The PRSP, which fully integrates the recent national social protection strategy, emphasizes the need to improve the lives of vulnerable groups, and it prescribes actions to ensure that these groups are effectively able to benefit from wealth creation and have access to social services. The Bank will support the Government in this area through a variety of programs. First, the Bank has already integrated the issue of vulnerable groups into the design of sectoral projects in the agricultural, health, nutrition, and education sectors. For example, support to farmers contributes to the reduction of poverty levels, as most of the poor are concentrated in rural areas. Similarly, a better educated and healthier workforce is more likely to be productive and employed, thereby reducing their vulnerability. Beyond these sectoral projects, the PRSC program is and will actively help the authorities in developing specific programs in favor of: (i) the disabled, through community based rehabilitation programs; and (ii) specific vulnerable groups, through improved access to social protection and health insurance schemes. A Poverty Update and a new Poverty Assessment are expected to be produced in FY07 and FY09 respectively. Last, but not least, as described in the next section, this support in favor of vulnerable groups will be complemented by further assistance to help emigrant and immigrant groups.
PILLAR 3: RURAL AND URBAN SYNERGIES: URBANIZATION/MIGRATION
5.39 At the current pace, it is projected that almost six out of ten Senegalese will be living in cities by the year 2015. This rapid pace of urbanization raises a key challenge for the authorities who will need to find the right balance between urban and rural development. To support the Government, the WBG will shape its program along three areas, as summarized below.
1. Improving urban mobility, access in and out of Dakar, and promote regional centers
5.40 Optimizing rural and urban synergies through the development of the road network takes into account three key priorities: (i) improving urban mobility within Dakar; (ii) facilitating access in and out Dakar; and (iii) developing rural roads. The WBG will assist the authorities during the CAS period through a variety of ongoing and planned lending operations, in close collaboration with partners. First, improving urban mobility will continue to be supported by the Local Authorities Development Program Project (PRECOL) and the second phase of the Urban Mobility Improvement (PAMU)/Transports III project to be started in FY09. Second, the challenge of improving access conditions in and out of Dakar will be supported by the Bank’s financial assistance to the Dakar-Diamniadio highway and the provision of an IFC Partial Risk Guarantee. Third, Bank support in developing and maintaining rural roads will be integrated in the planned PAMU/Transport III, and through partnership with AFD in the Senegal

32
River Valley, and EU in Southern Senegal. They aim at promoting access to a minimal infrastructure platform (health, education, and water, and roads) in rural areas through increasing participation of local Governments and communities. As part of the Government’s ambitious project to decentralize industrial activities outside of Dakar, in close coordination with the above mentioned highway project and the industrial platform to be funded by the Millennium Challenge Account, analytical advice is provided on the new airport project. The Bank will stress that the above investment operations be carried out under conditions of transparency to help promote Government efforts towards improved governance.
5.41 The WBG also plans to provide support to the development of regional centers, especially in the regions of the Senegal River through the regional project Senegal River Basin Multipurpose Water Resources Development and the planned Senegal River Multimodal Navigation Project. Support to the Casamance region is provided through the ongoing Casamance Emergency Project. This latter project aims at rehabilitating social infrastructure (health centers, classrooms, roads) affected by the conflict in the Southern part of the country.
2. Reducing the vulnerability of immigrant and emigrant groups with a focus on street children in Dakar
5.42 Rural emigration has shaped Senegal’s economic and social development over the past three decades. Massive emigration to cities has been the result of the increasing vulnerability of the rural population, which has seen its income decrease significantly over time. Support to farmers is provided through two ongoing sectoral projects (Agricultural Markets and Agribusiness Development Project; and Agricultural Services and Producers Organization II). The Bank will also provide analytical support to the Government by launching a series of studies aimed at identifying actions to reduce the vulnerability of the rural population to major natural risks (such as weather-based and crop insurance schemes) and to better understand non-farm employment issues. Furthermore, the objective of improving learning outcomes in rural communities, especially in the groundnut region, has been stressed by the Bank’s project in the education sector. The Bank, in close coordination with the authorities and partners, will also address the growing phenomenon of street children in urban areas through the PRSC series, a national outreach program, and the Nutrition Enhancement II project. The main outcome will be to reduce the vulnerability of street children, as measured by the decline in the number of working children in the Dakar area, by facilitating their insertion in schools and skills development programs. The Country Economic Memorandum (CEM) and a subsequent employment strategy note will also help identify further directions in addressing the issues of unemployment and under-employment in Senegal, including for women.
3. Improving quality of life through better management of natural resources and access to water and sanitation
5.43 The concentration of the Senegalese population in urban centers raises multiple issues in terms of environment and quality of life. Cities such as Dakar have become more polluted, leading to higher environment-related diseases in children. There is a need to strengthen compliance with environmental regulations in Senegal and monitor the Government’s activities for environmental compliance. Further problems also arise, ranging from unsustainable land management to waste management and provision of food and water. During the CAS

33
period, the WBG will focus its assistance in the following areas: (i) reducing environment health-related diseases in children; (ii) improving the implementation of environmental regulations with a focus on the Baie de Hann that is highly polluted as the result of uncontrolled industrial activities; and (iii) reaching MDGs in terms of access to water and sanitation services by 2015, with a special focus on rural areas. Senegal will receive both financial and analytical support through the ongoing Country Environmental Analysis, the GIRMaC, GEF/SLM supplementals to PSAOP2, and planned lending support in the water sector, including at the regional level through the Water and Sanitation Millennium Program.
SUMMARY OF MAIN OUTCOMES TO BE EXPECTED FROM THE CAS PROGRAM
5.44 For the WBG, overall success should be measured in principle by the contribution of the CAS to high order national goals: (i) higher GDP growth in the range of 7 percent; (ii) reduction in poverty levels, notably in rural areas, along the lines of the first Millennium Development Goal; and (iii) the capacity to generate more and better jobs, leading to a decline by half of unemployment and underemployment rates. However, these goals are not directly measurable over a short period of time and are influenced by several factors that are outside of the control of the Government and the Bank.
5.45 Table 5.1 summarizes the main outcomes that the WBG aims to achieve by the end of the CAS period and will help Senegal progress toward PRSP indicators and MDGs. It is nonetheless worth underscoring that they were selected through an intensive participatory process and are well aligned with PRSP objectives and MDGs. They also account for: (i) areas in which the Bank is expected to influence results through its lending and non-lending programs; and (ii) interventions by other donors to maximize synergies. As much as possible the selected outcomes rely on monitoring instruments used independently by the Bank (in the AAP such as CPIA ratings, WBI governance indicators and PEFA benchmarks) and by existing projects in Senegal. Additional details are in Annex 1, which describes the results framework.
Table 5.1: Summary of CAS Results-Based Framework
Country Goals (PRSP/MDGs) Outcomes IDA Expects to Influence by FY10
Mainstreaming Governance
Greater transparency and efficiency in the use of public resources - Increase score on WBI Government effectiveness
indicator from 53.8 in 2004 to over 60 in 2009.
Outcome 1: Increase the number of PEFA indicators with a “B” score from 6 in 2005 to 10 in 2009 (including minimum score of “B” on external scrutiny). Outcome 2: Improve quality of public administration CPIA score from 3.5 in 2005 to 4.0 in 2009.
Increasing public sector accountability through decentralization, stronger institutions, and better information - Increase score on WBI voice and accountability indicator
from 51.5 in 2004 to over 58 in 2009. - Increase score on WBI control of corruption indicator
from 43.35 in 2004 to 50.0 in 2009.
Outcome 3: FECL and FDD transfers account for at least 3.0% of total central Government spending in 2009 from 1.5% in 2005. Outcome 4: 2/3 of local Governments have produced administrative and financial accounts on time and auditors have expressed opinions. Outcome 5: The Commission contre la Corruption has examined 70% of the cases received by end-2009. Outcome 6: Results of new household survey analyzed and disseminated by 2009.

34
Country Goals (PRSP/MDGs) Outcomes IDA Expects to Influence by FY10
Strengthening and modernizing the judicial system and mechanisms for private sector governance - Increase score on WBI rule of the law indicator from 47.3
in 2004 to 50.0 in 2009.
Outcome 7: Improve the Doing Business indicator on enforcement of contracts from 485 days in 2005 to less than 300 days (or reduce number of procedures from 33 in 2005 to less than 25 in 2010).
Promoting wealth creation/ Accelerated growth
Promoting a competitive investment climate - Improve by 30% the ranking in the Overall Doing
Business score, compared to the 2005 baseline.
Outcome 1: Reduce by 30% the time and cost (in % of GNI per capita) to (i) register a business; and (ii) register a property, by 2009.
Building and maintaining basic infrastructure for growth (Road, Electricity, Communication) - 60 % of villages have access to road (asphalt or laterite)
by 2010. - Increase electricity coverage of rural areas by 20% of the
population.
Outcome 2: Improve the quality of the core road network in targeted areas by increasing the proportion of roads rated bad to fair by 40% and from fair condition to good by 25%. Outcome 3: Increase number of households with electricity by 30,000 in rural areas, by end 2009.
Facilitating access to financial resources by small and medium-sized enterprises (SMEs)
Outcome 4: Increase number of IDA/IFC partial Credit Guarantees to SMEs to 40 by end 2009.
Promoting a modern and diversified agriculture sector - Share of agriculture in GDP to reach 9.0 % of GDP in
2010 against 8.2% in 2004. - Increase exports of horticulture & non-traditional
Agricultural products to 30,000 tons, from 14,000t in 2005.
Outcome 5: Increase export of cherry tomatoes, mangos, green beans, and melons to 25,000 tons by 2009 from 18,000 tons in 2005. Outcome 6: 2500 hectares of irrigated land developed by 2009.
Promoting sustainable development and management of natural resources - Ratio of forest coverage increase every year from 2005 to
2010.
Outcome 7: 100,000 ha of land sustainability managed in critical areas, like sylvopastoral areas, and the groundnut basin. Outcome 8: Meet 3/4 of household wood fuels needs at the national level through the establishment of sustainable community managed forests.
Developing skilled labor and use of technology - Increase score of WBI knowledge assessment (KAM). - Unemployment rate declines from 16% in 2005 to 13% in
2010.
Outcome 9: Number of vocational training programs funded in partnership with the private sector has reached at least 100 enterprises between 2006 and 2009.
Human development/Shared growth
Improving quality of and access to basic education - Gross enrollment in primary schools increase from 80%
in 2004 to 98% in 2010 (from 77% to 90% for girls).
Outcome 1: Increase success rate in achieving primary level from 53.1% in 2005 to 77% in 2009 (from 51.5% to 73% for girls).
Improving health services provision for women and children - Child mortality rate reaches 45 per 1,000 live births by
2015. - Maternal mortality ratio decline to 380 (per 100,000 live
births) by 2015. - Reduce by one third the malaria death rate in the
population compared to the 2005 baseline.
Outcome 2: Increase the number of assisted births to 70% at national level while ensuring a minimum of 50% in the 5 poorest regions. Outcome 3: Reduction in underweighted malnutrition in children under five by 15% by 2009. Outcome 4: 50% of targeted households use insecticide treated nets by 2009.

35
Country Goals (PRSP/MDGs) Outcomes IDA Expects to Influence by FY10
Improving protection of targeted vulnerable groups - Reduction of persons living in poverty from 57.1% in
2002 to 42 % in 2010 (from 65.2 % to 43% in rural areas).
Outcome 5: At least 80,000 workers in the transportation sector that will benefit from health insurance by 2009. Outcome 6: At least 1,000 disabled will receive yearly health devices through the community based rehabilitation programs.
Maximizing rural and urban synergies
Improving urban mobility and access in and out of Dakar, and promote regional centers
Outcome 1: Travel time between Dakar (Malick Sy) and Pikine is reduced to 20 minutes. Outcome 2: Rehabilitate 2/3 of social infrastructure (health centers, classrooms, roads) affected by the conflict in Casamance.
Reducing vulnerability of immigrant and emigrant groups, with a focus on street children in Dakar - Proportion of working children decline from 36.7% in
2000 to less than 15% in 2010.
Outcome 3: Proportion of working children in Dakar to decline by half by end 2009 compared to 2004.
Improving quality of life through better management of natural resources and access to water and sanitation - Increase access in rural areas to (i) water from 65% of
the population in 2005 to 82% in 2015; and to (ii) sanitation from 191% in 2005 to 59% in 2015.
Outcome 4: Increase access in rural areas to (i) water from 65% of the population in 2005 to 70% in 2009, and to (ii) sanitation from 19% in 2005 to 28% in 2009.
5.46 As a tangible step toward achieving these medium-term outcomes, the proposed CAS recognizes the regional dimension of Senegal’s development as well as the importance of enhancing gender development and building local capacity. Senegal is a key player in West Africa and its economic development will largely influence and be influenced by existing and potential synergies with its neighbors. Several regional operations and analytical works are envisaged in the energy sector, the promotion of the Senegal River area, the road sector with the development of corridors with Mauritania and The Gambia, and social sectors through regional initiatives in health (Malaria, Avian epidemic flu) and education (network of tertiary education and research institutes).
5.47 Success in the development of Senegal will also greatly depend on its capacity to promote women, not only in terms of providing them social protection and equal access to social services (education, health) but also in securing them more and better jobs (Box 5.1).
Box 5.1: Gender Development in the CAS
Gender development is a key element of CAS support in Senegal in various dimensions. First, the WBG will support the authorities in their effort to promote job creation and skill development for women through the implementation of the new national Employment Strategy (through the next CEM and the PRSC series). It will also promote credits to women entrepreneurs and associations, mostly in rural areas, through the IFC/IDA partial guarantees schemes. Second, the Bank assistance in the education and health sectors will include specific activities targeted at women, such as increasing enrollment of girls in primary and secondary schools and improving maternal health. Third, gender equity will be at the center of the agenda aimed at increasing the protection of vulnerable groups through the restructuring and extension of existing social security systems and targeted financial assistance programs.
36
5.48 Last but not least, the focus on capacity building is justified because, in the absence of natural resources, Senegal’s future economic development will be shaped by the quality of its labor force and entrepreneurs (training, education, knowledge dissemination) as well as the effectiveness of its public administration (civil service reform, strengthening institutions, decentralization, etc.). This focus is envisioned in the following four dimensions: (i) development of human resources that cut across several areas (e.g., education programs and vocational training as supported in the Education for All II project and the PRSC program); (ii) enhancement of specific skilled occupations (doctors, nurses, teachers, farmers, etc.) through ongoing and planned projects in the these sectors, the use of Trust Funds, and targeted AAA work; (iii) support to capacity building on governance issues including the justice sector (through the planned Judicial Governance Project) and institutions recently built to enhance transparency in both the public and the private sectors (such as the Cour des comptes, the Commission against corruption, and the institutions responsible for the implementation of the new procurement Code); and (iv) support to local Governments through the ongoing and planned CDD operations.
C. DELIVERY OF THE BANK’S ASSISTANCE PROGRAM
5.49 The proposed CAS will aim at maximizing the impact of the WBG’s assistance in Senegal through: (i) the use of various financial instruments such as budget support, single investment projects, and community driven development initiatives; (ii) maximizing synergies within the WBG; and (iii) leveraging financial resources beyond the country allocation through partnerships and donor coordination.
5.50 Modalities and lending instruments. The WBG will use various mechanisms to deliver its program of assistance. Such a diversification is consistent with the objective of increasing mutual accountability and aligning disbursement procedures with national systems. It is also effective in enhancing cross-sector externalities in areas such as budgetary and financial reforms, decentralization, and the protection of vulnerable groups. It is also key for improving the performance of social sectors, which are highly dependent on factors that are not under their direct control (for example, health-related issues in urban areas are related to the lack of access to sanitation and water, which are partly the result of high immigration rates).
5.51 The WBG will continue to deliver investment projects for a variety of reasons. First, in spite of recent progress and the central place given by the WBG to the improvement of the Government’s budgetary procedures, severe weaknesses remain, most notably in terms of procurement and ex-post controls. This explains the continued use of implementation units, with the view to gradually phasing them out. Second, investment operations are often considered as more effective in financing infrastructure work (e.g., roads and energy) and in providing technical support at the sectoral and local levels (e.g., justice and education). The Bank’s portfolio will also rely on CDD-type operations, which aim at increasing empowerment of local communities and final beneficiaries, and strengthening the decentralization process.
5.52 To increase further the effectiveness of Bank support, output-based approaches are being piloted in the water and the rural electricity sectors. These will be evaluated during the CAS preparation process and, based on their results, will be extended to other activities.
37
5.53 Synergy within the WBG. Following the recent trend, IFC/IDA joint projects will continue to be privileged, notably in the areas of infrastructure (energy and roads) and access to finance. Reliance on alternative financial instruments will also reinforce the coordination within the WBG since most these instruments are expected to be provided by IFC and MIGA, under the form of guarantees or facilities. MIGA can mitigate perceived political risks of private sector projects, and work directly with investment-promotion agencies, as it did with APIX during the previous CAS period, to develop PPPs and increase FDI flows. Extensive collaboration with IFC, which provides financing to the private sector and advisory services to Government and private operators, including SMEs, will enable the Bank to increase its private sector development impact. Such synergies will be developed through the following examples: (i) IFC program of partial guaranty on banks bond issuance with local banks to provide medium-term funding for on lending to SMEs; (ii) MIGA Small Investment Program (SIP) provides guarantees against risks of expropriation, war and civil disturbances, transfers and inconvertibility; and (iii) MIGA West African Development Bank (BOAD) facility for small infrastructure projects.
5.54 Partnerships and donor coordination. Because of its strategic role, and its good development outcomes, Senegal’s development program has benefited from large foreign aid support. Most bilateral and multilateral development agencies have an active presence in Senegal, with the Bank, the European Union, France and the United States being the largest contributors. Considerable progress has been made in recent years in harmonizing development assistance in Senegal. These harmonization efforts are consistent with the principles articulated in the Paris Declaration on Aid Effectiveness and in the AAP. It has led to a close collaboration in the design of budget support operations, including the Bank’s PRSC. Further coordination is expected through the adoption of a Memorandum of Understanding (MOU), setting up common evaluation processes on the macroeconomic conditions, the PRSP progress, and public sector management reforms. At the sectoral level, an explicit effort was made by the Bank’s to foster joint projects with other donors in the infrastructure and urban renewal, the rural sector operations and the Education SWAP. At the end of 2005, 8 out of 16 of IDA-supported investment projects were co-financed with other donors, which is much higher than the average in Senegal (one out of four projects).
5.55 Nevertheless, as described in Annex 7, progress still needs to be made on several fronts, including better coordination among donors that should lead to a reduction in the number of projects and improved alignment with respect to PRSP priorities. For example, the protection of vulnerable groups (PRSP third pillar) only benefited from marginal attention from donors. There is also a need to share information on current and future projects to improve the predictability of aid flows over time and maximize complementarities between donors and the Government as well as among donors. Seeking partnerships will be at the center of the Bank’s agenda over the next few years. As part of the implementing the Paris Declaration agenda (of which Senegal has been chosen as a pilot country), consultations within the donor community have been launched on a formalized framework for Government-donor co-operation, including joint analytical work.
5.56 Promoting partnerships with the Government and local research groups will be encouraged by the Bank’s program to facilitate ownership, sustainability, and dissemination of knowledge.

38
D. LENDING AND THE AAA SUPPORT PROGRAM
5.57 The CAS proposes a lending program which will aim to optimize the WBG’s assistance given government priorities and donor collaboration (Table 5.2). The program is based on a total envelope of IDA resources of US$420 million over the four-year CAS period or an average of US$105 million a year. Given that IDA-15 resources are yet to be determined, it is assumed for simplicity, that the level of IDA resources during the IDA-15 period will correspond to the level under IDA-14. Actual allocations during the CAS period will be determined on an annual basis and will depend on: (i) total IDA resources available; (ii) the country’s performance rating31; (iii) the performance of other IDA borrowers; (iv) the number of IDA-eligible countries; and (v) terms of financial assistance (grants or credits).
5.58 The IDA financing over the CAS period will be constrained, partly as the result of the recent multilateral debt reduction initiative (MDRI),32 justifying the search for alternative channels to help increase the financial impact of the WBG lending program. The first channel, as explained earlier, will be to conceive Bank projects in a way that systematically maximizes scope for parallel or co-financing with donors as well as private participation, especially in the infrastructure sector, including under the innovative toll-road project, and for IPPs. The second channel will be to explore the possibility to access additional funding in FY08 through scale up initiatives in the Africa region..
5.59 The proposed lending program aims at balancing the WBG’s assistance across the three key pillars and the governance filter. Support to the three CAS pillars is aggregated in Figure 5.1, based on the existing portfolio of operations and a tentative lending program for FY07-FY10. It shows that the Bank’s portfolio will be equally divided between pillars I and III (with a share of 44 percent and 40 percent of total lending respectively), while pillar II will receive about 16 percent of the Bank’s assistance over the CAS period. This allocation reflects the capital-intensive infrastructure projects in the urban infrastructure, energy and water sectors and not a bias against human development and shared growth. It also takes into account (i) the growing Government’s financial involvement in human development; almost half of the budget is now allocated to social sectors, and (ii) the constructive dialogue to improve the efficiency of these expenditures. The WBG will continue to actively support the education and health sectors and plans to be increasingly involved in the protection of vulnerable groups through its budgetary support and community driven initiatives.
5.60 The FY07 lending program includes PRSC-III and investment projects to support infrastructure, decentralization, and social sectors. PRSC-III will continue to provide support to five main priorities of the PRSP: (i) budgetary reforms; (ii) decentralization; (iii) health sector; (iv) wealth creation with a focus on the labor market and reform of the judiciary sector; and (v) the protection of vulnerable groups. The second phase of Quality Education for All II and the
31 IDA country allocations are based on the country performance ratings (CPR), which is based on CPIA ratings, country portfolio ratings, and governance indicators. 32 While Senegal benefited from debt relief under the MDRI, this initiative has reduced the IDA envelope by about US$20 million per annum. A second factor that limits financing in FY08 is that IDA resources were significantly frontloaded in FY06 and FY07 to finance operations that had been planned under the last year of IDA13 (FY05) but could not be funded due to resource constraints that year.
39
Local Authorities Development Program II have been launched. A nutrition enhancement project includes support to the regional Malaria Booster.
5.61 In FY08, the lending program will be limited due to (i) the strategic choice of front-loading the Bank’s IDA 14 program in FY06 and FY07; and (ii) lower than anticipated IDA 14 resources as the result of the MDR Initiative. The Africa Action Plan stresses the importance of leveraging other sources of financing. In that context, funding of the Diamniadio-Dakar highway project will be sought, including possibly through the catalytic fund (together with an IFC guarantee of about US$30 million). Funding for the Energy Sector Rocovery operation will depend on continuing strong performance and availability of additional IDA resources in FY08. In the absence of such additional resources, the FY08 lending program would be adjusted accordingly and no lending would be possible in that year.
5.62 In FY09 and FY10, Bank assistance will include the start of the second PRSC series, which is expected to become the key WBG’s instrument to sustain human development in Senegal, including the protection of vulnerable groups. In parallel, a lending operation should be launched to support the Accelerated Growth Strategy, following the closing of ongoing projects (PIPP and PSAC). The alternative option would be to include such a support in the PRSC program and thus consolidate the Bank’s portfolio in Senegal. This strategic choice will be made following the first result of the implementation of the AGS and the finalization of the Bank’s analytical work to be carried out in the CEM (early FY08) and the Technical Assistance provided by MIGA and IFC. The Bank will support the enhancement of governance in Senegal, by a sectoral support to the justice sector which will help build capacity and the development of infrastructure with planned projects in the electricity and sustainable energy, water, and transportation sectors. These projects will seek to support the authorities in their efforts to improve access to better infrastructure, especially in rural areas, and to achieve the geographical diversification of economic activities outside of the Dakar area. The second phase of the Urban Mobility Improvement II, to be launched in FY09, will help improve urban mobility and living conditions in Dakar. A number of regional operations would also be prepared aimed at promoting transportation and integration between Senegal and its neighboring countries.
5.63 Non lending program. The CAS includes a core program of AAA aimed at supporting the Government’s vision as well as optimizing the WBG’s support over time. The Bank’s Economic and Sectoral Work (ESW) is expected to be focused on three mains issues: (i) labor market and productivity (including education and vocational training); (ii) protection of vulnerable groups (notably youth and street children and in rural areas such as in the groundnut basin); and (iii) fiscal policies, expenditure efficiency, and civil service reforms. In collaboration with IFC and WBI, other analytical studies are expected to be carried out on the development of the knowledge economy, the regional housing finance market, and a review of the fiscal regime of financial operations.

40
Table 5.2: Proposed World Bank Group Program FY07 FY08 FY09 FY10 LENDING Operations US$ Operations US$ Operations US$ Operations US$
PRSC III 20 Dakar-Diamniadio Toll Road. *
PRSC IV/ Accelerated Growth Support 60 PRSC-V 30
Nutrition Enhancement II 15 Energy Sector Recovery DPL (choice of lending instrument not finalized) *
Sustainable Partnership Energy management (PRODEGE II) 10
Water & sanitation Millennium Project 60
Quality Education for All II 30 GEF SLM PSAOPs supplemental Mauritania-Senegal-The Gambia Integration Project 20
Electricity Services for rural Areas II 30
Local Authorities Development Program 80
Urban Mobility Improvement II/Transport III 50 Regional Biosafety Project TBD
Regional WAAP 5 GEF Regional Strategic Fisheries Partnership for Africa -
Senegal River Multimodal Navigation Project TBD
GEF GIRMaC supplemental Judicial Governance 10
TOTAL 150 * 150 120
NON LENDING
Country Environmental Analysis Country Economic Memorandum ESW on Financing of SMEs (in rural areas)
Toward Private-Sector Led Growth (Mid-term Assessment of the Accelerated Growth Strategy)
Transport and Infrastructure Study Investment Climate Assessment Poverty Assessment PER Note
PEFA Health Financing and effectiveness of public spending PER note PEFA update
Poverty Update PER (Civil Service Reform) CAS Progress Report
MIGA Small infrastructure project Employment Strategy Note MIGA MIGA TA with FIAS and PEP Africa program MIGA MIGA TA
WBI Knowledge Assessment MIGA MIGA TA with FIAS and PEP Africa program WBI MIGA small infrastructure project MIGA
MIGA small infrastructure project
MIGA MIGA TA with FIAS and PEP Africa program MIGA MIGA small infrastructure project WBI PPP course WBI WBI PPP course
WBI PPP training WBI PPP training WBI WBI health capacity building WBI health capacity building
WBI Health capacity building WBI Health capacity building WBI parliamentary strengthening WBI WBI parliamentary strengthening
WBI Parliamentary strengthening WBI Parliamentary strengthening Education: The way forward
IFC ROSC private governance (IFC) ESSD TF
Study on street children/school dropouts
ESSD TF Study on non farm employment ESSD TF Study on crop insur. schemes *Dakar-Diamniadio Toll Road (50); Energy Sector Recovery DPL (50) - (Funding sources not yet determined (see para. 5.61)

41
Table 5.3: Senegal in comparison of other Sub-Saharan Africa countries 2005 CPIA scores
Senegal Sub-Saharan Africa
Macroeconomic management 4.5 3.6
Fiscal policy 4.0 3.3
Debt policy 4.0 3.2 A. Economic management 4.2 3.4 Trade 4.5 3.6 Financial sector 3.5 3.1 Business regulatory environment 3.5 3.2 B. Structural policy 3.8 3.3 Gender equality 3.5 3.3 Equity of public resource use 3.5 3.2 Building human resources 3.5 3.2 Social protection & labor 3.0 3.0 Policy and institutions for environmental sustainability 3.5 3.2 C. Policy .for social inclusion/equity 3.4 3.2 Property rights & governance 3.5 2.9 Quality of budgetary & financial management 3.5 3.1 Efficiency of revenue mobilization 4.5 3.5 Quality of public administration 3.5 3.0 Transparency, accountability & corruption in public sector 3.0 2.9 D. Public sector management and institutions 3.6 3.1 Overall CPIA 3.8 3.2
5.64 Efforts at mobilizing extra funding for ESW through Trust Fund and collaborative efforts with other donors will intensify over the CAS period. A series of interagency reports on vulnerable groups and youth employment is planned in FY07. In addition, the Norwegian ESSD Trust Fund should help finance new studies on vulnerable groups and systematic risks in the groundnut basin. The forthcoming Public Expenditure Financial Assessment (PEFA) should be carried out by all donors providing budgetary support.
5.65 An explicit effort will be made to increase local ownership and dissemination of knowledge in Senegal. Training provided by WBI will continue in the following areas: (i) high level policy seminar to mobilize leaders around critical issues and share international experience; (ii) parliamentary strengthening; (iii) regulation and public-private partnerships in infrastructure. Partnerships with local institutions will be encouraged along the lines of the joint collaboration between WBI and the Centre d’Etudes en Politique de Développement (CEPOD). The recent MOU signed between the World Bank and the Regional Training Institutions in Financial Management (CESAG) should help disseminate best practices in financial and human resources management to public administration both at the central and local levels.
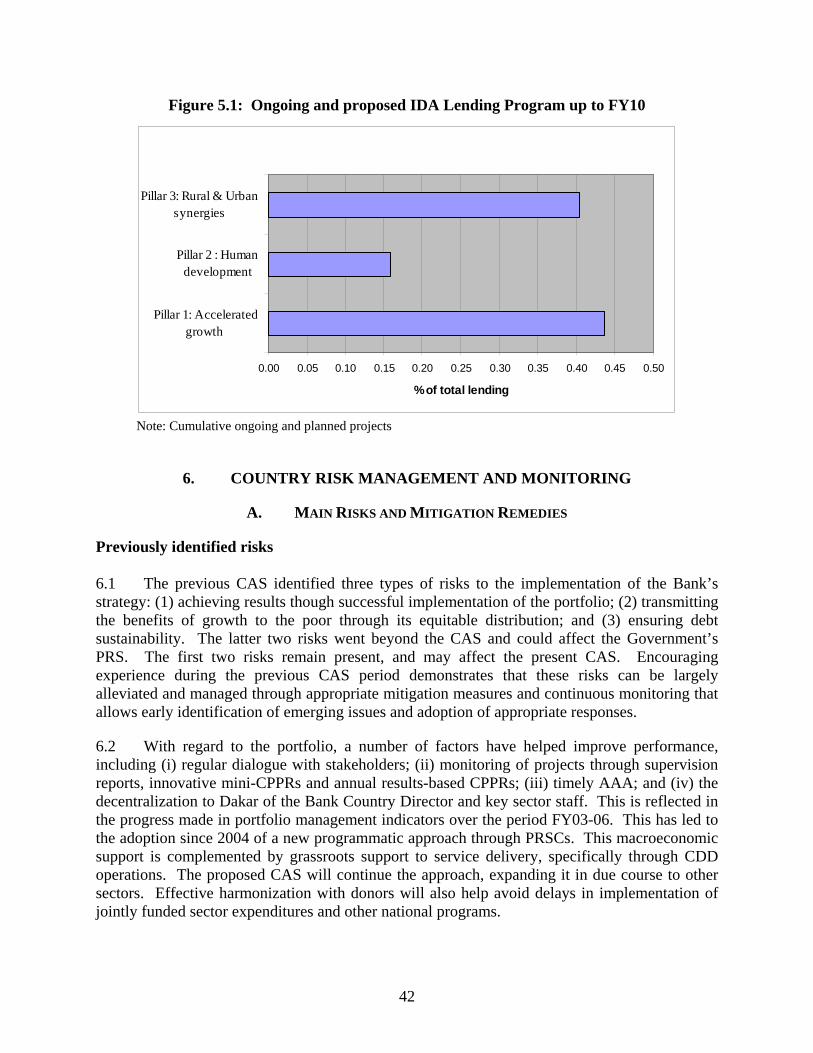
42
Figure 5.1: Ongoing and proposed IDA Lending Program up to FY10
0.00 0.05 0.10 0.15 0.20 0.25 0.30 0.35 0.40 0.45 0.50
Pillar 1: Acceleratedgrowth
Pillar 2 : Humandevelopment
Pillar 3: Rural & Urbansynergies
% of total lending
Note: Cumulative ongoing and planned projects
6. COUNTRY RISK MANAGEMENT AND MONITORING
A. MAIN RISKS AND MITIGATION REMEDIES
Previously identified risks 6.1 The previous CAS identified three types of risks to the implementation of the Bank’s strategy: (1) achieving results though successful implementation of the portfolio; (2) transmitting the benefits of growth to the poor through its equitable distribution; and (3) ensuring debt sustainability. The latter two risks went beyond the CAS and could affect the Government’s PRS. The first two risks remain present, and may affect the present CAS. Encouraging experience during the previous CAS period demonstrates that these risks can be largely alleviated and managed through appropriate mitigation measures and continuous monitoring that allows early identification of emerging issues and adoption of appropriate responses.
6.2 With regard to the portfolio, a number of factors have helped improve performance, including (i) regular dialogue with stakeholders; (ii) monitoring of projects through supervision reports, innovative mini-CPPRs and annual results-based CPPRs; (iii) timely AAA; and (iv) the decentralization to Dakar of the Bank Country Director and key sector staff. This is reflected in the progress made in portfolio management indicators over the period FY03-06. This has led to the adoption since 2004 of a new programmatic approach through PRSCs. This macroeconomic support is complemented by grassroots support to service delivery, specifically through CDD operations. The proposed CAS will continue the approach, expanding it in due course to other sectors. Effective harmonization with donors will also help avoid delays in implementation of jointly funded sector expenditures and other national programs.

43
6.3 Poverty studies that became available after the completion of the previous CAS indicate that the degree of poverty reduction was greater than had been estimated, but with greater impact on the urban population than on the rural one. Nevertheless poverty in Senegal remains high and there is no room for complacency if the poverty MDG is to be attained. Bank support of the growth agenda under the previous CAS constitutes an appropriate response, and benefits from added emphasis under the new PRS and the proposed CAS. In addition, there have been notable efforts to reinforce the impact of public expenditures on the poor, notably through fiscal decentralization and enhanced social protection, which will be sustained and deepened under the proposed new WBG program.
6.4 The debt sustainability risk has been reduced to negligible levels. Having reached the HIPC Completion Point in April 2004, Senegal now benefits from MDRI and enjoys a significant fiscal space that has led to the financing of core programs without excessive reliance on foreign borrowing. Moreover fiscal expansion, mainly large infrastructure projects in the Public Investment Program, are being financed through own resources, the private sector, and grant and concessional financing. Future debt service is projected to remain low and at sustainable levels.
Emerging Risks
6.5 There are several possible risks associated with the implementation of the CAS and the Government’s PRSP and AGS, which can be grouped into three main categories: (i) governance and resistance to policy reforms from vested interests; (ii) vulnerability to political, economic, and other internal or external shocks, and volatility of donor support; and (iii) insufficient capacity to implement reforms and sustain growth.
6.6 The challenges of improving governance. Vested interests and rent-seekers have formed significant obstacles to reforms in the past. Recent presidential and forthcoming legislatives elections in the country have reinforced this tendency, as policymakers have been more interested in their political survival than in implementing the longer-term economic reform agenda. Influential groups have thus undermined policies, notably in the energy sector and parastatals such as ICS, leading to a financial crisis in these two sectors and affecting the size of the overall public (and quasi-public) deficit. Funding of political parties and election-related expenditures have been longstanding unresolved issues in democratic nations, rich and poor. The mitigating factors in place include parliamentary oversight over public expenditures and stricter observation of procurement rules. The application of the Building-Operation-Transfers (BOT) law also provides a transparent framework for private-public partnership.
6.7 Encouragingly, experience has shown that the first part of the mandate of a new administration, much of the CAS period, provides a good opportunity for bold reforms in both policy and governance areas. The many dimensions of governance range from public finance management issues to enabling a good investment climate through public accountability and the ability of the judicial system to empower its citizens, by enforcing the rights and deliver fair and consistent judgments. Based on ongoing dialogue in these areas, the proposed CAS supports improved transparency and governance in Senegal by mainstreaming these issues in Bank projects and programs, notably as a centerpiece for the PRSC. Improved monitoring and evaluation systems ensure that the goals are being attained over time.
44
6.8 Vulnerability to internal and external shocks. Thanks to the robustness of regional monetary arrangements, the relatively comfortable fiscal situation, and Senegal’s other geographic and other advantages, the risk of significant macroeconomic slippage in the form of unsustainable inflation or sustained negative growth is minimal. There is the more insidious risk of stalled growth and/or vulnerability to natural disasters and external shocks, such as the 2002 drought when GDP growth declined to 1.1 percent, the locust invasion in 2004, continued oil price increases, the recent flood in the Dakar region (August 2005), and the possible avian flu pandemic. The Government and donors have been able to respond through the funding of remedial actions. While volatility of donor support could also have a negative impact, this risk is not considered significant and is largely mitigated by MDRI.
6.9 An internal risk concerns lack of economic diversity. The limited formal private sector also increases the vulnerability of the Senegalese economy to terms-of-trade shock. The CAS has placed an emphasis on channels aimed at reducing this risk by providing assistance to the agricultural sector and vulnerable groups that are the most exposed to these natural shocks. It also puts a major emphasis on enabling private sector-led growth.
6.10 Senegal is vulnerable to regional instability. In Casamance, with a minority of rebel groups still not signatory to the peace accord, military action picked up in March/April 2006. Nevertheless, the Government remains committed to seeking political and economic solutions. Political instability in neighboring countries has and is likely to continue to affect the economy. There is also a risk associated with deterioration in regional policies on key areas such as trade policy, infrastructure projects, and financial and competition policies. Senegal’s progress will depend on sustainable progress in these areas because of the limited size of its local market and significant economic regional externalities within WAEMU and ECOWAS. To this effect, the CAS supports further regional integration.
6.11 Capacity constraints. Achieving the CAS and PRS objectives could become more difficult as a result of insufficient administrative capacity in Senegal, shortages of skills and slow program implementation. This risk is highest at the sectoral level and in local Governments, even though the authorities have been allocating more resources to this objective, especially in their new PRS. To mitigate this risk, the WBG33 and other donors have increasingly given more attention to this issue by consolidating their strategy toward local communities and providing direct support to key sectors such as education, health, and governance. Pay and civil service reform would also help in the retention of expertise.
B. PERFORMANCE MONITORING & EVALUATION
6.12 The measurement of results is an essential component of improved mutual accountability and mitigated risks. The WBG will primarily depend on three complementary channels to monitor CAS progress over time.
6.13 The first channel is to use the current PRSP institutional framework for the compilation and verification of results and milestones. This framework is built around four working groups representing the main actors operating in Senegal: (i) central Government
33 Most recently in the context of work on the capacity pillar of the AAP.

45
ministries and agencies; (ii) local governments; (iii) civil society and the private sector; and (iv) donors. These four groups are coordinated by the PRSP unit, which report to both a technical Committee chaired by the Minister of Economy and Finance and an Interministerial Committee chaired by the Prime Minister. This framework has been operating for the past two years, fueling the design and preparation of the new PRSP. The WBG has played a central role in co-chairing the donors’ working group.
6.14 The second channel is to continue to review the Bank’s portfolio on a quarterly basis, in close collaboration with the authorities and implementing agencies, to identify current constraints and future issues. Such reviews are one of the reasons explaining higher disbursements ratios over the past few years, as pointed out in the CAS Completion Report (Annex 2). Once a year, those reviews will be complemented by a more detailed evaluation exercise of the Bank’s portfolio, including with the participation of major stakeholders operating in Senegal.
6.15 The third channel is to closely monitor the results framework proposed in Annex 1 in the areas supported by the CAS. A set of intermediary indicators or milestones has been identified that should help evaluate progress over time, including the CAS progress report scheduled for early FY09. This monitoring will be reinforced by the series of AAA defined in Table 5.2.
7. CONCLUDING REMARKS
7.1 The next four years will be critical for Senegal. The country has made significant progress by achieving political and macroeconomic stability, maintaining a strong fiscal position, and defining a clear medium-term vision in its PRSP strategy. The next step for Senegal will be to reach the level of emerging countries by taking full advantage of its institutions and people. This will require a sustained effort in man-made areas such as governance, Government efficacy, ease in doing business, and the inclusion of vulnerable groups to ensure that growth is shared over time. The WBG will continue to provide full support for Senegal’s efforts to these ends.

46
ANNEXES

47
Annex 1: Results-Oriented CAS Matrix Country Goals (PRSP/MDGs)
Issues that Hinder Development of Desired Outcomes
Outcomes IDA Expects to Influence by FY10
Intermediate Outcomes
WBG instruments
Main Partners
Filter: Mainstreaming Governance - Limited capacity to
prepare and execute budgets in a transparent and timely manner
- Limited checks and balances due to weaknesses in the legislative and judiciary powers
Outcome 1: Increase the number of PEFA indicators with a “B” score from 6 in 2005 to 10 in 2009 (including minimum score of “B” on external scrutiny)
- Prepare budget on a programmatic basis (MTEF) in 8 key Ministries by end-2008
- Parliamentary Public Accounts and Budget Committee provide regular updates to Parliament on budget implementation by 2008
- Supreme Audit Institution issues opinion on State Accounts (1998-05) and conformity of Administrative Accounts with State Accounts according to WAEMU regulations by 2008
Greater efficiency and transparency in the use of public resources Increase score on WBI Government effectiveness indicator from 53.8 in 2004 to over 60 in 2009
- Low labor productivity of public employees because (i) complex and inappropriate payment mechanisms; (ii) lack of training; and (iii) lack of financial incentives
- Lack of a consistent M&E system
Outcome 2: Improve quality of public administration CPIA score from 3.5 in 2005 to 4.0 in 2009
- Performance-based incentive regime piloted in finance, education and health ministries by 2008
- Govt. employees receive paychecks under new payroll system in 2008
Ongoing lending: PRSC-II Planned lending: PRSCs III, IV and V MDTF IDF grant Ongoing AAA: CFAA/CPAR PER Planned AAA: PEFA PER
France, Netherlands, Canada, European Union, IMF; France, Netherlands, Canada, European Union, IMF

48
Country Goals (PRSP/MDGs)
Issues that Hinder Development of Desired Outcomes
Outcomes IDA Expects to Influence by FY10
Intermediate Outcomes
WBG instruments
Main Partners
- Limited capacity of local government to deliver basic services due to (i) slow pace of decentralization; (ii) inadequate transfer of resources; and (iii) constrained empowerment of local communities
Outcome 3: FECL and FDD transfers to account for at least 3.0% of total central Government spending in 2009 from 1.5% in 2005 Outcome 4: 2/3 of local governments have produced administrative and financial accounts on time and auditors have expressed opinions
- At least 20% of BCI resources for health, and education transferred to local govt. by 2008 (against 5% in 2006)
- New rules adopted for FECL and FDD transfers
- 1/3 of local governments have produced administrative and financial accounts on time and auditors have expressed opinions
- Lack of political commitment to independence of regulatory bodies and implementation agencies involving civil society
Outcome 5: The Commission contre la Corruption has examined 70% of the cases received by end-2009
- The Infrastructure Council has examined all PPPs in conformity with the BOT law by end-2008
- Audit reports on procurements have been published for the period 2003 2005 by 2008
Increasing public sector accountability through decentralization, stronger institutions, and better information Increase score on WBI voice and accountability indicator from 51.5 in 2004 to over58 in 2009 Increase score on WBI control of corruption indicator from 43.35 in 2004 to 50.0 in 2009 - Underdeveloped
communication & information strategy Poor coordination
- Capacity to collect & analyze survey data weak
Outcome 6: Results of new household survey analyzed and disseminated by 2009
- The Office national de la statistique is fully operational and a new household survey has been launched by end-2007
Ongoing lending: PDLP PRSC II Participatory Local Development Program Planned lending PRSC III,IV and V Local Authorities Development Programs Judicial Governance Current AAA Outreach program Planned AAA: PEFA Outreach program
France, Netherlands, Canada, European Union, IMF, Germany, UNDP
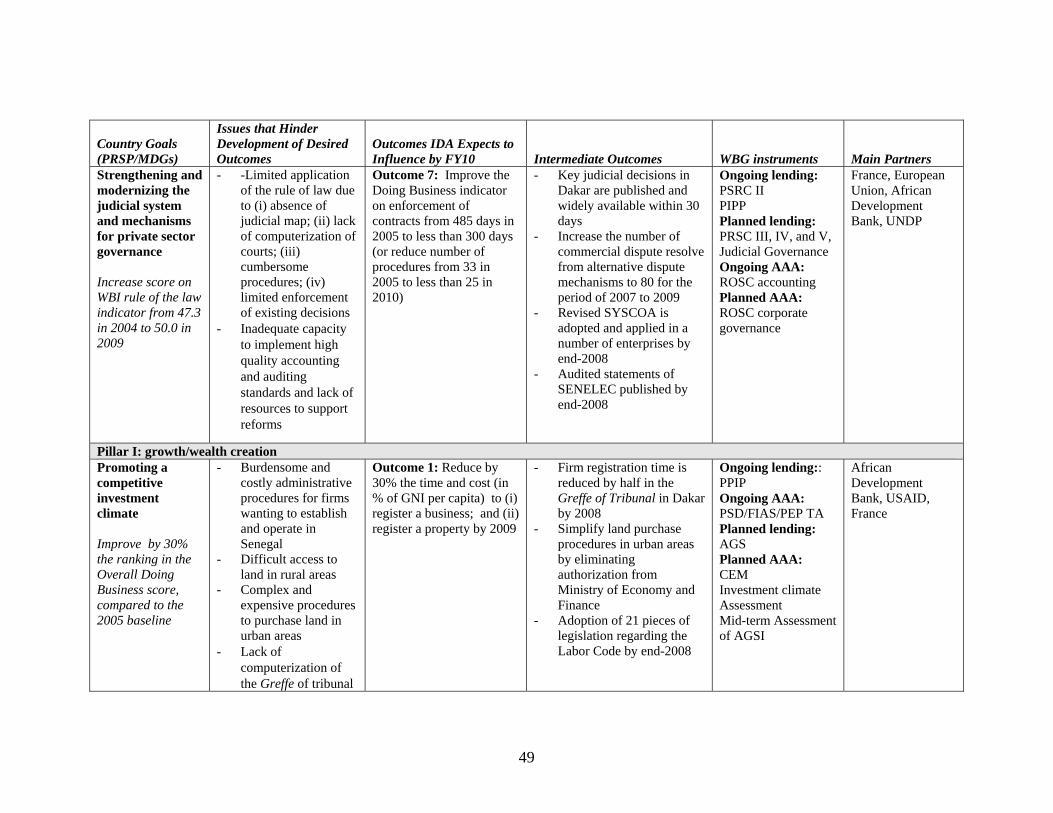
49
Country Goals (PRSP/MDGs)
Issues that Hinder Development of Desired Outcomes
Outcomes IDA Expects to Influence by FY10
Intermediate Outcomes
WBG instruments
Main Partners
Strengthening and modernizing the judicial system and mechanisms for private sector governance Increase score on WBI rule of the law indicator from 47.3 in 2004 to 50.0 in 2009
- -Limited application of the rule of law due to (i) absence of judicial map; (ii) lack of computerization of courts; (iii) cumbersome procedures; (iv) limited enforcement of existing decisions
- Inadequate capacity to implement high quality accounting and auditing standards and lack of resources to support reforms
Outcome 7: Improve the Doing Business indicator on enforcement of contracts from 485 days in 2005 to less than 300 days (or reduce number of procedures from 33 in 2005 to less than 25 in 2010)
- Key judicial decisions in Dakar are published and widely available within 30 days
- Increase the number of commercial dispute resolve from alternative dispute mechanisms to 80 for the period of 2007 to 2009
- Revised SYSCOA is adopted and applied in a number of enterprises by end-2008
- Audited statements of SENELEC published by end-2008
Ongoing lending: PSRC II PIPP Planned lending: PRSC III, IV, and V, Judicial Governance Ongoing AAA: ROSC accounting Planned AAA: ROSC corporate governance
France, European Union, African Development Bank, UNDP
Pillar I: growth/wealth creation Promoting a competitive investment climate Improve by 30% the ranking in the Overall Doing Business score, compared to the 2005 baseline
- Burdensome and costly administrative procedures for firms wanting to establish and operate in Senegal
- Difficult access to land in rural areas
- Complex and expensive procedures to purchase land in urban areas
- Lack of computerization of the Greffe of tribunal
Outcome 1: Reduce by 30% the time and cost (in % of GNI per capita) to (i) register a business; and (ii) register a property by 2009
- Firm registration time is reduced by half in the Greffe of Tribunal in Dakar by 2008
- Simplify land purchase procedures in urban areas by eliminating authorization from Ministry of Economy and Finance
- Adoption of 21 pieces of legislation regarding the Labor Code by end-2008
Ongoing lending:: PPIP Ongoing AAA: PSD/FIAS/PEP TA Planned lending: AGS Planned AAA: CEM Investment climate Assessment Mid-term Assessment of AGSI
African Development Bank, USAID, France

50
Country Goals (PRSP/MDGs)
Issues that Hinder Development of Desired Outcomes
Outcomes IDA Expects to Influence by FY10
Intermediate Outcomes
WBG instruments
Main Partners
- Lack of flexibility of labor markets
- Insufficient budgetary allocations for road maintenance and lack of clear institutional funding arrangements
- Lack of coordination and harmonization between central and local Governments
- Weak implementation of rural transportation strategy
Outcome 2: Improve the quality of the core road network in targeted areas by increasing the proportion of roads rated bad to fair by 40% and from fair condition to good by 25%
- The 2nd Generation Road Fund reaches CFAF 20 billion and is executed at 95% in 2008
Ongoing lending: Transports SIL-2 Urban Mobility Improvement : Planned lending: Transports III PAMU II Ongoing AAA: ICA
France, European Union, Japan
Building and maintaining basic infrastructure for growth (roads, electricity, communications) 60 % of villages have access to road (asphalt or laterite) by 2010 Increase electricity coverage in rural areas by 20%, of the population
- Lack of clarity on corporate restructuring of SENELEC
- Weak application of pricing, regulations
- Growing gap between supply and demand for electricity
- Poor coverage in rural areas
Outcome 3: Increase number of households with electricity by 30,000 in rural areas, by end-2009
- Increase number of households with electricity by 20,000 in rural areas, by June 2008
Ongoing Lending: Electricity Services for Rural Areas 1 Electricity Sector Efficiency Enhancement project IFC Kounoune I Planned Lending: Electricity services for rural areas–APL2
France, African Development Bank, BOAD, Islamic Development Bank, Germany
Facilitating access to financial resources by small and medium-sized enterprises (SMEs)
- Lack of access to financial services and credit by SMEs in rural areas
- Lack of audited financial statements
Outcome 4: Increase number of IDA/IFC partial Credit Guarantees to SMEs to 40 by end 2009
- Increase number of IDA/IFC Partial Credit Guarantees to SMEs to 10 by Dec. 07
- Increase the number of beneficiaries of the
Ongoing lending: PIPP Agricultural Services and Producers Organizations (PSAOP2)
African Development Bank, Germany, France

51
Country Goals (PRSP/MDGs)
Issues that Hinder Development of Desired Outcomes
Outcomes IDA Expects to Influence by FY10
Intermediate Outcomes
WBG instruments
Main Partners
by SME to allow access to credit
- Gender-based obstacles to growth and entrepreneurship
matching grant made under the PPIP for improving the financial reporting of SMEs by 120 by December 2008
Planned lending: AGS Planned AAA Investment Climate Assessment ESW on financing of SMEs
Promoting a modern and diversified agriculture sector Share of agriculture in GDP to reach 9.0 % of GDP in 2010 versus 8.2% in 2004 Increase exports of horticulture & non-traditional agricultural products to 30,000 tons, from 14,000t in 2005
- Insufficient diversification of production and exports
- Poor development of Irrigation (4% of cultivated areas)
- Unsustainable land management practices limit productivity in the groundnut basin
Outcome 5: Increase exports of cherry tomatoes, mangos, green beans, and melons to 25,000 tons by 2009 from 18,000 tons in 2005 Outcome 6: 2,500 hectares of irrigated land developed by 2009
- Increase exports of cherry tomatoes, mangos, green beans, and melons to 22,000 tons by 2008 from 18,000 tons in 2005
- 1,500 hectares of land irrigated in three regions by 2008
Ongoing lending: Agricultural Services and Producer Organizations (PSAOP2) Agricultural Markets and Agribusiness Development Participatory Local Development Program Senegal River project Planned Lending: Regional WAAP Regional Biosecurity Project
European Union, France, IFAD, African Development Bank

52
Country Goals (PRSP/MDGs)
Issues that Hinder Development of Desired Outcomes
Outcomes IDA Expects to Influence by FY10
Intermediate Outcomes
WBG instruments
Main Partners
- Unregulated access to fish resources by artisanal fishermen
- Destruction of critical spawning and nursery grounds for fish stocks
Establishment of 10 new marine protected areas by 2008
- Effectiveness of biodiversity management improved in the 3 pilot areas supported by GIRMaC by 20 percent in 2008, with the active participation of stakeholders
Ongoing lending: GIRMaC Planned lending: GEF Strategic Fisheries Management supplemental to GIRMaC GEF strategic fisheries partnership Ongoing AAA Country Environmental Analysis
GEF, European Union, France, Netherlands, USAID, African Development Bank, Switzerland, Spain,
- Lack of integrated ecosystem management in Senegal River delta, sylvopastoral areas, and the groundnut basin
- Inappropriate incentive mix drives unsustainable land management
Outcome 7: 100,000 ha of land sustainably managed in priority areas, like sylvo-pastoral zones and the groundnut basin
- 20,000 hectares of land with pilot sustainable management system in place in sylvo-pastoral zones, and the groundnut basin by 2008
Ongoing lending: PSAOP Planned lending: GEF/SLM supplemental to PSAOP Ongoing AAA Country Environmental Analysis
GEF, Netherlands, France, TerrAfrica African Development Bank, European Union, Norway, UNCCD, UNEP, IFAD
Promoting sustainable development and management of natural resources Ratio of forest coverage to increase every year from 2005 to 2010
- Lack of sustainable energy sources due to (i) continuation of the quotas system by govt. (ii) limited labor in target zones; and (iii) charcoal price does not reflect the real cost of
Outcome 8: Meet 3/4 of household wood fuels needs at the national level through the establishment of sustainable community managed forests
- Establish sustainable community forest mgmt. on 262,000 ha with supplying capacity of 256,000 tons per year of sustainable wood fuels by end 2007
- -Create two biodiversity community reserves in
Planned lending: Regional Biodiversity Project PROGEDE II. Planned AAA Country Environmental Analysis
GEF Netherlands

53
Country Goals (PRSP/MDGs)
Issues that Hinder Development of Desired Outcomes
Outcomes IDA Expects to Influence by FY10
Intermediate Outcomes
WBG instruments
Main Partners
forest management
Kédougou and Tambacounda by end 2008
Developing skilled labor and use of technology Increase score of WBI knowledge assessment (KAM) Unemployment rate declines from 16% in 2005 to 13% in 2010
- Lack of capability to adapt, adopt and manage technological change
- Absorptive capacity and technical expertise of firms
- Lack of innovation-related institutions
- Non-existent linkages between universities
Outcome 9: Number of vocational training programs funded in partnership with the private sector has reached at least 100 enterprises between 2006 and 2009
- At least 50 new vocational training programs funded in partnership with the private sector (FONDEF) by 2008
- Increase proportion of projects with high technology content registered at APIX by end- 2008
- Improvements in the MTSQ infrastructure of Senegal (Metrology, Testing, Standards and Quality)
Ongoing lending: PRSC II Planned Lending PRSC-III, IV, and V AGS Planned AAA: CEM Investment Climate assessment WBI Knowledge Assessment
France, USAID
Pillar II: Human development/shared growth Improving quality of and access to basic education Gross enrollment in primary schools to increase from 80% in 2004 to 98% in 2010 (from 77% to 90% for girls)
- Inconsistent intra-sectoral and inter-regional allocations
- Insufficient access for growing middle school population, especially women
- Mixed quality of primary education
- Lack of motivated teachers
- Lack of adequate involvement of NGOs
Outcome 1: Increase success rate in achieving primary level from 53.1% in 2005 to 77% in 2009 (and from 51.5% to 73% for girls)
- Reduce regional disparities in primary gross enrollment allocations to 5% by 2008
- Maintain at 45% allocation of recurrent budget to primary; increase to 8% allocation to middle schools
- Increase the number of places in middle schools by 600 in 2007 and by an additional 1,000 per year during 2008-2010
Planned Lending: Quality Education for all II
Canada, France, Luxembourg, Belgium, African Development Bank, European Union, Japan, Netherlands, UNDP UNESCO, UNICEF, WFP, USAID
Improving health services provision for women and children
- Poor accountability - Poor quality of
service provision - Low productivity and
Outcome 2: Increase the number of assisted births to 70% at national level while ensuring a minimum of
- Ensure that 80 % of health districts have executed performance-based contracts
Ongoing lending: PRSC II APL Community Nutrition
UNICEF, WHO, USAID, African Development Bank,
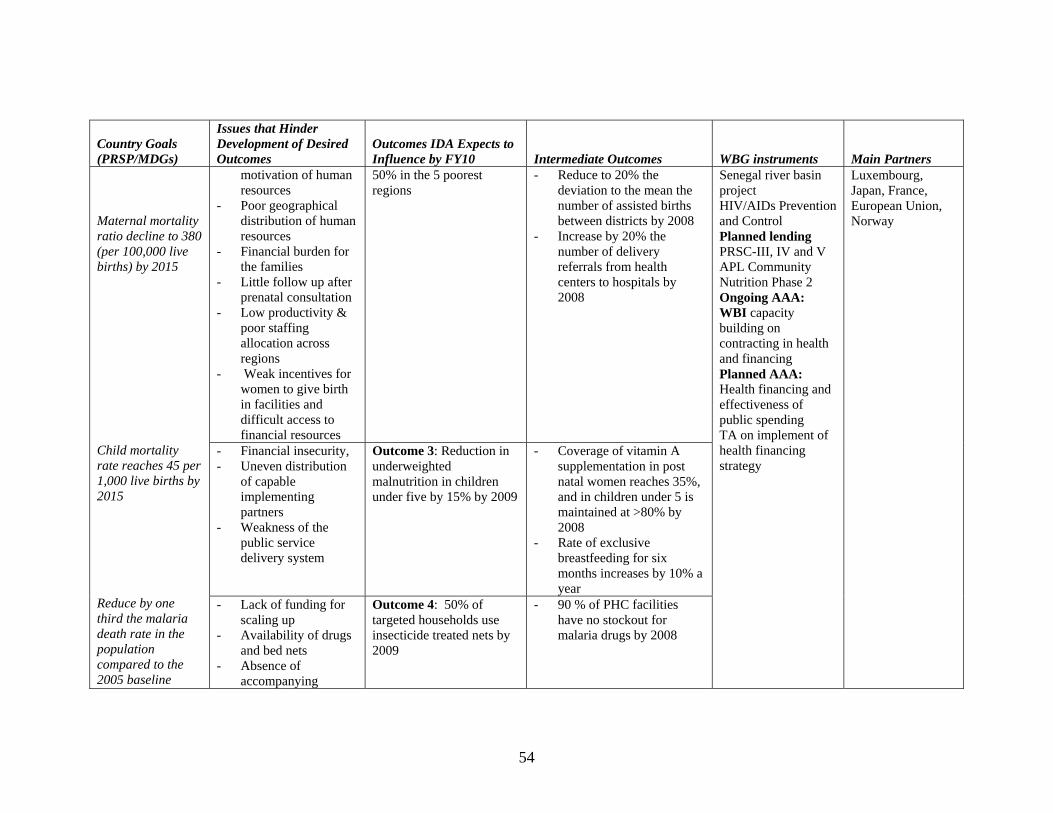
54
Country Goals (PRSP/MDGs)
Issues that Hinder Development of Desired Outcomes
Outcomes IDA Expects to Influence by FY10
Intermediate Outcomes
WBG instruments
Main Partners
motivation of human resources
- Poor geographical distribution of human resources
- Financial burden for the families
- Little follow up after prenatal consultation
- Low productivity & poor staffing allocation across regions
- Weak incentives for women to give birth in facilities and difficult access to financial resources
50% in the 5 poorest regions
- Reduce to 20% the deviation to the mean the number of assisted births between districts by 2008
- Increase by 20% the number of delivery referrals from health centers to hospitals by 2008
- Financial insecurity, - Uneven distribution
of capable implementing partners
- Weakness of the public service delivery system
Outcome 3: Reduction in underweighted malnutrition in children under five by 15% by 2009
- Coverage of vitamin A supplementation in post natal women reaches 35%, and in children under 5 is maintained at >80% by 2008
- Rate of exclusive breastfeeding for six months increases by 10% a year
Maternal mortality ratio decline to 380 (per 100,000 live births) by 2015 Child mortality rate reaches 45 per 1,000 live births by 2015 Reduce by one third the malaria death rate in the population compared to the 2005 baseline
- Lack of funding for scaling up
- Availability of drugs and bed nets
- Absence of accompanying
Outcome 4: 50% of targeted households use insecticide treated nets by 2009
- 90 % of PHC facilities have no stockout for malaria drugs by 2008
Senegal river basin project HIV/AIDs Prevention and Control Planned lending PRSC-III, IV and V APL Community Nutrition Phase 2 Ongoing AAA: WBI capacity building on contracting in health and financing Planned AAA: Health financing and effectiveness of public spending TA on implement of health financing strategy
Luxembourg, Japan, France, European Union, Norway
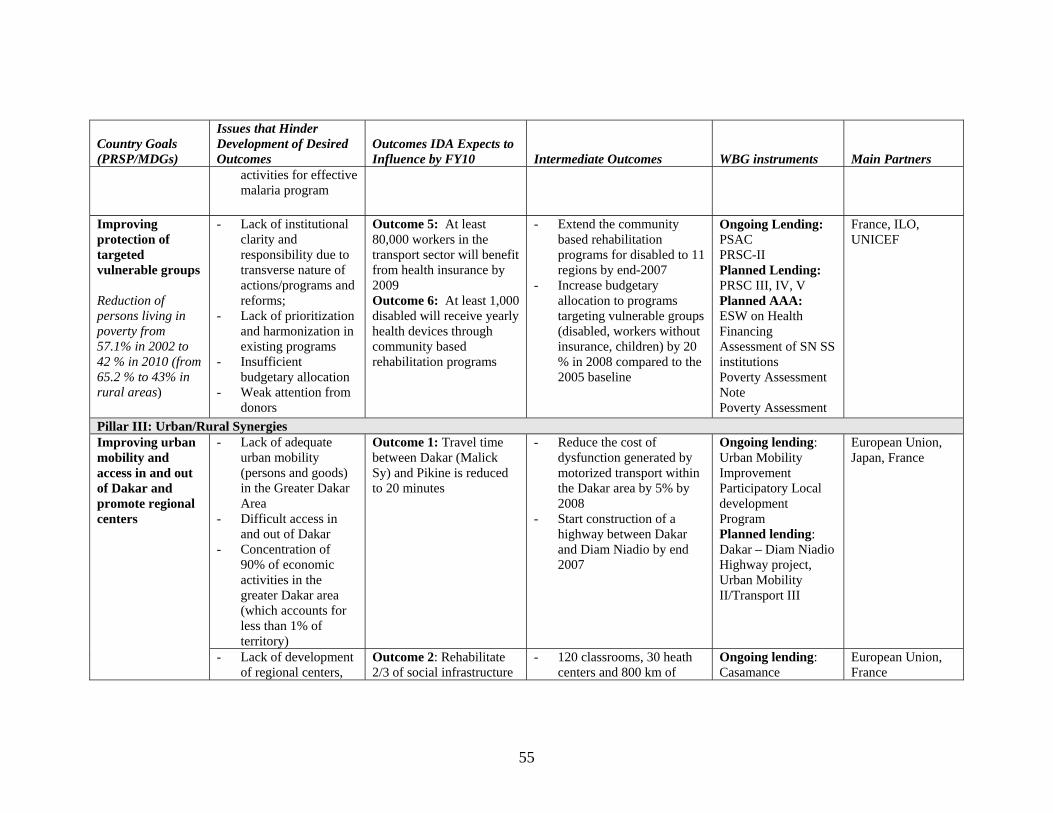
55
Country Goals (PRSP/MDGs)
Issues that Hinder Development of Desired Outcomes
Outcomes IDA Expects to Influence by FY10
Intermediate Outcomes
WBG instruments
Main Partners
activities for effective malaria program
Improving protection of targeted vulnerable groups Reduction of persons living in poverty from 57.1% in 2002 to 42 % in 2010 (from 65.2 % to 43% in rural areas)
- Lack of institutional clarity and responsibility due to transverse nature of actions/programs and reforms;
- Lack of prioritization and harmonization in existing programs
- Insufficient budgetary allocation
- Weak attention from donors
Outcome 5: At least 80,000 workers in the transport sector will benefit from health insurance by 2009 Outcome 6: At least 1,000 disabled will receive yearly health devices through community based rehabilitation programs
- Extend the community based rehabilitation programs for disabled to 11 regions by end-2007
- Increase budgetary allocation to programs targeting vulnerable groups (disabled, workers without insurance, children) by 20 % in 2008 compared to the 2005 baseline
Ongoing Lending: PSAC PRSC-II Planned Lending: PRSC III, IV, V Planned AAA: ESW on Health Financing Assessment of SN SS institutions Poverty Assessment Note Poverty Assessment
France, ILO, UNICEF
Pillar III: Urban/Rural Synergies - Lack of adequate
urban mobility (persons and goods) in the Greater Dakar Area
- Difficult access in and out of Dakar
- Concentration of 90% of economic activities in the greater Dakar area (which accounts for less than 1% of territory)
Outcome 1: Travel time between Dakar (Malick Sy) and Pikine is reduced to 20 minutes
- Reduce the cost of dysfunction generated by motorized transport within the Dakar area by 5% by 2008
- Start construction of a highway between Dakar and Diam Niadio by end 2007
Ongoing lending: Urban Mobility Improvement Participatory Local development Program Planned lending: Dakar – Diam Niadio Highway project, Urban Mobility II/Transport III
European Union, Japan, France
Improving urban mobility and access in and out of Dakar and promote regional centers
- Lack of development of regional centers,
Outcome 2: Rehabilitate 2/3 of social infrastructure
- 120 classrooms, 30 heath centers and 800 km of
Ongoing lending: Casamance
European Union, France

56
Country Goals (PRSP/MDGs)
Issues that Hinder Development of Desired Outcomes
Outcomes IDA Expects to Influence by FY10
Intermediate Outcomes
WBG instruments
Main Partners
including secondary cities such as St. Louis and Kaolack
- Poverty traps in Casamance due to post-conflict situation
(health centers, classrooms, roads) affected by the conflict in Casamance
secondary roads rehabilitated by June 07
Emergency Reconstruction Project Senegal River Basin Planned Lending Senegal River Multimodal Navigation Project
Reduced vulnerability of immigrant and emigrant groups, with a focus on street children in Dakar Proportion of working children to decline from 36.7% in 2000 to less than 15% in 2010
- Lack of statistical information on the number of street children in Dakar
- Poor harmonization of current financial support programs, driven by NGOs
- Lack of coordination between Government and donors
Outcome 3: Proportion of working children in Dakar to decline by half by end 2009
- Registration of religious schools (daaras) enforced by 2008
- Survey of street children complemented and information campaign launched by end 2007
EU, France, IFAD
- Poor learning outcomes, esp. in rural communities
- Reduce vulnerability of farmers to major natural risks
- The percentage of second grade (CP) students obtaining the minimum acceptable score in reading, as measured by reading fluency and reading comprehension tests, will increase (baseline to be established in 25 schools using both French and Native Language scores)
Ongoing Lending: PRSC-II Planned Lending PRCS-III,IV, and V Quality Education for all II Planned AAA: ESSD trust fund Tracking survey of rural dropout CEM Planned AAA: AAA/ESW on street children ESW on school dropouts Crop insurance ESW Non-farm Employment ESW Poverty Note Poverty Assessment

57
Country Goals (PRSP/MDGs)
Issues that Hinder Development of Desired Outcomes
Outcomes IDA Expects to Influence by FY10
Intermediate Outcomes
WBG instruments
Main Partners
- Pilot projects of weather insurance schemes tested by 2008
Improving quality of life through better management of natural resources and access to water and sanitation Increase access in rural areas to (i) water from 65% of the population in 2005 to 82% in 2015; and to (ii) sanitation from 19% in 2005 to 59% in 2015
- Insufficient capacity to evaluate cost-benefit of environmental interventions
- Environmental and pollution regulations are not fully implemented, and compliance is not monitored
- Lack of sustainable management of water and sanitation
- Limited access to water and sanitation services in rural areas
Outcome 4: Increase access in rural areas to (i) water from 65% of the population in 2005 to 70% in 2009; and to (ii) sanitation from 19% in 2005 to 28% in 2009
- Increase access in rural areas to (i) water from 65% of the population in 2005 to 65% in 2008; and to (ii) sanitation from 19% in 2005 to 25% in 2008
- 50% of large industrial plants affecting water quality in the Baie de Hann undergo environmental audit, issued permits, and are monitored for compliance by 2008
Ongoing Lending: Long term Water sector Project Coastal and Marine Resource management (GIRMaC Planned Lending: Long term Water Project II Planned AAA: Country Environmental Analysis
African Development Bank, Germany, European Union Netherlands

58
Annex 2: CAS Completion Report FY03-FY06
Date of CAS: March 5, 2003 Period covered by CAS: June 2002-June 2006 Date of Completion Report: October 2006 Prepared by: Ronnie Hammad
A. Introduction 1. The Senegal CAS Completion Report assesses the impact and effectiveness of the 2003 CAS in achieving its intended results between FY03 and FY06. While the initial CAS period was FY03 to FY05, the Country Director agreed to assess, when possible, the impact for an extra year due to finalization of the second Poverty Reduction Strategy Paper (PRSP) only in October 2006. Furthermore, due to delays in the effectiveness of a number of projects and the extension of 10 projects, the availability of information through ICRs only recently became available.34 2. The 2003 CAS was based on three pillars that mirror those of Senegal’s first PRSP: (i) wealth creation; (ii) capacity building and promoting social services; and (iii) improving the living conditions of vulnerable people. The fourth pillar of Implementation of the Strategy was not evaluated since it was part and parcel of each pillar and was presumably meant to emphasize the country management priority. This CAS was prepared prior to the advent of the results-based approach and thus an attempt was made to retrofit the results matrix to assess progress. Baselines were taken primarily from Project Appraisal Documents and ISRs, and outcomes were obtained primarily from ICRs or ISRs for current projects. Sector data was inserted where available, though no direct attribution is being made that project interventions contributed to sector or country outcomes or MDGs. This report benefited from internal consultations with selected country team members and from a broader discussion with the full country team, the Government, and project coordinators between June and October 2006. 3. The CAS completion report concludes that the Bank’s assistance to the implementation of Senegal’s first PRSP through FY03-FY06 has been moderately satisfactory. Under the wealth creation pillar, the Bank program supported the government’s good macroeconomic performance where average annual GDP growth during the period was around 6 percent, tax revenues increased dramatically, even while marginal income tax rates on capital investment declined from 45 to 28 percent, significantly improving fiscal space. Progress in agriculture exports and reforms in trade and price liberalizing have been mixed. Improvements in the investment climate have been modest as evidenced by the lack of progress in the score of Doing Business. The record of privatization has also been mixed, succeeding in water and sanitation, airline, railroad, but less so in electricity and the Port of Dakar.
34 A number of reports and diagnostic studies have informed the preparation of this report: the Independent Evaluation Group (IEG) Country Assistance Evaluation FY94-FY04, (2006); IEG Project Evaluations; Implementation Completion Reports, Implementation Status and Results Reports (ISRs) of projects that are ongoing; the IMF Ex Post Assessment of Longer-Term Program Engagement; Quality Assurance Group Reports; Senegal Client Survey Report 2000; Joint IDA-IMF Staff Advisory Note of the PRSP 2nd Annual Progress Report (Nov 11, 2005) PRSP and Joint IDA-IMF Staff Assessment Annual Progress Report (April 28, 2004); PRSP and Joint IDA- IMF Assessment (Nov 20, 2002).

59
4. Under capacity building and support for social services, the substantial investment in water and sanitation provided much needed services, attracted private investment, and made the sector more financially viable. This success story is likely to help Senegal achieve its MDGs in this sector. In the education sector, Senegal is also likely to achieve its MDG of primary enrollment rates; though a number of quality and equity issues remain in the sector. Major policy reversal in higher education set back a key reform. Preliminary efforts to build the capacity of the Health and Education ministries to manage and implement reforms were not successful but recent improvements occurred through the use of the series of Poverty Reduction Support Credits (PRSCs). Access to health services have not expanded as much as anticipated and Senegal is unlikely to achieve its MDGs in this sector. Progress in combating HIV/AIDS has been mixed, with some success in setting up national institutions, but utilization of VCT services has been slow to meet expectations (even though significant progress was achieved in 2006). The record for transportation and urban mobility has been mixed. A significant bottleneck, Dakar and other major cities suffer from extreme congestion with long delays in road work. 5. On support to vulnerable groups, the Bank has been successful in building the capacity of local governments and communities in implementing projects that have improved service delivery and economic activities targeting the neediest. The nutrition program is a major success story in Senegal, managing to exceed its key targets of reducing malnutrition through a complex multi-sectoral approach involving difficult behavior change interventions. It places Senegal in a very small league of Sub- Saharan African countries likely to attain its MDG for nutrition. 6. Overall Bank performance has been satisfactory and it continues to play a key role in policy discussions. Relations between the Bank and Government have improved over the past two years, and its ability to bring disparate players together and create consensus in key reforms continues. It has also managed to mobilize and leverage significant amount of donor resources. Portfolio management has also significantly improved in recent years, with commitments at risk and the number of problem projects practically eliminated.
Table 1: Summary of CAS Completion Report Outcome Ratings
Rating Overall CAS Program Rating Moderately satisfactory Pillar 1: Wealth Creation
Outcome 1 Growth strategy in primary sector Moderately satisfactory Outcome 2: Promote Private Sector Development. Moderately unsatisfactory Outcome 3: Productive Infrastructure Unsatisfactory Outcome 4: Sound macro framework Satisfactory
Pillar 2: Capacity Building and Promotion of Basic Social Services Outcome 5: Improve Education and Training Moderately satisfactory Outcome 6 Improve access to Health Services Moderately satisfactory Outcome 7: Expand Drinking Water and Sanitation Highly Satisfactory Outcome 8: Improve Transportation and urban mobility Moderately satisfactory Outcome 9: Improve management of Natural Resources Satisfactory Outcome 10: Promote Good Governance Moderately satisfactory
Pillar 3: Improving the Living Conditions of Vulnerable Groups Outcome 11: Assistance to Vulnerable Groups Highly satisfactory

60
B. Context of the CAS
1. Senegal Medium term Strategy 7. The finalization of the first PRSP in June 2002 was an important step forward in launching a comprehensive development strategy focused on poverty reduction in Senegal. The strategy was built on four main pillars: (i) wealth creation through economic reform and private sector development; (ii) capacity building and development of social services; (iii) improvements in the living conditions of the poor; and (iv) implementation of the strategy and monitoring of its outcomes. 8. Key strategic elements of the strategy were:
• Promote good governance and strengthen the rule of law; • Reinforce local development by strengthening decentralization and good governance; • Accelerate the development of basic infrastructure to enlarge access to services and to
develop human capital; • Increase investment and competitiveness of the productive system, by investing in
infrastructures that support production; • Pursue regional integration and international cooperation; • Provide information for development and encourage the use of modern research and new
information technologies; • Rational management of natural resources and the environment for sustainable
development; and • Assist vulnerable groups and to reduce gender inequalities.
9. PRSP implementation. As summarized by the authorities in their two PRSP Progress Reports in 2004 and 2005,35 progress in the implementation of the strategy has been unequal. The authorities emphasized the progress realized in strengthening the first pillar with appropriate macroeconomic policies, improvements in the investment climate through tax, regulatory and administrative reforms, and structural reforms in the groundnut sector. Yet, they also recognized that further improvements are needed to foster a sustained rise in private investment and exports. Concerning the second pillar, they pointed to progress in health and education, but at a pace (especially in health) that might not be sufficient to attain the MDGs. The authorities also emphasized their need to consolidate fiscal transparency, as well as strengthen internal and external budgetary controls. Regarding the protection of vulnerable groups, they reported that increasing funds were allocated to support children and women, but that there were gaps in programs supporting handicapped and elderly, as well as the development of infrastructure benefiting the poorest segments of the population. The mixed performance of Senegal is reflected in its uneven gains toward reaching the long–term MDGs (as reported in Table 2.3 of the main text). 2. Economic Developments, Growth and Poverty Trends
35 See www.imf.org, www.worldbank.org: “Senegal-Poverty Reduction Strategy Paper Annual Progress Report” and “Joint Staff Advisory Note”, November 11, 2005.
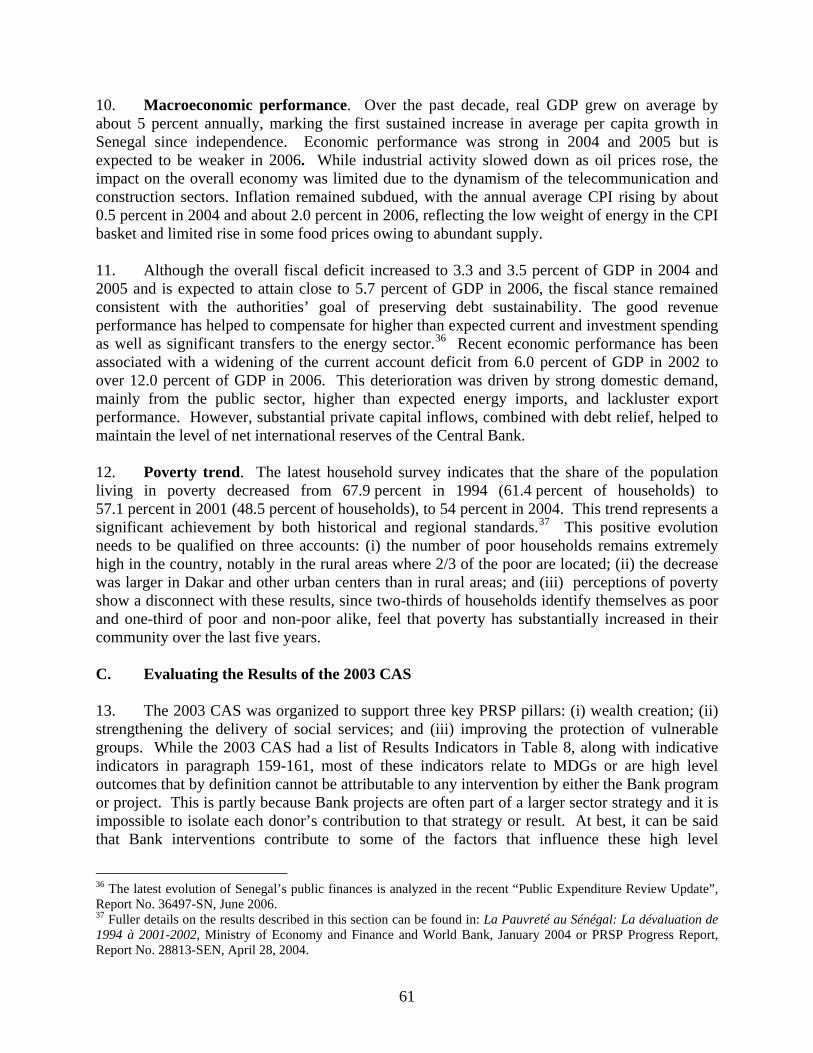
61
10. Macroeconomic performance. Over the past decade, real GDP grew on average by about 5 percent annually, marking the first sustained increase in average per capita growth in Senegal since independence. Economic performance was strong in 2004 and 2005 but is expected to be weaker in 2006. While industrial activity slowed down as oil prices rose, the impact on the overall economy was limited due to the dynamism of the telecommunication and construction sectors. Inflation remained subdued, with the annual average CPI rising by about 0.5 percent in 2004 and about 2.0 percent in 2006, reflecting the low weight of energy in the CPI basket and limited rise in some food prices owing to abundant supply. 11. Although the overall fiscal deficit increased to 3.3 and 3.5 percent of GDP in 2004 and 2005 and is expected to attain close to 5.7 percent of GDP in 2006, the fiscal stance remained consistent with the authorities’ goal of preserving debt sustainability. The good revenue performance has helped to compensate for higher than expected current and investment spending as well as significant transfers to the energy sector.36 Recent economic performance has been associated with a widening of the current account deficit from 6.0 percent of GDP in 2002 to over 12.0 percent of GDP in 2006. This deterioration was driven by strong domestic demand, mainly from the public sector, higher than expected energy imports, and lackluster export performance. However, substantial private capital inflows, combined with debt relief, helped to maintain the level of net international reserves of the Central Bank. 12. Poverty trend. The latest household survey indicates that the share of the population living in poverty decreased from 67.9 percent in 1994 (61.4 percent of households) to 57.1 percent in 2001 (48.5 percent of households), to 54 percent in 2004. This trend represents a significant achievement by both historical and regional standards.37 This positive evolution needs to be qualified on three accounts: (i) the number of poor households remains extremely high in the country, notably in the rural areas where 2/3 of the poor are located; (ii) the decrease was larger in Dakar and other urban centers than in rural areas; and (iii) perceptions of poverty show a disconnect with these results, since two-thirds of households identify themselves as poor and one-third of poor and non-poor alike, feel that poverty has substantially increased in their community over the last five years. C. Evaluating the Results of the 2003 CAS 13. The 2003 CAS was organized to support three key PRSP pillars: (i) wealth creation; (ii) strengthening the delivery of social services; and (iii) improving the protection of vulnerable groups. While the 2003 CAS had a list of Results Indicators in Table 8, along with indicative indicators in paragraph 159-161, most of these indicators relate to MDGs or are high level outcomes that by definition cannot be attributable to any intervention by either the Bank program or project. This is partly because Bank projects are often part of a larger sector strategy and it is impossible to isolate each donor’s contribution to that strategy or result. At best, it can be said that Bank interventions contribute to some of the factors that influence these high level
36 The latest evolution of Senegal’s public finances is analyzed in the recent “Public Expenditure Review Update”, Report No. 36497-SN, June 2006. 37 Fuller details on the results described in this section can be found in: La Pauvreté au Sénégal: La dévaluation de 1994 à 2001-2002, Ministry of Economy and Finance and World Bank, January 2004 or PRSP Progress Report, Report No. 28813-SEN, April 28, 2004.
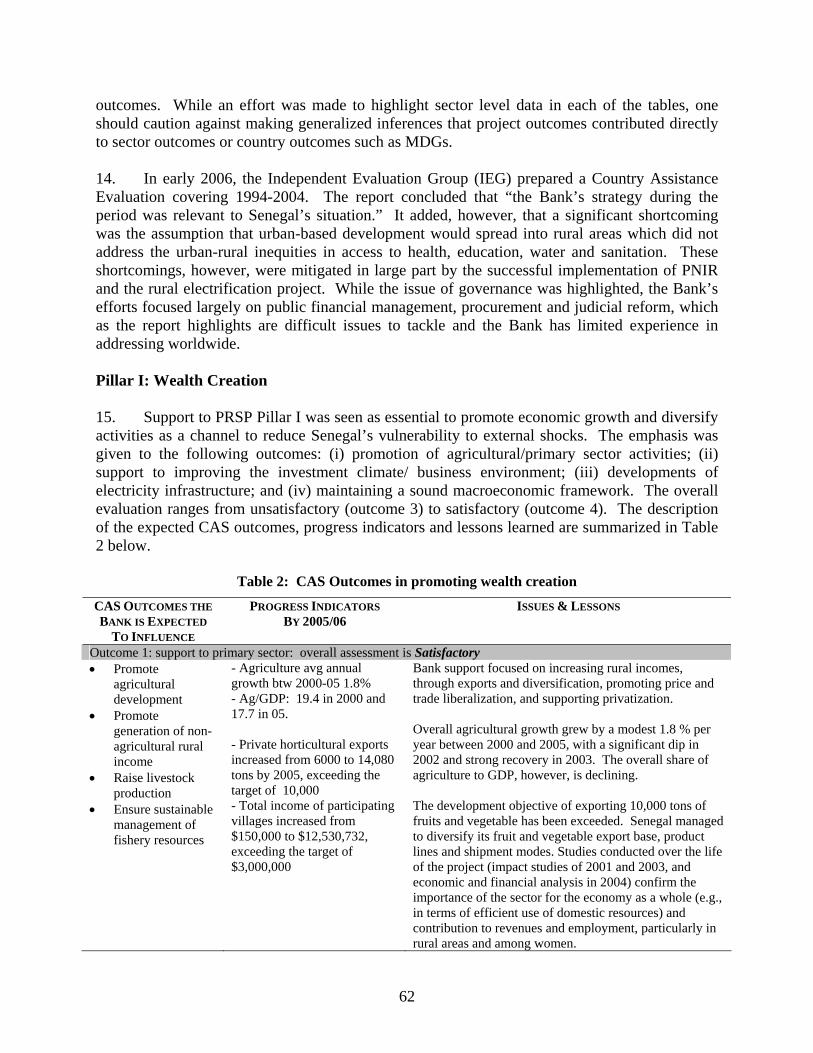
62
outcomes. While an effort was made to highlight sector level data in each of the tables, one should caution against making generalized inferences that project outcomes contributed directly to sector outcomes or country outcomes such as MDGs. 14. In early 2006, the Independent Evaluation Group (IEG) prepared a Country Assistance Evaluation covering 1994-2004. The report concluded that “the Bank’s strategy during the period was relevant to Senegal’s situation.” It added, however, that a significant shortcoming was the assumption that urban-based development would spread into rural areas which did not address the urban-rural inequities in access to health, education, water and sanitation. These shortcomings, however, were mitigated in large part by the successful implementation of PNIR and the rural electrification project. While the issue of governance was highlighted, the Bank’s efforts focused largely on public financial management, procurement and judicial reform, which as the report highlights are difficult issues to tackle and the Bank has limited experience in addressing worldwide. Pillar I: Wealth Creation 15. Support to PRSP Pillar I was seen as essential to promote economic growth and diversify activities as a channel to reduce Senegal’s vulnerability to external shocks. The emphasis was given to the following outcomes: (i) promotion of agricultural/primary sector activities; (ii) support to improving the investment climate/ business environment; (iii) developments of electricity infrastructure; and (iv) maintaining a sound macroeconomic framework. The overall evaluation ranges from unsatisfactory (outcome 3) to satisfactory (outcome 4). The description of the expected CAS outcomes, progress indicators and lessons learned are summarized in Table 2 below.
Table 2: CAS Outcomes in promoting wealth creation
CAS OUTCOMES THE BANK IS EXPECTED
TO INFLUENCE
PROGRESS INDICATORS BY 2005/06
ISSUES & LESSONS
Outcome 1: support to primary sector: overall assessment is Satisfactory • Promote
agricultural development
• Promote generation of non-agricultural rural income
• Raise livestock production
• Ensure sustainable management of fishery resources
- Agriculture avg annual growth btw 2000-05 1.8% - Ag/GDP: 19.4 in 2000 and 17.7 in 05. - Private horticultural exports increased from 6000 to 14,080 tons by 2005, exceeding the target of 10,000 - Total income of participating villages increased from $150,000 to $12,530,732, exceeding the target of $3,000,000
Bank support focused on increasing rural incomes, through exports and diversification, promoting price and trade liberalization, and supporting privatization. Overall agricultural growth grew by a modest 1.8 % per year between 2000 and 2005, with a significant dip in 2002 and strong recovery in 2003. The overall share of agriculture to GDP, however, is declining. The development objective of exporting 10,000 tons of fruits and vegetable has been exceeded. Senegal managed to diversify its fruit and vegetable export base, product lines and shipment modes. Studies conducted over the life of the project (impact studies of 2001 and 2003, and economic and financial analysis in 2004) confirm the importance of the sector for the economy as a whole (e.g., in terms of efficient use of domestic resources) and contribution to revenues and employment, particularly in rural areas and among women.
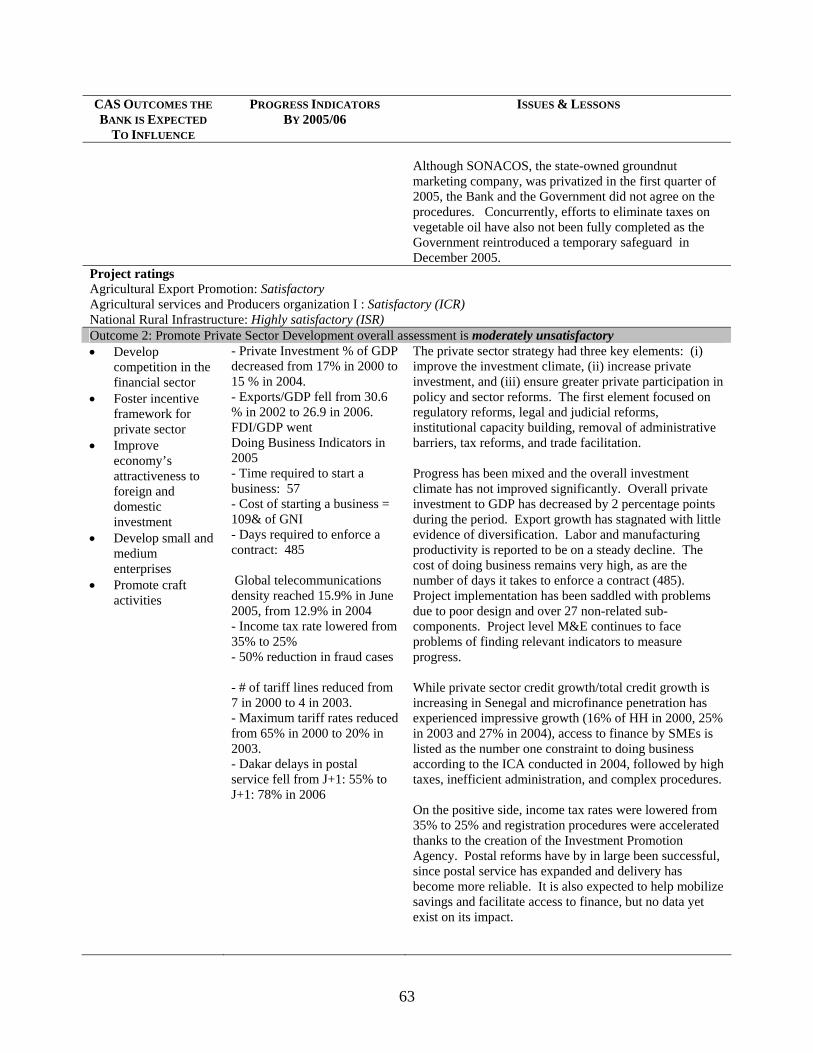
63
CAS OUTCOMES THE BANK IS EXPECTED
TO INFLUENCE
PROGRESS INDICATORS BY 2005/06
ISSUES & LESSONS
Although SONACOS, the state-owned groundnut marketing company, was privatized in the first quarter of 2005, the Bank and the Government did not agree on the procedures. Concurrently, efforts to eliminate taxes on vegetable oil have also not been fully completed as the Government reintroduced a temporary safeguard in December 2005.
Project ratings Agricultural Export Promotion: Satisfactory Agricultural services and Producers organization I : Satisfactory (ICR) National Rural Infrastructure: Highly satisfactory (ISR) Outcome 2: Promote Private Sector Development overall assessment is moderately unsatisfactory • Develop
competition in the financial sector
• Foster incentive framework for private sector
• Improve economy’s attractiveness to foreign and domestic investment
• Develop small and medium enterprises
• Promote craft activities
- Private Investment % of GDP decreased from 17% in 2000 to 15 % in 2004. - Exports/GDP fell from 30.6 % in 2002 to 26.9 in 2006. FDI/GDP went Doing Business Indicators in 2005 - Time required to start a business: 57 - Cost of starting a business = 109& of GNI - Days required to enforce a contract: 485 Global telecommunications density reached 15.9% in June 2005, from 12.9% in 2004 - Income tax rate lowered from 35% to 25% - 50% reduction in fraud cases - # of tariff lines reduced from 7 in 2000 to 4 in 2003. - Maximum tariff rates reduced from 65% in 2000 to 20% in 2003. - Dakar delays in postal service fell from J+1: 55% to J+1: 78% in 2006
The private sector strategy had three key elements: (i) improve the investment climate, (ii) increase private investment, and (iii) ensure greater private participation in policy and sector reforms. The first element focused on regulatory reforms, legal and judicial reforms, institutional capacity building, removal of administrative barriers, tax reforms, and trade facilitation. Progress has been mixed and the overall investment climate has not improved significantly. Overall private investment to GDP has decreased by 2 percentage points during the period. Export growth has stagnated with little evidence of diversification. Labor and manufacturing productivity is reported to be on a steady decline. The cost of doing business remains very high, as are the number of days it takes to enforce a contract (485). Project implementation has been saddled with problems due to poor design and over 27 non-related sub-components. Project level M&E continues to face problems of finding relevant indicators to measure progress. While private sector credit growth/total credit growth is increasing in Senegal and microfinance penetration has experienced impressive growth (16% of HH in 2000, 25% in 2003 and 27% in 2004), access to finance by SMEs is listed as the number one constraint to doing business according to the ICA conducted in 2004, followed by high taxes, inefficient administration, and complex procedures. On the positive side, income tax rates were lowered from 35% to 25% and registration procedures were accelerated thanks to the creation of the Investment Promotion Agency. Postal reforms have by in large been successful, since postal service has expanded and delivery has become more reliable. It is also expected to help mobilize savings and facilitate access to finance, but no data yet exist on its impact.

64
CAS OUTCOMES THE BANK IS EXPECTED
TO INFLUENCE
PROGRESS INDICATORS BY 2005/06
ISSUES & LESSONS
Project Ratings (ISR): PIPP: Satisfactory on DO and IP PSAC: Satisfactory on DO and IP Outcome 3: Productive Infrastructure in the electricity sector: Unsatisfactory • Develop energy
infrastructure and services
• Lower electricity costs
• Raise Electricity coverage
• Extend rural electrification
• Lower utility costs of private households.
- Cost of power reduced to KOF 67/ kWh in 2003 - Rural electrification increased from 5% to 15% between - Electricity consumption (sales) in 2004 was 1538 GWh, in 2006 1,690 GWh (9.9% increase) Sales for 1st semester of 2006: 806 GWh; increase of 7.6% vs. 1st semester of 2005. -Undeliverable energy increased from 14 Kwh 2004 to date due to problems in one of the generation plants. Target is 8 Kwh in 2008.
Overall strategy has been to (1) maintain and increase the electricity supply and the reliability of the services; (2) reduce the costs of the electricity services; and (3) enhance the performance of key energy sector institutions. Overall performance of sector has been weak. Sector continues to have low coverage, high transmission and distribution costs, and poor quality of service despite high tariffs. Private sector participation has been unsuccessful since past privatizations efforts of SENELEC failed. Its financial position, while improved, is precarious given rising oil prices and a cut in tariffs. Regulatory authority is not effective and lacks independence. The Government has refused to take advice of Bank on a number of occasions. Harmonization of procurement & financial rules in a multi donor project are essential. In rural areas, the objective has been to increase access to modern energy; ensure environ social sustainability of woodfuels in urban and peri-urban areas. To sustain results and strengthen future operations, OMVS & SOGEM need to put measures for network expansion, better resource allocation, & long-term tariff agreement. Increased stakeholder (the rural population, village committees, various commissions and local NGOs) participation in management of Senegal River Basin will help in the development and implementation of water resources policy and legal and institutional instruments.
Project Ratings (IEG) Energy Sector Adjustment Credit: Unsatisfactory Electricity services in rural areas: na. Regional Hydropower Development Project: Satisfactory National Rural Infrastructure: Highly satisfactory (ISR) Outcome 4: Sound Macro framework overall assessment satisfactory • Maintain stable
macro framework • Ensure fiscal and
external position • Satisfactory
implementation of PRSP
• Develop Medium Term Expenditure Framework (MTEF)
- GDP growth exceeded 5 percent, with the inflation rate below 2 percent, over the period 2003-2005. - The fiscal and current account deficits remained under control, with an unprecedented increase in government tax revenues and massive capital inflows. - Exports remained flat around 20% of GDP and lack of diversification. Satisfactory progress on PRSP implementation as reported in the 2003 and 2004 PRSP
The Government’s performance in maintaining macroeconomic stability for growth, including a strong fiscal position, has been very good during the period 2003-05. This assessment was shared by the IMF reviews of the PRGF and by the Bank’s CPIA ratings (Senegal presented in third highest score for macro-management in the Africa Region in 2005) The Government was able to increase tax revenues, faster than GDP growth, thanks to policy reforms aimed at simplifying the tax regimes and improvements in tax administration. Fiscal sustainability is good in Senegal (reinforced by recent debt relief initiatives), putting the attention on the effectiveness of public spending (allocation and operational effectiveness). While progress in the first two PRSP pillars (wealth creation and delivery of social services) was encouraging, support to vulnerable

65
CAS OUTCOMES THE BANK IS EXPECTED
TO INFLUENCE
PROGRESS INDICATORS BY 2005/06
ISSUES & LESSONS
Progress Report and IMF/WB JSA. - The 2006 Budget was prepared on a programmatic basis for 4 key Ministries in 2005 and 7 in 2006.
groups (the third pillar) has been weak. While the current account deficit remained manageable, the lack of progress in the diversification of exports has continued to make Senegal vulnerable to external shocks such as droughts or increases in international oil prices. MTEF needs to be extended to other ministries, as scheduled in 2006 and onwards. The quality of existing MTEF in heath needs to be improved. The CAE raised concerns regarding the real exchange rate. The latest IMF article IV consultations concluded that there is no real over appreciation of the FCFA in Senegal. Senegal is highly dependant on foreign financing, both aid and remittances. Aid inflows have almost doubled between 1995 and 2004, and is now one of the highest per capita recipients of foreign assistance equivalent $100/per capita. The Bank and IMF have been working in close collaboration over the past few years as evidenced by joint missions and joint products (PER in 2005 and HIPCF completion point, DSA, JSA for PRSP, etc...). As such, it is difficult to isolate each agency’s contribution to overall macro stability.
Pillar II: Capacity building and promotion of Basic Social Services 16. The Bank’s support provided to the second pillar of the PRSP is seen as the most successful over the period 2003-06, with ratings ranging from highly satisfactory in water and sanitation to moderately satisfactory in education and health. In the last sector, the Bank initiated its assistance with a series of sectoral projects, followed its inclusion in the budgetary support (PRSC) which has contributed to improve the performance in this sector. Improving governance has been at the center of the PRSC series, initiated with PRSC-I and II, with a special attention given to: (i) strengthening financial management and procurement procedures; and (ii) decentralization. The main outcomes and lessons from the Bank’s assistance on this pillar are summarized below.

66
Table 3: CAS Outcomes in capacity building and promoting basic social services
CAS OUTCOMES THE BANK IS EXPECTED
TO INFLUENCE
PROGRESS INDICATORS/ RESULTS
BY 2005/06
ISSUES AND LESSONS
Outcome 5: Education: overall assessment moderately satisfactory - Satisfactory implementation of the 10 yr Education & Training program/ Education for all Program - 95% of universal primary education by 2010 Allocation of 49% of national education budget to primary education - Improve access to education for girls and lengthen time they spend in formal education - Greater access to middle and secondary education Improve quality of university education and research - Continue to utilize private sector and non-formal education - Improve literacy rates, particularly among women - Reduce disparities among the regions and between rural and urban areas
Primary Education - Net primary enrollment ratio reached 79.9% in 2005 from 75.8 in 2003. - Gross primary enrollment reached 82.5% in 2005 exceeding target of 75%. Baseline was 65% in 1999. - Grade 1 intake reached 91.5% in 2005, exceeding target of 80%. Baseline was 68% in 1991. - Girls overall primary enrollment reached 48.6% in 2005, exceeding target of 46%. Baseline was 44% in 1999. - No of students benefiting from literacy classes went from 191,000 to 417,000 . Target was 120,000 - Students with minimum level in French reached 52.2%, and in Math 66%, Targets: 44.4%, 44.3% - Repetition rate fell to 12.4%, but did not meet target of 10% - Teaching hrs/wk in middle school increased to 17hrs/wk, but did not meet target of 20hrs/wk) Higher Education - Enrollment in UCAD reached 31,153 in 2003, almost double target of 15,578 - Share of higher education budget reached 24.1%, target 19.9%- Distance Learning: - Training cost fell to $27/day, target <$110/day - Utilization rate of DL facility reached 91%, target >25%
The overall strategy has been to establish a framework for achieving universal primary education by: (i) increasing coverage & equity through the expansion of primary & lower secondary enrollment, especially girls and children in under-served regions; (ii) improving quality & internal efficiency of primary/secondary through the reduction of dropout and repetition rates, esp. in rural/under-served areas thru school grants, pilot primary education in national languages, improving teacher training; and (iii) strengthening capacity for decentralized management through improved financial and budget management systems and programs for teacher career management. For the QEA, the objective to implement a framework for quality education was achieved. Senegal was able to maintain a sustainable increase in terms of access to education through constructing sufficient number of schools, recruiting required number of teachers, transferring enough responsibilities for managing the education sector to decentralized departments. These efforts were sustained by a favorable budget allocation to primary education. The objective in terms of primary school enrollment was achieved and will allow Senegal to reach its MDG in this sector. Primary school completion rate improved from 36.5% in 2000 to 53.9% in 2005 but remains low by international standards. Enrollment in early childhood development programs improved considerably, from 2.7% in 2000 to 6.8 percent in 2005. School construction program was successful overall. At the secondary and higher education levels, few significant results were in evidence. The main issue has been slow and non-systematic implementation of the strategy. Progress has been uneven and masks urban/rural and gender disparities. Higher education project rated unsatisfactory due to policy reversals after new elections in 2000 and 2001. Highly political, strong vocal constituency for free university and payment of scholarships that favors a few relatively privileged university students. The national university was built for 5000 but now hosts over 50,000, at the expense of quality.

67
CAS OUTCOMES THE BANK IS EXPECTED
TO INFLUENCE
PROGRESS INDICATORS/ RESULTS
BY 2005/06
ISSUES AND LESSONS
Project Ratings (IEG): Higher Education: Highly Unsatisfactory Pilot Female Literacy Project: Satisfactory Quality Education for All: Satisfactory (ISR) Distance Learning Center: Satisfactory Outcome 6: Health: overall assessment moderately satisfactory Improve health status, promote access of the poor to health services, reduce burden of health expenditures on poor • Focus on reducing
mortality and morbidity, especially child and maternal mortality
• Improve access and service quality
• Develop community-based health services
• Emphasize prevention
• Strengthen campaign against HIV/AIDS and malaria
• Strengthen control of endemic disease and epidemiological surveillance
• Enhance reproductive health programs
• Ensure institutional support for regional and district levels
Health - Overall deaths due to malaria fell to 30% in 2005 from 40.7% in 2000 target was 32% in 2003 - Children morbidity from urinary schistosomiasis prevalence increased to 22% from 19.5% - No. of births assisted by trained personnel icreased from 54% in 02 to 62% in 04. - Onchocerciasis prevalence fell from 2.5% to 0.2%. - Infant mortality rate dropped to 61 in 2004 from 80 in 2000 and 78 in 2003. Immunization of DT3 increased from 70% in 2003 to 93 in 2005. - Population served by health centers increased from 150,000 to 170,000 over life of project. - Population served/ health post increased from 11,000 to 11,260 HIV/AIDS - Access to VCT increased from 3 in 3 regions in 2003 to 14 in 11 regions by May 2006. - cumulative VCT utilization increased from 9900 in 2003 to 88,141 in May 2006 - No. of infected on ARV drugs increased from 870 in 2003 to 4764 by May 2006
While four projects were prepared during the CAS period to address a range of health intervention, two of them were completed with unsatisfactory ratings. In the first project ( the Integrated Health Project), clinics and health centers were built, but access to health services did not improve significantly and the rural poor were not reached, partly because of lack of coordination and leadership within the sector. Even though local capacity remains a major constraint, using national capacity rather than PIU worked well. Second, the endemic disease project designed to alleviate burden of endemic & epidemic diseases among populations ( malaria, schistosomiasis and onchocerciasis) suffered because of weak country ownership and was designed in isolation of the health sector strategy. The third project in the Bank program was aimed to prevent the spread of HIV/AIDS by reducing transmission among high risk groups; expand treatment, care and support for PLWH. Universal access to VCT has almost been achieved, prevention and mother to child transmission of HIV (PMTCT) and care/support to people living with HIV/AIDS (PLWHA) in all the 11 regions was achieved; but utilization is still limited. HIV prevalence, though low in the general population (0.7% ) remains high among vulnerable groups such as commercial sex workers (20%), tuberculosis patients (10%) and men having sex with men (21%). Three regions also continue to experience the highest HIV prevalence in the country (about 3% in Ziguinchor, Kolda and Tambacounda) and need continued attention and specific strategies. The project succeeded in setting up the structures (NAC) and (NAS) and in expanding national response in key ministries (Health, Education, Youth, Labor, Family, Armed Forces, Industry, and, Women Entrepreneurship); Grants were allocated to over 600 civil society projects. The fourth project was the series of PRSC-I and II that is supported the Government’s effort to achieve results in the health sector. Immunization of DT3 (for chidren between the ages of 12-23 months) was a big success, having increased substantially from 40% in 2000, to 70% in 2003 to 93% in 2005. As such Senegal has already exceeded its MDG for immunization of 85% by 2015. The first key lesson is that the budgetary approach is an

68
CAS OUTCOMES THE BANK IS EXPECTED
TO INFLUENCE
PROGRESS INDICATORS/ RESULTS
BY 2005/06
ISSUES AND LESSONS
effective tool to mobilize the entire Government on cross-cutting issues such as health where pending measures related to the reorganization of the Ministry were achieved through the involvement of the Ministry of Economy and Finance. The second lesson is that efforts have to be made to rely further on indicators monitored through the regular information system, rather through new surveys.
Project Ratings (IEG): Integrated Health: Unsatisfactory Endemic Disease Control: Unsatisfactory HIV/AIDS: Moderately satisfactory (ISR) PRSC: na Outcome 7: Drinking water and sanitation overall assessment: highly satisfactory Ensure easy and permanent access to drinking water. Improve sanitary conditions.
• Sustainability, by
improving management, pricing and cost recovery
• Increase quality and accessibility of drinking water to 100% by 2010 in urban areas.
• Raise investment in water and sanitation
• Ensure effective outreach through IEC programs
• Assume responsibilities by the communities
The Water Sector Project (97 - 2004) From 1998 to 2004: 1 million additional people have direct access to water supply; From 1998 to 2004: 150,000 additional people have access to sewage connection. The urban water sub-sector reached financial equilibrium in December 2003, as originally expected. The Long Term Water Sector Project (01 - 07) - From 2003 to 2005, 422,500 additional people have direct access to water supply - From 2003 to 2005, 62,250 additional people have access to a sewage connection; - From 2003 to 2005, 400,000 additional people benefited from on-site sanitation services, achieving 2007 target - The urban water sub-sector has maintained its
The Bank has made a substantial and long term investment in the sector since 1998. The objective of the Water Sector Project (WSP) was the creation of an enabling management framework to attract a private operator, increase efficiency and improve service delivery. The project included a capacity building component targeting key institutions and institutional restructuring. By 1995, the govt. established a regulatory framework that put a private company (SDE) in charge of water service delivery under a 10 year lease contract, and a public asset-holding company (SONES) responsible for managing sector assets, investments planning and financing. The Government also created the National Office of Urban Sanitation (ONAS) as an autonomous public agency in charge of operating and managing sewer networks and drainage. The urban water reform which is regarded as a best practice model in SSA, has significantly improved the overall management of the sector on the quality of service delivery, efficiency of operations and cost recovery. As a result, the lease contract was extended for 5 years in April 2006. Long term financial viability of the water sector was achieved in December 2003 through increased efficiency and effectiveness. Sector revenues became sufficient to fully finance operations including debt service. This was achieved through gradual annual tariff increases that matched improvements in the quality of service, accompanied by public awareness campaigns. A $100 million Bank investment in the WSP leveraged an additional $150 million from partners. The Long Term Water Project (US$ 125M for IDA and US$ 100M for other partners) became effective in June 2001. This project is addressing the continuing need for an increase in water production capacity, finance much-needed investments in sanitation, and support further institutional reforms. Key lessons

69
CAS OUTCOMES THE BANK IS EXPECTED
TO INFLUENCE
PROGRESS INDICATORS/ RESULTS
BY 2005/06
ISSUES AND LESSONS
financial equilibrium since 2003.
A long term support and a substantial partner support, an optimized investment program with an appropriate mix of public and private financing, a strong govt. commitment, and performance incentives for the private operators, were key elements of success. Bank was instrumental in bringing all players together. Strong procurement track record in sector, and substantial contract amounts attracted a large number of international bidders. This allowed for significant cost savings which were channeled in additional capital investment. Future lending is expected to focus on rural water and sanitation through the Water Millennium Action Plan developed with the support of the Bank.
Project Ratings by IEG Water Sector: Highly Satisfactory Outcome 8: Transport and Mobility: overall assessment: moderately satisfactory Improve Rural and Urban Transport • Satisfactory
implementation of Transport Sector Program.
• Satisfactory implementation of Urban Mobility Improvement Program
- Amount of time lost in traffic increased to 4868 hours/day in 2005 compared to a baseline of 1344 hours/day in 2000. - The percentage of people using public transportation and satisfied decline to 64.4% in 2005 compared to 73% in 2000 - The number of accidents per 1000 vehicles has declined to 44.3 in 2005 from 61.4 in 2000.
The program focused on improving supply/performance of transport infrastructure, expand access, reduce costs, create environment for growth. In road maintenance, an autonomous road management agency was created (AATR). AATR significantly improved program and brought greater coherence to road sector. However long delays in road work continue. Govt. allocation to sector has been insufficient. Air Senegal was successfully privatized. Port of Dakar was not. The Dakar Bamako railroad was privatized and service improved dramatically. Bank continues to play a key role in mobilizing donor resources and coordination support to the sector by other dones. - Key indicators in terms urban access have worsened considerably with the huge road construction projects all taking place at the same time. Traffic congestion is at an all time high, time lost in traffice has tripled since 2000, and the percentage of people using public transportation has declined significantly.
Project Ratings Transport II: Satisfactory for DO and IP Urban Mobility Improvement Project: Moderately satisfactory for DO and IP Outcome 9: Management of Natural Resources: Overall assessment: satisfactory • Implement
Senegal River Basin Charter
• Implement support to a Senegal River Basin
• Eliminate lead from gasoline
• Protect and develop coastal and marine biodiversity
- Sustainable wood fuel production increased to 370,569 tons/yr, target: 300,000 tons/yr - De-forestation reached 39,489 ha/yr, target 20,000 ha/yr - Net CO2 emission reduced to 1,786,214 tons/yr, target: 510,000 tons/yr - Area under sustainable NRM mgmt: target 300,000 ha in 2004, actual
The Bank’s strategy was to meet an important part of the rapidly growing urban demand for household fuels, without the further loss of forest cover and the ecosystem's carbon sequestration potential and biodiversity, and to generate opportunities for employment and income generation in the participating communities. Energy: Supply side management has been essential in achieving results in the energy sector. Community-based management proved to be a successful approach in natural resource management. Community-based biomass energy management has been a gateway to increasing rural access to modern energy services.

70
CAS OUTCOMES THE BANK IS EXPECTED
TO INFLUENCE
PROGRESS INDICATORS/ RESULTS
BY 2005/06
ISSUES AND LESSONS
• Improve sanitation systems and garbage collection and processing
• Reduce environmental costs of traffic congestion in major cities
378,161
Project Ratings: Regional Power – Satisfactory Sustainable and participatory Energy Management Project: Highly Satisfactory Urban Mobility Improvement Project: Moderately satisfactory for DO and IP Long-Term Water Sector: Highly Satisfactory GEF Senegal River Basin : na Outcome 10: Increase Social Capital and promote Good Governance and fight corruption overall assessment: moderately satisfactory
• Promote anti-corruption efforts
• Strengthen the judiciary system
• Improve management of public resources and accountability
• Reform civil service
• Modernize the administration
• Decentralize public administration
• Promote local development
- Increase in the execution rate of the Investment budget from 67% in 2003 to 83% in 2004. Exceptional expenses in total public spending were limited to less than 5% of total expenditures The percentage of contracts approved by the CNCA on a sole basis was limited to 17% in 2004. The number of staff increased by4494 in 2004. Public wages increased by 37.1% from end September 2004 to end December r 2004 Financial transfers made available to local governments in May 2004 (against July in 2003) and they increased from 12 billion of FCFA in 2002 to 14.1 billion of FCFA in 2004. - Volume of signed municipal contracts increased to FCFA 46.6 b - Volume of signed priority investment programs reached FCFA 37,154 b, target: FCFA 30,000 b - Average monthly payment delays 2.77
Improving financial management in the public sector was one of the key areas supported by the PRSC program. Among the most important results, it can be noted: (i) Initiation of the decentralization of financial execution procedures to linel Ministries; (ii) implementation of software (SIGFIP) integrating public spending; (iii) audit of the wage bill in the public sector; and (iv) production of quarterly reports on the cash flow situation of the treasury. Substantial progress was also realized in improving the legal and institutional framework for procurement as the new Code was approved in March 2006. Judicial reform has progressed slowly. Investment Climate Assessment shows that Unreliable justice and corruption are ranked in the top 5 concerns. On civil service reform, the gov’t recruited almost 15,000 new civil servants in priority sectors of health, education, justices, tax collection and security. A number of reforms include: (1) improving competetiveness of public wages; (2) simplifying procedures; and (3) introducing performance based incentives. The Bank also focused its support on improving the decentralization process in Senegal The PRSC series supported efforts to rationale financial relations between the central and local governments, while the PNIR and the Urban Development projects aimed at building capacities in rural and urban local governments. The Bank’s program was designed to improve financial & organizational management of municipalities; improve programming of urban investments; rationalize financing of urban investments; upgrade basic infrastructures in urban and some rural communities. In spite of these efforts, the central govt. still controls 90% of resources.

71
CAS OUTCOMES THE BANK IS EXPECTED
TO INFLUENCE
PROGRESS INDICATORS/ RESULTS
BY 2005/06
ISSUES AND LESSONS
months Municipal audits provided baselines on the spatial, organizational and financial aspects of municipalities. It also helped shape local programs based on priorities set at the local level. This was a tool to gather information at low cost, using local firms, targeted data to support decision-making. Lessons learned: Clear implementation arrangements and well- defined contractual distribution of responsibilities are essential for a successful municipal development program. Capacity building works better when integrated in a contractual arrangement and linked to investments than if it is a free- standing component. Judicial reform is a very slow and difficult reform to capture and measure.
Project Ratings: Urban Development and Decentralization: Highly Satisfactory PNIR: Satisfactory DO and IP PRSC: Na Public Info-systems: moderately satisfactory Pillar III: Improving Living Conditions of Vulnerable Groups 16. Protection of vulnerable groups was included in a variety of Bank projects. It was first integrated in projects in education, health and agriculture and in FY05 into the PRSC. While it is difficult to assess the Bank’s contribution because the protection of vulnerable groups is not the prime target of these operations, the success of the Nutrition Enhancement Program and the Social Development Fund are two examples of targeted interventions that exceeded their targets and implemented high quality monitoring and evaluation systems to track progress and measure impact. In terms of impact on beneficiaries, these two projects have proved that communities are fully capable of managing their own development and significantly improving key development outcomes. While the integration of the Social Development Fund into the fledging local governments will take time, the track record to date is likely to lead to sustainable effort to successfully target and address the needs of the poorest. The Bank support therefore is rated both relevant and highly satisfactory.

72
Table 4: CAS Outcomes in providing support to Vulnerable Groups CAS OUTCOMES THE
BANK IS EXPECTED TO INFLUENCE
PROGRESS INDICATORS/ RESULTS
ISSUES AND LESSONS
Outcome 11: Improving Living Conditions of Vulnerable Groups overall assessment Highly Satisfactory • Consolidate and
reinforce social investment programs
• Strengthen capacities of communities to identify, prioritize and implement projects
• Implement nutrition program
• Promote micro-finance
- Over 578 projects to improve access to social services and 525 projects to support economic activities were approved and delivered by local communities successfully. Malnutrition - Underweight malnutrition reduced from 27% in 2003 to 10% in 2005 in project target areas. - Exclusively breastfeeding rate increased from 30% in 2004 to 58% by end-2005 in targeted areas. - The percentage of pregnant women making at least 4 pre-natal visits has increased from 30% to 58% between 2003 and 2005, exceeding target. - The percentage of care takers able to identify two danger signs of sick children increased from 55% to 71% between 2003 and 2005 in targeted areas.
- Social Fund proved that communities can manage to design and implement their own development projects. Participatory poverty assessment involved over 1000 villages. A needs assessment managed to target fund to neediest population. Capacity to manage projects, through learning by doing, especially in procurement and financial management a success story. Lesson is that capacity of local communities exists but challenge is to unleash it. External trainers replaced by community trainers who are now human resources available to local govt. - Strategy to support both local communities and local government vindicated. SF managed to involve local government in decisions, though not in management of funds, which at least gave them comfort to synchronize efforts. PNIR managed to address basic social services and convinced federal govt. to commit to devolving local authority and finances. - Malnutrition rates declining beyond expectations. Program covered 20% of the 0-2 year old children in Senegal, contributing to national drop in malnutrition since 2000 from 22% to 17% in 2005 following a decade of stagnation at 22-23%. Turnaround put Senegal in very small league of SSA countries likely to attain the MDG nutrition targets. Data show increases in knowledge and practices, notably regarding danger signs for care seeking, infant and young child feeding, hygiene, malaria protection, and prenatal care. Coverage up for vitamin A supplementation, deworming and use of bednets. The monitoring and evaluation system for this program has been ranked as best practice. The system monitors on a monthly basis the weight gain of tens of thousands of infants from 924 sites and synthesized reports are disseminated back. In addition, various survey instruments compliment monthly reporting. An independent impact evaluation of the NEP was done in 2006. The PRSC program was sequential with an early focus on improving the strategic and institutional frameworks. As a result, an inter-ministerial committee was created in early 2005 and the new Social protection Strategy adopted in November 2005. The next step will be to rationalize budgetary support (notably through the adoption of MTER) and realize concrete results on targeted groups such as street children, non-farm unemployed people in rural areas, and disabled.
Project Ratings: Social Fund: Satisfactory NEP: Highly Satisfacotry PNIR: Satisfactory DO and IP PRSC: na

73
D. Bank Performance in Portfolio management 17. Bank’s Portfolio. The number of projects has remained relatively stable over the CAS period at around 20 projects, representing an average commitment of $760 million during the period. Although the CAS originally called for a consolidation of the portfolio and a move towards more programmatic lending, such an effort was initiated gradually during FY03-06, and is expected to be accelerated in the next CAS. This share of programmatic lending has remained stable.
Figure 1 to 4: Portfolio by commitment, FY03-06
18. The portfolio’s composition remained relatively stable over the 2003 CAS period. Based on commitments, infrastructure (Energy, Water, large infrastructure and Urban Development) continued to dominate the portfolio by an average of 57 percent, followed by human development at 23 percent, and agriculture and rural development and private sector development both at 9 percent. The percentage of commitments in the Human Development sector declined from roughly 28 percent in FY03 to 19 percent in FY06 mainly due to the closing of 3 health projects. Health interventions are now financed through the PRSC program. 19. The average age of the portfolio over the period FY03-FY06 was 6.6 years. At the end of May 2006, this average declined to 2.9 years, though this masks the high average of 4.9 and 4.6 years for infrastructure and health respectively. This was in marked contrast to 0.6 years for rural development programs, reflecting the board approval of three new projects expected to be effective in FY07. There were two main reasons behind the relatively long implementation period. First, the average number of months for projects to become effective was 7.7 due to considerable delays in meeting effectiveness conditions. Second, 10 projects were restructured or extended at least once during the period FY03-06.
Senegal Portfolio by Commitments FY03
Energy/Water 29%
Infra/Urban 29%
Ag/ENV 8%
HD 28%
PSD 6%
ECON 0%
Senegal Portfolio by Commitments FY04
Energy/Water 30%
Infra/Urban 31%
Ag/ENV 8%
HD 25%
PSD 6%
ECON 0%
Senegal Portfolio by Commitments FY05
Infra/Urban 32%
Ag/ENV 9%
HD 22%
PSD 11%
Energy/Water 22%
ECON 4%
Senegal Portfolio by Commitments FY06
Energy/Water 27%
Infra/Urban 28%
Ag/ENV 12%
HD 19%
PSD 14%
ECON 0%

74
20. One characteristic of the portfolio was the large share of Adaptable Program Lending (APL) operations. In FY06, they represented about 45 percent of the portfolio, up from 30 percent in FY03. The data include two new operations in the agricultural sector that were approved in FY06 but not yet effective by end FY06. The multiple phase design of APLs tends to lock in resources in the same sector/subsector for extended periods of time; preventing a strategic shift in portfolio allocations should emerging needs arise. 21. Total disbursements more than doubled between FY03 and FY05, due largely to most of the projects being under full maturity and a steady improvement in portfolio performance. The PRSC also disbursed in FY05, significantly increasing average disbursement amounts. The sectors with the largest average disbursements were infrastructure and energy, due to the large size of the operations and the value of goods procured.
Figure 5: Disbursements by Sector
Disbursements by Sector FY03-06
0.020.040.060.080.0
100.0120.0140.0160.0180.0200.0
Energy
/Wate
r
Infra/
Urban
Ag/ENV
HD PSD
ECON
TOTAL
Mill
ions
of U
SD
2003 2004 2005 2006
22. Improvements in projects ratings over time. Over the period FY03-06, the Bank was able to significantly improve its portfolio management. There were no active projects rated as unsatisfactory at the end of May 2006, compared with 4 projects in FY04. Disbursement rates increased at a steady pace (reaching 26.9 percent at end of May 2006) and commitments at risk declined to US$65 million from a high of US$210 in FY03. 23. These improvements were largely due to the active involvement of the CMU which created additional structures and internal controls in the past two years. The first was a quarterly half-day Country Portfolio Performance Review at which key ministers and project coordinators convene to resolve any outstanding issues. These could be project specific or cross cutting (such as M&E, the role of Project Implementation Units (PIUs), or audits, etc.). Meetings were well attended and provided a forum for immediate decision and follow-up. The second emphasis has been on improving Quality at Entry (QER). The CMU has been deliberate in providing guidance to task teams at decision meetings and appraisal, often insisting on outside reviewers to provide feedback on project. There has also been an increased emphasis on improving the results focus of projects and programs and obtaining expert advice from within and outside the region. Finally,

75
the Country Director has taken an active involvement in meeting with, and occasionally participating in missions, commenting on Aide Memoires, and providing input on ICRs, etc. 24. By May 2006, 14 projects were closed and had ICRs prepared. Of these projects, 11 were rated High or Substantial for Institutional Development, representing, approximately 80 percent of portfolio commitments. There was considerable evidence of strengthened capacity in the water, telecommunication and road sector, while slower progress in health and education. On the issue of governance, IEG cites a range of stagnating or declining measures related to “government effectiveness, regulatory quality, and rule of law” all of which have been the source of Bank support provided through the ongoing PRSC program. 25. The three projects evaluated as unsatisfactory by IEG (Endemic disease, Higher Education, and Integrated Health) were also deemed to be unlikely to be sustainable with negligible institutional development impact. The keys reasons for unlikely sustainability were: (i) inadequate government ownership; (ii)) lack of a results focus which contributed to poor choice of indicators that had incomplete baselines; (iii) proliferation of institutions with conflicting interests and financial shortcomings hindering implementation of projects; and (iv) too little attention to implementation support and supervision compared with project preparation. 26. A key issue in Senegal relates to the significant number of PIUs designed to manage Bank projects. The Bank’s Africa Region strategy has encouraged the elimination/consolidation of PIUs arguing they reduce the Government’s own capacity to manage projects and are not likely to be sustainable. A closer look at PIUs in Senegal has revealed that their type, size, function and effectiveness vary widely. While some are clearly candidates for elimination, some like the Nutrition program PIU, which arguably is the consummate multi-sector program, operate as highly effective coordinating unit which has delivered outstanding results. A study of Project Implementation Units is underway to determine whether the proliferation of investment projects in Senegal has undermined the capacity of Government’s agencies to implement projects. Evidence to date indicates that the nature of PIUs in Senegal is different from that of other countries in Africa, as the relatively small number of people employed and the services it provides are specific and focused. A pragmatic and case by case approach should be taken in Senegal. 27. Mixed instruments. The bulk of projects delivered over the 2003 CAS period were investment projects. Budget support in the amount of $30 million in the past two fiscal years constituted only about 10 percent of total disbursements, or 5 percent of commitments. The relatively small share of budget support reflected unequal progress in financial management by the Government and the Bank’s reluctance to provide large amounts of direct budget support before the implementation of a fully transparent system. This strategic choice of lending instruments was also made by other donors, which have also limited their budget support. As mentioned earlier (see para. 20), another feature of the Bank’s portfolio has been the high share of the Adaptable Project Lending (APLs), which increased from 30 percent in FY03 to 45 percent in FY06. The reliance on APLs is expected to decrease over time as this instrument will be increasingly replaced by PRSCs, notably in social sectors, requiring annual monitoring of progress.

76
E. Lessons Learned – Implication for the new CAS 25. The lessons derived from the implementation of the 2003 CAS need to be interpreted in light of the recent research on aid effectiveness (i.e., the Paris Declaration) and the experience from implementation of several CASs in Sub-Saharan Africa and other regions. The following are the seven key lessons that need to be incorporated into the design of the new CAS (FY07-FY10). 26. Stronger ownership by the Government. The Bank’s success in Senegal will be determined by the actions and reforms undertaken by the authorities. It is essential that the Bank’s lending and non-lending program be closely aligned to priorities of the Government as reflected in the second PRSP. Over the past two years, the relationship with the Government has improved significantly both at the policy and operational levels. Country dialogue is more constant, fluid and less tense. While there have been a number of issues where the Bank has publicly disagreed with the position of the Government, there is less room for mis-interpretation. 27. Greater emphasis on governance. The authorities recognize the importance of governance and have designed a fourth pillar devoted to governance and to the need to promote further decentralization and participatory mechanisms in the second PRSP. It is proposed that the Bank give special attention to governance in its new CAS, not only through specific operations, but also through “a governance lens” that will help filter and monitor progress over time. 28. Greater emphasis on rural development. The Bank should support the Government in balancing the provision of infrastructure and social services across regions and across groups (women, children, and disabled) and in its effort to decentralize economic activities outside of the Dakar area and through the development of regional poles (e.g., Casamance, Senegal River area). 29. Sharpen results orientation. The new CAS should identify clear measurable outcomes that determine success and are monitorable annually. This orientation should be reflected at both the CAS and project/program levels. Many projects do not have key performance indicators that are appropriate or can be measured. IDA 14 requires baseline data to be available for key performance indicators by the 1st Status report. Not all performance indicators need to rely on expensive household surveys and simple monitorable indicators can be prepared that give annual progress. Finally, as implementation issues continue to be at the heart of the portfolio, increased emphasis should be placed on supporting the Government in managing for results, not just measuring it. 30. Design and choices of lending instruments. Effectiveness of the Bank’s support is partially determined by the use of appropriate lending instruments. The gradual shift toward budget support and community driven initiatives should help increased ownership at the different levels of the Governments but it should be accompanied by improvements in financial management and procurement procedures. From the review of the recent operations, it is also recommended that project design be simplified because they tend to rely on overly complex conditionalities that have resulted in long delays for effectiveness and contributed to slow
77
implementation (as evidenced by the high number of projects that had to be restructured or extended). The number of effectiveness conditions should not only be reduced but actually be in place by Board date. 31. Donor Harmonization. Seeking synergies with development partners will help increase the Bank’s leverage and simplify procedures for the Government. The significant improvement in the relationship with the donor community is already bearing fruit, compared with from the tensions in the earlier part of the CAS period. This is evidenced by the increased co-financing of Bank projects. Senegal is one of the pilot countries for the implementation of the Paris Declaration and a number of initiatives to push the agenda forward have started bearing fruit. The Bank is generally perceived as an “honest broker.” Many donors are more willing to engage in a sector when the Bank is involved, this is especially true in transport. When Government ownership exists, the Bank can play a pivotal role in mobilizing resources and providing support in areas few others can. The use of alternative financial instruments such as MIGA, IFC and Bank’s guarantees should be pursued, especially for infrastructure projects given the limited IDA allocation. 32. Communications. The Bank has made major strides in implementing a communications and outreach strategy that is beginning to bear fruit. The CAS consultations with the Government, civil society, the private sector and donors were well received and appreciated. The most successful projects have been those with clear ownership by the authorities of the reforms and outcomes, exemplified by the water and nutrition sectors. In both cases, leadership was provided at the highest political level. This level of coordination should exist not only during preparation but during execution and evaluation. This is particularly true for sectors where the issues are complex, such as infrastructure and decentralization.
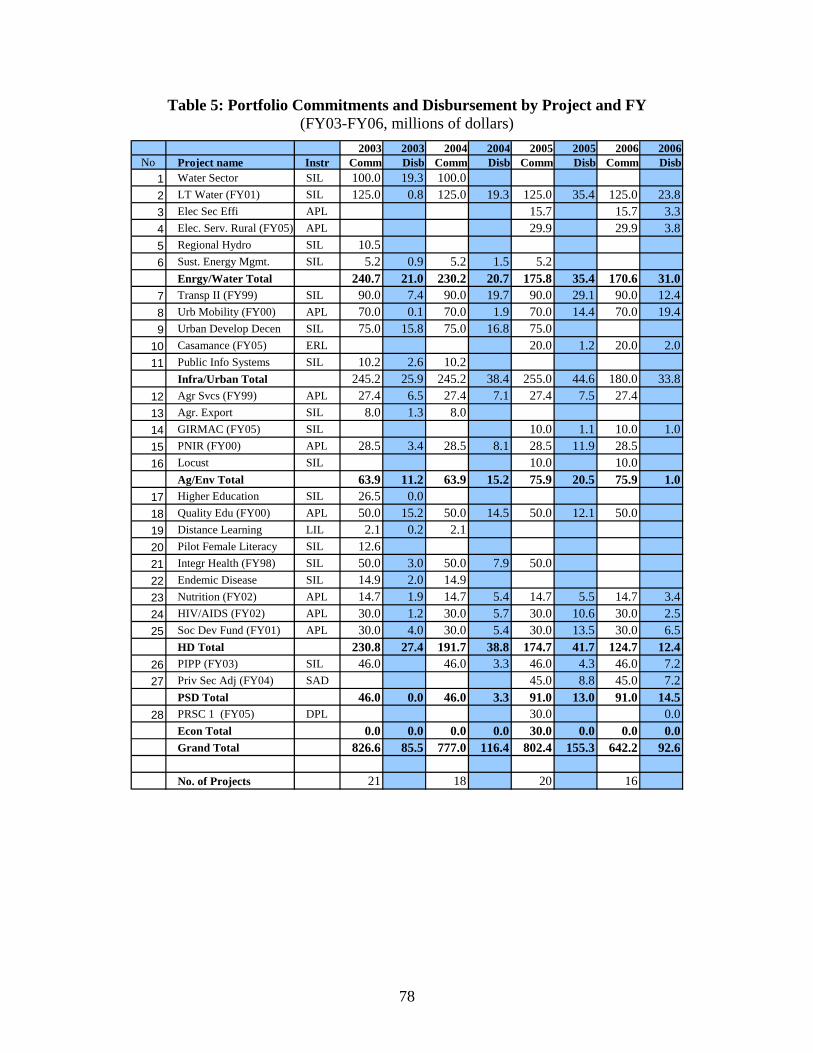
78
2003 2003 2004 2004 2005 2005 2006 2006No Project name Instr Comm Disb Comm Disb Comm Disb Comm Disb
1 Water Sector SIL 100.0 19.3 100.02 LT Water (FY01) SIL 125.0 0.8 125.0 19.3 125.0 35.4 125.0 23.83 Elec Sec Effi APL 15.7 15.7 3.34 Elec. Serv. Rural (FY05) APL 29.9 29.9 3.85 Regional Hydro SIL 10.56 Sust. Energy Mgmt. SIL 5.2 0.9 5.2 1.5 5.2
Enrgy/Water Total 240.7 21.0 230.2 20.7 175.8 35.4 170.6 31.07 Transp II (FY99) SIL 90.0 7.4 90.0 19.7 90.0 29.1 90.0 12.48 Urb Mobility (FY00) APL 70.0 0.1 70.0 1.9 70.0 14.4 70.0 19.49 Urban Develop Decen SIL 75.0 15.8 75.0 16.8 75.0
10 Casamance (FY05) ERL 20.0 1.2 20.0 2.011 Public Info Systems SIL 10.2 2.6 10.2
Infra/Urban Total 245.2 25.9 245.2 38.4 255.0 44.6 180.0 33.812 Agr Svcs (FY99) APL 27.4 6.5 27.4 7.1 27.4 7.5 27.413 Agr. Export SIL 8.0 1.3 8.014 GIRMAC (FY05) SIL 10.0 1.1 10.0 1.015 PNIR (FY00) APL 28.5 3.4 28.5 8.1 28.5 11.9 28.516 Locust SIL 10.0 10.0
Ag/Env Total 63.9 11.2 63.9 15.2 75.9 20.5 75.9 1.017 Higher Education SIL 26.5 0.018 Quality Edu (FY00) APL 50.0 15.2 50.0 14.5 50.0 12.1 50.019 Distance Learning LIL 2.1 0.2 2.120 Pilot Female Literacy SIL 12.621 Integr Health (FY98) SIL 50.0 3.0 50.0 7.9 50.022 Endemic Disease SIL 14.9 2.0 14.923 Nutrition (FY02) APL 14.7 1.9 14.7 5.4 14.7 5.5 14.7 3.424 HIV/AIDS (FY02) APL 30.0 1.2 30.0 5.7 30.0 10.6 30.0 2.525 Soc Dev Fund (FY01) APL 30.0 4.0 30.0 5.4 30.0 13.5 30.0 6.5
HD Total 230.8 27.4 191.7 38.8 174.7 41.7 124.7 12.426 PIPP (FY03) SIL 46.0 46.0 3.3 46.0 4.3 46.0 7.227 Priv Sec Adj (FY04) SAD 45.0 8.8 45.0 7.2
PSD Total 46.0 0.0 46.0 3.3 91.0 13.0 91.0 14.528 PRSC 1 (FY05) DPL 30.0 0.0
Econ Total 0.0 0.0 0.0 0.0 30.0 0.0 0.0 0.0Grand Total 826.6 85.5 777.0 116.4 802.4 155.3 642.2 92.6
No. of Projects 21 18 20 16
Table 5: Portfolio Commitments and Disbursement by Project and FY (FY03-FY06, millions of dollars)

79
Table 6: Senegal Commitments and Disbursements by Sector and FY
FY03 FY04 FY05 FY06 FY03-06 FY03 FY04 FY05 FY06 FY03-06
Sector Net Commitment Amount US$ millions Disbursements in FY
Energy/Water 240.7 230.2 175.8 170.6 204.3 21.0 20.7 35.4 31.0 27.0
Infra/Urban 245.2 245.2 255.0 180.0 231.3 25.9 38.4 44.6 33.8 35.7
Ag/ENV 63.9 63.9 75.9 75.9 69.9 11.2 15.2 20.5 1.0 12.0
HD 230.8 191.7 174.7 124.7 180.5 27.4 38.8 41.7 12.4 30.1
PSD 46.0 46.0 91.0 91.0 68.5 0.0 3.3 13.0 14.5 7.7
ECON 0.0 0.0 30.0 30.0 15.0 0.0 0.0 30.0 30.0 15.5
Grand Total 826.6 777.0 802.4 672.2 277.0 85.5 116.4 185.3 122.6 149.9
No. of Projects 21 18 20 17
FY03 FY04 FY05 FY06 FY03-06 FY03 FY04 FY05 FY06 FY03-06
Sector Net Commitment Amount US$ millions Disbursements in FY
Energy/Water 29.1% 29.6% 21.9% 26.6% 27% 24.6% 17.8% 19.1% 33.4% 27%
Infra/Urban 29.7% 31.6% 31.8% 28.0% 30% 30.2% 33.0% 24.1% 36.5% 30%
Ag/ENV 7.7% 8.2% 9.5% 11.8% 9% 13.1% 13.0% 11.1% 1.1% 9%
HD 27.9% 24.7% 21.8% 19.4% 23% 32.1% 33.3% 22.5% 13.4% 23%
PSD 5.6% 5.9% 11.3% 14.2% 9% 0.0% 2.8% 7.0% 15.6% 9%
ECON 0.0% 0.0% 3.7% 4.4% 1% 0.0% 0.0% 16.2% 24.7% 10%
Grand Total 100.0% 100.0% 100.0% 100.0% 100% 100.0% 100.0% 100.0% 100.0%
No. of Projects 21 18 20 17
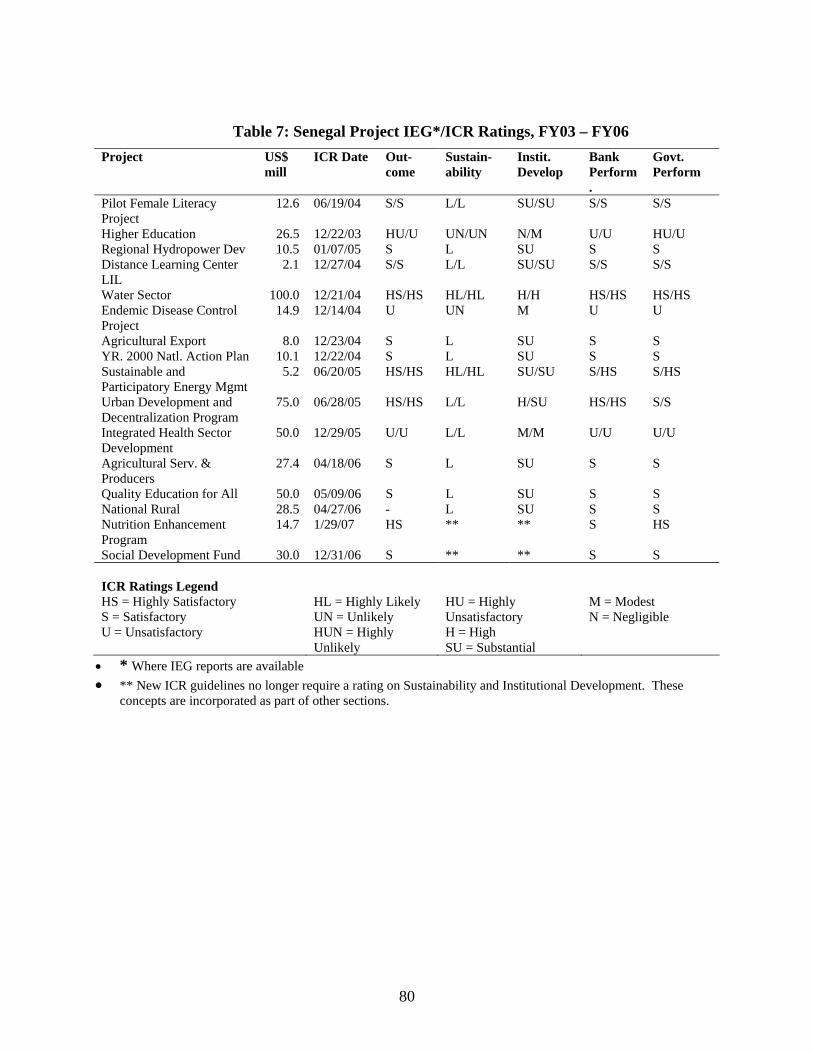
80
Table 7: Senegal Project IEG*/ICR Ratings, FY03 – FY06 Project US$
mill ICR Date Out-
come Sustain-ability
Instit. Develop
Bank Perform.
Govt. Perform
Pilot Female Literacy Project
12.6 06/19/04 S/S L/L SU/SU S/S S/S
Higher Education 26.5 12/22/03 HU/U UN/UN N/M U/U HU/U Regional Hydropower Dev 10.5 01/07/05 S L SU S S Distance Learning Center LIL
2.1 12/27/04 S/S L/L SU/SU S/S S/S
Water Sector 100.0 12/21/04 HS/HS HL/HL H/H HS/HS HS/HS Endemic Disease Control Project
14.9 12/14/04 U UN M U U
Agricultural Export 8.0 12/23/04 S L SU S S YR. 2000 Natl. Action Plan 10.1 12/22/04 S L SU S S Sustainable and Participatory Energy Mgmt
5.2 06/20/05 HS/HS HL/HL SU/SU S/HS S/HS
Urban Development and Decentralization Program
75.0 06/28/05 HS/HS L/L H/SU HS/HS S/S
Integrated Health Sector Development
50.0 12/29/05 U/U L/L M/M U/U U/U
Agricultural Serv. & Producers
27.4 04/18/06 S L SU S S
Quality Education for All 50.0 05/09/06 S L SU S S National Rural 28.5 04/27/06 - L SU S S Nutrition Enhancement Program
14.7 1/29/07 HS ** ** S HS
Social Development Fund 30.0 12/31/06 S ** ** S S ICR Ratings Legend
HS = Highly Satisfactory S = Satisfactory U = Unsatisfactory
HL = Highly Likely UN = Unlikely HUN = Highly Unlikely
HU = Highly Unsatisfactory H = High SU = Substantial
M = Modest N = Negligible
• * Where IEG reports are available • ** New ICR guidelines no longer require a rating on Sustainability and Institutional Development. These
concepts are incorporated as part of other sections.
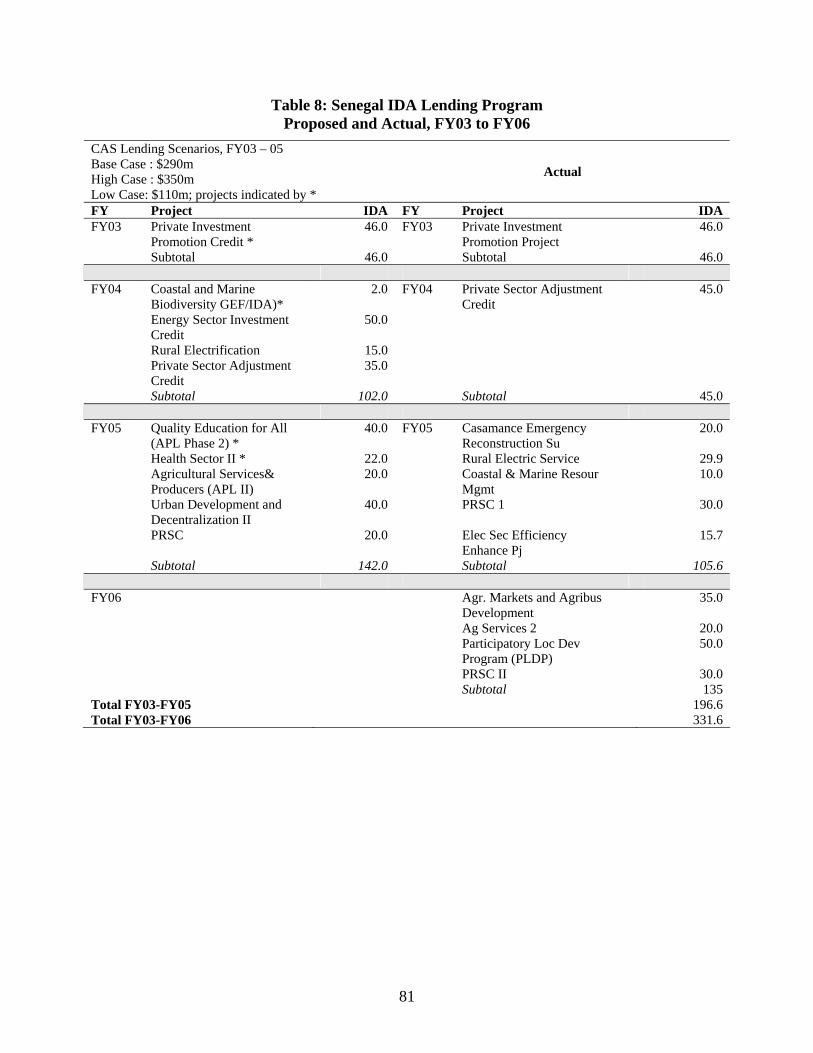
81
Table 8: Senegal IDA Lending Program Proposed and Actual, FY03 to FY06
CAS Lending Scenarios, FY03 – 05 Base Case : $290m High Case : $350m Low Case: $110m; projects indicated by *
Actual
FY Project IDA FY Project IDA FY03 Private Investment
Promotion Credit * 46.0 FY03 Private Investment
Promotion Project 46.0
Subtotal 46.0 Subtotal 46.0 FY04 Coastal and Marine
Biodiversity GEF/IDA)* 2.0 FY04 Private Sector Adjustment
Credit 45.0
Energy Sector Investment Credit
50.0
Rural Electrification 15.0 Private Sector Adjustment
Credit 35.0
Subtotal 102.0 Subtotal 45.0 FY05 Quality Education for All
(APL Phase 2) * 40.0 FY05 Casamance Emergency
Reconstruction Su 20.0
Health Sector II * 22.0 Rural Electric Service 29.9 Agricultural Services&
Producers (APL II) 20.0 Coastal & Marine Resour
Mgmt 10.0
Urban Development and Decentralization II
40.0 PRSC 1 30.0
PRSC 20.0 Elec Sec Efficiency Enhance Pj
15.7
Subtotal 142.0 Subtotal 105.6 FY06 Agr. Markets and Agribus
Development 35.0
Ag Services 2 20.0 Participatory Loc Dev
Program (PLDP) 50.0
PRSC II 30.0 Subtotal 135 Total FY03-FY05 196.6 Total FY03-FY06 331.6
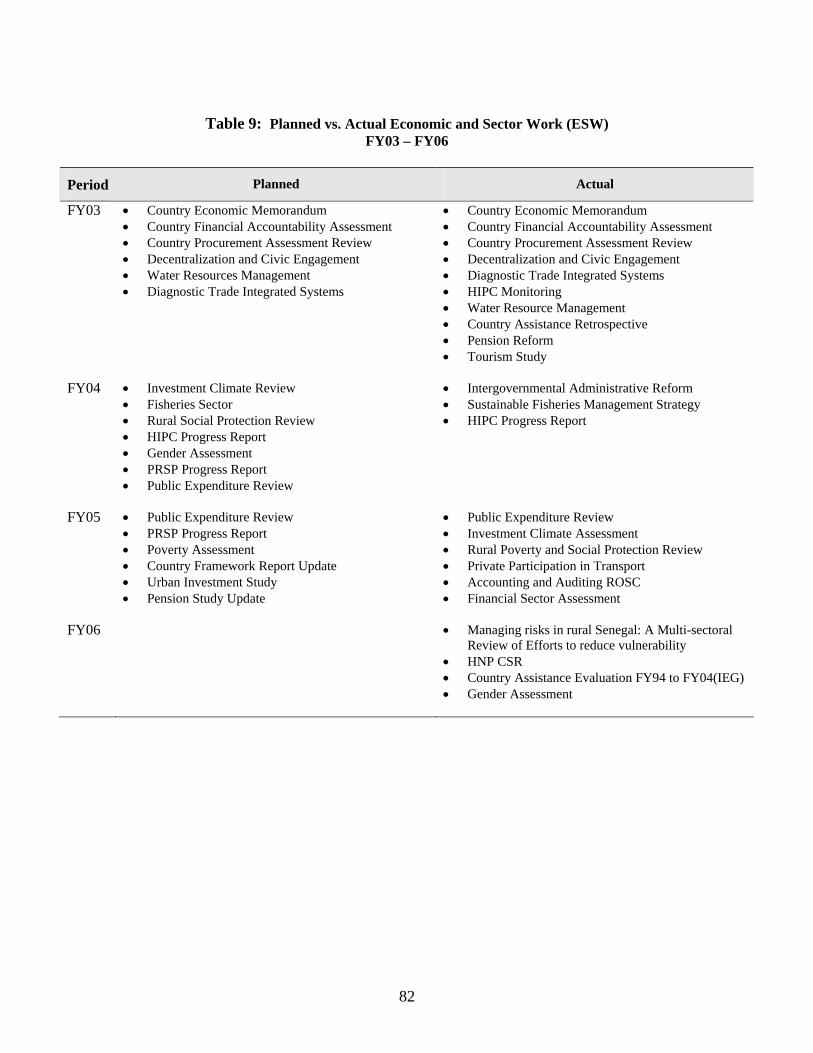
82
Table 9: Planned vs. Actual Economic and Sector Work (ESW)
FY03 – FY06
Period Planned Actual
FY03 • Country Economic Memorandum • Country Financial Accountability Assessment • Country Procurement Assessment Review • Decentralization and Civic Engagement • Water Resources Management • Diagnostic Trade Integrated Systems
• Country Economic Memorandum • Country Financial Accountability Assessment • Country Procurement Assessment Review • Decentralization and Civic Engagement • Diagnostic Trade Integrated Systems • HIPC Monitoring • Water Resource Management • Country Assistance Retrospective • Pension Reform • Tourism Study
FY04 • Investment Climate Review • Fisheries Sector • Rural Social Protection Review • HIPC Progress Report • Gender Assessment • PRSP Progress Report • Public Expenditure Review
• Intergovernmental Administrative Reform • Sustainable Fisheries Management Strategy • HIPC Progress Report
FY05 • Public Expenditure Review • PRSP Progress Report • Poverty Assessment • Country Framework Report Update • Urban Investment Study • Pension Study Update
• Public Expenditure Review • Investment Climate Assessment • Rural Poverty and Social Protection Review • Private Participation in Transport • Accounting and Auditing ROSC • Financial Sector Assessment
FY06
• Managing risks in rural Senegal: A Multi-sectoral Review of Efforts to reduce vulnerability
• HNP CSR • Country Assistance Evaluation FY94 to FY04(IEG) • Gender Assessment

83
Table 10: Senegal Projects and Program during CAS Review Period FY03 to FY06 By Effectiveness Date
F Y 0 0 F Y 0 1 F Y 0 2 F Y 0 3 F Y 0 4 F Y 0 5 F Y 0 6 F Y 0 7 F Y 0 8 F Y 0 9 F Y 1 0 F Y 1 1 F Y 1 2
F Y 0 0 F Y 0 1 F Y 0 2 F Y 0 3 F Y 0 4 F Y 0 5 F Y 0 6 F Y 0 7 F Y 0 8 F Y 0 9 F Y 1 0 F Y 1 1 F Y 1 2
A g r . M a rk e ts a n d A g r ib u s D e v e lo p m e n t ($ 3 5 m ) 1 9
P a r t ic ip a to ry L o c D e v P rg m P N D L T h ia m ($ 5 0 m ) 3 5
L o c a l A u th o r i t ie s D e v e lo p m e n t P ro g ra m ($ 8 0 m ) 3 6
E le c t .S e c E f f ic ie n c y E n h a n c e m e n t P h a s e 1 A P L 1 ($ 1 5 .7 m ) 2 6
L o c u s t ($ 1 0 m )G IR M A C (C o a s ta l a n d M a r in e R e s o u rc e M g m t) ($ 1 0 m ) 3 3
N a t io n a l R u ra l In f ra s t ru c tu re ($ 2 8 .5 m ) 4A g r . S e rv ic e s a n d P ro d u c e r O rg a n iz a t io n s ($ 2 7 .4 m ) 2 1 A g r . S e rv ic e s I I ($ 2 0 ) 2 1
U rb a n M o b i l i ty Im p ro v e m e n t ($ 7 0 m ) 3
T ra d e R e fo rm ($ 1 0 0 m )
C o m m u n ity N u tr i t io n ($ 1 8 .2 m )
2 n d H R E d u c t io n ($ 4 0 m )
P r iv a te S e c to r A d ju s tm e n t C re d i t ($ 4 5 m ) 8
S o c ia l D e v e lo p m e n t F u n d ($ 3 0 m ) 3 4
Q u a l i ty E d u c a t io n f o r A l l A P L I ($ 5 0 m ) 1 7
P r iv a te S e c to r C a p a c i ty B u i ld in g ($ 1 2 .5 m ) 6
Q u a l i ty E d u c a t io n F o r A l l - A P L 2 1 8
E n e rg y S e c to r A d ju s tm e n t C re d it ($ 1 0 0 m ) 2 4
R e g io n a l P o w e r ($ 1 0 .5 m ) 2 3
W a te r S e c to r P ro je c t $ (1 0 0 m ) 2 9 L o n g T e rm W a te r S e c S IL ($ 1 2 5 m ) 2 8
S u s ta in a b le P a r tn e rs h ip E n e rg y M g m t ($ 5 .2 m ) 2 5
P R S C I I ($ 3 0 m )
E le c t r ic i ty S e rv ic e f o r R u ra l A re a s ($ 5 m ) 2 7
P R S C I ($ 3 0 m )
U rb a n D e v e lo p m e n t a n d D e c e n tra l iz a t io n P ro g ra m ($ 7 5 m ) 3 0
P u b l ic S e rv ic e In f o S y s te m M o d e rn iz a t io n ($ 1 0 .1 5 m ) 3 1
H ig h e r E d u c a t io n P ro je c t ($ 2 6 .5 m ) 1 4
P i lo t F e m a le L i te ra c y P ro je c t ($ 1 2 .6 m ) 1 5
N u tr i t io n E n h a n c e m e n t P ro g ra m ($ 1 4 .7 m ) 1 0
A g r . E x p o r t P ro m o t io n ($ 8 m ) 2 0
U rb a n T ra n s p o r t R e f o rm ($ 6 .6 m ) 1
T ra n p s o r t S IL -2 ($ 9 0 m ) 2
D a k a r /D ia m n ia d io T o l l R o a d ($ 5 0 m ) 5
E n d e m ic D is e a s e ($ 1 4 .9 ) 1 2
In te g ra te d H e a l th S e c to r D e v e lo p m e n t P ro je c t ($ 5 0 m ) 1 3
D is ta n c e L e a rn in g C e n te r ($ 2 .1 m ) 1 6
P r iv a te In v e s tm e n t P ro m o t io n S IL ($ 4 6 m ) 9
C a s a m a n c e E m e rg e n c y R e c o n S u p p o r t ($ 2 0 m ) 3 2
H IV /A ID S P re v e n t io n a n d C o n tro l ($ 3 0 m ) 1 1
C A S P e r io d

84
Annex 3: IFC Strategy A. IFC’s Activities to Date 1. As of December 31, 2006, IFC had total commitments of US$60.94 million, of which $47.95 million were outstanding (Table 1). Power represented 72.7 percent of the committed portfolio, while other sectors included manufacturing (24 percent), tourism (2.4 percent), and banking (0.8 percent).
B. Implementation of the Past CAS 2. In the previous CAS 2003-05, IFC strategy was defined as: (i) supporting the power sector through additional investments in independent power producers to increase power generation capacity; (ii) financing private infrastructure in other sectors such as telecoms expanding regionally; (iii) providing support to investment climate initiatives such as the Presidential Investment Council; and (iv) expanding activity in the financial sector, including capacity building, establishing non-bank financial institutions, expansion of micro-finance and SME-oriented banks and financial institutions and local currency loan guaranties for lending to private schools.
3. During FY 2003-05, in a WBG initiative to restructure and improve Senegal’s electricity sector, IFC was instrumental in developing and designing a new power generation project. On April 25, 2005, the “Electricity Sector Efficiency Enhancement Project” was approved by the joint IDA/IFC Board including an IDA credit of US$15.7 million together with an IFC A Loan of €17 million and a Partial Risk Guarantee of up to US$7.2 million for the Kounoune I. The IFC loan was committed in November 2005.
4. In July 2005, IFC initiated a new program of technical assistance under the title Private Enterprise Partnership for Africa. This donor funded program replaces the previous APDF with
Table 1. Senegal: Statement of IFC's
Committed and Outstanding Portfolio (CAS Annex B8) As of 12/31/2006
(In Millions of US Dollars)
Held Disbursed
FY Approval Company Loan Equity Quasi Partic Loan Equity Quasi Partic 1 0 0. 0 0 0 0.15 0 0 1 0 0 0 0 0 0.02 0 1980 BHS 0 0.46 0 0 0 0.46 0 0 1999 Ciments du Sahel 10.05 2.26 3.08 0 10.05 2.26 3.08 0 1997 GTI Dakar 7.38 1.67 0 8.93 7.4 1.51 0 8.93 1998 GTI Dakar 1 0 0 0 1.48 0 0 0 2005 Kounoune 21.36 0 0 0 0 0 0 0 2001 SEF Royal Saly 1.39 0 0 0 1.39 0 0 0
Total Portfolio: 43.94 4.56 2.92 8.93 20.93 4.4 2.92 8.93

85
a more focused approach. PEP Africa will design and implement technical assistance programs both at micro (enterprise) and macro (sectors of the economy and business climate) levels, to be complemented with financing. One such program, SME Enterprise Development Initiative has already started.
5. IFC has endeavored to develop projects during the past CAS following its strategic orientation. However, project development has been extremely slow in light of the challenging business climate in the country and limited staff resources in the office. Indeed, Senegal ranks 146th in the 2006 Doing Business Report. IFC has taken an active role in the Presidential Investor Council to assist in improving the business climate.
C. IFC Strategy During FY07-FY10 6. Development constraints: Senegal has achieved 5-6 percent real GDP growth in the past few years and is aiming at higher rates according to the Accelerated Growth Strategy of the Government. However, growth is mostly achieved in the construction and property sectors, financed by remittances from Senegalese abroad. Moreover, growth slowed to around 3 percent in 2006 due to oil prices but also due to unfavorable domestic circumstances. Despite some progress in adopting new measures and simplifying procedures by the Presidential Investor Council, the business climate remains challenging and is an impediment to attracting foreign as well as domestic investment.
7. The banking sector remains the main source of financing for the economy but is mostly focused on the larger enterprises. The microfinance institutions are not able to meet the needs of their clients as they develop to become micro-enterprises. As a result, the SMEs remain underserved, particularly for financing their growth. Furthermore, even for the larger enterprises, medium- and long-term financing for their development is difficult to find as banks are restricted in transforming their short-term funding to finance longer term loans.
8. In the past year, the credit quality of the banks’ portfolios has deteriorated as a number of larger companies face financial difficulty. This has further reduced the banks’ appetite for risk and their willingness to finance SMEs.
9. At the same time, during years of structural adjustment few investments have been made in infrastructure projects. As a result, the country is in need of major investments to develop roads, energy, means of transportation and basic urban and rural infrastructure. Dakar remains congested and needs urban planning.
10. The Accelerated Growth Strategy could address some of theses issues. The Government enjoys significant fiscal space as a result of recent debt forgiveness and potentially significant funding through donors. In this context, IFC intends to implement a strategy that will address the needs of the country and supports the objectives of the Government.
11. IFC Objectives. During FY2007-2010, IFC’s strategy for Senegal, both in terms of investments and technical assistance, is focused on: (i) improving the investment climate; (ii) building up the capacity of SMEs and micro enterprises and that of institutions that can support them; and (iii) proactive support to project development in the priority sectors (tourism,

86
agribusiness, telecom and hi-tech and manufacturing) set out in the Accelerated Growth Strategy of the Government.
12. Power. In line with the Energy Sector Development Letter issued by the Government on April 9, 2003, the WBG advocated for the development of new generation projects through public-private partnerships, whereby the private sector would own and operate the project, and the public sector would provide the required support/mitigation through guarantees (as it is the case in the GTI Dakar and Kounoune I IPPs). The transmission and distribution systems, however, would remain under Senelec’s ownership and control, and be financed by Senelec with the support of the donor community.
13. After a year of hiatus in the dialogue between the WBG, Government and Senelec, the appointment of a new director at Senelec marks a new beginning in the chapter of collaboration in this sector. The WBG is working on a new package for the sector including WB budgetary support to be earmarked for Senelec and IFC financing for a new 100 MW IPP to be initiated during 2007. IFC could provide advisory services for a potential Public Private Partnership solution for Senelec in the medium term. It was agreed that Senelec will pursue establishing the Kounoune II project (a new 60MW diesel power plant), on its own balance sheet.
Financial sector 14. Development of the bond market. Discussions are well advanced with one bank to provide a 10 to 20 percent IFC partial guaranty on TCN issues which would allow the bank to raise up to 7 year funds. This is an intermediary step in liberalizing debt markets and initiating investors to credit analysis. The idea is to move toward a guaranty free issuance of debt instruments.
15. IFC and KFW will be investing in two microfinance institutions to be established de novo. In line with the FSAP recommendations for Senegal, the IFC’s objective would be to introduce greater coverage of the micro lending sector and encourage the local banks to take an active role in microfinance. Because of the regulatory environment (taxes and interest rate ceilings), the banks could not downscale to microfinance on balance sheet, but would need to establish de novo microfinance institutions (in which they could invest only up to 25 percent directly) in order to benefit from the appropriate legislation. One institution will focus on the rural sector (the operator has been selected and local partners are being considered) and another will serve urban clients (selection of operator is to be completed in the second quarter of 2007).
16. The housing finance sector in the region has attracted much attention of late, with both private and public sector players seeking appropriate approaches to developing the sector. IFC has been working closely with the World Bank in this regard with a view to introducing guaranty and liquidity institutions to work on a regional basis within the West African Monetary and Economic Union.
17. Global Trade Finance Program. The IFC has been marketing this program in Senegal with great success. Three banks have expressed interest in signing up for the program and due diligence missions are in progress.

87
18. IFC’s commitment to the development of the West African capital markets. In December 2006, IFC became the first non-resident international financial institution to issue a 22 billion CFA franc denominated bond in the WAEMU countries. Though this exercise, IFC introduced international standards and market practices, as in all 33 countries it has previously issued, and provided institutional investors with the opportunity to invest in Aaa/AAA rated securities. To distribute the issue, IFC worked with regional Sociétés de Gestion et Intermédiation and involved 6 regional financial institutions as partner banks, three of which were from Senegal. As a result of a comprehensive road show, the IFC issue was distributed in all of the 8 countries of WAEMU and its proceeds were invested in 4 projects in the region. The largest portion of the proceeds went to finance SOCOCIM in Senegal to help it improve production processes to meet Senegalese and international environmental standards, build a power plant for its internal use and an expansion to meet growing demand for cement. As a result of the success of this issue, Conseil Régional has given IFC authorization to bring to the bond market one of its clients with only a partial guaranty as a test case in the process of removal of the 100% guaranty requirement for issuers, and the further liberalization of the market. IFC is working on developing one such issue during 2007.
19. SME Access to Finance. In conjunction with IDA, IFC is implementing an IDA-IFC Access to Finance Project, which aims at improving access to finance for SMEs in Senegal. The project design is similar to the other PCGs in Sub-Saharan Africa, with an IDA-IFC partial guarantee of up to 50 percent of a new SME portfolio coupled with technical assistance for the 2 selected banks. The 2 banks are being appraised for the investment product. In parallel, TA will be provided to SMEs. IDA/IFC would be considering an investment of up to US$10 million in this project coupled with $1 million of IDA funds for TA for the banks, resulting in a total SME portfolio of US$20 million..
Infrastructure
20. The Dakar-Diamnadio toll road. In cooperation with the World Bank, APIX has developed a major toll road project connecting Dakar to Diamniadio. The objective is to alleviate traffic congestion in Dakar, relocate and rehabilitate a community that suffers very poor living conditions in the outskirts of the city and create a link to a platform of commercial and industrial activity in Diamniadio to be developed by MCC and to a new airport. The project cost is currently estimated at US$250 million of which US$80 million is expected to come from the private sector. The World Bank through its IDA window will be contributing US$50 million with the remainder coming from other bilateral/multilateral and budgetary sources. Currently, the Government has selected a strategic advisor to help in refining the parameters of the project. IFC’s active involvement will be sought probably in the second half of 2007.
21. The commercial/industrial Diamnadio platform partially financed by MCC. As part of the Government’s infrastructure and public works development efforts and in the context of the accelerated Growth Strategy, the commercial/industrial platform has been identified and submitted to the MCA for funding. Discussions with MCC are far along and in July 2005 US$6.5 million were committed for technical and feasibility studies. In the event of favorable findings, the MCA could be providing financing of US$300-400 million to rehabilitate land, provide basic infrastructure, access roads and the like. Currently, the Government expects

88
private sector investment of an equal amount on the platform. IFC has had discussions with the officials, and has expressed support once a clearer definition of projects is available.
22. Telecommunications. In the context of the third global telephony license to be awarded by the telecom regulator, IFC has expressed its willingness to provide financial and technical assistance to the potential winning bidder.
Technical Assistance 23. Agribusiness. IFC will provide technical assistance to a Senegalese and Spanish joint horticultural venture to strengthen procedures and management of the company. The project will consist in: (i) implementing an integrated Management Information system; (ii) organizing study tours for the New Manager; and (iii) Certification of their produce. A tomato growing/processing project will receive TA for (i) better structuring the business plan to be financed by IFC, and (ii) an out-grower scheme to better train and organize its future suppliers.
24. School facility. As tried in Ghana, the facility combines an IFC investment with technical assistance to address challenges faced by private schools. IFC and AFD are currently undertaking an assessment to understand the size and characteristics of the private schools sector in Senegal. This will determine the likely level of demand for financing to allow IFC and the partner bank to design a risk sharing facility on a new portfolio of loans to private schools and assess the technical assistance needs of the schools.
25. Tourism. PEP Africa proposes the development of an accommodation e-marketplace program to be implemented in partnership with the Tourism Association of Senegal. Besides developing and promoting a tourism e-marketplace (WorldHotel-Link.com) the program also aims at capacity building in selected tourism associations that will run the site, develop and offer training and capacity building to the hosted accommodation providers.
26. ICT. PEP Africa proposes to develop a TA program for the enterprises in the sector to provide (i) training for their staff, (ii) strategic and marketing advice benefiting from lessons leant in other off-shoring centers where IFC has been involved, and (iii) basic SME tool kits to these companies to make them more bankable. IFC is in discussions with other donors including AFD to promote this promising sector that could be a promising generator of employment. In conjunction with this TA program, IFC could provide support to local banks to facilitate access to finance for the SMEs in this sector.
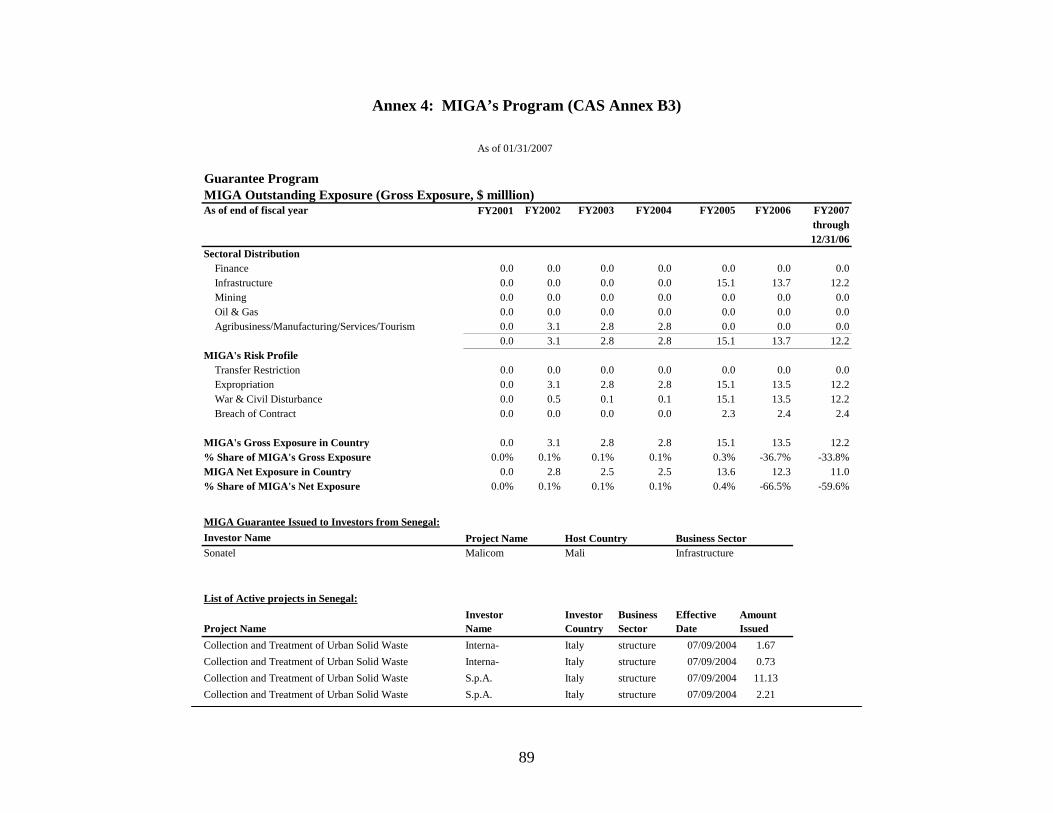
89
Annex 4: MIGA’s Program (CAS Annex B3)
Guarantee ProgramMIGA Outstanding Exposure (Gross Exposure, $ milllion)As of end of fiscal year FY2001 FY2002 FY2003 FY2004 FY2005 FY2006 FY2007
through12/31/06
Sectoral DistributionFinance 0.0 0.0 0.0 0.0 0.0 0.0 0.0Infrastructure 0.0 0.0 0.0 0.0 15.1 13.7 12.2Mining 0.0 0.0 0.0 0.0 0.0 0.0 0.0Oil & Gas 0.0 0.0 0.0 0.0 0.0 0.0 0.0Agribusiness/Manufacturing/Services/Tourism 0.0 3.1 2.8 2.8 0.0 0.0 0.0
0.0 3.1 2.8 2.8 15.1 13.7 12.2MIGA's Risk Profile
Transfer Restriction 0.0 0.0 0.0 0.0 0.0 0.0 0.0Expropriation 0.0 3.1 2.8 2.8 15.1 13.5 12.2War & Civil Disturbance 0.0 0.5 0.1 0.1 15.1 13.5 12.2Breach of Contract 0.0 0.0 0.0 0.0 2.3 2.4 2.4
MIGA's Gross Exposure in Country 0.0 3.1 2.8 2.8 15.1 13.5 12.2% Share of MIGA's Gross Exposure 0.0% 0.1% 0.1% 0.1% 0.3% -36.7% -33.8%MIGA Net Exposure in Country 0.0 2.8 2.5 2.5 13.6 12.3 11.0% Share of MIGA's Net Exposure 0.0% 0.1% 0.1% 0.1% 0.4% -66.5% -59.6%
MIGA Guarantee Issued to Investors from Senegal:Investor NameSonatel Malicom Mali Infrastructure
List of Active projects in Senegal:
Project NameInvestor Name
InvestorCountry
Business Sector
Effective Date
AmountIssued
Collection and Treatment of Urban Solid Waste Interna- Italy structure 07/09/2004 1.67Collection and Treatment of Urban Solid Waste Interna- Italy structure 07/09/2004 0.73Collection and Treatment of Urban Solid Waste S.p.A. Italy structure 07/09/2004 11.13Collection and Treatment of Urban Solid Waste S.p.A. Italy structure 07/09/2004 2.21
Project Name Host Country Business Sector
As of 01/31/2007

90
Annex 4: MIGA’s Program (Cont’d)
MIGA has no active TA program in Senegal. However, a number of recent TA activities have been concluded, including: MSP Senegal was a participant in the MIGA-Swiss-Partnership Program (MSP) – an investment facilitation program in four African countries, co-funded by the Swiss government. Under the initiative, successfully concluded in the summer of 20006, MIGA assisted the Senegalese National Investment Promotion Agency (APIX) in its efforts to attract FDI into apparel, textiles and call centers. Outreach activities were organized to target investors in these sectors and resulted in a number of investments. Snapshot Africa MIGA released a new regional report – Snapshoot Africa – in early 2006. The report displays the results of a study conducted by MIGA, comparing the operating costs and conditions for investors in six industries in nine-sub-Saharan African countries: Ghana, Kenya, Lesotho, Madagascar, Mali, Mozambique, Senegal, Tanzania, and Uganda. The study-designed to help investment promotion intermediaries in developing countries to attract foreign direct investment-is the fifth in a series of sector analyses under MIGAS’s Global Enterprising Benchmarking Program. The study identifies each country’s comparative advantage by capturing a snapshot of an industry in one location at a point in time from the perspective of an investor. In total, nearly 300 investors, both foreign and local, were surveyed for the study. Snapshot Africa examines the attractiveness of six sectors from the vantage point of investors – textile, apparel, food and beverage processing, horticulture, tourism and call centers – which are incidentally sectors attracting the highest level of mobile FDI in sub-Saharan Africa. The study examines numerous thriving investments, underscoring the untapped potential of these sectors. For prospective investors, Snapshot Africa provides hard-to-find comparable information on investor costs and conditions in the above-mentioned sectors, and can assist them to develop their site selection options. MIGA IPA Performance Review Senegal participated in MIGAS’s IPA Performance Review 2006. The 2006 Review is an ambitious global survey which has comprehensively measured IPA performance in terms of their ability to provide investor information. Access to good-quality investment-related information is critical to investors during the site selection process, and the results of this study are now being used to advise each participating agency of its performance relative to that of other IPAs and to industry best-practice standards. The Review consisted to two components: first, each IPA’s web site was reviewed from the perspective of private investor’s information requirements in screening locations as potential
91
investment sites. The assessments covered web site architecture and design, the quality and relevance of information and content available on the site, and the use of the site as marketing tool. Second, the study undertook a survey of each site, and the use of the site as a marketing tool. Second, the study undertook a survey of each IPA’s ability to handle specific investor enquiries. The study used a “Mystery shopper” approach, in which anonymous investor enquiries were submitted to each IPA, and the IPA was assessed on the basis of the quality of its responses.
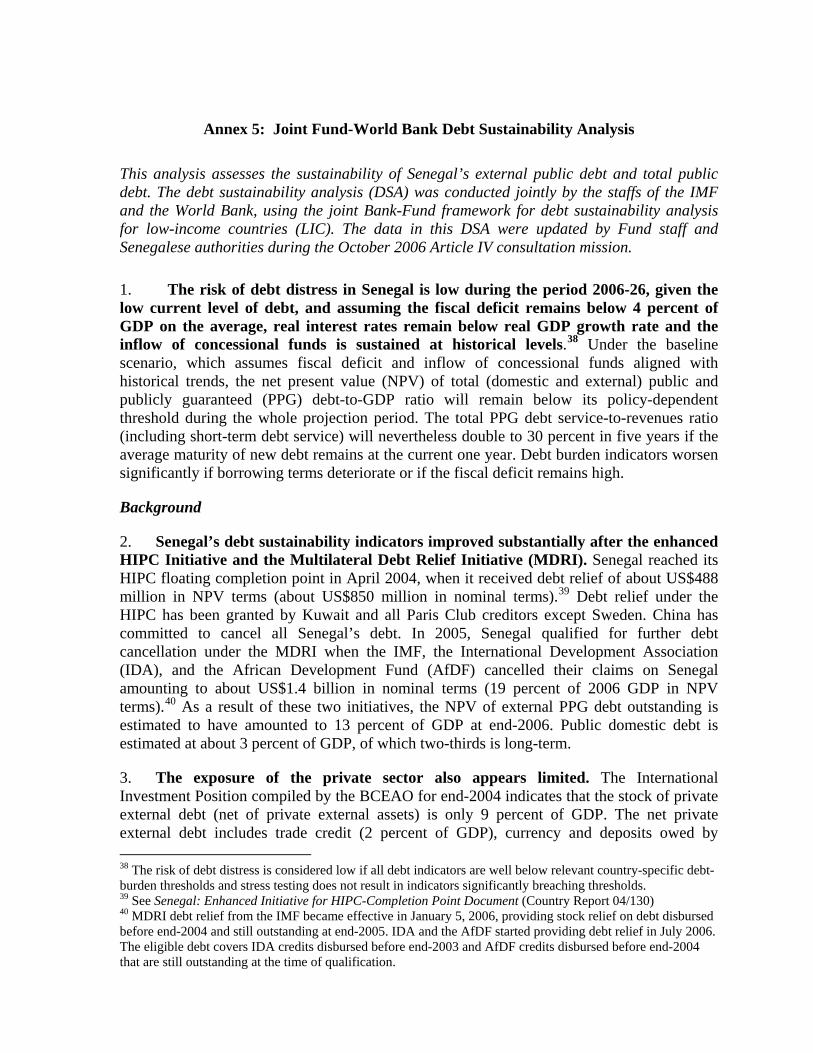
Annex 5: Joint Fund-World Bank Debt Sustainability Analysis This analysis assesses the sustainability of Senegal’s external public debt and total public debt. The debt sustainability analysis (DSA) was conducted jointly by the staffs of the IMF and the World Bank, using the joint Bank-Fund framework for debt sustainability analysis for low-income countries (LIC). The data in this DSA were updated by Fund staff and Senegalese authorities during the October 2006 Article IV consultation mission.
1. The risk of debt distress in Senegal is low during the period 2006-26, given the low current level of debt, and assuming the fiscal deficit remains below 4 percent of GDP on the average, real interest rates remain below real GDP growth rate and the inflow of concessional funds is sustained at historical levels.38 Under the baseline scenario, which assumes fiscal deficit and inflow of concessional funds aligned with historical trends, the net present value (NPV) of total (domestic and external) public and publicly guaranteed (PPG) debt-to-GDP ratio will remain below its policy-dependent threshold during the whole projection period. The total PPG debt service-to-revenues ratio (including short-term debt service) will nevertheless double to 30 percent in five years if the average maturity of new debt remains at the current one year. Debt burden indicators worsen significantly if borrowing terms deteriorate or if the fiscal deficit remains high.
Background
2. Senegal’s debt sustainability indicators improved substantially after the enhanced HIPC Initiative and the Multilateral Debt Relief Initiative (MDRI). Senegal reached its HIPC floating completion point in April 2004, when it received debt relief of about US$488 million in NPV terms (about US$850 million in nominal terms).39 Debt relief under the HIPC has been granted by Kuwait and all Paris Club creditors except Sweden. China has committed to cancel all Senegal’s debt. In 2005, Senegal qualified for further debt cancellation under the MDRI when the IMF, the International Development Association (IDA), and the African Development Fund (AfDF) cancelled their claims on Senegal amounting to about US$1.4 billion in nominal terms (19 percent of 2006 GDP in NPV terms).40 As a result of these two initiatives, the NPV of external PPG debt outstanding is estimated to have amounted to 13 percent of GDP at end-2006. Public domestic debt is estimated at about 3 percent of GDP, of which two-thirds is long-term.
3. The exposure of the private sector also appears limited. The International Investment Position compiled by the BCEAO for end-2004 indicates that the stock of private external debt (net of private external assets) is only 9 percent of GDP. The net private external debt includes trade credit (2 percent of GDP), currency and deposits owed by 38 The risk of debt distress is considered low if all debt indicators are well below relevant country-specific debt-burden thresholds and stress testing does not result in indicators significantly breaching thresholds. 39 See Senegal: Enhanced Initiative for HIPC-Completion Point Document (Country Report 04/130) 40 MDRI debt relief from the IMF became effective in January 5, 2006, providing stock relief on debt disbursed before end-2004 and still outstanding at end-2005. IDA and the AfDF started providing debt relief in July 2006. The eligible debt covers IDA credits disbursed before end-2003 and AfDF credits disbursed before end-2004 that are still outstanding at the time of qualification.

93
Senegalese banks to non-residents (3 percent of GDP) and loans taken abroad (3 percent of GDP).
Methodology and Baseline scenario
4. Following the guidelines of the LIC DSA framework, staffs have analyzed the evolution of the total public debt stock and debt service indicators for Senegal subject to a baseline scenario and a series of stress tests.41 The stress tests are designed to assess a country’s probability of facing debt distress in the future.42 The analysis is guided by indicative, country-specific external PPG debt-burden thresholds, which take into account the empirical finding that the external debt levels that a low-income country can sustain increase with the quality of its policies and institutions. The quality of policies and institutions is measured by the World Bank’s 2005 Country Policy and Institutional Assessment (CPIA), according to which Senegal ranks as a “strong performer.” The indicative external debt-burden thresholds for countries in this category are: (i) an NPV of external PPG debt-to-GDP ratio of 50 percent; (ii) an NPV of external PPG debt-to-exports ratio of 200 percent; (iii) an NPV of external PPG debt-to-revenue ratio of 300 percent; (iv) an external PPG debt service-to-exports ratio of 25 percent; and (v) an external medium and long-term PPG debt service-to-revenue ratio of 35 percent.
5. Broadly in line with the PRSP II, the baseline scenario assumes that:
• Economic performance will follow the trends observed during 2000-5 (Box 1 and Table 3). Economic growth will recover from around 3.3 percent in 2006 and range between 4.9 and 5.6 percent during 2007-26—3.8 percentage points higher than the average real interest rate on public debt over the period. The projected recovery in 2007-8 will be induced by the decline in international oil prices and the resolution of the financial crisis in Senegal’s largest company (Industries Chimiques du Sénégal - ICS).43 Beyond 2008, the reforms to improve the business environment will boost private investment and sustain economic growth close to the trend level of 5.1 percent per year observed in 2000-05.44
• The overall fiscal deficit (including transfers) will remain below 4 percent of GDP over 2007-26 on the average.
41 See “Operational Framework for Debt Sustainability Assessments in Low-Income Countries—Further Considerations,” March 28, 2005 (www.imf.org). The new framework introduces some methodological changes in the calculation of the NPV of debt compared to the HIPC methodology by using: (a) a fixed 5 percent discount rate instead of currency specific discount rates (under HIPC); (b) WEO exchange rate projections instead of fixed exchange rates as of the end of the base year; and (c) annual exports instead of a three-year average of exports as the denominator in the NPV of debt-to-exports ratio. 42 The standard stress tests conducted for Senegal for external DSA are listed in Table 2 and for fiscal DSA in Table 4. The most-extreme stress tests (worst-case scenarios) depicted in Figures 1 and 2 and detailed in Box 2 are those with the worst indicator in 2016. 43 The price of oil is assumed to decline to US$ 59 per barrel, at end-2006 from US$ 68 in mid-2006, and rise to US$ 64 at end-2008. It is projected to decline again to US$59 at end-2011 and stabilize at that level for the rest of the projection period. 44 Excluding 2002, when a severe drought reduced real GDP growth to 0.7 percent.

94
• The external current account deficit will decline during 2007-26 as export growth exceeds that of imports (Box 1 and Table 1). Growth in the exports of goods will outpace the growth in GDP in 2007-2026 as ICS, which accounts for about 10 percent of total exports, will gradually resume its activities during 2007-08, and structural reforms expand the export base. Imports as a percentage of GDP will fall in 2007-08 as oil prices decline and the local refinery resumes its operations. Remittances will grow slightly faster than GDP during the entire projection period, in line with recent trends.
• External borrowing on concessional terms will remain constant at trend level of about 3.5 percent of GDP throughout the projection period, with an average grant element of 45.3 percent (1.6 percent of GDP). The authorities intend to borrow abroad only on concessional terms. Financing needs of the public sector beyond that level will be covered almost entirely by short-term domestic borrowing on non-concessional terms, which is consistent with the debt management policy implemented in recent years.
Box 1. Senegal: Baseline Scenario (2007-26) - Main Assumptions
External Sustainability Analysis
6. Under the baseline scenario, Senegal’s external PPG debt-burden indicators remain below the thresholds throughout the projection period. The NPV of external PPG debt-to-GDP ratio will rise slightly from 13 percent in 2006 to 15 percent by 2026 under this scenario, below the policy-dependent threshold of 50 percent for a strong performer such as Senegal. Similarly, the NPV of external PPG debt-to-exports ratio and the external PPG debt service-to-exports ratio are projected to remain under 56 and 6 percent, respectively, during the whole projection period, below their respective policy-dependent thresholds (Figure 1 and Table 2).
Real GDP growth projected to average 5 percent per year
The external current account deficit will decline from 12 percent of GDP in 2006 to 5.3 percent of GDP in 2026.
The primary fiscal deficit will decline from 5 percent of GDP in 2006 to remain around 3.1 percent of GDP during 2007-26, which is consistent with historical performance.
External grants and concessional loans will remain constant at 3.5 percent of GDP, with a grant element of 45.3 percent (1.6 percent of GDP).
New public sector domestic borrowing assumed to be composed of 95 percent of short-term securities and 5 percent of long-term bonds.
Interest rate on private and domestic PPG debt assumed to average 4.5 percent.

95
7. External debt sustainability indicators remain below the thresholds in case of all standard temporary shocks, including the most extreme.45 The most extreme stress test for Senegal consists of a combined two-year decline in GDP growth, export growth, capital inflows, and a reduction in GDP in US dollars (Box 2).46 External PPG debt and debt service will rise sharply as a result of such a shock, but will remain below the thresholds during the projection period (Figure 1, Table 2).
Box 2. Senegal: Standard Stress Tests (temporary shocks)
8. The debt indicators are sensitive to borrowing terms. If all new external borrowing (3.5 percent of GDP annually on average) is concessional with an average grant element of 45.3 percent, the NPV of external PPG debt-to-GDP ratio will rise by only 2 percentage points in the projection period. However, it will grow by 21 percentage points and reach 34 percent in 2026 if all new external borrowing is non-concessional (Figure 1 and Table 2). In this case, the debt indicators remain below the threshold during the projection period but continue to grow and eventually breach the thresholds after the end of the projection period. If financing under the worst-case shock is non-concessional, the NPV of external PPG debt-to-GDP ratio in 2008 will be 10 percentage points higher than if it is concessional (Figure 1). These results underline the need for the government to adhere strictly to the policy of borrowing externally only on concessional terms.
Fiscal Sustainability Analysis
9. Under the baseline scenario, the public debt indicators mirror the external debt indicators. The NPV of total PPG debt-to-GDP ratio and the NPV of total PPG debt-to-exports ratio will remain low during the entire projection period, even though the domestic portion of the total public debt is non-concessional. The medium and long-term debt service-to-revenues ratio will similarly remain low under the baseline scenario (Box 1, Figure 2, Tables 3 and 4).
45 The effect of fiscal slippages on total PPG debt is analyzed in the next section. The tests assume that balance-of-payments gaps are financed by public sector borrowing. External PPG debt indicators remain unchanged if the balance-of-payments gaps are financed by private sector borrowing. 46 The magnitude of the shocks in the worst-case scenarios is substantially more severe than the effect of delaying the resumption of ICS for one year, in which case GDP growth rate would be around 1.5 percentage point below the baseline scenario in 2007.
Worst-case scenarios for PPG debt sustainability Baseline scenario External DSA Fiscal DSA
(domestic and external) Real GDP growth rate (percent) 5.0 3.3 in 2007-08 2.3 in 2007-08
Exports (in $) growth rate (percent) 8.2 –1.0 in 2007-08 8.2
Net current transfers (percent of GDP) 8.8 4.5 in 2007-08 8.8
GDP (in $) deflator (percent change) 2.1 –2.9 in 2007-08 2.1
96
10. The government may face rollover difficulties over the next 5 to 10 years owing to the growing share of short-term domestic debt (Figure 3). If the current policy of issuing short-term securities to close the financing gap continues in the medium-term, the total PPG debt service-to-revenue ratio (including short-term debt service) will double to 30 percent by 2011 before stabilizing at a high level, around 42 percent, over the rest of the period.47 These projections underline the need for Senegal to extend the maturities of public debt securities and to develop a liquid primary and secondary market for government debt.
11. Fiscal debt sustainability hinges on the reduction of the fiscal deficit to below 4 percent of GDP on the average. If the fiscal deficit remains at its 2006 level of 5.7 percent of GDP (equivalent to a primary deficit of 5.0 percent of GDP) during the entire projection period, the NPV of total PPG debt-to-GDP ratio will reach 50 percent in 2021. The financing needs caused by the accumulated deficits could crowd out the private sector. The NPV of total debt-to-revenue ratio and debt service-to-revenue ratio (including short-term debt service) will follow similar trajectories, reaching 268 and 197 percent by 2026, respectively. This prospect highlights once again the need for the authorities to pursue a prudent fiscal policy over the medium-term (Figure 2 and Tables 3 and 4).
12. Temporary adverse shocks will require additional fiscal adjustment to reduce domestic borrowing needs and stabilize public debt. The most extreme shock for fiscal DSA, which involves GDP growth rate falling to 2.3 percent a year in 2007 and 2008 (equivalent to one standard deviation below its historical average), would raise the NPV of total PPG debt-to-GDP ratio to 50 percent by the end of the projection period. The NPV of total PPG debt-to-revenues ratio would follow a similar trajectory and reach 200 percent in 2022. The realization of a sizeable contingent liability equivalent to 10 percent of GDP in 2007 is less severe than the worst-case scenario. To insure that debt indicators remain within reasonable limits in case of a shock, the fiscal deficit should be reduced below the level assumed under the baseline scenario (Box 2, Figure 2 and Table 4).
Conclusion
13. The risk of debt distress remains low. Debt indicators rise steeply during the projection period only if the overall fiscal deficit remains at its 2006 level of 5.7 percent of GDP, or the average maturity of new domestic debt remains at one year or less. Beyond 2026, the debt distress may arise only if GDP does not grow as projected, or all borrowing is on non-concessional terms. In these cases, additional fiscal adjustment will be needed to ensure that the risk of debt distress stays low. This DSA highlights the need for Senegal to continue to adopt strict fiscal discipline, a prudent strategy regarding borrowing on non-concessional terms, and appropriate debt management policies.
47 See “Operational Framework for Debt Sustainability Assessments in Low-Income Countries—Further Considerations,” March 28, 2005 (www.imf.org).

97
1/ Assumes that the interest rate on new borrowing is 3.5 percentage points higher than in thebaseline, while grace and maturity periods are the same as in the baseline.
Figure 1. Senegal: Indicators of External PPG Debt Under Alternative Scenarios, 2006-2026
(In percent)
Source: Staff projections and simulations.
NPV of external PPG debt-to-GDP ratio
0
10
20
30
40
50
60
2006 2007 2008 2009 2010 2011 2012 2013 2014 2015 2016 2017 2018 2019 2020 2021 2022 2023 2024 2025 2026
BaselineBaseline with loans on less favorable terms 1/Most extreme stress test financed on concessional termsMost extreme stress test financed on non-concessional terms
NPV of external PPG debt-to-exports ratio
0
50
100
150
200
250
2006 2007 2008 2009 2010 2011 2012 2013 2014 2015 2016 2017 2018 2019 2020 2021 2022 2023 2024 2025 2026
BaselineBaseline with loans on less favorable terms 1/Most extreme stress test financed on concessional termsMost extreme stress test financed on non-concessional terms
Debt external PPG service-to-exports ratio
0
5
10
15
20
25
30
2006 2007 2008 2009 2010 2011 2012 2013 2014 2015 2016 2017 2018 2019 2020 2021 2022 2023 2024 2025 2026
BaselineBaseline with loans on less favorable terms 1/Most extreme stress test financed on concessional termsMost extreme stress test financed on non-concessional terms

98
Figure 2. Senegal: Indicators of Total PPG Debt Under Alternative Scenarios, 2006-2026 1/
Source: Staff projections and simulations.1/ Most extreme stress test is test that yields highest ratio in 2016.2/ Revenue including grants.
NPV of debt-to-GDP ratio
0
10
20
30
40
50
60
2006 2007 2008 2009 2010 2011 2012 2013 2014 2015 2016 2017 2018 2019 2020 2021 2022 2023 2024 2025 2026
Baseline
No Reform
Most extreme stress test
Realization of contingent liability
NPV of Debt-to-Revenue Ratio 2/
0
50
100
150
200
250
300
2006 2007 2008 2009 2010 2011 2012 2013 2014 2015 2016 2017 2018 2019 2020 2021 2022 2023 2024 2025 2026
Baseline
No Reform
Most extreme stress test
Realization of contingent liability
Debt Service-to-Revenue Ratio 2/(excludes short-term debt service)
0
5
10
15
20
25
2006 2007 2008 2009 2010 2011 2012 2013 2014 2015 2016 2017 2018 2019 2020 2021 2022 2023 2024 2025 2026
Baseline
No Reform
Most extreme stress test
Realization of contingent liability

99
Figure 3. Senegal: Indicators of Total PPG Debt Under Alternative Scenarios, 2006-2026 1/
Source: Staff projections and simulations.1/ Most extreme stress test is test that yields highest ratio in 2016.2/ Revenue including grants.
Debt Service-to-Revenue Ratio 1/2/(includes short-term debt service)
0
20
40
60
80
100
120
2006 2007 2008 2009 2010 2011 2012 2013 2014 2015 2016 2017 2018 2019 2020 2021 2022 2023 2024 2025 2026
BaselineNo reformMost extreme stress testRealization of contingent liability
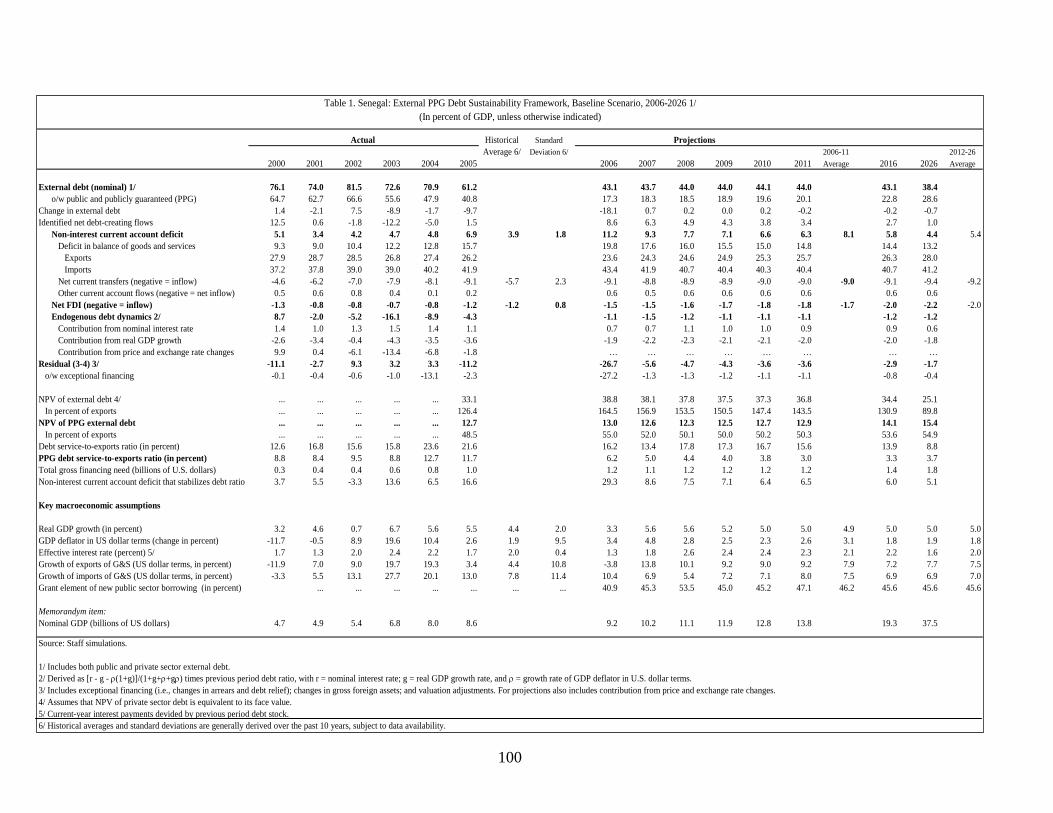
100
Historical StandardAverage 6/ Deviation 6/ 2006-11 2012-26
2000 2001 2002 2003 2004 2005 2006 2007 2008 2009 2010 2011 Average 2016 2026 Average
External debt (nominal) 1/ 76.1 74.0 81.5 72.6 70.9 61.2 43.1 43.7 44.0 44.0 44.1 44.0 43.1 38.4o/w public and publicly guaranteed (PPG) 64.7 62.7 66.6 55.6 47.9 40.8 17.3 18.3 18.5 18.9 19.6 20.1 22.8 28.6
Change in external debt 1.4 -2.1 7.5 -8.9 -1.7 -9.7 -18.1 0.7 0.2 0.0 0.2 -0.2 -0.2 -0.7Identified net debt-creating flows 12.5 0.6 -1.8 -12.2 -5.0 1.5 8.6 6.3 4.9 4.3 3.8 3.4 2.7 1.0
Non-interest current account deficit 5.1 3.4 4.2 4.7 4.8 6.9 3.9 1.8 11.2 9.3 7.7 7.1 6.6 6.3 8.1 5.8 4.4 5.4Deficit in balance of goods and services 9.3 9.0 10.4 12.2 12.8 15.7 19.8 17.6 16.0 15.5 15.0 14.8 14.4 13.2
Exports 27.9 28.7 28.5 26.8 27.4 26.2 23.6 24.3 24.6 24.9 25.3 25.7 26.3 28.0Imports 37.2 37.8 39.0 39.0 40.2 41.9 43.4 41.9 40.7 40.4 40.3 40.4 40.7 41.2
Net current transfers (negative = inflow) -4.6 -6.2 -7.0 -7.9 -8.1 -9.1 -5.7 2.3 -9.1 -8.8 -8.9 -8.9 -9.0 -9.0 -9.0 -9.1 -9.4 -9.2Other current account flows (negative = net inflow) 0.5 0.6 0.8 0.4 0.1 0.2 0.6 0.5 0.6 0.6 0.6 0.6 0.6 0.6
Net FDI (negative = inflow) -1.3 -0.8 -0.8 -0.7 -0.8 -1.2 -1.2 0.8 -1.5 -1.5 -1.6 -1.7 -1.8 -1.8 -1.7 -2.0 -2.2 -2.0Endogenous debt dynamics 2/ 8.7 -2.0 -5.2 -16.1 -8.9 -4.3 -1.1 -1.5 -1.2 -1.1 -1.1 -1.1 -1.2 -1.2
Contribution from nominal interest rate 1.4 1.0 1.3 1.5 1.4 1.1 0.7 0.7 1.1 1.0 1.0 0.9 0.9 0.6Contribution from real GDP growth -2.6 -3.4 -0.4 -4.3 -3.5 -3.6 -1.9 -2.2 -2.3 -2.1 -2.1 -2.0 -2.0 -1.8Contribution from price and exchange rate changes 9.9 0.4 -6.1 -13.4 -6.8 -1.8 … … … … … … … …
Residual (3-4) 3/ -11.1 -2.7 9.3 3.2 3.3 -11.2 -26.7 -5.6 -4.7 -4.3 -3.6 -3.6 -2.9 -1.7o/w exceptional financing -0.1 -0.4 -0.6 -1.0 -13.1 -2.3 -27.2 -1.3 -1.3 -1.2 -1.1 -1.1 -0.8 -0.4
NPV of external debt 4/ ... ... ... ... ... 33.1 38.8 38.1 37.8 37.5 37.3 36.8 34.4 25.1In percent of exports ... ... ... ... ... 126.4 164.5 156.9 153.5 150.5 147.4 143.5 130.9 89.8
NPV of PPG external debt ... ... ... ... ... 12.7 13.0 12.6 12.3 12.5 12.7 12.9 14.1 15.4In percent of exports ... ... ... ... ... 48.5 55.0 52.0 50.1 50.0 50.2 50.3 53.6 54.9
Debt service-to-exports ratio (in percent) 12.6 16.8 15.6 15.8 23.6 21.6 16.2 13.4 17.8 17.3 16.7 15.6 13.9 8.8PPG debt service-to-exports ratio (in percent) 8.8 8.4 9.5 8.8 12.7 11.7 6.2 5.0 4.4 4.0 3.8 3.0 3.3 3.7Total gross financing need (billions of U.S. dollars) 0.3 0.4 0.4 0.6 0.8 1.0 1.2 1.1 1.2 1.2 1.2 1.2 1.4 1.8Non-interest current account deficit that stabilizes debt ratio 3.7 5.5 -3.3 13.6 6.5 16.6 29.3 8.6 7.5 7.1 6.4 6.5 6.0 5.1
Key macroeconomic assumptions
Real GDP growth (in percent) 3.2 4.6 0.7 6.7 5.6 5.5 4.4 2.0 3.3 5.6 5.6 5.2 5.0 5.0 4.9 5.0 5.0 5.0GDP deflator in US dollar terms (change in percent) -11.7 -0.5 8.9 19.6 10.4 2.6 1.9 9.5 3.4 4.8 2.8 2.5 2.3 2.6 3.1 1.8 1.9 1.8Effective interest rate (percent) 5/ 1.7 1.3 2.0 2.4 2.2 1.7 2.0 0.4 1.3 1.8 2.6 2.4 2.4 2.3 2.1 2.2 1.6 2.0Growth of exports of G&S (US dollar terms, in percent) -11.9 7.0 9.0 19.7 19.3 3.4 4.4 10.8 -3.8 13.8 10.1 9.2 9.0 9.2 7.9 7.2 7.7 7.5Growth of imports of G&S (US dollar terms, in percent) -3.3 5.5 13.1 27.7 20.1 13.0 7.8 11.4 10.4 6.9 5.4 7.2 7.1 8.0 7.5 6.9 6.9 7.0Grant element of new public sector borrowing (in percent) ... ... ... ... ... ... ... 40.9 45.3 53.5 45.0 45.2 47.1 46.2 45.6 45.6 45.6
Memorandym item:Nominal GDP (billions of US dollars) 4.7 4.9 5.4 6.8 8.0 8.6 9.2 10.2 11.1 11.9 12.8 13.8 19.3 37.5
Source: Staff simulations.
1/ Includes both public and private sector external debt.2/ Derived as [r - g - ρ(1+g)]/(1+g+ρ+gρ) times previous period debt ratio, with r = nominal interest rate; g = real GDP growth rate, and ρ = growth rate of GDP deflator in U.S. dollar terms. 3/ Includes exceptional financing (i.e., changes in arrears and debt relief); changes in gross foreign assets; and valuation adjustments. For projections also includes contribution from price and exchange rate changes.4/ Assumes that NPV of private sector debt is equivalent to its face value.5/ Current-year interest payments devided by previous period debt stock. 6/ Historical averages and standard deviations are generally derived over the past 10 years, subject to data availability.
Actual
Table 1. Senegal: External PPG Debt Sustainability Framework, Baseline Scenario, 2006-2026 1/(In percent of GDP, unless otherwise indicated)
Projections

101
2006 2007 2008 2009 2010 2011 2016 2026
Baseline 13 13 12 12 13 13 14 15
A. Alternative Scenario
New public sector loans on less favorable terms in 2007-26 2/ 13 14 15 16 17 18 24 34
B. Bound Tests
B1. Real GDP growth at historical average minus one standard deviation in 2007-08 13 13 13 13 14 14 15 16B2. Export value growth at historical average minus one standard deviation in 2007-08 3/ 13 17 24 24 24 24 24 21B3. US dollar GDP deflator at historical average minus one standard deviation in 2007-08 13 14 16 16 16 16 18 19B4. Net non-debt creating flows at historical average minus one standard deviation in 2007-08 4/ 13 19 25 25 25 25 25 22B5. Combination of B1-B4 using one-half standard deviation shocks 13 23 36 36 36 36 34 29B6. One-time 30 percent nominal depreciation relative to the baseline in 2007 5/ 13 18 17 17 18 18 20 22
Baseline 55 52 50 50 50 50 54 55
A. Alternative Scenario
New public sector loans on less favorable terms in 2007-26 2/ 55 57 60 64 68 72 93 121
B. Bound Tests
B1. Real GDP growth at historical average minus one standard deviation in 2007-08 55 52 50 50 50 50 54 55B2. Export value growth at historical average minus one standard deviation in 2007-08 3/ 55 85 139 137 134 132 128 108B3. US dollar GDP deflator at historical average minus one standard deviation in 2007-08 55 52 50 50 50 50 54 55B4. Net non-debt creating flows at historical average minus one standard deviation in 2007-08 4/ 55 79 103 101 99 97 94 78B5. Combination of B1-B4 using one-half standard deviation shocks 55 97 159 155 152 148 141 111B6. One-time 30 percent nominal depreciation relative to the baseline in 2007 5/ 55 52 50 50 50 50 54 55
Baseline 6 5 4 4 4 3 3 4
A. Alternative Scenario
New public sector loans on less favorable terms in 2007-26 2/ 6 5 5 5 5 4 5 8
B. Bound Tests
B1. Real GDP growth at historical average minus one standard deviation in 2007-08 6 5 4 4 4 3 3 4B2. Export value growth at historical average minus one standard deviation in 2007-08 3/ 6 6 8 9 8 7 9 8B3. US dollar GDP deflator at historical average minus one standard deviation in 2007-08 6 5 4 4 4 3 3 4B4. Net non-debt creating flows at historical average minus one standard deviation in 2007-08 4/ 6 5 6 6 6 5 6 6B5. Combination of B1-B4 using one-half standard deviation shocks 6 6 8 9 9 8 10 8B6. One-time 30 percent nominal depreciation relative to the baseline in 2007 5/ 6 5 4 4 4 3 3 4
Memorandum item:Grant element assumed on residual financing (i.e., financing required above baseline) 6/ 0 0 0 0 0 0 0 0
Source: Staff projections and simulations.
1/ Stress-tests assume that shocks are fully financed by public sector on non-concessional terms, not by private sector.2/ Assumes that the interest rate on new borrowing is by 3.5 percentage points higher than in the baseline, while grace and maturity periods are the same as in the baseline.3/ Exports values are assumed to remain permanently at the lower level, but the current account as a share of GDP is assumed to return to its baseline level after the shock (implicitly assumingan offsetting adjustment in import levels). 4/ Includes official and private transfers and FDI.5/ Depreciation is defined as percentage decline in dollar/local currency rate, such that it never exceeds 100 percent.6/ Applies to all stress scenarios except for the alternative scenario (less favorable financing) in which the terms on all new financing are as specified in footnote 2.
Table 2. Senegal: Sensitivity Analyses for Key Indicators of External PPG Debt, 2006-26 1/
Debt service ratio
(In percent)
NPV of debt-to-GDP ratio
NPV of debt-to-exports ratio
Projections

102
Estimate
2003 2004 2005
Historical Average 5/
Standard Deviation
5/ 2006 2007 2008 2009 2010 2011
2006-11 Average 2016 2026
2012-26 Average
Public sector debt 1/ 55.1 48.0 46.3 20.3 22.2 23.2 24.3 25.5 26.7 31.5 38.2o/w foreign-currency denominated 51.1 44.4 42.9 17.0 18.2 18.5 18.9 19.5 20.0 22.8 28.6
Change in public sector debt -13.4 -7.0 -1.7 -26.0 2.0 1.0 1.1 1.3 1.1 0.8 0.3Identified debt-creating flows -13.9 -6.9 2.6 -24.3 1.7 1.3 1.3 1.4 1.1 0.9 0.3
Primary deficit 0.5 1.8 2.4 -0.2 1.7 5.0 3.7 3.4 3.4 3.4 3.4 3.7 3.0 2.6 3.0Revenue and grants 20.1 20.6 21.1 21.5 21.7 21.7 21.2 21.3 21.3 21.8 22.8
of which : grants 2.0 2.1 1.7 1.8 1.8 1.8 1.8 1.8 1.8 1.8 1.8Primary (noninterest) expenditure 20.6 22.4 23.4 26.5 25.4 25.0 24.7 24.7 24.8 24.8 25.4
Automatic debt dynamics -13.2 -6.1 2.8 -4.8 -1.0 -1.0 -1.1 -1.1 -1.2 -1.7 -1.4 -1.9 -1.5Contribution from interest rate/growth differential -4.3 -3.1 -2.8 -1.9 -0.9 -0.9 -1.0 -1.0 -1.1 -1.4 -1.9
of which : contribution from average real interest rate 0.0 -0.2 -0.3 -0.5 0.2 0.3 0.1 0.2 0.1 0.1 -0.1of which : contribution from real GDP growth -4.3 -2.9 -2.5 -1.5 -1.1 -1.2 -1.1 -1.2 -1.2 -1.5 -1.8
Contribution from real exchange rate depreciation -8.9 -3.0 5.6 -2.9 -0.2 -0.1 -0.1 -0.1 -0.1 ... ...Other identified debt-creating flows -1.1 -2.6 -2.6 -24.5 -1.0 -1.0 -1.0 -1.0 -1.2 -0.8 -0.4
Privatization receipts (negative) 0.0 0.0 -0.1 0.0 0.0 0.0 0.0 0.0 0.0 0.0 0.0Recognition of implicit or contingent liabilities 0.0 0.0 0.0 0.0 0.0 0.0 0.0 0.0 0.0 0.0 0.0Debt relief (HIPC and other) -1.1 -2.6 -2.5 -24.5 -1.0 -1.0 -1.0 -1.0 -1.2 -0.8 -0.4Other 0.0 0.0 0.0 0.0 0.0 0.0 0.0 0.0 0.0 0.0 0.0
Residual, including asset changes 0.5 -0.1 -4.3 -1.7 0.2 -0.3 -0.2 -0.1 0.0 0.0 0.1
NPV of public sector debt … … … 16.1 16.6 17.0 17.9 18.7 19.5 22.8 24.9o/w foreign-currency denominated … … … 12.7 12.6 12.3 12.4 12.6 12.9 14.1 15.3o/w external ... ... … 12.7 12.6 12.3 12.4 12.6 12.9 14.1 15.3
NPV of contingent liabilities (not included in public sector debt) ... ... ... ... ... ... ... ... ... ... ...Gross financing need 2/ 2.8 6.4 6.4 8.0 6.8 6.6 7.7 8.7 9.3 11.2 11.8NPV of public sector debt-to-revenue ratio (in percent) 3/ … … … 74.7 76.3 78.5 84.1 87.9 91.4 104.7 109.0
o/w external … … … 59.2 57.9 56.8 58.6 59.5 60.3 64.7 67.2Debt service-to-revenue ratio (in percent) 3/ 4/ 12.8 18.4 15.8 11.2 8.6 8.2 7.8 7.4 5.8 5.6 5.8Primary deficit that stabilizes the debt-to-GDP ratio 13.8 8.9 4.1 31.0 1.7 2.4 2.3 2.2 2.3 2.2 2.3 2.2
Key macroeconomic and fiscal assumptionsReal GDP growth (in percent) 6.7 5.6 5.5 4.4 2.0 3.3 5.6 5.6 5.2 5.0 5.0 4.9 5.0 5.0 5.0Average nominal interest rate on forex debt (in percent) 1.7 2.0 1.9 1.8 0.5 0.9 2.0 2.1 1.5 1.6 1.3 1.6 1.3 1.1 1.3Average real interest rate on domestic currency debt (in percent) 2.0 3.2 0.7 0.2 2.3 9.8 6.7 6.7 5.1 4.4 4.3 6.1 2.5 1.3 2.2Real exchange rate depreciation (in percent, + indicates depreciation) -15.4 -6.3 13.5 1.9 12.1 -7.2 ... ... ... ... ... ... ... ... ...Inflation rate (GDP deflator, in percent) -0.1 0.4 2.4 2.0 1.4 3.1 2.5 2.3 2.2 1.8 1.8 2.3 1.8 1.9 1.9Growth of real primary spending (deflated by GDP deflator, in percen 15.4 14.8 10.2 9.3 10.4 16.8 1.3 4.0 3.7 5.2 5.3 6.0 5.0 5.3 5.2Grant element of new external borrowing (in percent) ... ... ... 40.9 45.3 53.5 45.0 45.2 47.1 46.2 45.6 45.6 45.6
Sources: Country authorities; and Fund staff estimates and projections.1/ Public sector comprises central government. Gross debt is used.2/ Gross financing need is defined as the primary deficit plus debt service plus the stock of short-term debt at the end of the last period. 3/ Revenues including grants.4/ Debt service is defined as the sum of interest and amortization of medium and long-term debt.5/ Historical averages and standard deviations are generally derived over the past 10 years, subject to data availability.
Table 3. Senegal: Total PPG Debt Sustainability Framework, Baseline Scenario, 2003-2026(In percent of GDP, unless otherwise indicated)
Actual Projections
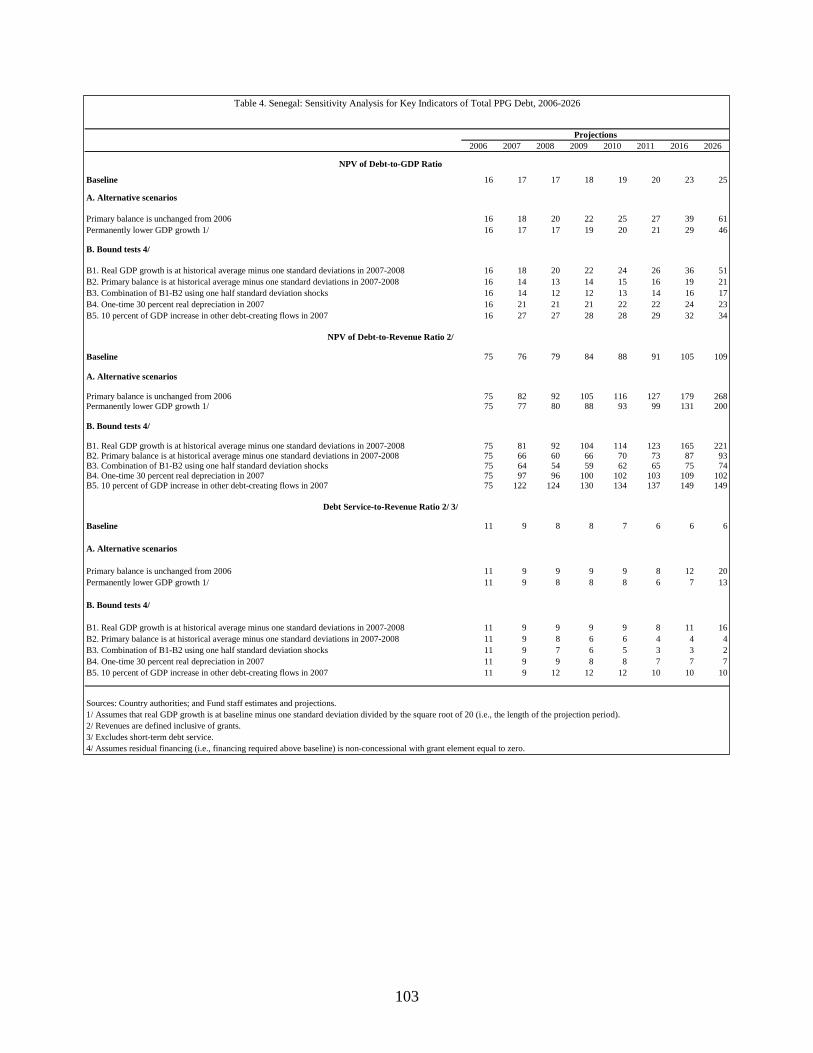
103
2006 2007 2008 2009 2010 2011 2016 2026
Baseline 16 17 17 18 19 20 23 25
A. Alternative scenarios
Primary balance is unchanged from 2006 16 18 20 22 25 27 39 61Permanently lower GDP growth 1/ 16 17 17 19 20 21 29 46
B. Bound tests 4/
B1. Real GDP growth is at historical average minus one standard deviations in 2007-2008 16 18 20 22 24 26 36 51B2. Primary balance is at historical average minus one standard deviations in 2007-2008 16 14 13 14 15 16 19 21B3. Combination of B1-B2 using one half standard deviation shocks 16 14 12 12 13 14 16 17B4. One-time 30 percent real depreciation in 2007 16 21 21 21 22 22 24 23B5. 10 percent of GDP increase in other debt-creating flows in 2007 16 27 27 28 28 29 32 34
Baseline 75 76 79 84 88 91 105 109
A. Alternative scenarios
Primary balance is unchanged from 2006 75 82 92 105 116 127 179 268Permanently lower GDP growth 1/ 75 77 80 88 93 99 131 200
B. Bound tests 4/
B1. Real GDP growth is at historical average minus one standard deviations in 2007-2008 75 81 92 104 114 123 165 221B2. Primary balance is at historical average minus one standard deviations in 2007-2008 75 66 60 66 70 73 87 93B3. Combination of B1-B2 using one half standard deviation shocks 75 64 54 59 62 65 75 74B4. One-time 30 percent real depreciation in 2007 75 97 96 100 102 103 109 102B5. 10 percent of GDP increase in other debt-creating flows in 2007 75 122 124 130 134 137 149 149
Baseline 11 9 8 8 7 6 6 6
A. Alternative scenarios
Primary balance is unchanged from 2006 11 9 9 9 9 8 12 20Permanently lower GDP growth 1/ 11 9 8 8 8 6 7 13
B. Bound tests 4/
B1. Real GDP growth is at historical average minus one standard deviations in 2007-2008 11 9 9 9 9 8 11 16B2. Primary balance is at historical average minus one standard deviations in 2007-2008 11 9 8 6 6 4 4 4B3. Combination of B1-B2 using one half standard deviation shocks 11 9 7 6 5 3 3 2B4. One-time 30 percent real depreciation in 2007 11 9 9 8 8 7 7 7B5. 10 percent of GDP increase in other debt-creating flows in 2007 11 9 12 12 12 10 10 10
Sources: Country authorities; and Fund staff estimates and projections.1/ Assumes that real GDP growth is at baseline minus one standard deviation divided by the square root of 20 (i.e., the length of the projection period).2/ Revenues are defined inclusive of grants.3/ Excludes short-term debt service.4/ Assumes residual financing (i.e., financing required above baseline) is non-concessional with grant element equal to zero.
Table 4. Senegal: Sensitivity Analysis for Key Indicators of Total PPG Debt, 2006-2026
NPV of Debt-to-Revenue Ratio 2/
NPV of Debt-to-GDP Ratio
Debt Service-to-Revenue Ratio 2/ 3/
Projections
104
Annex 6: CAS Consultations and Outreach 27. The CAS consultation process was designed with the objective of listening and gaining a better understanding of the concerns and motivations of stakeholders as well as to get feedback on the effectiveness of Bank Group assistance. This annex describes the main elements of the process adopted by the Bank’s country team to reach out to the Government, the private sector, civil society and the donors operating in Senegal.
Step 1: January-March 2006 -- the path to the CAS Concept note 28. The consultation process started within the WBG with the organization of a brainstorming session at the end January 2006. This session benefited from a large representation from staffs in Washington and in the field as well as from the WBG at large (WBI, MIGA, and IFC). It resulted in a preliminary agreement on the key challenges faced by the WBG in its assistance to Senegal and the identification of the CAS core team, with representatives from the Bank’s Africa Region and technical units, IFC, MIGA, and WBI. This agreement was transferred to the CAS outline that was subsequently shared with the CAS core team, leading to the finalization of the concept note that was presented and endorsed by the Country Team on March 21, 2006.
29. In parallel to the consultation process within the WBG, preliminary consultations with Government officials started in February 2006, notably with the unit in charge of designing and monitoring the implementation of the PRSP over time. Key challenges perceived by the Bank were shared by a group of stakeholders (ranging from Government officials, NGOs representatives, donors, and researchers) in a workshop on poverty organized jointly by the Government and the Bank in Dakar on February 27, 2006. Dialogue with other donors began within the context of the donors’ working group organized around the PRSP, co-chaired by the Bank and UNDP. The primary purpose of the above consultations was to listen and increase common understanding of country conditions and concerns, and the role and interests of diverse stakeholders. These consultations helped define the basic structure of the CAS.
Step 2: April-May 2006: From the Concept Note to the ROC Document
30. The consultation process was intensified within the WBG with the goal to prepare the outcome-based matrix presented in Annex 1. The process was sequential. The first stage was to share the proposed results-based methodology with the entire CAS team through a series of video-conferences with the Dakar office, led by Ronnie Hammad (AFTQK) and moderated by Susan Otis (HRSCE). The CAS TTL and a selected few team members also participated in the CAS Academy training program organized by OPCS. The second stage consisted of four sessions devoted to drafting the outcome-based matrix around the Governance filter and the three pillars on which the proposed CAS is built. The third and final stage helped finalize the draft matrix through an iterative process involving the TTL and the core members of the CAS team.
31. Informal consultations continued in Dakar. A series of meetings was organized by the Dakar office to exchange information and opinions between the CAS team and

105
representatives from: (i) the media; (ii) civil society; and (iii) the private sector. Follow-up meetings were organized with Government representatives, including the Minister of Economy and Finance, to share the World Bank’s vision and agree on a tentative timetable for in-country consultations. On June 20, a one-day workshop was organized in Dakar during which the CAS team shared its views and discussed the broad lines of the proposed CAS for the period FY07-10. This workshop included representatives from the four working groups supporting the implementation of the second-generation PRSP in Senegal, including: (i) central Government; (ii) local Governments; (iii) civil society and the private sector; and (iv) donors.
Step 3: July 2006-March 2007 32. A more formal consultation process was launched in the country, followed clearance from the ROC meeting. It was principally managed by the Country Office (under the responsibility of the Information Coordinator) in close collaboration with the TTL, and with the support of HRSCE. It is worth under scoring that the consultations were fully integrated in the participatory process surrounding the finalization of the PRSP by the Government. Not only were key stakeholders identical in both processes, but the Bank was also co-chairing the group of donors involved in the PRSP. This opportunity allows us to align perfectly the CAS with the PRSP priorities.
33. The CAS consultations also benefited from the GAC consultations (December 2006-January 2007), which were an additional opportunity to go more deeply in some complex issues on governance and corruption. Participants in all sessions welcome the consultation as an opportunity to raise and to discuss on national issues, including (i) the role of civil society; (ii) greater transparency and efficiency in the use of public resources; (iii) economic growth and transparency; (iv) investment climate; (v) human development/shared growth; (vi) public sector accountability; (vii) judicial system; and (viii) mechanisms for private sector governance
34. Last but not least, the consultation process included the presentation of the second PRSP to the Bank’s Board of Director on January 30, 2007, which has allowed the country team to account for the Directors’ concerns and comments.
106
Annex 7: CAS Harmonization and Coordination with Other Donors
A. Background 35. Aligning the WBG support with the PRSP objectives as well as harmonizing it with the assistance provided by other partners is at the hearth of the CAS agenda over the period FY07-FY10. This goal is shared by the Senegalese authorities, who made clear their willingness to increase aid effectiveness in accordance with their commitment to the Paris Declaration. In particular, the decision to establish an action plan on harmonization, alignment and aid effectiveness is explicitly mentioned in the PRSP-II. The MEF has set up an internal working group, chaired by the CSPLP, and tasked with the preparation of this action plan.
B. Recent Developments
36. Remarkable progress has been achieved by the government and its development partners in recent years. Donors strongly improved their coordination in the education sector, with better alignment of project cycles and the preparation of a procedure manual. The complexity of the sector and bottlenecks in implementation capacity within the Government led to the decision that different types of aid instruments were still needed at this point in time. Some partners (France, Netherlands, EU and Canada) are working on the implementation of a sector budget support, and some decided to jointly finance capacity building activities (World Bank and France). This increased harmonization builds on Government achievements, particularly a sectoral MTEF, a Government led policy framework, a unit within the Ministry of Education designated as a focal point for donor-Government relations, and a common matrix of objectives.
37. Similarly, donors active in public financial management reform jointly support a Government led program. The World Bank set up a trust fund to harmonize the financing of this program. A MOU will soon formalize the strong existing coordination between the donors providing general budget support, including the Bank through its PRSC series. In decentralization and local development, the government designed with support from the World Bank a national program (Programme National de Developpement Local – PNDL) which is designed to serve as a conduit though which all local development activities will be channeled. The recently approved IDA Participatory Development Project will support the PNDL, and all donors agree to participate in the PNDL as soon as the existing projects are closing, thus progressively operationalizing a Sector-Wide approach. In the water sector, all donors have agreed to use the integrated project coordination unit set up within the Ministry of Water Resources. In most sectors, donors coordinate through sector working groups and have agreed to designate a lead donor for discussion with the Government.
38. These achievements are encouraging but are still too limited. Donor-Government relations need to be substantially improved, with actions to be taken both by the donors and by the Government.

107
39. A survey of the most important partners undertaken by the World Bank in the first quarter of 2006 confirms that many donors are very active in Senegal, with a total portfolio estimated at around US$2.3 billions at the end of 2005, including almost 500 projects. The largest donors are by decreasing order the World Bank, the African Development Bank, the European Union, and USAID (Table 1).
Table 1: A snapshot of Aid in Senegal – end of 2005
Development partners Portfolio amount at end
2005 US$ Million
Number of projects
% Grants Number of co-financed
projects
SCAC 44.3 30 100.0 3 ONUDI 6.0 8 100.0 5 AFD 171.9 23 62.0 8 Espagne 3.6 15 100.0 3 ACDI 65.2 50 100.0 0 Japon 0.2 17 100.0 1 Autriche 8.5 9 100.0 3 BAD 338.7 18 14.0 8 FAO 8.9 49 100.0 22 FMI 35.2 1 0.0 0 Belgique 43.8 14 100.0 6 World Bank 672.2 17 0.0 8 Grande Bretagne 3.0 10 100.0 0 KFW-GTZ 91.8 10 100.0 4 PNUD-FENU 44.0 52 100.0 9 Luxembourg 43.0 23 100.0 4 UE 370.9 42 100.0 1 Suède 11.0 3 100.0 0 USAID 215.8 5 100.0 0 UNIFEM 3.3 11 100.0 0 PAM 13.7 4 100.0 0 Italie 21.2 11 100.0 0 Suisse 2.0 4 100.0 0 Pays Bas 22.6 22 100.0 9 OMS 6.3 2 100.0 0 UNICEF 33.6 14 100.0 14 BIT 10.1 10 100.0 10 Total 2290.8 474 88% 118 Source: Donors’ survey 40. This survey also points to a series of concerns. The number of active projects is very high (474 by end 2005, for an average amount of only 5 millions dollars), with a small proportion of co-financed projects (1 on 4). Some sectors have a strong donor concentration (education, health, rural development, governance and decentralization, private sector development), leading to increased coordination issues. Project management activities (procurement, monitoring, financial reporting, auditing, etc.)

108
impose a strong burden on the limited capacities of the Senegalese administration, especially as harmonization efforts are still limited. Budget support accounts for only 10% of all aid flows to Senegal. Aid alignment on the PRSP priorities is unsatisfactory, the third pillar receiving very little attention from donors. Within the four pillars, some sectors receive a very small share of financing, like energy with only 2 percent of total aid resources.
41. The World Bank survey also revealed a strong gap between donors’ disbursements and aid flows reported in the TOFE. MEF’s data on ongoing projects and programs as well as on forecasted and effective disbursements is partial and not updated. In many cases, donors don’t provide to the MEF the required data, or provide it too late. The responsibilities within the MEF for aid program monitoring are unclear and spread on a number of units. Last, many donors, including important ones, don’t take part to the joint discussions and work to increase aid effectiveness.
Table 2: Donors’ Disbursements (Executed and Planned), 2003-2010 (US$ Million)
Disbursements Planned Disbursements 2003 2004 2005 2003-
2005 2006 2007 2008 2009 2010 2006-
2010 Budget support 5.5 59.9 43.7 109.1 139.9 114.3 110.8 119.8 100.8 585.7 Credits 5.0 52.4 13.8 71.3 88.0 51.8 44.5 44.5 30.0 258.7 Grants 0.5 7.5 29.9 37.8 52.0 62.5 66.3 75.3 70.8 327.0 Program/project support 498.1 684.3 765.9 1,948.4 547.8 564.8 537.1 509.9 489.9 2,649.4 Credits 76.1 104.6 117.0 297.7 83.7 86.3 82.1 77.9 74.8 404.8 Grants 422.0 579.8 648.9 1,650.7 464.1 478.5 455.0 432.0 415.0 2,244.6 Pillar 1 – Wealth creation 186.1 261.2 262.3 709.6 267.1 295.2 309.8 290.3 317.8 1,480.1 Pillar 2 – Capacity building 90.4 139.3 199.8 429.5 185.8 165.4 125.3 129.1 107.0 712.6 Pillar 3 – Vulnerable groups 15.0 19.1 34.1 68.2 31.3 6.6 6.8 3.5 3.5 51.7 Pillar 4 – Governance and participatory processes
206.7 264.7 269.7 741.1 63.7 97.7 95.1 86.9 61.7 405.0
Total Disbursements 503.6 744.2 809.6 2,057.5 687.7 679.1 647.9 629.7 590.7 3,235.1 Total Credits 81.1 157.0 130.8 369.0 171.6 138.0 126.6 122.4 104.8 663.5 Total Grants 422.5 587.3 678.8 1,688.5 516.1 541.0 521.3 507.3 485.9 2,571.6 Memos: Credits as % of total disbursements
16.1% 21.1% 16.2% 17.8% 25.0% 20.3% 19.5% 19.4% 17.7% 20.4%
Grants as % of total disbursements
83.9% 78.9% 83.8% 82.2% 75.0% 79.7% 80.5% 80.6% 82.3% 79.6%
Budget support as % of total 1.1% 8.0% 5.4% 5.3% 20.3% 16.8% 17.1% 19.0% 17.1% 18.1% Source : Donor’s survey.
42. The Monitoring survey of the Paris Declaration points to very similar conclusions. There are strong discrepancies between aid levels disbursed by donors and the amounts they report to the government, as well as between previsions and effective disbursements. In addition, the survey shows that donors maintain a large number of parallel PIUs (60) and coordinate a very small fraction of their missions (only 22% of the 307 annual missions are joint), and that major donors still have a long way to go to undertake jointly their analytical work.
109
43. Besides, many bottlenecks within the Senegalese administration are slowing the move towards program and budget support. A joint diagnostic of these structural obstacles should be quickly undertaken. The following elements, some of which appear in the PRSP-II, are likely to come out from such a study. Administrative capacities are still limited, and many donors rely on parallel or independent project units to implement their projects, which further weaken ministries’ capacities. The Government has not yet formulated a national capacity building strategy, which would be reflected in the sectoral policies, and on which donors would align and harmonize their support. Severe limitations in the recruiting and remuneration policies of the Senegalese Government prevent the administration to deliver core basic services, especially outside of Dakar.
C. Recommendations 44. The harmonization action plan announced in the PRSP-II should aim at overcoming these difficulties. Consistent with the mutual accountability promoted by the Paris Declaration, the logic should not be to list a set of conditions (on the charge of the Government or of the partners), but to start a virtuous circle where donors and the Government would jointly build the foundations for a more efficient aid. Many countries, including in Africa, already have such action plans (Ghana, Ethiopia), or have started a process to establish one (Mali, Rwanda, Tanzania--where the aid effectiveness agenda encompasses a very rich and diverse set of activities)
45. Such an action plan could be based on the list of indicators of the Paris Declaration, and establish clear methodologies, stages and targets. It should form a coherent set of actions, each part building on the achievements in the other parts, and with responsibilities shared between the Government and donors. Its main axes could be:
• Improving the quality of Government-partners dialogue. • Improving aid management and monitoring by the Government (both MEF
and sector ministries). • Improving alignment of aid on PRSP priorities. • Harmonizing capacity building activities around a strategy defined by the
Government. • Reducing aid dispersion. • Pursuing public financial management reform, and more broadly improving
governance. • Harmonizing donor procedures, increasing program and budget support.
46. The drafting of this action plan should build on the monitoring exercise of the Paris Declaration. The numerical targets in the action plan would be determined on the basis of the 2005 baseline as it results from the Paris Declaration monitoring questionnaire. The government could work to include in this exercise some important donors who did not take part in the Paris Declaration monitoring survey or reply to the World Bank questionnaire. Partners should make available the necessary resources for the preparation and implementation of this plan. Taking example of achievements or ongoing efforts in countries like Rwanda, Ghana or Mali, the Ministry of Finance should

110
designate a focal point to lead the work, with active support from donors, and a dedicated government-donor aid effectiveness working group should be established.
47. The World Bank should take an active role in facilitating, and in some cases leading, the joint effort to set up new program approaches for increased harmonization. In sectors like agriculture development, transport or environment, or in the support of the Senegal River basin, donors and the government are actively laying the bricks for the implementation of sector-wide approaches, and in some cases have already agreed on joint supervision and joint monitoring requirements. The Bank should be flexible and adopt a proactive approach to project restructuring to support any new sector-wide approach and reduce the administrative burden on the Senegalese administration. Similarly, the Bank should strive to undertake in a joint manner all new Analytical and Advisory Activities.

111
Annex 8: Senegal at a Glance (CAS Annex A2)
Sub-Key Development Indicators Saharan Low
Senegal Africa income(2005)
Population, mid-year (millions) 10.8 741 2,353Surface area (thousand sq. km) 197 24,265 29,265Population growth (%) 2.4 2.1 1.8Urban population (% of total population) 42 35 30
GNI (Atlas method, US$ billions) 7.7 552 1,364GNI per capita (Atlas method, US$) 710 745 580GNI per capita (PPP, international $) 1,770 1,981 2,486
GDP growth (%) 5.5 5.3 7.5GDP per capita growth (%) 3.1 3.1 5.6
(most recent estimate, 2000–2005)
Poverty headcount ratio at $1 a day (PPP, %) 24 a 44 ..Poverty headcount ratio at $2 a day (PPP, %) 66 a 75 ..Life expectancy at birth (years) 56 46 59Infant mortality (per 1,000 live births) 78 100 80Child malnutrition (% of children under 5) 23 29 39
Adult literacy, male (% of ages 15 and older) 51 .. 73Adult literacy, female (% of ages 15 and older) 29 .. 50Gross primary enrollment, male (% of age group) 83 99 110Gross primary enrollment, female (% of age group) 77 87 99
Access to an improved water source (% of population) 76 56 75Access to improved sanitation facilities (% of population) 57 37 38
Net Aid Flows 1980 1990 2000 2005 b
(US$ millions)Net ODA and official aid 263 818 423 1,052Top 3 donors (in 2004): France 108 230 147 510 Japan 5 82 48 50 United States 36 57 23 50
Aid (% of GNI) 9.1 14.9 9.9 14.1Aid per capita (US$) 44 103 41 92
Long-Term Economic Trends
Consumer prices (annual % change) 8.7 0.3 0.7 1.7GDP implicit deflator (annual % change) 11.5 1.2 3.3 2.4
Exchange rate (annual average, local per US$) 211.3 272.3 710.1 527.5Terms of trade index (2000 = 100) 99 99 100 96
1980–90 1990–2000 2000–05
Population, mid-year (millions) 5.5 7.3 9.5 10.8 2.9 2.6 2.4GDP (US$ millions) 3,503 5,717 4,692 8,640 2.6 3.1 4.6
Agriculture 17.9 17.9 16.9 14.4 1.7 2.8 1.3Industry 17.9 19.9 20.5 21.6 3.1 3.8 5.3 Manufacturing 12.0 13.7 12.9 13.8 3.0 3.0 3.7Services 64.2 62.2 62.7 64.0 2.7 2.9 5.1
Household final consumption expenditure 73.1 79.2 76.0 77.5 3.2 2.8 4.4General gov't final consumption expenditure 24.8 18.4 12.8 12.7 0.5 0.9 1.8Gross capital formation 14.6 18.0 22.4 25.6 5.4 0.3 9.2
Exports of goods and services 23.9 25.4 27.9 25.8 4.0 2.8 2.5Imports of goods and services 38.4 32.2 37.2 41.6 3.4 2.4 5.0Gross savings 0.1 -0.5 14.6 16.2 0.6 10.3 8.5
Note: Figures in italics are for years other than those specified. 2005 data are preliminary estimates. .. indicates data are not available.a. Country poverty estimate is for 1995. b. Aid data are for 2004.
Development Economics, Development Data Group (DECDG).
(average annual growth %)
(% of GDP)
20 10 0 10 20
0-4
10-14
20-24
30-34
40-44
50-54
60-64
70-74
percent
Age distribution, 2005
Male Female
0
50
100
150
200
1990 1995 2000 2004
Senegal Sub-Saharan Africa
Under-5 mortality rate (per 1,000)
-10
-5
0
5
10
90 95 00 05
GDP GDP per capita
Growth of GDP and GDP per capita (%)

112
Annex 8: Senegal at a Glance (Cont’d) Balance of Payments and Trade 2000 2005
(US$ millions)Total merchandise exports (fob) 922 1,543Total merchandise imports (cif) 1,340 2,872Net trade in goods and services -418 -1,329
Workers' remittances and compensation of employees (receipts) 217 617
Current account balance -201 -696 as a % of GDP -4.3 -8.1
Reserves, including gold 385 1,261
Central Government Finance
(% of GDP)Revenue 17.3 19.9 Tax revenue 16.9 19.7Expense 18.7 24.3
Technology and Infrastructure 2000 2004Cash surplus/deficit -1.4 -4.4
Paved roads (% of total) 29.3 29.3Highest marginal tax rate (%) Fixed line and mobile phone Individual 50 0 subscribers (per 1,000 people) 44 72 Corporate 35 .. High technology exports
(% of manufactured exports) 7.6 6.5External Debt and Resource Flows
Environment(US$ millions)Total debt outstanding and disbursed 3,607 3,938 Agricultural land (% of land area) 42 42Total debt service 224 335 Forest area (% of land area, 2000 and 2005) 46.2 45.0HIPC and MDRI debt relief (expected; flow) 850 .. Nationally protected areas (% of land area) .. 11.6
Total debt (% of GDP) 82.3 51.6 Freshwater resources per capita (cu. meters) .. 2,266Total debt service (% of exports) 13.9 11.4 Freshwater withdrawal (% of internal resources) .. 8.6
Foreign direct investment (net inflows) 63 70 CO2 emissions per capita (mt) 0.37 0.38Portfolio equity (net inflows) -2 4
GDP per unit of energy use (2000 PPP $ per kg of oil equivalent) 5.1 5.2
Energy use per capita (kg of oil equivalent) 284 287
World Bank Group portfolio 2000 2005
(US$ millions)
IBRD Total debt outstanding and disbursed 1 0 Disbursements 0 0 Principal repayments 3 0 Interest payments 0 0
IDA Total debt outstanding and disbursed 1,330 2,060 Disbursements 92 182
Private Sector Development 2000 2005 Total debt service 19 46
Time required to start a business (days) – 57 IFC (fiscal year)Cost to start a business (% of GNI per capita) – 108.7 Total disbursed and outstanding portfolio 23 45Time required to register property (days) – 114 of which IFC own account 13 34
Disbursements for IFC own account 5 1Ranked as a major constraint to business Portfolio sales, prepayments and (% of managers surveyed who agreed) repayments for IFC own account 2 3 Cost of financing .. 65.3 Access to financing .. 55.4 MIGA
Gross exposure 0 15Stock market capitalization (% of GDP) .. .. New guarantees 0 0Bank branches (per 100,000 people) .. ..
Note: Figures in italics are for years other than those specified. 2005 data are preliminary estimates. 3/21/07.. indicates data are not available. – indicates observation is not applicable.
Development Economics, Development Data Group (DECDG).
0 25 50 75 100
Control of corruption
Rule of law
Regulatory quality
Political stability
Voice and accountability
Country's percentile rank (0-100)higher values imply better ratings
2004
2000
Governance indicators, 2000 and 2004
Source: Kaufmann-Kraay-Mastruzzi, World Bank
Short-term, 36
IBRD, 0
Other multi- lateral, 901
IMF, 204
IDA, 2,040
Private, 168
Bilateral, 589
Composition of total external debt, 2004
US$ millions

113
Annex 9: Key Economic Indicators (CAS Annex B6)
Indicator 2000 2001 2002 2003 2004 2005 2006 2007 2008 2009 2010 National accounts (as % GDP at current market prices) Gross domestic product 100 100 100 100 100 100 100 100 100 100 100 Agriculturea 16.9 16.3 13.6 15.5 14.0 14.4 14.7 14.5 14.4 14.2 14.2 Industrya 20.5 21.7 22.3 21.5 22.1 21.6 20.2 20.4 20.8 21.1 21.1 Servicesa 62.7 62.0 64.0 63.0 63.9 64.0 65.1 65.1 64.8 64.7 64.7 Total Consumption 88.8 90.5 94.4 92.3 90.2 90.9 91.2 91.5 91.3 90.5 88.9 Gross domestic fixed investment 20.5 18.4 17.2 21.0 21.1 25.6 26.4 26.6 27.0 27.0 27.0 Government investment 5.6 6.5 7.4 8.5 9.8 10.0 10.7 10.8 10.9 11.0 11.0 Private investment (includes increase in stocks) 16.0 13.3 11.5 15.4 13.9 15.6 15.6 15.8 16.0 16.3 16.3 Exports (GNFS)b 27.9 28.7 28.5 26.8 26.7 25.8 23.3 23.9 24.0 17.2 17.2 Imports (GNFS) 37.2 37.8 39.0 39.0 39.8 41.6 43.0 41.4 40.0 32.6 32.6 Gross domestic savings 12.3 10.8 8.5 11.8 10.9 9.9 6.6 9.0 11.0 11.9 12.4 Gross national savingsc 15.0 15.5 13.4 17.8 17.6 17.6 14.4 16.7 18.3 19.3 19.9 Memorandum items Gross domestic product 4692.0 4881.9 5350.7 7617.0 8102.0 8639.9 9196.1 9948.5 10775.4 11647.5 12462.8 (US$ million at current prices) Gross national product per 514.4 517.0 556.7 791.3 828.2 867.8 901.6 950.2 1001.6 1057.7 1116.9 capita (US$, Atlas method) Real annual growth rates (%, calculated from 1999 prices) Gross domestic product at market prices 3.2 4.6 0.7 6.7 5.6 5.5 3.3 5.6 5.9 5.9 5.9 Gross Domestic Income 3.2 5.7 0.8 6.3 6.3 5.7 4.6 4.9 5.3 5.8 6.5 Real annual per capita growth rates (%, calculated from 1999 prices) Gross domestic product at market prices 0.7 2.0 -1.8 4.1 3.0 2.9 0.8 3.0 3.4 3.3 3.3 Total consumption -1.7 1.9 1.7 0.2 2.1 1.5 0.6 2.3 3.0 3.9 3.9 Private consumption -4.4 2.5 1.8 0.3 2.0 2.7 1.0 1.8 2.6 3.7 3.7
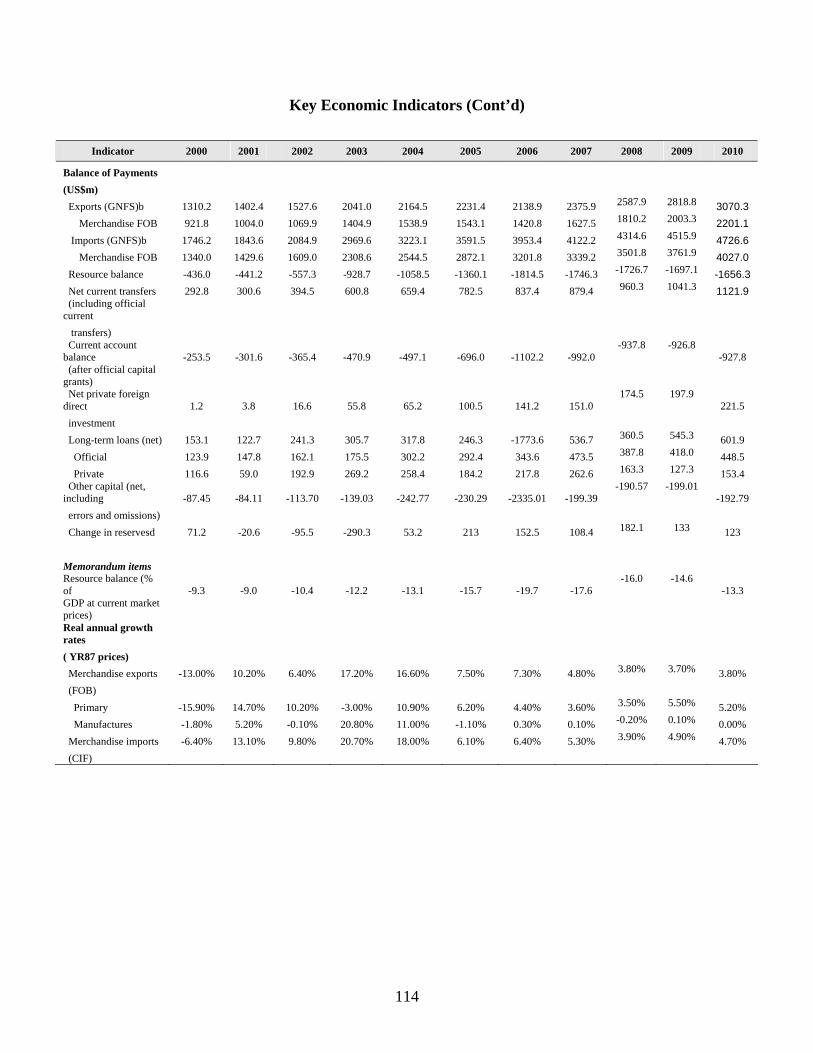
114
Key Economic Indicators (Cont’d)
Indicator 2000 2001 2002 2003 2004 2005 2006 2007 2008 2009 2010
Balance of Payments (US$m) Exports (GNFS)b 1310.2 1402.4 1527.6 2041.0 2164.5 2231.4 2138.9 2375.9 2587.9 2818.8 3070.3 Merchandise FOB 921.8 1004.0 1069.9 1404.9 1538.9 1543.1 1420.8 1627.5 1810.2 2003.3 2201.1 Imports (GNFS)b 1746.2 1843.6 2084.9 2969.6 3223.1 3591.5 3953.4 4122.2 4314.6 4515.9 4726.6 Merchandise FOB 1340.0 1429.6 1609.0 2308.6 2544.5 2872.1 3201.8 3339.2 3501.8 3761.9 4027.0 Resource balance -436.0 -441.2 -557.3 -928.7 -1058.5 -1360.1 -1814.5 -1746.3 -1726.7 -1697.1 -1656.3 Net current transfers 292.8 300.6 394.5 600.8 659.4 782.5 837.4 879.4 960.3 1041.3 1121.9 (including official current
transfers) Current account balance -253.5 -301.6 -365.4 -470.9 -497.1 -696.0 -1102.2 -992.0
-937.8 -926.8 -927.8
(after official capital grants)
Net private foreign direct 1.2 3.8 16.6 55.8 65.2 100.5 141.2 151.0
174.5 197.9 221.5
investment Long-term loans (net) 153.1 122.7 241.3 305.7 317.8 246.3 -1773.6 536.7 360.5 545.3 601.9 Official 123.9 147.8 162.1 175.5 302.2 292.4 343.6 473.5 387.8 418.0 448.5 Private 116.6 59.0 192.9 269.2 258.4 184.2 217.8 262.6 163.3 127.3 153.4 Other capital (net, including -87.45 -84.11 -113.70 -139.03 -242.77 -230.29 -2335.01 -199.39
-190.57 -199.01 -192.79
errors and omissions) Change in reservesd 71.2 -20.6 -95.5 -290.3 53.2 213 152.5 108.4 182.1 133 123 Memorandum items Resource balance (% of -9.3 -9.0 -10.4 -12.2 -13.1 -15.7 -19.7 -17.6
-16.0 -14.6 -13.3
GDP at current market prices)
Real annual growth rates
( YR87 prices) Merchandise exports -13.00% 10.20% 6.40% 17.20% 16.60% 7.50% 7.30% 4.80% 3.80% 3.70% 3.80% (FOB) Primary -15.90% 14.70% 10.20% -3.00% 10.90% 6.20% 4.40% 3.60% 3.50% 5.50% 5.20% Manufactures -1.80% 5.20% -0.10% 20.80% 11.00% -1.10% 0.30% 0.10% -0.20% 0.10% 0.00% Merchandise imports -6.40% 13.10% 9.80% 20.70% 18.00% 6.10% 6.40% 5.30% 3.90% 4.90% 4.70% (CIF)
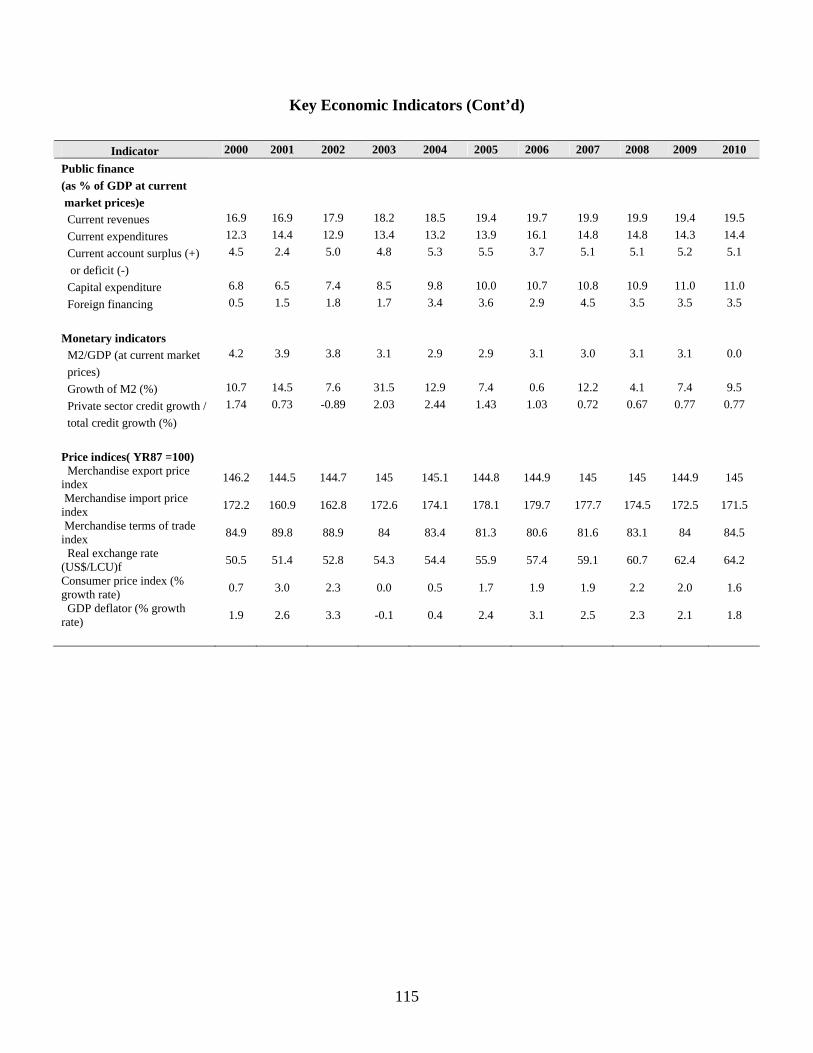
115
Key Economic Indicators (Cont’d)
Indicator 2000 2001 2002 2003 2004 2005 2006 2007 2008 2009 2010 Public finance (as % of GDP at current market prices)e Current revenues 16.9 16.9 17.9 18.2 18.5 19.4 19.7 19.9 19.9 19.4 19.5 Current expenditures 12.3 14.4 12.9 13.4 13.2 13.9 16.1 14.8 14.8 14.3 14.4 Current account surplus (+) 4.5 2.4 5.0 4.8 5.3 5.5 3.7 5.1 5.1 5.2 5.1 or deficit (-) Capital expenditure 6.8 6.5 7.4 8.5 9.8 10.0 10.7 10.8 10.9 11.0 11.0 Foreign financing 0.5 1.5 1.8 1.7 3.4 3.6 2.9 4.5 3.5 3.5 3.5 Monetary indicators M2/GDP (at current market 4.2 3.9 3.8 3.1 2.9 2.9 3.1 3.0 3.1 3.1 0.0 prices) Growth of M2 (%) 10.7 14.5 7.6 31.5 12.9 7.4 0.6 12.2 4.1 7.4 9.5 Private sector credit growth / 1.74 0.73 -0.89 2.03 2.44 1.43 1.03 0.72 0.67 0.77 0.77 total credit growth (%) Price indices( YR87 =100) Merchandise export price index 146.2 144.5 144.7 145 145.1 144.8 144.9 145 145 144.9 145
Merchandise import price index 172.2 160.9 162.8 172.6 174.1 178.1 179.7 177.7 174.5 172.5 171.5
Merchandise terms of trade index 84.9 89.8 88.9 84 83.4 81.3 80.6 81.6 83.1 84 84.5
Real exchange rate (US$/LCU)f 50.5 51.4 52.8 54.3 54.4 55.9 57.4 59.1 60.7 62.4 64.2
Consumer price index (% growth rate) 0.7 3.0 2.3 0.0 0.5 1.7 1.9 1.9 2.2 2.0 1.6
GDP deflator (% growth rate) 1.9 2.6 3.3 -0.1 0.4 2.4 3.1 2.5 2.3 2.1 1.8

116
Annex 10: Key Exposure Indicators (CAS Annex B7)
2001 2002 2003 2004 2005 2006 2007 2008 2009 2010 Total debt outstanding and disbursed (TDO) (US$m)a 3,665 4,121 ..
Net disbursements (US$m)a 196 198 .. Total debt service (TDS) 213 219 244 (US$m)a Debt and debt service indicators (%) TDO/XGSb 205.3 209.8 .. TDO/GDP 80.3 82.5 .. TDS/XGS 12.0 11.2 9.8 Concessional/TDO 75.0 75.5 .. IBRD exposure indicators (%) IBRD DS/public DS 0.8 0.0 0.0 Preferred creditor DS/public 47.1 47.7 45.3 DS (%)c IBRD DS/XGS 0.1 0.0 0.0 0.0 IBRD TDO (US$m)d 0 0 0 0 Of which present value of guarantees (US$m)
Share of IBRD portfolio (%) 0 0 0 0 IDA TDO (US$m)d 1,384 1,578 1,806 2,040 IFC (US$m) Loans Equity and quasi-equity /c MIGA MIGA guarantees (US$m)
a Includes public and publicly guaranteed debt, private non-guaranteed, use of IMF credits and net short-term capital. b "XGS" denotes exports of goods and services, including workers' remittances. c Preferred creditors are defined as IBRD, IDA, the regional multilateral development banks, the IMF, and the Bank for International Settlements. d Includes present value of guarantees. e Includes equity and quasi-equity types of both loan and equity instruments.
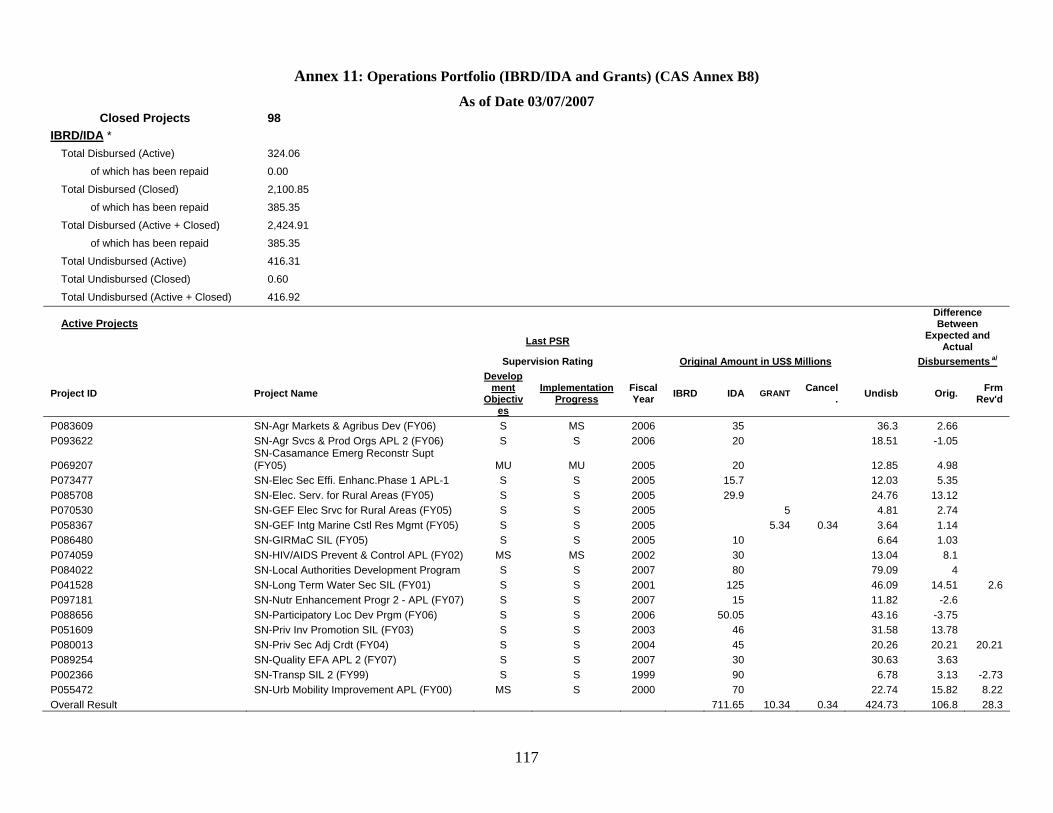
117
Annex 11: Operations Portfolio (IBRD/IDA and Grants) (CAS Annex B8) As of Date 03/07/2007
Closed Projects 98 IBRD/IDA *
Total Disbursed (Active) 324.06 of which has been repaid 0.00 Total Disbursed (Closed) 2,100.85 of which has been repaid 385.35 Total Disbursed (Active + Closed) 2,424.91 of which has been repaid 385.35 Total Undisbursed (Active) 416.31 Total Undisbursed (Closed) 0.60 Total Undisbursed (Active + Closed) 416.92
Active Projects Difference Between
Last PSR Expected and
Actual Supervision Rating Original Amount in US$ Millions Disbursements a/
Project ID Project Name Develop
ment Objectiv
es
Implementation Progress
Fiscal Year IBRD IDA GRANT Cancel
. Undisb Orig. Frm Rev'd
P083609 SN-Agr Markets & Agribus Dev (FY06) S MS 2006 35 36.3 2.66 P093622 SN-Agr Svcs & Prod Orgs APL 2 (FY06) S S 2006 20 18.51 -1.05
P069207 SN-Casamance Emerg Reconstr Supt (FY05) MU MU 2005 20 12.85 4.98
P073477 SN-Elec Sec Effi. Enhanc.Phase 1 APL-1 S S 2005 15.7 12.03 5.35 P085708 SN-Elec. Serv. for Rural Areas (FY05) S S 2005 29.9 24.76 13.12 P070530 SN-GEF Elec Srvc for Rural Areas (FY05) S S 2005 5 4.81 2.74 P058367 SN-GEF Intg Marine Cstl Res Mgmt (FY05) S S 2005 5.34 0.34 3.64 1.14 P086480 SN-GIRMaC SIL (FY05) S S 2005 10 6.64 1.03 P074059 SN-HIV/AIDS Prevent & Control APL (FY02) MS MS 2002 30 13.04 8.1 P084022 SN-Local Authorities Development Program S S 2007 80 79.09 4 P041528 SN-Long Term Water Sec SIL (FY01) S S 2001 125 46.09 14.51 2.6 P097181 SN-Nutr Enhancement Progr 2 - APL (FY07) S S 2007 15 11.82 -2.6 P088656 SN-Participatory Loc Dev Prgm (FY06) S S 2006 50.05 43.16 -3.75 P051609 SN-Priv Inv Promotion SIL (FY03) S S 2003 46 31.58 13.78 P080013 SN-Priv Sec Adj Crdt (FY04) S S 2004 45 20.26 20.21 20.21 P089254 SN-Quality EFA APL 2 (FY07) S S 2007 30 30.63 3.63 P002366 SN-Transp SIL 2 (FY99) S S 1999 90 6.78 3.13 -2.73 P055472 SN-Urb Mobility Improvement APL (FY00) MS S 2000 70 22.74 15.82 8.22 Overall Result 711.65 10.34 0.34 424.73 106.8 28.3

118
Annex 12: Selected Indicators of Bank Portfolio Performance and Management (CAS Annex B2)
As of Date 03/07/2007
Indicator 2004 2005 2006 2007 Portfolio Assessment Number of Projects Under Implementation a 14 15 15 16 Average Implementation Period (years) b 4.5 3.4 2.9 3.1 Percent of Problem Projects by Number a, c 21.4 6.7 0.0 6.3 Percent of Problem Projects by Amount a, c 30.4 7.0 0.0 2.8 Percent of Projects at Risk by Number a, d 21.4 6.7 6.7 6.3 Percent of Projects at Risk by Amount a, d 30.4 7.0 3.1 2.8 Disbursement Ratio (%) e 24.6 39.7 29.0 19.7 Portfolio Management Yes Yes Yes Yes CPPR during the year (yes/no) Supervision Resources (total US$) 500.37 527.51 446.39 415.61 Average Supervision (US$/project) 83.40 87.92 89.28 69.27 Memorandum Item Since FY 80 Last Five FYs Proj Eval by OED by Number 80 16 Proj Eval by OED by Amt (US$ millions) 1,952.2 528.7 % of OED Projects Rated U or HU by Number 28.8 18.8 % of OED Projects Rated U or HU by Amt 24.7 15.5 a. As shown in the Annual Report on Portfolio Performance (except for current FY). b. Average age of projects in the Bank's country portfolio. d. As defined under the Portfolio Improvement Program. e. Ratio of disbursements during the year to the undisbursed balance of the Bank's portfolio at the beginning of the year: Investment projects only. * All indicators are for projects active in the Portfolio, with the exception of Disbursement Ratio, which includes all active projects as well as projects which exited during the fiscal year.

119
Annex 13: IBRD/IDA Program Summary (CAS Annex B3) As of Date 03/15/2007
Fiscal year Proj ID US$(M)
2007 PRSC III 20.0 Nutrition Enhancement II 15.0 Quality Education for All II 30.0 Local Authorities Development Program 80.0 Regional WAAP 5.0 Sub-total 150.0 2008 * Dakar/Diamniadio Toll Road * Energy Sector Recovery DPL * Funding source not yet determined 2009 PRSC IV/Accelerated Growth Strategy 60.0 Sustain. Energy Management (PRODEGE) 10.0 MTA/SN/GM Integration Project 20.0 Urban Mobility II/Transport III 50.0 Judicial Governance 10.0 Sub-total 150.0 2010 PRSC V 30.0 Water and Sanitation 60.0 Electricity for Rural Areas II 30.0 Regional Bio-safety Project TBD Senegal River Multimodal Navigation TBC Sub-total 120.0 Overall Result 420.0
*Dakar/Diamniadio Toll Road (50); Energy Sector Recovery DPL (50) e (funding not yet determined)

120
Annex 14: CAS Summary of Non-lending Services (Annex B4)
(As at 03/21/07)
Product Completion
FY Planned in FY07 Full PRSP/ General Econ Work annual Country Assistance Strategy (CAS) 2007 Integrated CFAA and CPAR 2007 Street Children 2007 Support ESSD TF (Sustainable Devt. Sector Dialogue) 2008 Gender Assessment 2007 Country Environmental Analysis 2007 Country Economic Memorandum 2008 Planned in FY08 Country Economic Memorandum 2008 PRSP Progress Report/GEW annual PER (civil service reform) 2008 Investment Climate Assessment (ICA) 2008 Employment Strategy Note 2008 Health Sector Financing 2008 Support ESSD TF (Sustainable Devt. Sector Dialogue) 2008 Gender Assessment 2008 Planned in FY09 PRSP Progress Report/GEW annual CAS Progress Report 2009 Poverty Assessment 2009 PER note 2009 Planned in FY10 AGS mid-term assessment 2010 PER note 2010 PEFA update 2010

121
Country Map