document of the world bank report no: project … · cpar country procurement ... isa international...
TRANSCRIPT

Document of
The World Bank
Report No:
PROJECT BRIEF
ON A
PROPOSED CREDIT
IN THE AMOUNT OF SDR MILLION
(USD 7.2 MILLION EQUIVALENT)
TO THE
GOVERNMENT OF GUINEA
FOR A
ELECTRICITY SECTOR EFFICIENCY IMPROVEMENT PROJECT
April 28, 2006
Energy Team
Finance, Private Sector and Infrastructure Network
Africa Region

CURRENCY EQUIVALENTS
(Exchange Rate Effective November 2005)
Currency Unit = Guinean Francs (GNF)
GNF 4320 = US$1
US = SDR 1
FISCAL YEAR
–
ABBREVIATIONS AND ACRONYMS
BOT Build, Operate, Transfer
CAS Country Assistance Strategy
CDM Clean Development Mechanism
CFAA Country Financial Accountability Assessment
CPAR Country Procurement Assessment Report
CPS Country Partnership Strategy
CQ Consultants Qualifications
CREST Commercial Reorientation of the Electricity Sector Toolkit
CT Current Transformer
DNA Designated National Authority
EDG Electricité de Guinée
EIRR Economic Internal Rate of Return
ESMF Environmental and Social Management Framework
FMR Financial Monitoring Report
FMS Financial Management System
FPM Financial Procedures Manual
FR Financial Regulations
GDP Gross Domestic Product
GEF Global Environment Facility
GIS Geographic Information System
GoG Government of Guinea
GNI Gross National Income
GPS Global Positioning System
HT High Tension
HV High Voltage
HVDS High Voltage Distribution Systems
IAS Internal Audit Section
ICB International Competitive Bidding
ICR Implementation Completion Report
IDA International Development Association
IFC International Finance Corporation
IPP Independent Power Producers
ISA International Standards of Auditing
ISO Independent System Operator
ISR Implementation Status Report
KVA Kilo-Volt Ampere
KW Kilo Watt
KWh Kilo Watt Hour
LNG Liquefied Natural Gas
LT Low Tension
LV Low Voltage

LVDS Low Voltage Distribution Systems
MDG Millennium Development Goal
MIGA Multilateral Investment Guarantee Association
NCB National Competitive Bidding
NEPAD New Partnership for Africa’s Development
PCB Poly Chlorinated Biphenyls
PIM Project Implementation Manual
PIU Project Implementation Unit
PRSP Poverty Reduction Strategy Paper
PT Potential Transformer
RPF Resettlement Policy Framework
SBD Standard Bidding Document
SCADA Supervisory Control and Data Acquisition
SIL Specific Investment Loan
SOE Statement of Expenditures
SRFP Standard Request for Proposals
TA Technical Assistance
TOR Terms of Reference
TSSA Technical Support Services Agreement
Vice President: Gobind Nankani
Country Director: Mats Karlsson
Sector Manager: S. Vijay Iyer
Task Team Leader: Prasad Tallapragada
This document has a restricted distribution and may be used by recipients only in the performance of their
official duties. Its contents may not otherwise be disclosed without World Bank authorization.

GUINEA
ELECTRICITY SECTOR EFFICIENCY IMPROVEMENT
PROJECT
CONTENTS
Page
A. STRATEGIC CONTEXT AND RATIONALE ..............................................................1
1. Country and sector issues.........................................................................................1
2. Rationale for Bank involvement ..............................................................................7
3. Higher level objectives to which the project contributes .........................................9
B. PROJECT DESCRIPTION ............................................................................................10
1. Lending instrument ................................................................................................10
2. Project development objective and key indicators.................................................10
3. Project components ................................................................................................11
4. Lessons learned and reflected in the project design ...............................................14
5. Alternatives considered and reasons for rejection .................................................15
C. IMPLEMENTATION .....................................................................................................17
1. Institutional and implementation arrangements .....................................................17
2. Monitoring and evaluation of outcomes/results .....................................................19
3. Sustainability..........................................................................................................20
4. Critical risks and possible controversial aspects ....................................................21
D. APPRAISAL SUMMARY ..............................................................................................27
1. Economic and financial analyses ...........................................................................27
2. Technical ................................................................................................................27
4. Social......................................................................................................................28
5. Environment ...........................................................................................................29
6. Safeguard policies ..................................................................................................29
7. Policy exceptions and Readiness ...........................................................................30
8. Compliance (checklist) ..........................................................................................30
Annex 1: Country and Sector or Program Background ..........................................................31
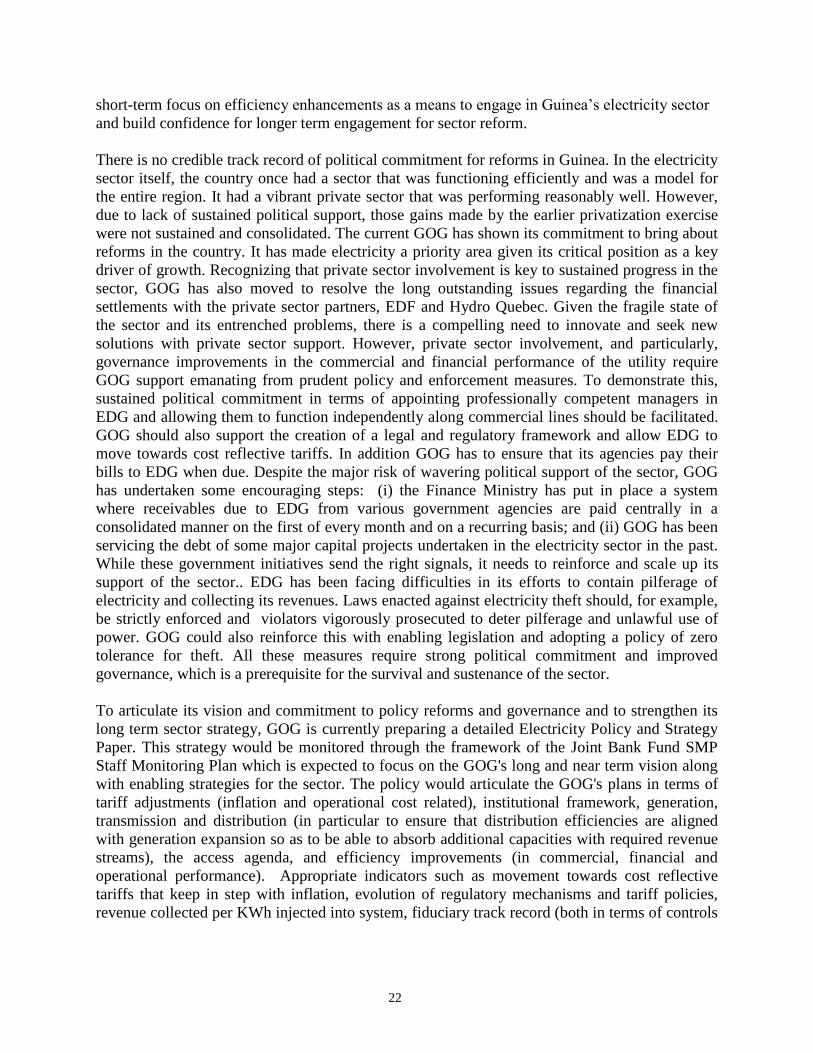
Annex 2: Major Related Projects Financed by the Bank and/or other Agencies ..................34
Annex 3: Results Framework and Monitoring .........................................................................35
Annex 4: Detailed Project Description .......................................................................................39
Annex 5: Project Costs ................................................................................................................49
Annex 6: Implementation Arrangements ..................................................................................50
Annex 7: Financial Management and Disbursement Arrangements ......................................55
Annex 8: Procurement Arrangements .......................................................................................59
Annex 9A: Economic Analysis ....................................................................................................68
Annex 9B: Sector Financial Summary .......................................................................................70
Annex 11: Incremental cost analysis ..........................................................................................77
Annex 12:Country at a Glance ...................................................................................................88

STRATEGIC CONTEXT AND RATIONALE
1. Country and sector issues
Introduction
Guinea, with a population of 8.8 million, is located in the west coast of Africa. Guinea is
bordered by Guinea Bissau, Senegal, Mali, Ivory Coast, Sierra Leone, and Liberia. Though
Guinea has been relatively internally stable, the conflicts in neighboring countries have spilled
over resulting in influx of refugees with consequent economic and social problems. Guinea
provides asylum to the maximum number of refuges among all West African countries
(UNCHR, EIU1). The movement of refugees from armed conflicts in Liberia and Sierra Leone
and political and military crises in Ivory Coast and Guinea-Bissau have added pressure to already
crumbling infrastructure and added to the financial cost2.
Guinea has a rich deposit of natural resources, including bauxite, iron ore, gold, and diamonds
which constitute its main exports. It is estimated that one-half of the world’s bauxite reserves are
located in Guinea. Though a number of facilitating conditions exist – vast mineral resource
reserve, strategic location for trade, huge potential for hydroelectric power, Guinea has achieved
a moderate growth rate of only 4% in the last decade. 40% of Guineans live below the poverty
line. In 2005, the real GDP growth is expected to have been a modest 3%3. Real GDP is
predicted to hover around 2-2.2% in 2006 with the mining sector continuing to be the biggest
contributor to growth.
Figure 1: Annual GNI and GNI per capita growth %
Annual GNI and GNI Per Capita Growth %
-4
-2
0
2
4
6
8
1990 1991 1992 1993 1994 1995 1996 1997 1998 1999 2000 2001 2002 2003 2004
Annual GDP Growth % Annual GDP Per Capita Growth %
Source: World Development Indicators, 2005
Guinea has primarily depended on mining exports and the economy has remained undiversified
with Guinea importing most of the manufactured goods. A recent WTO review of the economy
reveals that poor quality of infrastructure is a significant barrier to export diversification in
addition to uncertain legal and regulatory environment. In the World Bank compiled ‘Doing
Business’ 2005 report, Guinea ranked 144th
out of 155 countries surveyed. Guinea’s poor
1 Economist Intelligence Unit, 2005. Guinea – Country Profile, London, UK
2 IMF, 2004. Guinea – Poverty Reduction Strategy Paper Progress Report. IMF Country Report No. 04/375
3 IMF, 2005. Guinea – Staff Monitored Program. IMF Country Report 05/222
2
ranking has been a result of years of economic mismanagement and lack of a well-articulated
reform program. However, Guinea does not compare too unfavorably with other African nations
with respect to foreign direct investment (FDI) as large mining deposits have attracted foreign
investments in bauxite and aluminum mining.
Table 1: Ease of doing business
Ease of - Ranking
Doing business 144
Starting a business 145
Dealing with licenses 144
Hiring and firing 97
Registering property 133
Getting credit 144
Protecting investors 83
Paying taxes 139
Trading across borders 118
Enforcing contracts 101
Closing a business 81
Source: World Bank, 2005
Fiscal profligacy has also characterized Guinea’s macro-economic situation in the early years of
this decade, resulting in high inflation rate and continued currency depreciation. The inflation
rate has been on a rising trend since October 2002 with inflation at 17% at the end of 2004, and
prices rising in both the food and non-food sectors. The growth of money was even more
volatile, which reflected the impact of irregular reform policies4. Given the loose fiscal policy
and continuation of deficit monetization by the Central Bank, the EIU (2005) predicts that
inflation will continue to rise next year to 35%.
Guinea has been following a reform path since the mid-1980s under IMF guidance. However, the
reforms have been beset with political uncertainty and regional instability. The IMF sanctioned
$81.3 million Poverty Reduction and Growth Facility (PRGF) package in 2001 but cancelled the
PRGF in 2002 when Guinea failed to meet the performance criteria and significantly increased
defense spending that contributed to fiscal deficit. To regain PRGF eligibility, the Government
started to vigorously pursue a reform agenda of tighter fiscal and monetary policy, but has not
succeeded in either raising the growth rate or bringing down inflation.
A 12-month IMF sponsored Staff Monitored Program (SMP) primarily to tighten fiscal and
monetary policy that was put in place in July 2005 is now under implementation till April 2006.
One of the key components of the structural reform plan includes the restructuring of the water,
electricity, and telecom sectors to improve service delivery and make the utilities financially
sustainable. A successful review of the SMP will enable Guinea to qualify for PRGF, debt-relief
under the Highly-indebted poor countries (HIPC) initiative, and higher World Bank funding with
the change in status from ‘low-case lending scenario’ to a ‘base-case lending scenario.
4 Blavy, R. 2004. Inflation and monetary pass-through in Guinea. IMF Working Paper WP/04/223

3
In addition to pursuing a growth agenda, Guinea has been active in improving the living
conditions of its poor. In 1996-98, the Government of Guinea (GOG) adopted a ‘Guinea –
Vision 2010’. One of the critical elements of this approach is the equitable provision of
infrastructure, electricity being one of the key sectors. To bring the country into a sustained
growth path and to reduce widespread poverty, GOG has made poverty reduction and improving
the lives of its poorest as the main themes in its Poverty Reduction Strategy Paper (PRSP), 2002.
The PRSP identifies the provision of basic infrastructure such as electricity and water, as one of
the components of its ‘acceleration of growth’ pillar. While the PRSP objective was to increase
the rate of access to electricity to 40% by [200x], it had only reached 18% of its residents in
2002. Electricity access is limited to the area around the capital city of Conakry and some other
settlements (Kindia, Koubia, Kankan, Labe and a few others).
Electricity Sector
Electricité de Guinée (EDG) is the principal electricity sector entity in Guinea that is responsible
for generation, transmission and distribution. Currently, EDG generates 659 Gwh annually and
has 1,563 employees. The senior management consists of a Director General and nine directors.
It serves a total of 115,978 customers with almost 80% located in Conakry and the rest in the
interior areas. Besides EDG, there are also mining companies that self-generate almost half of
the electricity demand in Guinea. Projections based on mining and aluminum sector growth
indicate that peak demand is expected to grow from 149 MW in 2003 to 1098 MW in 2020.
Currently, hydro and diesel plants primarily meet Guinea’s generation capacity. The main
thermal plant is Tombo and the available capacity of the existing thermal plants is 67.4 MW. The
main hydro plant is the 75 MW Garafiri facility and the total available capacity is 116.25 MW.
Significant increase in capacity is expected from two committed hydro plants. Given the
considerable water resources available in Guinea, the potential for improving hydropower is
enormous (WAPP, 2005).
Table 2: Installed and available electricity generation
Installed capacity Available capacity % of use
Thermal 87.88 41.69 47%
Hydroelectric 127.56 116.25 91%
Isolated centers 11.36 4.53 40%
Total 226.8 162.47 72%
Source: EDG, 2005
With respect to transmission facilities, Guinea has three interconnected stations with a capacity
of 87.5 MVA and 19 source stations with 245.95 MVA. However, 305 transformers are overused
with 110 that are not operational due to over use. With respect to distribution, there are 45 km of
sub-terrain Medium Tension (MT) lines, 223 km of over-ground MT lines and 1203 km of Base
or Low Tension (BT) lines in Conakry. In the interior areas, there are 30 km of sub-terrain lines,
349 km of over-ground lines and 575 km of BT lines.
The sector continues to be in a state of disarray, with EDG’s operations losing GNF 107 billion
(USD 25 million at 2005 exchange rate) annually. Thus, the sector is currently imposing a major
burden on the economy. The outstanding debt payments for Guinea's hydropower plant are not
4
factored into the commercial operation of EDG, and are entirely being borne by GOG, imposing
a heavy burden on the fiscal budget. In addition, the high cost of self-generation and the
substantial, yet inadequate, budgetary support (GNF 30 billion in the current fiscal year,
equivalent to USD 7.5 million) is causing severe macroeconomic imbalance. High rates of
inflation erode the real tariff levels and the capacity of customers to pay their bills. While the
world-market prices for Guinea's main export articles have continued to stagnate, oil prices have
risen dramatically. For instance, cost of oil imports rose by 80% during 1999-2003, entailing
more severe load shedding schedules for EDG to stem financial loss. This was further
exacerbated by the below-average levels of rainfall in 2002 and 2003, leading to additional
power shortages.
EDG’s burdensome financial losses have been further aggravated by its lack of adequate
management controls and requisite investment in the distribution sector to reduce technical and
commercial losses. As highlighted in the 2003 CAS, the power sector in Guinea is plagued with
problems of low rates of billings and collection at the customer level and poor financial
management at the corporate level.5 At present, EDG only bills for 41% of electricity generated,
of which only 76% is collected. There is a high incidence of technical and non-technical
transmission and distribution losses that currently stand at 60%. While the average tariff levels
were increased to GNF 240/kWh (US cents 5.97/kWh) in September 2004 from [ ] previously,
the combination of technical and non-technical losses has pushed the sector into a vicious cycle
where poor performance of the distribution business leads to inadequate maintenance
investments on the generating side, leading to further load shedding and revenue losses. In early
2005, load shedding stood at 700-800 MWhs per day, equivalent to around 40% of the total
electricity generated by EDG.
Table 3: EDG Operational Status as of 2004-05
Annual generation 659 GWh
Energy lost due to technical and non-technical losses 391 GWh
Energy billed to consumption 268 GWh
Monetary value of power billed to customers GNF 63 billion
Amount collected against above billing GNF 48 billion
Monetary value of power lost GNF 92 billion
Amount lost annually including non-technical losses** GNF 107 billion
Specific Revenue Billed (SRC)* GNF 95 /KWh
Specific Revenue Collected (SRC)** GNF 73 /KWh
Result: Nearly 60% T&D losses and 80% Aggregate Technical and Commercial (ATC)
losses * SRC=Revenue billed in GNF/KWH input;**SRC=Collections made in GNF/KWH input.
GOG seeks to improve the capacity and viability of the electricity sector through a mix of
interventions that include improving EDG’s operational performance, and financial recovery of
the sector while increasing generation capacity. GOG has initiated a number of steps to galvanize
the deteriorating electricity sector. These include (i) changing the management team of EDG; (ii)
supporting EDG in reducing staff strength; (iii) resolving the dispute with former private
5 The World Bank, 2003. Country Assistance Strategy for Republic of Guinea. Report No. 25925 GUI

5
operator; and (iv) adjusting tariffs for the first time in 2004 since the last change in 1997.
Currently, the tariffs stand at the following levels:
Table 4: Social, commercial, and government tariff structure, 2005
Categories GNF
Social tariffs
1-90 KWh 90
91-400 KWh 232
Above 400 265
Tariffs for commercial enterprises, embassies, and NGOs 492
Tariffs for government enterprises 505
Source: EDG, 2005
Private participation in the sector: Earlier, EDG was called Enterprise Nationale d’Electricite
de Guinee (ENELGUI) and was a conventional state-owned public utility. In 1994, SOGEL was
established to carry out electricity operations by leasing the assets of ENELGUI. While SOGEL
was concessioned to a consortium of firms led by Hydro Quebec and Electricite du France
(EDF), ENELGUI, which remained under State ownership, bought a stake in SOGEL by
contributing a third of the equity. Through this arrangement, GOG could raise substantial capital
for ENELGUI, through several donors led by AFD, CIDA, IDB, and others, including the
general public, to construct more hydro and thermal facilities. This arrangement, which lasted
from 1994 to 2001, did not perform as expected. Several reasons contributed to the failure of
SOGEL, which started facing bankruptcy from 1998 onwards. Some of them were: (i) the slow
progress in payment of electricity bills due from State agencies; (ii) inadequate support to
ENELGUI and SOGEL in financial and tariff matters; (iii) a lack of will and commitment for
implementation of sector reforms; (iv) SOGEL’s inability to capture efficiency gains through key
loss reduction and anti-fraud programs; and (v) SOGEL’s inability to make critical investment,
cost control and customer relations decisions. As a result, the under performance of the sector led
to SOGEL and ENELGUI blaming each other for the poor state of affairs leading to the abrupt
termination of the private concession of SOGEL in October 2001. Subsequently, Societe
Electricite de Guinee (EDG) was created in its present form by GOG in December 2001. This
was done by sale of the consortium’s shares to GOG, which then liquidated ENELGUI and
transferred its assets to the newly created State owned utility, EDG. The outstanding issues from
this aborted private concession arrangement, such as claims from the former concessionaires and
the dues to several donors who provided soft loans to ENELGUI (such as AFD and CIDA) were
resolved through an agreement, only in late 2005. The poor relationship between SOGEL and
ENELGUI and the continued poor financial performance of SOGEL resulted in deteriorating
quality of service delivery, negatively impacting the manufacturing sector, especially small
businesses which either could not switch to cost-prohibitive self-generation or were now forced
to rely on higher cost self-generation.
Subsequent to the resolution of the outstanding issues related to the concession, there is
willingness in GOG to seek renewed private sector engagement in the sector. However, GOG
recognizes that the sector will have to be brought to a reasonable level of operational and
commercial efficiency to whet the private sector appetite. Thus, GOG has indicated its strong
6
commitment to facilitate and support the sector in achieving an operational recovery in the
medium term.
Access issues in the sector: With a population of 8.8 million, the country has a very low
electricity access rate of 18.8% at present. Apart from major urban settlements such as Conakry,
Labia, and Kindia, the countryside is literally living in the dark. Even among the 1.1 million
people who live in Conakry, large sections do not have access to electricity. GOG is likely to
come out with a clear strategy and vision to address this situation. The Electricity Policy and
Strategy paper that is to be issued by GOG is expected to articulate its access expansion strategy.
The strategy will draw lessons from the innovative access expansion mechanisms that are being
attempted under the ongoing IDA/GEF Decentralized Rural Electrification project, a Learning
and Innovation Loan (LIL) operation. The project attempts to encourage small concessionaires
to provide power supply from Pico thermal, Pico hydro or small renewable sources. The
concessionaires are supported by a mix of subsidy and credit that is disbursed through a
commercial bank. The commercial bank acts as a financial intermediary and conducts the whole
process of identifying, evaluating and supporting the concessionaires. The project
implementation unit at the Ministry of Energy (the PERD), performs the overall coordination,
support and oversight role including development of software tools and training modules. The
project is beginning to implement the first concessions and the experience from this innovative
project is expected to provide rich inputs to the overall access expansion strategy in the country.
Plans to expand access, however, will have to be preceded by efforts to strengthen the existing
generation, transmission and distribution systems. The entire network that is presently supplying
power to country is experiencing severe load shedding, mainly on account of the lack of
adequate power and a dysfunctional distribution system. Of these, the distribution system
requires immediate remedial measures. EDG’s distribution business is not generating enough
revenue to sustain existing generation in terms of cash required for fuel and other recurrent costs
nor to service debts.. The large incidence of system losses (the aggregate technical and
commercial losses are estimated to be at a staggering 80%), renders even existing generation
capacity unsustainable. Hence, it is critical that the distribution system be improved before
embarking on generation capacity additions. Efforts are being made through the West Africa
Power Pool (WAPP) project to provide new transmission interconnections that would facilitate
cross country energy flows. However, transmission investments require reasonable distribution
performance to be sustainable.
Strategies related to improving the country’s electricity access will have to be formulated against
this backdrop. In keeping with the sector’s marked requirement for distribution, this Project aims
at improving the existing distribution grid, including weaknesses in EDG’s commercial
operations, in order to pave the way for interventions in generation, transmission and access
issues. For instance, a strategy to deal with illegal connections which have far outnumbered
legally connected consumers would have to be implemented: Even in Kaloum area of Conakry,
which is the best electrically connected part of the country, out of the estimated 17,000
consumers, only 3,200 customers are in EDG’s books. The ongoing efficiency development plan
being implemented by EDG (with assistance from the Bank) has been able to recover so far,
about 8,500 of the unbilled consumers.

7
It also evident that there is substantial incidence of suppressed demand for electricity even in
areas that are connected to the network. Suppressed demand also manifests in the network
supplying grossly inadequate electricity supply to those having access. Hence, this Project aims
to address these issues, expand access and improve the quality of service in the current network.
2. Rationale for Bank involvement
The electricity sector's performance is intrinsically linked to the country’s failing macro-
economy. The sector, given its high loss making operations is draining the economy instead of
fuelling it. Highly unreliable and scarce supply of electricity stunts investments and restricts
access to electricity. Consequently almost all the industries in Guinea have captive generation6.
This generation is highly uneconomical, inefficient and has an adverse environmental impact. On
the other hand, the spiraling inflation is crippling the sector. While tariffs were hiked after a
long gap in 2004 by 77%, the sector’s financial position continues to deteriorate with the
Guinean Franc’s rapid depreciation vis a vis relatively stable foreign currencies7. The
unprecedented growth in fuel prices has only added to the sector’s mounting deficits.
Hence, it is essential to improve the sector performance to reduce the burden on the overall
economy in the short run and to restructure the sector to be a net cash contributor to the economy
in the long run. EDG’s operations are not sustainable with such a high level of aggregate
commercial and technical losses and its liquidity problems sap the distribution network and the
upstream generation and transmission investments. Hence, plans to add much needed generation
capacity8 should be preceded by immediate steps to improve the commercial and operational
performance of the sector. In the medium to long term, interventions made to improve the quality
of electricity services will make a reasonable impact only if they are complemented by assistance
to improve the generation capacity, especially by harnessing the country’s large hydro potential
of 6,400 MW (in 129 identified sites).
Due to the lack of essential parts, scheduled maintenance and repairs , the existing generation
facilities run the risk of breaking down. As the foregoing analysis points out, it may be a while
before new generation capacity comes online. Considering the fragile state of the sector, it is
6 Captive capacity is estimated to be around 120 MW in the whole country.
7 Guinean Franc, which stood at 2200 GNF to a USD in early 2005 fell to around 4900 GNF to a USD by the end of
2005. 8 Nexant study under WAPP, 2004.
Guinea’s Hydropower Potential
Guinea is endowed with several major rivers, including the Gambia and Niger Rivers,
offering large hydropower potential. Estimates show that Guinea has a (technically
feasible) hydroelectric potential estimated at 19,400 Gwh per year. However, currently,
only about 1% of Guinea's technically feasible hydroelectric potential has been
developed. For instance, the 75-MW Garafiri hydroelectric facility, on the Konkoure
River, was commissioned in 1999; and an 80-MW project is planned 60 miles (100 km)
downstream at Kaleta.

8
critical that EDG be assisted to achieve efficiency and maintain the stability of the presently
existing generation facilities (given that it is able to extract only 143 MW from an installed
capacity of 309 MW). In parallel, an appropriate institutional framework is needed to achieve
sustainable results.
With these objectives in mind and highlighting in particular, the urgent need to begin addressing
key issues in the sector, the GoG requested the Bank for assistance for its electricity sector in its
letter dated January 11, 2005. In February 2005 a Bank mission discussed an emergency program
with EDG and the GoG.. Subsequently, a Commercial Re-orientation of the Electricity Sector
Toolkit (CREST) efficiency improvement program was conceived with Bank team assistance,
and is under implementation by EDG in the Kaloum area.
Implementation of some of the CREST efficiency measures has led to early improvements in
billing and customer services without additional investments. Collection levels in Kaloum area
have gone up from 70% to 93%9. The number of customers connected to the grid has increased
from 3,200 to 11,700. System losses have gone down from 55% to 45%. All these
improvements have taken place without any new capital investments and have been achieved
mainly by reengineering business processes and management improvements. The experience in
Kaloum area has shown that electricity operations in major areas of Conakry can be improved if
efficiency improvements are implemented. This way the value of mitigating private investor risk
could be demonstrated and the implementation of this program ramped up with critical
investment to support sustainable electricity service delivery.
The Project, which is essentially a pilot operation, will target the electricity network and
consumers in Kaloum area of Conakry. Kaloum consumes most of the energy produced by the
EDG and is the last service area to be load shed. Most of the revenues and losses of EDG occur
in this area. Hence, this area provides the most logical part of the network to optimize gains from
an efficiency improvement program.
CAS and PRSP links: The PRSP (2002) identified infrastructure as among the most important
impediments to poverty reduction and growth. The CAS (2003) focuses on a framework that
seeks to facilitate and nurture sustainable and equitable growth, improve access and quality of
basic social services, and strengthen governance along with institutional and human capacity.
Accordingly, the CAS ranks the Energy and Mining sector as a high Country and a high Bank
priority. The CAS, thus, suggests to focus on improving governance and facilitating future
private sector participation in the sector and to develop innovative approaches to re-engage the
private sector. The proposed Project is fully in line with these principles. Although the CAS
foresees the promotion of an Electricity Support Program only under the high growth scenario -
which is unlikely to be met - the program needs to proceed in order to mitigate the significant
negative impact of the sector on the country's macro-economy. As the CAS is currently in a low
case, this issue has been considered at length during project preparation. The project does not
represent the conventional electricity operation that has been reflected in the CAS for a high case
scenario. In this context, the Project exercises (i) a leveraging role by building the technical and
commercial efficiencies, strengthening governance issues, and enhancing capacities and systems
9 As per the information provided by EDG to the pre appraisal mission

9
to improve business process efficiencies; and (ii) a catalytic role, by facilitating pilot approaches
for energy efficiency and conservation through GEF assistance.
Given the Bank’s commitment to partner with Africa in its challenging task of achieving growth
and achieving its millennium development goals (MDGs), and its support to the West Africa
Power Pool and NEPAD, it has a significant role in improving the electricity infrastructure in
Guinea.
3. Higher level objectives to which the project contributes
The Project seeks to reduce the fiscal burden the sector imposes on Guinea’s economy through
initiatives aimed at improving the sector’s commercial viability and quality of service delivery.
These would include investment lending in generation, distribution, capacity building in energy
efficiency and DSM programs, use of Information Technology and Management Information
Systems for technical and commercial operations; control of fraud and theft of electricity and
personnel management. The Project will also contribute to a reduction in carbon dioxide (CO2)
emissions by addressing the large inefficiencies in the distribution sector through a reduction in
energy losses, by improving efficiency of the generation plants and through demand side
management programs for efficient energy consumption..

10
B. PROJECT DESCRIPTION
1. Lending instrument
The instruments are a Specific Investment Loan (SIL), and a GEF Full-Sized Project grant.
2. Project development objective and key indicators
The Project’s principal objective is to support GOG’s current effort in improving the operational
and commercial efficiency of its power sector with the goal of turning around this ailing sector in
the medium-term to a reasonable level of performance in preparation for a longer-term reform
plan. Through critical investment support and capacity building assistance, it is expected that the
Project will improve the financial viability of the sector, which in turn would be instrumental in
reducing the power sector’s current large and negative fiscal burden on the economy. The
resulting macroeconomic and quality of service improvements are expected to contribute
significantly to creating an enabling environment for sustained economic growth and
development in Guinea. The medium-term efficiency enhancements in combination with
institutional strengthening are necessary steps to create value in the Guinean electricity business,
demonstrate its viability in a replicable manner and to facilitate private sector engagement in the
electricity sector. The project-term outcomes include operational and commercial distribution
efficiency enhancements, improvement in generation efficiency of the Garafiri hydropower plant
and the Tombo thermal generation plant, customer service improvements, and strengthening of
institutional capacity to manage and sustain the efficiency enhancement programs. A baseline of
the indicators will be established, against which the Project outputs and outcomes will be
evaluated.
Progress toward outcomes will be measured by:
(i) Operational and commercial efficiency enhancement results on the distribution front will
be measured by tracking energy loss reductions (technical and non-technical), and
increases in metering, billing and collection (MBC). By limiting energy losses and
boosting revenue collection, these efficiency gains are expected to improve the financial
health and thus the long-term sustainability of EDG. To assess progress, reduction in
technical losses, increase in MBC, and the expected increase in revenue base will be
tracked.
(ii) Gains in generation efficiency are critical to both improving service access and quality,
and to strengthening EDG’s financial position. Generation efficiency improvements would
be measured by improvement in plant load factor and availability factor of the Tombo and
Garafiri generation facilities.
(iii) Service delivery improvements will be measured by improvements in tail end voltage, and
by monitoring progress in terms of introducing better customer interface in the form of
customer care centers, spot billing, rapid response vehicle systems and other customer-
centric services. Periodic customer satisfaction surveys will help to further ascertain
progress.
(iv) The development of robust IT, financial and accounting systems is key to measuring and
improving the operational and commercial efficiency improvements, and an essential

11
platform for effective management of EDG. Installation of and training on relevant
technologies and systems will be monitored during the project period.
(v) The Project also seeks to improve institutional capacity for implementation of end-use
energy efficiency programs. Under the Technical Assistance component, the Project will
identify possible approaches for private sector participation, including Energy Services
Companies (ESCOs). The Project will assist through training and strategy work to
implement a program for energy conservation, including through DSM.
Global Development Objectives
Apart from the financial hemorrhage caused by the significant transmission and distribution
energy losses, these losses lead to high emissions of carbon dioxide (CO2) into atmosphere. The
Project will be instrumental in containing CO2 emissions by improving the energy efficiency of
the electricity distribution system through application of new business practices and technology,
by enhancing generation efficiency and by achieving end-use energy efficiency.
3. Project components
The Project proposes to support GOG’s commitment to improving the operational and
commercial soundness of the power sector, increase access and service delivery, and set the stage
for renewed engagement of the private sector to foster an efficient, stable and growing power
sector in the country. In keeping with this objective, the Project will support investments that aim
at improving (i) energy efficiency of distribution networks and generation capacity for reliable
supply, (ii) commercial character, and (iii) customer interface of the electricity sector including
introduction of end-use energy efficiency programs. The Project will also facilitate the
development of capacity at EDG in terms of technical, commercial and personnel systems. The
Project will increase access in terms of grid intensification through conversion of illegal
consumers into regular EDG customers and by connecting new customers to the grid. Since the
Project essentially focuses on Conakry, expansion of access is expected to follow initial grid
intensification in later interventions. It is also expected that the Decentralized Rural
Electrification Project, currently under implementation, would help facilitate appropriate
policies, institutional mechanisms and incentive structures that would lay the ground for future
access expansion plans in rural and peri-urban areas.
Implementation of the Project will be structured along the following three components:
Component 1: CREST- Distribution efficiency improvement: The efficiency improvement
program10
referred to as the Commercial Reorientation of the Electricity Sector Toolkit
(CREST), comprising a set of best practice interventions, is designed by EDG with active
support from the Bank team. The program reengineers core business processes (with a
pronounced focus on the retail MBC11
functions) and deploys innovative technology solutions in
order to improve service delivery and stem EDG’s financial losses. The Project would support
investments in goods and services related to implementation of the following initiatives under
the CREST efficiency improvement program:
10
Being implemented by EDG 11
MBC: Metering Billing and Collection process

12
CREST Initiatives Rationale
a) High voltage distribution system (HVDS) Increase energy efficiency through
significant technical loss reductions and
improvements in reliability of supply
(improve voltage profile) and reduce
commercial losses by deterring theft
b) HT Trivector meters for HV loads Enhance the coverage and quality of
metering for HT and LT customers
Better revenue collection through proper
metering and billing, and reduced
opportunities for pilferage
c) LT Trivector meters (CT operated) for LV
commercial loads above 20KW
d) Single phase and three phase meters (whole
current) for LV loads below 20KW with
AMR facility
e) Reactive power compensation by
installation of online capacitors Reduce technical losses and improve
customer satisfaction through voltage
enhancement
f) Establish customer care centers To improve MBC customer interface and
provide mechanism for and timely
response to customer grievances
g) Introduction of spot billing Improve billing coverage and collection
Improve cash flow and business process
efficiency
h) Launch of rapid response vehicles Reduce outage time and improve
response to customer complaints
i) GIS/GPS systems for AM/FM operations Improve network diligence and asset
management
These investments will strengthen the distribution infrastructure, improve quality of supply and
customer satisfaction, and reduce losses. Private sector would be encouraged to take up these
initiatives individually on a turnkey basis for a pre-specified part of the distribution network or a
customer cluster.
Component 2: Rehabilitation of Critical Generation. Investment support would be provided
to EDG, through this Project to improve the efficiency of the existing Garafiri Hydropower plant
and the Tombo Thermal generation plant. This will be in the form of assistance for critically
required equipment and spare parts and technical assistance for operations. This support is
critical in view of the worsening generation scenario in Guinea. The thermal and hydro facilities
are in dire need of maintenance and rehabilitation. Efforts to improve generation availability
would complement and reinforce GOG’s initiative to improve commercial discipline and
operational performance of EDG.
Component 3: Institutional Strengthening through Technical Assistance. A strong
institutional base is fundamental to the sustained financial success of the power sector in Guinea.
There is a clear and urgent need to develop a robust, modern technical, financial and accounting
infrastructure base to provide value-added support to the efforts of EDG to improve its
managerial, financial and operational performance. Further, opportunities for efficiency
13
enhancements from private sector partnerships and demand side management (DSM) will be
identified and explored. The following is a description of specific TA components:
3.1 Energy efficiency and conservation. The Project recognizes the need to sustain and scale up
the efficiency gains that will occur in the sector through these investments by promoting DSM
measures. Accordingly, it would assist in the development of an appropriate framework and
institutional capacity for energy efficiency and conservation programs.
3.2 Private sector partnerships. The Project would assist in the identification and development
of areas where the private sector can intervene with the aim of improving the electricity sector's
financial viability.12
These could include outsourcing of various distribution functions and
Energy Service Companies (ESCOs) type approaches.
12
This could imply, for example, the outsourcing of an area to the private sector for supply and billing of electricity.
Private Sector Participation Options and Strategy for Guinea’s Electricity Sector
The active participation of the private sector is important for the long-term growth and
efficient management of Guinea’s electricity sector. Private participation will be
important in harnessing Guinea’s vast hydropower potential and capitalizing on regional
developments such as the WAPP.
In the short-run, the private sector has a role to play in improving the electricity sector's
financial viability. Two feasible options can be explored:
1. Distribution Function Outsourcing
The private sector can be engaged in selective function role, for example, to
implement parts of the CREST program. While private players can build-transfer
(BT) the HVDS network, they can also be engaged through a build-own-transfer
(BOT) arrangement to provide services such as meter reading, bill generation, etc.
2. Energy Service Companies (ESCOs)
Private ESCOs can provide knowledge and business process assistance to conduct
energy audits of industrial and commercial establishments, and strategy for
achieving great efficiency improvements and DSM.
The potential for Distribution Business Outsourcing in Guinea requires further study.
Under this arrangement, there is an opportunity for the private sector to essentially
manage part of the distribution system. The MBC and customer service functions for a
designated network or cluster area can be fully outsourced to the private sector, under a
management contract or a concession, laying greater risk (and rewards) to the private
party. Such an arrangement would prove fertile learning ground for the GOG in
formulating a longer-term strategy to encourage greater private sector involvement, and
provide an opportunity for interested private players to build country presence and local
knowledge.

14
3.3 Financial and accounting systems. It is essential that EDG ring fences the generation,
transmission and distribution businesses and in turn identifies the real costs for each of those
functions. This would facilitate improvement of operational efficiencies through a profit center
approach on the one hand and efficient tariff setting on the other leading to commercial
efficiencies. The Project would assist in capacity building and provision of appropriate
infrastructure for development of financial and accounting systems towards achieving this
objective.
3.4 MIS and operational IT support. The Project would support initiatives leading to capacity
building and infrastructure support through installation of and training on innovative
technologies geared towards areas such as anti-theft measures, energy audit, remote metering
techniques, customer billing, HR data bases, etc.
4. Lessons learned and reflected in the project design
Lesson 1: The current financial and operational status of EDG clearly points out to the need for
improvement of commercial and technical efficiencies before any substantial investments are
made in generation. Initial results of the implementation of the Efficiency Development Plan
(CREST) by EDG as well as similar experiences in other countries in Africa such as Nigeria,
have demonstrated that there is value in the business and that investment support to these
activities would yield significant results. While this has been considered in designing this
Project, some assistance has been provided for critical spare parts for generation facilities to
complement the efforts in the distribution sector by securing generation, which is already in a
fragile state.
Lesson 2: The short lived experience with private sector participation in the sector points out to
the need for a careful analysis of the business environment, viable options of privatization and
the necessary investor risk mitigation strategies. This Project seeks to address this concern in two
ways. On one hand, private sector participation would be explored in the implementation of
various distribution improvement initiatives and on the other, viable options for private sector
participation would be explored through studies conducted under the TA component.
Continued
In the longer-term, as the requisite institutional capacity and regulatory environment
develops in Guinea, there is possibility for the private sector to be engaged in a much
larger scale. Within the right institutional framework, which might include the
unbundling of the vertically integrated utility, opportunities for contracting or
concessioning out all or significant parts of the generation and distribution businesses
can be contemplated. Private investors could also be enticed to build generation capacity
through long-term power purchase agreements (PPA). The development of the country’s
hydropower potential and the WAPP network can provide ample opportunity for further
bold reforms to encourage competitive generation and distribution systems, although
considerable milestones need to be achieved before reaching this stage in Guinea’s
electricity sector development path.

15
Lesson 3: EDG and the sector in general do not have a credible track record of implementation
of investment activities. This issue has also come to fore in the implementation of the
Decentralized Rural Electrification Project, which is being restructured. This risk would be
mitigated in two ways: (i) resorting to approaches such as BOT arrangements with the
involvement of private sector in implementation;(ii) support to be provided to EDG in the
preparation, selection and implementation of bid packages, through private consultancy services.
Lesson 4: Global experience from other countries such as Thailand, Sri Lanka, Uruguay and
Argentina shows that countries facing power scarcity need to adopt robust DSM strategies along
with efforts to rehabilitate and expand existing infrastructure. The Project seeks to assist EDG
and the Ministry of Energy and Hydraulics to develop institutional capacity and an appropriate
framework for energy efficiency programs.
5. Alternatives considered and reasons for rejection
i. Consideration for alternative lending instruments. Initially, the adaptable program loan
(APL) instrument had been considered for the Project since it has been designed as a pilot project
to be scaled up in the future with requisite sector reforms. However, the use of an APL is
constrained by a number of factors. A larger APL lending program would exceed the Bank’s
resource envelope for Guinea and raise issues regarding Guinea’s absorptive capacity for
significant infusions of technology and capital to resuscitate the sector. Macroeconomic issues
such as low economic growth, a large fiscal deficit, high inflationary pressures and a low tax
base limit the appropriateness of the macro-climate for an APL. Moreover, there are concerns
about the sustainability of the reform process and the underlying political commitment for
continued reform. Guinea needs to demonstrate a longer, consistent and credible track record to
satisfy the Bank Group’s larger and longer-term resource commitment. There is a need for the
GOG to develop a comprehensive and coordinated strategy for sector reform, and to generate the
policy environment for a phased-program. Finally, this Project, while a pilot, does not have
specific triggers for phasing in to subsequent projects, typical for an APL. Therefore, the SIL is a
more appropriate instrument where specific investments and action plans to ensure the viability
of the investment is demanded.
ii. Implementation of project activities through multiple agencies: The Ministry of Energy
and Hydrolique (MEH) had earlier implemented energy efficiency programs and has the mandate
to pursue DSM objectives and renewable energy programs. The option of separating this
component from the implementation of other activities in the Project was considered and
rejected. During pre appraisal it was found that EDG also had been implementing some DSM
measures. Since EDG is the sole sector utility, it would be difficult to mainstream energy
efficiency activities independent from implementation of other related activities. Hence, further
discussions concluded that MEH would implement these activities through the project team of
EDG.
iii. Including larger role for private sector in the Project: Given the concerns surrounding
sector sustainability and governance issues, it was considered to include a larger role for the
private sector in the implementation of this Project. However, with the earlier negative

16
experience with privatization, renewed attempts to involve private sector should be gradual and
should address various associated investor risks and governance issues. The Project seeks to
identify such viable strategies through studies to be undertaken in the TA component.

17
C. IMPLEMENTATION
1. Institutional and implementation arrangements
The main counterpart for implementation will be EDG where a team has been created to
implement this Project. GOG, through the Ministry of Energy will provide policy guidance and
also take an active part in project implementation. EDG will also implement the technical
assistance component involving DSM and energy efficiency activities, in coordination with a
corresponding team at MEH (per details given in the annex).
Rationale for the Institutional Arrangements. Project implementation would be carried out
through a team formed within EDG, so that various project activities are well coordinated in
terms of identification, implementation and ownership. Hence, a separate Project Implementation
Unit (PIU) is not contemplated; instead the Project Implementation Team would be an integral
part of the Directorate of Planning of EDG to identify, plan and execute all investments. This is
in line with the current thinking in the Bank to avoid establishing project-specific stand alone
PIUs. However, the experience from implementation of other Bank projects, particularly the
ongoing Decentralized Rural Electrification Project has demonstrated that implementation
capacity is very weak in several Government and parastatal agencies in Guinea. Moreover, EDG
itself does not have a track record of implementing Bank projects or for that matter, any major
investment program. Against this backdrop, implementation support is required in all areas of
preparation, evaluation and award of bids, supervision, and fiduciary diligence. Hence, a firm
with an established track record in these matters would provide implementation support services
to the Project Implementation Team.
The Counterpart Project Implementation Team would work under the supervision of the Director
of Planning, EDG and would be responsible for identification of specific investment networks,
related initial surveys, preparation, evaluation and award of bid packages. While the concerned
departments/agencies of EDG would undertake on site implementation, the Project
Implementation Team in the directorate of planning would have a monitoring and coordinating
role for the entire project implementation. It will also collect base line data, develop monitoring
indicators and evaluate the developmental impact of the investments.
Component-wise details of departments/agencies within EDG responsible for implementation
under the overall coordination of the Directorate of Planning/project team are as follows:
Component I – CREST: strengthening and rehabilitating the distribution grid, and
reengineering business processes. This component specifically involves distribution investments
needed to support the CREST efficiency development program being implemented by EDG.
These investments and associated business process improvements would introduce efficiencies
into several distribution functions and would be implemented essentially by the concerned
distribution agencies of EDG (such as the regional distribution directorates of Kaloum, Dixin,
Matoto, and Ratoma).

18
Component II -Rehabilitation of Generation: provision of urgently required spare parts
and repairs of the Garafiri Hydro and the Tombo Thermal facilities. The concerned managers at
the respective generation facilities will implement these activities.
Component III - Technical Assistance
This component has five sub components:
Energy efficiency and conservation: Technical assistance for the following: (i) development
of a policy and strategy for energy efficiency, conservation and renewable energy activities, to be
accomplished with consultancy support and implemented by MEH (ii) training and capacity
building for concerned staff of MEH and EDG for energy efficiency, conservation and DSM
activities to be implemented by the project implementation team within the DSM/EE cell; and
(iii) identification of ESCOs and preparation of the framework for implementation of DSM/
energy conservation activities such as energy audits for industrial and commercial buildings, to
be implemented by the DSM team at EDG and MEH.
A DSM/EE cell would be created within the EDG and MEH to: (i) coordinate all the energy
efficiency and DSM activities; and (ii) be the repository of knowledge and skills relating to all
aspects of energy efficiency including supply, distribution and end-use efficiency.
Private sector capacity development: This activity would essentially involve identification of
measures for improving the capacity of domestic and foreign private sector to participate in
Guinea’s electricity sector. Related studies would also look at potential linkages with the West
Africa Power Pool (WAPP), and related development of generation and transmission
infrastructure. The study would also examine the potential for establishing an open access regime
for distribution for the domestic Guinean electricity market and for expanding such an open
access to WAPP in the context of ECOWAS protocols. The Project Implementation Team will
perform this task.
Financial and Accounting support: In order to realize the “real costs” in the sector for
efficiency improvements both in terms of revenue enhancements and cost control measures, and
for cost reflective tariffs, it is critical that the accounting systems of EDG are appropriately
managed, and follow internationally accepted standards. The Finance Directorate at EDG would
be responsible for related tasks in support of this objective.
MIS and IT support: To achieve efficient distribution management and implementation of
several activities under the CREST program, appropriate MIS and IT support would have to be
provided. The Project Implementation Team would be responsible for this TA component.
The project implementation team is represented by all line and staff departments of EDG. While
the Directorate of Finance of EDG would be responsible for project financial management, it
would also exercise its monitoring role through its representation in the project implementation
team and through regular due diligence. Among other things, the Finance Directorate and the
Project Implementation Team would be responsible for ensuring compliance with the financial

19
management requirements of the Bank and the GOG, including preparation and submission of
quarterly Financial Monitoring Reports and audited annual financial statements to IDA. The
Internal Audit Sections of EDG will perform modern internal audit functions for the Project.
The IDA Credit Agreement will require the submission of consolidated Audited Project
Financial Statements to IDA within six months after financial year-end. Samples of audit reports
are included in Annex XXI of the Financial Accounting Reporting and Auditing Handbook
(FARAH) of the World Bank. Experienced and well-qualified external auditors will be
appointed by EDG (on a TOR acceptable to IDA) to audit Project accounts, financial statements
and transactions. Project financial management risk is assessed to be moderate and mitigated
through adequate supervision by the Bank’s FMS, and external audit.
Flow of Funds and Financial Reporting. Through the Ministry of Finance, GOG would on-
lend IDA funds to EDG and the Project Implementation Team, would in turn allocate credit
proceeds to various investments/activities based on the procurement plan. Regarding flow of
funds and banking arrangements, IDA will disburse the credit through a Special Account for
EDG using the report-based disbursement method.
Retroactive financing in an aggregate amount not to exceed US$50,000, accounting for 0.7% of
the expected IDA credit amount, would be provided for anticipated expenditures (for any
advanced contracts related to the technical assistance for project preparation and implementation,
such as independent auditors that would verify, and confirm the opening balances of EDG’s
accounts and balance sheet, required before project negotiations) incurred after April 1, 2006.
2. Monitoring and evaluation of outcomes/results
Performance monitoring of the proposed Project would include: (i) the performance indicators
as included in Annex 3; (ii) progress of the technical assistance components in terms of
deliverables of each of those components; and (iii) quarterly progress reports on preparation of
investment programs and in the execution of contracts. The Project will have a 3-year
implementation period. There will be no Mid-Term Review (MTR). Instead there will be two
annual reviews and an Implementation Completion Report (ICR) at the end of the Project, to be
jointly prepared by IDA and the concerned implementing agencies.
The Project’s developmental objective is to improve sector operational and commercial
efficiency, and sustainability. The sector level outcomes are to (i) build technical, human and
financial capacity to reduce technical and non-technical losses; and (ii) undertake preparations
for achieving increased private participation in the Guinean electricity market. Outcome
information would be useful for (i) evaluation of longer-term prospects of the sector and its
economic and fiscal impact; (ii) drawing lessons to improve institutional performance in
delivering service; and (iii) evaluating progress towards power sector reform.
The intended intervention and intermediate results by project component are as follows:
Component one: CREST-Distribution Efficiency Investments— The CREST program
comprises initiatives to improve the distribution business by (i) improving network reliability,
(ii) improving EDG’s commercial charter by increasing billing and collection, and (iii)

20
improving customer interface. Selected areas under the program will be supported with hardware
investments such as high voltage distribution system (HVDS), and better quality and coverage of
metering which would reduce system losses, improve system reliability (by increasing tail-end
voltage closer to 220V rather than the present ~180V) and increase revenue collections (through
increased GNF billed/kWh). Customer care centers, spot billing and rapid response outage
management programs will be introduced to enhance quality of customer service. During
implementation, the scheduled hardware investments and customer service initiatives as well as
the expected outcomes in terms of system loss reductions, improved system reliability, increased
revenue collections and better customer service will be tracked.
Intermediate Results: (i) Improvement in tail-end voltage by 10% over the baseline in Year 3;
(ii) Reduction in system losses by 8% in Year 3 over the baseline; and (iii) Increase in revenue
collection by 10% over the baseline in Year 3.
Component Two: Generation investments-With the objective of improving generation
efficiency, the Project will support the financing of critically required equipment and spare parts
to rehabilitate the Garafiri hydro facility and the Tombo Thermal facility. Improvement in
generation efficiency can be measured in terms of increase in capacity utilization and the Plant
Load Factor (PLF).
Intermediate results: (i) Improvement in PLF at both Garafiri and Tombo of 10% over the
baseline in Year 3.
Component Three: Institutional Strengthening through Technical Assistance: The technical
assistance component of the Project aims to strengthen the institutional basis for (i) energy
efficiency and conservation; (ii) private sector capacity development; (iii) financial and
accounting systems; and (iv) MIS and operational IT support. Specific technical, organizational
and policy objectives of the technical assistance program will be tracked to measure
performance.
Intermediate Results: (i) 20 customer energy audits by Year 3 for DSM, (ii) reduction in peak
load demand by 12.15MW by Year 3, (iii) publication and distribution of audited annual
financial statements in each year starting in Year 1 of implementation, and (iv) launch remote
metering, anti-theft metering and customer service centers.
3. Sustainability
In order to ensure that the sector shows sustainable results in the long term, several dimensions
have to be considered. The following are some of the critical aspects:
Replicability: The initial success of the Kaloum initiative has to be built upon in order to
effectively demonstrate to stakeholders and donors that these interventions can be replicated and
that the results can then be leveraged to attract private sector participation, increase access, and
provide quality services. The total need for distribution sector is estimated by the team at
approximately US$ 200 million which indicates a significant potential for replication. The GoG
has already prepared an investment plan for about US$ 44 million and is expected donor

21
assistance for the same following-up on quick and successful implementation of this project.
The other donors keenly interested in the Guinea power sector and closely working with the
Bank are the Islamic Development Bank, The Government of France through AFD and the
Government of Canada through CIDA.
The CREST program proposed in this Project has wide potential for replication beyond Guinea
in Africa. Some of the other countries such as Ghana, Nigeria, Mozambique and Zambia are also
in the initial phase of instituting CREST within their systems and lessons from the
implementation of this project would greatly benefit these other efforts in Africa to improve the
energy efficiency of distribution systems.
Stakeholders: All stakeholders have to be involved in implementation of these interventions.
The quality of stakeholders also has to be ensured in the sense that they are paying customers
with commercial discipline.
Regulatory framework: While recognizing that the sector has to graduate into second
generation reforms after achieving reasonable levels of efficiency in the first instance, adequate
regulatory mechanisms should be put in place, even if they are not fully evolved, to create the
right environment for the private sector to involve in the sector.
Determination of costs: The sector has not demonstrated the ability to recognize the “real costs”
of electricity supply and have not been able to translate them into cost reflective pricing. EDG
has not attempted segregating generation and transmission costs from distribution costs and no
attempts have been made to establish cost by customer categories. Resultantly, tariff setting is
not done efficiently and the market lacks proper incentives to reduce self-generation, contain
theft and provide appropriate payment behaviors from customers. This Project attempts to
mitigate this risk by assisting EDG to develop capacity in this regard, and by launching
appropriate studies under the TA component.
Subsidies: The subsidy element also has to be viewed in the context of sustainability. The GOG
is subsidizing the sector and EDG in three significant ways: (i) by servicing the debt on major
capital investments such as Garafiri hydro facility; (ii) by budgetary support; and (iii) by
investment support from time to time. It is clear that the subsidies being given by the GOG are
not sustainable and that eventually the sector would have to be self-sustainable. The SMP and the
DPR could be good instruments to impress the GOG on the need to phase out subsidies and
develop a clear vision and strategy in this regard.
4. Critical risks and possible controversial aspects
Political commitment to reform and governance issues: In order to revive the electricity
sector in Guinea from its presently poor operational and commercial conditions, it is critical that
the GOG remains politically committed to a long-term reform vision with a coherent sector wide
strategy. The success of this pilot project depends on the continued commitment from the
political leadership in Guinea and the support of the management at EDG, and their willingness
to replicate the lessons learned at the sectoral level. The Project seeks a phased approach with
22
short-term focus on efficiency enhancements as a means to engage in Guinea’s electricity sector
and build confidence for longer term engagement for sector reform.
There is no credible track record of political commitment for reforms in Guinea. In the electricity
sector itself, the country once had a sector that was functioning efficiently and was a model for
the entire region. It had a vibrant private sector that was performing reasonably well. However,
due to lack of sustained political support, those gains made by the earlier privatization exercise
were not sustained and consolidated. The current GOG has shown its commitment to bring about
reforms in the country. It has made electricity a priority area given its critical position as a key
driver of growth. Recognizing that private sector involvement is key to sustained progress in the
sector, GOG has also moved to resolve the long outstanding issues regarding the financial
settlements with the private sector partners, EDF and Hydro Quebec. Given the fragile state of
the sector and its entrenched problems, there is a compelling need to innovate and seek new
solutions with private sector support. However, private sector involvement, and particularly,
governance improvements in the commercial and financial performance of the utility require
GOG support emanating from prudent policy and enforcement measures. To demonstrate this,
sustained political commitment in terms of appointing professionally competent managers in
EDG and allowing them to function independently along commercial lines should be facilitated.
GOG should also support the creation of a legal and regulatory framework and allow EDG to
move towards cost reflective tariffs. In addition GOG has to ensure that its agencies pay their
bills to EDG when due. Despite the major risk of wavering political support of the sector, GOG
has undertaken some encouraging steps: (i) the Finance Ministry has put in place a system
where receivables due to EDG from various government agencies are paid centrally in a
consolidated manner on the first of every month and on a recurring basis; and (ii) GOG has been
servicing the debt of some major capital projects undertaken in the electricity sector in the past.
While these government initiatives send the right signals, it needs to reinforce and scale up its
support of the sector.. EDG has been facing difficulties in its efforts to contain pilferage of
electricity and collecting its revenues. Laws enacted against electricity theft should, for example,
be strictly enforced and violators vigorously prosecuted to deter pilferage and unlawful use of
power. GOG could also reinforce this with enabling legislation and adopting a policy of zero
tolerance for theft. All these measures require strong political commitment and improved
governance, which is a prerequisite for the survival and sustenance of the sector.
To articulate its vision and commitment to policy reforms and governance and to strengthen its
long term sector strategy, GOG is currently preparing a detailed Electricity Policy and Strategy
Paper. This strategy would be monitored through the framework of the Joint Bank Fund SMP
Staff Monitoring Plan which is expected to focus on the GOG's long and near term vision along
with enabling strategies for the sector. The policy would articulate the GOG's plans in terms of
tariff adjustments (inflation and operational cost related), institutional framework, generation,
transmission and distribution (in particular to ensure that distribution efficiencies are aligned
with generation expansion so as to be able to absorb additional capacities with required revenue
streams), the access agenda, and efficiency improvements (in commercial, financial and
operational performance). Appropriate indicators such as movement towards cost reflective
tariffs that keep in step with inflation, evolution of regulatory mechanisms and tariff policies,
revenue collected per KWh injected into system, fiduciary track record (both in terms of controls

23
and remedies leading to improved fiduciary management, cost reduction and staff
rationalization) would be incorporated in the SMP to facilitate monitoring.
Limited institutional capacity: The electricity sector in Guinea suffers from poor technical and
human capacity, and proper institutional arrangements which constrains the ability to implement
the reform agenda. The urgent need to build basic institutional and management capacity of the
sector should be explored with private sector participation in training and capacity building. The
lessons learned from the implementation of the Decentralized Rural Electrification Project would
also provide valuable inputs.
Recognition and transfer of “real costs”: While GOG, in its effort to improve the viability of
the electricity sector, adjusted tariffs in 2004 (after a long hiatus since 1997), high inflation has
eroded real tariffs in Guinea. The current environment of high fuel prices will put additional
pressure on the sector to align real tariffs with actual costs of electricity supply. While politically
challenging, the move towards cost-effective tariffs should be an integral part of any reform
package. GOG also understands that tariff increases have to take place in step with improved
service delivery. The Project’s focus on improving operational and commercial efficiency
through enhanced service delivery should bolster GOG’s effort to rationalize tariff rates in the
future. Improved financial performance of EDG attributed to project activities will also mitigate
some of the financial burden arising from below-cost tariffs levels.
Private sector involvement: The abrupt end of the previous concession and the consequent
negative signals to the investor community poses a risk to achieving project objectives. GOG’s
renewed commitment to the sector demonstrated by the change in management, staff reductions
at EDG, tariff adjustment, and commitment to resolving all outstanding issues related to the
earlier concession should send strong positive messages to the market and entice future private
sector participation. The Project’s goal to improve the commercial efficiency of the sector will
also enhance the sector’s attractiveness to various models of private sector involvement.
Risks Risk Mitigation Measures Risk Rating with
Mitigation
To Project Development Objective
GOG commitment to reinvigorate the
power sector with a long-term vision
for reforming the sector
Phased and flexible engagement
with focus on efficiency
enhancements in the short to
medium-term as preparation for
long-term reform
S
Limited institutional capacity to expand
beyond the pilot phase, and to absorb
larger investments and reform
a) Training and capacity
building are integral parts of
the Project
b) Potential for private sector
involvement through turn
key/outsourcing
S
Recognition and transfer of “real costs” Phased approach with initial S

24
focus on improved service
delivery
Private sector participation a) Project will improve
operational and
commercial efficiency,
enhancing sector
attractiveness
b) Technical assistance
component to explore
avenues for private sector
participation
M
To Component Results
Planned HVDS investments delayed
due to customer densities
Use of taller poles, insulated
cables and deployment of other
technical solutions
M
Implementation delays in replacement
of critical generation equipments
Turn-key contracts to private sector
providers with penalties for delay N
Difficulties in mitigating rent-seeking
prevalence in metering, billing and
collection processes
a) Staff training on effective
communications and customer
interface
b) Deployment of technical
solutions like automated meter-
reading, spot billing, pre-paid
meters
c) Efficient management of
business processes through
outsourcing
d) Interventions such as threat of
power cut-off to provide
incentive for customer
compliance
S
Overall Risk Rating Substantial
Credit conditions and covenants:
Effectiveness Condition
Execution of subsidiary loan agreement between the Borrower and EDG;
Execution of the GEF grant agreement;
Appointment of key fiduciary staff within the implementing agencies;
Opening of the Special and other project Bank Accounts;
Establishment of the Project Administrative, Financial and Accountant Manual;
Development of an appropriate TOR for the external auditor and preparation of a short list of
qualified auditors, acceptable to the Bank;
Agreement on financial management reporting formats and training of staff;
Adoption of the PIP for EDG in a manner satisfactory to IDA; [usually an effectiveness condition
but surprised not to find it in the Procurement Annex]

25
Initial deposits are made into the Counterpart Funds; and.[will come up at negotiations and will
be an effectiveness condition]
Record approval of EDG’s reconstituted balance sheet as at December 31, 2005.
Agreements Reached with the Borrower:
Flow and Utilization of Project Funds:
Onlend the Credit amount to EDG under a subsidiary loan agreement between GOG and
EDG under terms and conditions satisfactory to IDA which shall include: (a) interest at
a fixed rate of 4.0% per annum, repayment over 20 years including a grace period of 5
years for the Generation and Distribution components; (b) interest at a rate of 2% per
annum, repayment over 25 years including a grace period of 7 years for the technical
assistance component; and (c) foreign exchange risk to be borne by EDG; and
Assure availability of adequate counterpart funds in addition to the IDA credit for
implementing the project components.
Management and Financial Aspects of the Project:
Take all actions, including but not limited to adjustment of tariffs to enable EDG to realize
satisfactory operating and cash generation ratios;
Take all necessary measures to carry out the Accounts Receivable Management Action Plan to
assist EDG in collecting and reducing outstanding Government arrears and achieve monitoring
targets in the Plan;
Agreements Reached with EDG:
Financial Aspects:
Review with IDA, by April 30 of each year, the adequacy of its tariffs to produce the required
minimum cash requirement and debt service coverage, satisfactory to IDA;
Generate sufficient revenues to cover no less than the sum of: (a) operating expenses; and (b) the
amount by which debt service requirements exceed the provision for depreciation;
Maintain net revenues at the level of 1.5 times its total estimated debt service requirements;and
Review with IDA, by April 30 of each year, its proposed annual budgets and financial plan for
each succeeding three-year period.
Accounts/Audits:
Appoint independent auditors, acceptable to IDA, and make the audit reports available to IDA
within six months after the close of each fiscal year.

26

27
D. APPRAISAL SUMMARY
1. Economic and financial analyses
The economic analysis of the Project is based on a cost-benefit analysis of the main investment
sub-components. A range of benefits is evaluated for each sub-component. For the distribution
component benefit analysis focuses on reduced losses (technical and non-technical), increased
sales, and improved revenues. For the generation analysis, the benefit analysis focuses on
increases generation (kWh) and increased sales.
2. The Project produces a robust EIRR of 27% as compared to the opportunity costs of
capital at 12%. The project’s FIRR is sound at 29%. The distribution component of the project
produces an EIRR of 25% and an FIRR of 27%. The generation component produces an EIRR of
30% and an FIRR of 30%. Table 1 below summarizes the key indicators. The NPV is sensitive to
changes in the tariff levels. Especially a marked decline in tariff in real terms could put the
economic viability of the project as a whole at risk.
3. The Project will bring about greenhouse gas emission reductions through avoided fossil
fuel generation. The measures implemented will result in a reduction of approximately 38,950
tonnes of CO2 over the 10 year lifetime of the investment. This translates into incremental costs
of approximately US$ 12.8 per tonne of carbon.
Table 1:Key Economic Indicators of Project
(in US$)
Distribution
Efficiency
Improvement
Generation
Improvement Total
Economic Benefits 10.12 21.56 31.68
Investment Costs (including taxes and financial charges) 5.90 2.60 8.50
O&M Costs 2.58 17.00 19.58
Economic NPV 2.29 1.96 4.25
Financial NPV 1.64 1.22 2.86
EIRR 25% 30% 27%
FIRR 27% 30% 29%
Note: Discount rates of 12% and 16% respectively are assumed to calculate the present values for the economic and
financial analysis. Input data will be confirmed at appraisal.
2. Technical
The investments under the GNESEIP have been designed to support the recovery of the
electricity sector in Guinea. In view of the limited resources available, three main themes have
been identified as critical to jumpstart the process of the sector recovery. They are: distribution
efficiency improvement, urgent rehabilitation of the generation facilities and Technical
Assistance. The technical assistance component includes support for development of institutional
framework and capacity for energy efficiency programs, identification and development of
viable approaches for private sector participation, financial and accounting systems, and MIS and
IT systems for operations. The key operational and commercial objectives are highlighted below:

28
Remove immediate bottlenecks in the generation and distribution system by improving
efficiencies in selected generation plants and distribution areas.
Improve power quality by investments in system reactive power compensation
equipment.
Increase supply reliability of the distribution network in identified areas.
Reduce energy losses in the system.
Improve cash flows through higher revenue collection.
These investments were identified by the EDG team based on the initial results of the
implementation of the CREST efficiency development program. In order to complement the
efforts being made for improvement of operational and commercial efficiencies, EDG identified
the need for support for critical rehabilitation/repairs required for the generation facilities and
strengthening of institutional capacities in specific areas. The technical feasibility and viability
of these investments has been appraised in the context of the results of initial implementation of
the efficiency development plan by EDG and global experience of these investments delivering
the desired results and objectives.
3. Social
Improvement of the electricity sector’s service delivery, efficiency, and billing will have a
positive social impact. For example, prior to the CREST pilot program, 80% of the customers in
Kaloum, were given estimated bills, facilitating fraud and corruption. Customer dissatisfaction
with EDG is high and pilferage of electricity is common. More efficient and reliable service,
coupled with more transparent billing mechanisms, will increase customer satisfaction, and
increase EDG’s revenues, leading to better service delivery in the long run.
Evidence from the CREST pilot program in Kaloum has shown that increased customer
satisfaction through better management resulted in collection levels rising from 70% to 93%,
customer connection increasing to 11,700, and system losses decreasing from 55% to 45%.
These improvements took place with no new capital investment, but through enhanced business
processes and management improvements.
While better service delivery, transparency in billing and greater efficiency of management will
improve the sector as a whole, it is important to delineate the impacts on different stakeholder
groups. Nearly 40% of Guineans live on less than US$2/day, and predicted tariff hikes could
price poor consumers out of the market. As such, it is important to understand where the greatest
costs for the poor lie, be it in connection fees, auxiliary fees, or in billing.
Second, a careful assessment of Conakry could reveal valuable differences in electricity
operations vis-à-vis Kaloum in general. Success in the Kaloum area could be a result of different
social realities, such as greater government trust, diverse livelihoods strategies, a greater
willingness to pay, or characteristics of local officials that more easily embraced reform. The
focus of the Project is in the Kaloum area of Conakry, where the greatest losses of EDG occur.
These losses could be indicative of a wide range of social indicators, including inability to pay
(poverty), but also distrust of EDG officials because of corruption and fraud, and a consequent
lack of willingness to pay.

29
Finally, under the Project, certain components give priority to high revenue yielding customer
premises. On the one hand, high revenue yielding customers are key to the reform’s success,
since they constitute the bulk of the revenue. On the other hand, however, many of these
customers, particularly in the private sector, have the ability to self-generate electricity. While
the private sector and the high revenue yielding areas in general are key to the reform’s success,
it is important that perceptions of reform do not result in the poor and low revenue yielding areas
seeing the Project as delivering to exclusive customer segments and network. While cost
recovery is key to the Project, and to EDG in the short run, in the long term, reduced non-
payment and customer buy-in is important to the survival of the sector. As such, a
communication strategy that includes stakeholders from the private sector, and civil society, is
vital to understanding particular concerns and communicates the reform strategy effectively.
4. Environment
The Project is rated Environmental Category C. The Project principally involves pilot
initiatives such as rehabilitation of existing distribution infrastructure using the CREST
approach, funding goods and services such as HT trivector meters or the introduction of spot
billing. Existing generation facilities are being provided with the necessary spare parts to
improve the efficiency of the existing Garafiri Hydropower plant and the Tombo Thermal
generation plant. The operation also focuses on institutional strengthening and technical
assistance such as support for accounting systems, identification of areas for future private sector
involvement, and operational IT support.
This operation is essentially a pilot operation designed to assist the electricity sector to improve
commercial and operational efficiencies. Thus, the intention is to use the US$7.2 million under
this pilot operation to fix the most urgent problems, and to address significant environmental
issues in the context of a larger, follow-on project. Towards this end, the project team will
proceed with the preparation of an environmental audit of the afore-mentioned plants, and a
sector-wide environmental and social management framework study in the future.
5. Safeguard policies
Safeguard Policies Triggered Yes No TBD
Environmental Assessment (OP/BP 4.01) X
Natural Habitats (OP/BP 4.04) X
Forests (OP/BP 4.36) X
Pest Management (OP 4.09) X
Cultural Property (OPN 11.03) X
Indigenous Peoples (OP/BP 4.10) X
Involuntary Resettlement (OP/BP 4.12) X
Safety of Dams (OP/BP 4.37) X
Projects on International Waterways (OP/BP 7.50) X
Projects in Disputed Areas (OP/BP 7.60) X

30
6. Policy exceptions and Readiness
The Project complies with all World Bank policies and no exceptions are necessary. The
Project’s first year procurement plan is under preparation and will be reviewed by the Bank.
7. Compliance (checklist)

31
Annex 1: Country and Sector or Program Background
GUINEA: ELECTRICITY SECTOR EFFICIENCY IMPROVEMENT PROJECT
Geography, population and politics
Guinea, a country of 8.8 million, is located in the west coast of Africa, and bordered by Guinea
Bissau, Senegal, Mali, Ivory Coast, Sierra Leone, and Liberia. Guinea received its independence
from France in 1958 and was ruled for 26 years by President Sekou Toure. President Lansana
Conte, a former military General, has presided over the country since the death of President
Sekou Toure in 1984. Guinea is a constitutional republic with a strong presidency that rules with
an appointed council of ministers. The last elections were held in June 2002, when President
Conte’s party –Unity and Progress Party and its associated parties, won 91 of the 114 seats13
.
Economic conditions, poverty, and human development
Guinea’s GNI per capita declined since 1999 and now stands at US$460. Due to the concentrated
nature of its growth in extractive industries and agriculture, 40% of Guineans live below the
poverty line. Guinea’s human development also lags behind, in the recent human development
report (2005), Guinea ranked 156 among 177 countries. A significant percentage (44%) of the
population is below 15 years of age with life expectancy currently at 53.7 years. Less than half of
its adult population is literate and only 58% of the girls are enrolled in primary school (Human
Development Report, 200514
).
To improve the poor living conditions of millions of Guineans, GOG adopted a ‘Guinea – Vision
2010’ in 1996-98. GOG aims to embrace an integrated approach to combat the problem of rising
poverty. One of the critical components of this approach is the equitable provision of
infrastructure, electricity being one of the key sectors. The goal is to reach electricity access rate
of 65% in 2010 from a baseline of 16.4% in 1999, to improve the reliability of power supply, and
to ensure adequate supply of electricity at competitive prices (PRSP, 2002).
To bring the country into a sustained growth path and to reduce widespread poverty, GOG has
made poverty reduction and improving the lives of its poorest as the main themes in its Poverty
Reduction Strategy Paper (PRSP), 2002. The goal of the PRSP is to reduce headcount poverty
from 40% recorded in 1995 to 30% in 2010. Guinea has identified provision of basic
infrastructure such, as electricity and water, as one of the components of its ‘acceleration of
growth’ pillar. While the PRSP objective was to increase the rate of access to electricity to 40%,
it had only reached 18% of its residents in 2002. Weak and unreliable supply of electricity has
imposed a severe cost on businesses since 2000 who have resorted to auto-generation of
electricity. Improving electricity provision will also be critical for diversifying Guinea’s
13
http://www.state.gov/r/pa/ei/bgn/2824.htm 14
UNDP, 2005. Human Development Report, 2005: International cooperation at a crossroads: Aid, trade and
security in an unequal world.

32
economy that depends primarily on bauxite and mining revenues. This would also lead to
improving the investment climate for private sector development.
Electricity sector
The electricity sector in Guinea is currently a major burden on the economy given that, about
107 billion GNF (US$42 million at 2004 exchange rate) is being lost on operations alone
annually. In addition, the high cost of self generation and the substantial, yet inadequate,
budgetary support (30 billion GNF in the current fiscal year) are causing severe macroeconomic
imbalances. High rates of inflation (28% in 2005) erode the real tariff levels and the capacity of
customers to pay their bills. While the world-market prices for Guinea's main export articles
have continued to stagnate, oil prices have risen dramatically. For instance, cost of oil imports
rose by 80% during 1999-2003. Rising oil prices in the past year have entailed more severe load
shedding schedules. Further, below average rainfall in 2002 and 2003 led to additional power
shortages. The outstanding debt payments for Guinea's hydropower plant are not factored into
the commercial operation of EDG, and are entirely borne by GOG, imposing a heavy burden on
GOG's budget.
Electricité de Guinée (EDG) is the principal electricity sector entity in Guinea that annually
generates 659 Gwh. Guinea was among the first countries in Sub-Saharan Africa where the
power sector was managed by a private firm with major capital expenditure (Izzaguire, 1998).
Following the departure of the private concessionaire in 2002, EDG has been operating as a
public utility. However, EDG’s financial situation is highly vulnerable. The commercial
indicators suggest that unless substantial interventions are undertaken to check the technical and
commercial losses, improve billing, and efficiency, the Company will continue to slide further
into financial losses.
Table 1: Commercial indicators, 2005 % 1998 1999 2000 2001 2002 2003 2004 Oct
2005
Billing 38.4 36.68 39.21 39.08 43.38 39.27 40.63 44.52
Collection 80.88 85.76 88.44 88.62 74.62 73.43 73.44 73.92
Productivity 31.06 31.46 34.68 34.63 32.37 28.83 29.84 32.91
Output –
network
distribution
42.3 40.61 43.98 41.40 47.06 43.56 44.78 48.06
Output –
production
transport
90.64 90.33 89.15 94.39 92.18 90.14 90.85 92.63
Technical
loss
19.00 19.00 22.90 25.00 25.00 25.00 25.00 25.00
Distribution
loss
16.50 16.50 17.30 18.51 18.51 18.51 18.51 18.51
Source: EDG, 2005
As EDG is forced to cope with the worsening situation of reduced generation, the widening
demand-supply gap could lead the electricity sector to collapse in the foreseeable future. Since
2004, GOG has highlighted the importance of electricity for the economic well-being of the

33
country and has sought to improve the sector's financial health, performance, and service
delivery.
GOG has addressed the governance and financial problems in the electricity sector by setting the
path to improve the financial viability of EDG. Further measures are needed to attract the
required investment to this economically vital sector in order to meet demand and improve
service quality. To this end, GOG plans to adopt the following measures: (i) a rigorous
implementation of the anti-fraud plan adopted in June 2005; (ii) adoption of a medium term
action plan laying out the measures which will further strengthen the financial viability of the
electricity company; (iii) following the agreement between GOG and EDG on the question of
cross debts; (iv) resolving the issue of the remaining cross debts which have been excluded from
the agreement by the end of 2005; (v) making timely payment of its bills to EDG while EDG will
honor regularly its obligations towards the state; and (vi) taking all necessary steps to enable
EDG to issue a first balance sheet by the end of 2006 which is a key step for attracting
investment to the sector. The balance sheet will also reflect the resolution of the dispute with the
former managing firm in the sector.
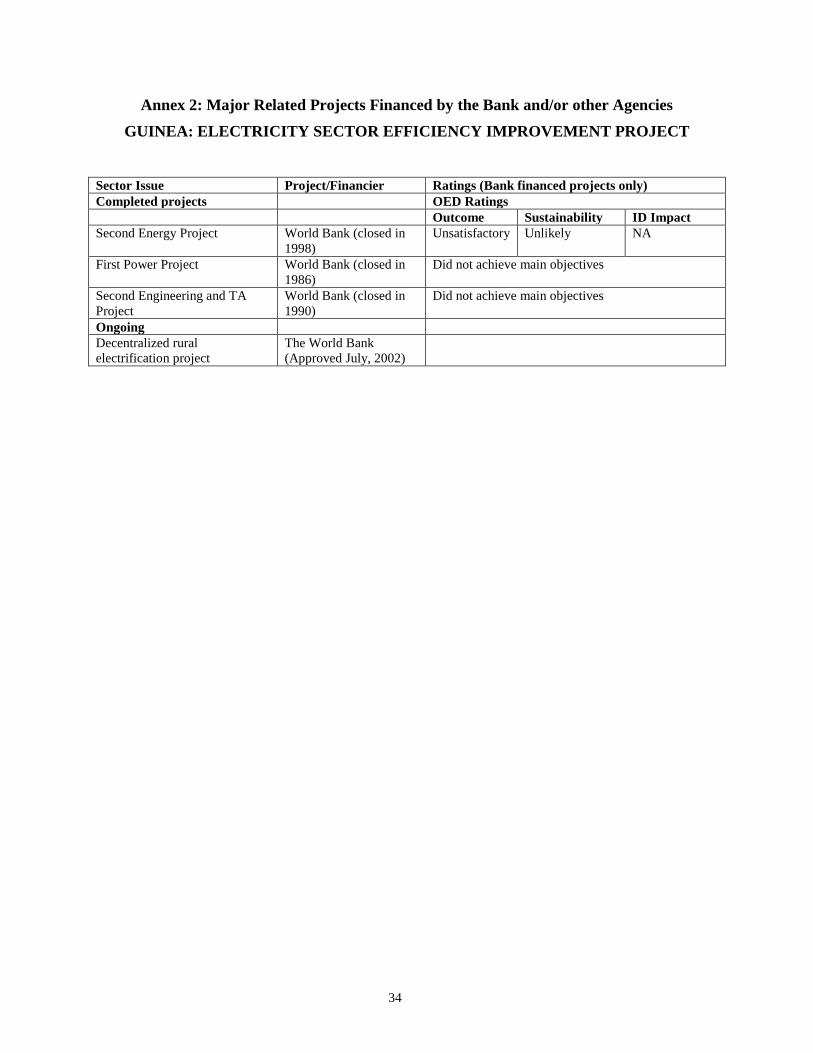
34
Annex 2: Major Related Projects Financed by the Bank and/or other Agencies
GUINEA: ELECTRICITY SECTOR EFFICIENCY IMPROVEMENT PROJECT
Sector Issue Project/Financier Ratings (Bank financed projects only)
Completed projects OED Ratings
Outcome Sustainability ID Impact
Second Energy Project World Bank (closed in
1998)
Unsatisfactory Unlikely NA
First Power Project World Bank (closed in
1986)
Did not achieve main objectives
Second Engineering and TA
Project
World Bank (closed in
1990)
Did not achieve main objectives
Ongoing
Decentralized rural
electrification project
The World Bank
(Approved July, 2002)
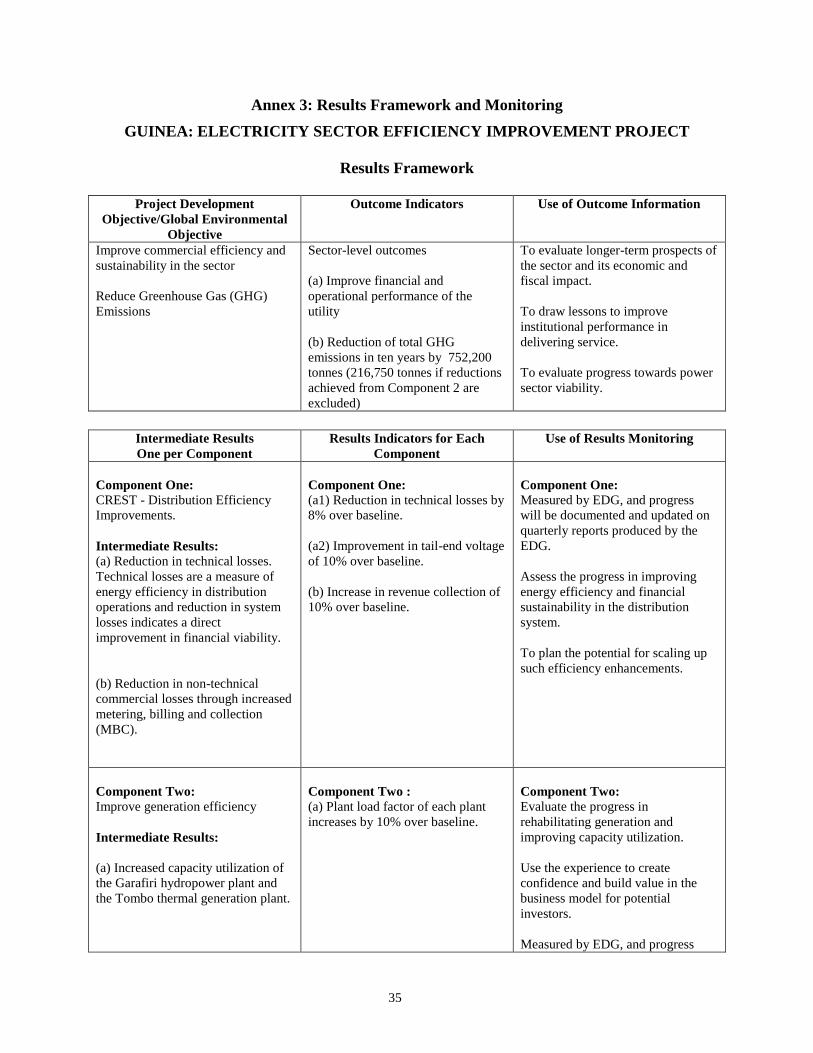
35
Annex 3: Results Framework and Monitoring
GUINEA: ELECTRICITY SECTOR EFFICIENCY IMPROVEMENT PROJECT
Results Framework
Project Development
Objective/Global Environmental
Objective
Outcome Indicators Use of Outcome Information
Improve commercial efficiency and
sustainability in the sector
Reduce Greenhouse Gas (GHG)
Emissions
Sector-level outcomes
(a) Improve financial and
operational performance of the
utility
(b) Reduction of total GHG
emissions in ten years by 752,200
tonnes (216,750 tonnes if reductions
achieved from Component 2 are
excluded)
To evaluate longer-term prospects of
the sector and its economic and
fiscal impact.
To draw lessons to improve
institutional performance in
delivering service.
To evaluate progress towards power
sector viability.
Intermediate Results
One per Component
Results Indicators for Each
Component
Use of Results Monitoring
Component One: CREST - Distribution Efficiency
Improvements.
Intermediate Results:
(a) Reduction in technical losses.
Technical losses are a measure of
energy efficiency in distribution
operations and reduction in system
losses indicates a direct
improvement in financial viability.
(b) Reduction in non-technical
commercial losses through increased
metering, billing and collection
(MBC).
Component One:
(a1) Reduction in technical losses by
8% over baseline.
(a2) Improvement in tail-end voltage
of 10% over baseline.
(b) Increase in revenue collection of
10% over baseline.
Component One:
Measured by EDG, and progress
will be documented and updated on
quarterly reports produced by the
EDG.
Assess the progress in improving
energy efficiency and financial
sustainability in the distribution
system.
To plan the potential for scaling up
such efficiency enhancements.
Component Two: Improve generation efficiency
Intermediate Results:
(a) Increased capacity utilization of
the Garafiri hydropower plant and
the Tombo thermal generation plant.
Component Two : (a) Plant load factor of each plant
increases by 10% over baseline.
Component Two: Evaluate the progress in
rehabilitating generation and
improving capacity utilization.
Use the experience to create
confidence and build value in the
business model for potential
investors.
Measured by EDG, and progress

36
will be documented and updated on
quarterly reports produced by the
EDG.
Component Three:
Institutional Strengthening through
Technical Assistance
Intermediate Results: (a) Promotion of energy efficiency
and conservation.
(b) Establish a robust financial and
accounting system.
(c) Ensure MIS and operational IT
support for the pilot area.
Component Three:
(a) #20 energy audits of customers
completed; reduction in peak load
demand by 12.15 MW from DSM
related activities
(b) Production and disclosure of
annual audited financial statements
with international accounting
standards
(c) Technologies that assist in
remote metering, anti-theft, and
customer service centers.
Component Three:
Assess capacity building for
sustained energy sector reform.
Serve as inputs to policy and
regulation development.
Semi-annual progress reports by the
EDG.
Planning of long-term DSM/energy
efficiency strategy and
programming.
Diligent management of Utility
finances to improve availability of
resources for energy efficiency,
improved service delivery, and
reduce sector’s dependence on
external fiscal support
Energy Audit and Balance leading to
Energy efficiency and loss reduction
Arrangements for results monitoring
Target Values Data Collection and Reporting
Outcome Indicators Baseline YR1 YR2 YR3 Frequency
and Reports
Data Collection
Instruments
Responsibility
for Data
Collection
Results Indicators for Each Component
Project development
objective/Global environmental
objective:
Improvement in utility’s
profitability
Reduction in C02 emission
2005 net
loss of
10bn GNF
TBD
0%
0%
5%
10% of
estimated
reduction
10%
10% of
estimated
reduction
Annual Audited
financials,
Operational
efficiency gains
in distribution
and generation
tracked
EDG, World
Bank
Component One:
Reduction in system losses
Improvement in tail-end voltage
Increased revenues
15
60%
180 Volts
2005
revenues of
100 billion
GNF
0%
0%
0%
4%
5%
5%
8%
10%
10%
Quarterly
System Loss
reduction
would be
measured by the
formula: Units
received –units
billed, and
verified by a
Performance
Verification
Index (PVI),
which is defined
as revenue
collected/ (Units
sent into the
system*Average
Annual end user
EDG, World
Bank
15
Credible baseline information is not available at this time. The baseline information is currently available as composite number (including technical and non-
technical losses). Table 3 on Page 8, provides certain base line information. Appropriate Baseline surveys will be launched for firm base line data before
investment activities are launched.

38
Target Values Data Collection and Reporting
Outcome Indicators Baseline YR1 YR2 YR3 Frequency
and Reports
Data Collection
Instruments
Responsibility
for Data
Collection
tariff).
Component Two: Increased plant load factor of
Garifiri and Tombo Power Plants
60%
0%
5%
10%
Quarterly
Data gathered
from the
Garafiri and
Tombo power
plant
performance
records
EDG, World
Bank
Component Three: # of energy audits of customers
completed for DSMReduction in
peak load demand of 12.15MW
Production of audited
Annual financial statements
Technologies/business processes that
assist in:
a) remote metering,
,
c) anti-theft meters, and
d) customer service centers
0
0
0
0
0
0
4
1
1
1
12
0
\
6
6
1
1
12
1
10
5.15
1
1
12
1
Annual
Data gathered
from the
Ministry, EDG,
and private
sector
implementation
agencies
EDG, World
Bank
EDG,
World Bank

39
Annex 4: Detailed Project Description
GUINEA: ELECTRICITY SECTOR EFFICIENCY IMPROVEMENT PROJECT
Component 1: Distribution Efficiency Improvement (Total US$ 7.3 million, IDA US$ 5.1
million, GEF US$ 2.2 million)
This component aims at improving the commercial and operational efficiency of the distribution
network in order to:
Reduce system losses, both technical and commercial
Improve revenue billing and collections
Improve cash flows through reengineered business processes
Improve customer satisfaction through improved utility interface and better outage
management; and
Contribute to reduction of GHG emissions on account of reduced technical losses in the
distribution network and reduced consumption of HFO on account of improved
generation efficiency
This component will support investments that aim at improving the distribution business in terms
of: (i) networks for reliable supply to be measured by better voltage and reduced outage times as
well as energy losses; (ii) commercial character of the business as measured by enhanced billing
and increased revenues; and (iii) customer interface measured by time required to respond to
complaints, customer services, etc as well as offering DSM programs. The Project will also
facilitate development of capacity in EDG in terms of technical, commercial and personnel
systems and capabilities. The main rationale of these investments is to create value in Guinea’s
electricity business and demonstrate its viability in a replicable manner.
Guinea has large investment requirements. In view of this, any investment influx would not
demonstrate the desired impact unless the same is directed to achieve specific outcomes in
identified areas. In order to address this concern, the Project would adopt a cluster approach.
Clusters would be a group of customers that are served by an electrically demarcated distribution
and sub transmission network. The CREST program and related investments would be
implemented in these clusters to create “islands of excellence”. Hence efforts would be made to
develop these clusters in such a way that measurable and tangible improvements would be
targeted in these clusters in terms of improved distribution sector performance that would lead to
improved revenues, reduced losses and enhanced customer satisfaction in terms of quality of
supply, reduced fault redressal times, and reduced billing complaints.
Features of a typical cluster: The electrical network that is part of a single 11 KV feeder would
be defined as a cluster. Thus a cluster would be a part of the electrical network served by a 33/11
KV substation. Typically, such a substation would have up to six 11 KV feeders. These 11 KV
feeders, the distribution transformers (that would step down the voltage from 11 KV to 415/220
V), the LT network along with the metering and related arrangements at the customer points
would together constitute the distribution network. The incoming 33 KV feeder would constitute
the sub transmission network. These clusters would be serving around 10,000 consumers or a
population of 50,000 each. The clusters are demarcated thus to facilitate measurement of energy
input into the network fed from the 33/11 KV substation into each 11 KV feeder.
40
Typical investments in a cluster
Investments will be made in goods and services related to implementation of the following
initiatives:
a. Improved reliability of supply for customers through reduction of losses by investment in
High Voltage Distribution Systems (HVDS).
b. Enhancing the coverage and quality of metering for HT and LT customers. Better
revenue collection by metering for Max Demand (MD) consumer premises and metering
non-MD consumer premises.
c. Improved quality of supply for customers through reactive power compensation by
installation of online capacitors.
d. Addressing customer concerns through set up of customer care centers.
e. Better cash flow management and the MBC process by introduction of spot billing.
f. Improved attention to customer concerns through launch of rapid response outage
management program.
These investments will strengthen the distribution infrastructure, improve quality of supply and
customer satisfaction and facilitate realization of potential in the sector to be a net cash generator
instead of being the burden that it is currently on the economy. These investments are targeted to
improve quality and continuity of supply, curb pilferage of electricity, and raise the standards of
customer service.
Sub-component detailed description
(a) Reconfiguration of the LV distribution system into a HV distribution system
Quality of supply (Voltage): Voltage profiles in general are very poor and consumers get 180 V
or even lower at times instead of the standard 220 V. As a result household consumers cannot
run appliances at all or are at considerable risk and industrial customers find it very difficult to
carry out industrial and commercial activities efficiently. The CREST program will address the
voltage problem by upgrading the distribution lines to an HVDS to replace the traditional low
voltage distribution system. The current system, typically a 500 KVA transformer, transports the
electricity from a distance at 400 V and serves around 400 customers. By the time the customer
is served, it is at LV through long, sometimes sagging lines that are prone to breakdown or being
tapped into by theft.
With a number of smaller capacity transformers replacing such large transformers under the
HVDS, voltage is stepped down from 11 KV to 220 V at several points along a supply line
instead of at one point. As a result the transformation occurs closer to the consumption point
limiting voltage drop and dramatically improving the voltage profile. In HVDS projects already
implemented in other countries, actual measurements of voltages at consumer points show vast
improvement – from 160 V in some cases to the desired level of 220 V.

41
The higher voltage lines also deter theft, while also dramatically reducing technical losses by
reducing the amount of current output in the system16
. Technical loss reduction increases energy
efficiency and creates reductions of global carbon emissions that can generate revenues.
Pilferage of electricity: A long LT line facilitates theft as it is relatively simple to pilfer
electricity from an LT line. It is practically impossible to pilfer electricity from a distribution
system that is configured under the HVDS that uses insulated aerial bunched cables to connect
the consumption point from the distribution transformer.
(b) Enhancing the coverage and quality of metering for HT and LT customers
It is important that all the energy flows are appropriately measured at all the interface and
network nodes in the grid. Meters should be of appropriate class of accuracy and should be
calibrated and sealed properly to avoid under billing and bypassing the meter and subsequent
pilferage. Special precautions also need to be taken in case of different classes of meters. LV
meters are used to measure energy consumed by the connected premises, if the connection to the
premises is on the downstream side of the LT distribution transformer, i.e. the customer is
connected to the grid at 220 V. In the case of LV electro-mechanical meters, it has to be ensured
that the jewels of the discs are not worn out and that they are within the prescribed time limit. In
case of LV electronic meters it has to be ensured that the counters do not stall or slow down due
to the influence of external magnetic fields. LV meters should be sealed and should be housed in
an appropriate enclosure to avoid tampering and pilferage of electricity. On the other hand, HV
meters are built with tamper proof features. They have an inbuilt RS 232 port that can be used
for communication purposes. A remote reading of HV customer premises using this facility and
interfacing it with a telephone line would be undertaken. HT meters are positioned on the 11 KV
side of the transformer and the customer is responsible for the step down transformer.
It is observed that 80% of the customers in Kaloum do not have meters and are given estimated
bills. This apart from adversely affecting the revenues of EDG, is also facilitating fraud and
corruption. It also leads to customer dissatisfaction with the system. Under this component it is
proposed to procure HV and LV meters and install them at various locations, giving priority to
high revenue yielding customer premises.
(c) Improved quality of supply for customers through reactive power compensation by
installation of online capacitors
If the power factor in the distribution grid is below unity, it leads to generation of reactive power
in the system. While this causes technical losses, it also causes customer dissatisfaction as it
leads to reduction of available voltage at the customer end. This component seeks to rectify this
by procuring capacitors and installing them on the distribution grid as required.
(d) Addressing customer concerns through establishment of customer care centers
16
These losses are calculated as the square of the current multiplied by the resistance. Hence with a 500 KVA
transformer, the output current is 350 amperes resulting in losses of 350x350x resistance value of the wires.
Alternatively with a 25 KVA transformer the output current is 31 amperes. In this case the losses will be 31x31x
resistance value of the wires. Hence this system will lead to a dramatic reduction in technical losses.

42
Improving Customer service: One of the major complaints with EDG is that consumers get bills
that do not reflect the actual consumption and that bills do not get delivered on time if at all they
are delivered. The CREST interventions in this regard include:
Introducing efficiency in marketing, bill distribution and bill collection network by
outsourcing and introduction of new business processes such as spot billing
Segregation of technical and commercial functions and creating exclusive machinery for
customer interface
Establishing networked customer service centers
Internet based interface mechanisms for bill verification and payment
Broad based payment facilities by involving banks, retail outlets, and introduction of
mechanisms such as cash collection cards, and
A multi level grievance mechanism to redress customer complaints.
(e) Better cash flow management and the MBC17
process by introduction of spot billing
The introduction of customer friendly billing systems such as spot billing using hand held
electronic machines would both enhance billing coverage and collection, and improve business
process efficiency. In this system, bills are printed and delivered on the spot at the customers’
premises when their meters are read, and EDG customer database is updated electronically.
Customers have the additional advantage of staggered payment due dates thus reducing crowding
at cash collection centers near the due date. This vastly improves cash flow for the utility as the
billing cycle is reduced to a very significant extent.
(f) Improved attention to customer concerns through launch of rapid response outage
management program.
Continuity of Supply: One of the major concerns of consumers in Guinea is unreliable supply,
caused by a variety of reasons such as the huge shortfall in generation, transmission constraints,
and distribution inefficiencies and discontinuities. The HVDS program adopted under Sub-
component (a) described above would address this concern. To supplement this effort at the
customer interface level, EDG will press into service a system of Rapid Response Units
equipped with uniformed workmen and necessary toolkits/spares, stationed at major areas of
Conakry (Kaloum, Matoto, Ratoma and Dixin) on a pilot basis. These units would be available
round the clock every day to respond to customer complaints of power failure. The rationale for
this initiative is two fold: (i) to reduce outage time and to quickly respond to customer
complaints and (ii) to prepare the customer interface system for a GIS based trouble call
management system that could be taken up later.
Component 2: Generation efficiency improvement (US$ 2.3 million, IDA US$2.3 million)
This component aims at improving the efficiency of the generation plants in order to:
improve generation availability
17
MBC: Metering, Billing and Collection

43
complement and reinforce GOG’s initiative to improve commercial discipline and
operational performance of EDG; and
contribute to reduction of GHG emissions on account of reduced consumption of HFO
used for thermal generation.
The Garafiri Hydro facility was commissioned in 1999. This high profile hydro generation plant
with an installed capacity of 75 MW has been the backbone of electricity production in Guinea.
Of late, the plant has been facing several problems. Investment support would be provided under
this component to EDG, to rehabilitate and improve the efficiency of the existing Garafiri
Hydropower plant. Detailed estimates of specific activities have been prepared and a summary of
the costs involved is available in Annex 8. As the generation efficiency from Garafiri improves,
the dependence of EDG on the thermal facilities would be reduced and consequently the
consumption of HFO, used by EDG for thermal generation, can be reduced, contributing to
lower carbon emissions.
The Tombo Thermal generation plant has five units at present (Tombo I-V) with a cumulative
installed capacity of 67.4 MW. These plants mainly run on HFO and have developed several
snags. Resultantly the heat recovery levels have dwindled and the PLF is going down. The
critical incinerator system for residual HFO disposal is not functioning for lack of essential
repairs. Assistance would be given in the form of critical spares to improve the PLF of the
Tombo units. Specific activities of support have been identified and the details are available in
annex 8.These efforts to improve the efficiency of the thermal generation facilities would reduce
HFO consumption, due to increased efficiency, for the same level of power generation, and thus
would lead to reduction of carbon emissions.
Component 3: Technical Assistance for energy efficiency and Institutional and business
process strengthening (US$4.1 million, IDA US$1.8 million, GEF US$2.3 million.
This component aims at removing barriers for energy efficiency and operational performance in
the following manner:
Develop institutional capacity and framework for energy efficiency and DSM programs
Identify and develop models for private sector capacity development both in terms of
energy efficiency programs and in regular utility operations
Build capacity and systems of prudent financial and accounting practices
Design, develop and implement MIS systems and IT interventions to conduct energy
audit, reduce energy theft, manage energy sales through customer data bases and improve
operations through data management such as HR databases; and
Contribute to reduction of greenhouse gas emissions on account of improved institutional
capacity for energy audits, loss reduction and energy efficiency programs.
A strong institutional base is fundamental to the sustained financial success of the power sector
in Guinea. There is a clear and urgent need to develop a robust, modern technical, financial and
accounting infrastructure base to support EDG in improving its managerial, financial and
operational performance. Further, opportunities for efficiency enhancements from private sector
partnerships and DSM will be identified and explored. The following is a description of specific
TA components:

44
(a) Energy efficiency and conservation
As Guinea faces a severe power shortage in terms of unmet demand and protracted load
shedding, it needs to implement energy efficiency and demand side measures urgently. The EDG
system is small with an installed capacity of 143 MW, but there is an almost equivalent (known)
captive generation at about 120 MW. These enterprises and households are incurring high
energy expenditures due to the use of small, inefficient generators. The DSM program will be
targeted at these enterprises and individuals to offer them options to reduce their energy
consumption. The current project will build on earlier efforts by the Ministry of Energy to
initiate an energy audit program for the commercial and industrial sector.
EDG itself has an interest in controlling the consumption of commercial and industrial sector
enterprises in the interest of developing its customer base. With the current high level of
consumption of these enterprises, it is difficult for the EDG to accommodate them, but it would
be possible to do so once the energy consumption comes down. For the EDG, a broader
customer base has wide ranging positive impacts such as improved revenues, lower revenue risks
and better system stability.
In the case of the EDG’s own customers, close link of the DSM initiatives with EDG business
objectives such as the system peak shaving benefits and distribution loss reduction rationale are
the key drivers of this effort. Even EDG’s most valuable industrial and commercial customers
are causing higher system losses due to poor power factors in their facilities and by stretching
EDG’s peak demand.
In order to launch activities discussed above, the sector would undertake the following:
Implementation of EE/DSM measures following an energy audit of industrial and
commercial establishments, buildings and other facilities where significant energy
consumption occurs and dovetail these efforts with prudent load management targeting
about 12.15 MW in peak demand reduction and initial implementation of pilot projects
will be undertaken in the areas of efficient lighting for public and private buildings as
well as efficient motors in industries.;
Develop appropriate incentives for energy efficiency through tariffs and other
mechanisms
Involve private sector in design and implementation of these programs through ESCOs
Develop institutional capacity in the MEH and EDG for these programs
Develop a policy framework for implementation of activities leading to energy efficiency
and conservation
Implement a communication strategy for generating awareness for energy conservation
The Project recognizes the need to sustain and scale up the efficiency gains that will occur in the
sector through these investments by promoting DSM measures. Accordingly, it would assist in
the development of an appropriate framework and institutional capacity for energy efficiency and
conservation programs, and develop viable strategies for participation of ESCOs to undertake
this work. In view of the limited resource under this Project, other energy efficiency initiatives
detailed above cannot be followed up in this Project and would be taken up in future Bank
projects. It is however, expected that due to the catalytic role played by this component, EDG,

45
the MEH, other sector stakeholders including the private sector would carry this important
activity forward.
(b) Private sector capacity development and partnerships. The Project would assist in
development of private sector capacity through identification and development of areas where
the private sector can intervene with the aim of improving the electricity sector's financial
viability.18
These could include outsourcing of various distribution functions and ESCOs. This
component would essentially deliver a report detailing possible strategies for private sector
participation. The Bank’s energy team has identified two possible public private partnerships in
this context. The first concept of Distribution Function Outsourcing involves the private sector in
the implementation of the project components. The second concept of Distribution Business
Outsourcing was explored and it was felt that a detailed study needs to conducted before
assessing its viability and private sector interest. The TA under this component would help
examine this issue apart from exploring the viability of other approaches of private participation
in the sector.
Public Private Partnership initiatives in implementation of the project
Option I: CREST Distribution function outsourcing
The GNESEIP would support investments in goods and services related to implementation of the
following initiatives under the CREST program:
(a) HVDS
(b) HT Trivector meters for HV loads
(c) LT Trivector meters (CT operated) for LV commercial loads above 20 KW
(d) Single phase and three phase meters (whole current) for LV loads below 20 KW with
AMR facility
(e) Reactive power compensation by installation of online capacitors
(f) Set up of customer care centers
(g) Introduction of spot billing
(h) Launch of rapid response vehicles
These investments will strengthen the distribution infrastructure, improve quality of supply and
customer satisfaction and facilitate realization of potential in the sector. These investments are
targeted to improve quality and continuity of supply, curb pilferage of electricity, and raise the
standards of customer service.
Model bids would be developed under this Project for private parties to take up these initiatives
individually on a turn key basis for a pre specified part of the distribution network or a customer
cluster. While the contract would be on a BOT basis for initiatives mentioned at (d), (e), (f) and
(h), it would be on a BT basis for the rest of the initiatives. To illustrate, under the BOT for
single and three phase LV meters, the contractor shall be responsible for meter reading and
generation of bills for the entire BOT period, which is expected to be around three years.
Option II: Distribution business outsourcing
18
This could imply, for example, the outsourcing of an area to the private sector for supply and billing of electricity.

46
A selected part of the distribution network or a customer cluster would be electrically ring-
fenced and concessioned to a private party. The concessionaire would trade electricity by
purchasing power in bulk from EDG or other generators, and retail it to customers within the
cluster. The concessionaire will pay wheeling charges to EDG for the use of distribution
network. All investments made by the operator in improving the network would be duly
accounted for.
The concession could be for a period of five years, after which the private party would transfer
the cluster to EDG. The size of the network that could be operated under the distribution
business outsourcing will depend on the private sector’s appetite to take the market risks for the
scale of expected operations under a modest sovereign guarantee framework. Therefore, prior
consultations with potential interested parties, foreign and local, are necessary before finalizing
the modalities and form of offers and guarantees.
(c) Financial control and accounting systems.
EDG's internal control policies and procedures and accounting system are inappropriately set up
and not operating well. Although it has taken some initiative and piece-meal approach to
improve its commercial system, the lack of resources have hampered efforts to strengthen
financial management. Essential to an effective financial management is the development at
EDG of the following systems: (i) Inventory Management; (ii) Budget Control; (iii) Treasury
and Cash Management; (iv) Loan Management; (v) Customer Service; (vi) Accounts Receivable;
(vii) Fixed Assets; (viii) Billing and Collection; (ix) Accounts Payable; (x) Procurement Contract
Management Information; (xi) Records Management and Financial Reporting; and (xii) Project
Financial Management. These should be complimented by good information technology and
integrated in an effective management information system.
This project component would assist in capacity building and provision of appropriate
infrastructure for development of financial management and accounting systems. The objectives
are to overhaul EDG's accounting systems and procedures, establish effective internal controls,
and strengthen its financial management capacity through staff training. Technical assistance
would be provided on the following:
Conducting an Institutional Strengthening Assessment that would provide the overall
management perspective towards EDG's commercialization
Developing a Financial Accounting and Management Information System using selected
hardware and software (a single software or a combination of software applications), to
install and put this system into operation at EDG and to provide staff, the knowledge and
skills necessary to operate, maintain the system successfully. The target system would be
the main instrument for modernizing and commercializing EDG's financial management
system.
Re-stating of EDG's balance sheet by verifying questionable and establishing proper
opening balances of accounts
Independent audit arrangements and reporting of EDG's financial accounts
Developing a financial projection model that would be the basis for EDG's future
financial projection, test sensitivities and monitor tariff requirements and compliance
with key financial covenants. The model would follow financial management reporting
standards and calculate the required financial ratios.
..
47
(d) MIS and operational IT support.
The electricity utility business needs to leverage IT for a variety of functions:
The Project would support initiatives leading to capacity building and infrastructure support
through installation of and training on innovative technologies geared towards areas such as
anti-theft measures, energy audit, remote metering techniques, customer billing, HR data
bases, etc.
Assistance would be given to the EDG in the form of training in global best practices in anti
electricity theft measures in other electricity utilities which have successfully reduced
incidence of pilferage of electricity.
Energy audit would be developed as a key business function in EDG through technical
assistance under the Project. This would be done by selecting certain parts of the grid for
energy audit, identifying critical nodes and metering them for this purpose, training for staff
to acquire these capabilities and so on.
Assistance would also be given to develop capacity within EDG for remotely reading high
consumption premises, in order to reduce commercial and technical losses, to supplement the
energy audit function, and check theft of electricity. The focus on high consumption premises
is based on the realization that this customer segment, which constitutes 20% of the customer
base, contributes to 80% of revenue. Hence this initiative would optimize commercial returns
and attack the most debilitating impact of electricity theft. Under this component, the utility’s
central server would be connected to the RS 232 port of the HV electronic meter of the
customer through a telephone line and the consumption would be monitored both for billing
and energy audit purposes. The energy consumed at the premises would be balanced with the
energy sent out from the sub station, thus giving a powerful tool to conduct energy audit. Due
to the memory and other electrical parameters available with the meter’s software, quality of
supply and tamper record such as with the CT ratio can also be monitored.
The customer database is the heart of the distribution business. It determines the revenue
base and would also assist in efficient trouble call management. TA would be provided for
developing a robust customer database.
In order to assess the productivity of EDG and also to introduce cost cutting measures, it is
critical to have a HR database. This information would be critical for future private sector
participation and also for identification of costs such as unfunded pension liabilities. The
Project would assist EDG in developing a functional HR database.

48

49
Annex 5: Project Costs
GUINEA: ELECTRICITY SECTOR EFFICIENCY IMPROVEMENT PROJECT
Project Description All figures in million USD
Component description Total
cost
IDA
Fin
GEF
Fin
% IDA &
GEF
1. Distribution efficiency
Improvement
1.1 a) Technical loss reduction
(Conversion to HVDS)
3.75 2.05 1.7
b) Metering 2.0 2.0 0.0
c) Reactive Power compensation 0.6 0.3 0.3
d) Customer Care Centers 0.05 0.05 0.0
e) Billing process: Spot billing 0.05 0.05 0.0
f) Outage management: Rapid Response units 0.05 0.05 0.0
1.2 Engineering supervision and implementation
support
0.5 0.3 0.2
1.3 System protection and coordination 0.2 0.2 0.0
1.4 Contingency and unallocated 0.1 0.1 0.0
Component 1 Subtotal 7.3 5.1 2.2 100%
2. Generation efficiency enhancement
2.1 Garafiri Investment support 1.0 1.0 0.0
2.2 Tombo Investment support 1.0 1.0 0.0
2.3 Technical studies 0.2 0.2 0.0
2.4 Contingency and unallocated 0.1 0.1 0.0
Component 2 Subtotal 2.3 2.3 0.0 100%
3 Technical Assistance
3.1 Energy Efficiency/conservation/DSM 1.5 0.0 1.5
3.2 Private sector/ESCO studies 0.5 0.2 0.3
3.3 Policy preparation support 0.3 0.2 0.1
3.4 Financial and accounting support 0.6 0.6 0.0
3.5 MIS and IT support 0.7 0.7 0.0
3.6 Monitoring and Evaluation (Including Base line
determination)
0.5 0.1 0.4
Component 3 Subtotal 4.1 1.8 2.3 100%
Total 13.7 9.2 4.5 100%
Note: These costs include: IDA Resources in this project: $7.2 million
GEF Resources in the associated project: $4.5 million
IDA resources in the restructured Decentralized Rural Electrification Project: $2.0 million

50
Annex 6: Implementation Arrangements
GUINEA: ELECTRICITY SECTOR EFFICIENCY IMPROVEMENT PROJECT
The main counterpart for the implementation will be EDG where a team has been created to
implement this Project. The GOG, through the MEH, will provide policy guidance and also take
an active part in implementation. While EDG will implement the TA component involving DSM
and energy efficiency activities, it will implement part of some of those activities (as per details
given in the annex) through the corresponding cell in the MEH.
Rationale for Institutional Arrangements - Implementation would be carried out through a team
formed within EDG, so that various activities under the Project are mainstreamed in terms of
identification, implementation and ownership. Hence, a separate Project Implementation Unit
(PIU) is not contemplated and it is proposed that the project team would be an integral part of the
Directorate of Planning of EDG, which is mandated to identify, plan and execute all investments.
This is in line with the current thinking in the Bank to move away from project specific stand
alone PIUs. However, the experience from implementation of other Bank projects, particularly
the ongoing Decentralized Rural Electrification Project has demonstrated that implementation
capacity is very weak in several Government and parastatal agencies in Guinea. Moreover, EDG
itself does not have a track record of implementing Bank projects or for that matter, any major
investment program. In this backdrop, implementation support is required in all the areas of
preparation, evaluation and award of bids, supervision of execution and procurement and
fiduciary diligence. Hence, it is proposed to provide implementation support services from a firm
with established track record in these matters. This firm would provide support to the
implementation team.
The Counterpart project implementation team would work under the supervision of the Director
of Planning, EDG. It will be responsible for identification of specific investment networks,
related initial surveys, preparation, evaluation and award of bid packages. While the concerned
departments/agencies of EDG would be responsible for on site implementation, the project
implementation team would discharge a monitoring and coordinating role for the entire project
implementation. It would also collect base line data, develop monitoring indicators and evaluate
the developmental impact of the investments.
Component-wise details of departments/agencies within EDG responsible for implementation
under the overall coordination of the Directorate of Planning/project team are:
Component I – Distribution Efficiency Improvement (CREST)
This component would be implemented by EDG and associated business process improvements
will be implemented essentially by the concerned distribution agencies of EDG’s regional
distribution directorates of Kaloum, Dixin, Matoto, and Ratoma.
The Cluster approach and the implementation strategy
Determination of size of the cluster. A cluster could comprise of any of the following
alternatives:
The network of a distribution transformer and its downstream infrastructure.

51
A 11 KV feeder emanating from a 33/11 KV substation.
A 33/11 KV substation and the down stream network.
While each of these alternatives facilitate ring fencing and energy audit, a 11 KV feeder is
selected here as it has specific advantages over other alternatives in the context of this project
area. Given that a 11 KV feeder caters to substantial load with well organized metering, it would
be possible to conduct energy audit and conduct proper monitoring and evaluation of the results.
Distribution operations can be carried out with reasonable overheads and some economies of
scale, if the cluster size is optimal. This would also facilitate private participation and cluster
based outsourcing.
Rationale behind the cluster approach: In contrast with conventional investment approach to
electrical infrastructure, the cluster approach would facilitate the following advantages in
Guinea’s context:
1. Given that the country’s power sector in general and the distribution sector in particular,
require large investments for reasonably efficient operations, there is an imminent risk
that the resource envelope available under the Project may not demonstrate clear impact
if it is too thinly spread across the country. Making concerted investments as per a result
specific strategy in a demarcated area would facilitate directing these investments to
specific tangible and measurable impacts.
2. This approach would facilitate establishing a base line on key performance indicators
such as quality of supply (tail end voltage), distribution losses (technical and
commercial), billing and collections, response and resolution times for various activities
that involve customer interface and so on. The impact that would come by investments in
these clusters can then be measured.
3. The measurement of impacts brought about by investments in clusters would also
facilitate economic and financial cost benefit analysis of investments made in the Project.
4. It would be a matter of enhancing investments and time to scale up the improvement of
the distribution sector by increasing the number of clusters gradually given availability of
resources.
Horizontal and vertical investment components: Even though investments would be
principally fashioned as vertical components targeted to improve distribution in specific clusters,
certain investments would have to be system wide that would strengthen improvements across all
the clusters on a country wide basis. It is expected that after implementation of the GNESEIP,
the number of such clusters (“islands of excellence”) would be replicated and scaled up
substantially, eventually covering more of Guinea by this approach. For this goal to be realized,
it is essential that some system wide measures, such as developing Local and Wide Area
Networks, customer database and related software, standardizations required for design and
safety and so on, are also essential so that clusters would emerge in the targeted manner. The
GNESEIP would therefore incorporate certain investments that would have a horizontal system
wide implication as against the essentially vertical cluster interventions. This would help realize
the overall objective of the distribution efficiency improvement component of the GNESEIP by
leveraging investments in the clusters in order to improve customer service, quality of supply
and financial viability of the sector in the short- and medium-term. This would also have the
value enhancing benefit of creating conducive conditions for a transition to a privately owned
and operated distribution sector to sustain these improvements in the long run. Horizontal

52
components would be investments that would facilitate development of a universal billing
system and software, accounting and financial systems and related hardware and software, wide
area networks and IT infrastructure and so on. Vertical components would be billing machines,
meters, transformers, cables and other equipment that would go in for development of the
distribution infrastructure and related business processes in a given cluster.
Bulk of the goods and services to be procured under this project would essentially be vertical
investment components that are focused on a cluster. Outsourcing of the operation of these
components would also be required by the utility after implementation of these initiatives. The
following is an illustrative list of components that would be covered by this approach.
Customer Service centers
Rapid Response vehicles
Typical horizontal investment components that would be implemented on a system wide basis
for improvements across all the clusters include:
Development of a universal billing system and software, and
Accounting and financial systems and related hardware and software.
Wide area networks and IT infrastructure: In order to integrate the cluster approach with
various initiatives that are sought to be funded under the distribution component of the
GNESEIP, it is proposed to follow an initiative implementation based disbursement approach.
This approach would establish the linkages between performance and disbursement on one hand
and enhance the involvement of regional distribution directorates of EDG in preparation of
proposals with the project implementation team of EDG.
Component II: Rehabilitation of Generation
This component component would be implemented by the concerned managers of the the
Garafiri Hydro and Thombo Thermal facilities.
Component III: Technical Assistance
This six sub components would be implemented by the following:
i) Energy efficiency and conservation:
a. Development of a policy and strategy for energy efficiency, conservation and renewable
energy activities would be implemented by MEH
b. Training and capacity building for concerned staff in MEH and EDG for energy
efficiency, conservation and DSM activities would be implemented by the project
implementation team
c. Identifying ESCOs and preparing the framework for conduct of DSM/ energy
conservation activities (such as energy audits for industrial, commercial, government and
residential consumption points including building audits) would be implemented by the
MEH.
ii) Private Sector capacity development: The project implementation team would
implement this task.

53
iii) Financial and Accounting support: This TA components would be implemented by the
Finance Directorate of EDG.
iv) MIS and IT support: This TA component would be implemented by the project
implementation team.
The project implementation team is represented by all the line and staff departments of EDG.
While the Directorate of Finance of EDG will be responsible for managing the financial affairs
of the Project, it will exercise its monitoring role through its representation in the project
implementation team and through regular diligence. Among other things, the Finance Directorate
and the project implementation team would be responsible for ensuring compliance with the
financial management requirements of the Bank and GOG, including forwarding the quarterly
Financial Monitoring Reports and audited annual financial statements to the Bank. The Internal
Audit Sections of EDG will perform modern internal audit functions for the Project. The IDA
Credit Agreement will require the submission of Consolidated Audited Project Financial
Statements for the Project to the Bank within six months after year-end. Samples of audit reports
are included in Annex XXI of the Financial Accounting Reporting and Auditing Handbook
(FARAH) of the World Bank. Experienced and well-qualified external auditors will be
appointed by EDG (on a TOR acceptable to IDA) to audit project accounts, financial statements
and transactions, irrespective of the source of financing. Project financial management risk is
assessed to be moderate and mitigated through adequate supervision by Bank FMS, and external
auditors.
All accounting and internal audit staff would be sufficiently trained in Bank procedures,
including disbursement, financial management requirements and procurement.
Support to GOG’s transition strategy
GOG’s transition strategy is to seek to improve the sector’s financial health, performance, and
service delivery while still under public ownership, and lay the foundations for public-private
partnership in the medium term. The GNESEIP seeks to support this transition strategy and
facilitate private participation in EDG’s operations in the distribution sector through a
demonstrated viable public private partnership initiative. The Project seeks to assist the sector in
investments that are required for implementation of the CREST program identified by EDG as a
necessary short- and medium-term intervention to achieve sustainable private participation.

54
ANNEX 7- FINANCIAL MANAGEMENT AND DISBURSEMENT ARRANGEMENT
Scope of the assessment. The Guinea Electricity Improvement Project will be implemented by
EDG under the supervision of MEH. Based on project implementation arrangements, the overall
responsibility for the consolidation of financial statements will be carried out within that unit.
However, the experience from implementation of other Bank financed projects has demonstrated
that implementation capacity is very weak particularly in the area of fiduciary aspects. In that
regard, implementation support is required; qualified persons in charge of financial management
and procurement will be appointed to carry the activities.
EDG, financial management capacity. The financial management capacity of EDG should be
acceptable before project effectiveness. The objective is to have a fully established and
functional implementing unit including a fiduciary team to declare the project effective so that at
the outset of the implementation of activities, EDG has the appropriate project accounting,
internal control, and the relevant financial reporting system in place. to (i) reliably record and
report the financial transactions involving the use of project funds and from the Bank and other
donors; and (ii) provide sufficient and relevant financial information for managing and
monitoring program activities.
The project software. The accounting system is based on a well-functioning, computerized
system. To that end, the financial management, accounting and procurement units will be
equipped with a computerized and integrated financial management appropriate to the scale of
the Project. The computerized project financial management system will be multi-currency and
will include the following modules which should be integrated: general accounting, cost
accounting, monitoring and evaluation, assets management, preparation of withdrawal
applications and tracking of disbursements by donors, reports-generating, including quarterly
Financial Monitoring Reports (FMRs) and annual financial statements. A fully functioning
project financial management system satisfactory to the Bank is considered as a condition of
credit effectiveness.
Manual of procedure A Project Administrative, Financial and Accounting Manual should be
put in place. It describes : (i) the overall organization of the Project including an organizational
diagram and job description of the key persons of the project implementation team including the
accounting and financial staff; (ii) the accounting system which will be on accrual basis; (iii) the
main transaction cycles; format, content, and timing of the project financial reporting, i.e.
financial statements and other financial reports including FMRs, filing system, etc.; (iv) the
various operational procedures including budget management (planning, execution and
monitoring) and management of assets, procurement of goods and services, and disbursement;
and (v) internal control procedures. The Accounting Procedures Manual should be available
before project effectiveness and frequently updated in the light of practical experience during
project implementation.
Financial Management risks. The financial management risks are related to: (i) the weak
implementation capacity and shortcomings in financial management as EDG does not have a
track record of implementing Bank projects; (ii) the weak implication of the technical staff on
the internal control issue who are particularly involved in core activities; (iii) availability of

55
timely regular budget for the operations of the project (Programme d’Activité Budgétisé); (iv)
the assessment of the project progress and related costs;
To mitigate these risks, the following has to be observed: (a) care must be exercised in ensuring
the timely availability and release of Counterpart Funds ; (b) regular Bank supervision missions
including SOE reviews and timely follow-up of management issues, will be essential; (c) the
planning and budgeting activity should be properly organized; (d) timely information on
monitoring and evaluation must be provided.
Staffing. It is proposed to provide implementation support services by putting in place a
fiduciary team which will comprise of a procurement specialist, financial management specialist
and an accountant. These staff would be recruited on a competitive selection basis acceptable to
the Bank. They should have the relevant academic and professional experience and be familiar
with Bank procedures and requirements. Persons in charge of the project’s components and their
respective focal points will be appointed within GOG. The Project Financial Management
Specialists will work closely with the Bank’s Financial Management Specialist (FMS) during
the whole life of the Project .
Reporting. At least two sets of financial reports will be prepared by the implementing team
within EDG. The quarterly FMRs, as required by the Bank and the annual project’s financial
statements. The quarterly FMRs, agreed upon appraisal, will be prepared and submitted to the
Bank 45 days after closing of the quarter following the date of effectiveness. The FMRs will be
based on formats developed in the Bank’s Guidelines on FMRs, agreed with the Administrator
and the accountants with some adjustments. The FMRs will include financial, physical progress
and procurement information that is useful to the Borrower while also providing the Bank with
sufficient information to establish whether: (i) funds disbursed to the Project are being used for
the purpose intended; (ii) project implementation is on track; and (iii) budgeted cost will not be
exceeded. A copy of the FMR Guideline will be provided to the team before project
effectiveness by the Bank FMS.
Project Financial Management Capacity Strengthening Action Plan. To ensure that the
above mentioned financial management system requirements will be met in due time to declare
the Credit effective, an action plan is proposed hereafter with tasks to be performed as well as
target completion date.
Action Tasks Target
completion
date
Conditionality
1- Appointment of fiduciary
staff
Appoint/recruit key financial
staff within EDG
04/30/06 Effectiveness
3- Special Accounts Open Special and project Bank
Accounts
05/31/06 Effectiveness
4- Accounting procedures
manual to be provided
Establish the Project
Administrative, Financial and
Accountant Manual.
04/30/06 Effectiveness
5- Recruitment of external
auditor
Appropriate terms of reference
(TOR) for the external auditor to
05/31/06 Negotiations
56
be developed and agreed.
Prepare a shortlist of firms of
qualified auditors to be invited
to submit proposals for
conducting the external audit on
approved TOR acceptable to the
Bank.
05/31/06 Effectiveness
Reporting Agreed on format for FMRs and
ability to prepare FMRs
demonstrated
05/31/06 Effectiveness
Installation of the integrated
financial and accounting
system
Design, installation,
configuration testing and
training of staff
06/30/06 Project
implementation
Audit Arrangements. EDG’s consolicated financial accounts and the project’s consolidated
financial statements will be audited annually by an independent auditor acceptable to the Bank in
accordance with auditing standards also acceptable to the Bank. Audit reports of reasonable
scope and detail will be submitted to the Bank within six months of the end of the audited period.
The auditor will provide an audit opinion on: (i) EDG’s financial statements (ii) the project
financial statement of expenditures (SOE); and (iii) the Special Account (SA );
The auditor will also issue a separate management report on internal and operational procedures,
outlining any recommendations for improvements to internal accounting controls and operational
procedures identified as a result of the financial statement audit. Detailed terms of reference for
the selection of the auditor should be prepared, discussed and agreed on or before effectiveness.
The Audit Scope will be tailored the project’s specific risks in accordance with Bank’s
requirements and agreed with the Borrower. The selection of an auditor acceptable to the Bank is
a condition of effectiveness.
Disbursement Arrangements. Specials Accounts: To facilitate project implementation, GOG
will open one special account which will be located at a reliable commercial Bank in Conakry.
This Special Account would cover IDA funds for the whole activities of the Project. A second
project account will be opened at the same commercial bank and will be used exclusively for the
counterpart funds of the Project .
Disbursements from the Special Account would initially be made on the basis of incurred
eligible expenditures (transaction based disbursements). The Bank would then make advance
disbursements from the proceeds of the Credit by depositing into a Borrower-operated SA to
expedite project implementation. Another acceptable method of withdrawing funds from the
Credit is the direct payment method, involving direct payments from the Credit to a third party
for works, goods and services upon the Borrower’s request. Payments may also be made to a
commercial bank for expenditures against the Bank’s special commitments covering a
commercial bank’s Letter of Credit. The Bank’s Disbursement Letter stipulates a minimum
application value for direct payment and special commitment procedures.
Statements of Expenditures. Disbursements for all expenditures should be against full
documentation for expenditure item under contracts valued at less than: (a) US$150,000 for
goods; (b) US$100,000 for consulting contracts awarded to firms; (c) US$50,000 for consulting
contracts awarded to individuals. Civil works, all training and operating costs will be reimbursed
on the basis of SOEs. All the supporting documentation for SOEs will be retained at EDG and

57
will be readily accessible for review by periodic Bank supervision missions and external
auditors.
Annex 8: Procurement Arrangements
Guinea Energy Sector Efficiency Improvement Project
P077317; GEF P098742
Procurement capacity is weak in various public agencies in Guinea in general and at EDG in
particular. Hence procurement poses a major barrier for effective implementation of the Project
and for achieving the desired outcomes. Inconsistent implementation of procurement laws, rules
and regulations, cumbersome procurement processes and clearances; and weak institutional
structures, among other reasons, contribute to this weak capacity.
GOG undertook a public procurement reform program, supported by an IDF grant in 1997
without much success. Through this initiative, GOG intended to reform its legal, regulatory and
institutional framework related to procurement through public agencies. This exercise, completed
in 2000, gave mixed results. Inconsistent implementation of procurement laws, rules and
regulations, cumbersome procurement processes and clearances, and weak capacity in
implementing agencies continue to adversely affect procurement. Resultantly, implementation is
slow, desired outputs and outcomes remain elusive and developmental aid continues to be
ineffective.
Against this backdrop, EDG, the principal implementing agency for this Project, does not have a
credible track record of implementing donor projects in general and procurement operations in
particular. Since implementation of sector support Bank projects earlier, EDG has undergone a
major change since then. The erstwhile ENELGUI (the asset holding company) and SOGEL (the
network and business operating company) have since been merged in 2001, after the private
concession arrangement for SOGEL came to an abrupt end. In a bid to quickly put together an
entity that would take charge of the electricity operations, EDG in its present form, was put
together without following the standard processes that should precede the creation of a corporate
institution. This has resulted in a situation where, EDG, which is well into its fifth year of
operations, does not have proper institutional structures, accounting mechanisms and asset
registers. Established procedures and staff with adequate capacity that are prerequisites for
reasonable procurement operations are almost non-existent. In this context, the implementation
of this Project faces considerable risk of overruns both in terms of time and costs. It is hence
critical to hedge this risk with mitigating institutional and procedural mechanisms.
The team examined two alternatives in this regard. The first, Performance Based Procurement
(PBP) involves the supply, installation and operation of goods and provision of services by the
vendor for a specified period of time. Payments to the vendor would be predicated on
performance that would revolve typically on predetermined indicators. For example, the
performance indicators for the distribution components could be (i) increase in revenue billed per
KWH; (ii) increase in tail end voltage; and (iii) reduction in outage times. However, in order to
achieve these outcomes, the operator would have to perform as a concessionaire or a
management contractor. This would involve several governance and contractual issues that
would be outside the scope of a normal bid for provision of goods and services. Moreover, given
the abrupt end of the earlier private concession for SOGEL, the situation is not yet prime, for

58
introduction of such a complex implementation arrangement. It would take some time for the
appropriate environment to evolve into a public private partnership sustained by investor
interest, public and Government support. This Project aims to provide assistance, trough a TA
component, for exploring avenues for private participation in the sector. Hence, this alternative
was not considered.
The other alternative considered by the team was the system of Technical Support Services
Procurement. In the conventional method of procurement, a compartmentalized process of
procuring various goods and services is adopted by the implementing agency. In this method,
normally, different vendors provide supply and installation services. And these vendors do not
take any responsibility for operation and use of the assets created. In this scenario, if the
implementation capacity of the procuring agency is weak, there is a discernable disconnect in
translating the procurement actions into desired outcomes. The following features characterize a
Technical Services Contract system:
(i) A single vendor takes the comprehensive responsibility of providing all goods and services
that are required for providing a particular outcome; and
(ii) The vendor also ensures that the commissioned goods and services are operationalized in
such a manner that would deliver the desired outcomes.
By hedging the risk of low implementation capacity of the procuring agency, this system of
procurement ensures effective linkages to outputs and outcomes. In view of this, the Project
would adopt the method of Technical Services Contract Procurement.
The Project has three principal components:
1. Distribution efficiency improvement
2. Generation efficiency improvement
3. Technical Assistance
The Distribution efficiency improvement will be implemented in selected clusters (such as
Kaloum). Some of the principal outcomes/outputs under this activity would be:
Loss detection,
Power distribution management,
System repairs to reduce losses,
Replacements/rectification of loss making connections,
Repetition of loss detection surveys, repairs and rehabilitation work,
Continuous system performance controls/logging, and
Detection and rectification of loss generation areas.
This single responsibility contract will make the contractor responsible for doing the diagnosis,
repair/rectification and making the system fully operational to the expected standards of
performance prescribed in the cluster of implementation. The contractor is expected to be
selected following a two stage bidding with a scope detailing all the requirements of the system
to meet the desired level of performance. It is proposed to use the Bank Standard Bidding
Documents (SBD) for Supply and Installation with two stage bidding and with appropriate
modifications to suit the Scope envisaged. The details will be finalized during the appraisal
mission.

59
A similar approach would be adopted for the Generation Efficiency Improvement component.
The Technical Assistance components would however, be implemented as per normal
procedures adopted under Bank guidelines for such activities.
Procurement for the proposed Project shall be carried out in accordance with the World Bank’s
“Guidelines: Procurement under IBRD. Loans and IDA Credits” dated May 2004; and
“Guidelines: Selection and Employment of Consultants by World Bank Borrowers” dated May
2004, and the provisions stipulated in the Legal Agreement. The various items under different
expenditure categories are described below. For each contract to be financed by the Credit, the
different procurement methods or consultant selection methods, the need for pre-qualification,
estimated costs, prior review requirements, and time frame are agreed between the Borrower and
the Bank in the Procurement Plan. The Procurement Plan will be updated at least annually or as
required to reflect the actual project implementation needs and improvements. The procurement
process that shall be used by the implementing agencies shall be well defined in the Project
Implementation Manual (PIM) which shall include Procurement and Financial Management
Manuals. The Bank shall provide GOG with a copy of the Generic Procurement and Financial
Management Manuals.
I. Procurement of Technical Services Support contract for Distribution Efficiency
Enhancement Component (US$7.3 million) would include one supply and installation
contracts for all the items mentioned below:
(a) Conversion of LVDs Lines to HVDs
(i) supply and installation of 50, 25 and 15 KVA CSP transformers;
(ii) supply and erection of HT poles;
(iii) supply of cables (AB cables, AAC and three Core Cables + neutral);
(iv) supply of OH 100 mm AA conductor for re-conductoring; and
(v) supply and installation of 11 kV automatically switched capacitor banks.
(b) Supply and installation of Critical Distribution Network Maintenance
Materials
(i) supply of HT poles;
(ii) supply of cables (of various sizes 70 - 185mm2 3-core HT Cables);
(iii) supply of OH 100 – 150 mm AA conductors;
(iv) supply of cable jointing kits of various sizes; and
(v) supply of fuses, feeder pillars and RMUs.
(c) Supply and installation of HT Metering Equipment
60
(i) supply and installation of HT Panel Meters.
(d) Supply and installation of LT Metering Equipment
(i) supply and installation of single phase whole current meters;
(ii) supply and installation of three-phase whole current meters; and
(iii) supply and installation of LT maximum demand, trivector
meters/accessories.
(e) Distribution relays
(f) GIS Mapping of distribution network
(g) Outsourcing of rapid response vehicles
(h) Outsourcing of customer service centers
(i) System protection and coordination
(j) Training EDG staff in installation and operation of these activities
II. Procurement of Technical Services Support contract for Generation Efficiency
Enhancement Component (US$2.3 million) would include one supply and installation
contracts for all the items mentioned below:
a) Identified works for the Tombo Thermal plant (US$1.0 million) (Details to be finalized
during Appraisal mission in April 2006)
b) Identified works for the Garafiri Hydro plant (US$1.0 million) (Details to be finalized
during Appraisal mission in April 2006)
c) Technical studies and Contingency (US$0.3 million) (Details to be finalized during
Appraisal mission in April 2006)
III. Procurement of Technical Services Support contract for MIS and IT support
component (US$0.7 million)
This would be a Horizontal or system wide initiative (Details would be finalized during
Appraisal mission in April 2006)
IV. Procurement of Consultancy Services contract (US$3.4 million) for the following:
Energy Efficiency/Conservation/DSM related activities and related training
Private Sector/ESCO capacity development

61
Financial and Accounting support and related training
Policy preparation support
Monitoring and evaluation support
There shall be one bid per cluster (ICB) for all the above works for the Technical services contract in
selected clusters in the Distribution efficiency improvement component.
There shall be one bid (ICB) for Tombo and one bid (ICB) for Garafiri Generation Efficiency
Improvement component for the above works in the form of a Technical Services Contract
Standard procurement procedures shall be followed in case of Consultancy services
The Bank’s SBDs will be used for all International Competitive Bidding (ICB), Limited
International Bidding (LIB) and National Bidding Documents agreed with or satisfactory to the
Bank. However, since there is no National Standard Bidding Document, the Bank’s SBD for
Goods and Works shall be adopted by the Borrower. For evaluation of bids, the Bank’s Standard
Evaluation Forms will be used. The implementing agency will ensure that the most current
version of the appropriate SBD or Standard Request for Proposals (SRFP) and standard forms of
evaluation are used. Less competitive bidding and selection procedures shall not be used to by-
pass more competitive methods, and fractioning of large procurement into smaller ones should
not be done solely to allow the use of less competitive methods or to avoid IDA review.
The Bank’s SRFP would be used for all consulting assignments estimated to cost US$200,000
equivalent or more. For assignments less than US$200,000, until acceptable national SRFP
documents are developed, Bank’s SRFP document will be used. Shortlists of consulting services
estimated to cost less than US$200,000 equivalent per contract may be composed entirely of
national consultants in accordance with the provisions of paragraph 2.7 of the Consultant
Guidelines. Consultancy services estimated to cost less than US$200,000 equivalent per contract
may be procured in accordance with provisions of paragraphs 3.6, 3.7 and 3.8 of the Consultant
Guidelines. Consultancy services estimated to cost US$100,000 equivalent or more per contract
may be procured in accordance with provisions of paragraphs 5.1, 5.2, 5.3 and 5.4 of the
Consultant Guidelines. All single-source services irrespective of the amount may be procured in
accordance with provisions of paragraphs 3.9, 3.10, 3.11, 3.12 and 3.13 of the Consultant
Guidelines. The appropriate selection method for each consulting services contract would be
established in the Procurement Plan.
Retroactive Financing: Independent auditors/advisors would be financed under retroactive
financing to value, review, verify and confirm the opening balances of EDG’s accounts and
balance sheets as required for project negotiation. Retroactive financing in an aggregate amount not
to exceed US$50,000 and accounting for 0.7% of the expected IDA credit amount, would be provided for
anticipated expenditures incurred after April 1, 2006.
Operational Costs: The operating costs that shall be financed by the Project are to be agreed
during negotiations and contained in the Development Credit Agreement.
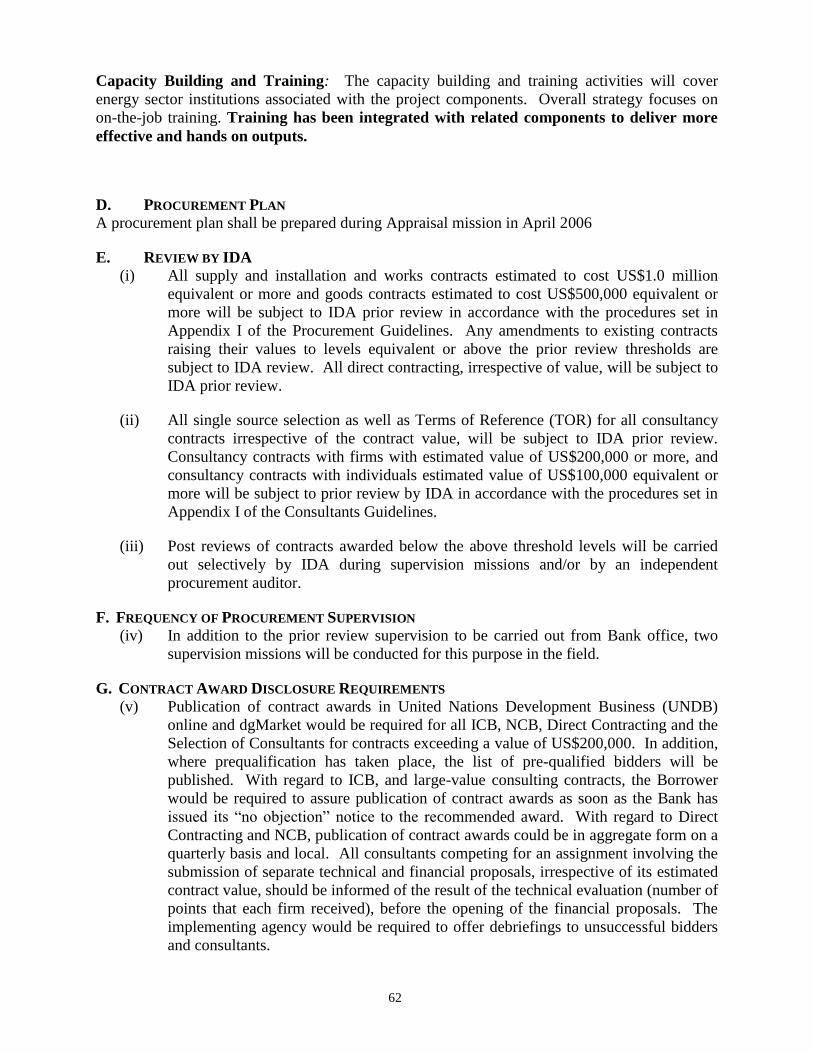
62
Capacity Building and Training: The capacity building and training activities will cover
energy sector institutions associated with the project components. Overall strategy focuses on
on-the-job training. Training has been integrated with related components to deliver more
effective and hands on outputs.
D. PROCUREMENT PLAN
A procurement plan shall be prepared during Appraisal mission in April 2006
E. REVIEW BY IDA
(i) All supply and installation and works contracts estimated to cost US$1.0 million
equivalent or more and goods contracts estimated to cost US$500,000 equivalent or
more will be subject to IDA prior review in accordance with the procedures set in
Appendix I of the Procurement Guidelines. Any amendments to existing contracts
raising their values to levels equivalent or above the prior review thresholds are
subject to IDA review. All direct contracting, irrespective of value, will be subject to
IDA prior review.
(ii) All single source selection as well as Terms of Reference (TOR) for all consultancy
contracts irrespective of the contract value, will be subject to IDA prior review.
Consultancy contracts with firms with estimated value of US$200,000 or more, and
consultancy contracts with individuals estimated value of US$100,000 equivalent or
more will be subject to prior review by IDA in accordance with the procedures set in
Appendix I of the Consultants Guidelines.
(iii) Post reviews of contracts awarded below the above threshold levels will be carried
out selectively by IDA during supervision missions and/or by an independent
procurement auditor.
F. FREQUENCY OF PROCUREMENT SUPERVISION
(iv) In addition to the prior review supervision to be carried out from Bank office, two
supervision missions will be conducted for this purpose in the field.
G. CONTRACT AWARD DISCLOSURE REQUIREMENTS
(v) Publication of contract awards in United Nations Development Business (UNDB)
online and dgMarket would be required for all ICB, NCB, Direct Contracting and the
Selection of Consultants for contracts exceeding a value of US$200,000. In addition,
where prequalification has taken place, the list of pre-qualified bidders will be
published. With regard to ICB, and large-value consulting contracts, the Borrower
would be required to assure publication of contract awards as soon as the Bank has
issued its “no objection” notice to the recommended award. With regard to Direct
Contracting and NCB, publication of contract awards could be in aggregate form on a
quarterly basis and local. All consultants competing for an assignment involving the
submission of separate technical and financial proposals, irrespective of its estimated
contract value, should be informed of the result of the technical evaluation (number of
points that each firm received), before the opening of the financial proposals. The
implementing agency would be required to offer debriefings to unsuccessful bidders
and consultants.

63
H. ETHICS/TRANSPARENCY
(vi) All procuring entities as well as bidders, suppliers and contractors shall observe the
highest standard of ethics during the procurement and execution of contracts financed
under the project in accordance with Paragraph 1.15 and 1.16 of the Guidelines:
Procurement under IBRD Loans and IDA Credits, May 2004): and Paragraph 1.25
and 1.26 of the Guidelines: Selection and Employment of Consultants by World Bank
Borrowers, May 2004.
I. DETAILS OF THE PROCUREMENT ARRANGEMENTS INVOLVING INTERNATIONAL
COMPETITION
(vii) The Project’s detailed activities for the first 18 months of implementation are detailed
in the Procurement Plan which will be discussed and agreed between IDA and the
GOV during negotiations and will be incorporated in the PIM.

64
Table A: Thresholds for Procurement Methods and Prior Review
Expenditure
Category
Contract Value
Threshold (US$)
Procurement
Method
Contracts Subject
to
Prior Review (US$)
1. Works
Supply and
Installation
>=1 million
<1,000,000
ICB
NCB
All contracts
None
2. Goods
>=500,000
<500,000
<50,000
All Values
ICB/LIB
NCB/LIB
Shopping/IAPSO
Direct Contracting
All contracts
None
None
All contracts
3. Consulting
Services
>=200,000 – firms
<200,000 – firms
>=100,000 –
individuals
<100,000 –
individuals
All values
QCBS
QCBS/LCS/SBCQ
IC
IC
Single-Source
Selection
All contracts
None
All contracts
None
All contracts
4. Training Annual Plan All Training
Note: ICB = International Competitive Bidding
LIB = Limited International Bidding
NCB = National Competitive Bidding
DCT = Direct Contracting
IAPSO = Inter Agency Procurement Services Office
SHOPPING = International/National Shopping
QCBS = Quality- and Cost-Based Selection
SBCQ = Selection Based on Consultants’ Qualification
IC = Individual Consultants
LCS = Least Cost Selection
SS = Single Source

65
ATTACHMENT I - DETAILS OF THE PROCUREMENT ARRANGEMENT
INVOLVING INTERNATIONAL COMPETITION
A. I. General
1. Project information: Guinea-Electricity Sector Efficiency Improvement Project
Project ID No: P077317
Project Implementing Agencies: EDG
2. Bank’s approval Date of the Procurement Plan:
3. Date of General Procurement Notice:
4. Period covered by this procurement plan:
B. C. II. Goods, Supply and Installation and Works and non-consulting services
1. Prior Review Threshold: Procurement Decisions subject to Prior Review by the Bank
as stated in Appendix 1 to the Guidelines for Procurement:
Procurement Method Prior Review
Threshold
Comments
1. ICB and LIB (Goods) >=500,000 All Contracts 2. ICB (Works/Supply & Installation) >=1.0 million All Contracts 3. ICB (Non-Consultant Services) >=500,000 All Contracts 4. Direct Contracting All Values All Contracts
(a) List of contract Packages which will be procured following ICB and Direct contracting:
(b) ICB Contracts estimated to cost above US$500,000 equivalent or more per
Contract and all Direct Contracting will be subject to prior review by the Bank.
Note: Further details including the Procurement Plan would be finalized during appraisal
mission in April 2006.

66
Annex 9 A
Economic Analysis
Background
1. The Project has both a distribution and generation component. However, it focuses on the
enhancement of business processes and supporting investments with the aim of returning distribution to
its function of a revenue generating business. The Project increases the distribution business by focusing
on (i) the High Voltage Distribution System (HVDS); (ii) meters; (iii) rapid response vehicles; and (iv)
customer service centers. In addition, key investments in generation capacity are envisaged, which will
enhance the available electric capacity in the system. The envisaged investments in generation capacity
are key to keeping generation operational. The analysis here deals with the investment components of the
project only.
Alternatives
2. The alternatives to the measures suggested under this Project would be a “do nothing” approach,
which would be likely to lead to the final erosion of the viability of EDG. The costs of this option would
be the costs of alternative supply of electricity through small diesel generators, batteries and kerosene (for
lighting). The cost of such unserved energy has been estimated for Senegal at US$ 1.82 and as an average
for the entire ECOWAS region at US$ 0.15 (ECOWAS West Africa Power Pool Masterplan, 2004).
Current costs of energy generation in Guinea have been estimated by EDG at GNF 416.88 or about US$
0.09. Although there is significant uncertainty regarding these data, they are sufficient to conclude that the
proposed Project constitutes the least cost course of action.
Key Assumptions
3. All values are of the year 2006 and where appropriate have been discounted to 2006 at the rate of
12%. For the conversion of investment and O&M costs from Euro into US Dollar a rate of 0.831 US$/€
was applied. For the purposes of the economic analysis, appropriate costs and benefits have been
estimated for a ten year period, as most of these equipments require replacement in that time frame. The
current average tariff of 3.9 €cents/ kWh has been used for quantifying the energy gains that result due to
these investments. A number of assumptions were made in order to evaluate the costs and benefits of the
various distribution investments. The basis for these assumptions is drawn from an analysis of the
historically established distribution costs and benefits in Nigeria, on measured empirical data emanating
from CREST pilot projects under implementation, and on the basis of experience gathered in India. The
table below details the key assumptions made for the economic and financial analysis of the HVDS and
meters under the distribution component.
Initiative Assumptions on
direct Benefits
Assumptions on other
Benefits
Assumptions on O & M
HVDS Technical loss
reduction
resulting in
energy saved:
8%;
60% load factor.
Voltage improvement
resulting in substitution of
energy from captive
generation to grid supply:
3%;
Cost of captive energy US$
0.10
5% of the cost of
investment;
2% associated other
cost for marketers
and meter readers.

67
Metering, spot
billing, customer
care and rapid
response vehicles.
Increase in
billing 5%;
50% load factor.
Installation of about 100
HV meters and 66,000 LV
meters;
Increase in energy sales on
account of new customers:
2%;
Financial benefits due to
segregation of customer
premises: 1%
3% of the cost of
investment;
2% associated cost
for marketers and
meter readers.
Project Benefits and Costs
4. The economic analysis of the Project is based on a cost-benefit analysis of the main investment
sub-components. A range of benefits is evaluated for each sub-component. For the distribution
component benefit analysis focuses on reduced losses (technical and non-technical), increased sales, and
improved revenues. Table 3 gives an overview of the types of benefits that are generated under the
distribution process. Given the small amounts allocated for rapid response vehicles and customer service
centers, benefits are only quantified for investments in HVDS and meters. For the generation analysis, the
benefit analysis focuses on increases generation (kWh) and increased sales. A minimum value of the
incremental demand has been computed on the basis of a load growth of 4% per year, and the average
tariff of 3.9 €cents/kWh (2004 revised average EDG tariff).
5. The evaluation of economic and financial benefits differs in that the economic benefits evaluate
the benefits of the Project to the economy as a whole, while the financial benefits evaluate the benefits of
the Project to the company itself. The two main differences are (i) reduction of commercial losses; and (ii)
segregation of meters. In the context of (i) the reduction of commercial losses does not bring about
economic benefits as currently this electricity is being consumed and benefits for Guinea’s economy are
derived. Reduction in commercial theft will merely “relocate” this benefit to the utility EDG. Similarly,
the segregation of meters from one meter serving a number of households to one meter per household will
not yield an economic benefit. However, EDG will financially benefit as each of the households would
now have to pay a minimum connection fee, rather than one connection fee paid by the group of
previously jointly connected households.
6. The main economic and financial costs are the total investment costs, the O&M costs and
various other costs. The investment costs include spare parts for the generation component and
distribution equipment such as transformers, meters and conductors for the distribution component. The
O&M costs include mainly repair and maintenance costs. Economic and financial costs differ as the
economic costs do not include taxes or financial charges. Economic costs are also net of price
contingencies, which are included in the financial costs. A detailed cost breakdown is presented in Annex
5.
7. The Project produces a robust EIRR of 27% as compared to the opportunity costs of capital at
12%. The project’s FIRR is sound at 29%. The distribution component of the project produces an EIRR
of 25% and an FIRR of 27%. The generation component produces an EIRR of 30% and an FIRR of 30%.
Table 1 below summarizes the key indicators.
Table 1:Key Economic Indicators of Project
(in US$)
Distribution
Efficiency
Improvement
Generation
Improvement Total
Economic Benefits 10.12 21.56 31.68

68
Investment Costs (including taxes and financial charges) 5.90 2.60 8.50
O&M Costs 2.58 17.00 19.58
Economic NPV 2.29 1.96 4.25
Financial NPV 1.64 1.22 2.86
EIRR 25% 30% 27%
FIRR 27% 30% 29%
Note: A discount rate of 12% and 16% is assumed to calculate the present values for the economic and financial analysis.
Input data will be confirmed at appraisal.
Sensitivity analysis
8. The net present value (NPV) for the economic analysis at a 12% discount rate yields
approximately US$4.25 million. The NPV is sensitive to changes in the tariff levels. Especially a marked
decline in tariff in real terms could endanger the economic viability of the project as a whole.
Tab
le 3:
Ben
efits
by
Category
I. High Voltage Distribution System:
(a) Technical loss reduction;
(b) Non technical loss reduction (on account of reduced theft of electricity);
(c) Enhanced energy billing due to enhanced loads;
(d) Increase in sales owing to load growth on account of increase in distribution capacity.
II. Meters
(a) Enhanced energy billing due to efficient metering
(b) Increase in sales due to metered new customers (who would have been supplied energy without
metering in the absence of this investment)
(c) Higher energy sales due to segregation of customer premises
III. Rapid response vehicles
(a) Increase in billing due to decrease in outage times
(b) Reduced energy losses due to detection and elimination of illegal connections
IV. Customer Service Centers
(a) Higher recoveries induced by better customer outreach
(b) Increase in sales due to ease of obtaining new connections to the grid
Table 2: Results of sensitivity analysis on the economic and financial rate of return
Scenario EIRR
(in %)
FIRR
(in %)
Economic NPV
(in US$ million)
Higher Average Tariff (+10%) 30 32 4.73
Lower Average Tariff (-10%) 25 25 3.49

69
Annex 9-B: Sector Financial Summary
A. Past Financial Performance and Present Financial Position
1. The electricity sector is in a critical situation. EDG whose management was taken over by the
State following the termination of a private concession contract is facing enormous financial difficulties.
Since 1994, the electricity sector was managed by two different entities: Enelgui (the asset holding
company) and Sogel (the operating company). Enelgui was formed in 1988 as a financially autonomous
public corporation with its own board of directors, replacing Societe Nationale d’Electricite (SNE), as the
owner and operator of all electric assets previously held by SNE. The same legislation and corporate
statutes which enabled the formation of Enelgui also offered it broad latitude for the planning and
execution of its investment program while defining and narrowing the role of the Ministry of Natural
Resources, Mines and Energy to undertake sector policy formulation and regulatory oversight as opposed
to its previous full planning and day-to-day control of the utility. However, despite the statutes,
government intervention in Enelgui’s business continued unabated. Contrary to expectation, Enelgui also
failed to make significant improvements in its financial position compared to SNE. It continued to operate
at a loss, reflecting poor management practices and the unwillingness of GOG to grant regular tariff
adjustments. Low levels of metering, billing and collection, and high level of bad debts persisted,
essentially bankrupting Enelgui.
2. In 1994, Enelgui was transformed into a state-owned enterprise, and its supply facilities were
transferred to the private operator Sogel via a 10-year concession contract awarded
following an international tender. Enelgui bought a stake in Sogel by contributing one-third of the equity,
and a consortium headed by HydroQuebec contributed two-thirds. In October 2001 the concession
contract was terminated prematurely by HydroQuebec after it became apparent that Sogel was unable to
operate the facilities as successfully as had been expected. The consortium’s shares in the company were
sold to the Guinean state, which then liquidated Enelgui and transferred its assets to EDG, which was
founded in December 2001. The dissolution of the Sogel partnership was not amicable and a dispute
ensued with the foreign partners who sought remedies from the GOG. It was only in October 2005 that a
compromise agreement was reached between the parties for a settlement of their differences.
3. A summary of the current financial performance of EDG's consolidated accounts is presented in
Table 1. As a relatively newly formed entity with a history of management deficiencies and changes and
poor accounting and financial infrastructure, EDG currently faces significant constraints in providing
detailed historical and projected consolidated financial information, severely restricted in-depth financial
analysis of EDG’s past performance and future sustainability. The analysis henceforth is based on the
limited amount of financial information supplied by EDG thus far..
4. Given the lack of capacity in furnishing proper financial data, the Project has established, as part
of its technical assistance component, assistance for the development of a robust financial and accounting
system to capture necessary information that is critical for the proper management and future growth of
EDG. As part of the covenant package, EDG would be required to provide fully audited consolidated
financials which are compliant with international accounting standards and consisting of the complete
income statement, balance sheet and cash flow statement for the past three years to be made available by
July of 2007. Detailed historical and projected financial performance is available in the project files.
5. EDG recorded net losses in each of its full year of operation (FY03 and FY04) at GNF 25 bllion
and GNF 11 billion, respectively, and this, despite a 14% increase in sales of electricity in FY04. While
operating losses declined considerably from GNF 6 billion in FY03 to an operating profit of GNF 15
billion in FY04, in large measure due to EDG’s efforts at holding down O&M and selling and
administrative expenses, provisions for bad debts and other operating expenses, the FY04 operating ratio
(operating expense as a percentage of operating revenues) improved tremendously 76% (110% in FY03).
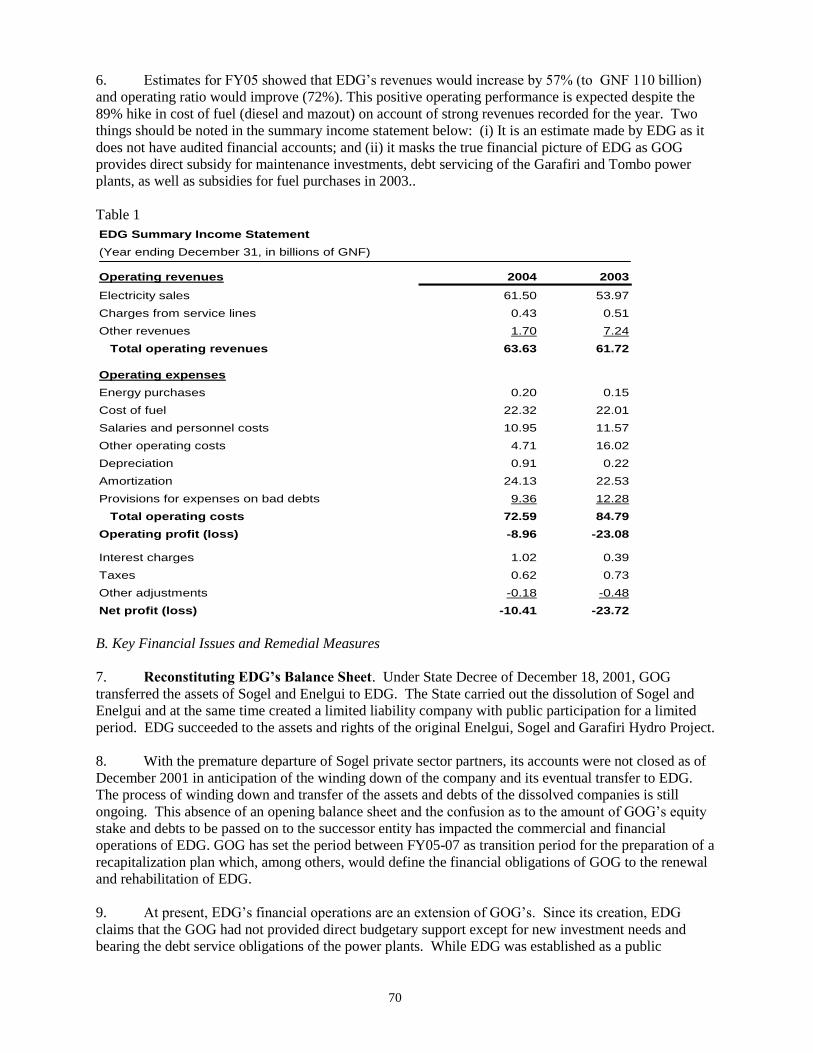
70
6. Estimates for FY05 showed that EDG’s revenues would increase by 57% (to GNF 110 billion)
and operating ratio would improve (72%). This positive operating performance is expected despite the
89% hike in cost of fuel (diesel and mazout) on account of strong revenues recorded for the year. Two
things should be noted in the summary income statement below: (i) It is an estimate made by EDG as it
does not have audited financial accounts; and (ii) it masks the true financial picture of EDG as GOG
provides direct subsidy for maintenance investments, debt servicing of the Garafiri and Tombo power
plants, as well as subsidies for fuel purchases in 2003..
Table 1
EDG Summary Income Statement
(Year ending December 31, in billions of GNF)
Operating revenues 2004 2003
Electricity sales 61.50 53.97
Charges from service lines 0.43 0.51
Other revenues 1.70 7.24
Total operating revenues 63.63 61.72
Operating expenses
Energy purchases 0.20 0.15
Cost of fuel 22.32 22.01
Salaries and personnel costs 10.95 11.57
Other operating costs 4.71 16.02
Depreciation 0.91 0.22
Amortization 24.13 22.53
Provisions for expenses on bad debts 9.36 12.28
Total operating costs 72.59 84.79
Operating profit (loss) -8.96 -23.08
Interest charges 1.02 0.39
Taxes 0.62 0.73
Other adjustments -0.18 -0.48
Net profit (loss) -10.41 -23.72
B. Key Financial Issues and Remedial Measures
7. Reconstituting EDG’s Balance Sheet. Under State Decree of December 18, 2001, GOG
transferred the assets of Sogel and Enelgui to EDG. The State carried out the dissolution of Sogel and
Enelgui and at the same time created a limited liability company with public participation for a limited
period. EDG succeeded to the assets and rights of the original Enelgui, Sogel and Garafiri Hydro Project.
8. With the premature departure of Sogel private sector partners, its accounts were not closed as of
December 2001 in anticipation of the winding down of the company and its eventual transfer to EDG.
The process of winding down and transfer of the assets and debts of the dissolved companies is still
ongoing. This absence of an opening balance sheet and the confusion as to the amount of GOG’s equity
stake and debts to be passed on to the successor entity has impacted the commercial and financial
operations of EDG. GOG has set the period between FY05-07 as transition period for the preparation of a
recapitalization plan which, among others, would define the financial obligations of GOG to the renewal
and rehabilitation of EDG.
9. At present, EDG’s financial operations are an extension of GOG’s. Since its creation, EDG
claims that the GOG had not provided direct budgetary support except for new investment needs and
bearing the debt service obligations of the power plants. While EDG was established as a public

71
company and a separate commercial entity, the objective will be to attain financial independence, and
adjust tariffs so that they are ultimately cost-reflective. To allow EDG to begin its new commercial life
without past financial overhang, the balance sheet should be reconstituted, subject to the approval of
GOG and under valuation procedures satisfactory to the Bank. Given the precarious state of EDG’s
finances, utmost priority should be to given to establishing EDG’s accounts and ensuring its viability to
continue operating to a stage where it could pay a dividend to GOG and generate enough cash from
operations for reinvestment. Agreement would be reached during negotiations that, not later than April
30, 2006, GOG will record approval of EDG’s reconstituted balance sheet as at December 31, 2005.
10. Insufficient Electricity Tariffs. The poor financial performance of EDG is in part due to the
inadequacy of tariffs to recover operational costs. Tariffs have remained unchanged until September
2004 when GOG approved an increase of 74% in electricity tariffs, the first such increase since FY96.
Although electricity tariffs are relatively high – GNF 197 and 492/kwh (US$0.05 and 0.12/kwh) on
average, for retail and wholesale consumers, respectively, steep production costs, high losses and a poor
collection record have caused EDG to run a large cash deficit, covered by GOG. While the average tariff
levels rose in the past year to GNF 240/kWh (US cents 5.97/kWh), the combination of technical and non-
technical losses has pushed the sector into a vicious cycle where non-performance of distribution
adversely affected generation by minimizing maintenance and ever increasing load shedding. In early
FY05, load shedding stood at 700-800 MWhs per day. In addition, EDG absorbs part of its losses through
a subsidy also given by GOG (the FY04/05 budget has a provision of GNF 30 billion, equivalent to about
US$7.5 million).
11. The proposed Project aims to close the financial gap that EDG currently faces by improving
generation capacity, and commercial and technical distribution efficiency, thereby reducing technical and
non-technical losses to a more reasonable level. A combination of increased generation driving electricity
sales, and higher levels of billing and collection enhancing revenue realization is expected to curve losses
and generate positive cash flows. However, efficiency enhancements alone will not be sufficient to
achieve full financial recovery. Notwithstanding commercial and operational efficiency gains, unless
proper tariff adjustments are made to reflect cost recovery levels, the electricity sector in Guinea will
continue to be burdened by its inability to cover costs and make necessary investments to sustain and
grow the sectoral capacity. A Tariff Study has been launched to evaluate EDG’s Sector Financial
Recovery Plan which includes a mix of efficiency interventions and tariff adjustments and within the
framework of the Recovery Plan to (i) analyze the real cost of electricity supply in Guinea, (ii) review
current tariff levels and policies, (iii) recommend a tariff structure, and (iv) assess the financial impact of
the proposed tariff structure.
12. High Electricity Losses. FY03 was the worst operating year for the sector since FY99 in as far
as production and technical indices are concerned. During the year, EDG produced 578 Gwh of
electricity and purchased 6 Gwh from the power pool to meet increasing demand for electricity which
peaked at 139 Gwh. Actual electricity sales dropped from 299 Gwh in FY02 to 229 Gwh in FY03, a
reduction of 24% for the year. While technical losses was reported at 10% of power produced, total
electricity lost, stolen or unaccounted for in the system reached its heights during the year to 70% (349
Gwh).
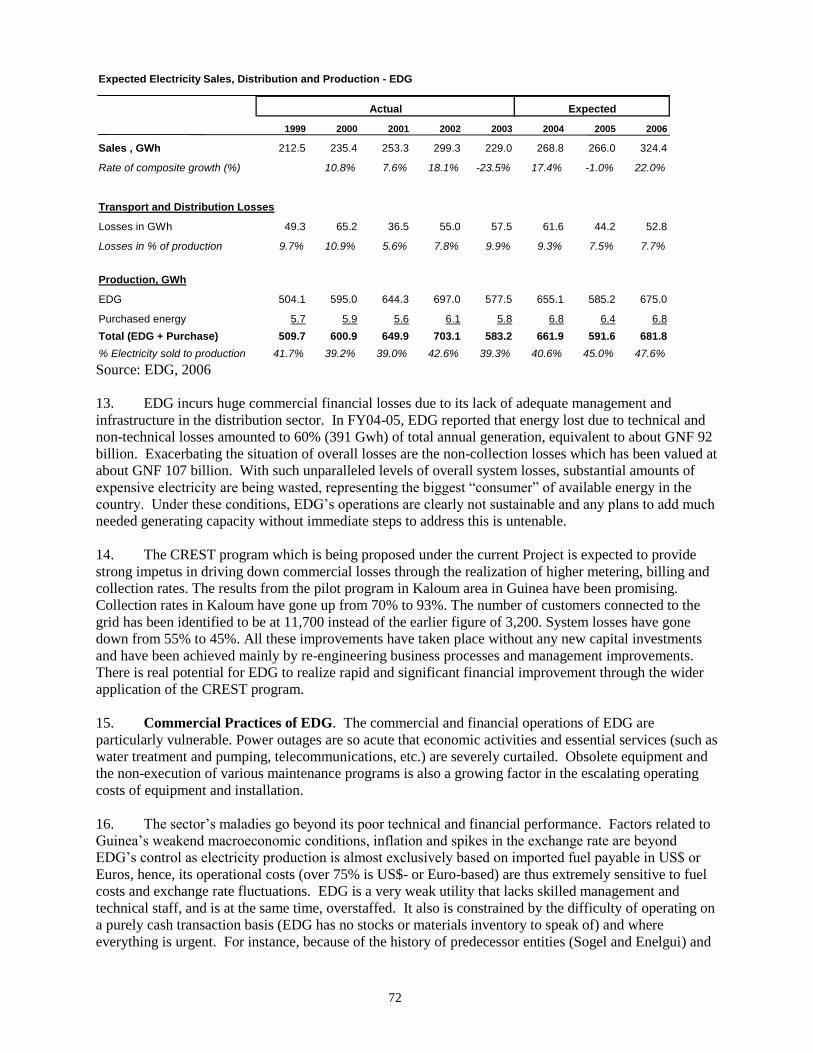
72
Expected Electricity Sales, Distribution and Production - EDG
1999 2000 2001 2002 2003 2004 2005 2006
Sales , GWh 212.5 235.4 253.3 299.3 229.0 268.8 266.0 324.4
Rate of composite growth (%) 10.8% 7.6% 18.1% -23.5% 17.4% -1.0% 22.0%
Transport and Distribution Losses
Losses in GWh 49.3 65.2 36.5 55.0 57.5 61.6 44.2 52.8
Losses in % of production 9.7% 10.9% 5.6% 7.8% 9.9% 9.3% 7.5% 7.7%
Production, GWh
EDG 504.1 595.0 644.3 697.0 577.5 655.1 585.2 675.0
Purchased energy 5.7 5.9 5.6 6.1 5.8 6.8 6.4 6.8
Total (EDG + Purchase) 509.7 600.9 649.9 703.1 583.2 661.9 591.6 681.8
% Electricity sold to production 41.7% 39.2% 39.0% 42.6% 39.3% 40.6% 45.0% 47.6%
Actual Expected
Source: EDG, 2006
13. EDG incurs huge commercial financial losses due to its lack of adequate management and
infrastructure in the distribution sector. In FY04-05, EDG reported that energy lost due to technical and
non-technical losses amounted to 60% (391 Gwh) of total annual generation, equivalent to about GNF 92
billion. Exacerbating the situation of overall losses are the non-collection losses which has been valued at
about GNF 107 billion. With such unparalleled levels of overall system losses, substantial amounts of
expensive electricity are being wasted, representing the biggest “consumer” of available energy in the
country. Under these conditions, EDG’s operations are clearly not sustainable and any plans to add much
needed generating capacity without immediate steps to address this is untenable.
14. The CREST program which is being proposed under the current Project is expected to provide
strong impetus in driving down commercial losses through the realization of higher metering, billing and
collection rates. The results from the pilot program in Kaloum area in Guinea have been promising.
Collection rates in Kaloum have gone up from 70% to 93%. The number of customers connected to the
grid has been identified to be at 11,700 instead of the earlier figure of 3,200. System losses have gone
down from 55% to 45%. All these improvements have taken place without any new capital investments
and have been achieved mainly by re-engineering business processes and management improvements.
There is real potential for EDG to realize rapid and significant financial improvement through the wider
application of the CREST program.
15. Commercial Practices of EDG. The commercial and financial operations of EDG are
particularly vulnerable. Power outages are so acute that economic activities and essential services (such as
water treatment and pumping, telecommunications, etc.) are severely curtailed. Obsolete equipment and
the non-execution of various maintenance programs is also a growing factor in the escalating operating
costs of equipment and installation.
16. The sector’s maladies go beyond its poor technical and financial performance. Factors related to
Guinea’s weakend macroeconomic conditions, inflation and spikes in the exchange rate are beyond
EDG’s control as electricity production is almost exclusively based on imported fuel payable in US$ or
Euros, hence, its operational costs (over 75% is US$- or Euro-based) are thus extremely sensitive to fuel
costs and exchange rate fluctuations. EDG is a very weak utility that lacks skilled management and
technical staff, and is at the same time, overstaffed. It also is constrained by the difficulty of operating on
a purely cash transaction basis (EDG has no stocks or materials inventory to speak of) and where
everything is urgent. For instance, because of the history of predecessor entities (Sogel and Enelgui) and
73
resultant lack of confidence in EDG’s credit, suppliers have refused to offer short-term credit terms to
EDG for purchases of diesel, insisting that supplies be paid in advance or on COD. Also, the lack of
spare parts and a shortage of skilled technicians have resulted in widespread operational problems.
Maintenance is inadequate and work is often substandard, although the quality is improving. A large part
of the problem stems from government policy which treats the power sector as a public service instead of
a commercial operation; for instance, EDG has been obliged to assume important service charges for
previous years. Meanwhile, government bureaucratic systems and rigorous controls are being applied to
EDG. The situation has yet to improve.
17. GOG is seeking to improve the supply of electricity through a mix of interventions that include
improving performance and financial recovery of the sector and at the same time increasing generation
capacity. It has initiated a number of steps to galvanize the deteriorating electricity sector. These include:
(i) changing the management team of EDG; (ii) supporting EDG in reducing staff strength (556 positions
terminated out of 2008); (iii) making significant progress in the dispute with the former private operator;
and (iv) adjusting tariffs (in FY04) since the last one in FY96.
18. Accounts Receivable. Collection performance of EDG is poor and worsening; collections are
only xx% of sales revenue. Accordingly, unpaid accounts are estimated to have increased by GNF xx
million (US$xx million) to GNF xx million (US$xx million), approximately xx months’ revenue. The
commercial shortcomings of EDG are reflected in the low rates of customer billing of only 41% of
electricity generated, of which only 76% is collected. In addition, EDG also has difficulties in collecting
unpaid government bills, with current back payments of GNF 24.8 billion. Government agencies are the
primary debtors, followed by the Municipality, and then residential consumers. EDG faces significant
liquidity problems on account of weak collections. Such position of trade receivables, even after
reconstituting EDG’s balance sheet and implementing tariff adjustments, is cause for serious concern,
arguably since there is no point in raising revenues that could not be collected..
21. The issue of EDG’s collection performance was discussed with GOG and is being addressed in
the context of Guinea’s Financial Sector Trajectory Plan. Agreement would be reached at negotiations
that GOG will take all measures necessary to assist EDG to (i) implement the Plan as it relates to
collection of accounts receivable; (ii) collect these outstanding receivables; and (iii) reduce the level of
receivables to no more than three months of sales revenue by December 31, 2007; and to 2.5 months of
sales revenue by December 31, 2009. Also, an agreement would be reached for GOG and EDG to
implement an Accounts Receivable Management Action Plan, satisfactory to the Bank, to assist EDG in
collecting and reducing accounts receivable and achieve the monitoring targets in the Financial Sector
Trajectory Plan
C. Financial Prospects of EDG
23. Financial Forecasts and Performance Covenants . Improvements in EDG’s financial
performance would require the following: (i) the capacity to meet demand for increased quantities of
electrical energy; (ii) improved generating and distribution efficiencies; (iii) cost-reflective tariffs to be
adjusted on a regular basis; and (iv) better collection performance. The proposed Project will provide
EDG with the necessary generating capacity, reduce EDG’s electrical losses, implement reasonable tariffs
and improve collection through the implementation of a modern billing and collection system.
24. A Minimum Cash Requirement covenant (revenues to cover no less than the sum of cash
operating expenses and other cash requirements) and a Debt Servicing Covenant should be the driving
forces of EDG’s financial management measures. Ageement would be reached that EDG would achieve
annually: (a) minimum cash requirement; and (b) debt service coverage ratio of 1.5x. Accordingly,
starting in FY07, EDG should charge tariffs at least sufficient to produce revenues that would cover cash
operating expenses, debt service requirements, net increases in working capital, major repair expenditure

74
and government taxes. With a view to maintaining an adequate financial performance, agreement would
be recorded at negotiations that GOG will support EDG in taking all necessary measures necessary
(including tariff increases) to achieve these financial targets. The template below presents a menu of
selected operating and financial performance indicators that the project team will track over time to assess
EDG’s performance on its path to operational efficiency and financial sustainability.
Operational and Financial Performance Indicators
Actual Actual Provisional
Operating Statistics 2003 2004 2005 2006 2007 2008 2009 2010
Energy sent out (GWh)
Energy billed (GWh)
% growth in sales
% energy billed
T&D losses
Cash collection rate
Average electricity tariff
GNF/kWh
USc/kWh
Number of customers
Financial Statistics
Operating ratio (operating expense/operating revenue)
Working ratio (cash operating expenses/operating revenue)
Return on fixed assets (operating income/average net fixed assets)
Return on equity (net income/average equity)
Self-financing ratio (funds from internal sources/average 3 year capex)
Days receivable
Current ratio (current assets/current liabilities)
Debt/equity ratio (historical basis)
Debt service ratio (internal cash generation/debt service due)
Forecast
25. GOG has agreed to implement the Financial Sector Trajectory Plan to address the sector’s short
and medium- to long-term issues associated with rehabilitation, investment, institutions and reforms.
GOG is aware of the need to proceed in all areas, since it would not be productive to install new facilities
unless measures are taken to improve EDG’s financial and technical performance.
26. Assumptions. Revenue projections have been made based on the following: (i) the sales and
load forecast; (ii) new generation and distribution capacities as they become progressively available in
accordance with a capital investment program; (iii) the projected costs of supply and distribution; (iv) the
progressive reduction of non-paying customers of electricity; (v) reduced energy losses; (vi) the effect of
projected international inflation and exchange rates on investment and operating costs. A complete set of
assumptions used for these projections is given in Table xx, including commercial conditions for the on-
lending agreement between GOG and EDG. The main determinants of future costs will be fuel costs and
the investment program.
27. Sensitivity Tests. A stress test on the various probabilities of tariffs and fuel prices was
undertaken under several scenarios. The results of the sensitivity analysis are given in Table xx.

75
Annex 11
Incremental Cost Analysis
Introduction
Since 2004, GOG has particularly stressed the important role electricity plays for the economic
well-being of the country. GOG has initiated a number of steps to galvanize the deteriorating
electricity sector. By early 2005, the following measures had been taken: (i) change of
management team of the utility; (ii) support extended to the management team to reduce
significantly excess of staff (556 out of 2008); (iii) addressing the judicial dispute with former
private concessionaires; and (iv) implementation of the first tariff adjustment (77%) since 1997,
which took effect in September 2004.
Baseline Scenario
GOG seeks to improve efficiency of supply of electricity through a mix of interventions that
include improving performance, and financial health of the sector and at the same time increase
generation capacity. Though GOG is currently engaged in resolving outstanding issues related to
the earlier concession that withdrew in 2001, it is actively scoping renewed private sector
engagement in the sector. However, the GOG recognizes that the sector will have to be brought
to a reasonable level of operational and commercial efficiency to whet the private sector appetite.
GOG has thus indicated its strong commitment to facilitate and support the sector in achieving
an operational recovery in the medium term. While GOG’s capacity to sustain the sector cannot
be stretched further to absorb recurring and substantial financial losses, there is a significant
opportunity to improve the performance of the sector introducing efficient and modern
management practices that blend sound business processes with innovative technological
applications particularly in the operations of the utility to reduce system losses.
Besides EDG, there are mining companies that self-generate almost half of the electricity
demand in Guinea. Projections based on mining and aluminum sector growth indicate that peak
demand is expected to grow from 149 MW in 2003 to 1,098 MW in 2020. The following table
captures EDG’s business performance.
Annual generation 659 GWh
Energy lost due to technical and non-technical losses 391 GWh
Energy billed to consumption 268 GWh
Monetary value of power billed to customers GNF 63 billion
Amount collected against above billing GNF 48 billion
Monetary value of power lost GNF 92 billion
Amount lost annually including non-technical losses** GNF 107 billion
Specific Revenue Billed (SRC)* GNF 95 /KWh
Specific Revenue Collected (SRC)** GNF 73 /KWh
Result: Nearly 60% T&D losses and 80% Aggregate Technical and Commercial (ATC)
losses

76
* SRC=Revenue billed in GNF/KWH input;**SRC=Collections made in GNF/KWH input.
The foregoing analysis illustrates that electricity operations are not sustainable with such a high
level of aggregate commercial and technical losses. Hence, plans to add much needed generation
capacity19
should be preceded by immediate steps to improve the commercial and operational
performance of the sector. The high technical and non-technical losses imply that thermal
capacity is generated in excess of what would be needed in the absence of such losses, CO2
emissions induced by these losses are therefore high.
While GOG’s capacity to sustain the sector cannot be stretched further to absorb recurring and
substantial financial losses, there is a significant opportunity to improve the performance of the
sector introducing efficient management practices that blend sound business processes with
innovative technological applications particularly in the operations of EDG to reduce system
losses. EDG has committed to undertake a new approach to enhance the efficiency of its
distribution system through the Commercial Reorientation of the Electricity Sector Toolkit
(CREST).
GOG requested World Bank assistance for its ailing electricity sector as per its letter dated
January 11, 2005. In its letter, it highlighted the need to rapidly begin addressing the key issues
surrounding the crisis faced by the sector. In February 2005 an Energy Mission of the World
Bank discussed an emergency program with EDG and the relevant Ministries. Subsequently, a
CREST20
efficiency improvement program was adopted and implementation thereof begun by
EDG. It has led to improved energy efficiency, billing and customer services without additional
financing provided by the World Bank. EDG and GOG have thereby demonstrated their
earnestness in taking action in the sector. At this juncture, the implementation of this program
needs to be ramped up with critical investment support.
These attempts notwithstanding, EDG continues to face some key barriers in the implementation
of the CREST. These include:
Lack of technical capacity: While there is a basic level of capacity in EDG with respect to
design, implementation and O&M of distribution systems, a lack of technical capacity in the area
of new technological applications such as remote metering and HVDS, as well options such as
DSM to manage energy. There have been few and scattered efficiency efforts and the
DSM/energy efficiency capacity is low. Similarly, EDG has adequate skills in the area of basic
power plant operations, but lacks technical capacity related to optimization and efficient
operation of power plants.
Lack of regulatory and policy capacity to encourage energy efficiency: Currently Guinea does
not have a conducive policy and regulatory environment to encourage energy efficiency in utility
operations, especially with respect of electricity distribution and end-use.
High first cost of efficiency measures: Though they bring significant benefits, one of the barriers
to the adoption of energy efficiency measures in EDG is due to their high initial cost. There is
inadequate experience within Guinea to understand and evaluate the benefits of such measures.
19
Nexant study under WAPP 20
CREST stands for “Commercial Reorientation of Electricity Sector Toolkit” and is a customized action plan to
improve commercial and operational efficiencies of the Utility.

77
Lack of private sector involvement: The private sector interest in the area of energy efficiency
improvement is low, given the current conditions. Past energy efficienciy efforts (industrial
energy audits) were undertaken by GOG. Consequently, the capacity of local consultants and the
private enterprises in the area of energy efficiency is limited. ESCOs are virtually non-existent
today, but there is some level of interest in the private sector to undertake utility functions such
as metering and billing.
Lack of awareness to information: The level of information available on energy efficiency
concepts and applications in electricity distribution system is very limited. Exposure to
international best practices in the area is also limited. In the past, the MEH has conducted
energy audits among a few large consumers of electricity but an energy audit program has not
been instituted. There is also little information available regarding whether or how the audit
recommendations were implemented.
GEF Alternative
The proposed Project seeks to assist the sector in investments that are required for
implementation of the efficiency improvement program identified by EDG as a necessary short
and medium term intervention to achieve sustainable private participation in future. The main
objective of the GEF project is to reduce carbon dioxide (CO2) emissions by improving energy
efficiency through a comprehensive approach that addresses efficiency in power generation,
reduced losses in the distribution system as well as DSM/efficiency programs designed for end-
use customers. The measures implemented will result in a reduction of approximately 216,750
tonnes of CO2 reductions over the 10-year life of the investments. Based on total GEF funding
of $4.5 million, this translates into $20.8 per ton of carbon. Including the CO2 emission
reduction from improved plant load factor at the Garifiri hydro plant (Component 2) which is not
being funded by GEF, the total CO2 emission reduction for the 10 year period equals 752,200
tonnes, which translates into a cost of $6.0 per ton of carbon.
One of the key interventions of the alternative scenario is the HVDS. The conventional Low
Voltage Distribution System (LVDS) employs large transformers (typically 500 KVA) to carry
power at the 400 V level and serve roughly 400 consumers. This configuration results in high
losses due to the higher current being carried on the line and is also often characterized by poor
voltage profile at the tail-end of the line due to losses and electricity theft. This technological
configuration is widely used but is proven to be inefficient. The alternative (HVDS) brings in a
new mindset that utilizes a different technological configuration and associated materials and
equipment. A new planning and technical design process is followed resulting in a technical
configuration where technical losses are reduced substantially due to the lower current carried on
the line. In this case, the power is distributed at the 11 kV level and small-sized high-efficiency
transformers are utilized for transformation close to the consumption point. The HVDS therefore
institutes new mindset, new planning and technical design skills and brings new higher
efficiency oriented material and technology choices. While all technology and material choices
are aligned to achieving EE objectives, in particular, this utility efficiency program will
introduce high efficiency transformers in the Guinea market and begin the market development
process. The technical comparison between the conventional and the alternative efficient
distribution transformer is presented in the table below:

78
Baseline Distribution transformer Alternative high efficiency transformer
Conventional Core Amorphous core
Aluminum wound Copper wound
Oil based Dry
External switchgear Self-protecting
4.5 % transformation losses 1.5 % transformation losses
Tail –end voltage achieved = 180 V Tail-end voltage = 210-220 V
350 Amp line current 31 Amp line current
HVDS forms part of the broader CREST program which addresses distribution efficiency
measures in a comprehensive manner. The short term efficiency improvement strategy, referred
to as the Commercial Reorientation of the Electricity Sector Toolkit (CREST), comprises a set of
best practice interventions and is being designed for EDG, Guinea, with active support from the
World Bank’s team. This approach seeks to improve the performance and efficiency in the
transition phase by providing support for private participation through value creation in the
electricity business. The key components of CREST, which has been designed to operate in
tandem with the Government’s longer term generation expansion and privatization programs,
are:
• Innovative deployment of technology and improving quality of supply (normative
voltage and reduced outage times),
• Reengineering the core business processes with a customer focus,
• Focusing on the retail MBC functions for increased revenues and loss reduction,
• Stemming financial losses of EDG
The Project will support investments that aim at improving (i) distribution efficiency for reliable
supply to be measured by better voltage and reduced outage times; (ii) commercial character of
the business as measured by enhanced billing and increased revenues; (iii) customer interface
measured by time required to respond to complaints, customer services, etc.; (iv) power plant
efficiency to demonstrate the viability of rehabilitation through interventions at two sites and (v)
the capacity of the EDG and MEH in designing and implementing DSM and energy efficiency
programs.
The CREST itself would involve the following interventions:
Improved reliability and quality of supply for customers, firstly through High Voltage
Distribution Systems (HVDS), involving investments in small capacity transformers, HT
and aerial bunched cable, insulators, poles and other accessories, and secondly by
reactive power compensation by installation of online capacitors..
Mechanisms to facilitate efficient metering would include enhancing the coverage and
quality of metering for HT and LT customers involving HT trivector meters, LT trivector
meters (CT operated) for LV commercial loads above 20 KW, single-phase and three-
phase (whole current) meters for other LV loads apart from other metering equipment.
Modern metering options such as Automatic Meter Reading, prepaid metering, spot
billing with hand-held terminals and others will be suitably deployed. These arrangement
will also facilitate Demand Side Mangement initiatives for the EDG. Metering of

79
Maximum Demand consumer premises and that of non-Maximum Demand consumer
premises, through use of modems and other accessories for remote reading would be
introduced where required.
Better cash flow management by introduction of spot billing which involves hand-held
terminals, printers, modems and associated accessories. In addition, collections would be
improved through opening up alternate avenues for customers to pay their bills.
Addressing customer concerns through set up of customer care centers, and improved
attention to customer concerns through launch of rapid response program involving
appropriate vehicles with GIS, GPS facilities and equipment, fault repair kits, wireless
sets and any other required accessories.
These interventions are designed to strengthen distribution infrastructure, improve energy
efficiency and quality of supply, and increase cash generation. The main operational impact of
investments would be in the areas of quality of supply, pilferage of electricity, customer service,
and improving distribution business processes.
(a) Quality of supply: Voltage profiles are generally poor, with consumers receiving
180 volts or even lower instead of the standard 220V supply. At such low
voltages, household consumers risk ruining appliances if used- often times these
cannot be used at all. Business applications for industrial and commercial
customers are similarly affected. The CREST initiative will address the voltage
problem through reconfiguration of distribution lines to a High Voltage
Distribution System (HVDS). Under the current system, large capacity
transformers are the norm, serving numerous of customers from one
transformation point. Typically a 500 KVA capacity transformer would supply
around 400customers. This configuration requires electricity at low voltages
(LV) of around 400 volts to be transported over long distances. Because of long
line lengths, customers at the far end of the line experience low voltages.
Furthermore, such long lines sag, and are therefore prone to frequent breakdowns
and easy theft, besides being unsafe. The HVDS remedies these shortcomings by:
Replacing each such large transformer by several smaller capacity transformers to
step-down from 11kV to 220 V at several points along a supply line instead of at
one terminal point. As a result, transformation occurs closer to the consumption
point, i.e. fewer consumers are served per transformer, thereby limiting voltage
drops and dramatically improving the supply profile. In pilot HVDS projects
implemented under CREST, actual measurements of consumer-end voltages show
vast improvement – from 160 volts in some cases to the desired level of 220 volts.
The higher voltage lines also deter theft, while also dramatically reducing
technical losses by reducing the amount of current output in the system21
.
Technical loss reduction results in higher energy efficiency and in lowering of
21
These losses are calculated as the square of the current multiplied by the resistance. Hence with a 500 KVA
transformer, the output current is 350 amperes resulting in losses of 350x350x resistance value of the wires.
Alternatively with a 25 KVA transformer the output current is 31 amperes. In this case the losses will be 31x31x
resistance value of the wires. Hence this system will lead to a dramatic reduction in technical losses.

80
carbon emissions that can be monetized into revenues through sale of carbon
credits.
(b) Pilferage of electricity.
A long LV line invites theft as it is relatively simple to tap into. On the other
hand, HV lines are placed higher from the ground, and are practically impossible
to tap into. Furthermore, a HVDS configuration employs insulated aerial-
bunched cables to connect the transformer to distribution points, which eliminates
all possibility of theft.
Remote reading of industrial and high revenue yielding customer premises also reduces
pilferage of electricity significantly, while facilitating monitoring the quality of supply to
such customers who are critical to the business.
(c) Improving Customer service and distribution business processes. Poor customer
service is one of the major complaints against EDG. The most frequent ones
relate to wrong billing, undelivered or late delivery of bills, improper accounting
of paid bills and apathy to consumers reporting faults or interruptions in supply.
Also, weak business processes result in inefficiencies apart from customer
dissatisfaction. The CREST interventions that address these issues include:
Introduction of customer friendly billing systems such as spot billing, using hand
held electronic machines. In this method, bills are printed and delivered on the
spot at the customers’ premises when their meters are read, and EDG’s customer
database is updated electronically. Customers have the additional advantage of
staggered payment due dates thus reducing crowding at cash collection centers on
or near the due date. Apart from improving customer service, this intervention
compresses the cash flow cycle, introduces electronic data recording facilitating
diligence on this critical revenue generating part of the business.
Expansion of the marketing, bill distribution and bill collection network by
outsourcing these activities. Some mechanisms would be internet based interface
mechanisms for bill verification and payment, open-access bill information and
payment facilities such as through banks, retail outlets and mobile phone service
providers.
Segregation of technical and commercial functions to improve efficiencies in the
business and creating exclusive machinery for customer interface, such as
establishment of multi-level grievance redress systems, email complaint facility
and toll-free complaint lines.
In order to address customer interface issues and complaints rapidly and
effectively, CREST will facilitate establishment of “networked” customer service
centers with trained staff. These networked customer service centers would also
facilitate data mining and tracking the revenue streams more efficiently
81
Assets and facilities management would be strengthened through standard
software and infrastructure provision as necessary. This would help reduce the O
& M and other costs in the business
Performance monitoring mechanisms that draw upon the HR database would be
introduced.
Critical Data base and data mining initiatives (for billing and other business
processes) including GIS/GPS techniques
To promote end-use and distribution system efficiency, a DSM/EE cell will be created under the
project to coordinate activities and build design and implementation capacity. The cell will
undertake energy efficiency audits starting with key industrial and commercial customers and
guide them in the implementation of energy efficiency measures. The cell will serve as a
repository of energy efficiency related knowledge and skills within EDG.
Component 1: Distribution Efficiency Improvement
This component aims at improving the commercial and operational efficiency of the distribution
network in order to
Reduce system losses, both technical and commercial, to improve operations;
Improve revenue billing and collections
Improve cash flows through reengineered business processes;
Improve customer satisfaction through improved utility interface and better outage
management;
Contribute to reduction of green house gas emissions on account of reduced technical
losses in the distribution network leading to avoiding generation required/load served
thereby reducing consumption of HFO used for thermal generation
Investments will be made in goods and services related to implementation of the following
initiatives:
Improved reliability of supply for customers through reduction of losses by investment in
High Voltage Distribution Systems (HVDS).
Enhancing the coverage and quality of metering for HT and LT customers. Better
revenue collection by metering for MD consumer premises and metering non-MD
consumer premises
Improved quality of supply for customers through reactive power compensation by
installation of online capacitors. .
Addressing customer concerns through set up of customer care centers.
Better cash flow management and the MBC22
process by introduction of spot billing.
Improved attention to customer concerns through launch of rapid response outage
management program.
22
MBC: Metering, Billing and Collection

82
These investments will strengthen the distribution infrastructure, improve quality of
supply and customer satisfaction and facilitate realization of potential in the sector to be a net
cash generator instead of being the burden that it currently imposes on the economy. These
investments are targeted to improve quality and continuity of supply, curb pilferage of
electricity, and raise the standards of customer service.
Component 3: Institutional Strengthening and Technical Assistance
3.1 Energy effciency and conservation
As Guinea faces a severe power shortage in terms of unmet demand and protracted load
shedding, it needs to implement energy efficiency and demand side measures urgently.
The EDG system is small with an installed capacity of 143 MW, but there is an almost
equivalent (known) captive generation at about 120 MW. These enterprises and households are
incurring high energy expenditures due to the use of small, inefficient generators. The DSM
program will be targeted at these enterprises and individuals to offer them options to reduce their
energy consumption. The current project will build on earlier efforts by the Ministry of Energy to
initiate an energy audit program for the commercial and industrial sector.
EDG itself has an interest in controlling the consumption of commercial and industrial sector
enterprises in the interest of developing its customer base. With the current high level of
consumption of these enterprises, it is difficult for the EDG to accommodate them, but it would
be possible to do so once the energy consumption comes down. For the EDG, a broader
customer base has wide ranging positive impacts such as improved revenues, lower revenue risks
and better system stability.
In the case of the EDG’s own customers, close link of the DSM initiatives with EDG business
objectives such as the system peak shaving benefits and distribution loss reduction rationale are
the key drivers of this effort. Even EDG’s most valuable industrial and commercial customers
are causing higher system losses due to poor power factors in their facilities and by stretching
EDG’s peak demand.
In order to launch the above discussed efficiency/DSM program, DSM capacity will be created
within the EDG and within the Minstry of Energy and Hydraulics to build expertise in the
following areas
1) Initiate an audit program through EDG/MoE focused on industrial and commercial
customers. Provide technical assistance to the customers in the implementation of
corrective measures following an energy audit of industrial and commercial
establishments, buildings and other facilities where significant energy consumption
occurs and dovetail these efforts with prudent load management- the targeted peak
reduction will be in the order of 12.15 MW and initial implementation of pilot projects
will be undertaken in the areas of efficient lighting for public and private buildings as
well as efficient motors in industries.;
2) To develop appropriate incentives for energy efficiency through tariffs and other
mechanisms
3) Provide training to ESCos to build private sector capacity in design and implementation
of these programs

83
4) To provide support to the Ministry of Energy to develop a policy framework for
implementation of activities leading to energy efficiency and conservation
5) Implement a communication strategy for generating awareness for energy conservation
The project recognizes the need to sustain and scale up the efficiency gains that will occur in the
sector through these investments by promoting demand side management (DSM) measures.
Accordingly it would assist in the development of an appropriate framework and institutional
capacity for energy efficiency and conservation programs and develop viable strategies for
participation of ESCOs to undertake this work. In view of the limited resource envelope under
this project, other energy efficiency initiatives detailed above cannot be followed up in this
project and would be taken up in future Bank projects. It is however, expected that due to the
catalytic role played by this component, the EDG, the Ministry, other sector stakeholders
including the private sector would carry this important activity forward.
3.2 Private sector partnerships: The project would assist identification and development of
areas where the private sector can intervene with the aim of improving the electricity sector's
financial viability.23
These could include outsourcing of various distribution functions and
Energy Service Companies (ESCOs) among other approaches. This component would essentially
deliver a report detailing possible strategies for private sector participation. The Bank’s energy
team has identified two possible public private partnerships in this context. The first concept of
Distribution Function Outsourcing involves the private sector in implementation of the project
components. The second concept of Distribution Business Outsourcing, was explored and it was
felt that a detailed study needs to conducted before assessing its viability and private sector
appetite for it. The report to be delivered under this component would examine this issue apart
from exploring the viability of other approaches of private participation in the sector.
3.3 Financial and accounting systems: It is essential that the EDG ring fences the generation
transmission and distribution businesses and in turn identifies the real costs for each of those
functions. This would facilitate improvement of operational efficiencies through a profit center
approach on one hand and efficient tariff setting on the other leading to commercial efficiencies.
The project would assist in capacity building and provision of appropriate infrastructure for
development of financial and accounting systems towards achieving this objective.
3.4 MIS and operational IT support: The project would support initiatives leading to capacity
building and infrastructure support (in various areas such as anti theft measures, energy audit and
remote metering techniques), MIS systems, customer billing and HR data bases etc.
GEF funding is sought for overcoming the market barriers to implementation of efficient
distribution technologies and practices. Attached is a incremental cost matrix which
demonstrates the specific areas where there is a justification for GEF support over and above the
developmental baselines efforts underway as part of the CREST program.
Incremental Cost Matrix Benefits Baseline Alternative Increment
23
This could imply, for example, the outsourcing of an area to the private sector for supply and billing of electricity.
84
Local benefits
(1) Distribution
Efficiency improvement:
(a) T &D System
Improvements:
Undertake re-
conductoring and
rehabilitation of the
network and reconfigure
the network to take
transformation points
close to the load center
Re-conductoring and
rehabilitation of the 110
KV and 20 KV network as
well as implementation of
HVDS in selected areas.
Also, design and
implement reactive power
compensation plan to
reduce losses further.
Implementation of the
HVDS System to reduce
losses in the distribution
system. Preparation and
implementation of training
modules for HVDS
replication throughout the
country. Capacity
building and training on
reactive power
compensation options in
distribution systems.
(3) DSM and Energy
conservation: No current
program at EDG
Creation of an appropriate
framework and
institutional capacity in
the area of DSM and
energy conservation
within EDG
Development of DSM
groups at the Ministry of
Energy and within EDG to
serve as the institutional
focal point for DSM and
Energy conservation
work. Develop and
implement DSM programs
for industrial and
commercial sectors
Global Benefits
Distribution system is
improved, but relies
largely on conventional
loss reduction
approaches.
T&D system
improvements based on
innovative technical and
institutional approaches
results in offset of
additional GHG
emissions.
216,750 tonnes of C02
emission reduction over
the life of the investments
(from distribution
efficiency enhancements
and DSM activities). Total
global benefits of 752,200
tonnes of CO2 emission
reduction including the
benefits from increase
plant load factor at the
Garifiri hydropower plant.

85
Cost by
Component (US$
million)
1. Distribution
Efficiency
Enhancement
3.DSM and
Energy Efficiency
Total
5.1
2.0
7.1
7.3
4.3
11.6
2.2
2.3
4.5
86
Annex 11
STAP PROJECT REVIEWS
UNIVERSITY OF CALIFORNIA, BERKELEY
BERKELEY DAVIS IRVINE LOS ANGELES RIVERSIDE SAN DIEGO SAN FRANCISCO• • • • • • SANTA BARBARA SANTA CRUZ•
ENERGY AND RESOURCES GROUP DANIEL M. KAMMEN
310 BARROWS HALL CLASS OF 1935 DISTINGUISHED CHAIR IN ENERGY
UNIVERSITY OF CALIFORNIA PROFESSOR IN THE ENERGY AND RESOURCES GROUP
BERKELEY, CA 94720-3050 PROFESSOR OF PUBLIC POLICY
WWW: http://socrates.berkeley.edu/~rael PROFESSOR OF NUCLEAR ENGINEERING
TEL (510) 642-1139 DIRECTOR
FAX (510) 642-1085 RENEWABLE AND APPROPRIATE ENERGY LAB (RAEL)
CO-DIRECTOR, BERKELEY INSTITUTE OF THE ENVIRONMENT EMAIL: [email protected]
March 3, 2006
Ph: 202-458-1211
Ph: 202-522-2130
Re: ELECTRICITY SECTOR EFFICIENCY IMPROVEMENT PROJECT
Overall Assessment and Major Comments:
This project addresses the most basic, and hence most difficult aspects of
revitalizing the electric power sector in a poor nation with a marginal local
physical and human resources infrastructure on which to build. This project
offers a serious dilemma of need versus the capacity to make implementation a
reality.
Not without significant concerns, I recommend that this project be approved and
implemented.
On one hand, the opportunities are tremendous, with major generation,
transmission and distribution and then immense payment problems at the end of
the supply chain. The detail provided in this project plan, for work at all stages of
the supply plants, the distribution network, and opportunities for efficiency in the
end-use as well as financial management innovations. The project team is to be
commended for these excellent plans, many of which make perfect sense in this
context, and should be supported. The savings from refurbishing the Tombo
Thermal generation plant alone would appear to be worth the investment, a would
the imposition of a far more rigorous billing and collection scheme (where

87
incredible losses to the system take place). Further, the project involved a very
reasonable GEF component, and (Appendix 11) even pencils out at a reasonable
cost per ton of avoided carbon ($12.8/tC) (which is quite impressive given the
amount of to concrete results, even though the effort is essential to good
performance). On all these initiatives the project team has done an excellent job
and are the basis for a recommendation that the project be supported.
Counterbalancing that opportunity, however, are the severe constraints under
which this project must operate. Each of the key aspects of the project, in fact, is
rated by the design team as entailing significant risks. The PCD notes that (page
28), that:
The abrupt end of the previous concession and the negative signals it has sent to the investor community poses a risk to the project objectives.
The issues fundamental to this project that are ranked as coming with a
‘significant’ risk include: (i) Government commitment to re-invigorate the power
sector with a long-term vision for reforming the sector; (ii) the limited
institutional capacity to expand beyond the pilot phase, and to absorb larger
investments and reform; the (iii) difficulties in mitigating rent-seeking prevalence
in metering, billing and collection processes; and finally (iv) the problems of
reflecting and imposing realistic/real costs. In light of their central relationship to
the project plans, it is difficult to envision a more severe set of challenged and
major risks
In fact, a major concern of the overall project plan is the seeming contradiction –
which is reflected throughout the project plan – is that a major risk identified in
the project is (i), and yet the justification for conducting the project is the
statement that:
The government’s renewed commitment to the sector as evidenced by the change in management and staff reductions at EDG, and the tariff adjustment as well as its commitment to resolving all outstanding issues related to the earlier concession should send strong positive signals to the market and entice future private sector participation.
The conflict inherent in these two views is not resolved and must be in order to
move forward.
Beyond that, the history of past projects (Appendix 2, page 37ff) is even worse:
Sector Issue Project/Financier Ratings (Bank financed projects only)
Completed projects OED Ratings
Outcome Sustainability ID Impact
Second Energy Project World Bank (closed in
1998) Unsatisfactory Unlikely NA

88
First Power Project World Bank (closed in
1986) Did not achieve main objectives
Second Engineering and TA
Project
World Bank (closed in
1990) Did not achieve main objectives
Ongoing
Decentralized rural
electrification project
The World Bank
(Approved July, 2002)
(Color emphasis added).
Under normal circumstances this could and should be enough to veto this project.
However, at what point does one fund a project anyway because it is so critically
needed? In my assessment, the value of doing this despite these problems
warrants that the project be supported. However, the PCD does not do a sufficient
job of proving evidence of that needed the local willingness (not the capacity,
which is a subject of the project itself). Some evidence of improvement in local
commitment does exist, such a the report that, ‘implementation of some of the
CREST efficiency measures has led to early improvements in billing and
customer services without additional investments. Collection levels in Kaloum
area have gone up from 70% to 93%.’ (page 16). The linkage here does need
discussion. Have improved energy services, i.e. lower usage rates through
efficiency led to better performance and thus either increased willingness to pay,
or simply has a new attention to revenue collection resulted in this change?
Second, are the reasons that the collection rate increased transferable, or are they
specific to the Kaloum locale (i.e. where is the analysis of the potential to expand
on the Kaloum experience as suggested on page 27 (Replicability))? Were the
collection rates accomplished through coercive activities (as has been the case in
some other nations), or, ideally where they the result of perceived improved
service or simply additional staffing? With 41% billing and 76% payment rates
(Annex 11, page 60) the opportunity to change financial status through aggressive
collection efforts is significant, particularly with this being one of the most visible
means of improvement available to donor and other observers.
A number of questions were listed above, and are intended to more fully explain
the local changes. The reason that this is so vital is that very little concrete
evidenced exists as to how and why a new culture of commitment to utility
performance exists. If this can be more fully demonstrated – perhaps best
accomplished through an Electricité de Guinée report to the GEF – then the
overall assurance that a series of important new measures have been instituted.
The energy efficiency and conservation section of this report is excellent. If the
reporting capacity existed – which is unclear – it would be ideal to move to a
further stage of savings reporting where utility bills listed the difference between
energy use in the current (billing) period and past periods to demonstrate the
monetary value of savings. These programs have been very successful in both
developed and developing nations at reducing load, but they require extensive
data records and reporting. Perhaps the best known such program in the U. S.
state of California is the ‘20/20 program’, where 20% reductions in energy use

89
compared to the similar month the year before result in a further 20% savings to
the end-user:
http://www.consumerenergycenter.org/rebate/index.html
Programs such as this, when combined with efforts focused on efficient devices,
have successfully made the connection between energy efficiency and household
savings.
Minor Comments:
Page 14: Wording, “However, transmission investments too beg reasonable
distribution performance to be sustainable.” Replace ‘beg’ with ‘require’?
Appendix D: Appraisal Summary (p. 29ff). Analysis is provided based on 12 and
16% EIRR and FIRR, which appear to simply have been derived from the 16%
default rate (page 58). If so, what evidence exists that is the likely actual default
rate, and not just that set, and assumed, by the World Bank project guidelines as
the risk level for project of this type, and presumably in countries with utilities in
a certain performance bracket?

90
Annex C (ii) Team Response to STAP Review Comments
STAP reviewer comments Team responses
1. The conflict inherent in the
following two views needs to
be resolved in order to move
forward.
The abrupt end of the
previous concession and the
negative signals it has sent to
the investor community poses
a risk to the project
objectives.
The government’s renewed
commitment to the sector as
evidenced by the change in
management and staff
reductions at EDG, and the
tariff adjustment as well as its
commitment to resolving all
outstanding issues related to
the earlier concession should
send strong positive signals to
the market and entice future
private sector participation.
As articulated in the draft Project
Appraisal Document, the aborted
private concession arrangement (in
2001) gave negative signals to the
investor community and has
understandably triggered high risk
perceptions for the private sector.
Therefore any efforts to improve the
sector and its investment climate need
to address this. The Government has
sought to mitigate these perceptions
(in 2005) by several steps as
described in the draft PAD. These
proactive measures initiated by the
Government are meant to reassure all
the stakeholders and to move the
sector forward in terms of efficiency,
and required investments. In the
team’s view, if these measures have
not been taken, the adverse impact of
earlier events would have continued
to affect the sector. Hence, with the
Government taking this initiative,
possible conflicts and inconsistencies
on account of this issue are
substantially reduced. Moreover, the
steps initiated by EDG confirm this
conclusion as described in responses
to other comments
2.
2(a)
However, the PCD does not do a sufficient
job of proving evidence of that needed the
local willingness (not the capacity, which is
a subject of the project itself) surrounding
the following issues:
Have improved energy services, i.e. lower
usage rates through efficiency led to better
performance and thus either increased
willingness to pay, or simply has a new
attention to revenue collection resulted in
this change?
The basic thrust of the pilot project is
to improve efficiencies through focus
on business processes and utility
commercial performance
improvements which have led to the
encouraging results. Loss reduction
and end use efficiency programs are
sought to be introduced through the
proposed project.
However, increased revenue
realization can also be attributed to a
rise in willing ness to pay due to
effective stakeholder communication
in the Kaloum pilot.
2(b) Second, are the reasons that the collection
rate increased transferable, or are they
The potential for repilcability is borne
out by the following :

91
specific to the Kaloum locale (i.e. where is
the analysis of the potential to expand on the
Kaloum experience as suggested on page 27
(Replicability))?
1.Though the pilot project focused on
specific initiatives in Kaloum, system
wide initiatives were taken up for
utility performance improvements in
EDG also. The improvements in
performance in Kaloum (Coanakry’s
downtown area) are matched by
improvements in Conakry and in
EDG wide results; though not on the
same scale.
2. The system losses and low
collection efficiency in Kaloum
characterize the entire network, and
as pointed out in the STAP review,
provide a significant opportunity for
capturing efficiency gains and service
delivery improvements and
the basis for replicating these
interventions elsewhere in the system.
2(c) Were the collection rates accomplished
through coercive activities (as has been the
case in some other nations), or, ideally where
they the result of perceived improved service
or simply additional staffing?
As already described, the
improvement in collections were
achieved through business process
improvements and effective
stakeholder communication. There
was no increase in staff deployed for
this purpose, and use of coercive
methods was not reported.
3. Page 14: Wording, “However,
transmission investments too
beg reasonable distribution
performance to be
sustainable.” Replace ‘beg’
with ‘require’?
We agree.
4. Appendix D: Appraisal
Summary (p. 29ff). Analysis
is provided based on 12 and
16% EIRR and FIRR, which
appear to simply have been
derived from the 16% default
rate (page 58). If so, what
evidence exists that is the
likely actual default rate, and
not just that set, and assumed,
by the World Bank project
guidelines as the risk level for
project of this type, and
presumably in countries with
The financial analysis takes into
account the results of sensitivity
analysis conducted for this purpose.
Hence a range of results for NPV
have been simulated for different
discount rate scenarios. This range
covers the spectrum of discount rates
that are applicable to utilities within
similar performance bracket in the
region.

92
utilities in a certain
performance bracket?

93
Annex 12
Guinea at a glance 8/25/05
Sub-
POVERTY and SOCIAL Saharan Low-
Guinea Africa income
2004
Population, mid-year (millions) 8.1 719 2,338
GNI per capita (Atlas method, US$) 460 600 510
GNI (Atlas method, US$ billions) 3.7 432 1,184
Average annual growth, 1998-04
Population (%) 2.2 2.2 1.8
Labor force (%) 2.1 1.0 2.1
Most recent estimate (latest year available, 1998-04)
Poverty (% of population below national poverty line) .. .. ..
Urban population (% of total population) 36 37 31
Life expectancy at birth (years) 46 46 58
Infant mortality (per 1,000 live births) 104 101 79
Child malnutrition (% of children under 5) 23 .. 44
Access to an improved water source (% of population) 51 58 75
Literacy (% of population age 15+) .. 65 61
Gross primary enrollment (% of school-age population) 81 95 94
Male 92 102 101
Female 71 88 88
KEY ECONOMIC RATIOS and LONG-TERM TRENDS
1984 1994 2003 2004
GDP (US$ billions) .. 3.4 3.6 3.5
Gross capital formation/GDP .. 15.6 9.9 10.5
Exports of goods and services/GDP .. 22.6 22.0 23.1
Gross domestic savings/GDP .. 12.3 7.4 8.6
Gross national savings/GDP .. 8.3 6.6 7.6
Current account balance/GDP .. -7.3 -3.3 -2.9
Interest payments/GDP .. 1.2 0.8 ..
Total debt/GDP .. 91.9 95.2 ..
Total debt service/exports .. 12.7 16.4 ..
Present value of debt/GDP .. .. 52.5 ..
Present value of debt/exports .. .. 238.1 ..
1984-94 1994-04 2003 2004 2004-08
(average annual growth)
GDP 3.7 3.8 1.2 2.6 4.8
GDP per capita 0.8 1.5 -0.9 0.5 2.8
Exports of goods and services 2.7 4.1 2.3 1.2 8.2
STRUCTURE of the ECONOMY
1984 1994 2003 2004
(% of GDP)
Agriculture .. 21.7 24.6 24.9
Industry .. 28.8 36.4 36.7
Manufacturing .. 4.2 4.0 4.0
Services .. 49.5 39.0 38.4
Household final consumption expenditure .. 80.9 85.2 85.8
General gov't final consumption expenditure .. 6.7 7.5 5.6
Imports of goods and services .. 25.9 24.6 25.0
1984-94 1994-04 2003 2004
(average annual growth)
Agriculture 3.6 4.5 2.9 4.1
Industry 2.6 4.7 0.4 2.9
Manufacturing 4.4 4.4 -4.0 2.0
Services 3.4 2.9 1.5 1.6
Household final consumption expenditure 4.1 3.7 4.0 3.9
General gov't final consumption expenditure -1.4 4.3 8.8 -0.5
Gross capital formation 2.2 2.1 -21.9 -5.1
Imports of goods and services 2.0 2.9 -3.0 0.0
Note: 2004 data are preliminary estimates.
This table was produced from the Development Economics LDB database.
* The diamonds show four key indicators in the country (in bold) compared with its income-group average. If data are missing, the diamond will
be incomplete.
-30
-15
0
15
99 00 01 02 03 04
GCF GDP
Growth of capital and GDP (%)
-5
0
5
10
15
99 00 01 02 03 04
Exports Imports
Growth of exports and imports (%)
Guinea
Low-income group
Development diamond*
Life expectancy
Access to improved water source
GNI
per
capita
Gross
primary
enrollment
Guinea
Low-income group
Economic ratios*
Trade
Indebtedness
Domestic
savings
Capital
formation
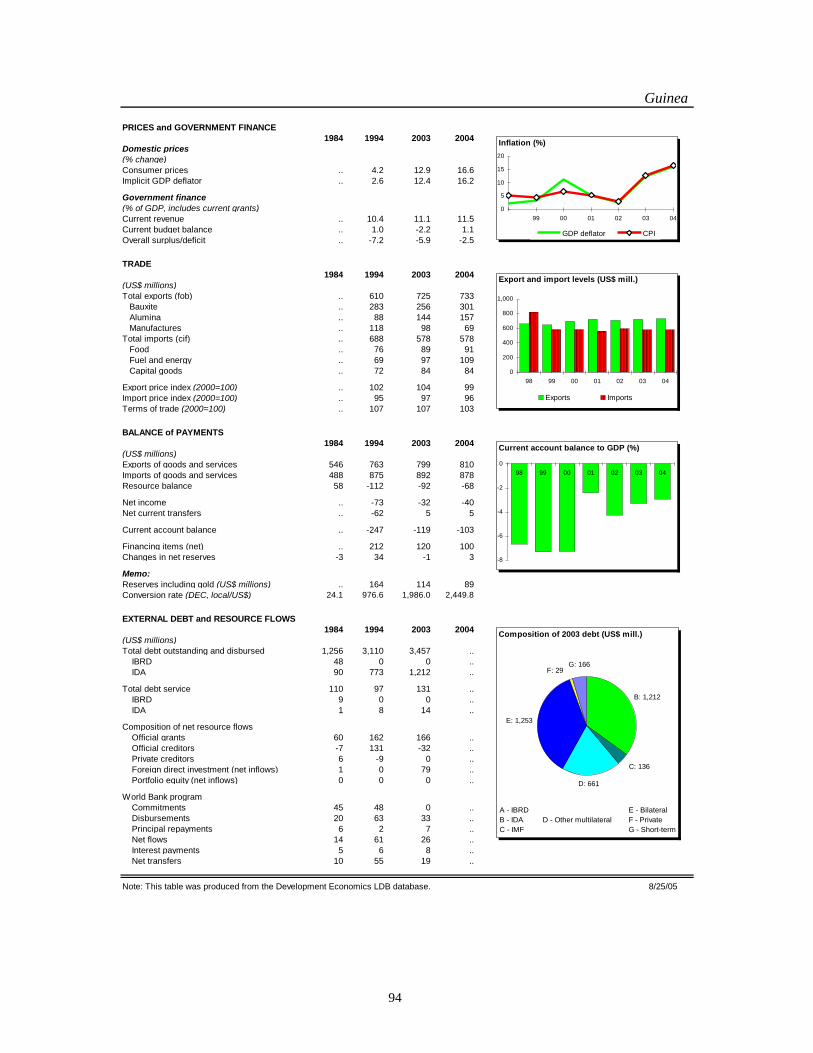
94
Guinea
PRICES and GOVERNMENT FINANCE
1984 1994 2003 2004
Domestic prices
(% change)
Consumer prices .. 4.2 12.9 16.6
Implicit GDP deflator .. 2.6 12.4 16.2
Government finance
(% of GDP, includes current grants)
Current revenue .. 10.4 11.1 11.5
Current budget balance .. 1.0 -2.2 1.1
Overall surplus/deficit .. -7.2 -5.9 -2.5
TRADE
1984 1994 2003 2004
(US$ millions)
Total exports (fob) .. 610 725 733
Bauxite .. 283 256 301
Alumina .. 88 144 157
Manufactures .. 118 98 69
Total imports (cif) .. 688 578 578
Food .. 76 89 91
Fuel and energy .. 69 97 109
Capital goods .. 72 84 84
Export price index (2000=100) .. 102 104 99
Import price index (2000=100) .. 95 97 96
Terms of trade (2000=100) .. 107 107 103
BALANCE of PAYMENTS
1984 1994 2003 2004
(US$ millions)
Exports of goods and services 546 763 799 810
Imports of goods and services 488 875 892 878
Resource balance 58 -112 -92 -68
Net income .. -73 -32 -40
Net current transfers .. -62 5 5
Current account balance .. -247 -119 -103
Financing items (net) .. 212 120 100
Changes in net reserves -3 34 -1 3
Memo:
Reserves including gold (US$ millions) .. 164 114 89
Conversion rate (DEC, local/US$) 24.1 976.6 1,986.0 2,449.8
EXTERNAL DEBT and RESOURCE FLOWS
1984 1994 2003 2004
(US$ millions)
Total debt outstanding and disbursed 1,256 3,110 3,457 ..
IBRD 48 0 0 ..
IDA 90 773 1,212 ..
Total debt service 110 97 131 ..
IBRD 9 0 0 ..
IDA 1 8 14 ..
Composition of net resource flows
Official grants 60 162 166 ..
Official creditors -7 131 -32 ..
Private creditors 6 -9 0 ..
Foreign direct investment (net inflows) 1 0 79 ..
Portfolio equity (net inflows) 0 0 0 ..
World Bank program
Commitments 45 48 0 ..
Disbursements 20 63 33 ..
Principal repayments 6 2 7 ..
Net flows 14 61 26 ..
Interest payments 5 6 8 ..
Net transfers 10 55 19 ..
Note: This table was produced from the Development Economics LDB database. 8/25/05
-8
-6
-4
-2
0
98 99 00 01 02 03 04
Current account balance to GDP (%)
0
200
400
600
800
1,000
98 99 00 01 02 03 04
Exports Imports
Export and import levels (US$ mill.)
0
5
10
15
20
99 00 01 02 03 04
GDP deflator CPI
Inflation (%)
G: 166
D: 661
C: 136
B: 1,212
F: 29
E: 1,253
A - IBRD
B - IDA
C - IMF
D - Other multilateral
E - Bilateral
F - Private
G - Short-term
Composition of 2003 debt (US$ mill.)