document of the world bank · document of the world bank. report no: icr00003180 . implementation...
TRANSCRIPT

Document of The World Bank
Report No: ICR00003180
IMPLEMENTATION COMPLETION AND RESULTS REPORT (IDA-42110)
ON A
CREDIT
IN THE AMOUNT OF SDR 82.2 MILLION (US$ 120 MILLION EQUIVALENT)
TO THE
REPUBLIC OF INDIA
FOR A
KARNATAKA PANCHAYATS STRENGTHENING PROJECT
September 29, 2014
Global Governance Practice South Asia Region
Pub
lic D
iscl
osur
e A
utho
rized
Pub
lic D
iscl
osur
e A
utho
rized
Pub
lic D
iscl
osur
e A
utho
rized
Pub
lic D
iscl
osur
e A
utho
rized
Pub
lic D
iscl
osur
e A
utho
rized
Pub
lic D
iscl
osur
e A
utho
rized
Pub
lic D
iscl
osur
e A
utho
rized
Pub
lic D
iscl
osur
e A
utho
rized

CURRENCY EQUIVALENTS
(Exchange Rate Effective September 29, 2014)
Currency Unit=Indian Rupee (INR) INR 1.00 = US$ 0.02 US$ 1.00 = INR 61.17
FISCAL YEAR
April 1 – March 31
ABBREVIATIONS AND ACRONYMS
ANM Auxiliary Nurse Midwifery ANSSIRD Abdul Nazeer Sab State Institute for Rural Development BG Block Grants BRGF Backward Region Grant Fund CA Chartered Accountant CAS Country Assistance Strategy CPS DAC
Country Partnership Strategy Decentralization Analysis Cell
DCB Demand Collection Balance EMF ESW
Environmental Management Framework Economic and Sector Work
GDP GOI
Gross Domestic Product Government of India
GOK Government of Karnataka GP Gram Panchayat GS Gram Sabhas ICR ICRR IDA
Implementation Completion Report Implementation Completion and Results Report International Development Association
IEC IEG
Information, Education Communication Independent Evaluation Group
ISR Implementation Support Report KGSP Karnataka Gram Swaraj Project KGSP II Karnataka Gram Swaraj Project II KPSP Karnataka Panchayat Strengthening Project KSAD Karnataka State Audit Department MDG Millennium Development Goals MGNREGS Mahatma Gandhi National Rural Employment Guarantee Scheme MTR Mid Term Review M & E NGO
Monitoring and Evaluation Non-Governmental Organization
NIC NREGA
National Informatics Centre National Rural Employment Guarantee Act
ii
OSR O&M
Own Source Revenue Operation and Maintenance
PAD Project Appraisal Document PDO Project Development Objective PMU Project Monitoring Unit PFT Project Facilitation Team RDPR RGPSA SATCOM
Rural Development and Panchayat Raj Department Rajiv Gandhi Panchayat Sashaktikaran Abhiyan Satellite Communications
SC/ST Scheduled Caste / Scheduled Tribe SDR SFAA SFC
Special Drawing Right State Public Financial Accountability & Assessment State Finance Commission
SHGs Self Help Groups SIRD State Institute of Rural Development TRC Taluk Resource Centres
Vice President: Philippe H Le Houerou, SARVP Country Director: Onno Ruhl, SACIN Practice Manager: Alexandre Arrobbio, GGODR
Project Team Leader: Farah Zahir, GGODR ICR Team Leader: Zahed H Khan, GURDR
ICR Primary Author Simon Carl O’Meally, GGODR
iii

INDIA KARNATAKA PANCHAYATS STRENGTHENING PROJECT
Implementation Completion and Results Report
B. Key Dates ..................................................................................................................... vi C. Ratings Summary ......................................................................................................... vi D. Sector and Theme Codes............................................................................................. vii E. Bank Staff .................................................................................................................... vii F. Results Framework Analysis ....................................................................................... vii G. Ratings of Project Performance in ISRs ....................................................................... x H. Restructuring (if any) ................................................................................................... xi I. Disbursement Profile ................................................................................................... xii 1. Project Context, Development Objectives and Design ............................................... 1
1.1 Context at Appraisal ............................................................................................ 1 1.2 Original Project Development Objectives (PDO) and Key Indicators (as
approved) ....................................................................................................................... 3 1.3 Revised PDO (as approved by original approving authority) and Key Indicators,
and reasons/justification ................................................................................................. 4 1.4 Main Beneficiaries ............................................................................................... 4 1.5 Original Components (as approved) .................................................................... 4 1.6 Revised Components ........................................................................................... 6 1.7 Other significant changes .................................................................................... 6
2. Key Factors Affecting Implementation and Outcomes .............................................. 6 2.1 Project Preparation, Design and Quality at Entry ................................................ 6 2.2 Implementation .................................................................................................... 8 2.3 Monitoring and Evaluation (M&E) Design, Implementation and Utilization ... 10 2.4 Safeguard and Fiduciary Compliance ................................................................ 10 2.5 Post-completion Operation/Next Phase ............................................................. 12
3. Assessment of Outcomes .......................................................................................... 12 3.1 Relevance of Objectives, Design and Implementation ...................................... 12 3.2 Achievement of Project Development Objectives ............................................. 14 3.3 Efficiency ........................................................................................................... 19 3.4 Justification of Overall Outcome Rating ........................................................... 20 3.5 Overarching Themes, Other Outcomes and Impacts ......................................... 20 3.6 Summary of Findings of Beneficiary Survey and/or Stakeholder Workshops . 20
4. Assessment of Risk to Development Outcome ......................................................... 21 5. Assessment of Bank and Borrower Performance ..................................................... 22
5.1 Bank Performance ............................................................................................. 22 5.2 Borrower Performance ...................................................................................... 23
6. Lessons Learned ........................................................................................................ 24 7. Comments on Issues Raised by Borrower/Implementing Agencies/Partners ........... 26 Annex 1. Project Costs and Financing ............................................................................. 27 Annex 2. Outputs by Component .................................................................................... 28 Annex 3. Economic and Financial Analysis .................................................................... 31 Annex 4. Bank Lending and Implementation Support/Supervision Processes................ 33 Annex 5. Beneficiary Survey Results .............................................................................. 35
iv

Annex 6. Stakeholder Workshop Report and Results ...................................................... 47 Annex 7. Summary of Borrower's ICR and/or Comments on Draft ICR ........................ 48 Annex 8. Comments of Co-financiers and Other Partners/Stakeholders ......................... 75 Annex 9. List of Supporting Documents referred to in the ICRR ................................... 76 MAP ................................................................................................................................. 77
v

A. Basic Information
Country: India Project Name: Karnataka Panchayats Strengthening Project
Project ID: P078832 L/C/TF Number(s): IDA-42110 ICR Date: 09/29/2014 ICR Type: Core ICR
Lending Instrument: SIL Borrower: GOVERNMENT OF INDIA
Original Total Commitment:
XDR 82.20M Disbursed Amount: XDR 82.20M
Revised Amount: XDR 82.20M Environmental Category: B Implementing Agencies: Rural Development and Panchayati Raj, Govt. of Karnataka Cofinanciers and Other External Partners: B. Key Dates
Process Date Process Original Date Revised / Actual Date(s)
Concept Review: 06/18/2003 Effectiveness: 10/04/2006 10/04/2006
Appraisal: 05/09/2005 Restructuring(s): 03/26/2012 12/10/2012 11/20/2013
Approval: 06/29/2006 Mid-term Review: 11/09/2009 Closing: 03/31/2012 03/30/2014 C. Ratings Summary C.1 Performance Rating by ICR Outcomes: Moderately Satisfactory Risk to Development Outcome: Substantial Bank Performance: Moderately Satisfactory Borrower Performance: Moderately Satisfactory
C.2 Detailed Ratings of Bank and Borrower Performance (by ICR) Bank Ratings Borrower Ratings
Quality at Entry: Moderately Unsatisfactory Government: Moderately Satisfactory
Quality of Supervision: Moderately Satisfactory Implementing Agency/Agencies: Moderately Satisfactory
Overall Bank Performance: Moderately Satisfactory Overall Borrower
Performance: Moderately Satisfactory
vi

C.3 Quality at Entry and Implementation Performance Indicators
Implementation Performance Indicators QAG Assessments
(if any) Rating
Potential Problem Project at any time (Yes/No):
Yes Quality at Entry (QEA):
None
Problem Project at any time (Yes/No):
Yes Quality of Supervision (QSA):
None
DO rating before Closing/Inactive status:
Moderately Satisfactory
D. Sector and Theme Codes
Original Actual Sector Code (as % of total Bank financing) Other social services 1 20 Sub-national government administration 99 80
Theme Code (as % of total Bank financing) Decentralization 24 24 Environmental policies and institutions 13 13 Participation and civic engagement 13 13 Rural policies and institutions 25 25 Rural services and infrastructure 25 25 E. Bank Staff
Positions At ICR At Approval Vice President: Philippe H. Le Houerou Praful C. Patel Country Director: Onno Ruhl Michael F. Carter Practice Manager/Manager:
Alexandre Arrobbio Constance A. Bernard
Project Team Leader: Farah Zahir Geeta Sethi ICR Team Leader: Zahed H. Khan ICR Primary Author: Simon Carl O'Meally F. Results Framework Analysis Project Development Objectives (from Project Appraisal Document) The development objective of the project is to improve the effectiveness of service delivery by Karnataka Gram Panchayats (village governments) particularly with respect
vii

to the management of public resources and the delivery of relevant services that the rural people prioritize. Revised Project Development Objectives (as approved by original approving authority) Not Applicable (a) PDO Indicator(s)
Indicator Baseline Value
Original Target Values (from
approval documents)
Formally Revised Target Values
Actual Value Achieved at
Completion or Target Years
Indicator 1 : Rising number of Gram or Ward Sabhas with high and representative participation and relevant agendas.
Value quantitative or Qualitative)
4,305 sabhas (not defined in PAD)
60% increase in the number of sabhas w.r.t baseline (taking 2006/07 actual value as baseline i.e 4,305 sabhas)
72% rise in sabhas at the time of project completion (no. of sabhas increased from 4,305 to 7,444 in 2012/13)
Date achieved 10/05/2006 10/25/2012 03/30/2014 Comments (incl. % achievement)
Target Achieved. However, 'high and representative' not clearly defined as explained in the ICRR text.
Indicator 2 : Rising satisfaction of village residents with service delivery by Gram panchayats Value quantitative or Qualitative)
N.A. 60% 55% (against the 2009 baseline of 48%)
Date achieved 10/05/2006 10/25/2012 03/30/2014 Comments (incl. % achievement)
Target nearly achieved. However, full project progress was not measurable given that no baseline was established prior to the project implementation in 2006.
Indicator 3 : Gradual increase in own-source revenue (OSR) and stronger financial health of village governments
Value quantitative or Qualitative)
US $ 6 million US $ 16 million
Us $ 14 million (using exchange rate at the time of appraisal)
Date achieved 10/05/2006 10/25/2012 03/30/2014
Comments (incl. % achievement)
Target substantially achieved. The annual average growth in OSR was 11.4% during the project period. Although an increase of 266% was targeted against the baseline, the project made significant progress and achieved an increase of 233% in OSR.
viii

(b) Intermediate Outcome Indicator(s)
Indicator Baseline Value
Original Target Values (from
approval documents)
Formally Revised
Target Values
Actual Value Achieved at
Completion or Target Years
Indicator 1 : Increased block grants to poorer Panchayats equal to IDA disbursements based on formula
Value (quantitative or Qualitative)
0% 100% 100%
Date achieved 10/05/2006 10/25/2012 03/30/2014 Comments (incl. % achievement)
Target Achieved
Indicator 2 : Panchayat budgets executed according to plans and procedures Value (quantitative or Qualitative)
NA 90% 95%
Date achieved 10/05/2006 10/25/2012 03/30/2014 Comments (incl. % achievement)
Target Achieved.There were, however, some challenges in the planning process as outlined in the ICRR text.
Indicator 3 : Timely releases equal to budgets and entitlements Value (quantitative or Qualitative)
50% 100% 100%
Date achieved 10/05/2006 10/25/2012 03/30/2014 Comments (incl. % achievement)
Target Achieved.
Indicator 4 : GP revenues, expenditures and procurement decisions publicly disclosed in 90% of GPs.
Value (quantitative or Qualitative)
3% 90% 100%
Date achieved 10/05/2006 10/25/2012 03/30/2014 Comments (incl. % achievement)
Target Achieved.
Indicator 5 : Improved financial management system available in at least 5000 GPs. Value (quantitative or Qualitative)
0 % at least 5000 GPs 100%
Date achieved 10/05/2006 03/31/2012 03/30/2014 Comments (incl. % achievement)
Target Achieved.
ix
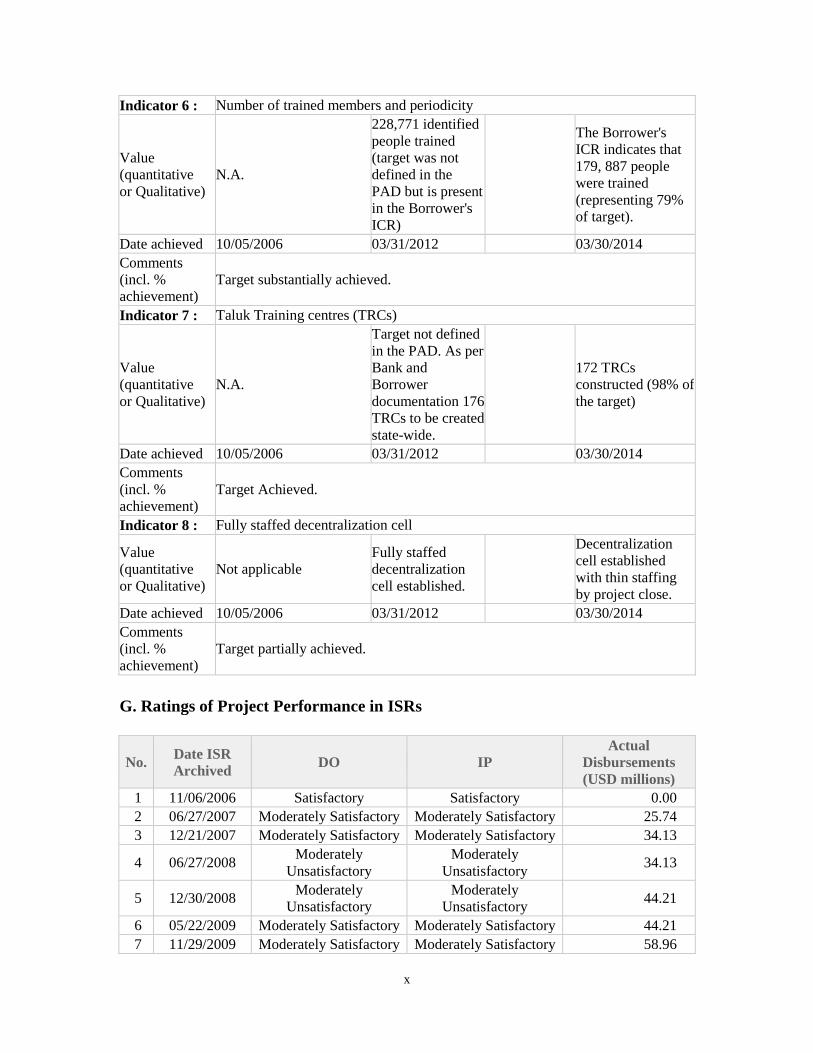
Indicator 6 : Number of trained members and periodicity
Value (quantitative or Qualitative)
N.A.
228,771 identified people trained (target was not defined in the PAD but is present in the Borrower's ICR)
The Borrower's ICR indicates that 179, 887 people were trained (representing 79% of target).
Date achieved 10/05/2006 03/31/2012 03/30/2014 Comments (incl. % achievement)
Target substantially achieved.
Indicator 7 : Taluk Training centres (TRCs)
Value (quantitative or Qualitative)
N.A.
Target not defined in the PAD. As per Bank and Borrower documentation 176 TRCs to be created state-wide.
172 TRCs constructed (98% of the target)
Date achieved 10/05/2006 03/31/2012 03/30/2014 Comments (incl. % achievement)
Target Achieved.
Indicator 8 : Fully staffed decentralization cell
Value (quantitative or Qualitative)
Not applicable Fully staffed decentralization cell established.
Decentralization cell established with thin staffing by project close.
Date achieved 10/05/2006 03/31/2012 03/30/2014 Comments (incl. % achievement)
Target partially achieved.
G. Ratings of Project Performance in ISRs
No. Date ISR Archived DO IP
Actual Disbursements (USD millions)
1 11/06/2006 Satisfactory Satisfactory 0.00 2 06/27/2007 Moderately Satisfactory Moderately Satisfactory 25.74 3 12/21/2007 Moderately Satisfactory Moderately Satisfactory 34.13
4 06/27/2008 Moderately Unsatisfactory
Moderately Unsatisfactory 34.13
5 12/30/2008 Moderately Unsatisfactory
Moderately Unsatisfactory 44.21
6 05/22/2009 Moderately Satisfactory Moderately Satisfactory 44.21 7 11/29/2009 Moderately Satisfactory Moderately Satisfactory 58.96
x
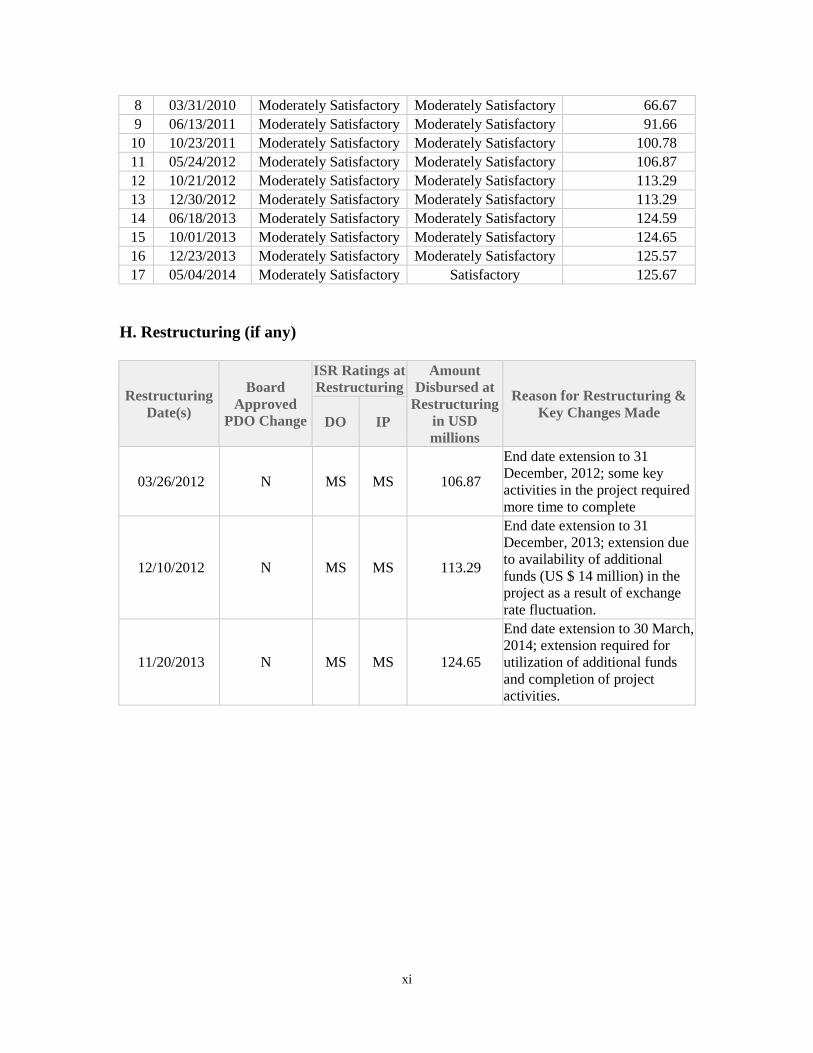
8 03/31/2010 Moderately Satisfactory Moderately Satisfactory 66.67 9 06/13/2011 Moderately Satisfactory Moderately Satisfactory 91.66
10 10/23/2011 Moderately Satisfactory Moderately Satisfactory 100.78 11 05/24/2012 Moderately Satisfactory Moderately Satisfactory 106.87 12 10/21/2012 Moderately Satisfactory Moderately Satisfactory 113.29 13 12/30/2012 Moderately Satisfactory Moderately Satisfactory 113.29 14 06/18/2013 Moderately Satisfactory Moderately Satisfactory 124.59 15 10/01/2013 Moderately Satisfactory Moderately Satisfactory 124.65 16 12/23/2013 Moderately Satisfactory Moderately Satisfactory 125.57 17 05/04/2014 Moderately Satisfactory Satisfactory 125.67
H. Restructuring (if any)
Restructuring Date(s)
Board Approved
PDO Change
ISR Ratings at Restructuring
Amount Disbursed at
Restructuring in USD millions
Reason for Restructuring & Key Changes Made DO IP
03/26/2012 N MS MS 106.87
End date extension to 31 December, 2012; some key activities in the project required more time to complete
12/10/2012 N MS MS 113.29
End date extension to 31 December, 2013; extension due to availability of additional funds (US $ 14 million) in the project as a result of exchange rate fluctuation.
11/20/2013 N MS MS 124.65
End date extension to 30 March, 2014; extension required for utilization of additional funds and completion of project activities.
xi

I. Disbursement Profile
xii


1. Project Context, Development Objectives and Design
1.1 Context at Appraisal Country and State Context
1. At the time of appraisal, most of India's poor lived in rural areas and were lagging behind
on a number of development indicators. Seventy two percent of India's population was resident in its rural areas and 30 percent of these were reported to be living below the poverty line1 at the time of preparation and appraisal of the Project. The Project Appraisal Document (PAD) noted that compared with other countries India spends a larger proportion of GDP on rural development, about US$ 7 billion by some accounts, but despite some progress, results are not commensurate with the magnitude of the expenditures. Rural areas continue to lag behind the urban agglomerations in poverty and social and economic indicators.
2. In spite of programs to address the needs of the rural poor, traditional delivery mechanisms were unable to cope with the magnitude of the challenge of providing services to more than 700 million rural people often in locations of limited accessibility. The national and state investments were fragmented in nature, having significant administrative costs. These investments were embedded in complex administrative procedures and somewhat narrow objectives, and they were not fully utilized by the diverse and heterogeneous population. Consequently, a big proportion of national funds remained undisbursed at the local level.
3. As one response to the challenge of reducing poverty, improving basic services and strengthening the delivery mechanisms, India opted for decentralization. The objective was to bring the government closer to the people, in particular the rural poor. In 1993, a revision to the Constitution (73rd and 74th Constitutional Amendments) created rural governments at the district, block and village levels and mandated states to hold periodic elections for these bodies and devolve functions and funds to them. In 2006, the national administration saw rural governments as the key mechanism for delivering key services to rural people and one of its priorities was to make this approach work in some states to serve as an example and a model for the rest of the country. By 2006, the progress in states on devolution had been mixed, with limited devolution of the 3 Fs – Functions, Funds and Functionaries.
4. At the time of preparation and appraisal, Karnataka was considered to be India’s fastest growing state, although it faced a number of poverty and development challenges. Karnataka was mostly known for its strong growth in the services sector, in particular the IT sector. However, the high growth benefited largely the urban sector leaving vast disparities between the urban and rural areas and between different regions of the state. At the time of Project preparation and appraisal, Karnataka ranked eighth among 29 states in absolute number of poor people (with 14 million), and ninth in absolute number of rural poor (about 8 million) more than any other southern state. In terms of percentage of poor people, it ranked seventh in India close to Maharashtra, Uttar Pradesh and West Bengal. It also ranked poorly in child malnutrition and access to roads. A state High Powered Committee (2002) reviewed the status of regional disparities according to several indicators and identified 39 rural blocks (Taluks 2)
1 The Project Appraisal Document (PAD, May 2006) quoted 756 million rural population in India out of a total population of 1.05 billion (Census 2001). Of these 30 percent were below poverty line. However, these figures for 2004-05 have been revised in the most recent Planning Commission Poverty Estimates (Expert Group chaired by Suresh D. Tendulkar) which shows 42 percent of rural people below poverty line in India during this period. 2 Taluk is the intermediate level of government in the three tier local government structure in India.
1

concentrated primarily in Northern Karnataka as the most backward3, with another 75 Taluks considered to be lagging in development indicators (out of 176). These Taluks also showed the highest concentration of scheduled caste, dalit, and tribal people.
5. Karnataka had a longer history of active rural local governments, it was a pioneer in
certain initiatives of sub-state devolution and its 1983 reforms served as the basis for the 1993 Constitutional Amendments. In 2002, the Report on Rural Decentralization 4 by Government of Karnataka (GoK) outlined the strategy to improve rural governance and empowerment of local governments. Following this strategy the state undertook a series of policy initiatives towards devolution which included - (i) Amendments to the State Panchayat Act; (ii) devolution of 29 subjects and 28 percent of public expenditures to district, block and village governments; (iii) clearer expenditure assignments; and (iv) the introduction of Block Grants (BG) in the transfer system, along with improved financial management and planning guidelines. The State Government through a Government Order of October 16th, 2004 mandated its line agencies to transfer to the Panchayats activities which had been devolved to them and required international organizations, including the World Bank, to implement its Projects through the Panchayat system. Karnataka saw decentralization as one instrument to address regional disparities if it could be pursued in an equalizing fashion by divesting more resources to the poorest blocks and villages and by developing capacity at the local level.
6. Karnataka, despite its impressive record, had a long way to go before its local bodies could
fulfill their potential. The block grants were small and unpredictable; generally, these grants were the same for every Gram Panchayat (GPs)5 independent of population, poverty or need. At the same time, there were high informal and formal transaction costs for local residents in need of alternative services. The majority of rural poor could be targeted and reached only by the lowest level of the village government, the GP, and this level was also the one with the best information on local needs and demands.
7. The effectiveness and efficiency of the system for resource transfers from the central to the
state and local levels was limited because of the scheme based nature of programs (essentially tied transfers). This resulted in large disparities in service delivery, considerable delays and associated opportunity cost and a failure to take local preferences systematically into account for service delivery options. The transfer system was driven by tied schemes that limited the ability of local governments to adjust resource allocations to local needs. Block grants were small and unpredictable and of the same size for every Gram Panchayat (GP) independent of population, poverty or need.
8. Enhancing the own resources and capacity of Gram Panchayats were also important priorities. Fiscal stress at the state level made it difficult to finance the huge needs of rural governments, particularly in the disadvantaged areas. Some of the estimates calculated the requirement to be over one billion US dollars. As a result, efforts by the Panchayats were required to mobilize their own resources through increased revenues. Meanwhile, capacity building was also an important challenge requiring a continuing process of training and hand-holding for over 5000 local bodies and 100,000 local elected representatives as well as
3 Dr. D.M. Nanjundappa Committee Report, 2002 4 Report of the Working Group on Decentralization, Government of Karnataka, March 2002 5 Gram Panchayat is the local self-government institution at the village level in India.
2

enhancements to the local government accounting system to strengthen linkages between planning, budgeting, spending and monitoring.
Rationale for Bank Assistance 9. Given the record of Karnataka in empowering local governments, it was considered
opportune for the Bank to support the ongoing decentralization process. In addition, the Bank’s active multi-sector involvement in Karnataka – health, education, watershed, rural water supply – required effective and efficient local bodies for implementation through creating appropriate capacity to deliver a wide range of services. Supporting these local bodies through an umbrella operation, in addition to State schemes and Bank funded sector Project, was also mitigating the risk of Panchayats being transformed into service agents for higher levels of government rather than into true local self-governments.
10. Rural decentralisation was also a key pillar of the India country strategy, and the Project
could build on important Bank analytical work. The Bank’s India Country Strategy (2001-2004) highlighted a specific need of improving government’s effectiveness through decentralization and accelerating pro-poor rural development through more effective delivery mechanisms, and by strengthening the rural safety net and beneficiary participation. The Project would help in operationalizing the recommendations from the Bank’s intensive Economic and Sector Work on decentralization. Also, the subsequent Country Strategy (2005-2008), envisaged a substantial increase in its volume of lending for community driven rural programs.
1.2 Original Project Development Objectives (PDO) and Key Indicators (as approved)
11. The original Project Development Objective (PDO) in the Project Appraisal Document (PAD) was stated as follows. “The development objective of the Project is to improve the effectiveness of service delivery by Karnataka Gram Panchayats (village governments) particularly with respect to the management of public resources and the delivery of relevant services that the rural people prioritize”.
12. The progress towards the PDO is measured by the results framework outlined in the PAD
(Annex 3). The results framework has the following indicators (Table 1).
Table 1: Karnataka Gram Swaraj Project (KGSP) Key Indicators Hierarchy of Objectives Key Indicators
Project Development Objective To improve the effectiveness of service delivery by Karnataka’s Gram Panchayats (village governments) particularly with respect to the management of public resources and the delivery of relevant services that the rural people prioritize
• Rising number of Gram or Ward Sabhas with high and representative participation and relevant participatory plans reflecting community preferences of local population
• Rising satisfaction of village residents with service delivery by Gram Panchayats
• Gradual increase in own-source revenue and stronger financial health of GP
Intermediate Results (Component A – Block Grants to Gram Panchayats)
• Increased block grants to poor Panchayats equal to IDA disbursements based on formula
• Panchayat budgets executed according to plans and procedures
• Timely releases equal to budgets and entitlement Intermediate Results (Component B–Building Capacity of Constituents)
• GP revenues, expenditures, and procurement decisions publicly disclosed in 90% of GPs
3

Table 1: Karnataka Gram Swaraj Project (KGSP) Key Indicators Hierarchy of Objectives Key Indicators
Intermediate Results (Components C&D- Building the capacity of Panchayats and state)
• Number of trained members and periodicity • Taluk training centers • Fully staffed decentralization cell • Improved financial management system available in at
least 5,000 GPs
1.3 Revised PDO (as approved by original approving authority) and Key Indicators, and reasons/justification
Not applicable.
1.4 Main Beneficiaries
13. The PAD identified Gram Panchayats as the primary beneficiaries of the project. Based on the PAD, the ICRR interprets the primary beneficiaries as the GPs, which include GP functionaries and elected representatives, in terms of improvements in their capacity and their benefitting from improved systems and procedures. Citizens resident in GPs of the Project area (comprising of the most backward 39 taluks) and the State Government were also identified as beneficiaries in terms of improved delivery, policy environment, monitoring and evaluation, and learning.
1.5 Original Components (as approved)
14. The PDO was intended to be achieved through the implementation of four Project components, which represented an allocated IDA financing of US$ 120 million over a 5.5 year period. Support under the Project followed a dual approach of programmatic support (for Component A: Block Grants to GPs comprising US$ 113.3 million) and traditional investment lending (For Components B, C and D comprising US$ 6.7 million)6.
Type of Support Component
Programmatic A: Block Grants to 1341 GPs in 39 ‘most backward taluks’ Investment (state-wide, 5629 GPs)
B: Building information systems for constituents C: Building the capacity of Panchayats D: Building Capacity of State (Setting up of DAC)
Component (A) Block grants to Gram Panchayats 15. This programmatic component would finance block grants to GP for the delivery of services
listed in the Panchayats’ perspective/participatory plans and budgets. To be eligible for the block grants, GPs would have to put in place the new Financial Management and Accounting System prepared by the state of GoK acceptable to IDA. In addition to the above, GPs that were eligible would also need to implement the new planning guidelines, and hold regular Gram
6 According to the cost estimates provided in the Project Appraisal Document, Annex 5 (Pg. 40), the total Project cost is US$ 133.3 million. Of this, the IDA funding was US$ 120 million. Block grant was 100 percent reimbursable under IDA while IDA funded only one-third of components B, C and D and the remaining was funded by GoK.
4

Sabha 7 meetings with open participation and public display of financial management and procurement information.
16. The block grants were to be based on a formula aimed at supporting inclusiveness and poverty alleviation. The formula in the first year gave weight to poverty (the population of scheduled castes and scheduled tribes), area (a proxy for costs of service provision), and illiteracy (proxy for service deficit). From the second year onwards, the block grants were to be transferred to eligible GPs based on a revised formula which would also incorporate some performance indicators. The basis of the formula from the second year would be to equalize over fiscal disparities and needs in the ‘most backward’ GPs.
Component (B) Building Information Systems for Constituents 17. This component would increase the capacity of rural people (especially poor), to voice their
demands on local bodies and hold them accountable for performance. This was to be achieved through three distinct activities – (i) creation of special mobile communication units; (ii) a Planning unit of the District Government that would make information on service delivery available at the village level through various channels; and (iii) the provision of technical assistance through organized groups/associations (self-help groups, watershed associations etc.) to make people aware on how to access and use available government programs and services.
Component (C) Building the Capacity of Panchayats 18. This component aimed at creating capacity at the District, Block and Village level to
function effectively as a local level of government. Since GPs were the weakest link, most capacity building efforts were envisaged to be targeted at this level. In total 5,629 local governments (GPs) and 100,000 elected representatives were intended to benefit from this component. Specifically, this component would include; - (i) creation of resource cells; (ii) a service delivery monitoring system; (iii) training programs for Panchayats; (iv) computerized financial management systems (included rolling out an accounting software called PanchaTantra) for GPs and; (v) an environmental management framework for Projects undertaken by the PRIs8.
Component (D) Building the capacity of the state 19. This component would enhance the state level capacity to monitor, facilitate and guide the
Panchayat. Specifically it would include: • Creation of a Decentralization Analysis Cell (DAC): The DAC was expected to perform
tasks such as analysis, evaluation, monitoring of fiscal flows to panchayats, own revenues and service delivery, and policy analysis.
• Establishment of a Panchayat monitoring system at state level: The system was intended to monitor Panchayat fiscal and service delivery data and policy support.
• Strengthening of the State Institute for Rural Development: This was to finance equipment for the Abdul Nazeer Sab State Institute for Rural Development (ANSSIRD) campus in Mysore and the creation of ANSSIRD training centers (satellite studios- SATCOMs) at the Taluk level equipped with audio-visual capabilities.
7 Gram/Ward Sabhas is a village meeting of all voting adults in that particular village or ward. The Panchayats are expected to implement the decisions of the Gram Sabhas. 8 Refers to the three tier system of rural local government in India which comprises of the District (Zilla Panchayat), Block (Taluk) and the Village (Gram Panchayat)
5

• Restructuring of line agencies: This would cover technical assistance to the State line agencies for the design of their institutional restructuring towards new roles in a decentralized service delivery framework.
1.6 Revised Components
Not Applicable.
1.7 Other significant changes 20. Level 2 restructuring to extend the Project closing date was carried out three times. The
original Project closing date was December 31st, 2011. The Project finally closed on March 30, 2014 with extensions of nine months in 2011, 12 months in 2012 and three months in 20139. Broadly, the activities that were to be completed during the extension period included: (i) procurement and installation of computers and peripherals in 5629 GPs and 176 Samarthya Soudhas (TRCs) as agreed in the Action Plan 2013; (ii) the completion of construction of the remaining TRCs; (iii) installation of studio equipment for the five satellite studios (SATCOMs) and establishment of fully functional communication facilities; (iv) allowing the GPs to complete the utilization, accounting and reporting of the block grants financed by the Project; and (v) completion of the impact evaluation study based on an end-of-Project survey.
21. The 2012 extension was primarily due to exchange rate fluctuations in the dollar. As a result an additional amount of INR 82 crores (US$ 13 million) accrued to the Project in July 2012 over and above its original allocations. At the same time, there were unspent balances of INR 28 crores (US$ 4.5 million) remaining from the original Project allocations. In order to fully utilize the huge amount the Government requested a one year extension. Among the available funds, a major share was provided to GPs as BG in the form of a sixth annual tranche.
2. Key Factors Affecting Implementation and Outcomes 2.1 Project Preparation, Design and Quality at Entry 22. The Karnataka Gram Swaraj Project (KGSP)10 was a pioneering operation of the Bank as
it was a first-generation decentralization Project in India as well as in South Asia. The Project design covered block grants to the lowest tier of local government, capacity building at various levels, information for stakeholders and creating support infrastructure.
23. The Project design built upon a considerable body of analytical work carried out prior to Project agreement. The Economic and Sector Work (ESW) portfolio of the World Bank had carried out a series of analyses11 on decentralization in the years running up to the Project. This had also involved discussions with government officers, policy makers, academics and activists working on issues of decentralization in Karnataka and other states.
9 On March 26, 2011, and subsequently on October 12, 2012 a level 2 restructuring was undertaken; this was to extend the closing of the Project by nine months and then by 12 months, respectively. On November 20, 2013, a further three month extension to the Project was granted. 10 Karnataka Gram Swaraj Project (KGSP) is the local name used for Bank funded Karnataka Panchayat Strengthening Project (KPSP). 11 Fiscal Decentralization to Rural Governments, 2003; Overview of Rural Decentralization in India, 2000, Panchayats and Resource Allocation in South India, 2004, and Local Organizations for Decentralized Development in India, 2004; and workshops/seminars in connection with these.
6
24. Karnataka put in place a decentralized framework prior to Project effectiveness that aimed to support implementation. The Government of Karnataka (GoK) undertook a number of steps which included the following: (i) developed a Decentralization Strategy in 2002 and since, amended its Panchayat Act; (ii) redesigned the financial management framework for Panchayats,; allocated 28 percent of government budgets to the Panchayat (three-tier) system; (iii) assigned a block grant of US$ 6,611 to each Gram Panchayat; (iv) developed clear expenditure assignments; (v) consolidated many of the state tied schemes (initially over 600) into a smaller number of budget lines; and (vi) transferred most of these schemes to the Panchayat system through a government order in 2004.
25. Project risks were well identified at the design stage. The Bank had identified the substantial risk of weakening commitment to Project goals emanating from multiple factors – political economy issues, fiscal stress at the state level, changes in political and administrative leadership – and the possible undermining of block grant transfers as envisaged in Project design. The disbursement arrangements were designed to mitigate these risks as much as possible, with a formula based transfer system. The formula-based grant allocation system was to include incentives for own-revenue generation, planning guidelines were to cover a large range of services, and monitoring of service delivery was expected to provide the necessary feedback for correction, as needed. There was also the expectation that economic restructuring loans (another lending operation of the Bank with GoK) would improve state level expenditure management.
26. All the risks identified at the time of appraisal, however, could not be addressed adequately at entry. The slow pace of GP capacity building was seen as a substantial risk and sought to be addressed through provision for outsourcing to populate the resource cells at the block. The slow pace of instituting the financial management system was also identified as a risk. However, as this was a state-wide initiative, there were limitations in what the Project could take up at the Project’s entry stage. The risk of according low priority to the decentralization cell was sought to be addressed through an up-front agreement with the State Finance Department on the role of the DAC and the provision of a full-time officer to head the DAC.
27. The design of the project as a decentralization-focused one was made based on learning and
experience with other design models. Three key learnings were integrated. First, the project was not designed as a rural poverty project12. Given their size, Bank projects have limited impact unless they can contribute to mainstream programs. Second, GoK had access to many state and central schemes that target vulnerable groups, and there were already a large number of community organizations and self-help groups operating in the state. Many of those schemes were financed as central grants and therefore the priority for the state was not to borrow to increase the total amount of targeted schemes and funds, but rather to improve implementation of the existing ones. Finally, the weakest link for improving local governance was the local government itself. The project was also not designed as a standalone project and instead opted for working through the government system. The reformed financial management system prepared by the Government offered enough assurances for the Bank’s fiduciary requirements.
28. Activation of Gram Sabhas with increased participation was one of the drivers designed in
the Project to move towards service delivery responding to local priorities and increased accountability. This design was informed by the experience from a range of local governance projects, which suggests that: the presence of organized groups of poor people can help to ensure transparency and accountability of local governments to them; Panchayats needed to be involved
12 Project Appraisal Document, May 2006
7
in local infrastructure planning to ensure its sustainability; and Gram Sabhas (village assemblies) generally take place when they have relevant decisions to make. Also, where communities contribute towards local investments these can be implemented at lower costs and are more likely to be sustained.
29. The project also focused on the most backward Taluks in the state. The risk of shifting
resources away from most needy jurisdictions was addressed through the focus of the project on the GPs in the 39 most backward Taluks of Karnataka. This was written into the project’s legal agreement.
30. The Project design, overall, adopted a the blended approach of having a programmatic
block grant support with investment lending embedded in institutional and capacity strengthening at the district, block and village level. The block grants were to be used as a vehicle to catalyze institutional strengthening and building the capacity of the system to implement the policy framework (2002)13 of GoK. Project execution became easier once the GPs aligned themselves in accordance with the new financial reporting and accounting systems and the planning guidelines.
2.2 Implementation
31. The Project facilitation team (PFT) experienced some implementation delays, especially in the first two years, which slowed progress; but the pace largely picked up thereafter and more comprehensively after corrections at Mid-Term Review. There were initial challenges (especially with staffing of the PFT and DAC) with the pace of the implementation of the Project. This was accentuated by changes in administrative leadership14 at the state and also changes in political leadership15 at the time of the start of the Project. Also, an amendment to the Panchayat Raj Act was passed in April 2007 by the Legislative Assembly and awaited assent of the Governor, and this presented a hindrance16 to project implementation. Discussions with the state government on the Project were suspended for a brief period (till October 2007), until the outcome of the amendment and its implications were clear. During this phase, implementation gaps were identified in all components, but primarily in the planning process and the information to constituents, as these activities related to the disbursement of BGs and their utilization.
32. In 2008 state elections were held and the Project had to face challenges of significant turnover of staff in the Rural Development and Panchayat Raj Department including their senior management, though this eventually settled down. During this period the Project progress
13 Amendment to the Karnataka Panchayat Raj Act (2002) included- : (i) creation of Ward Sabhas (neighbourhood assemblies) as the lowest unit of constituent representation and participation to enhance accountability downwards; (ii) allow associations of Gram Panchayats to explore economies of scale in service delivery; (iii) allow outsourcing to technical staff for the delivery of Panchayat services. Along with amending its Panchayat Act, the GoK has also taken other significant rural decentralization policy initiatives. These include: putting in place a new accounting and reporting framework for Panchayats, issuance of new planning and procurement guidelines , issuance of a government order to enhance transparency of Panchayat expenditure, granting Panchayats the independence to make payments without taking approval from the Taluk, increasing State block grant to GPs, development of a capacity building program on Panchayat duties and responsibilities, institutionalization of a fiscal information collection system on Panchayats and the completion of the enlistment of all taxable entities for property taxes in 123 Taluks out of 176. 14 New administrative leadership had taken charge at the time of the first supervision mission (November 2006). There was a change in leadership by the time of the next mission (June 2007) and again by December 2007. 15 The state government changed in 2006 and again following elections in 2008, with a brief interregnum when the state was under President’s rule. 16 On April 21, 2007, the Karnataka legislative council (upper house of the legislature) passed an amendment to the state Panchayati Raj Act, 1993, to take over the role of panchayats in selecting beneficiaries for development programmes at the village-level. "If the gram panchayat fails to prepare beneficiaries' list in respect of housing schemes or other programmes funded by the government, then a committee headed by the member of the legislative assembly (MLA) from the constituency shall select the beneficiaries…"
8
was disrupted and BG disbursements started slowing down. Some components on capacity building did not take off in the manner agreed upon with the Bank and the decision to conduct the baseline survey was postponed. This all contributed to a rating of ‘moderately unsatisfactory’ in the two ISRs of 2008. However, once the impact of the elections settled down the Project started showing positive changes, but the team continued with a MU rating given that the positive changes were fragile and had to be sustained for a longer period of time.
33. At MTR, steps were taken to address some key implementation weaknesses that had crept into the Project. The MTR recommended that the operational focus of the Project for the remaining years should be on achieving the following institutional development results: (i) The effort to strengthen the GP financial management capacity should continue; (ii) the Project should build on enhanced grassroots participation and further improve the quality of the GP planning and execution process and the development impact of GP spending; (iii) the Project should initiate targeted capacity building interventions to develop GPs’ own revenue capacity; and (iv) the Project should significantly strengthen the management of the Decentralization Analysis Cell (DAC) and build its fiscal analysis and advocacy capacity. As a result the Project turned around significantly post Mid-Term Review.
34. In addition, during MTR, the legal covenants governing the BGs were simplified to enhance their utilization. GPs initially had difficulty in interpreting and meeting the FM and accounting covenant17 of the BG. This created bottlenecks in fund flow and utilization of BGs in the first two years of the Project implementation. The covenant was simplified and converted into quantifiable indicators18 during the MTR in order to facilitate easy access and utilization of BGs by the Project GPs. Enforcing these conditions signaled to GPs the importance of financial management discipline which played an important role in facilitating smooth Project execution.
35. On the ground the five year perspective plans were implemented in a large number of GPs and were seen as important in capturing local preferences at the GP. The perspective plans provided flexibility through the annual action plans for accommodating the evolving changes in local preferences. However, not all Project GPs made use of the annual action plans to make mid-course corrections. In addition, information Education & Communication (IEC) activities were carried out in the form of media outreach in 39 taluks. 19 GPs started disclosing information related to budget, tenders, revenue collection, work plans, audit compliance/findings to the public through Ward/Gram Sabhas, display of information in the GP offices and awareness posters. The disclosure in the Project GP’s was 98 percent.
36. In 2010, the Project deliverables were reviewed and the focus shifted to the implementation of procurement tasks – construction of Taluk Resource Centers and the studios for Satellite Communication - that had slipped. Subsequently, most of these were completed by the time of Project closure and permanent infrastructure in the form of Taluk Resource Centers (172 centers) and SATCOM studios (five studios) were established.
17 GPs would receive annual block grants if they meet the following eligibility criteria: i) Having implemented GoK’s new FM and Accounting System; ii) Having implemented GoK’s new Planning Guidelines; iii) Having held regular Gram Sabhas with open participation; iv) Having publicly displayed FM and procurement information. 18 In agreement with GoK, the first covenant was elaborated as: a) The GP should have submitted UC for 70% of all cumulative installments; b) The GP Project accounts should have been audited for the FY 08-09; c) The GP accounts for all funds in FY 08-09 should have been completed by the CA firm; d) The GP complies with internal audit findings, where applicable. 19 The Project initially focused on a media outreach program in 39 Taluks to inform residents about the project and enable them to track Project progress. In addition to the media campaign, residents were informed about the roles and responsibilities of GPs and service delivery performance at the village level through awareness campaigns such as kalajathas (street plays), short films, skits, etc.
9

37. During implementation, the demand from flagship programs like the Mahatma Gandhi National Rural Employment Guarantee Scheme (MGNREGS) also stretched the training organization capacities, which itself was already undergoing change as a result of the project. The State Institute of Rural Development (ANSSIRD) was challenged by the need to design and deliver training programs for the GPs as indicated by the Project. This was stretched further with the advent of flagship programs. Demands on the ANSSIRD for providing training to functionaries involved in the national flagship program – MGNREGS – was immense.
38. The DAC took some time in getting staffed and active, but took up a significant volume of work during the Project period. The DAC devised the formula for the block grants, developed concept notes, (for example, on how to make TRC sustainable, assisted in implementation of Panchatantra financial management software) and created the fiscal database information system.20 The DAC also reviewed the baseline socio-economic data. The data compiled by DAC was expected to be used by other departments but this does not appear to have happened.
2.3 Monitoring and Evaluation (M&E) Design, Implementation and Utilization
39. The KGSP Results Framework included a number of critical performance indicators to monitor progress towards the Project Development Objectives (PDO). Assessment of results at times was, however, difficult in the absence of timely and reliable baseline values for certain indicators prior to Project initiation; and by the fact that some indicators were not fully defined (as noted below in this ICRR). However, project team ensured that these data gaps were adequately addressed during Project implementation. A reliable database was established during the Project implementation which helped in regular and timely monitoring of results in the Project. This is one of the pioneer decentralization projects where an impact evaluation was envisioned and completed by Project closure.
40. Annual submission of data related to progress in the Project by GPs and Taluk Panchayats (TP) was the key source of information which facilitated regular monitoring. The Decentralization Analysis Cell (DAC) established systems for monitoring of fiscal flows, collection of own revenues and service delivery performance, aggregating data collected at all three levels. Panchatantra was a key strength in the Project which enabled real time monitoring of progress at the GP level.
41. The baseline survey for certain indicators was delayed to 2009 when the Project had completed almost three years of implementation. As a result of this, some of the baseline values were not representative of the initial conditions of the GPs at the start of Project implementation. Despite the difficulties in the timing of the surveys, the results from both baseline and end-line had important findings and recommendations.
42. Preparation of detailed Aide Memoires 21 based on field visits were instrumental in appraising Project implementation progress. This facilitated corrective measures from time to time towards the achievement of PDOs within the stipulated timeframe. Systematic follow-up on results was possible through regular progress reports submitted by the PMU.
2.4 Safeguard and Fiduciary Compliance
20Various Aide Memoires and Implementation Support Reports for the Karnataka Panchayat Strengthening Project 21 In overall terms, the Bank conducted 11 Implementation Support Missions and prepared 17 ISRs.
10

Environment
43. There was inadequate emphasis on environmental frameworks during the MTR. The implementation of the Environmental Management Framework (EMF) was weak in this Project due to lack of awareness among GP officials, inadequate training, mentoring and supervision by the Project. Over time and more recently the Project took steps20 to address this issue and four rounds of training on Environment OK cards22 were held towards the end of Project. These efforts, however, needed to be sustained over a much longer period of time to institutionalize the environment safeguards as an integral part of the operational design.23
Social
44. The Project met most of the social safeguard measures elaborated in the PAD. This was made possible through the fiduciary framework which facilitated participation and inclusion of vulnerable and excluded groups in Gram Sabhas. The design of the perspective plans was inclusive enough to take care of the women and SC/ST population of the Project GPs.
Procurement
45. Residents visited during the annual post procurement review expressed satisfaction with the transparency in procurement brought about by the tendering process under the Project. The improved procurement procedures resulted in creation of better quality assets at the GP level. The procurement of equipment for the SATCOM centres had been a major area of concern in the Project for several years. During the Tenth Implementation Support Mission a major breakthrough was achieved in finalizing the bidder for supply and installation of equipment’s in the SATCOM studio. Several annual Post Procurement Reviews highlighted that the majority of the contracts under the Project complied with the requirements elaborated in the PAD.
Financial Management
46. Fiduciary risk was rated ‘high’. Mitigating measures were designed to address the risks mentioned in the PAD through a framework governing Block Grant approval, usage, accounting and assurances set out in the appraisal and captured in the legal covenants. In addition, the financial management framework for the Project was seen as supporting the overall development objectives of the Project.
47. Fiduciary assurance mechanisms prior to MTR were limited to annual external audit of the GP block grant account (instead of the entire GP account), internal audit on a sample basis, and the Utilization Certificate. Timely and high-quality audit of the entire GP accounts was not emphasized. The GP eligibility criteria designed to give GPs incentive to adopt transparency and accountability practices were not enforced24. In the corrections post-MTR, an eligibility criterion for GPs to access BG was enforced and auditing of GP accounts taken up through Chartered Accountant firms.
22 Mandatory checklist of adherence to environmental guidelines before commencement of construction works. 23 An environment review (2013) by the Bank found that the works carried out under KGSP did not have any negative environmental impacts; instead it highlighted that the assets created can have a positive impact in the community. Some key suggestions included: (a) annual planning in GPs must be preceded by a review of the works and assets created in the preceding years to assess the usage status and to gather learning; (b) screening tool and OK cards need to be more specific and simple; (c) more focused training program for engineers. 24 MTR
11

2.5 Post-completion Operation/Next Phase
48. The government’s commitment towards correcting regional imbalances through deepening
decentralization is reflected in its request for the next phase of the Project. GoK has requested a second phase for the Gram Swaraj Project as an IBRD loan of US$ 220. The phase II emphasizes expanding the scale and coverage of KGSP by including an additional 1244 GPs from 40 ‘more backward’ Taluks. However, the institutions and the capacity that was developed under the first loan will need to be sustained over a longer period of time including the second phase.
49. The introduction of the improved financial management system needs to be sustained. Substantial support was provided by the Project on the roll out of Panchatantra. Fully sustaining may be a challenge, as skilled personnel are not available at the GPs. Appointment of suitably qualified personnel like trained Chartered Accountants, a dedicated and well-resourced cell on Panchatantra at the PMU and Taluk level are required on a continuous basis for providing guidance and support to the GPs.
50. It would be recommended to strengthen Project Monitoring Unit (PMU) management and there is a need to fix tenures of officials and consultants to ensure stability in the Project. The tenure of the staff and consultants at the Project Monitoring Unit (PMU) could be fixed for effective implementation of the Project. In addition to insulating Project staff from frequent changes/transfers, the Project Director could be a high-level officer (at Secretary level, as per the PAD) and not someone with an additional charge of the Project. Also, there could be efforts to streamline the multi-layered process of obtaining internal clearances with regards to the Project.
51. Monitoring systems at the sub-district level could be improved. Monitoring of progress in different projects suffers due to the span of coverage and inadequate personnel at the Taluks. GoK has suggested the formation of cluster-level cadre to assist the Taluks in M&E. Also, under the Rajiv Gandhi Panchayat Sashakthikaran Yojana (RGPSA), additional personnel (mostly engineers) have been provided to reduce the work load of the Taluk personnel.
52. A substantial number of assets were created during the Project and there would need to be
an emphasis on their Operation and Maintenance (O&M). Sustainability of assets created need attention through appropriate O&M. More than 52,000 works have been created under KGSP which need to be sustained through a proper mechanism for maintenance as well as a strategy for prioritizing maintenance expenditure.
3. Assessment of Outcomes
3.1 Relevance of Objectives, Design and Implementation
Rating: Substantial Relevance of Objectives sub-rating: High 53. The PDOs remain highly relevant to, and consistent with, Government of India’s and
Government of Karnataka’s current development priorities. A recent report25 from the GoI illustrates the central importance of the PRI system in India for ensuring more effective and efficient delivery of services, amongst other things. Similarly, GoK, through setting up of a
25 Expert Committee on ‘Leveraging Panchayats for Efficient delivery of Public Goods and Services’, GoI Report 2013
12

committee to amend its existing Panchayat Raj laws 26 has signaled, to a good degree, its continued prioritization for decentralization strengthening. In addition to this, GoI and GoK have formally accepted the centrality of local governments in delivering services in a range of significant flagship anti-poverty programs, such as MGNREGS, which emphasizes that the basic objectives of the Project retain a high relevance in this context.
54. In spite of some shifts in GoK priorities during Project implementation, GoK has re-
emphasized decentralization as a high priority, which is illustrated by the preparation of a substantial follow-on investment lending operation. The changes in political leadership (in 2006 and 2008) and the accompanying changes in the executive led to some decline in prioritization of decentralization. However, even with changes in the government at the State level over the Project period, the Project continued to receive support from the State Government. More importantly, the GoK has more recently illustrated the high priority it accords to this type of project by requesting and preparing a follow-on decentralization project for US$ 220 million. The phase II of the project follows the same aspects of its predecessor with an expanded geographic coverage and stronger performance triggers. Moreover, KGSP’s focus on backward Taluks in the north eastern part of Karnataka and its emphasis on balanced regional development in Karnataka remains highly relevant, as illustrated by the fact that GoK wishes to continue its focus in the North and to focus on the more and most backward Taluks.
55. The PDOs also remain highly relevant to the Bank’s current country partnership strategy, 2013-2017. A number of points can be briefly highlighted. First, the CPS notes the critical importance of rural development in India where there is a high concentration of India’s poor; and KGSP focused on rural development. Second, the CPS recognizes that strong rural local bodies are critical in improving access to basic services, and that more progress needs to be made in empowering such bodies. Third, the CPS has a key pillar on ‘inclusion’. The decentralization agenda is highly relevant here, as decentralization strategies aim to encourage improved inclusion of local constituents in development processes, as well as inclusion of marginal groups within those constituents, which is illustrated through the range of reservations for excluded groups in the PRI system in India. This amounts to decentralization being an important element of the CPS’ focus on shared prosperity.
Relevance of Project Design & Implementation Sub Rating: Substantial 56. The Project design was largely consistent with the PDOs and targeted important areas for
achieving the objectives. The design and implementation activities were relevant insofar as they drew on a range of important analytical, preparatory work (as described above). The block grant design model was also very relevant insofar as it attempted to address identified bottlenecks and constraints in the existing system. For instance, the grants targeted the lowest tier of elected rural local governments which were key areas in need of support, and the untied nature of the grants was intended to facilitate greater responsiveness to local demands and needs. The Project design was also highly relevant to the state’s agenda of balanced development, as the Project directed resources to the ‘most backward’ Taluks. Moreover, the Project design and implementation also supported targeted capacity and institution-building activities to strengthen planning and delivery mechanisms to complement the untied grants.
26 A committee has been set up by the GoK to examine necessary amendments to the State PRI Act which is expected to submit its report on October 2, 2014. These amendments are likely to deepen the decentralization process in Karnataka and strengthen capacity at the GP level.
13

57. There were, however, some aspects that could have been addressed to increase the relevance of the Project design and implementation. Although the blended (mix of programmatic and investment lending) design of the Project was a key strength; the limited capacity of the ‘most backward’ Taluks resulted in difficulties to respond to Project activities on a timely basis. In terms of implementation, the Project implementation was relevant and responsive to the achievement of the PDOs. For example, the Project responded to the requests from GoK to extend the closing date of the Project to utilize remaining funds and make further progress towards the PDOs. On the other hand, implementation relevance could have been increased in various ways. For example, components B, C and D were fully rolled out on a state-wide basis but their implementation was challenging given the scale and delays in execution of activities. In addition, the implementation relevance would have been increased had it found a way to adapt to the launch of the MGNREGS program, which diverted attention away from the capacity building activities and, to some degree, reduced the relevance of the block grants by pumping considerable resources, albeit tied, to the GP level.
3.2 Achievement of Project Development Objectives Rating: Substantial
Attribution and Results Measurement 58. In order to assess the extent to which the project achieved the PDO, the Project approach
and results framework indicators were scrutinized. The Project Development Objective was ‘to improve the effectiveness of service delivery by Karnataka’s Gram Panchayats (village governments) particularly with respect to the management of public resources and the delivery of relevant services that the rural people prioritize’. The ICRR considers those results that can be reasonably attributed to the Project activities. 27 According to the PAD, it was expected that emphasis on Gram/Ward Sabha planning would result in improved capture of local needs and priorities. Also, it was expected that the provision of untied funds alongside capacity development would result in construction of assets and provision of services that address the above local needs and priorities. It was similarly expected that these activities at GP level would be strengthened and facilitated by state-level strengthening of devolution, capacity support and monitoring and evaluation. The results framework indicators were developed broadly in line with this thinking.
59. It is judged that the PAD’s results indicators are, in spite of certain limitations, useful
measures of progress towards the PDO and are the best available measures for this ICRR given data availability. As such, as per IEG guidelines, the below assessment is based on the official indicators and targets outlined in the PAD. However, a few RF indicators lacked clarity in the PAD and the supporting evidence is patchy in certain areas; in such cases the ICRR team has based its judgment on available borrower documentation, as flagged at relevant points below. Where necessary, the ICRR team has made clear its interpretation of the indicator, including in the footnotes, and has triangulated the available evidence to reach the best possible judgments.
Assessment of Achievement of PDOs by Indicator28
27 It is difficult to directly attribute certain results to the Project, not least because of limitations in some of the available data. Nonetheless, those areas that can be reasonably attributed are considered, alongside those areas where the Project has been registered to make a notable contribution to results. 28 For a number of indicators the ICRR has used baseline information from 2006-07 from the KGSP MIS database to assess results. In areas, where the MIS database fell short, the team has used information from 2009 baseline survey.
14
PDO-Level Indicator: Rising number of Gram or Ward Sabhas with high and representative participation and relevant participatory plans reflecting community preferences of local population Target: 60% (increase against baseline)
60. Achievement sub-rating: substantial. There was a 72% increase in the number of Gram and
Ward Sabhas held, thus the target of a 60% increase was exceeded.29 In addition to this, there was a 33% increase of women participants and a 21% increase in SC/ST household members between 2006-07 to 2011-12.30 In spite of this exceeding the target, the rating is conservatively assigned as substantial because of the lack of definitional clarity on what is meant by ‘high and representative participation’.31 PDO-Level Indicator: Rising satisfaction of village residents with service delivery by Gram Panchayats Target: 60% (of surveyed residents felt their services are better in comparison to neighbouring GPs)
61. Achievement sub-rating: modest. This indicator cannot be fully measured since there was no
baseline defined at the time of PAD preparation and appraisal; the baseline was conducted in 2009. The end-line survey found that 55% of respondents from Project GPs felt services were better in comparison to non-Project GPs against a 2009 baseline survey of 48%. Based on this available data, only modest progress in this area can be evidenced. The Project’s endline survey found that 90% of stakeholders thought that the quality of assets created under KGSP were worth the investment in comparison to other schemes such as BRGF and MNREGA.32 PDO-Level Indicator: Gradual increase in own source revenue and strong financial health of village governments. Target: INR 67 crore (USD 16 million)
62. Achievement sub-rating: substantial. The end value achieved was INR 59 crore (USD 14
million), so the target was not achieved but substantial progress (from a baseline of INR 25 crore, OSR more than doubled) was made. It is worth noting that OSR collection in Project GPs grew at an annual average growth rate of 22.69% as compared to the state average of 12.72% from 2006-07 to 2012-13.
29 In other words, Gram Sabhas increased with an annual average growth rate of 12 percent and an overall increase of 72 percent during the Project period. The practice of convening Gram Sabha meetings to identify projects was more prevalent in Project GPs. The Participatory Rural Appraisal conducted as part of the End-line survey (2014) also found that, in almost all villages surveyed, the first time they held a ward sabha was under the KGSP Project. Ward Sabhas that were conducted for the first time ever in almost all the villages was under the KGSP Project. 30 However, the total attendance – of these groups – remains low at about 3-5 percent of the population enumerated. 31 The PAD does not clearly define and measure ‘high and representative participation’ or ‘relevant participatory plans reflecting community preferences of local population’. The available data in the borrower ICRR does, nonetheless, indicate representation across the range of groups, as well as increases in the number of people attending during the Project lifetime. 32 It can also be noted that focus group discussions conducted as part of another study in 20 Project GPs concluded that community members were satisfied with service delivery in GPs due to improved procurement practices and transparency measures. In sum, an impact evaluation notes that assets that were constructed under the Project were rated better (on dimensions of quality of design and construction) in Project GPs compared to non-Project GPs, both by engineers and in focus groups. Additionally, the end-line studies gave some insights into prioritization issues – the end-line evaluation documented the major problems reported by the stakeholders in order of priority as: water supply, roads, drainage, toilets/sanitation, electricity, health care, transport, housing and employment in that order. These four priorities received 70.75 percent of the investments made under the BG. In comparison, the other two partially untied schemes studied at end-line (NREGA and BRGF) invested 19 percent and 15 percent of their funding on these aspects.
15

Intermediate Indicator: Increased block grants to poor Panchayats equal to IDA disbursements based on formula Target: 100%
63. Achievement sub-rating: high. The Project achieved 100% disbursement of IDA block grants33
by the end of the Project, which means that the target was fully achieved.34
Intermediate Indicator: Panchayat budgets executed according to plans and procedures Target: 90%
64. Achievement sub-rating: substantial. The target was exceeded, at 95%, by the end of the
Project with budgets executed according to stipulated plans and procedures. However, it is deemed that progress was substantial, and not high, because the 5 year perspective planning was largely not updated for any mid-course corrections so plans were not able to capture changing constituent priorities.35
Intermediate Indicator: Timely releases equal to budgets and entitlement Target: 100%
65. Achievement sub-rating: high. The target of 100% was met by the end of the Project.
Intermediate Indicator: GP revenues, expenditures, and procurement decisions publicly disclosed in 90% of GPs Target: 90%
66. Achievement sub-rating: substantial. The target was achieved as, by 2013-14, 1273 GPs (94%)
regularly displayed information. However, the extent of the regularity of the disclosure and the detail and accuracy of the information is not measured by the indicator or the available end-line survey data, hence the sub-rating is judged to be substantial. Intermediate Indicator: Number of trained members and periodicity36 Target: 228,771 identified people trained37
33 Compared to the statutory grant release of a fixed amount to each GP, the Project provided BG which was formula based and thus accounted for the size and nature of the population in the GP. 34 For informational purposes, although the basis for disbursement and the significance of the quantum appears to have had some problems in the initial stages, the disbursement of Block Grants was reported to have been as planned and timely. After the MTR, the disbursement of two annual installments was converted into a single annual installment. In the later stages of the Project, an additional sixth tranche of disbursements (due to availability of additional funds resulting from exchange rate fluctuations) was also achieved compared to the five annual tranches expected during the design 35 The apparent weakness was that citizen priorities were not accurately reflected in GP funding proposals, as the GPs were asked to stick to the five-year plans, prepared at the beginning of the Project. In terms of lesson learning, the five-year perspective plan limitations were: (i) variable quality; (ii) shortcomings in community participation processes of planning; (iii) strong orientation towards physical infrastructure and construction; and (iv) rigidity of guidelines that prevented adjustment of annual plans based on evolving needs and priorities of the community. 36 There is an inconsistency between the results framework and the table on arrangements for results monitoring in the PAD in terms of the capacity building component C and D. The table on arrangements for results monitoring does not provide any baseline or target values for intermediate outcome indicators on number of trained members and periodicity, TRCs and DAC. In order to overcome this, the ICRR team has consulted the range of official documentation and validated this through discussions with the range of stakeholders. 37 The end target was not specified in the PAD, therefore the conclusion has been reached and validated based on the borrower’s ICRR (as outlined in Annex 6). However, periodicity was not targeted or measured as per the documentation, even though it is mentioned in the indicator. Given that it is not targeted by either Bank or borrower documentation, the ICRR does not consider periodicity in its evaluation.
16

67. Achievement sub-rating: substantial. The target was not defined in the PAD but is present in the borrower ICRR. The Borrower’s ICRR indicates that 179,887 people were trained (representing 79% of the target), which can be judged as substantial progress towards the target.
Intermediate Indicator: Taluk training centers Target: 176.38
68. Achievement sub-rating: substantial. The construction of Taluk resource (or training) centres
(TRCs) was envisaged state-wide for all of the state’s 176 Taluks. 172 were constructed under the Project (98% of the target), which marks substantial progress. Intermediate Outcome Indicator: Fully staffed decentralization cell Target: Fully staffed decentralization cell.39
69. Achievement sub-rating: modest. The Decentralization Analysis Cell (DAC) was established in
the initial Project years. It was fully staffed in the initial years but in later years there was a high turnover of staff. By Project close the DAC was not, however, fully staffed with relatively thin staffing. As such, progress is judged to be modest. The DAC also fulfilled a substantial amount of functions over the Project life39, though this is not captured in the formal target and hence not directly considered in the ICRR rating.
Intermediate Outcome Indicator: Improved financial management system available in at least 5000 GPs Target: 5000 GPs (state-wide).
70. Achievement sub-rating: high. The target was fully achieved by the Project close as 5629 GPs
(100%) had adopted the improved financial management system. The Project also contributed to the roll-out and uptake of financial management software, as described below. In addition, it was found that reportage of tendering process followed for procurement was higher in Project GPs and double-entry book-keeping systems were adopted more frequently in the Project GPs.40 Additional key progress areas and achievements
71. While the analysis and ICRR rating – as per IEG guidelines – is largely based on the
achievements related to the formal PAD indicators, other areas of Project activity and
38 The end target was not specified in the PAD, therefore the conclusion has been reached and validated based on the borrower’s ICRR (as outlined in Annex 6). 39 Despite some limited leadership and limited resourcing the DAC produced substantial good quality analytical reports – included budgetary outcomes in terms of spending and revenues raised budgetary balances and shortfalls, tax effort, and the match between budget projections and actual outcomes. This relied heavily on data produced by the fiscal information system which included Formula Evaluation, Monitoring of Compliance, Revenue Mobilization Analysis, Best Practices, Expenditure related assignments. 40 In order to provide information, the following points should be documented: the Project undertook various efforts to address the issues such as non-availability of budget estimates, absence of a mechanism to compile information on revenue collection, unsatisfactory bookkeeping at GP level, and absence of standards for accounting through introduction of improved financial management system in all 5629 GPs in the state. Required actions were assured to be taken up to create a panel of CA firms in consultation with KSAD to conduct special reviews in both Financial Management and Procurement at the GP level. The Project influenced GPs to make use of the services of Chartered Accountant for strong internal audit of Finances which include process audit which starts from the processing of Perspective plans prepared at Gram Panchayats including the tender process/shopping methods involved, work clearance order, work execution with photos at all three phase before, present and after, record maintenance, bill maintenance (Measurement Books), cash book entries. It is also worth noting that 91% of ‘Most Backward GPs’ covered under KGSP completed audits in time during Project period against the state average of 86%. [Empirical Impact Evaluation Study on Karnataka Panchayats Strengthening Project (Gram Swaraj), Centre for Management and Social Research (CMSR), March 2014].
17

Project contribution to progress are considered. These areas are briefly summarized in the following bullets:
• The Project contributed to the roll-out of, and capacity building for, a financial management software – ‘Panchatantra’41 – to help GPs improve their financial management, although there is progress still to be made. The Project was instrumental in strengthening Panchatantra implementation by, among other things, providing one desktop computer and MS office software to each of the 5629 GPs in Karnataka. In addition, the Project, in coordination with ANSSIRD, supported the training of more than 10,000 staff of GPs on Panchatantra which accelerated its roll-out.42
• The Project facilitated improved access to basic services through its activities. In total, the Project enabled the construction of more than 25,000 roads, 8029 drainage lines, 1652 community toilets, 2947 drinking water facilities, 1537 Anganwadi Buildings and a number of other assets which were essential to address the infrastructural gaps in the communities.43
• The Project contributed to increased overall awareness amongst people about the PRI system. According to the end-line survey, Project informational activities appear to have contributed to increased awareness of GP activities, revenue issues and the importance of operation and maintenance of assets. However, these informational activities were relatively limited in scope and reach.
• The KGSP framework has arguably helped indirectly, to some degree, to facilitate the GP absorption and use of funds from other GoI flagship programs. While this has not been rigorously measured, anecdotal evidence suggests that the Project contributed to this by providing GPs with a strengthened system to facilitate better reporting, accounting, auditing and documentation.
• There has been a documented improvement in some indicators reflecting broader institutional improvements, even if this cannot necessarily be directly attributed to the Project activities. End-line studies point to the improvement of indicators, including: (i) discussion of annual action plans in GP meetings; (ii) discussion of budgets in Gram Sabha; (iii) participation in Gram Sabha/Ward Sabha meetings; (iv) voting in GP elections; and, (v) access to GP Adhyaksha44. However, these improvements are visible in Project and non-Project GPs and seem to indicate overall improvements state-wide. This would require further evaluation. Overall Rating for Achievement of the PDO
72. It is judged that the achievement of the PDOs, according to the identified indicators, is substantial based on the achievement of target values by the closure of the Project. Table 2 summarizes the achievements per indicator and aggregates these totals. The table illustrates that
41 Panchatantra is a web-based application introduced by GoK with support from National Informatics Centre (NIC) of GOI with an aim to reduce the manual tasks, increase the accuracy of financial statements and ensure transparency of Gram Panchayats in the state. Panchatantra is currently used by all 5629 GPs in the state. Panchatantra allows GPs to feed in their accounts, meeting proceedings, Gram/Ward Sabha details, Jamabandi / Social Audit etc. Further, through Panchatantra, all necessary information related to the GP is accessible to the public, which includes the budget information and expenditure status. GP members are allowed to track the status of their applications & grievances through the web based portal. Panchatantra enables real time monitoring of GPs by the Zilla Panchayat and Senior Officials at the state level through tracking of day to day financial transactions. 42 Training was provided to complete the full cycle of data entry for producing the necessary reports and citizen service through the Panchayat Enterprise Suite. The Project also provided support in the selection and deployment of Chartered Accountant services for the audit and handholding of GPs. The Project also supported e-governance initiatives for issuing certificates and licenses from the GP. The Ministry of Panchayati Raj (MoPR) has undertaken e-Panchayat Mission Mode Project (e-Panchayat MMP) with a view to introduce and strengthen e-Governance in Panchayati Raj Institutions (PRIs) across the country and build associated capacities of the PRIs for effective adoption of the e-Governance initiative. Under this Project, Panchayat Enterprise Suite (PES) has been conceptualized which comprises 11 Core Common applications. 43 Borrower’s Implementation Completion Report 44 An Adhayaksha is the Chairperson of the Gram Panchayat
18
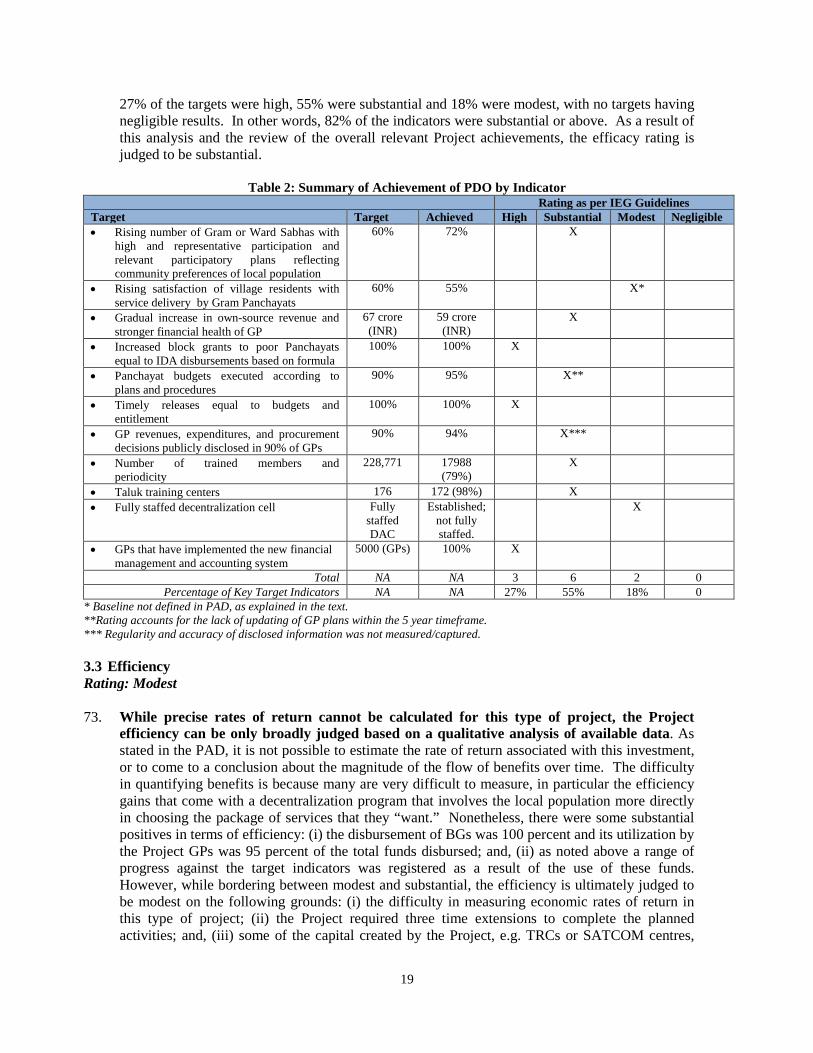
27% of the targets were high, 55% were substantial and 18% were modest, with no targets having negligible results. In other words, 82% of the indicators were substantial or above. As a result of this analysis and the review of the overall relevant Project achievements, the efficacy rating is judged to be substantial.
Table 2: Summary of Achievement of PDO by Indicator Rating as per IEG Guidelines Target Target Achieved High Substantial Modest Negligible • Rising number of Gram or Ward Sabhas with
high and representative participation and relevant participatory plans reflecting community preferences of local population
60% 72% X
• Rising satisfaction of village residents with service delivery by Gram Panchayats
60% 55% X*
• Gradual increase in own-source revenue and stronger financial health of GP
67 crore (INR)
59 crore (INR)
X
• Increased block grants to poor Panchayats equal to IDA disbursements based on formula
100% 100% X
• Panchayat budgets executed according to plans and procedures
90% 95% X**
• Timely releases equal to budgets and entitlement
100% 100% X
• GP revenues, expenditures, and procurement decisions publicly disclosed in 90% of GPs
90% 94% X***
• Number of trained members and periodicity
228,771 17988 (79%)
X
• Taluk training centers 176 172 (98%) X • Fully staffed decentralization cell Fully
staffed DAC
Established; not fully staffed.
X
• GPs that have implemented the new financial management and accounting system
5000 (GPs) 100% X
Total NA NA 3 6 2 0 Percentage of Key Target Indicators NA NA 27% 55% 18% 0
* Baseline not defined in PAD, as explained in the text. **Rating accounts for the lack of updating of GP plans within the 5 year timeframe. *** Regularity and accuracy of disclosed information was not measured/captured.
3.3 Efficiency Rating: Modest 73. While precise rates of return cannot be calculated for this type of project, the Project
efficiency can be only broadly judged based on a qualitative analysis of available data. As stated in the PAD, it is not possible to estimate the rate of return associated with this investment, or to come to a conclusion about the magnitude of the flow of benefits over time. The difficulty in quantifying benefits is because many are very difficult to measure, in particular the efficiency gains that come with a decentralization program that involves the local population more directly in choosing the package of services that they “want.” Nonetheless, there were some substantial positives in terms of efficiency: (i) the disbursement of BGs was 100 percent and its utilization by the Project GPs was 95 percent of the total funds disbursed; and, (ii) as noted above a range of progress against the target indicators was registered as a result of the use of these funds. However, while bordering between modest and substantial, the efficiency is ultimately judged to be modest on the following grounds: (i) the difficulty in measuring economic rates of return in this type of project; (ii) the Project required three time extensions to complete the planned activities; and, (iii) some of the capital created by the Project, e.g. TRCs or SATCOM centres,
19

could not provide benefits within the Project due to their late construction, even if one might anticipate future benefits from these investments.
3.4 Justification of Overall Outcome Rating Rating: Moderately Satisfactory
74. Based on the assessment of the Project’s relevance, efficacy and efficiency, the ICRR can
justify an overall outcome rating of ‘moderately satisfactory’. The ICRR considered the relevance of objectives as ‘high’ and the relevance of design and implementation as ‘substantial’. The combined rating for relevance (objectives and design) is rounded downwards to ‘substantial’. The efficacy rating – achievement of PDOs – is considered as ‘substantial’ as the Project achieved most of the intended outcomes (see Table 1) as per the PAD indicators and contributed to other PDO-relevant areas of progress, even when controlling for data and attribution challenges and when considering that further progress could be made. Efficiency was considered as ‘modest’ as explained in the previous section. Combining these ratings, as per IEG guidelines, led to a ‘moderately satisfactory’ rating. In short, it is judged that the Project, all points considered, had moderate shortcomings in the achievement of its pre-defined objectives, its relevance today and its efficiency.
3.5 Overarching Themes, Other Outcomes and Impacts (a) Poverty Impacts, Gender Aspects, and Social Development
75. The Project design did not explicitly aim at impacting poverty, gender and social
development in its official indicators. However, the PDO aimed at improvement of the effectiveness of service delivery by GPs particularly with respect to the management of public resources and the delivery of relevant services that the rural people decide and prioritize. Also, it was found that, as noted above, there was a 32.7% increase of women participants and a 20.6% increase in SC/ST household members in Gram Sabhas of the Project GPs between 2006-07 to 2011-12, which suggests some gains in respects to gender and social development although the impacts of their participation on GP prioritization and outcomes was not measured. There was no measurement of poverty reduction as a result of the Project.
(b) Institutional Change/Strengthening
These aspects are already captured above, given the institutional strengthening aspects of the Project.
(c) Other Unintended Outcomes and Impacts (positive or negative) Not applicable.
3.6 Summary of Findings of Beneficiary Survey and/or Stakeholder Workshops
76. There are important lessons in the Government of Karnataka “Impact Evaluation Study” for future operations both within the state and for other Indian states. The study reiterated that the broader objective of the Gram Swaraj Project was to strengthen the Gram Panchayats. The block grants over the past six years have enhanced the capacity of the GPs in meeting the development needs and priorities; the funding was untied and reliable. The investments under the Project have created a model in local governance through its transparent (tender system), accountable and participatory processes. The assets built have raised the satisfaction levels of the
20

local citizens with the Panchayats - in sectors where the KGSP invested - thus making GPs more responsible and responsive. The various awareness campaigns and other project initiatives have contributed to a large extent in making residents aware of the importance of Gram and Ward Sabhas. The soft component of the KGSP covered the entire Karnataka leading to the enhancement of the capacity of stakeholders not only in the 39 most backward Taluks but also of the rest of the State. The KGSP has also created permanent infrastructure in the form of Samarthya Soudhas (capacity-building centres/TRCs) and SATCOM sub-centres. See Annex 5.
4. Assessment of Risk to Development Outcome
Rating: Substantial
77. There are various reasons to be optimistic about the prospects of maintaining the Project’s development outcomes, in particular in the shorter term. The government and implementing agencies have shown general commitment towards the Project. During the course of the Project, various aspects of risk identified have been mitigated, to some degree, by measures that were institutionalized. For instance, the eligibility criteria for BG were modified and the institutionalization of the new financial management system has increased the likelihood of sustained gains in these areas. There are also reasons to judge that a number of the gains will be maintained and not reversed, especially as a number of post-operational steps have already been undertaken, namely through GoK’s commitment to a follow-on project (see Section 2.5).
78. However, if some future remedial steps are not undertaken, there are some areas of risk over the medium term. Five main risks have been identified and assessed for their likelihood and potential impact:
(i) There is a risk that the BG model, without some modification, may be less relevant if the total size of untied transfers is not comparable to the large amount of tied resources available via other schemes. As noted, the emergence of schemes – such as MGNREGS – has dwarfed the relative amount available via block grants, even if evaluations suggest that the BG model has retained its importance as gap-filler and provider of good quality assets.45
(ii) There is a risk that GP gains – in terms of their ability to deliver and maintain services – would not continue in the absence of continued and tailored capacity development support. Capacity building activities would need to be continued and strengthened to ensure continued progress.
(iii) There is a risk that the occurrence and quality of Gram Sabhas could decline if the planning process for BGs, and other schemes, does not clearly incentivize continued participation. This means that strengthened interventions and attention would be needed to ensure that the planning processes are straightforward, responsive to bottom-up preferences and flexible enough to allow for the integration of changing preferences.
(iv) There is a risk that more marginal groups would not sustain and increase their participation in the GS without top-down measures to ensure that weaker groups’ voices are fully heard. While excluded group participation increased during the Project lifetime, assessments in Karnataka point to how important it is that such groups are provided with capacity support and top-down facilitation to ensure they have a fair say over planning outcomes.46
79. In overall terms, the risk is broadly judged to be substantial, although this level of risk
could be notably reduced if remedial actions are taken. The rating recognizes that a number of the gains made under the intermediate indicators are likely to be maintained. However, there
45GoK Impact Evaluation Report, 2013; Documentation of Gram Swaraj Project by IMaCS 46 Ananthpur, Kripa and Malik, Kabir and Rao, Vijayendra, The Anatomy of Failure: An Ethnography of a Randomized Trial to Deepen Democracy in Rural India (June 1, 2014). World Bank Policy Research Working Paper No. 6958
21

are certain risks, as noted above, which are substantial when one balances the likelihood of them materializing against their potential impact over the medium term. These risks could be mitigated to some degree with the effective design and implementation of a follow-on project.
5. Assessment of Bank and Borrower Performance 5.1 Bank Performance (a) Bank Performance in Ensuring Quality at Entry Rating: Moderately Unsatisfactory
80. There were key strengths in ensuring quality at entry. The Project emerged from a long term
engagement between the Bank and the Government of Karnataka, and the design was informed by robust analytical work and lesson learning. The objectives were and remain highly relevant to development priorities in Karnataka and India more broadly, as noted above. Furthermore, the operational design was arguably simple, realistic and flexible enough to integrate learnings early on during Project implementation. The combination of a programmatic approach towards block grants and a traditional investment lending for capacity building balanced the creation of assets with institutional strengthening, the facilitation of more participatory planning and the creation of demand for adequate capacity at the taluk level in the form of TRCs and communication facilities. In addition, the BG eligibility criteria and fiduciary framework was relatively well designed, and the risk management framework was relatively robust delineating the risk management measures for each component. The Project design also envisaged a strong evaluation strategy and end-of-project survey, though there were some flaws in its implementation as flagged in this report. Overall, this broad design – in spite of course corrections (described in the next paragraph) – proved to be largely appropriate which is also evidenced by the final project results.
81. However, there were design limitations, particularly regarding disbursement procedures for block grants and missing baselines in the result framework. The initial Project design proved somewhat ambitious for a first-generation project given the existing levels of capacity at the GP level. In particular, the disbursement procedures for the block grants required adjustments. Similarly, baselines were not determined for all results indicators at the beginning of the Project in 2006, which could be judged as a major design flaw. Given that these design limitations adversely affected the initial years of the project, it is judged that, overall, Bank performance for quality at entry is ‘moderately unsatisfactory’.
(b) Quality of Supervision Rating: Moderately Satisfactory
82. The quality of supervision is rated ‘moderately satisfactory’ reflecting the successful efforts
to concertedly address initial implementation challenges and ensure achievement of Project objectives. Overall, the Project was closely supervised despite two changes in task team leadership. Documentation and field support was, overall, strong. Eleven supervision missions were conducted over seven years with intensifying efforts following the mid-term review (MTR). The initial implementation challenges were properly identified during supervision missions, as reflected by the temporary ‘moderately unsatisfactory’ ratings of the Project and identification of the problems in the ISRs. Corrective actions were subsequently taken to improve implementation, for instance by adjusting the disbursement procedures for the block grants.
83. The project was restructured three times, demonstrating the Bank’s proactivity to respond to client demand and adjust to unforeseen developments such as the allocation of the
22

additional foreign exchange gains. However, stronger measures could have been taken to revise and strengthen the initial results framework and related Project monitoring and evaluation arrangements at an earlier stage of implementation. Nonetheless, with the active and visible implementation support, particularly in the final years, the Project was fully disbursed and achieved visible results on most PDO indicators. The Bank team also supported the impact evaluation with an end-of-project survey, which helped provide pointers for a possible future intervention. Overall, the quality of Bank supervision is therefore considered “moderately satisfactory”.
(c) Justification of Rating for Overall Bank Performance
Rating: Moderately Satisfactory
84. This rating of ‘moderately satisfactory’ is based on combining the rating from (a) and (b) above, as per ICRR guidelines.47 Overall, this recognizes the design flaws in the project, but balances this with the design strengths and the relatively responsive supervision; all of which made a contribution to full disbursement and the achievement of project results (as outlined in section 3).
5.2 Borrower Performance (a) Government Performance
Rating: Moderately Satisfactory
85. Government performance is rated as ‘moderately satisfactory’, which balances the challenges experienced in Project management during the initial years with the strong performance after the MTR. During the initial years of the Project, Government performance was affected by changes in the political leadership of the state which temporarily reduced the attention accorded to decentralization and the Project relative to other priorities. However, despite these changes, basic Government support to the Project was maintained during the earlier years, and this was reinforced in the later years of the Project. With close monitoring by senior officials in the Government, the credit could be closed successfully with all major Project activities being completed, a number of results achieved and almost 100 percent disbursement. The Government has reiterated its strong commitment to the decentralization approach with its request for a new loan from the Bank.
(b) Implementing Agency or Agencies Performance Rating: Moderately Satisfactory
86. The performance of the implementing agency is also rated ‘moderately satisfactory’
reflecting implementation challenges in the early years that were subsequently effectively addressed. The implementing agency (the Project Facilitation Cell/Project Management Unit)
47 As IEG guidance stipulates, ‘when the rating for one dimension is in the satisfactory range (Moderately Satisfactory or better) while the rating for the other dimension is in the unsatisfactory range, the rating for overall Bank Performance normally depends on the Outcome rating. Thus, overall Bank Performance is rated Moderately Satisfactory IF Outcome is rated in the satisfactory range or Moderately Unsatisfactory IF Outcome is rated in the unsatisfactory range, except when Bank performance did not significantly affect the particular outcome’. It is therefore judged that a combined MS rating is correct in this instance.
23

was under the purview of the State Government itself. Its performance is therefore examined in a similar context to the performance of the Government. Frequent turnovers in Project leadership affected Project performance over the initial 2-3 years resulting in delays in implementation. However, the performance improved considerably thereafter. The MTR noted that a new team had ‘energetically taken up the task of improving Project performance’. By the time of credit closing (March 2014), the performance of the implementing agency, which allowed the completion of Project activities and full disbursement, was recognized by the last Bank mission.48 The overall rating of Implementing Agencies’ performance is therefore assessed as ‘moderately satisfactory.’
(c) Justification of Rating for Overall Borrower Performance Rating: Moderately Satisfactory
87. The overall Borrower performance is rated ‘moderately satisfactory’ based on the
combination of Government performance and Implementing Agencies’ performance throughout the Project. As outlined above, both the Government and the Implementing Agencies experienced implementation challenges in the initial years of Project implementation which were subsequently addressed through strong commitment especially following the MTR. In the end, the Project showed visible results and disbursed fully, due in large part to the actions of the government and implementing agency.
6. Lessons Learned
88. Strong, top-down state commitment and action is critical to the success of decentralization and this “block grants plus capacity building” approach. The variation of support to the Project due to changes in the political and executive machinery had an impact on Project performance at specific junctures. This underlines the need to fully understand the political economy of decentralization and to find measures to mitigate such risks. It also underlines the importance of ensuring a strong policy framework and enabling environment for decentralization in parallel to bottom-up and local strengthening. The DAC was one important step in this regard, although it would require further strengthening in order to ensure greater influence on the thinking of the state on such matters. Similar lessons, regarding the critical importance of top-down state support for decentralization, have been learnt in other states in India and in international experience.
89. The approach of discretionary block grants complemented by capacity building has proved its potential, even if it may require modification to continue having strong impacts. It has contributed to the improved management and citizen-centered prioritization of resource allocation at the GP level. The KGSP was one of the Bank’s first local government strengthening projects that shifted away from sectoral projects on the one hand, and from community-driven development projects, on the other. However, given the risk that BGs may be dwarfed by other existing schemes in India, the BG model may need to be modified so that it serves as a more direct vehicle and incentive for convergence with existing schemes; so that it continues to add
48 To utilize the additional amount that had accrued to the Project due to exchange rate fluctuation, the Project proposed the procurement of 5629 computers for all GPs of the state. As the total estimated cost of 5629 computers with peripherals was more than USD 2 million, it was decided to opt for International Competitive Bidding. In spite of capacity constraints of the client to handle such a large procurement process, the client took this as a challenge and successfully managed to award the bid in a record time of 20 days.
24

value by filling critical gaps and contributing to broader development outcomes; and, so that it continues to catalyze critical institutional change.
90. It is critical that the M&E and management information system of decentralization projects
are more robust and well thought through, even if this is challenging for this type of project. This lesson has a number of key interrelated points. First, a robust baseline and impact evaluation framework would be required. The absence of a baseline in certain areas during the initial stages of the Project posed challenges for measuring progress. Second, the key PDO and intermediate indicators would need significant thought to ensure that they are capturing the most important elements of resource management, service delivery, participation and inclusion, as some indicators were too vague in the Project.49 Third, in future projects it would be important to adopt PDO indicators that are further down the results chain, in order to consider impacts, where feasible, on service delivery, social and human development outcomes. Finally, a flexible and responsive management information system, to regularly track results on the ground and facilitate course corrections, was lacking in this Project and could be adopted in future projects.50
91. It is important to have a performance assessment system that has good enough standards of accountability but that is also realistically tailored to the existing capacities of GPs in the ‘backward’ areas. KGSP established performance indicators for measuring the annual performance of the ‘Most Backward GPs’ covered under the Project. However during the initial stages of the Project most of the GPs lacked the necessary capacities to adhere to the standards, in addition to limited skills to compile relevant information, which hindered uptake. Therefore, future projects should have a simple system driven by certain Minimum Mandatory Conditions and intermediate indicators which are dynamic in line with the improving capacities of the GPs. On the other hand, such performance standards would need to be demanding enough to provide incentives for institutional transformation and would need to ensure process monitoring to confirm that such standards are being implemented throughout.51 This could be approached by using base-level grants – which require minimum conditions – and an additional performance grant that is added when certain standards and outcomes are achieved.
92. Capacity building efforts would need to be better tailored and more appropriately targeted and rolled out if the full potential of the block grant system is to be realized. There is a risk that GP gains – in terms of their ability to deliver and maintain services – would not be sustained in the absence of continued and tailored capacity development support. In addition, such support could be better targeted and tailored so that a range of groups beyond GP functionaries – such as community based organizations, facilitators, excluded groups and elected representatives52 – also receive appropriate forms of capacity strengthening. It would be helpful if a strong capacity needs and gaps assessment was carried out prior to developing subsequent capacity development plans. The capacity strengthening could be dynamic and field-based to increase the chances of its application in real-life circumstances. The Project also illustrated the large, and often unmet,
49 During the course of the Project, there was limited capture of information at the GP level on the extent and quality of participation (attendance levels, inclusion of women, vulnerable groups, etc.) and also the causal chain to good planning and budgeting practice. 50 Strengthening M&E systems also points to a need to review the Project management and delivery structures to ensure better responsiveness and monitoring. In KGSP, there was no direct field presence of the Project team in the districts. Disbursement to GPs and monitoring had to be managed centrally from the Project Facilitation Cell. While the staffing of TRC assisted in this, it also diverted them from their core task of capacity building to a monitoring role. 51 This could be achieved for instance by developing, from the Karnataka Panchayat Raj Act, and periodic Government Orders, a set of simply measurable indicators that are tracked regularly. A composite index can be devised thereon – this can help determine a base level grant, and further, an additional performance component as top-up for better performers on the State’s own parameters. Over the years, the threshold could be very gradually raised. This approach could hard-wire monitoring and evaluation to some of the core decentralization indicators, apart from serving the need for Project management. 52Empirical Impact Evaluation Study on Karnataka Panchayats Strengthening Project (Gram Swaraj), CMSR, March 2014.
25

demand for ‘just-in-time’ technical support, handholding and trouble-shooting to GPs and other stakeholders to carry out their functions. 53 These issues could be addressed in the planned follow-up project.
93. It is important to ensure that the GP plans and their implementation sufficiently reflect changing constituent preferences and the interests of the more excluded groups. This could be achieved through a number of measures, including the following: ensuring that the planning process is periodically updated to reflect changing preferences; providing top-down support, facilitation and monitoring to ensure that the plans are sufficiently representative and participatory; and, providing targeted capacity support to typically marginalized groups. In a number of cases, it has been found that if such a planning process is not robust and inclusive, the incentives for people to participate in the Gram Sabha are likely to decline over time.
94. Improved information and education campaigns could contribute to the strengthening of
the GP planning, resource management and delivery. The Project made some gains in improving levels of awareness, but it might have gone further. A more extensive and multi-channel information campaign – to inform actors of their duties and entitlements – could potentially change behaviors and improve the usage and implementation of the BGs.
7. Comments on Issues Raised by Borrower/Implementing Agencies/Partners (a) Borrower/implementing agencies: Not applicable (b) Cofinanciers: Not applicable (c) Other partners and stakeholders: Not applicable
53 The Project experience suggests that it is necessary to provide continuous training and trouble-shooting for the relatively novice local government functionaries in their participatory planning exercises, prioritization of their schemes, in the procurement process, and in maintaining quality during scheme implementation. Under the KGSP such handholding seemed to be limited, and a follow up project should support more regular technical support and training, cascading from the district through the Taluks to the GP-level. This points to two considerations for future: (1) the strategy for delivering capacity support needs to be dependent on more than a singular channel; and, (2) should be designed to respond more swiftly to day-to-day demands and needs. This also means that a mix of public, private and non-governmental institutions could be deployed to provide different types of support.
26

Annex 1. Project Costs and Financing
(a) Project Cost by Component (in USD Million equivalent)
Project Cost by Component
Local
Foreign
Total
A. Block Grants 113.33 113.33 B. Capacity Building & Information
Systems for constituents
1.4 0.03 1.43
C. Capacity Building at Panchayat Level 14.97 14.97 D. Capacity Building and State Level 3.0 3.0
Total Baseline Cost 132.70 0.03 132.73
Physical Contingencies 0.1 0.1 Price Contingencies 0.5 0.5 Total Project Costs
Interest during construction 133.30 0.03 133.33
Front End Fee
Total Financing Required
133.30
0.03
133.33
(b) Financing
Source of Funds Type of Cofinancing
Appraisal Estimate
(USD millions)
Actual/Latest Estimate
(USD millions)
Percentage of Appraisal
Borrower 13.33 13.33 100.00 Local Communities 0.00 0.00 .00 International Development Association (IDA) 120.00 120.00 100.00
27

Annex 2. Outputs by Component Component A: Block Grants to Gram Panchayats Activity Outputs at Project Close (31 March 2014)
Disbursement of Block Grants to 1341 GPs for taking up works as per their prioritized needs
• 1341 Most Backward GPs developed 5 year perspective plans and annual plans based on priorities of the community members
• Decentralization Analysis Cell (DAC) developed formula for disbursement of Block Grants
• Achieved 100% disbursement of the Block Grants to 1341 Most Backward GPs as per the formula developed by DAC
• Creation of Assets - 25,212 roads, 8,029 drainage lines, 1,652 community toilets, 2,947 drinking water facilities, 1,537 Anganwadi Buildings and a number of other assets were developed in the 1,341 Most Backward GPs
Component B: Information Systems for Constituents Activity Outputs at Project Close (31 March 2014)
Information to constituents on roles and responsibilities of GPs and on service delivery performance at the village level
• Organized ‘Kalajathas’ (Information Campaigns) at GP level to educate constituents about functions of Panchayats, roles and responsibilities of GP functionaries etc.
• Panchtantra was rolled out in all 5,629 GPs in the state which provided constituents with access to budget information, expenditure status, tracking status of applications & grievances through the web based portal
• Project GPs regularly displays information about procurement decisions, details of various works undertaken including cost incurred
Capacity building of organizations of the poor
• Trained 25,973 SHG members about their role in GP governance
Component C: Building the capacity of Panchayats Activity Outputs at Project Close (31 March 2014) Creation of GP resource cells at the Taluk level
• Constructed 172 Taluk Resource Centers
Service delivery monitoring system
• Baseline survey was conducted in 2009 • ANSSIRD brought out a variety of charts, wall newspapers and posters
on various aspects of service delivery, poverty alleviation and development for dissemination to all gram Panchayats
• ANSSIRD developed a series of short films on the following aspects:
CC Road 44%
Drainage 17%
CC Road with Drainage
5%
Compound Wall 4%
IEC 5%
Construction of Toilet
4%
Anganwadi Building
3%
Construction of GP Building
2% Other Works 16%
Works Funded by Gram Swaraj Project
28

Activity Outputs at Project Close (31 March 2014) o Panchayat raj, poverty alleviation & food security – inter-linkages
between income, work, food, nutrition, health, HIV. o Feminization of poverty – caste, gender and bonded labor o Vulnerable groups in agriculture o Poverty alleviation, credit and access to resources
• End line survey was conducted in 2014
Training programs for Panchayats through the State Institute of Rural Development
• ANSSIRD developed training modules and trained: o 10,835 GP Presidents, Secretaries, Eos, Account Superintendents
& PEO of TP, Team leader of CAs and Accounts Experts on various aspects of Gram Panchayats (functions, roles and responsibilities, development of plans, accounting and financial management)
o 13,502 Bill Collectors & GP staff on collection of fees and taxes o 57,956 Anganwadi Workers and GP Presidents on improving
health service delivery mechanism o 54,852 Anganwadi Workers and Health Assistants in Community
Management System
Computerized financial management system for GPs
• ‘Panchtantra’ the computerized financial management software was rolled out in all 5,629 GPs in the state
• All 5,629 GPs adopted Improved Financial Management and Accounting Systems
• Trained about 10,000 officials on ‘Panchtantra’
Environmental Guidelines for Panchayats
• Environmental Management Framework was developed and established in all 5,629 Panchayats in the state
• ANSSIRD trained 16,769 Environmental Coordinators, GP President, Vice president, Secretary, JEs, SHG members on Environmental Frameworks
Component D: Building the Capacity of the State. Activity Outputs at Project Close (31 March 2014)
Decentralization Analysis Cell (DAC)
• Decentralization Analysis Cell (DAC) established and functional in the state
• Produced reports on o An Assessment Study on “Effective Implementation of Gram
Swaraj Project in Selected Taluks” o “A Comparative Study on Revenue Envelope of Gram
Panchayats in Udupi and Gulbarga Districts”. o A Study on the “Outcome Indicators of Gram Swaraj Project in
selected Taluks of Gram Swaraj Project Area”. o A Study on “Tribal Population in Gram Swaraj Project Area-
Their Inclusion and Fiscal Devolution in Panchayat Raj Institutions”.
Panchayat monitoring system at state level
• Decentralization Analysis Cell (DAC) established a system for collection, compilation and analysis of Fiscal Data
Policy support
• Decentralization Analysis Cell (DAC) carried out policy level studies on: o “Understanding Determinants of Own Source Revenue
Mobilization Monitoring Compliances) in Karnataka's Gram Panchayats"
o "Documentation of Best Practices adopted by Gram Panchayats in Karnataka"
o “Review of Gram Swaraj Project in Koppal District of Karnataka" Some Policy Perspectives
29

Strengthening of the State Institute for Rural Development.
• Established 5 SATCOM Centres (in Bangalore, Davanagere, Dharwad, Gulbarga and Mangalore) for satellite based delivery of training programme
• Project assisted upgrading of ANSSIRD facilities
30

Annex 3. Economic and Financial Analysis (including assumptions in the analysis)
The Project, during appraisal, did not carry out any quantitative analysis but listed and discussed a set of expectations and outcomes derived from the Project design and objectives. The ICRR examined the current status of these expected outcomes in context of available data and Project implementation experience. COST-BENEFIT ANALYSIS
Panchayats will spend on provision of basic services at the village level, including for drinking water, sanitation, water reservoirs for domestic animals and micro-irrigation, upgrading schools and health clinics, street lighting, local libraries, scholarships for the disadvantaged, common land management, and others.
The portfolio of projects taken up is different. But the block grant would have been used for gap-filling and hence the re-prioritization, e.g. Jal Nirmal is investing in water in most of these Taluks.
Panchayat expenditure will be more efficient than state and central government expenditure
We do not have any comparator studies/data for this.
Karnataka performs better than others in rural service delivery
Locally financed village level infrastructure costs much less than infrastructure financed through line agencies, but is of the same quality
We do not have any comparator studies/data for this.
The Project would increase resources for the poorest and neediest jurisdictions where the cost effectiveness and/or returns to the marginal investment are likely to be higher
By focusing on the most backward Taluks, the Project increased resources for the poorest and neediest jurisdictions.
The proposed Project would improve the quality of expenditures - larger proportion of budgeted amounts become actual investments.
With the tendering process of procurement and a moderately transparent system, reported absence of leakage; this should be true. How do we put this?
Equalizing formula for grant allocation devised by Project will accommodate population and area needs rather than a lump sum grant.
This was done
The Project will help GoK move to an improved formula of grant allocation bettering the lump sum grant allocation method.
Need to know GoK's ATR for TSFC recommendations.
The SFC (3rd) and GoK would move to an improved formula for allocating untied funds to GP.
The indicators selected by the TSFC are Population, Area, SC&ST Population, Illiterates, Population per Hospital Bed and Density of Population. Among these indicators, population index is given the highest weight of 40 percent followed by area with 20 percent weight and remaining 40 percent is divided equally among the other four indicators
This would help financial sustainability of GPs. Not clear whether GoK accepted this, as the SSFC also had similar indicators, which due to paucity of data led to GoK using a fixed amount per GP.
31

State flows to panchayats would increase three fold (State flows to Panchayats, presently are about 0.8% of government revenues), from about US$ 32 million per year (86 cents per capita) to about US$ 84 (nominal) million per year (2 dollars per capita) after 5 years (about 1.18% of projected government revenues).
Grant-in-aid to Panchayats (4,449 GPs) increased from INR 7,870 Million in FY 2006 to INR 32,350 Million by FY 2010 (4 years), a factor of 4. The data has anomalies and is in excess of GoK estimates.
Government revenues are expected to increase by about 40% in nominal terms. Assuming that the vertical share of GPs would increase at the same rate as the vertical urban share the block grant transfers for GPs would amount to about US$ 60 million per year after 5 years.
At currency valuation used in the PAD, the grants-in-aid to GPs amount to USD 716 Million in FY 2010.
The allocations to the less poor Panchayats would remain constant in nominal terms (500,000 rupees per year) and would thus decline in real terms
Not clear why this was used. But owing to GoK grants-in-aid being a fixed amount per GP, it would have declined in real terms.
Funds would be made available through transfer and consolidation of schemes into the transfer system
Consolidation of schemes not done.
Other (not specified) The own source of revenue of the Gram Panchayats have improved by more than 50 percent between 2005-06 to 2008-09. This increase has taken place across all the districts in the states and different categories of Taluks. However, the percentage of own source of revenue to total funds available with the gram panchayats shows a decreasing trend.
The KGSP PAD does not have any rigorous economic analysis. Instead it has a set of expectations derived from Project objectives. The ICRR team examined the current status of these expected outcomes in the light of data available.
32

Annex 4. Bank Lending and Implementation Support/Supervision Processes
(a) Task Team members
Names Title Unit Lending Dhimant Jayendraray Baxi Sr. Procurement Spec. SARPS Geeta Sethi Special Adviser CCGVP Luis F. Constantino Country Manager EACDF-DIV Paul Jonathan Martin Sector Leader AFTSN Ranjit Nayak Lead Social Development Specialist ECSSO Sarita Rana Senior Program Assistant SASDO Yoshiko Masuyama Program Assistant SASDO
Supervision/ICR
A.K.Kalesh Kumar Programs and Capacity Building Coordinator GGODR
Abdu Muwonge Senior Economist GURDR Anand Mathew Consultant GURDR Ashish Bhateja Senior Procurement Specialist OPSOR Atul Pokharel E T Consultant SASDS Basel Al-Bishtawi Consultant SASGP Christiane Frischmuth Consultant WBCKO Farah Zahir Sr. Economist GGODR Geeta Sethi Special Adviser GCCVP Jeffrey S. Hammer Consultant DECRS Kalyani Kandula Consultant GGODR Krishnamurthy Sankaranarayanan Sr. Financial Management Specialist GGODR Manoj Jain Lead Financial Management Specialist GGODR Martin Serrano Sr. Counsel LEGES Mohan Nagarajan Sr. Economist GGODR Neil Buddy Shah Consultant GGODR Parimal Manmohan Sadaphal Consultant GENDR Paul Jonathan Martin Sector Leader AFCW3 Prasad C. Mohan Lead IEC Specialist AFTDE Priti Kumar Sr. Environment Specialist GAGDR Rama Krishnan Venkateswaran Lead Financial Management Specialist GGODR Ramachandran R. Mohan Senior Social Development Specialist SASDS Rinku Murgai Lead Poverty Specialist GPVDR Roy W. Bahl Consultant GMFDR Ruma Tavorath Sr. Environment Specialist GENDR Sally Wallace Consultant GURDR Sapna John Program Assistant SACIN Satyanarayan Panda Procurement Specialist GGODR Stuti Khemani Senior Economist DECHD Sujata Jayant Pradhan Program Assistant SASDO Vidya Kamath Program Assistant SACIN Yongmei Zhou Manager GCFDR Yoshiko Maruyama Program Assistant ECRJP
33

(b) Staff Time and Cost
Stage of Project Cycle
Staff Time and Cost (Bank Budget Only)
No. of staff weeks USD Thousands
(including travel and consultant costs)
Lending FY04 23.44 152.73 FY05 52.89 292.92 FY06 25.15 144.59
Total: 101.48 590.24 Supervision/ICR
FY07 32.52 219.49 FY08 27.02 290.77 FY09 27.45 201.60 FY10 31.41 233.59 FY11 12.41 98.23 FY12 6.78 52.19 FY13 22.68 71.78
FY14 23.79 136.08 Total: 184.06 1303.73
34

Annex 5. Beneficiary Survey Results
This annex contains the executive summary of (1) Impact evaluation study of the KGSP, and, (2) the observations and recommendations from the documentation of KGSP, both produced in 2014.
A. GOVERNMENT OF KARNATAKA’s EMPIRICAL IMPACT EVALUATION STUDY ON KARNATAKA GRAM SWARAJ PROJECT, MARCH 2014 58 Executive Summary THE CONTEXT
Karnataka occupies a unique position in the country with respect to democratic decentralization. The State has an enviable track record of devolution of powers to the Panchayati Raj Institutions (PRIs) as envisioned by the Constitution of India. Local governance in the State has taken off, propelled by regular elections and steady headway made by the Gram Panchayats (GPs) towards delivering basic services to citizens. Despite the rapid strides, the local administration is still constrained by insufficient resources to address the growing demands for more and better services.
In order to make GPs stronger and more vibrant and viable institutions of local self-governance, a critical policy imperative is to provide them with additional resources and also encourage them to raise resources that are commensurate with their requirements and enhance their capacity to utilize the resources. Resources utilized towards services that are prioritized locally would lead to greater satisfaction among the local population.
THE ENDLINE EVALUATION
This end-of-project study evaluates the KGSP Project interventions. The Project conducted a baseline survey in 2009. This end line survey follows the same methodology as the baseline in terms of sample locations and respondent categories. The baseline was conducted in 100 GPs consisting of 50 treatment or Project GPs and 50 control or non-Project GPs. The sample GPs represent 19 districts and 68 Taluks (38 Treatment and 33 Control).
BASELINE ENDLINE
Districts 19 (15 TC + 4 C) 19 (15 TC + 4 C)
Taluks 68 (38 T + 33 C) 68 (38 T + 33 C)
Gram Panchayats 98 (49 treatment+49 control) 98 (49 treatment+49 control)
Villages/habitations 191 (96 treatment+95 control) 191 (96 treatment+95 control)
Sample households 3,119 (40 per GP; 20 per village) 3,119 (40 per GP; 20 per village)
Gram Panchayat Members 502 (6 per Gram Panchayat) (256 treatment + 246 control)
549 (6 per Gram Panchayat) (278 treatment + 271 control)
Gram Panchayat Secretaries 87 (1 per Gram Panchayat) 45 treatment+42 control GPs
87 (1 per Gram Panchayat) 45 treatment+42 control GPs
FGDs 100 (1 per Gram Panchayat) 100 (1 per Gram Panchayat)
Gram Panchayats for asset survey Survey not done in baseline 56 (40 treatment+16 control)
T: Treatment; C: Control
35

The end line evaluation comprises five components: (1) Household survey (2) GP Member Survey (3) GP Secretary Survey (4) GP assets survey (5) PRA (Participatory Rural Appraisal). The assets survey is exclusive to the final evaluation as such a survey was not conducted in the baseline (the table below summarises the sampling design).
HIGHER INVESTMENTS BY GPs TO IMPROVE SOCIAL INDICATORS
• The untied block grants have improved the investment capacity of the Project GPs. The funding has been provided for the past seven years - from 2006-07 to 2012-13. During the Project period each treatment GP received an annual average funding ranging from Rs 6 lakh to Rs 9 lakh.
• The block grants constituted some 9% of the total annual GP finances during the Project period. The proportion is substantial given that the funds are untied and reliable.
• The overall GP budget in general has risen over the years across the treatment and the control GPs. Increasing own-source revenue and scheme-based funding are crucial contributory factors in this respect.
• The mean annual budgetary levels have increased from around Rs 20 lakh in 2006-07 to more than Rs 70 lakh in 2012-13. The upward trajectory of treatment GPs during the KGSP period is accounted for largely by the block grants and internal revenue.
• The KGSP is distinctive as its funding being discretionary and the total grants have been invested in assets and services that enhance human development; in relative terms, the Project invested the highest proportion of funding in meeting community priorities – making it stand out from similar schemes such as NREGA and BRGF whose primary objectives are different.
GRADUAL INCREASE IN OWN-SOURCE REVENUE (OSR) OF GPs
• The own-source revenue (OSR) has been on the rise across the intervention and the non-intervention GPs. But the OSR of Project GPs has grown faster during the Project period. Mean revenues of Project GPs from OSR has raised from Rs 2.40 lakh to Rs 3.78; corresponding figures for control GPs are: Rs 1.62 lakh and Rs 3.54 respectively.
• Household survey covered two important sources: property tax and water tax covering two reference periods: (1) taxes paid in the past 12 months (2) taxes paid in the 12 months before the last GP elections. In the previous financial year, the proportion of households paying house tax in the Project GPs is higher than that of the control GPs. Similarly the percentage of households paying water charges has also raised in the Project GPs to a level that is higher than that of the control GPs.
• During the other reference period too, treatment GPs had done better regarding both house tax and water charges: in the end line the Project GPs have outperformed their control counterparts by 7% with respect to property tax. When it comes to water charges as well, in the end line, the proportion of water tax-paying households in treatment GPs is higher by 5%.
• In treatment group around three-fourths of GP Members participate in tax collection whereas the corresponding figure for the control GPs is less than two-thirds.
• Findings from the GP Secretary component evidence that a higher proportion of treatment Secretaries reported in favour of indicators such as: extent of collection of taxes; participation of ward members in tax collection; share or importance of own-source revenue; and levels of annual budget handled by GPs.
• FGDs (Focus Group Discussions) with stakeholders reveal that the tax compliance is better in
36

treatment GPs on account of the efforts on the part of GP officials and Members in motivating citizens; training interventions have improved their awareness levels in this regard. The quality assets built under the Project over the past 6-7 years reflecting people’s preferences have also made a difference.
• Secondary data reveals that during the Project period the OSR collection of Project GPs - as a proportion of the current demand - had entered a higher trajectory indicating an improved performance. Regarding per capita OSR, around the launch of the Gram Swaraj Project, the per capita revenue of treatment and control GPs hovered around the same level (Rs 25). From 2007-08 – after the launch of the KGSP – the per capita fiscal performance of the Project GPs entered a higher trajectory.
PARTICIPATORY PLANS REFLECTING COMMUNITY PREFERENCES
• The Project GPs prepared action plans for the Gram Swaraj works through participatory processes. The finalisation of action plans was preceded by Ward Sabhas to identify works at that level. Stakeholder surveys collected evidence with regard to the main problems faced by the community; this is used to ascertain whether the perspective plans reflect the people’s preferences. Problems reported by stakeholders in order of priority are: (1) Water (2) Roads (3) Drainages (4) Toilets and Sanitation (5) Electricity (6) Health Care (7) Transport (8) Housing.
• Perspective plans, in large measure, contain the community priorities. This is also reflected in the investments made in the infrastructure. The bulk of the block grants (71%) have been invested in assets that address the top four problems stated above; the corresponding proportions of similar schemes are much lower – NREGA (19%) and BRGF (15%). Water sector, however, should have received better attention under the KGSP.
• But the community has welcomed every asset built in their village. The stakeholders found every asset useful and reported that the assets meet their needs and priorities. Given the huge gap that exists between supply and demand every asset/service is considered as a vital addition.
• Water supply systems have been built under the KGSP in all GPs. But water remains a high priority. The following points emerge from FGDs with stakeholders: (1) In addition to water the community also identified other needs and priorities. The Project was expected to meet their needs in all important sectors. (2) If the Project had focused only on water supply it would have become a water supply scheme (3) A typical GP consists of at least 5-6 villages. The Project had to spread the investments across the constituent villages to achieve equity. This would not have been possible if the Project had focused only on one or two sectors.
• Given the number of villages in a GP the Project GPs had to balance the competing priorities and demands (5) Water is a chronic problem with geographical, social, environmental and public policy causes as well as implications. (6) There are other schemes or projects that exclusively focus on water supply.
• A comparison of problem ranking by stakeholders between the baseline and the end line shows that certain sectors witnessed visible improvements while others remain under-addressed. The sectors that have seen greater improvements are: (1) Roads (2) Sanitation (3) Electricity (4) Housing. The areas that need better policy attention are: (1) Water (2) Schools and Anganwadis (3) Drainages (4) Streetlights. The extent of inclusion of community priorities in an action plan also hinges on how representative the Gram Sabhas and Ward Sabhas are in terms of both the level of attendance and social composition of the participants.
INCREASED NUMBER OF ASSETS BUILT IN THE GP
• There has been a visible increase in the number of assets built across the treatment and the control
37

GPs. In the treatment GPs, the Gram Swaraj Project has made a visible impact in the number of assets built over the past 7 years (from 2006-07 to 2012-13).The number of assets built by a typical GP in a year with block grants ranges from TWO to as many as SIXTEEN. The average number of assets built per year falls in 3-to-11 range.
• The KGSP also ensured both spatial and social distribution by spreading the assets most equitably ensuring quality through an open tender system. The range of assets reflects the level of fulfilment of local needs covering almost all social sectors. The assets include: (1) CC roads (2) BT roads (3) Formation or kutcha or metalled roads (4) Water tank/cistern (mini water supply system) (5) Boundary walls, usually with gates, around structures such as schools, GP buildings, health centres and anganwadis (6) Street lighting/solar lamps (7) Roadside drains/sewers (8) Water taps/pipeline (9) Dhobi ghats (10) Bus shelters (11) Bore wells (12) Additional room(s) or extensions (13) New buildings (such as GP offices, anganwadis, libraries, veterinary hospital and school kitchens) (14) Community toilets (15) Community halls (16) Culverts and bridges (other cross-drainage systems) (17) Repairs/renovations to existing buildings (18) Stone slabbing of roads (19) Check dams (20) Shops (to be managed by GP).
INCREASED QUALITY OF ASSETS BUILT IN THE GPs
• The quality of assets built under the KGSP is much superior - compared to that of the infrastructure created under two comparable schemes - the Backward Regions Grant Fund (BRGF) and the National Rural Employment Guarantee Act/Scheme (NREGA).
• Quality was assessed by stakeholders or asset users as well as by engineers. With respect to the stakeholder assessments, the proportion of users who reported that the quality of KGSP assets was “good” is 72%, as against 31% and 51% for BRGF and NREGA assets respectively.
• The quality assessment by engineers also proves that the quality of Gram Swaraj assets has been the best. The proportion of the select assets rated “good” by engineers is highest under the Gram Swaraj.
• The evaluation carried out regressions to find out the drivers of quality. The results show that the processes followed by the Project GPs in the execution of civil works determines the quality to a large extent; these factors are: (1) Number of tenders (2) Time taken to build the asset (3) Double entry book keeping (4) Asset identification through Gram Sabha (5) Year of asset creation (6) Level of investment. However, the exact combination of the above stated independent variables varies according to the quality assessor (stakeholder or engineer) and the type of asset (say CC road or drains) in question.
• Tests of significance were carried out separately for CC roads (leading common asset) and all assets combined. Results show that the better quality of KGSP assets, in general, are statistically significant @ 90% level.
RISING SATISFACTION OF CITIZENS WITH SERVICE DELIVERY BY GPs
• The infrastructure created under the KGSP has in general had a positive impact on some key facilities and services in the Project GPs. The three stakeholder components of the evaluation asked the respondents as to how does a given facility in their village compare with that of neighbouring villages. The respondents were expected to rate the quality of the facility or service in terms of: BETTER, SAME and WORSE. Seven such services or facilities were selected for ascertaining the perceptions of the above stakeholders: (1) Roads (2) Streetlights (3) Anganwadi (4) Health Centre or PHC (5) Primary School (6) Drinking Water (7) Drainages.
• The results regarding the perception BETTER show a mixed picture. As far as the household level responses on roads in the end line are concerned, the proportion of households reporting
38

BETTER is higher in the treatment GPs by almost 9%. Even with respect to drainages the satisfaction levels (BETTER cases) among the Project GPs are higher. The broad trend with respect to these two facilities reflects the impact made by the KGSP Project through its investments in infrastructure.
• Regarding the other services the pattern in the end line is mixed with both Project and non-Project GPs showing more or less same satisfaction levels with respect to streetlights and drinking water; and the BETTER proportions are marginally higher among the control GPs regarding the other services. But the baseline status also exhibits a mixed picture in that the satisfaction levels were already marginally higher in the control group when it comes to the facilities of roads, streetlights, anganwadi, health care and primary school.
• Difference-in-Differences (DoD) models were run on the household satisfaction levels with the above stated set of facilities. The levels of difference arrived at were found to be statistically significant with respect to roads and drainages.
• Despite the mixed results it can be inferred in broad terms that the stakeholders in the Project GPs are happy with the visible improvements that they experience in areas where the bulk of the KGSP investments were made, that is, roads, drainages, anganwadis, sanitation and schools. The impact has not reached the same level in other sectors due to their thin distribution.
• Evaluation of this indicator had encountered certain methodological limitations since it was difficult to ascertain whether the respondents were comparing a given service with that of a treatment GP/village or a control GP/village. Moreover, in addition to GPs the respondents reported other agencies or departments as responsible for providing a given service.
GRAM AND WARD SABHAS WITH HIGH AND REPRESENTATIVE PARTICIPATION
• Responses of stakeholder groups were elicited regarding this indicator. The awareness levels about Gram Sabha and Ward Sabha have improved since the baseline across treatment and control GPs; but there are no major differences between the intervention and the non-intervention GPs.
• Another question was on whether they ever attended a Gram Sabha or Ward Sabha. The participation levels have witnessed considerable improvements since the baseline in both treatment and control GPs: from 55% to 84% in Gram Sabha and from 56% to 74% in Ward Sabha. However, there are no big variations in the attendance levels between treatment and control situations.
• Regarding the number of Gram Sabhas and Ward Sabhas attended, the frequencies covered are one, two and more than two. There are no significant variations in the proportions of households that attended Gram Sabhas and Ward Sabhas covering the three frequencies.
• Findings of the end line survey with respect to Gram Sabha and Ward Sabha participation levels by gender and caste categories (SC, ST, OBC and General) show that there are no perceptible variations between male and female participation levels between the treatment and control groups. Similarly, the end line findings do not show big variations between the participation levels by the four social categories between the Project and non-Project GPs. On the other hand, baseline data throws up highly mixed results.
• In order to evaluate the real impact (in view of mixed results between baseline and end line) Difference-in-Differences (DID) models have been used. The differences in Gram Sabha and Ward Sabha participation levels are not significant, statistically speaking - indicating that the impact had not reached the levels that would have been quantitatively visible and significant.
• Secondary data on the number of Gram Sabhas, Ward Sabhas and GBMs conducted by GPs show
39

that in 2012-13 both treatment and control GPs conducted broadly the same number of Gram Sabhas while the treatment GPs fare marginally better with respect to the number of Ward Sabhas. It seems that in 2013-14 the treatment GPs began improving their performance regarding Gram Sabhas while continuing their lead with respect to Ward Sabhas. Overall 2013-14 represents a minor shift in favour of Project GPs. However, data for at least for five years would allow one to draw reliable inferences in this regard.
• The household survey does not seem to have fully captured the impact on this front due to certain methodological limitations: (1) relatively small household sample (2) the baseline was conducted after the Project had taken off (3) barring some special interventions, the capacity-building component in general was common to both treatment and control GPs (4) A considerable proportion of respondents in the end line are different from those of the baseline.
FINDING OF PRA (PARTICIPATORY RURAL APPRAISAL)
• The broad trend across the sample GPs is that the frequency of Ward Sabhas is not in line with the mandate of the Panchayati Raj Acts and other policies and guidelines; hence the track record on this front is uneven. By contrast the Gram Sabha is increasingly playing a vital role in local governance.
• Through its soft components the KGSP aimed at ensuring higher and more representative participation in Gram Sabhas and Ward Sabhas. This was done under the stakeholder capacity building strategy. The PRA reveals that for the first time Ward Sabhas were conducted in almost all the villages under the Gram Swaraj Project. As a result the awareness levels about the relevance and effectiveness of the Ward Sabha increased leading to improved participation.
• Participation levels at Gram Sabhas were higher compared to such previous meetings. The GP functionaries and community members who underwent training played a vital role in ensuring high and representative participation at Gram Sabhas.
• The frequency of Ward Sabhas has increased in the treatment GPs in general during the Project period. This in turn had influenced GP functionaries to meet the expectations by conducting more Ward Sabhas. In general the KGSP impact on Ward Sabha and Gram Sabha participation is relatively higher in GPs where the GP representatives and officials are proactive.
• In treatment GPs both Ward Sabhas and Gram Sabhas have been conducted with earnestness and commitment. Stakeholder consultations reveal that people’s participation has improved on account of the following processes: (1) The block grants constitute the largest source of untied funding (2) People’s needs and priorities have been addressed through block grants (3) Regular monitoring and review of the Project implementation.
HOW THE PANCHAYATS HAVE BEEN STRENGTHENED
The broader objective of the Gram Swaraj Project was to strengthen the Gram Panchayats. The following impacts of the Project interventions have contributed to the strengthening of GPs:
• The block grants over the past six years have enhanced the capacity of the GPs in meeting the development needs and priorities; the funding was untied and reliable. The investments under the Project have created a model in local governance through its transparent (tender system), accountable and participatory processes.
• The assets built have raised the satisfaction levels of the local citizens with the Panchayats - in sectors where the KGSP invested - thus making GPs more responsible and responsive. The training and other capacity-building initiatives have made local stakeholders aware of their roles and responsibilities. Interventions such as double-entry book keeping, auditing and Panchatantra have made governance more efficient and transparent. The Project interventions have facilitated
40

higher tax compliance.
• Thanks to the Project initiatives a large proportion of local citizens have been made aware of the importance of Ward Sabha and Gram Sabha. As a cumulative impact of the Project interventions, participation levels in Gram Sabha and Ward Sabha have marginally improved.
• The investments in assets that meet community preferences to a great extent have had both direct and indirect impacts on social indicators. The Project has raised the expectations of the community making GP functionaries more responsive and responsible.
• The spread of the assets built under the KGSP has been equitable – in both social and spatial terms.
• The soft component of the KGSP covered the entire Karnataka leading to the enhancement of the capacity of stakeholders not only in the 39 most backward Taluks but also of the rest of the State. The KGSP has also created permanent infrastructure in the form of Samarthya Soudha’s (capacity-building centres) and SATCOM Sub-Centres.
COMPLEMENTARY FINDINGS
• The KGSP has been implemented in a more responsible and transparent manner; two factors are relevant here: the hard component (block grants) and the complementary soft component (capacity building). Monitoring by the State Government and other stakeholders also helped.
• The untied nature of block grants had made the Project more participatory and equitable. Large scale funding under the NREGA (rather unlimited funding as the scheme is demand-driven) in later years seems to have partially shifted the focus.
• The practices and processes introduced by the KGSP have been made mandatory for other schemes and projects as well, such as preparation of action plans through Gram Sabhas; double-entry system; and online entry of program-related and socio-economic data.
• The coverage of stakeholders under training programmes had slowed down in the later years of the Project period. As stakeholders perceive, it is the tender work that makes the KGSP distinctive. This particular requirement had greatly contributed to the quality of works.
• Unlike the Gram Sabha the performance of Project GPs with respect to Ward Sabhas was uneven. The soft interventions were not given the level of priority they deserve; such interventions would have contributed to better participation in Gram Sabhas and Ward Sabhas.
• The KGSP has had much greater, verifiable and visible impact on the infrastructure that has been built through its core component. Here one can find a correlation between the impact and the scale of the intervention.
• With respect to the soft interventions—and even the hard interventions to some extent—we need to look at the context in which the KGSP has been implemented. The Project period coincides with the launch of several centrally sponsored flagship schemes that were aimed at achieving the broader goal of inclusive growth. The flagship schemes cover the full range of social sectors. In addition, there are Government of Karnataka schemes and externally-aided projects. The guidelines of other schemes and projects also require the GPs to ensure community participation, transparency, equity and accountability. It is in this context that the evaluation tried to assess the impact of the KGSP.
• The KGSP had the advantage of up taking the findings of the 2009 baseline survey in order to make course corrections.
• Training interventions by ANSSIRD and other agencies covered the entire state; from a
41
methodological perspective this has “contaminated” the control GPs and caused difficulties in isolating the impact of KGSP.
• The aspects of participation, frequency, representativeness and “voice” with regard to Gram Sabha and Ward Sabha fall in the realm of institutions. Transformations in these indicators take time and require sustained and targeted interventions.
• In general the control GPs are more urbanised and better connected to their respective Taluk and district headquarters. For instance in Bidar, Gulbarga and Raichur districts almost all control GPs were selected from their respective urban Taluks as only the urban Taluks were available outside the most backward Taluks. In order for the Project impact to be visible the treatment GPs first need to catch up with their control counterparts – at least with respect to some indicators – and then need to overtake them. These factors need to be taken into account while evaluating the impact of the KGSP.
• The capacity-building interventions experienced an interruption—and some erosion of capacity at GP level—due to the change of GP bodies after the 2010 Panchayat polls. The previous GP bodies were in office during the launch of the KGSP and attended both special and regular training sessions. Nearly 85% of GP Members were new incumbents following the 2010 GP elections who had to learn the KGSP processes, requirements and related themes afresh following the departure of trained and experienced GP Members.
42

B. DOCUMENTATION OF GRAM SWARAJ PROJECT 201454
I. OBSERVATIONS Based on the review of documents, interactions and focus group discussions the following are the key observations from the study team:
• Community Participation: The Gram Swaraj Project witnessed a revival in terms of community participation in planning of activities at the grass root level. The priorities and preference of the villagers were taken in to consideration while deciding on the utilization of money received under block grants. This paved way for addressing the basic infrastructure related problems of some of the backward Panchayats of the state with necessary community consensus. However it was observed that no participatory techniques were adopted in a systematic way to identify the needs of the community. The study team also found that the participation of the community members was not much evident during the implementation phase. During execution of the work by the contractors the role of the community was limited and apart from individual monitoring initiatives by elders of the community no collective initiatives were carried out. Community members from different sections of the community expressed their satisfaction about the development works carried out by under the Project.
• Frequent transfers of officials: A major problem faced by the Panchayats during the implementation of the Project was the frequent transfer of officials such as PDOs and EOs. For e.g. Hoguntta Gram Panchayat of Chitapur Taluk witnessed frequent transfer of PDO (Panchayat Development Officers). Since the inception of Project, four PDOs have been posted there and presently the secretary who is given additional charge of PDO is the fifth resource for the same position. The present PDOs expressed that although the transfer is within same Taluk but it affects implementation of Project in terms of execution of plans, approval of annual action plan, submission of utilization certificate etc. Maintenance of Project related documents was also affected due to frequent transfers. It was observed that there is a lack of proper systems for handing over the documents related to the Projects to new officials. In most of the places the new officers faced difficulties in retrieving information from the past.
• Insufficient resources at TRCs: Interactions with Elected Representatives revealed that they are pleased about the formation of Taluk Resource Centres. They are of the opinion that they are able to receive help from the Taluk Resource Centre as and when there is a need. However all the elected representatives responded that the Taluk Resource Centres are not equipped with the necessary staff as most of the TRCs covered under the study have only Computer Operator or Accountant. As a result the only help they are able to seek from TRC is with regard to the computerised accounting system, accounts, and documentation. The Elected Representatives and the PDOs are of the opinion that the TRCs need to be staffed with sufficient number of resources so that their assistance can be sought for the day to day functioning of the Panchayats.
• Maintenance of TRCs: The Taluk Resource Centres are constructed using the one time construction grant received from Gram Swaraj Project. Most of the Taluk Resource Centres are regularly being used for providing trainings for PRIs and line department staff. However the maintenance of TRCs poses a big challenge for the Taluk Panchayats. There is no specific fund available for the repair works of the TRCs.
• Maintenance of assets created: The Project was successful in addressing some of the basic infrastructure needs of the most backward Panchayats in the state. However the Project is yet to address the need for any mechanism for the maintenance of assets created under the
54 Report by ICRA Management Consulting Services, Limited (IMaCS), 2012
43

Project. In Kaidhalli village of Honguntta Gram Panchayat, public toilet was constructed using the money received as Block Grant. The need for public toilet emerged during ward Sabha and it was finalized during Gram Sabha. The toilet was constructed by Panchayat using Block Grants fund. The constructed toilet did not have any water or tap connection due to which villagers find it difficult to make use of it. The path way to the public toilet was also found congested and blocked by shrubs. The villagers feel that, if water connection is provided in the toilet then it can be utilized and will serve the need of the villagers. Interventions for addressing similar kind of issues are required to ensure that the assets created are being utilized at its best.
• Works under Gram Swaraj and Other projects: The study team found that there have been significant differences between the systems adopted for the activities carried out under Gram Swaraj Project and that of other schemes. Under Gram Swaraj it was mandatory that the community will decide and prioritize the activities to be undertaken under the Project where this is not evident in similar projects being implemented in the Panchayats. The Project ensured the utilization of the money as the next instalment of the block grant will be released only after utilizing the 70% of the previous instalment. Considering procurement, the Project has put proper systems in place for the activities carried out under the Project. All procurement activities carried out under the Project was through tendering process which further ensured transparency along with other measures.
• Application of Environment Management Framework: The Project has put in place systems to make sure that the environment will not be suffered as a result of the construction works undertaken under the Project. However the observations revealed that the application of environmental guidelines was handled as just another duty than effectively implementing the same by identifying the possible risks and mitigating the same. Though most of the work files are placed with OK cards, none of the cards carried any information with regard to the identification of environmental risks and the means adopted to mitigate the same.
II. RECOMMENDATIONS The key recommendations derived from the exercise are given below:
• Management of Assets created: Gram Swaraj Project invested tremendously in developing assets in the most backward Panchayats of the state. However the management of the assets generated has been identified as an issue which is not sufficiently addressed by the Project. There should be systems in place to ensure that the outcomes of the Project will be sustainable and the assets generated under the Project are being managed properly. Panchayats should be guided to identify measures and strategies to ensure the maintenance of the assets generated under the Project. The systems such as community based monitoring and maintenance systems such as user groups and user fees should be adopted to make sure that the assets generated are maintained properly.
• Resources at TRCs: The formation of TRCs at the Taluk level was aimed at providing technical support to Panchayats. However as of now most of the TRCs do not have sufficient number of resources to carry out the mandates of TRC. Most of the TRCs only have a Computer Operator or Accountant. It is important to make sure that the TRCs are fully equipped with the proposed personnel such as Social Mobilizers, Accountants and Computer Operators which will help in addressing the needs of the Panchayats.
• Need for training Follow-up: ANSSIRD has carried out an incredible task by delivering number of training programmes aimed equipping the elected representatives and officials to undertake their tasks effectively. However it was observed that there are no systems in place to assess the impact of the training programmes and monitoring mechanisms to see how well
44
they are able to apply the knowledge in their day to day affairs at the grass root level. Therefore there should be systems such as random monitoring field visits and interactions with the participants to understand the problems they face in applying their knowledge in the real field situations. There should be systems in place to see the trainings imparted through satellite systems are being well understood and received by the participants. There should be pre and post assessment systems to see how effective the satellite trainings were in educating the participants.
• Need for improved Community Participation: Gram Swaraj Project was instrumental in enabling community participation in the decision making process at the grassroots level. However the community participation was limited to deciding and prioritizing the type of development works. It was very limited during the later stages of implementation. The Project envisages increased participation of the community yet failed to device any strategy for the same. The absence of the social mobilizers at the Taluk Resource Centre also limited the scope of enhanced community mobilizations for undertaking community based monitoring and social audits. Therefore it is important to establish systems and practices in place to ensure community participation at all levels of the Project.
• Effective implementation of the Environment Management Framework: The Project adopted systems for managing environmental risks associated with the Project by implementation of an environmental management framework. However evidences from the field shows that the implementation and application of the same was not that effective as expected. Therefore within the available timeframe the Project should ensure that systems are in place accomplishing the objectives of environmental management framework. There should be frequent monitoring visits from the PMU and District Planning Units to see how effective the Gram Panchayats are in implementing the Environment Management Framework and whether the Executive Officers at the Taluk Panchayat are effective in monitoring the same. Policy level decisions by the Government are also required for an effective implementation of the same.
• Training Need and Impact Assessment: There is a need for rapid training need assessment before the start of each training and quick impact assessment during the closure of the training. This quick need assessment will help the trainers to understand the knowledge levels of the participants and systematically address the training needs by being flexible in their training approach. The quick impact assessment will help the trainers and training material developers to understand how many the participants were able to learn from the current training and on which areas the participant needs specific attention in the subsequent trainings.
• Expansion of Gram Swaraj Project: Gram Swaraj Project was successful in addressing the micro level development needs of the Gram Panchayats in the most backward blocks of the State. It has proven that enhanced community participation is a must in addressing the development needs of the communities. When most of the other schemes for the Panchayats provide tied funds for the Panchayats, Gram Swaraj Project gives untied funds to address the felt development needs of the community. The predictable nature of fund allocation under Gram Swaraj Project has helped Panchayats to be prepared for management of the funds. The key interventions such as revised procurement systems and implementation of the environment management guidelines are few among the best practices shown by the Project. Studies have been undertaken to see how the Project has brought out various best practices which can be replicated in other parts of the state and country. Expanding similar interventions to other blocks and Panchayats with similar indicators after drawing lessons from the successful aspects of Gram Swaraj Project will definitely able to bring outstanding results in the on-going development process at grass root levels which further strengthens the decentralization process. Therefore, it is recommended to expand the Project to all Districts and Gram Panchayats of the State by ensuring enhanced community participation and improved monitoring systems.
45

46

Annex 6. Stakeholder Workshop Report and Results
No ICRR stakeholder workshop was held
47

Annex 7. Summary of Borrower's ICR and/or Comments on Draft ICR
Government of Karnataka
Borrower’s
Implementation Completion Report (ICR)
PROJECT AREA: 1341 GRAM PANCHAYATS
39 MOST BACKWARD TALUKS
15 DISTRICTS
GRAM SWARAJ-KARNATAKA
PANCHAYAT STRENGTHENING PROJECT
48

Borrower’s Implementation Completion Report (ICR)
Background Backwardness and regional imbalances are always the factors that hinder the development of States as well as the Nation. Efforts have been made under various development programmes to realize Gandhiji’s concept of Gram Swaraj. In spite of these efforts the issues of backwardness and regional imbalances continue to occupy centre stage in our policy making process. Steps have been initiated to find out reasons for such backwardness and imbalances and find means to eradicate them. With the great hope that backwardness and imbalances could be eradicated through the Panchayat Raj Institutions (PRI), the States have initiated several programmes.
Backwardness can be attributed to several factors and important among them are issues related to: 1. Social and cultural factors 2. Economic factors 3. Political situation- that is the decision making process (if people are weak in decision
making process they are bound to remain backward) 4. Administrative factors (here the services provided and at what level of efficiency is
important)
Apart from this the lack of infrastructure facilities, Institutional mechanisms at the grassroots level, lack of awareness, knowledge, skills among the community and the levels of delivery of services through participatory initiatives also play an important role.
In Karnataka, several efforts have been made to address issues related to backwardness and regional imbalances. Most important among them is the recommendations made by the committee headed by the well known economist Dr. D. M. Nanjundappa about the efforts to be made to eradicate regional imbalances in its report. In this report all the Taluks have been classified as Most backward, The More backward, the backward and the Relatively Developed Taluks. Several programmes have been taken up in this regard since several years and financial resources are being released to these backward regions to supplement them.
At the Institutional level, during the year 1987 Karnataka initiated the first generation decentralization reforms with “central theme” of creating and empowering strong district level local government. The constitutional 73rd amendments of 1993, with its emphasis on reservations for deprived classes constituted second-generation reforms while the strengthening of the decentralization initiatives formed the third generation reforms. The aim was to strengthen the accountability, enhance the transparency and role clarity. The emphasis was on good governance, transparent and accountability through decentralization and to make the PRIs truly institutions of local self- governments. In this regard, there was need of additional resources to be provided to Institutions at the grassroots level especially Gram Panchayats to encourage them in increasing resources to address their needs and to enhance their capacity in utilising these resources. Gram Swaraj- An Overview
Karnataka has been in the forefront of administrative decentralization and devolution of powers to the Panchayats as envisaged in the Constitution. It has been observed that the Panchayat Raj Institution structure in Karnataka has now been stabilized and strengthened with regular elections. However, to make them truly institutions of local self- governments, there was a need to provide Gram Panchayats with additional resources and also encourage them to raise their own sources through capacity building initiatives. Resources utilized towards services that are prioritized locally would lead to greater satisfaction among the local population. The Project gave special emphasis to improve the service delivery by Gram Panchayats particularly with respect to the management of public resources and the delivery of services that the local people prioritize and decide.
49

Project Objectives
The major objective of the Project in the 39 ‘Most Backward Taluks’ was to provide them opportunities towards improving their present conditions particularly with respect to the management of public resources and the delivery of relevant services that the rural people prioritize. In order to achieve this objective, the Project focused on:
• Build capacity of the Grama Panchayats (GPs), Taluk Panchayats (TPs) and Zilla Panchayats (ZPs) Improve framework and guidelines for own revenue collection.
• Provide formula-based Block grants to 1341 GPs in the ‘Most Backward Taluks’ • Revamp financial management and procurement system. • Improve the effectiveness of service delivery across a range of services that have
devolved on them under the Karnataka Panchayat Raj Act, 1993 (KPR Act, 1993)
Project Area
The Project was implemented in 1341 GPs, coming under 39 ‘Most Backward’ Taluks in 15 Districts identified in the Nanjundappa Committee Report. The list of the 39 Most Backward Taluks is annexed as Annexure-1. However, developing the capacity of the institutions at all three tiers of Zilla Panchayats, Taluk Panchayats and Gram Panchayats by imparting training to PRI members and functionaries was taken up in the entire state.
Project Description
The “Gram Swaraj Project” (GSP) is a Panchayat Strengthening Project conceived and assisted by World Bank and was implemented through Rural Development and Panchayat Raj Department (RD&PRD), Government of Karnataka from 2006-07. The State Government intended to strengthen the ‘most backward Taluks’ constituting 1341 Gram Panchayats. The focus was to fill the administrative and development gaps in the GPs, designed with optimum scope for improving efficiency and effectiveness. Initially, it sought to increase the resources for development in these backward GPs by providing untied grants. Along with this, it also sought additional efforts on the part of GP functionaries to generate own source revenue (OSR) and thereby increasing their capacity to undertake higher investment. In addition to this, to improve the local management capacity, the Project allocated, formulae based block grants rather than tied funds, so that GPs could carry out their own prioritization and planning. The Project duration was initially fixed at 5 years and a detailed planning, budget allocations were designed. The Project was designed based on realized efficiency gains from improved processes and capacity building measures with the innovative idea of establishment of Taluk Resource Centres (TRCs) and SATCOM Studios. The critical aspects of these arrangements included the establishment of the Decentralization Analysis Cell which is responsible for analysis, evaluation and monitoring of panchayat fiscal and service delivery performance, strengthening of ANSSIRD and restructuring of line agencies.
Intervention Strategies
A. Infrastructure Development
GSP displayed transparent approach so that people were aware of the scheme being allocated to different local governments and the services/outputs expected to result there from through ward/gram sabhas held. Provision & maintenance of drinking water supply, health & sanitation, inter road connectivity, asset creation etc. are some of the important civic responsibilities of GPs. The intervention of GSP in the matter of service delivery in the GPs, revealed an overall positive outcome. The service-wise physical achievement made is presented in the below table.
50

Table 1: Physical achievement under Component A (Block Grants) Sl. No
Type of Service Typology of Work No. of works implemented
% to total Works
1 Inter Road Connectivity
Cement Road 20658 45.74% Cement Road with drainage 2814
Mettle & Asphalted road 1742 2 Sanitation Drainage 8029 17.56% Community toilets 1652 3 Asset creation Panchayat Buildings 982
11.36% Anganwadi Building 1537 Commercial buildings 968 Compound Wall 2357 Bus stands 417
4 Drinking Water Pipelines 1265 5.35% Cistern 1480 Bore well 202
5 Other infrastructure Bridge, dhobi ghat, solar lights etc.
11024 20.00%
Total - 55127 100.00
Table shows 55127 works of different types approved by Gram Sabhas as per action plan were completed. It can be seen that major works carried out are roads, sanitation and other infrastructure. The nature of works taken up with Gram Swaraj Project funds included Concrete Roads, Community Toilets, Cisterns, and Buildings. The works carried out strictly adhered to the Environmental Framework guidelines designed under the Project which included the issue of OK cards. This helped in assessing the environmental impact in the Project area. The importance of the environmental safeguards and frameworks were discussed in the gram sabhas for creating the awareness among the community. Apart from this an unique pilot work was taken by installing solar lights in Pudukote Kaval village of Bheemanahalli Gram Panchayat in HD Kote Taluk of Mysore District.
The investments made through block grant to GPs have created a model in local governance through its transparency, accountability and participatory process. Incurring expenditure by the Gram Panchayat on asset creation, better service delivery such as interlinking concrete cement roads, portable drinking water supply vide cisterns, pipelines, better drainage & sanitation facility, solar lights etc. should be seen not as an asset alone but their indirect impact on health hygiene and socio-cultural behavior. This should also be considered along with infrastructure augmentation and increasing the involvement of civil society in planning and its execution through discussions and effective participation in ward/gram sabhas.
B. Capacity Building
Taluk Resource Centers (TRC): The concept of TRC was a built-in objective of the Project for the capacity building of PRIs with and intention of providing space for better environment and easy accessibility to impart training comfortably to facilitate various Training programs organized by Abdul Nazir Sab State Institute of Rural Development (ANSSIRD) for the elected representatives of Panchayat Raj Institutions and also functionaries of these Institutions that included other Government Departments like Agriculture, Education, Women and Child Development etc., which co-function with Panchayat Raj Institutions by setting up a permanent structure in the name of TRC. In addition, Non-Government Organizations (NGOs) were also allowed to impart training to groups like Self Help Groups (SHGs) which are engaged on income generating activities. Taluk Resource Centers also facilitated to save the precious time and carry
51
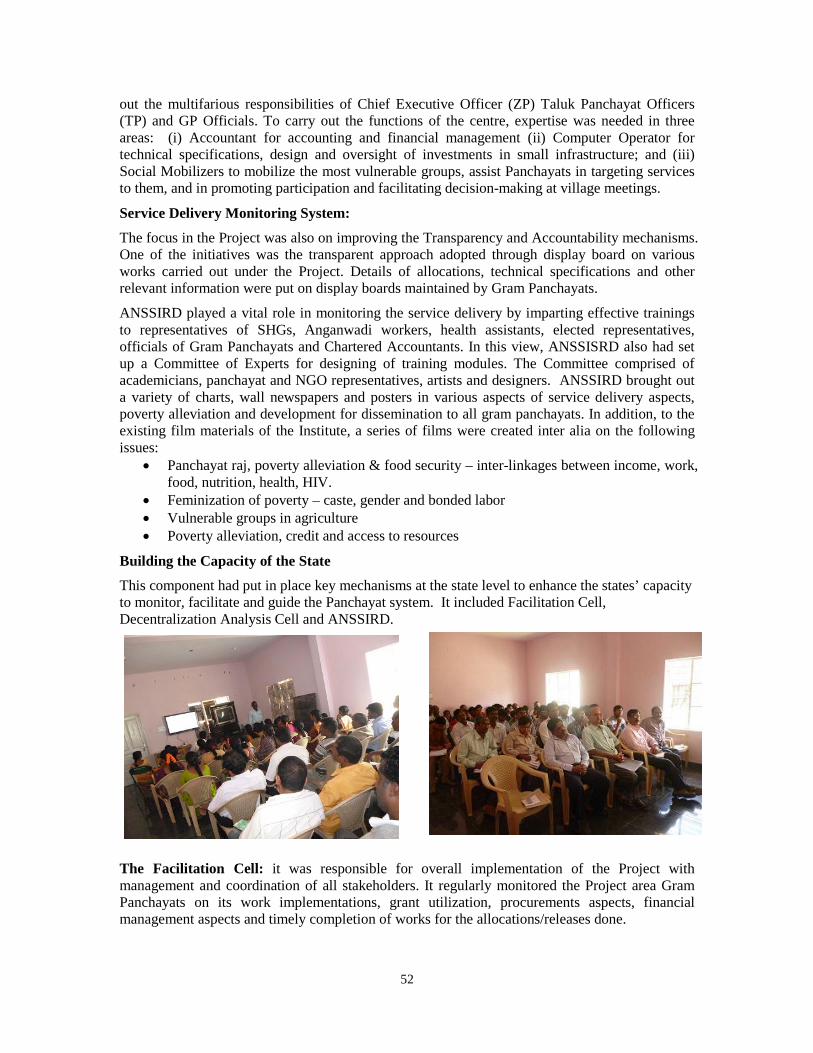
out the multifarious responsibilities of Chief Executive Officer (ZP) Taluk Panchayat Officers (TP) and GP Officials. To carry out the functions of the centre, expertise was needed in three areas: (i) Accountant for accounting and financial management (ii) Computer Operator for technical specifications, design and oversight of investments in small infrastructure; and (iii) Social Mobilizers to mobilize the most vulnerable groups, assist Panchayats in targeting services to them, and in promoting participation and facilitating decision-making at village meetings.
Service Delivery Monitoring System:
The focus in the Project was also on improving the Transparency and Accountability mechanisms. One of the initiatives was the transparent approach adopted through display board on various works carried out under the Project. Details of allocations, technical specifications and other relevant information were put on display boards maintained by Gram Panchayats.
ANSSIRD played a vital role in monitoring the service delivery by imparting effective trainings to representatives of SHGs, Anganwadi workers, health assistants, elected representatives, officials of Gram Panchayats and Chartered Accountants. In this view, ANSSISRD also had set up a Committee of Experts for designing of training modules. The Committee comprised of academicians, panchayat and NGO representatives, artists and designers. ANSSIRD brought out a variety of charts, wall newspapers and posters in various aspects of service delivery aspects, poverty alleviation and development for dissemination to all gram panchayats. In addition, to the existing film materials of the Institute, a series of films were created inter alia on the following issues:
• Panchayat raj, poverty alleviation & food security – inter-linkages between income, work, food, nutrition, health, HIV.
• Feminization of poverty – caste, gender and bonded labor • Vulnerable groups in agriculture • Poverty alleviation, credit and access to resources
Building the Capacity of the State
This component had put in place key mechanisms at the state level to enhance the states’ capacity to monitor, facilitate and guide the Panchayat system. It included Facilitation Cell, Decentralization Analysis Cell and ANSSIRD.
The Facilitation Cell: it was responsible for overall implementation of the Project with management and coordination of all stakeholders. It regularly monitored the Project area Gram Panchayats on its work implementations, grant utilization, procurements aspects, financial management aspects and timely completion of works for the allocations/releases done.
52

GP Public
Contractors
/ Suppliers
General Public
Grama Panchayathas
Information Systems for Constituents
This component was to increase the capacity of rural people, in particular the poor, to voice their demands on local bodies and put pressure on them to perform. This was achieved through three distinct activities. It concentrated on increasing the ability of rural people to watch their demands on local governance and elicit responses from the poor, women, scheduled caste and scheduled tribes and also to enhance the awareness on IEC activities.
Information Education & Communication (IEC) aspects focused on empowering the community organizations and Gram Panchayat Officials on their roles and responsibilities, service delivery performance at the village levels etc. Initially, Project focused on media reach program in the 39 Taluks by informing the media about the Project, to help them in monitoring via reporting on the Project as it evolves. ANSIRRD planned a comprehensive program for GSP activities to be executed and implemented. It included intensified emphasis on Projects objectives, procedures, grievance mechanism, planning process by portraying that the GPs are the autonomous government structures and that its citizens/people have all right to define the expenditure priorities in their boundaries through awareness campaigns such as kalajathas, short films, skits, etc.. With this, the GPs started disclosing information to public through ward/gram sabha and posters: full budget, beneficiary, tender calls, contracts, revenue collection, work plans, audit compliance/findings, implementation of promised changes to bring in the transparency in the local governance;
53
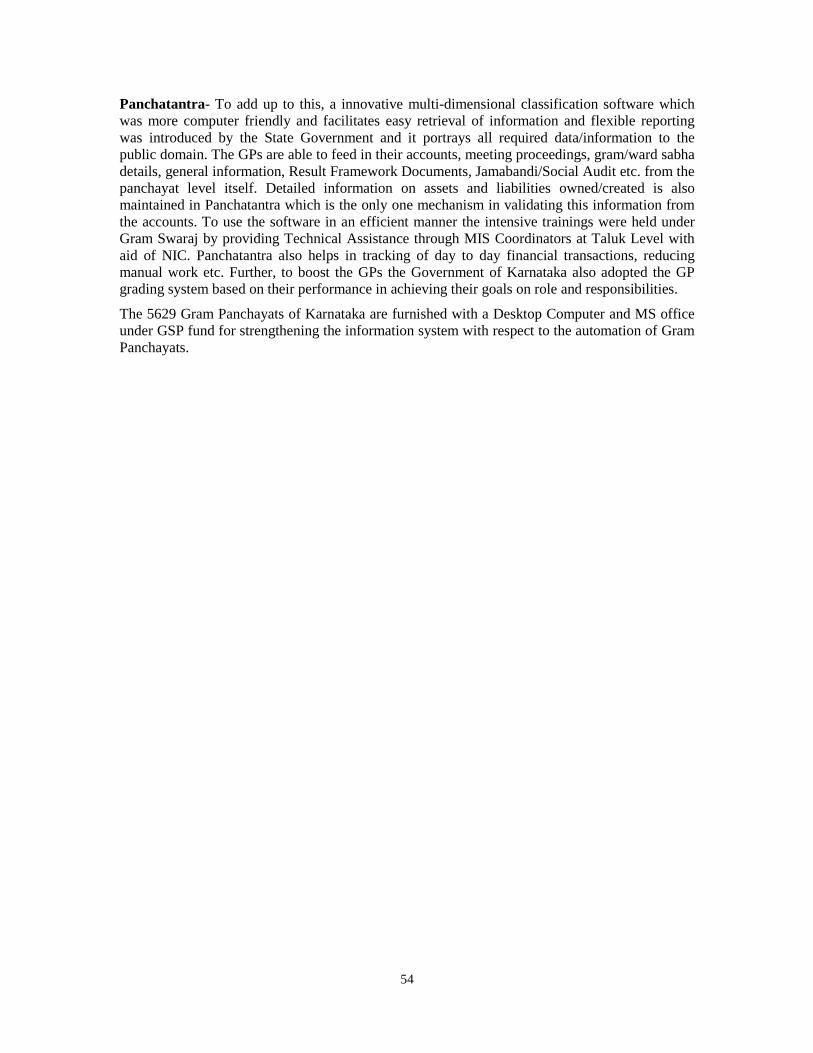
Panchatantra- To add up to this, a innovative multi-dimensional classification software which was more computer friendly and facilitates easy retrieval of information and flexible reporting was introduced by the State Government and it portrays all required data/information to the public domain. The GPs are able to feed in their accounts, meeting proceedings, gram/ward sabha details, general information, Result Framework Documents, Jamabandi/Social Audit etc. from the panchayat level itself. Detailed information on assets and liabilities owned/created is also maintained in Panchatantra which is the only one mechanism in validating this information from the accounts. To use the software in an efficient manner the intensive trainings were held under Gram Swaraj by providing Technical Assistance through MIS Coordinators at Taluk Level with aid of NIC. Panchatantra also helps in tracking of day to day financial transactions, reducing manual work etc. Further, to boost the GPs the Government of Karnataka also adopted the GP grading system based on their performance in achieving their goals on role and responsibilities.
The 5629 Gram Panchayats of Karnataka are furnished with a Desktop Computer and MS office under GSP fund for strengthening the information system with respect to the automation of Gram Panchayats.
54
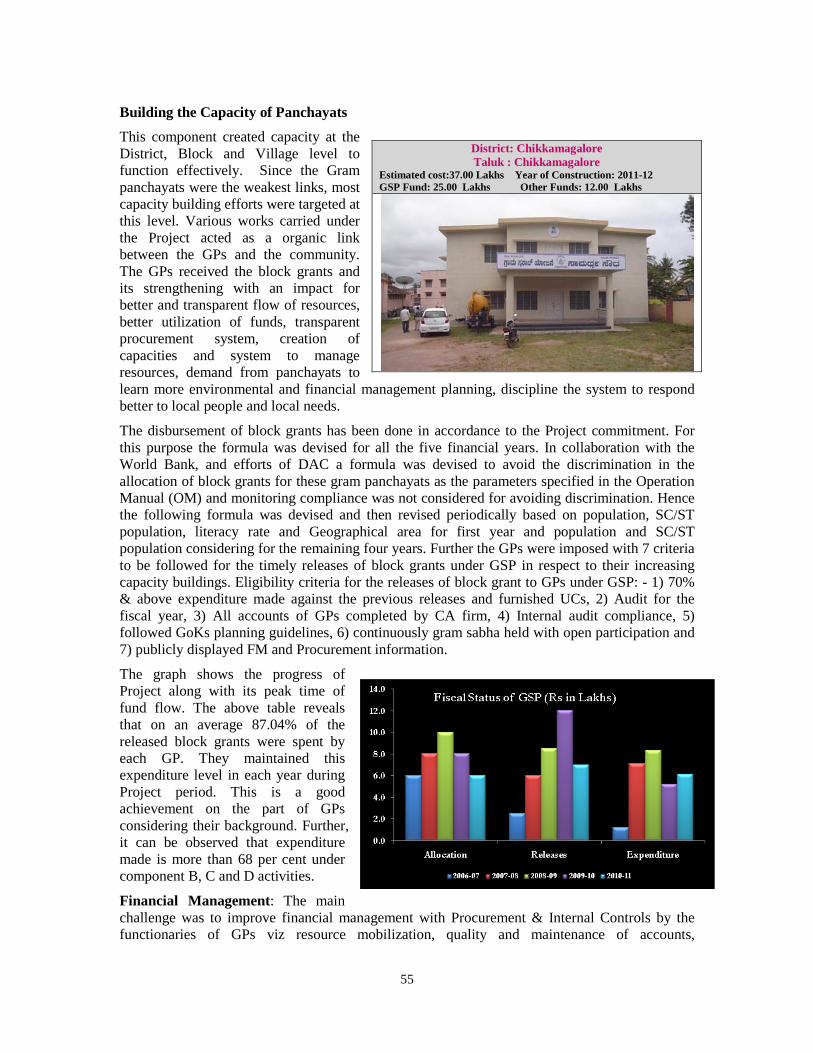
Building the Capacity of Panchayats
This component created capacity at the District, Block and Village level to function effectively. Since the Gram panchayats were the weakest links, most capacity building efforts were targeted at this level. Various works carried under the Project acted as a organic link between the GPs and the community. The GPs received the block grants and its strengthening with an impact for better and transparent flow of resources, better utilization of funds, transparent procurement system, creation of capacities and system to manage resources, demand from panchayats to learn more environmental and financial management planning, discipline the system to respond better to local people and local needs.
The disbursement of block grants has been done in accordance to the Project commitment. For this purpose the formula was devised for all the five financial years. In collaboration with the World Bank, and efforts of DAC a formula was devised to avoid the discrimination in the allocation of block grants for these gram panchayats as the parameters specified in the Operation Manual (OM) and monitoring compliance was not considered for avoiding discrimination. Hence the following formula was devised and then revised periodically based on population, SC/ST population, literacy rate and Geographical area for first year and population and SC/ST population considering for the remaining four years. Further the GPs were imposed with 7 criteria to be followed for the timely releases of block grants under GSP in respect to their increasing capacity buildings. Eligibility criteria for the releases of block grant to GPs under GSP: - 1) 70% & above expenditure made against the previous releases and furnished UCs, 2) Audit for the fiscal year, 3) All accounts of GPs completed by CA firm, 4) Internal audit compliance, 5) followed GoKs planning guidelines, 6) continuously gram sabha held with open participation and 7) publicly displayed FM and Procurement information.
The graph shows the progress of Project along with its peak time of fund flow. The above table reveals that on an average 87.04% of the released block grants were spent by each GP. They maintained this expenditure level in each year during Project period. This is a good achievement on the part of GPs considering their background. Further, it can be observed that expenditure made is more than 68 per cent under component B, C and D activities.
Financial Management: The main challenge was to improve financial management with Procurement & Internal Controls by the functionaries of GPs viz resource mobilization, quality and maintenance of accounts,
District: Chikkamagalore Taluk : Chikkamagalore
Estimated cost:37.00 Lakhs Year of Construction: 2011-12 GSP Fund: 25.00 Lakhs Other Funds: 12.00 Lakhs
55
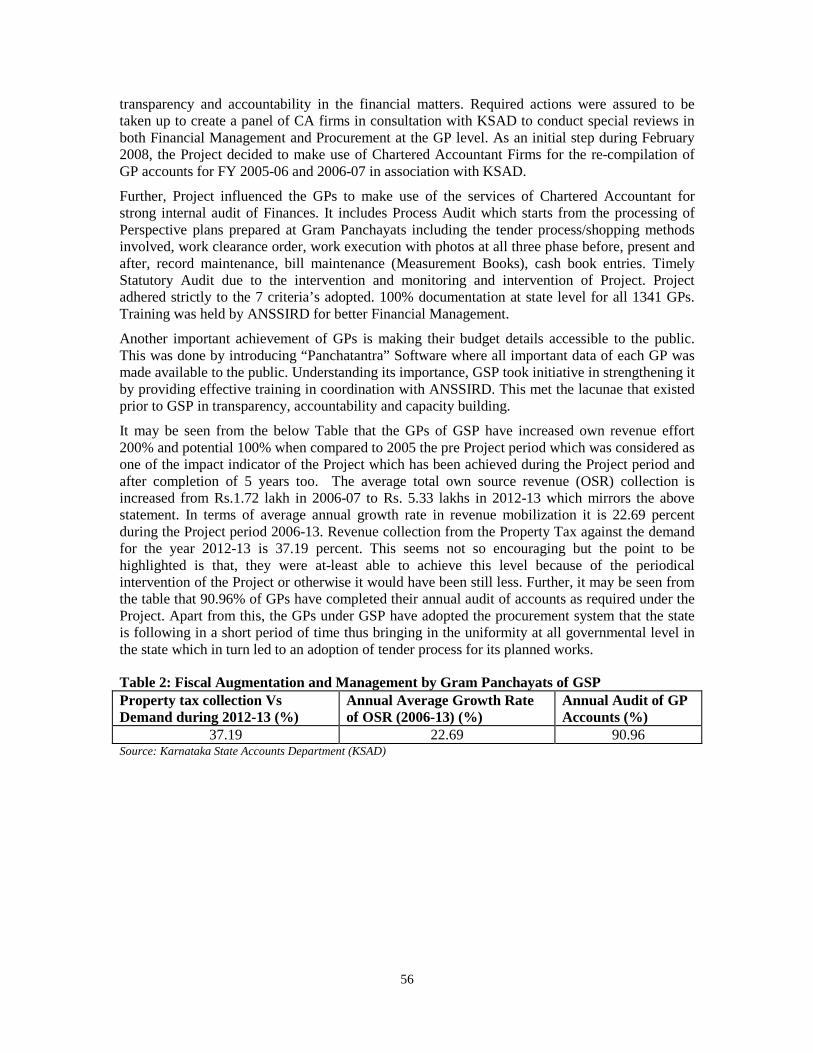
transparency and accountability in the financial matters. Required actions were assured to be taken up to create a panel of CA firms in consultation with KSAD to conduct special reviews in both Financial Management and Procurement at the GP level. As an initial step during February 2008, the Project decided to make use of Chartered Accountant Firms for the re-compilation of GP accounts for FY 2005-06 and 2006-07 in association with KSAD.
Further, Project influenced the GPs to make use of the services of Chartered Accountant for strong internal audit of Finances. It includes Process Audit which starts from the processing of Perspective plans prepared at Gram Panchayats including the tender process/shopping methods involved, work clearance order, work execution with photos at all three phase before, present and after, record maintenance, bill maintenance (Measurement Books), cash book entries. Timely Statutory Audit due to the intervention and monitoring and intervention of Project. Project adhered strictly to the 7 criteria’s adopted. 100% documentation at state level for all 1341 GPs. Training was held by ANSSIRD for better Financial Management.
Another important achievement of GPs is making their budget details accessible to the public. This was done by introducing “Panchatantra” Software where all important data of each GP was made available to the public. Understanding its importance, GSP took initiative in strengthening it by providing effective training in coordination with ANSSIRD. This met the lacunae that existed prior to GSP in transparency, accountability and capacity building.
It may be seen from the below Table that the GPs of GSP have increased own revenue effort 200% and potential 100% when compared to 2005 the pre Project period which was considered as one of the impact indicator of the Project which has been achieved during the Project period and after completion of 5 years too. The average total own source revenue (OSR) collection is increased from Rs.1.72 lakh in 2006-07 to Rs. 5.33 lakhs in 2012-13 which mirrors the above statement. In terms of average annual growth rate in revenue mobilization it is 22.69 percent during the Project period 2006-13. Revenue collection from the Property Tax against the demand for the year 2012-13 is 37.19 percent. This seems not so encouraging but the point to be highlighted is that, they were at-least able to achieve this level because of the periodical intervention of the Project or otherwise it would have been still less. Further, it may be seen from the table that 90.96% of GPs have completed their annual audit of accounts as required under the Project. Apart from this, the GPs under GSP have adopted the procurement system that the state is following in a short period of time thus bringing in the uniformity at all governmental level in the state which in turn led to an adoption of tender process for its planned works.
Table 2: Fiscal Augmentation and Management by Gram Panchayats of GSP Property tax collection Vs Demand during 2012-13 (%)
Annual Average Growth Rate of OSR (2006-13) (%)
Annual Audit of GP Accounts (%)
37.19 22.69 90.96 Source: Karnataka State Accounts Department (KSAD)
56

Own Source Revenue (OSR) Mobilization: Project emphasis on increasing OSR has yielded better results with regard to audit compliances in GSP villages. Perhaps frequent supervision had its effect, but it might have been far more effective to rely on incentives rather than administrative reminders. In the most recent review of the Project, undertaken a couple of months ago, there was a discussion on introducing performance-based rewards to GPs. However, no study or information exits on how OSR targets should be set. Presently the determinants of OSR are not known, underling the need for a study in this regard. Incentives should be designed to promote those determinants. Informed incentivization would be a key to success but just announcing a reward may not move GPs optimally to act on this difficult issue of OSR.
Capacity Building: As observed earlier capacity up-gradation of the functionaries of PRIs and other concerned agencies was an important component of GSP. In this regard it may be observed that about 79 per cent of the elected representatives of PRIs, Self Help Groups (SHGs) and officials received training. To strengthen it further, establishment of 5 SATCOM centers (satellite based training) and face to face trainings at Taluk levels in TRCs (Taluk Resource Centre) was taken up by the Project. Table 3: Capacity Building by Training Programmes under Gram Swaraj Project Sl. No. Details of Training Programmes Target Achievement % to target 1 Empowering of SHGs Representatives 28717 25973 90.00
2 Trainings for Anganwadi Workers and Health Assistants in Community Management System
67818 54852 81.00
3 Training of Anganwadi Workers and GP Presidents on improving health service delivery mechanism
75945 57956 76.00
4 Training GP Presidents, Secretaries, Eos, Account Superintendents & PEO of TP, Team leader of CAs and Accounts Experts
13544 10835 79.99
5 Training Bill Collectors & GP staff 16878 13502 79.99
6 Training on Environmental Frameworks for Environmental Coordinators, GP President, Vice president, Secretary, JEs, SHG members
25869 16769 64.82
Total 228771 179887 78.63
57
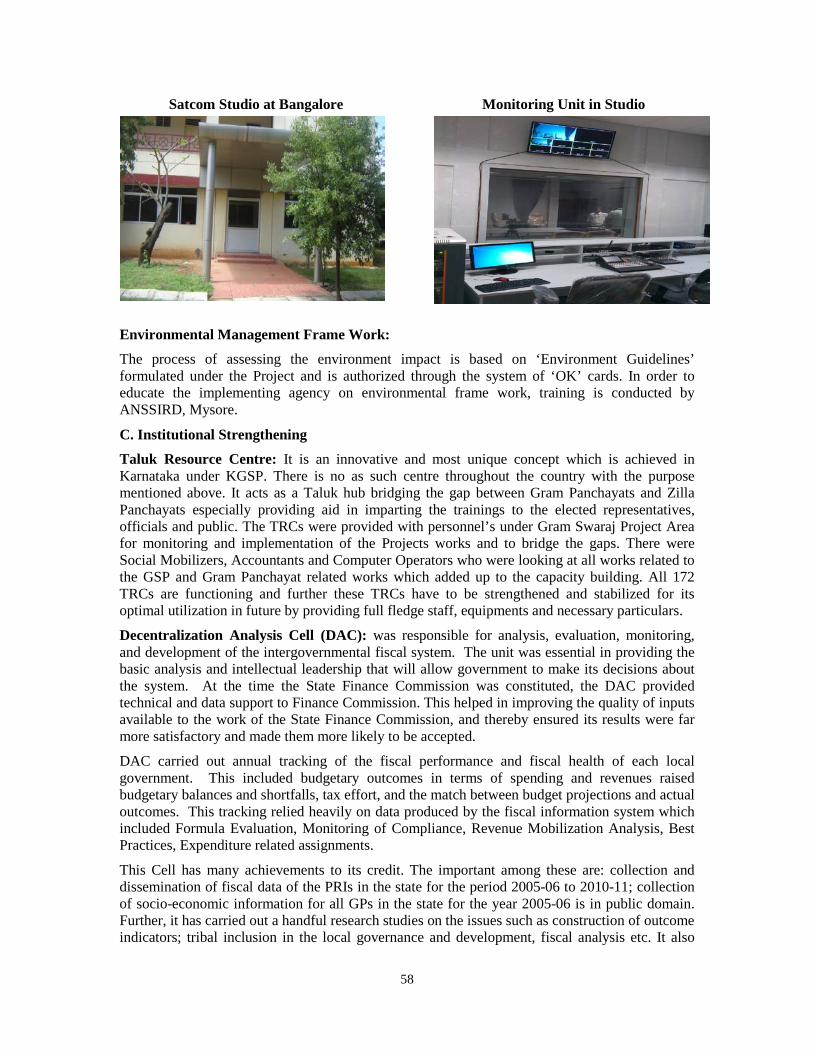
Satcom Studio at Bangalore Monitoring Unit in Studio
Environmental Management Frame Work:
The process of assessing the environment impact is based on ‘Environment Guidelines’ formulated under the Project and is authorized through the system of ‘OK’ cards. In order to educate the implementing agency on environmental frame work, training is conducted by ANSSIRD, Mysore.
C. Institutional Strengthening
Taluk Resource Centre: It is an innovative and most unique concept which is achieved in Karnataka under KGSP. There is no as such centre throughout the country with the purpose mentioned above. It acts as a Taluk hub bridging the gap between Gram Panchayats and Zilla Panchayats especially providing aid in imparting the trainings to the elected representatives, officials and public. The TRCs were provided with personnel’s under Gram Swaraj Project Area for monitoring and implementation of the Projects works and to bridge the gaps. There were Social Mobilizers, Accountants and Computer Operators who were looking at all works related to the GSP and Gram Panchayat related works which added up to the capacity building. All 172 TRCs are functioning and further these TRCs have to be strengthened and stabilized for its optimal utilization in future by providing full fledge staff, equipments and necessary particulars.
Decentralization Analysis Cell (DAC): was responsible for analysis, evaluation, monitoring, and development of the intergovernmental fiscal system. The unit was essential in providing the basic analysis and intellectual leadership that will allow government to make its decisions about the system. At the time the State Finance Commission was constituted, the DAC provided technical and data support to Finance Commission. This helped in improving the quality of inputs available to the work of the State Finance Commission, and thereby ensured its results were far more satisfactory and made them more likely to be accepted.
DAC carried out annual tracking of the fiscal performance and fiscal health of each local government. This included budgetary outcomes in terms of spending and revenues raised budgetary balances and shortfalls, tax effort, and the match between budget projections and actual outcomes. This tracking relied heavily on data produced by the fiscal information system which included Formula Evaluation, Monitoring of Compliance, Revenue Mobilization Analysis, Best Practices, Expenditure related assignments.
This Cell has many achievements to its credit. The important among these are: collection and dissemination of fiscal data of the PRIs in the state for the period 2005-06 to 2010-11; collection of socio-economic information for all GPs in the state for the year 2005-06 is in public domain. Further, it has carried out a handful research studies on the issues such as construction of outcome indicators; tribal inclusion in the local governance and development, fiscal analysis etc. It also
58

entrusted certain studies to external institutions such as “A Study of Panchayats Finance in Karnataka”, “Understanding determinants of own sources revenue mobilization (Monitoring Compliances) in Karnataka’s Gram Panchayats”, “Documentation of Best Practices adopted by Gram Panchayats in the State”. Involved in preparation of Terms of References, RFPs, Feedbacks/Suggestion/Critical Comments on the reports received at different levels and a tight monitoring was done to get the required output.
As the preliminary responsibility DAC analysed and proposed adjustments to the formula to find the eligible local governance by their achievements for the fund allocation done by the government and also devised formula for introducing incentive grants based on the performance of Grama Panchayats under GSP. A recursive analysis on the fiscal data maintained paved way to suggest a Standard Operating System for State Accounts Department (SAD) and RDPR.
Involved in various activities of RD&PR Department like: a. Identification of Low resource base and high OSR Performance GPs for the release of
RGPSA Grants b. Mapping of GPs with respect to village for providing Additional Grants based on
Population 2011 census c. Block Reorganization Commission- Government of Chhattisgarh: Information on Blocks,
reorganization etc. of Karnataka State has been provided as desired by Government of Chhattisgarh.
d. Comments/Feedback by DAC, Rural Development & Panchayat Raj Department, Government of Karnataka on the Draft Report submitted by Task Force- Ministry of Panchayat Raj, in making recommendations for strengthening the Institutions of State Finance Commissions.
e. Involved in furnishing of relevant and required data for the 14th Finance Commission in coordination with the IFA, RD&PR.
f. Involved in furnishing of required data and information for Indian Institute of Public Administration on Devolution Index.
ANSSIRD had the overall responsibility over the capacity building activities through satellite programs, distance learning programmes, face to face training. The funds were released from the Project for all the activities conducted under the Project. The SATCOM sub studios were established in Bangalore, Davanagere, Dharwad, Gulbarga and Mangalore for satellite trainings to be efficient.
PANCHATANTRA: Panchayath Online System - Panchatantra has many features for easy software use like - Local Language Support, Inbuilt Double Entry Accounting System, Online and User Friendly system, Incorporated with Business Rules, Public Interface and other features
59

and facilities in this software. Many new features are added up to Panchatantra like PEAIS Questionnaires, Gram Puraskar Questionnaires, E-Attendance of all Officials, Generation of form-9 and form-11, Street light and Water tap connection, Public grievance through Sakala, NBA Entries etc.
The Pancha Tantra is a web-based application with 3-tier architecture. It is a comprehensive application that meets the basic requirements of the GPs. It has been built with number of features for easier use by the GP staff. The rules and regulations defined in the Panchayat Act are incorporated while designing the PanchaTantra software. It guides the officers to carry out the GP activities as per the rules. This application helps Gram Panchayats to submit the details of various properties, beneficiaries, works, and generate various forms and reports as required and to view various reports maintained. Public can view the information through http://panchatantra.kar.nic.in/stat.
PanchatantraProperty Master
Accounting System
GramaSabha
Village Statistics
Services & Grievances
Development Works
General Information
Advantages:
• Tracking of day to day Financial Transaction by the Zilla Panchayat and other senior officer of the State Level on which performance based money can be transfered to Gram Panchayats.
• This software reduces manual working and increase accuracy of financial statement in the Gram Panchayats.
• Any person in the Gram Panchayats can view all the financial transactions and files profiles of the Gram Panchayats.
• Staff need not know more about double entry system as it is inbuilt in it. • Controlled Funds Management • Complete view of Panchayat at one place. • Easy for record maintenance. • Transparency and complete details of Panchayat made available to public. • A Gate way for Panchayat websites.
Features • Online and User friendly System • Workflow based • Local Language Support • Public Interface
60

• Role based Access and Security • Control at various stages • Transparent & Accountable • In-built double entry system • Performance based fund release
D. Financial Performance The Project components: Component Activities
Original Allocatio
n
Revised Allocation
Budgeted
Released
Actual Expenditur
e
% of Exp. against release
A Block Grants 510 565.44 565.45 565.13 491.9 87.04 B Information
Systems 6.44 6.66 6.49 6.49 6.16 94.91
C Capacity Building 67.37 87.39 86.87 60.04 48.02 79.98 D Project Management
and Coordination 13.5 14.65 14.95 12.02 11.9 99
Contingency 2.7 - - Grand Total 600.01 674.14 673.75 643.67 557.98 86.68 Note: Approved Project Total Cost was Rs. 600 Cr. Due to dollar fluctuation; it gained Rs. 74.14 Cr on it. State Share was Rs. 72.50 Cr.
Utilization of Grants
The information that follows highlights the achievement made in the above activities. Among the activities, the utilization of block grants by the Gram Panchayats is most important. The component-wise details of grants under GSP i.e. allocation, release and actual expenditure is shown in the above Table.
Gram Swaraj Project Releases, Expenditure and Balance (Rs. In Crores)
Year A. Block Grants to GPs B. Information Systems
to Constituents C. Capacity Building of
Panchayats D. Project Management
and Coordination
Releases Expenditure % Releases Expenditure Releases Expenditure Releases Expenditure
2006-07 80.48 80.47 99.99 0.04 0.04 2.42 2.42 0.44 0.44
2007-08 106.52 106.42 99.91 3.67 3.67 12.18 12.18 0.98 0.98
2008-09 132.76 132.41 99.74 1.30 1.30 4.51 4.51 1.46 1.46
2009-10 105.97 105.90 99.93 1.13 1.13 4.85 4.85 2.17 2.17
2010-11 77.94 75.84 97.31 0.00 0.00 6.50 6.50 1.65 1.65
2011-12 4.25 4.00 94.12 0.23 0.23 18.60 18.60 1.95 1.95
2012-13 51.53 38.65 75.00 0.12 0.12 2.42 2.42 1.94 1.94
2013-14 5.45 3.00 55.05 0.00 0.00 35.39 35.39 4.36 2.31
Total 564.90 546.69 96.78 6.49 6.49 86.87 86.87 14.95 12.90
61

E. Project outcomes
Key Performance Indicators:
Service delivery: This indicator has been stressed under GSP and has achieved it with better rating. This is proved by the typologies of works carried out with the quality comparison done under many research works. The Review of Gram Swaraj Project in Koppal District, Karnataka: Some Policy Perspectives shows statistical significant evidence on better service delivery compared to the non-Project area; Empirical Impact Evaluation Study on KGSP throws light on the better quality and durability of physical works carried out in the Project area especially of streetlights, roads and drainages. It also speaks on asset survey with cross cut analysis on the quality, cost-effectiveness, transparency and equity which rates high in the treatment area when compared to other programmes/schemes.
Own source revenue: Important indicator to rate the Project’s performance is OSR. The regular monitoring and intervention by the Project has led to the increased growth rate in OSR. This is annexed in the “Understanding Determinants of Own Source Revenue in Gram Panchayats of Karnataka. The recommendations on OSR and the existing state on the indicator are depicted in detail under “Study of Panchayat Finances in Karnataka”.
People participation rate
The above Table and Graph clearly indicates the increase in people participation during Ward Sabha and Gram Sabha. Especially the participation of weaker sections like., SC/ST and Women is increased to the greater extent.
62

F. Impact Assessment Studies
A number of studies that measured the impact assessment of various initiatives under the Project had been commissioned. These studies looked into specific aspects of focus and provided scope for mid-term course correction of various initiatives under the Project. These studies were conducted by the Centre for Budget and Policy Studies, Institute for Development and Empowerment, World Bank Independent Evaluation Team and Madras Institute of Development Studies. The first two studies focussed on issues related to fiscal performance of Gram panchayats. The study by the independent evaluation focused on a comprehensive study commencing from conducting a baseline and monitoring the programme over the entire duration of the Project. The study by the Madras Institute of Development Studies focussed on evaluation of the capacity building component of ANSSIRD and also developed the decentralised sustainable development indicators that paved the way for ranking of Gram Panchayats in Gram Swaraj Project area by using the measurable and monitorable indicators. The details of few of these studies are enclosed in the Annexure.
Summary The Gram Swaraj Project implemented in the state provided an opportunity to take measures at strengthening of the grassroots level institutions in the most backward Taluks in the state. The components that were addressed under the Project provided an opportunity to the various stakeholders for a better understanding and implementation of the various initiatives under the Project. These initiatives can be summarised as follows:
Infrastructure Development / Improving Services Delivery
• Type of Works focusing on improving the infrastructure in the villages • Focus on the Quality of Assets created
Capacity Building • Training for ANMs, Anganawadi Workers, Elected representatives, Officials etc.,. • Training on Environmental Frame work • Double Entry Accounting System • Usage of Panchatantra Software • Capacity Building on Procurement Method and Issues
Institutional Strengthening • Establishment off Taluk resource Centers (Samarthya Soudha) • SATCOM Sub-Studios • Establishment of Decentralization Analysis Cell • Development and Adoption of Panchatantra Software in all GPs. • Appointment of Charted Accountants for writing double entry accounts and
training to the Gram Panchayats personnel. • Engaging the Man Power at Taluk level as,
1. Social Development Consultant 2. Computer Operator 3. Accounts Consultant
63
With the intervention of the above strategies resulted in the following outcomes.
• 55,127 Quality Assets Created • Improvements in Revenue Collections • Around 2 lakh Individuals are trained • 100% Gram Panchayats Completed Annual Audit • Practicing Participatory Planning • Environmental Management Frame Work-OK Card system • Permanent Infrastructure like, Taluk Resource Center(Samarthya Soudha) and
SATCOM’s • Improvements in Financial Management Double Entry Accounts Procurement System Public Discloser of Information Timely Audit Social Audit (Jamabandi)
Conclusion The success of the programme can be attributed both to the initiatives under the Project as well as the steps taken at the macro level for strengthening of the institutions. The impact assessment studies have shown the way forward for ensuring more transparent and vibrant mechanisms to be put in place to ensure the success of such projects.
64

Borrowers ICR Annexure 1 GRAMA SWARAJ PROJECT
[Distircts, Taluks and No. of GPs]
Sl No. DISTRICT Sl No. TALUK NO. OF G.Ps 1 BAGALKOT 1 BILAGI 18
2 BELLARY 2 KUDLAGI 33 3 SANDUR 21
3 BIDAR
4 AURAD 38 5 B KALYAN 36 6 BHALKI 35 7 HUMANABAD 33
4 BIJAPUR
8 B.BAGEWADI 38 9 INDI 44 10 MUDDEBIHAL 31 11 SINDAGI 40
5 CHAMARAJANAGAR 12 C.R.NAGAR 42 6 CHIKKABALLAPUR 13 BAGEPALLI 24 7 CHITRADURGA 14 HOSADURGA 33
8 DAVANAGERE 15 CHANNAGIRI 61 16 HARAPANAHALLI 35
9 GULBARGA
17 AFZALPUR 22 18 ALAND 39 19 CHINCHOLI 32 20 CHITTAPUR 35 21 JEVARGI 33 22 SEDAM 23
10 KOPPALA 23 KUSHTAGI 28 24 YALABURGA 33
11 MYSORE 25 H.D.KOTE 32
12 RAMANAGARA 26 KANAKAPURA 43 27 MAGADI 32
13 RAICHUR
28 DEVADURGA 28 29 LINGASUGUR 35 30 MANVI 36 31 SINDANUR 34
14 TUMKUR
32 GUBBI 33 33 KUNIGAL 36 34 MADHUGIRI 39 35 PAVAGADA 33 36 SHIRA 36
15 YADAGIRI 37 SHAHAPUR 36 38 SURAPURA 42 39 YADAGIRI 39
Total 1341
65

Borrowers ICR Annexure 2 Understanding Determinants of Own Source Revenue
The Constitution has placed the Gram Panchayat at the centre of the rural governance. While Article 40 of the Constitution envisages the Gram Panchayat to function as vibrant units of local self governance, an attempt turn this into a reality has been made with the 73rd and 74th
Constitutional Amendments which have created constitutionally mandated third tier of government in the rural and urban areas respectively. Karnataka has been in the forefront of experiments with the decentralization in the country. The decentralized governance set up came into existence in the state much before the 73rd and 74th Constitutional Amendments.
Of the three levels of local government, Gram Panchayat is the lowest tier and is closest to the people. It is also the only tier of local government which has the power to tax as per the Karnataka Panchayat Raj act 1993. The own source revenues include taxes on land and buildings, the water charges, license charges, fees for various services and certificates provided by the GP. In addition to these, GPs receive grants from the state and central governments. These grants are generally tied to specific purpose of development activity. The Thirteenth Finance Commission (TFC) highlighted the need for the augmenting the revenues through better tax administration and improved collection efficiency along with provision of better quality of services. Accordingly, the concept of performance based grants was introduced for the TFC period starting from 2010-11.
The Own Source Revenue (OSR) in the GP has been the subject of many studies. These studies have examined the aspect of low OSR collection and reasons for the same. Reluctance on the part of the GP to rise own revenues has been as a principal reason for low OSR. Proximity to voters is a factor that works adversely in the OSR collection as highlighted by many studies. This situation is further aggravated by the state and central governments using GPs as agents for implementing a variety of their developmental programmes stretching their already scarce resources. Higher literacy and lower dependence on agriculture, both indicators of economic development, were found to positively correlate with OSR in the state of West Bengal. Generally, the studies find a positive correlation between economic development and the level of OSR.
The present study attempts to identify determinants of OSR in the GPs of Karnataka. A purposive stratified sample of 128 GPs, equal number of good performing and poor performing GPs, were selected for the purpose of the study. The administrative division as well as the development category as identified by the High Power Committee for Redressal of Regional Imbalances (HPCRRI) headed by Dr D. M. Nanjundappa was considered while selecting the sample GPs. The sample GPs are spread over all the four divisions, 24 districts and 64 Taluks. Instruments for primary survey were piloted in a GP followed by their finalization in consultations with experts and Decentralization Analysis Cell. In addition to primary data collection, the study also involved interviews with the GP members as well as the Focus Group Discussions with select members of public in the GP.
The secondary data analysis was done on the basis of socio economic survey data provided by the RDPR. In addition to confirming the relationship of OSR with variables of economic development, the secondary data also revealed issues relating to tax administration. The outlier1 GPs were analysed to identify the underlying factors for poor performance despite favorable circumstances and good performance in spite of unfavorable circumstances. It was seen that the GP elected members’ experience and education had a positive correlation with OSR collection. Good performing outliers were seen to have better tax record management.
The primary data analysis involved relating OSR performance with various demographic, socioeconomic and other variables like population, literacy, the distance to the Taluk and district head quarter, closeness to highway, proportion of SC/ST in the total population. The primary data
66

analysis also involved detailed examination of tax administration, book keeping, tax collection efforts, updating of various registers and so on. The GP members’ interview were analysed for their responses. The FGD and the field observations were also analysed.
The study finds that management of tax records including their periodical updating, availability of adequate human resource capacity, attitude of elected members were some of the significant determinants of OSR. The study revealed that the differences across divisions were more marked than across development category.
On the basis of determinants identified by the study, it is felt that there is a need for a) supervision of GPs by either the TP or ZP in respect of revision of tax rates, enhancing the tax base and overall performance with regard to OSR collection, b) improvement of tax administration in terms of engagement of sufficient number of bill collectors, payment of their salaries in full and on time, proper maintenance of tax related records, etc. c) building capacity of elected representatives in tax administration and motivating them to take leadership role in development of the GP. 1 GPs belonging to forward category Taluks and with otherwise positive development indicators
performing poorly on OSR collection and GPs belonging to most backward category and with otherwise poor socio economic indicators performing well on OSR collection.
67

Borrowers ICR Annexure:3
Study of Panchayat Finances in Karnataka The findings based on the analysis of the secondary data it is summarized as follows:
• The socio-economic data was made available for one year only. In the absence of comparative data for the subsequent years the data could not be used for analysis. The data was used for statistical analysis but no significant correlation could be found on the issues covered in the study. However the efforts made to collect the authentic data village wise for each of the Gram panchayats in the state need to be appreciated and the format can be used for up gradation of the data on a regular basis by the Gram panchayats in the state. The enormous data thus collected could be very useful for preparation of a plan/action plan at the Gram Panchayat level. It is essential to keep in mind that the data collected could be used to develop indicators which can measure the performance of Gram Panchayats in those areas. A format with the list of indicators that were tested and finalized in a Research Project under Gram Swaraj conducted by the Madras Institute of Development Studies is suggested in the recommendations.
• The data available on the receipts and expenditure of Zilla Panchayats indicates that the funds released have increased from Rs.4279 crores to Rs.5515 crores during the period 2005-06 to 2008-09. The expenditure also has increased from Rs. 4572 crores to Rs.4801 crores during the period. The percentage of utilization of funds has increased from 80.3 per cent to 87.05 per cent during these years. The details of receipts and expenditure under different schemes/heads indicates that sectors like Education, Health and Family welfare and rural development programmes receive the maximum share. Water Supply and Sanitation which received nearly Rs. 402 crores funds during the year 2005-06 received Rs. 2.86 crores during 2008-09 due to transfer of schemes to the Gram Panchayats. The percentage of utilization of funds is also significant in these sectors and schemes. However data on the expenditure incurred under the plan and non-plan would have shown more interesting results.
• The details of capital account expenditure show that the Water Supply and Sanitation sector, Welfare of SCs/STs/OBCs followed by construction of Roads and Bridges get the maximum share under the head. However there has been a drastic reduction in the outlay available for the water supply and sanitation sector from Rs.348 crores in 2005-06 to Rs.1.90 crores during 2008-09. A possible reason for this could be that the maintenance of all water supply schemes was transferred from ZP to Gram Panchayats. Overall figures indicate that the capital outlay available to the Zilla panchayats constitutes a small percentage of the total receipts for the year.
• There are a few sectors where the percentage of utilization of funds exceeds the receipts and the same needs close scrutiny. During the period the opening balance at the treasury has not shown much variation but with the banks it has increased by nearly 16 times from Rs.50 crores to about Rs.814 crores during the period 2005-06 to 2008-09.
• The analysis of the receipt and expenditure of Taluk panchayats also shows that certain areas have recorded impressive performance across all categories of Taluks. The capital account expenditure across the Taluks is not significant.
• The analysis of the Taluk panchayat data on the receipt and expenditure under various development heads indicates that they do not receive sufficient grants to take up any meaningful development works in the Taluks. The picture is the same across all categories of Taluks. Even where the funds are released they are mainly related to salary expenses or the funds which are released to the gram panchayats through the Taluk panchayats.
• There has been a significant increase in the opening balance of Gram Panchayats over the years. The reasons for this can be traced to the increased flow of funds to the Gram Panchayats especially under the MNREGS, delays in the utilization of funds etc. Discussions
68

with the GP officials during field visits indicated that this is also due to late release of funds by the State and Central governments for various development schemes during the end of the financial year.
• The own source revenue of the Gram Panchayats have improved by more than 50 per cent between 2005-06 and 2008-09. This increase has taken place across all the districts in the states and different categories of Taluks.
• The percentage of own sources of revenue to total funds available with the gram panchayats shows a decreasing trend from 13.41 per cent to 8.83 per cent. This is possibly due to increased grants for various development schemes released to the Gram Panchayats.
• Grant-in-Aid as a percentage of total funds of the Gram panchayats has been showing a decreasing trend during the study period
• Resource mobilization through taxes by the Gram Panchayats as percentage to total funds (including the opening balance) has decreased and Non-tax revenue also shows a similar trend. The data shows that the revenue from the tax and non-tax sources have been increasing across the districts during the period.
• Percentage of Tax revenue to total own source of revenue has marginally increased whereas there has been a decrease in the non-tax revenue mobilization by the gram panchayats over the years.
• The general picture that emerges from the analysis of the per capita income across the GPs in the districts in the state indicates that over the period in a majority of the district’s the per capita tax mobilization has increased over the period. There are districts which have shown significant improvement in the tax mobilization efforts.
• Property Tax is one of the important sources of revenue even though it constitutes a small percentage of the total revenue of the gram panchayats. A noteworthy feature across many districts is that the per capita property tax mobilisation has shown significant increase during the study period.
• The non-tax mobilization efforts also showed marginal improvement in many of the districts across the state. However the relatively developed districts in terms of agricultural activities showed a negative trend in non-tax resource mobilization.
• The Total Own Source resource mobilization by the Gram Panchayats across all the districts of the state has shown an increasing trend during the study period. The total funds that accrued to the Gram Panchayats in the state comprising tax, non-tax, and grants from State and Central governments have shown significant increase from 931 crores to 2259 crores during the years 2005-06 to 2008-09. This is due to increased flow of funds for development works under some of the flagship programmes of the State like MGNREGS, Rural Housing etc. Similar is the trend with respect to expenditure pattern by the Gram Panchayats which has increased across all the districts of the state. This is also due to the reason that the expenditure on development schemes has been increasing over the years at the grassroots level.
• Fiscal data on expenditure as a percentage of the total funds available with the Gram Panchayats show a decreasing trend from nearly 76 per cent to 72 per cent during the study period. This is also one of the reasons for the rapid increase in the opening balance of the Gram Panchayats. A possible reason for this could be that the staff at the Gram Panchayat level is overburdened with the implementation of a large number of schemes coupled with delays in getting necessary administrative and technical approval for projects. However the administration needs to be toned up for effective utilization of funds.
• Expenditure by the Gram Panchayats has been showing a steady trend during the study period. The district wise expenditure shows variations from year to year. The point to be noted is that the larger issues related to devolution of functionaries to the Gram Panchayats along with adequate freedom in expenditure decisions need to be addressed at the policy level.
• The field studies also focused on another important issue of functioning of Gram panchayats as per the provisions of the Act. The initial analysis of the data shows significant
69

improvements in the functioning of GPs in GS Project area compared to non-GS Project area under certain issues. It may added here that the focus of the field visits was on regular conduct of monthly GP meetings, ward sabha, gram sabha, formation and functioning of standing committees, preparation of budget and action plans, Jamabandi and audit related issues, maintenance of records, and certain social development parameters and service delivery related issues etc.
70
Borrowers ICR Annexure 4
The Review of Gram Swaraj Project in Koppal District, Karnataka: Some Policy Perspectives
This report presents a review of the Gram Swaraj Project (GSP) implemented in four Taluks of Koppal District. The exercise has a limited coverage in area because the intent was to go beyond official data and examine Project outcomes as viewed in household perceptions on Project outcomes and analyze this information econometrically. The question we faced while designing this exercise was whether we should go extensive and keep focus on official data or reduce the geographical coverage but make the exercise more intensive by obtaining detailed information and analysing it thoroughly. Since a larger macro exercise to evaluate GSP is already in the offing and since variability in changes of outcomes obtained from official data across the state was rather narrow, the decision was taken to increase the depth of analysis and focus on finding out how households evaluated the Project results.
Accordingly, 240 households were selected randomly across 12 village situated in 6 Gram Panchayats (GPs) of Koppal district, a half of which have been implementing GSP and the other half have not had the Project and thus were taken to be control GPs. The ‘treatment’ and ‘control’ dichotomy in sample helped us separate the effects of the Project from other effects on outcomes.
The Project has aimed to fill key development gaps in 39 most backward Taluks of the state. First, it has sought to increase the development resources of these backward GPs by not only emphasizing on higher generation of own source revenue (OSR) but also by giving Project grants to increase their capacity to undertake investment. Additionally, keeping in view the need to improve local management capacity, the Project sought to allocate block grants, rather than tied funds, so that the GPs can carry out their own prioritization and planning. Third, through extensive training and equipment supply the Project sought to build local management capacity in both handling of operations and procurement and accounting. Fourth, a number of process improvements were promoted such as tendering of works, internal audit and mandating the release of tranches of grants conditional to completing accounting of funds already released. Finally, it sought to promote enhanced participation, transparency and accountability. The expectation was that these process improvements would not only yield efficiency gains in the use of GSP resources but would also have spillover benefits and thus improve local service delivery in general.
The review exercise has shown that GSP outcomes were not realized fully as expected. The score is mixed at best. While OSR did improve in treatment GPs, over the control ones, and performance on audit and account keeping improved, it was not clear if gains indeed reflected the full potential of the process improvements. For one, though OSR performance improved over control GPs, yet it remained far below the goals set by the Project. In regard to process improvement practices, such as gram sabha attendance, representation of the weaker and marginalized sections in such meetings showed little improvements. The spill-over benefits seemed limited at best, as the quality of services delivered across treatment and control villages showed no (statistically) significant variation. Significantly, denial of wages programmed under MGNREGA was consistently lower for the households in GSP villages than for households in non GSP villages. But school, health and water services showed no correlation whatsoever with whether a village had GSP or not. This pointed to the fact that sector services ran quite independent of the household views, thus calling for convergence of services for more effective monitoring and programming.
This rather a mixed result posed a serious question. Why should enhanced participation, transparency, accountability, local financial autonomy local selection of works and local role in
71

procurement should all have no clear impact on outcomes? These improvements are known, theoretically as well as in development practices globally, to make a positive difference. Why then did they not have a significant impact on the results of this Project? This led us to examine various aspects of the Project design. The exercise brought out two sets of design gaps: a system gap and a number of policy gaps which did not allow intended process improvements to occur fully or to improve results.
The system gap discussed in the report refers to seriously weak accountability in implementing the Project as also in delivery of rural services in general. Since community gets most of these services free, and the suppliers of service is paid not by the recipients of service but by government agencies that do not directly benefit from the service, the accountability equation becomes unclear in the situation. The supplier may not care for or be sensitive to the needs of the recipients of service, and may thus not have adequate incentive to ensure quality. In fact, the funding agencies or their lower hierarchy may seek rent where they can manage net personal gains, rather than drive the providers towards best performance. Recipients of service, on their part, may have very little control over providers or recourse against delivery failures due to difficulty of access and lack of easy recall of public servants, elected and tenured.
This broken accountability chain may further weaken recipients’ demand for quality of Project outcomes due to public goods failure inherent in the situation.55 All this may lower effective monitoring and seeking recourse in event of failures or quality compromises. This calls for fixing the system gap. The report recommends the setting up of an independent monitoring mechanism to ensure accountability.
The report underlines several policy gaps. First, it emphasizes the need for explicit incentives for performance in several aspects of Project outcomes. In particular, it advocates for incentivizing OSR collection and performance of GPs in several other areas. It also calls for balancing participation of the weaker section in gram sabhas especially to enhance their say in selection of works. It calls for integrating various works while tendering so that tenders are not fragmented and are of a minimum size to attract established contractors. It underlines the need for enhancing transparency such as by pasting information on GP notice board about procurement quantities and costs, wage payments, payment received by each laborer. This will allow villagers to have easy access to these pieces of information and effective monitoring.
The report also advocates a compact approach in selection of work, so that approval of work is tied to villagers undertaking feasible and monitorable social responsibilities, in lieu of receiving public funds for their proposals. These responsibilities may include girls’ school attendance, prevention of early marriage, birth control or improvement in sanitation.
Above all, the report underlines the need for a continuous listening to the field by an expert group with a view to identifying programme and policy gaps and making policy proposals for correcting institutional and policy hurdles. The recommendations of this group should be submitted directly for consideration by the government. It is only through constant upgrading the programme and policy environment that can significantly improve efficiency and effectiveness of rural services. The report recommends the combining of the independent monitoring and the policy review and development functions into one mechanism.
To conclude, the report makes the following major recommendations:
i. Setting up of a mechanism for independent monitoring of services and continuous
72

listening to the field with a view to identifying institutional and policy hurdles holding results of GSP and other rural services, and to periodically propose reform.
ii. Incentivise Project activities and goals such as OSR collection, and enhance transparency, accountability and participation (ITAP) in Project processes.
iii. Promote convergence of services in planning and monitoring. iv. Promote compact approaches for behavior change, better monitoring and for higher
accountability.
Comments from the Borrower’s on Draft ICR
This has reference to your email dated September 9, 2014. The comments of the Project Monitoring Unit on the draft ICR are as follows:
i) In the rating summery the outcomes, Bank performance and borrowers performance are rated Moderately Satisfactory. The project outcomes are substantial and highly replicable in nature. Some of the outcomes have already been replicated and adopted in non project GPs and in other programmes implemented by the Rural Development and Panchayat Raj Department. To achieve this, Project Facilitation Team has put in all its efforts with the help of timely intervention and support of World Bank. Bank has given full co-operation and advise not only in Programme Implementation but also in timely release of funds. Hence the rating of the Project Outcomes, Borrowers performance and Bank performance should be ‘Satisfactory’.
ii) In Page no.11, para no.43, there was a mention about Project Facilitation Cell at State level. The sub unit was created at Gulbarga one of the northern districts of the state to cater the needs of northern taluks of the project. This has helped in better co-ordination and implementation of the project.
iii) In page no.12 at the end of the para 44 the word effectively to be inserted (Which did not happen effectively).
iv) In page no.13, para no.51- as per the base line report District level trainings, refresher
trainings and workshops were conducted to educate the stakeholders as an IEC activity.
v) In page no.14, para no.53- sufficient information on People Participation especially
Women and vulnerable groups during the conduct of Ward Sabha and Gram Sabha were captured and maintained in the Gram Panchayats.
vi) In page no.14, para no.54- Adequate training and hand holdings were given to the
Panchayat officials on Panchatantra and Procurement issues not only in Project GPs but also in non Project GPs.
vii) In page no.14, para no.55- The service of Three consultants at Taluk as Social
Development, Computer Operator and Accountant was continued till March 2013. The project sustained well even after their dis-continuation.
73

viii) In page no.15, at the end of the para 61 the word at macro level to be inserted (happened at macro level). DAC has also taken up the Study on Understanding Determinants of Own Source Revenue.
ix) In page no.15, para no.62- The fiscal data collection was started in 2008 instead of
2009.
x) In page no.16, para no.67- Transparency and Accountability practices were enforced and Social Accountability (JAMABANDHI-SOCIAL AUDIT) were conducted. A Dedicated Environment person was recruited and Environmental Management Frame Work guidelines, Training modules and OK Cards were prepared and conducted trainings to the Implementing Agencies.
xi) In page no.18, para no.76- The Public Discloser of information on works taken,
execution, expenditure made and procurement issue was made 100 percent. Awareness campaign, Kalajathas, Films, Adds, hoardings and pamphlets etc., were done to build the capacity of the constituents.
xii) In page no.20, para no.85- Out of 175 Taluk Resource Centers 172 TRCs have been
completed and dedicated for conducting Trainings.
xiii) In page no.22, para no.90- The block grant disbursement is 100 percent and its utilization is 97 percent by the project GPs.
~~~***~~~
74

Annex 8. Comments of Co-financiers and Other Partners/Stakeholders Not applicable
75

Annex 9. List of Supporting Documents referred to in the ICRR • Najundappa Report, 2002 • Karnataka Gram Swaraj Project(KGSP) – Project Appraisal Document • KGSP – Aide Memoires of Implementation Support Missions, June 2008, August 2009 - 13 • KGSP – Implementation Status and Results Report Nos. Sequence 1 – 17 • Bank Mid Term Review, 2010 • KGSP – Restructuring Papers of 2011, 2012 and 2013 • KGSP – Credit Agreement, 2006 • ‘Understanding Determinants of Own Source Revenue Mobilization Monitoring
Compliances in Karnataka’s Gram Panchayat’ available on RDPR website(http://rdpr.kar.nic/in)
• ‘A review of The Gram Swaraj Project in Koppal District, Karnataka: Some Policy Perspectives’ available on RDPR website(http://rdpr.kar.nic/in)
• ‘Outcome Indicators of GSP in Selected Taluks of Karnataka- A Review’ (draft) • ‘Tribal Population in GSP Area Their Inclusion and Fiscal Devolution in PRIs’ (draft) • Impact Evaluation Report – Gram Swaraj Project by CMSR, 2013 • World Bank Country Assistance Strategy 2001-2004, 2005-2008 • IEG Guidelines for Reviewing World Bank Implementation Completion and Results
Reports: A Manual for Evaluators
List of individuals consulted for this ICRR Government of Karnataka Mr. T.M. Vijay Bhaskar Additional Chief Secretary Mr. Gangaram Baderiya Secretary, RDPR
Sri Yalakki Gowda K Chief (I/C) & Director Panchayat Raj, RDPR Dr. M.R. Ekanthappa Additional Chief (Operations) Mr. Najunda Rao Chief(I/c) and Director, PMI- RDPR Mr. Venugopal Research Assistant Ms. Sowmya Programmer
WORLD BANK Mr. Michael Haney Operations Adviser Ms. Rinku Murgai Lead Poverty Specialist Mr. Abdu Muwonge Senior Economist Mr. S. Krishnamurthy Sr. Financial Management Specialist Mr. Kalesh Kumar Prog. & Capacity Bldg Coordinator (Procure) Mr. Satyanarayan Panda Procurement Specialist Ms. Ruma Tavorath Sr. Environmental Specialist
List of individuals on the ICRR Team
Immanuel Frank Steinhilper Consultant Sapna Kedia Consultant Rajiv Raman Consultant Ms. Vidya Kamath Program Assistant Savita Dhingra Sr. Program Assistant
76

MAP
77