document mune - eric · document mune. bd 092 735' cb .001 465. ... ise a neat. lettered...
TRANSCRIPT

DOCUMENT MUNE
BD 092 735' CB .001 465
AUTHOR,
Tiflis, Samuel E.; Donaghay, Herbert C.TITLE Physical Science Experiments for Scientific
Glassblowing Technicians.INSTITUTION New Jersey State Dept. of-Education, Trenton. Div. of
Vocational Education.; Rutgers; TheState Univ., NewBtunswick, N.J.'Curriculum Lab.; Sales. CosaunityCol?" Penns Grove, N.J.
PUB DATE Sep 73 k '-NOTE 78p. ' 'AVAILABLE uon- N. J, Voc-Tech Curriculum Laboratory, Rutgers-,Univ.,
Bldg. 4103-Kilmer Campus, New Brunswick, N. J. 08903($2.00 plus postage)
EDRS PRICE MF -$0.75 HC -$4.20 PLUS P0aTIGE .
DESCRIPTORS *Glass; Laboratory Equipment; *LaboratoryExperiments; Physical Sciences; *Science Experiaents;Science LAboratories; *Technical Education;
. TrainingIDENTIFIERS *Gliss Blowing
ABSTRACT. ..
The twenty experiments In this text have beendesigned to give.tke scientific glassblowing technician theopportunity -to use scientific glass apparatus in the study of .
physical science. Primary emphasis of these experiscience prog am as a working
nts is do the
iepractical application of the physical'tool for the scienkific glassblowinq technician. T e experiments are:precision.measurement, elasticity acrd tensile strength, Archimedesprinciple, specific gravity and density ofsolits and liquids,Boylets-Law of Gases, study of the thermocouple, lineai expansionKith temperature, beating value of fuel, specific beat of 'solids,latest heat and,change of state, velocity of sound hy, resonanceaethode, photometry and illumination. £lso: study pfsphericalmirrors, index of refraction, image formation ly a thin lens,polarization of light, internal strain in glasi, glass tube bendingand breaking points, glass annealing, and glass strength testing. Ihepurpose of each experiment is stated, apparatus listed, and aninformation section provided. The procedure is described, followed byquestions for analysis and interpretation. (Author/DS).
.,
r

1001111.40
a
0,-woripe114
44 s
soma Awriist IL* #":"
PIPSOWNCIII0Ale.
11,
d'ai.* JUMP

I

rr- f13,;s111P.7r
. :44
iY
wrf
0
44*
SS"'
1;7:

reNtiCT`
,State of New JerseyDepartment of Education
LL. Division of VtcationaI Education
PHYSICAL SC.IENCE EXPERIMENTS
FOR
SCIENTIFIC GLASSBLOWING TECHNICIANS
Samuel E. Tiflis, ChairmanEngineering Science Department
".Herbert C. Donaghay, DirectorSalem Community CollegePenns Grpve, New Jersey
Vocational-TechricalCurriculum LaboratoryRutgers The State UniversityBuilding 4103 2 Kilmer CampusNew Brunswick, New Jersey September 1973

DIVISION OF VOCATIONAL EDUCATION
STEPHEN POLIACIK, ASSISTANT COMMISSIONER
-MORTON MARGUES, ASSOCIATE DIRECTOR
CURRICULUM LABORATORY
RUTGERS THE STATE l NIVERSITY
BUILDING 4103 KILMER CAMPUS
)NEW BRUNSWICK, NEW JERSEY

.11
PREFACE
This laboratory text is designed to give the scientific zlassblowingtechnician the opportunity to use scientific glass apparatus in the. study ofphysical science.
The experiments chosen for this project were selected with primaryemphasis on the practical application of the,physical science program as aworking tool for the scientific glassblowing technician.
.These experiments will require maximum cooperation between the
scientific glassblowing instructor and the physicl scie- ce instructodSincethe burners used in most physical science laboratories do not produceenough or the kind of heat necessary for working with glass, several of theexperiments will have to be performed in the glassblowing laboratory.
If it is possible, the apparatus in each of these experiments shouldbe fabricated in the school's laboratory for use in the physical scienceexperiments.
Some of the equipment needed will be too complex for the firstyear student to fabricate while taking the physical science course: theseitems can be fabricated by the second year student for use in the physicalscience laboratory. .

Preface
TABLE OF CONTENTS
Page
Introduction iii
Laboratory Report Format iv
Experiment:
I Precision Measurement 1
II Elasticity and Tensile Strength 3
III Archimedes Principle 9
IV Specific Gravity and Density of Solids and Liquids 11
V Boyle's Law,of Gases 15
VI Study of the Thermocouple 18
VII Linear Expansion With Temperature 21
VIII Heating Value of Fuel 24
IX Specific Heat of Solids 9 26
X Latent Heat and Change of State 29
XI Velocity of Sound by Resonance Methods
XII Photometry and Illumination 39
XIII Study of Spherical Mirrors 43
XIV Index of Refraction 48
XV Image Formation by a Thin Lens 52
XVI Polarization o' Light 57
XVII Internal Strain in.Glass 60
XVIII Glass Tube Bending and Breaking Points 62
XIX Glass Annealing 65
XX Glass Strength Testing 68
tI

C
INTRODUCTION
The experiments to be accomplished in thii series will be keyed asclosely as possible to the study of glass and t application of blown
itscientific glass *apparatus developed in the schoo glassblowing laboratory.
( This course will be offered as the fit science course for theglassblower; therefore, he will not have as yet developed the ability todesign and fabricate his own apparatus. The experience in these laboratoryexperiments will be of assistance in helping him understand the accuracy/and skill necessary for the good rdesign and fabrication of scientificlaboratory glassware.
The apparatus used in these experiments should be encouraged asspecial projects in the Glass Fabrication end Isign Course in the secondyear of Scientific Glassblowing Technology. This fabrication of theapparatus will afford the student an opportunity tc build apparatus thathe understands how to use. It will act as an incentive to the students whofollow in the program and give some, insight into the standards of accuracyneeded in glass fabrication.
Laboratory, reports will be written for each experiment using theformat on the following pages.
410

J
Experiment No.
LABORATORY REPORT FORMAT
Name and Number of Course
Name
Date
Lab Section
Title Instructor
Body of Report
Purpose:
State the general piiiiciple being studied and any specific results to he obtained.The brief statement of purpose should. be the product of your own thought.
Method:
Describe briefly how the experiment was performed. The description should be inyour own words. It should not be copied from the manual.' Ise a neat. lettered sketch ordiagram whenever possible. Sketches may be in pencil.
Data Sheet :
This is the actual data sheet on whksk you recorded data in the laboratory. Formthe habit of neatness with your otiOnal laborlsory notes so that they will be suitable forinclusion in the report.
ResultsWhat did vou find from the investigation? Show the calculations you used. These
should be in skeleton form. Do no clutter tk the laboratory report with arithmetic.
Siortmari:c the results in table whenever possible. Display your answersprominently and in such a manner that the person who reads the report wilt he able totell readily that you have actuall verified the principle or law being studiO. Give carefulatt:ntion to.proper units.
Analsis and Interpretatimn:Identify aad discuss vrnir errors and the possible sources of error in the particular
C,Periment Calculate the perc,flt error of N()tir results. Point out practical applications ofinc 1)1,1 the cxrcrinicrit mr serifs the principle under
iscussion: Pros, to %ourself and to the instructor that it did or did not.
IV

EXPERIMENT I
Precision Measurement
Purpose:To study some instruments and methods of precision measurement; and to
compute the volume and density of gla apparatus.
Apparatus:,
Steel rule; inside and outside calipers 'oath vernier and micrometer (English andmetric): comparator with dial accurate to 0.0001 inch; laboratory balance and weights;set of gage blocks (English and metric); laboratory glass beakers; flasks; cylinders; rods;and tubes (calibrated and uncalibrated).
Information.Measurements are one of the most essential parts, of the scientific glassblower's
fabrication project. Accuracy of .001 inch to .00001 inch are common in scientificapparatus. The student must be thoroughly familiar with both the English and metricsystem of measurement. Most scientific glass apparatus is built to metric specifications.The student will review units of measurement in both the English and the metric systemsand the conversion factors from one system to the other.
Procedure:With the instruments, and the aid of manufacturers' specification charts, practice
twil accurate readings fron. vernier caliper and micrometer caliper can be obtainedeasily and quickly.
Part I. Conventional Measuring InstrumentsI. With the steel rule, take and record all.measurements necessary for calculating
the volume of a glass rod, tube, beaker, and cylinder.
V = irr21; or V= ird2h-4
2. Repeat measurements from step I with the English vernier caliper.3. Rcpt measurements from step 1 with the metric vernier caliper.
4. With both English and metric micrometer calipers measure the diameter ofthe rod, beaker. tube, and cylinder.
5. Check the accuracy of the measurement in step 4 by using the comparatorwith the dial indicator.
6. Weigh the beaker, rod, tube, and cylinN, (calibrated and uncalibrated) on thelaboratory balance to the nearest 01 gram.

.1; $ . .
-i,!;
A
,t
BEST COPY AVAILWLE
4
r
.4
.4

Ultimate tensile strength. The force per unit area (stress) at the instant a materialpulls apart is known as the ultimate strength. All of the gage readings in this data tablewill be in pounds per square inch (psi); therefore, the student will have to convert frompressure in psi to force in pounds to set up the measurement increments called for in thisexperiment. The force-pressure relationship will be used.
P FAR
Or F = PAR
where:
P = gage pressure in psiF = pounds
'4R = hydraulic jack Yarn area
.373 in? = jack ram area when it is extending or being used to gi7e a compressiveforee7'
.223 in' = jack ram area when it is retracting or being used to give a tensional
force.Procedure:.
Part I. Tensile Stress (Elasticity and Tensile Strength)1. Set up the model 9014 using the long, :rods to give. the long configuration.2. Measure length of sample between fillet ends (between rod ends for glassThand
sample diameter (sample series .00001).3. Install micrometer on a sample with adapters 14-16-000 and 14-17-000
and ension 14-05-000 and crew sample into lower holder 14-00-021.4. Make sure :pump hoses are set to tension with heavier hose.on top port of
jack and the polariscope in place for the glass and plastic samples.54 Load samples in increments-and record elongation.
Sample IncrementAluminum 50 lb.Steel 100 lb.Brass 100 lb.Plastic 1014.
Maximum
350 lb. )
600600Ib.100 lb.
When pressure has been released after completion of experiment, record lengthand diameter of sample again to determine permanent sample deformation.
6. Sketch the change in light patterns. within the test specimen. Note color andlocation of bands.
7. Repeat Steps 3 through 6 for hard glass.8. Repeat Steps 3 through 6 for plastic.9. Repeat StePs,3 through 5 for brass.
10. Repeat Steps 3 through 5 for steel.1
5

6
BEST COPY AVAI 9 E

Part II. Compression Test (glass andplastie only; elasticity and tensile strength)
1. Set up the model 9014 using the short rods to give the 'short configuration.The setup for axial compression is shown in Fig. 18, p. 30 of Scott Manual9014. The spider must be raised to put in the micrometer adapter14-06-000. Before ,petting in the top yoke make sure that space support14-000-010 is in place between the rods. Use the long spacer 14-000-009..
2 Set up the Polariscope model 9015 with model 9014. Adjust the analyzer(front pin), and the quarter wave plate (pins .on back of analyzer portion andfront of main unit) to 0°.
3. Measure length and diarrieter of sample to be tested (.0002 series).4. Make sure the pump iS.s'et up for.carnpression (heavy hose at the bottom port
of jack) and 1000 psi gage is in position on the pump.5. Turn on white light in polariscope and put plastic sample in place. Slowly
pump up 400 psi gage pressure and observe color change and bands,forming as.pressure is applied. Each band indicates a region of constant force. Sketch thechange in light patterns within the test specimen. to color and location ofbands.
6. Release pressure and reapply pressure,recordingcompression and force applied'at convenient intervals ion 600 psi of pressure.
Part III. Shearing Stress (in brass and steel only)1. Set up Scott Materials Test as shown in figure 5 and 7 of the Scott
Engineering Instruction Manual 9014.
2. Measure and record diameter of shear pin on apparatus.3. Insert brass shear test specimen.4. Begin to apply force to specimen. Record .applied force.5. Repeat Steps 2 through, 4 for steel test specimen.
Calculations:Part I. Compute the cross-Sectional area of each object. Using recorded force data and
atea calculation's, compute the tensile stress!' each object. Using. recordedmeasurements of change in length and original length, compute the strain oneach object. Determine Young's modulus for each type of material.
Part II. Sketch and color the action of the glass and plastic reaction under tension andcompression.
Part III. Calculate the area of the shear pin and using rthe force data determine theultimate shearing stress in the brass and steel.
7

e a.
Analysis and InterpretationPlota stress-to-strain curve for each material under tension.Label the elastic lirhit on each plot.
1. Hoy, do the values of stress, strain, and `!oung's Modulus compare toreference values?
2.,, In brief, describe how this experiment would be used to aid in the'desiin
of glass apparatus.
8
;.;

EXPERIMENT III
Archimedes Principle
Purpose:.To study the principles of flotation and bu. oy.ancy and to verify Archimedes
Principle.
Apparatus:_ . ..1
Overflow can and catch bucket; triple beam, balance; soda lime glass block; leadglass block; cork 'block; *Ater; glycerin; thermometer; and hydrometer.'
4
Information: .
Archimedes, an early. Greek experimenter, states thart an object in a fluid-isbuoyed up by a force equal to the weight of the fluid .move aside. If the body floats in41,the fluid, then the buoyant force must be equal to' the weight f the object. Therefore, afloating object is said to displace its own weight in a fluid in which it floats: If the objectis more dense or heavier than the fluid, it sinks and displaces an amount of fluid equal toits volume; the buoyant force is equal to the weight of the volume of fluid moved aside.The buoyant force equals the apparent loss in weight of the object when it sinks in thefluid.
ff
ro4
where:
then:
e,
where:
FB = Wt
FB = force of buoyancy
W = weight of an object in airW1 = apparent weight when submerged in a liquid
D= V
WL = DL vL
WL, = weight of liquid displacedpL = density of the liquidVL = vol,ime of the liquid
9

Then to prove Archimedes Principle, we must show that9t.
FB = W W 1 =
or, buoyant force = weight of displaced lipid.
..Procedure:Part I. .Using Water as the Liquid
1. Determine weight of soda lime glass 'block in air to the nearest .01 gm bysuspending it from triple beam balance. Be sure to use a fairly large `block so
that a considerable volume of liquid will be displaced.2. Fill the overflow can with water until it overflows into the catch bucket.
Mien-all dripping stops, empty and dry the catch bucket. Slowly lower the.balance on the laboratory stand until the block has sunk below or floats freeon the water surface. Catch all the water which overflows. Record thisvoNme.
Determine the apparent weight of the' block while it is hanging submerged inthe water. Record this apparent weight as WI. Measure the temperature of thewater.
4. Repeat steps 1 throtigh 3 above for lead glass block. /5. Repeat steps 1 through 3 above for cork block.
Part Ii. Using Glycerin
Repeat all the measurements in Part I for all objects.Measure the density of the liquid with a hydrometer.
Calculations:1. For both water and heavy liquid, show that Archimedes Principle for
submerged bodies has beemmerified.2. For both water and the heavy liquid, show that Archimedes Principle for
floatation has been verified.
Analysis and Interpretation:1. Analyze and discuss any errors found and the sources of these errors.2. From your library references, summarize what has been learned of the history'
of the development of Archimedes Principle.3. Practical application in the glassblowing field of the principle of flotation.
10

of
EXPERIMENT IV
'Specific Gravity and Density of Solids and Liquids
PurposeTo study the principles of specific gravity and density of solids and liquids.
App.'atus:Triple beam balance; graduated `cyli er; solid specimens (soda-lime glass, _lead
glass, borosilicate glass, altiminum, brass, steel, lead and sork);,liquid,speCimenlio (glycerin)
ethylene glycol); r ow c. catch bucket; sinker; hydrometers; and specific.gravity bott*
Informat :
will be recalled from Experiment 3 that the density is tbt weight per unitvolume f a substance. Specific gravity is a concept. of the relative heaviness of a
substance mpared to that of water.
Specific gravity
1
density of a substancedensity Of water
Dsor sp gr =
Dw
where sp gr = specific gravityDs = density of a substanceDw = density of water
But: Ds s and Dw =Vs
where:Ws = weight of a substanceVs = volume of a substanceWw = weight of waterVw- = volume of water
When substance and water have an equal volume, then
..DDs s) W V W,__ _ s w s
(11747::
Ww Vw s Ww(Since Vw= Vs)
DwSpecify gravity =
Ww
Vw
The specific gravity of solids can be determined in several ways. Thetechniques differ in determining the equal volume of water.
11

6
BEST COPY AVAILABLE
12
1
7,7Te.1-3,1
)

This experiment will use Archimedes.Principleto make the determination of equalvolume.
With solids lighter than water, a sinker may be used to pull the specimen underwater so its displacement may be measured. The specific gravit' of liquids may bedetefminedi by using specific gravity or pyconometer bottles. The bottle is filled with thesample liquid and the weight of this amount of liquid is detei-mined. Then if the bottle iscleaned, dried and filled with water, the weight of an .equal volume of water may befound since' the same measuring bottle is used for both the liquid and water. Anothermethod of determining ,the specific gravity of a liquid is to use Archimedes flotationprinciple. This method makes use of a calibrated hydrometer whi h will read the specific.gravity directly.
Procedure:Part I. Specific Gravity of a Solid
1. Solid heavier than waterWeigh the solid in air to the nearest .01 gm. and recor overflow canuntil water runs out of the spout into the catch bucket. Empty Wand dry thecatch bsucket. Immerse the solid in the overflow can; catch and weigh theoverflow water. This is the volume of water r-..-tual to the volume of the solid.Take three trial readings for each heavy solid.
'2. Solid Lighter than 4VaterWeigh the solid to the nearest .61 gm. Fill the overflow can until water runsout the spout into the catch bucket. Attach a sinker to, the light solid object.Immerse the sinker in overflow can until it is just covered by water. Emptyand dry the catch bucket. Allow sinker to pull light solid object until it iscompletely immersed in.the water. Catch and record the water overflow. Thisis the volume of water equal to the volume of the light solid object. Takethree trials of this volume for each solid.
Part 11. Specific Gravity of Liquids '
1. Specfic gravity bottle to pyconometer method.Weigh the empty pyconometer with stopper to the nearest .01 gm and
record. Fill the pyconometer with the test liquid and record this reading.Empty and dry the pyconometer: "Fill the pyconometer with water, weigh andrecord. Repeat this for each of the test liquids.
III. Density of Solids and LiquidsUsing data obtained from Parts I and ll determine the density of each sample inlbs./ft 3 and gms/cm 3-
Part
13

Calculations:
1. Determine the experimental values for the specific - gravity of each of the solidspecimens.
2. Determine the specific gravity of the liquids using data from the pyconometermethod. Compare these values with.the results of the hydrometer test.
3. Determine the density in lbsift3 of each test specimen.4. Compare values of specific gravity and density to standard reference values
and calculate the percent error between the experimental results and referencedata.
Analysis and Interpretation: A
1. Analyze and discuss possible sources of error in this experiment.2. Distingusih clearly between density and specific gravity. Why are they
numerkallrthe same in the metric system., but not in the English system?3. How could Archimedes principle be used to determine the density of solids
heavier than water?4. Discuss several important industrial applications of the principle of density
and specific gravity.5. If the density of a material is known in the English system, what is the
simplest way to find its specific gravity?
14

EXPERIMENT V
Boykrs Law of Gases
Purpose:
To study the . relationship .between preisure and volume of a gas when thetemperature is constant,
_
Apparatus:
Closed-end J tube fabricated in the .glasi laboratory prior to laboratoryexperiment; and laboratory barometer.
In formatio n:
The study of the gaseous state explains that gases have no definite volume. Thevolume of a given mass of gas (fixed number of molecules) varies greatly with changes inpressure or temperature. Pressure, volume,. and temperature actually determine thecondition of a gas at any given instant; therefore, these Variables are referred to as thePVT conditions of a gas.
With a tube similiar to the tubes fabricated by students for this experiment,Robert Boyle, in 1622, found that, if the temperature of a gas "remains constant whilethe absolute pressure is varied, the volume of the gas varies inversely with the absolutepressure which is applied.
In nature, pressure and temperature usually, both vary simultaneously; but in thelaboratory, it is possible bY. careful control to hold either pressure or, temperatureconstant and observe the effect of the change in temperature or ,pressure on the volumeof a gas. When the pressure is changed slowly, time is allowed for heat of compression tobe lost to the surrounding environment, thus keeping the temperature constant.
Boyle found that when this occurred the relationship of pressure and volume couldbe expressed in the mathematical form shown below:
(/) Pi Vi = P2 V2or
(2) P V = k
where:.P1 = original absolute pressure
P2 = new absolute pressure
V1 = original volume
V2 = new volume
k = the product of absolute pressure times volume, Vhich is a constant
Equation (2) is the accepted mathematical form of Boyle's law. This equation willresult in a hyperbola when it is used for a graphical plot. If absol te pressure is plotted
15

As.
1-1. 1,:;
HST COPY AMORE
f),,f ifrf LOA
4",,,e IL
:,.,!:,-1::,h,;1 -:,-) 1
,.
,...r. -!`l'o#. .`e--='' 'N-.4. ?.7.',rp.! .1!:,',-,:,-.1;!..)
,,,ei
4
:1 , 1:c PI, 33E32411Q*A. 19 b ;
1:1: NI .47 dr ; b9OS vii
tr!)nT111 ii. ?'!it
'17iitC:dh )141
lc:Mit )S7 ! : '
-dei- . ";e' '..," A ,^,,,,i-:`,.."-
(II 4 r44144'. ''-' '' ",.0.1.:.':. ...
ead ..011PU,7".4., ftl
s t ,,
/41*
al J
16
1.:3d011,
(f
/

on the vertical axis and volume on the horizontal axis, a curve of the pressure-volumerelationship according to Boyle's Law may be observed.
If you plot points P1,, V1 and P2, V2 on a PV plot, you will find that therectangles formed 15,-Ihmrek'and the distances of the points from the axes will be equal
in area.',.
Procedure:
Begin the experiment by mounting the J tube on a board with a meter stick.1. After mounting, record the position of the closed end of the J tube on the
meter stick.
2. Pour small amounts of mercury (do not touch or spill) into open end of jtube. Record mercury levels in both open and closed tube as read from meterstick.
3. Add small' amount of mercury to open end of J tube until about15 readingsof both open- and closed -tube levels have been recorded. (Be sure to wait atleast a minute between each addition of mercury to give the temperature ofthe gas in the closed-end of the tube time to stabilize to environmentaltemperature.)
4. Record reading of mercury barometer in centimeters of mercury.
Calculations:1. Determine,pressure difference between closed and open end of J tube by
subtracting the length of mercury in centimeters in the closed end from thelength of the column in the open end. This will be what is known as the gagepressure on the gas in the closed tube.
2. Determine absolute" pressure by adding data obtained from calculation 1 tothe mercury laboratory barometer reading.
3. Determine the volume of gas in the closed tube by subtracting the mercurylevel in the closed tube from the reading recorded for the top, of the closedend of the j tube.
4. Multiply the data front step 2 by the data from step ,3. This should show thatP V = k.
5. Plot on a graph the data from step 2 and 3-above., Plot step 2 data-on thevertical axis and step 3 data on the horizontal axis. The curve derived 'fromthese plots should be similiar to .a portion of the curve shown in yourreference text for the Boyle's Law curve.
Analysis and Interpretation:1. Analyze and discuss any errors between your results and Boyle's Law.2. Explain what effect a change in temperature during the experime4t would
have on your results.3. From reference reading, determine the extremes of temperature and pressure
at which Boyle's Law no longer applies. Why?17

1,
. s' ', . ,1
- '.",:t -54C .
tte'
18
BEST COPY -AVAILABLE
1

EXPERIMENT VI
Study of the Thermocouple
Purpose:
To study the thermoelectric effect and to plot a calibration chart for a laboratorythermocouple.
Apparatus:
Copper-constantan or glass embedded copper-Kovar; laboratory thermocouple;millivoltmeter (0 to 50 mv); beaker; ice; burner; thermometers (.5°C accuracy); and ringstand. ) -
/
Information:If two different metals are placed in contact with each other, they assume a
slightly different electrical potential. The difference in potential is due to the motion offree electrons which are present in metals. Free electrons are in rapid and random motionin metallic substances; the electrons in the surface layers will cross the boundry to theother metal. These electrons will pass in one direction much more readily than the other;therefore, one metal 'is made negative (excess electrons) while the other is made positive(deficient in electrons). For each different pair of metals, the magnitude of the contactpotential depends on the temperature at the contact surfaces. The discovery of this effectwas made by Volta (1745-1827), but T. J. Seeback (1771-1831) discovered thesignificant praftical application of the variation in contact potential with temperature.
Seeback determined that if the two junctions in a closed loop were kept at differenttemperatures, then the amount, of electron current is directly propo'rtional to thedifference in temperature between the two junctions. In this experiment the study willbe made of the calibration of a junction or thermocouple device as a means of measuringtemperature.
Procedure: Laboratory Copper-Constantan Thermopile1. Set up the thermocouple on a laboratory stand with the cold junction `in a
beaker of ice and the other end in a beaker of boiling water. Note thematerials of which the wires are made. Be sure that enough cracked ice is usedto maintain the temperature of the cold junction at 0°C. Record the readingson the thermometers and the millivolt meter.
2. Allow hot beaker to cool while keeping cold junction at 0°C: Recordtemperature and millivolt meter reading for each drop of 5° C until, with theaddition of crushed ice, th,e beaker containing the hot junction is also broughtdown to 0°C.
19

. oj hot ,), ,,,ppei-,ont.intan thermopile of tcnyerature to millivolts.Nor r.,.!Ilrer,Ciirc (in vcrtic-ill axis and mdliv(dts Utl hori/ontal axis. 1)etermine
millivolt per °C sensitivity.
Mall and Interpretation:
1. Sketch a face for the millivoltmeter which would read directk In °C and °F.\Vhat are some of the practical applications in industry of thermopiles and
thermocouples ?
I. Analyze the possible sources of error in this experiment.

EXPERIMENT VII
Linear Expansion with Temperature
Purpose:
To study the expansion of materials on being heated and to determine thecoefficient of expansion of several metals (aluminum, copper, Kovar and tungsten) andseveral glasses (lead, soda-lime, and borosilicatc).
Apparatus:Linear expansion apparatus; metal test rods; glass test rods; steam generator;
connecting hoses and steam trap (locally fabricated); thermometer .5°C accuracy; burner;and meter stick.
Information:When matter is heated the molecules move further. apart, and when cooled, the
molecules move closer together. Since gas molecules have the greatest freedom of motion,they expand and contract more than liquids or solids. In general, the freedom of motionand molecular structure determine, the amount of exnansion and contraction with the
temperature. Gases expand th st; liquids are next; and solids follow with the leastexpansion. There is quite a wi ge of ar,..tion due to difference in molecular structure
of different solids.If solids only are considered here, the student will find wide variation in the
amount of change taking place in solids with a change temperature. The molecules,
when heated, tend to spread apart in all directions. 41--the case of rods or tubing, themain interest lies in the change in length. This relationship of change in length withchange in temperature is called linear expansion. All materials expand or contract withchanges in temperature, but the amount of these changes depends upon the molecularstructure, the original length, and the change in temperature of the material. Since themolecular structure of each different type of solid is unique, there can be obtained byexperimentation a coefficient of linear expansion for any given solid which takes intoconsideration its individual molecular structure. This coefficient of linear expansion a is
defined as the change in length pc: unit of original length per degree change intemperature.
where:
L2 LI
L1 (t2 t1)(1)
L 1 = original length
L2 = new lengthti = original temperaturet2 = new temperature
21

22 \.

When original temperature is higher th.:: the new temperature, the elongation will benegative,which means the solid has contracted FJ;-.her than expanded.
since e = L2 L 1
then a
(2)
(3)
where
e = change in length or elongation
The preceding formula will be used to determine the coefficient of expansion ofthe solids used in this experiment.
The apparatus used in this experiment uses a friction-driven rotating pointer toindicate the change in length of the sample rod or tube as a tieileccion of a pointer inangular degrees. The change in length will be calculated from thiL'i angular displacement.
e d 0(4)
360
where:
0 = angular displacement in degrees.
d = diameter of the pointer at the point where the test rod or tube rests on it.
The coefficient of expansion for the rod may be letrmined with formula 3. Use L1 asthe distance from the fixed stand to the pointer air, the tube before heat is applied tothe rod.
Procedure:
1. Set up the apparatus as shown in photograph anti fill the steam generator two-thirds full of water.
2. Measure and record the length of the rod or tube from the fixed rest to thepointer of the indicator, the diameter of the pointer, the temperature of therod, and the starting Value of 0 on the indicator face.
3. Light burner and, apply heat to,.the steam generator until be i!er temperaturereads 100°. Read and record boiler temperature and 0.
4. Repeat steps 1 to 3 for each test rod.
Calculations:
For each test rod, use formula 3 to determine the coefficient of linear expansion.Using reference material, compare the laboratory findings with the accepted values
and determine percentage of error.
Analysis and Interpretation:1. What are the possible reasons for error in this report?2. Give some practical uses for the information from this report in industry.3. Using laboratory and reference information, design a glass-to-copper seal, glass-
to-aluminum seal, glass-to.-Kovar, and a glass-to-tungsten seal.23
EXPERIMENT VIII
Heating Value of Fuel
Purpose:To determine the heating value of the laboratory supply, using a continuous-flow
calorimeter.
Apparatus:
Continuous -flow calorimeter; thermometer (.1° accuracy); Bunsen burner; gasmeter with dial reading accuelle to .01 cubic foot; rubber tubing; laboratory balance; andweigh ts.
Information:Modern industry use many fuels. Some are very common and inexpensive, while
others are rare and costly. Fuel oil, coal', natural gas, and bottled gas are examples of low-cost fuels.' Alcohol, liquid hydrogen, hydrazine, and nuclear fuels are examples of the
more expensive types.Some fuels are convenient and safe to use and low iii air-polluting and solid or
particulate residue. Other fuels have to be managed very carefully to prevent explosions,air pollution, anyl frequent shutdowns for cleaning.
Since in industry air pollution, residue-caused shutdowns and actual fuel costsenter into the profit picture, different industries will call for the use of different fuels.
One of the major items Will be fuel cost; therefore, a way must be, found tocompare the relative cost offuels. For solid and liquid fuels, this is usually computed interms of BTU's per pound; in this determination for gaseous fuel, a measured quantityof fuel is used to heat a substance where the heat added Can be easily measured. Thesubstance usually preferred is water. Some of the reasons for this are: it is the standardby which both metric. and English units of heat are defined and measured, and it has
the highest thermal capacity of common .substanc'es.A continuous-flow calorimeter for gaseous fuels allows maximum heat transfer
from the flame or heat source to be absorbed by the water.This calorimeter can be purchased from a laboratory supply house or fabricated
from heat-resistant glass. as a project for the second-year glass technology student. 'Vater-flow in and out of the calorimeter can be measured and the input and output temperatures.
may be determined. Tilt: w.-ter-flow and temperature change must be care,lly measured,
as well as an accurate measi.c, the number of cubic feet of gas used. The heatingvalue of tile fuel can be determined by .,ing.the basic heat formula
24
(1)

where:
m = amount of water collected in poundss = specific heat of the waterti = water input temperature in °Ft 2 = water output temperature in °F
H = quantity of heat in BTU's
Since the specific heat (s) of water is one, the heat absorbed by the burned fuel is
H = to (t2 ti ) (2)
and the heating value of the fuel can be determined.
Heating value = -11-v (3)
where H = heat added in BTU'sV= volume of gaseous fuel used in cubic feet
Procedure:
1. Connect the gas tube through the gas flow meter to the burner. Set .up thecalorimeter. Be sure that the corks around the thermometer are well sealed toprevent a water leak. Carefully turn on the water to a slow continuous flow.When the water is flowing smoothly, light the burner and adjust it to a lowblue flame.
Place the burner about 1/2 to 3/4 inches below the calorimeter. Adjust waterflow to achieve a 10°F difference in temperature between the input waterand output water. While performing this experiment, watch the burnercarefully to :see that the flame does not go out due to the stack effect of thefire tubes in the calorimeter.
2. When a steady-state condition of water-flow 'and temperature readings has
been reached, start a stop-watch timer and simultaneously read the gas meter,thermometers, and begin catching- the output water in at least a quart-sizecontainer. Record the length of time to catch water, its. weight, gas meterreading at beginning and end of time, and the input and output temperatures.
3. Repeat steps 1 and 2 with a temperature difference of 15°F , 20°F, and 25°F.
Calculations:Using equations 2 and 3 and the measured data, determine the heating value of
the fuel in BTU's/ft.3 for each trial. Compare the experimental value with the heatingvalue of the fuel obtained by contacting your local gas company.
Analysis and Interpretation:1. What are possible sources of erior in this experiment?2. List some of the advantages of natural or manufactured gas as a fuel.3. What are some of the pollutant products given off to the atmosphere by heat-
producing burners and heat engines?
25

EXPERIMENT IX
Specific Heat of Solids
Purpose:
To study the law of heat exchange and to determine the specific heat of samplesof solids, including various types of glass.
Apparatus:
Calorimeter; centigrade thermometer (.1°(.1 C accuracy): burner and stand; beaker;centigram balance; metal test samples; and glass test samples.
Information:
The quantity of heat contained in a substance cannot be measured by a direct-reading instrument; it must be measured by its effect on matter.
The easiest effect of heat to measure is a temperature change; but when heat isadded to different substances, there is a different temperature change for each substance.Some substances have wide temperature changes with small amounts of heat added. Othersubstances require large quantities of heat to cause very small temperature changes.
This difference seems to be due to the differences in the molecular structure ofeach material. This is somewhat confirmed by the fact that the same substances in thedifferent physical states of liquid, gas, and solid, have a different molecular arrangementor bond and require a different amount of heat to cause a change in temperature.
Water as a liquid is the4eneral standard used for heat measurement because waterabsorbs the greatest quantity of heat for a given temperature change of any commonsubstance. The heat absorbing quality and the fact that water is plentiful and cheap arethe reasons it was chosen as the standard.
).r. he units of heat measurement in the English and metric systems definedaccording to this standard are the British thermal unit and the calorie. -
The BTU is defined as the amount of heat necessary to change 1 pound of water1° Fahrenheit.
The calorie is defined as the amount of heat necessary to change 1 gram of water1° Celsius. Since the thermal capacity or the ability to absorb heat varies with eachsubstance, a means had to be found to compare each substance to a standard water
reference.This was accomplished by using the ratio of the thermal capacity of a substance
to the thermal capacity of water; this ratio is called the specific heat of the substance.
26

)
Therefore, specific heat:thermal capacity substances 1117rma capacity of water
If the specific heat is used, then the amount of heat any substance will absorbcan be determined by the equation shown below.
H = ms (t2 ) (1)
where:
m = pounds or gramss = specific heat of a substanceH = heat (BTU's or calories)(t2 t = temperature change in °F or °C
The, speCific heat of a substance has no dimensional units so the same value willbe used in both the English and the metric system. When the weight is in pounds and the
.temperature is °F, the heat units will be calories.If two or more substances are heated together, then the total heat absorbed is the
sum of the heat absorbed by each substance.
At times it will be necessary to mix substances which are at different
temperatures. When this occurs the substance at the higher temperature will lose heat and
the substance at the lower temperature will gain heat. This action may be written asshown below and is called the law of heat exchange.
Heat lost by hot substance equals heat gained by cold substance.Water as the standard reference is usually mixed with a substance whose specific
heat is to be determined. Since water is a liquid, it will normally need a container tohold it while it is being mixed.
This container is called a calorimeter or calorie meter, and the amount of heat itabsorbs must also be considered in writing the equation to determine the specific heat ofan unknown material. For a substance mixed in a calorimeter, the law of heat exchangebecomes: heat lost by hot substance equals heat gained by cold substance plus the heatgained by the calorimeter.
Let:
mh = mass of hot substancesh = specific heat of hot substanceth = temperature of hot substanceme = mass of cold substancesc = specific heat of the cold substancetc = temperature of the cold substanceft:cal = mass of the calorimeter or mixing cup
seal = specific heat of calorimeter cup materialtf = final temperature of mixture and the colorimeter
27

Then:
Sh fit;C)
4 "'cal 'cal Of lc) (2)
The mcal seal is called the water equivalent of the calorimeter. This would be theamount of water which would absorb the same amount of heat as the calorimeterabsorbs.
Procedure:
Part 1. Specific Heat of Metallic Solids
1. Weigh the calorimeter inner cup to the nearest .01 gram and then fill it withjust enough cold tali water so that the specimen will be covered. Record thecold water temperature and the weight of the cup and cold water. Weigh andrecord the metallic test metal to the nearest .01 gram using the centigrambalance. Heat the test metal in a beaker of boiling water for at least 5minutes; then quickly transfer it to the cold water in the calorimeter cup. Stirgently; read and record the final temperature of the mixture. Take anothertrial with a different amount of water in the calorimeter cup, using the samemetal specimen.
2; Repeat step 1 for each of the test metals.
Part II. Specific Heat of Glass Specimens1. Repeat step 1 of part I for each of the glass test specimens.
Calculation:
Using equation (2), calculate (for each trial) the specific heat of the metal and glasstest specimens. Average the two trials for each substance; then compare this to thereference value. Display your results including percent error in a summary table.
Analysis and Interpretation:1. Analyze the possible sources of error and describe the steps that could be
taken to minimize heat gains and losses from the environment.2. Explain how the calorimeter minimizes heat gain and losses from:
a. conductionb. radiationc. convection
3." List and describe three industrial processes where heat exchange is extremelyimportant.
4. Why is water so widely used as a heat exchange medium in industry?
28

EXPERIMENT X
Latent Heat and Change of 'state
Purpose:
To study the change of state process and determine the latent heat of fusion ofice and the latent heat of vaporization of water.
Apparatus:
Calorimeter and stirrer, :,team generator; glass laboratory-fabricated steamtrap;burner; thermometers (.1°C accuracy): ice: centigram balance; and rubber tubing.
Infor,nation:Heat energy must be added to a substance to cause it to change from a solid to a
liquid, or from a liquid to a gas. This is because the molecules have much greaterfreedom in a liquid than in a solid; they have extreme freedom in a gas. The opposite istrue when going from the gaseous state to the liquid, or from the liquid to the solid;therefore, for this to occur, heat must be removed from the substance. Any materialwhich we find on earth can exist in the liquid, solid, or gaseous state. Sometimes it is
difficult to hold the surrounding conditions proper for these changesof states to occurand be repeatable; in other words to have the material go from solid to the gas by addingheat and having it come back to the 'same form as a solid by removing heat.
In most material, when heat is added or removed and the liquid-gas boundary orthe liquid-solid boundary is reached, it is observed that a large number of heat units areinvolved without a change in temperature of the substance.
When this occurs, the heat which is added or removed is called latent, or hidden,heat. Heat which causes a change in the temperature of the substance is called sensibleheat, since it can be sensed with a thermometer. This experiment will allow the studentto observe and measure the amount of heat involved in the change of state process. Thepoint or temperature at which a material changes from 't solid to a liquid is called themelting point of the substance: and the heat involved in the change of state is called thelatent heat of fusion. The temperature at which a material changes from a liquid to a gas
is called the boiling point of the sub,,tance; the heat involved in this change of state is
called the latent heat of vaporization.
The change of state processes of ..vater will be studied using the law of heatexchange or the so-called method of mixture. When two substances at different :.
temperatures are mixed, the quantity or heat lost by the hot body is equal to the heatgained by the cold body; an equilibrium or intermediate temperature is reached. If thisprocess takes place in such a manner that no heat is gained from or lost fo theenvironment, accurate measurements may be obtained.
29

The calorimeter construction minimizes heat gains or losses, but increasedmeasurement accuracy),can be obtained by taking the following precautions. Thetemperature range "in. all the tests should vary equally from the room temperature. Theinitial cold temperature should be approximately the same amount below roomtemperature as 'the fipal mixtuts temperature is above room temperature. This will allowthe same amount of heat to be lost to the room at the final temperature as is gained bythe substance at the cold temperature from the room.
This should cause a heat-loss balance in the experiment. The latent heat of fusion(9.) will be determined by dropping a few pieces of ice in a calorimeter in which warmwater at a =known temperature has been placed. As the ice melts, the law of heatexchange takes place and the mixture will reach a final equilibrium temperature. Theamount of ice used can be determined by weighing the calorimeter cup and its contents,after the equilibrium temperature is recorded. Be sure that the ice has been out of thefreezer long enoughi_to reach its melting point of 0° C or 32°F. The latent heat ofvaporization (Lie) will be determined by passing steam through a known amount of coolwater. The steam condenses in the cool water, and the mixture reaches a final
equilibrium .temperature. The heat absorbed by the thermometers should also, beconsidered in the experiment.
Instead of going into the mass and specific heat of the thermometer material,.4simply use an approiirnate water-equivalent for the thermometer of about 0.5 grams of
water. The working equations for the law of heat exchange in this experiment are:
Part I. Latent Heat of Fusion (if)Heat gained by the ice = Heat lost by the water and heat lost bycblorimeter cup and heat lost by the water equivalent of the thermometer.
mi(L f) + Mi (tf to x Mw (tw tf ) + Mc sc (tw 7) + W.E. (t tf)
Li
where:
Or
(Mw + Mc sc + W.E. ) Mi t1)
1f i = mass of the ice
Mu, = mass of the water
Afc. = mass of the calorimexr cup
se = specific heat of lie calorimeter cup
= water equivalent of the thermometert = temperature of the ice
t, = temperature of the water
tf = equilibrium temperature in the calorimeter= latent heat of fusion (water)
30

Part II. Latent Heat of Vaporization (Le)
Ms (Le ) + Ms (ts tf) = Mw (tf tw) + Mcsc(tf tw) + W.E. (tf tw)
or+ c c + W.E.) (tf tw) Ms (ts tf)
1-ew
Ms
where:
M = 'mass of cool water in calorimeter
Afs mass of steam added
Mc = mass ofealorimeter
sc = \ specific heat of calorimeter
tw = initial temperature of cool water and calorimeter cup
temperature of steam
equilibrium temperature in calorimeter
Le = latent heat of evaporization (water)
water equivalent of thermometer
Procedure:Part I. Latent Heat of Fusion (Lf of Water)
a. Weigh the calorimeter cup and stirrer accurately and note the specific heat ofthe material from which it is made.Record the weight of cup and stirrer. Fill the cup about; half full of waterwhose temperature is about 10°C above room temperature. Weigh water, cup,and stirrer combination and than place in calorimeter outer cup. Record theweight of water, cup and stirrer combination. Select several pieces of ice, dryeach carefully with a paper towel and cliv,p into water in the cup. Add ice andstir mixture slowly until all ice is ,melted and the final equilibriumtemperature in the cup is about 6° below room temperature. Record thefinal temperature, then weigh and record the weight of the calorimeter cupand its contents.
b.° Repeat Part I a to give three complete sets of readings.
Part II. Latent Heat of Vaporization (Le) ) of Water.a. Weigh the calorimeter cup and stirrer accurately and note the specific heat of
the material from which it is made. Record the weight of the cup and stirrer.Fill the inner cup about three-quarters full of water whose temperature is10°C to15°C below the room temperature. Weigh water, cup, stirrer
31
1

combination. Record this weight. Place hose from steam generator into top dff
calorimeter and bubble steam into the water until the temperature of thewater is raised to '40°C, or 15°C above room temperature. Remove steamtube from calorimeter, record thernjometer reading as final or equilibriumtemperature. Remove inner cup filled with water and the stirrer frbm theouter calorimeter cup. Weigh and record the Weight of the inner cup and itstotal contents.
-b. Repeat Step 2a until three complete sets of readings are obtained.
Calculations:
Part I. Latent Heat of Fusion of WaterUse .the data recorded in the procedure section, Part Ia and lb, and determin..Mc, Mw and Mi.From this information and the temperature readings, determinethe latent heat of fusion (I, r) for each of the three trials. Average thefinalresultsof these three calculations and compare it to the standard reference value of thelatentlfeat of fusion of water.
Part H. Latent-Heat of Vaporization of WaterUse the data recorded in the procedure section, Part Ha and lIb, and determine
the Mc, Mw and Ms. From this information and temperature readings, determine thelatent heat of vaporiiation (Le ) of the steam for each of these three calculations andcompare their average to the standard reference value of the latent heat of vaporization ofwater.
Analysis and Interpretation:1, Determine the percent error between your results and Chase from the standard
reference for the latent heat of fusion and the latent heat of vaporization.2. Describe some steps which may be taken to minimize the error in this
experiment.
3. What are some of the applications to the glass industry of the type ofinformation gained from this experiment?
32

EXPERIMENT XI
Velocity of Sound by Resonance Methods
Purpose..
To use glass apparatus in :lie measurement of sound characteristics.
Apparatus:Water resonance tube. air resonance tube, tuning forks, striking block or hammer,
rosin and chamois cloth.
In ion ati on :
The most direct method of measuring the IP iocity of sound through a materialwould be to station two groups a mile or so apart with visual contact between thegroups. This is not practical due to size limitations of the usual laboratory. So in thelaboratory we will have to use a different method, and we will use the phenomenoncalled resonance to do so.
Every object can be made to vibrate. An object will vibrate at its natural
frequency, which depends upOn its size, shape, and molecular structure. if two bodieshaving the same natural frequencies are set close to each other, and one is made tovibrate, then the other will start to vibrate also. This is called sympathic vibration, andthe transferring of the energy from the first to the second object is called resonance. Youmay have encountered this phenomenon when aNp.iece of chinaware br ..glasswan was set
into resonant vibration by a musical note played nearby. All /wind-type musicalinstruments are based on resonance a certain length of the air column will vibrate at acertain pitch (frequency) when the reed or lip vibrates at the proper rate.
The fundamental equation of wave motion used in this experiment is:V = nA
where:
V =Velocity of propagation of the waven = Number of complete waves per second
X = Wavelength the distance the wave travels in the medium under study inthe time for a single vibration to occur.
Resonance will be used to determine the velocity of sound in both air and solid rods.
33

iN
><- 4
a.
1
to,
, 15, -16
4
a
A
x.
Ale

Part I. Velocity of Sound in Air
A tuning fork held over the top of a column of air in a tube with one end closedwill cause vibrations to be sent through the air in Cie tube and reflected from thebottom to return again to the top. If the length of the column of air at the topof the tube is adinsted.to a length equal to one-fourth the wavelength of the :onefrom the fork, then the sound returned will be in phase with the original toneand will produce a marked increase of volume. This is one of the evidences ofresonance and will occur whenever the tube is-an odd multiple of this originalone-fourth wavelength, such as 1/4, 3/4, 5/4, etc. The apparatus used in this
portion of the experiment can be fabricated in the glass shop from a glass tubeapproximately 1 inch in diameter and 4 feet long. This glass tube will use aone-hole stopper and a small 90-degree glass elbow attached to a rubber or plastichose. The hose will be attached to a beaker or container of at least 1000ml.,with a hose connector fused in the, bottom. The water level in the 4-foot tubeand thus the length of the air column --- will be controlled by vertically raising andlowering the beaker or container with respect to the water in the tube.
Part II. The velocity of sound in a metal rod will be measured by causing the rod tovibrate at its natural frequency. When this rod is vibrated at its natural frequencyin a 4-foot glass tube closed at one end by a solid rubber stopper, standing orreson ince waves will be set up in the air column within the tube. If cork dust issprinkled within the tube, it will line up in alternate concentrations andrarifications as a direct result of the vibrating air column.
The apparatus used in this experiment can be partially fabricated in the glassshop. The metal rods with end plates and mounting stand will have to befabricated in the wood or metal shop.
The operation and measurements in this experiment depend upon the fact that ametal rod clamped in the middle and stroked with a rosined chamois cloth willset up longitudinal vibrations which can be transferred to the air column in theglass tube. The basic wave formula will be used in this portion of the experimentas follows:
V = n X in
Va = H Xa
(Since the sound is introduced into the air by the metal rod, then n is the samefor both air and metal.)
35../

4
36
BEST COPY AVAILABLE

where:
V = velocity of sound in metal in ft/sec.Va = velocity of sound in air in ft/sec.ti = frequency of note generated
Xm
Xa
Therefore:
Or
wavelength of sound in metal in feetwavelength of sound in air in feet
Vm n' InV n?1/4aa
VmVaXm
Xa
Let L = length of rod in feet
The natural vibration of the rod will produce a wavelength equal to twicethe length of the rod. That is,
Then
Xm =
V 21.,Vm 4
Aa
The velocity of sound in air has bera found to be:Va = 1087 ft/sec. +1.1 lt-32) ft/sec.
where
Procedure:
t = existing temperature in °F
Part 1. Velocit' of Sourd in Aira. Set up the 4-foot glass resonance apparatus fabricated in the glass shop. Fill
reservoir with water and elevate it until the water fills the tube approximately2/3 full. Strike the tuning fork on the strike pad and place it at the open endof the tube, being careful that the vibrating tuning fork does. not strike theglass tube. With the vibrating tuning fork over the tube, raise and lower thewater level until the first resonance point is reached. Record the length of theair column for that tuning fork. Repeat the above instructions until thesecond resonance and third resonance points are reached. Record the secondresonance point as three-quarter wavelength and the third point as five-quarterwavelength for the tuning fork.
37

h. Measure and record the temperature of the air ;n t'a
c. Repeat steps la and lb for each tuning fork used.
Part II..V.Incity A Sound in Metal Rodsa. Asserribk, base, metal rod, and the 4-foor tube fabricated in the glass shop.
Sprinkle y cork dust lightly on the insideof the glass tube. The metal rodshould be insezted into the tube and the end of the rod pulled back throughthe metal pipit. A 1.0.st the metal rod so that it is clamped halfway alcnig itslength by the screw mounted in the metal post. Half of the rod v/bill be in thetube, and the other .,?nd free on the other side of t e metal clam-P.
Add a small amount of rosin to a chamois cloth and stroke the rod mith aquick, firm stroke until vibrations are set up. These will cause dust patterns in
the glass tube. Measure and record the distance between any two minimum
points in the dust pattern, and record the total length of the metal rod.b. Measure and record the temperature of the air in the room.
c. Repeat steps Ha and Jib for each type of rod used.
Results:
Part I. Using measured data from the water-air resonance tube, determine the velocity of
sound in air for the room. Compare the experimental value with the calctilatedvalue for the air at recorded room temperature.
Part II. Use the measured data from the air tube and metal rod to calculate the velocityof sound in each metal rod. Compare the experimental results with acceptedvalues from reference tables.
Analysis:
if What are some of the possible sources of errors in this experiment?
2. Explain how it could be theoretically possible for a sound to break a piece ofglass apparatus. Would the same sound frequency have the same effect on all
glass apparatus?
38

EXPERIMENT XII
Photometry and Illumination
Purpose:
To determine the candle-power rating and light distribution from various types ofglass-enclosed light sources.
Apparatus:
Optical bench; bunsen photometer; standard lamp; to lamps; 15W, 40W, 60W,100W frosted and clear glass bulbs; photoelectric foot-candle meter; and black screen forshielding outside light.
Information:
The use of glass in the lighting industry is one of the major uses of this product.The scientific glassblower today does not hand-blow glass bulbs, but the transmission oflight through various types of glass used in this industry is of interest to the glassstudent. In this study the definitions of some of the basic terms are essential in the studyof photometry and illumination.
1. The intensity of light source (1). Unit of measurement is the candle powerand was originally based on the light emir.:ed by a standard candle. Onesquare centimeter of the surface of metting platinum gives off sixtycandlepower and is the primary standard reference used today. Thecandlepower unit is used in working with light sources.
2. The intensity of illumination (E). Measurement unit is the foot-candle and isonly used in measuring light at a surface tvhich is not a source. One
Coot-candle is the intensity of illumination on a surface one foot away from aone-c.p. source when the light rays are perpendicular to the illuminatedsurface.
where:
Or
Ed2
F = illumination in ft-cintensity in candlepower
= distance from surface to the source of light
E I cos 0
d2
if the light rays are not perpendicular to the surface and 0 is the anglebetween the light ray and a line which is perpendicular to the surface.
39

x.
t..

where :/
3. Flow. of light energy, or flux (F). The total light energy is the intensity ofillumination at a surface times the area of the surface.
= EA
or the flux output from a light source isF = 4 7r /
where the measurement unit for flux is lumens.
3
Measuring the light intensity of a source. Light intensity from a source
is measured by comparing the illumination a source causes to the illumination
from a 'standard source, where the illumination in footcandlesofboth sources is
the same and the light rays are striking perpendicular to the surface. When
this occurs, then the following formula may be derived and used for
comparing the candlepower of a standard lamp and a test lamp.
Et = Es
where: Et= illumination in foot-candles of test lampEs = illumination in foot-candles of standard lamp
Since E2
and ES sEtdr
S 2"5
rt.
at 2 d52
orrt dt2
rS ds2
It= candlepower of test lamp
Is= candlepower of standard lamp
eft = perpendicular distance from test lamp to illuminated surface
ds = perpendicular distance from standard lamp to the illuminated surface
The foot-candle meter may also he used in determining surface illumination
and then by calculation the candle-power of a light source may bedetermined. The heart of the foot-candle meter is a photoelectric cell that
converts light energy to electrical energy which can be read on an electric
meter calibrated in foot-candles of illumination. The electricity generated isdirectly proportional to the amount of illumination reaching the surface of
the photoelectric cell.
41

Procedure:
Part I. Source Intensity of Test Lamp.a. Set up the standard lamp, first test lamp and bunsen photometer on the
optical bench. Adjust the position of the photometer between the test andstancl-,-d lamps for equal illumination on both sides of the screen. Be sure thatall excess outside light is screened from the photometer and that equalillumination is carefully checked. Record the intensity of be standard lamp(I), the distance from the standard lamp to the photometer' (d s), and thedistance from the test lamp to the photometer (di).
b. Set up the photo,electric meter to give a reading of about 40 footcandlec ofillumination from the test lamp. Be sure that excess outside light is screenedfrom the meter and record the perpendicular distance from the test lamp tothe face of the meter as (dm).
c. Repeat Steps la and Ib for each test lamp used.
Part II. Check the validity of the formula E = I cos 01d2 by setting up a standard lampso that the light rays from it strike the face of the photoelectric meter at.an angleand cause a reading of about 30 footcandles on the meter. Record the straight-line distance (d) of the standard lamp to the face of the photometer and theangle (0) between the light rays and a line perpendicular. to the face of thephotoelectric meter.
Part W. Use the photoelectric meter measure the illumination at various work areas:1. reading area2. laboratory3. glass shop
4. office area
Results:
Part I. Calculate the candlepower of each test lamp using the data from bunsenphotometer readings and the data from the photoelectric meter. Chart andcompare the candlep, er values from two sources.
Part II. Verify E = I cos 0/d2 from the data recorded with the light rays at an angle tothe photoelectric meter surface by solving for the candlepower of the standardlamp.
Part III. Compare your readings for the illumination values at various work areas with therecommended values as found in the literature.
Analysis:
1. Compare the output of clear & ,c1 frosted glass bulbs of the same wattage.,What are the different types of bulbs used?
2. With the aid of outside reading, give a brief history of the lighting industryand the glass blowers part in this history.
42

EXPERIMENT XIII
Study of Spherical Mirrors
Purpose:To study image formation by curved spherical surfaces and to determine the
radius of curvature of a concave and convex mirror.
Apparatus:Optical bench; concave and convex surfaces; screen; light source with object plate:
and vernier calipers and spherometer.
Information:In studying image formation, it is convenient to think of light rays as being
straight lines of light propagation. A light ray is considered to be perpendicular to thewave front of the electromagnetic disturbance. The wave theory of light will be used in
our discussion of image formation.The apparatus for this experiment calls for a convex and a concave surface.
These surfaces may be purchased through a scientific glass house or may be ground bythe glass technology student as a project in his scientific glass technology program.
In studying the image formation by curved spherical surfaces, several assumptionswill be used. These are:
1. All light rays which approach the surface parallel to the principal axis arereflected back through a common point on the axis known as the focal point.(This is only true though for rays very close to the principal axis.)
2. A light ray which approaches the surface through the center of curvature willbe reflected directly back on itself.
3. A light ray whic passes through the focal point on its way to the surface will
be reflected bacl parallel to the principal axis of the surface. (This is trueonly for light rays close to the principal axis.)
The law of reflection of light will be used in this experiment. This law states thatthe angle of incidence is equal to'the angle of reflection. The angle of incidence is theangle between the incident ray and a line perpendicular to the surface at- that point.
The t ree cases of ray incidence discussed above will be used in determining the
location of th image formed by a curved surface. If the image is on the same side of the
mirror as the object, reflected light rays will actually pass through it and it is called a real
image. If the image is on the opposite side of the curved surface from the object, the light
rays only appear to pass, but do not actually pass through the image, and it is called an
imaginary image or virtual image.
43

a
BEST COr'Y AVAILABLE
44
Aker
1

The terms involved with curved .iurfaccs arc shown below:
.18 = the principal axis= the vertex or surface center
() = the object= the image
C = the center of curvature= the principal focus
R = the radius of curvature of the s face
For tutted surfaces that are small compared with the radius of curvature, theprincipal focus lies about halfway between the center of curvature and the vertex. Or wemay say
R = 2fThe relationship between object distance, image distance, and focal length is
1 1 ÷ 1
7 do di
where:do = th 'stance the object is away from the vertexdi = the distance the image is away from the vertexf = the distance the principal focus is from the vertex
The focal length is (+) if it is in front of the mirror and () if it is behind the mirror.A real image which is in front of the mirror will have an image distance (di) which is (+) andan imaginary or image behind the mirror will have a () image distance.
Methods used in determining radius of curvature:
I. Concave mirror. If an object is set at a distance from the concave surface so thata real image is formed at the same point as the object, then the object distance isequal to the image distance; and the object distance is equal to 2 times the focallength. The object is then at the center of curvature of the surface.
2. Radius of curvature using a spherometer. The peg spherometer used in thisexperiment consists of a flat metal base with three equally spaced legs ofidentical length and a micrometer screw at the center. The legs form a flat planeand the micrometer screw can be adjusted above or below the plane of the legs.
(A spherometer is shown in the illustration on page 52.)
45

With this spherometer, let (L) be the average distance between the legs atad .(d)be the micrometer screw reading alilive or below the plane of the legs when it isresting on thercurvcd surface. In this case then:
R = d + L22 6d
Procedure:
Part I. Image Formation by and Radius of Curvature of a Concave SurfaceSet up the optical bench with concave mirror, object,light source and screen.Determine the location, object distance and irAage distance, when the object isplaced at:a. Maximum distance from curved surface.b. Further away from the screen than the center of curvature of the surface.c. At the center of curvature of the surface.d. Between the center of curvature and the focal point.e. At the focal point.f. Between the focal point and the curved surface.
Note the relationship between image and object size, and whether there is a real orvirtual (imaginary) image in each of the above trials.
Part II. Image Formation by a Convex SurfaceSet up optical bench as in part I, except use a convex surface instead of concave.Observe the location of the images as in part I, a through f.
Part III. Radius of Curvature by Use of the SpherotneterMeasure both the concave and convex surfaces with the spherometer. Record foreach surface the measured value of (d) and (L).
Results:
Part I.
Part II.
Show by graphical representation the ray diagrams Of the images formed,image location, and relative size of the object and image for trials Ia throughIf of the measurements section.Determine by calculations the location of the center of curvature of thesurface, using measurements obtained in steps la, lb, and lc.
Sketch, from observations in (a) through (f) of the measurements in part II,the ray diagrams showing location of image and object for the convexsurface.
Part III. Determine the radius of curvature of the concave and convex surfaces,usingthe information obtained from the spherometer measurements.
46

Analysis:
1. Summarize and compare the results from the several iixthods of determining the
radius of curvature of spherical surfaces.
2. Explain any inherent sources of error in the image location studied in this
lal-oratory and discuss methods normally used to overcome these difficulties.
3. What are some of the practical applications of the concave surface mirror?
4. Are there any practical uses for the convex surface mirror?
47

EXPERIMENT XIV
Index of Refraction
Purpose:
To study the refraction of light in various types of glass and to verify Snell's law of
re frac t :on .
Apparthus:
Rectangular glass plate, boroilicate, soda lime, lead glass, and a triangular glassprism.
Information:
The bending of light rays as they pass from one medium to another is the subject of
study for this experiment. This bending of light at the boundary between two differentmediums is called refraction. Refraction or medium-face bending is caused by the change in
the speed with which light travels through the two mediums. Light travels at its greatestspeed in a vacuum and only slightly slower in the gases of our atmosphere. The speed oflight is reduced as the material becomes optically dense. Water and glass of all, types arc
optically more dense than air. You may have observed that when alight ray strikes an object
perpendicular to the surface, there is no bending of its rays; but if a light ray strikes thesurface at an angle away from the perpendicular, the part of the light which is not reflectedwill enter the surface and will be bent. The amount of the bend of the light ray is
proportional to the ratio of the velocities of light in the two mediums.
AIR
**IR
WATER
1
If the ray is traveling from a less dense to a more dense medium, the refracted angle
will be smaller than the incident angle. The incident angle is the angle between the entering
ray in the new tiler-141m and a line perpendicular to the surface. When the ray is traveling
from a less dense medium to a more dense medium, it will be bent towards theperpendicular or normal line. When the ray is traveling from a more dense to a less dense
medium, the ray will be bent away from the perpendicular or normal line.
The Dutch physicist Snell found that, when light travels between any twomediums, regardless of the striking angle, the ratio of the sine of the refracted angle tothe sine of the incident angle is a constant. It turns out that this constant is also theratio of the velocity of light in the incident medium to the velocity of light in therefracting medium. This constant is called the index of refraction and the Greek letter pis used as its symbol.
48

where:
. cut i
11 sin r
Vr
V2
i = angle between incident ray and the normal line.
r = angle between refracted ray and the normal line
Vi = velocity of light in the incident medium.
1'7 = velocity of light in the refracting medium.
Procedure:
Part I. Rectangular Glass Plate.Place a piece of graph paper on a cork or cardboard back. Set the rectangularglass plate near the center. Outline the glass plate on the graph paper as in theillustration below. Set pins 1 and 2 in line with each other in th,: upperright-hand side of the graph paper, but at an oblique angle to the glass surface.From the lower left-hand side of the graph paper, position the eye so that pinsone and two appear to be in line when viewed through the glass. Place pins 3 and4 on the lower 1,, t side of graph paper so that they are in line when viewedthrough the glass with pins 1 and 2.
Draw a line through pins 1 and 2 to the surface of the glass. Draw a line throughpins 3 and 4 to the surface of the glass.
Construct a line perpendicular to the surface of the glass at the point ofintersection with line 1-2 and the glass surface.
Construct a line perpendicular to the glass surface at the point of intersectionbetween the line 3-4 and the surface. Now draw a line between the twointersections points, within the glass rectangle. This will represent the path thelight ray took while in the glass.
49

The rays of light came to our eye from pins 1 and 2, through the glass, andthrough pins 3 and 4.
Measure and record the angle in degrees between line 2 and the perpendicularline at its point of intersection with the surface. Call this incident angle 1. Recordthe angle between the line drawn inside the glass frame and the above
perpendicular line. Call this refracted angle 1. Measure and record the anglebetween the line drawn inside the ..;lass area and the perpendicular to the surfaceat its intersection with line 3-4. Call this incident angle 2. Record the anglebetween line 3-4 and the perpendicular at the intersection point. Call this
refracted angle 2. Note that the angle is smaller when light is going into a moredense medium and is larger when going to a less dense medium.
Repeat the above procedure for the other two types of glass.
Part IL Refraction in a Triangular Glass Prism.Place a triangular glass prism in the center of a sheet of graph paper with it base
parallel to the horizontal edge of the paper. Outline its position on the graphpaper with a sharp pencil. Insert a pin near the upper left corner of the paper.Place a second pin a couple of inches away from the first in such a manner that aline drawn through the two pins will strike the glass surface at a sharp angle andto the left of the center of the glass. With your eye close to the lower right sideof the paper, move your line of vision from left to right until both pins appear tobe directly in line. Mark this line of sight by placing a third pin in the lower right-hand side of the paper so that it appears, while looking through the glass, to bedirectly in line with the other pins. Place a fourth pin in line with-and on thesame side of the paper as the third pin. Check carefully, when sighting down thetwo pins from the lower right corner of the paper and through the glass, that allfour pins appear to form a straight line. Mark carefully on Ole paper the positionof each pin.
Remove the glass plate and draw a straight line through pin positions 1 and 2until it strikes the glass surface. Draw a straight line through pin positions 3 and 4until it strikes the glass surface. Connect the two points of intersection, with aline. Call this line 1.
Now place two pins, one on each side of the prism and touching the prism, suchthat a line drawn between them would be parallel to the prisin base. Lookthrough the prism with the eve close to the paper while moving your head backand forth until the two pins appear to be in line with each other. Place a thirdpin on the opposite side of the prism from the eye so that the three pins appearto be in a straight line when viewed through the prism. Place a fourth pin on thesame side of the prism as your eye that will appear to be in a straight line withthe other three when viewed through the prism.
50

Be sure an outline of prism has been made and the four pin positions have beenmarked. Remove prism. Draw an external line connecting the two pins on eitherside of the prism to each other. Construct the line between the pins that weretouching the prism. Call this line 2. This is approximately the path that this lightray would take through the prism.
Repeat part II for triangular prisms made from the other types of glass.
Results:
Pan. I. Glass Plate
Compute the index of refraction of each of the glass plates, using the formulagiven in the body of this experiment, and using incident angle 1 and refractedangle 1.
Do the same by using incident angle 2 and refracted angle 2.
Part II
Diagram and then label path of incoming and outcoming light rays from trangularglass prisms.
Analysis and Interpretation:1. Compare the refractions indexes found in the experiment with those from
published tables.2. From outside reading, explain why the white light is spread out into the
spectrum colors.3. Diagram,using colored pencils,the separation or dispersion of light.
4. What is the importance of the index of refraction of particular kinds of glassin the manufacture of optical instruments and lenses?
rfo
51

4
JFt
",, ..
4a.ht/sirro -
4
4'
1.
ler 1,
1-44,
" '

EXPERIMENT XV
Image Formation by a Thin Lens
Purpose:To study image formation, radii of curvature, refractive index, and focal length of
thin lenses.
Apparatus:Optical bench with three movable mounts; double convex lens of about 20 cm
focal length; object light source; image screen; strips of red and blue glass; and metaldisks (one about the same size as the lens with an aperture in the center of about 1 cmand one which will cover only the central portion of the lens); spherometer.
Information:The most frequently observed phenomena encountered in the field of optics are
images formed by a thin lens or groups of lenses. A few of the common instrumentswhich utilize these phenomena are telescopes, spectacles, microscopes, cameras projectors,and rangefinders. There are basically two types of lenses, according to their shapes:converging lenses and diverging lenses. Mose lenses which are thicker in the center than
they are' on the edges tend to bend or refract light away from the optical axis and arccalled diverging or negative lenses.
There are certain basic defects in image formation with lenses. The defect of
spherical aberration, or indistinct focus of light rays which strike at a distance away from
the optical axis, is similar to this defect as found in sperical surface reflectors or mirrors.
One of the important defects of lenses is called chromatic aberration. It is caused by thefact that light of all colors or frequencies is not bent or refracted the same amount bythe lens material. The image will not be absolutely sharp because the lower frequencies(red light) are not bent or refracted as much as the higher frequencies (blue light). A thirddefect, astigmatism, is noted if the curvature of a lens is not the same for all planesthrough the optical axis. A thin lens will have a small thickness compared to its focallength, and in these situations, the basic lens formula will apply.
1 + I = 1
d d
w here:
do = distance from the object to the optical center of the lens.di = distance from the image to the optical center of the lens.f = focal length of the lens.
53

The above formula applies only to a symmetrical, thin lens, but lens
manufacturers make all shapes of lenses. The relationships shown in the lensmaker'sformula below is true for all lenses.
+R2
where:
f = focal length= refractive index of the, lens material
R 1 = radius of curvatur, of first face
R2 = radius of curvature of second face
R and R2 are positive if they result in convergence and negative if they result indivergence.
If the refractive index is to be found of a lens material for a lens alreadymanufactured, the lensmakers formula may be solved for,
R1
R2R2)+ R2)
Procedure:
Part I. Lens Constant Determinationa. Set up the optical bench with three movable carriers. Place the object light
source or object box on the left carrier, the lens and 1ms holder on themiddle carrier. and the image screen in the third position. With object box atthe end and lens and lens holder at the center of the optical bench, move thescreen until a clear image is viewed on the screen. Record the object-to-lensdistance (do) and the image-to-lens distance (di).
b. Repeat the above procedure, except move the object box closer to the lenswhile adjusting the image screen for a clear image. Continue this operationUntil the image distance is greater than, the object distance. Measure -.andrecord the object distance and the image distance.
c. Take spherometer readings of both faces of the double convex lens. Sinceboth lens faces are spherical, the method used in Experiment XIII may be usedto determine the radius of t _mature of each face. The radius of curvatureformula is :
L26d
54

where:R = radius of curvatured = the micrometer screw reading above or below the plane of the legsL = the average distance between the legs
Part II. Chromatic AberrationLight of different wavelengths is bent or refracted by the crown glass lens bydifferent amounts. Since this is the case, two wavelengths that are as far apt,: aspossible should be used for this part of the experiment. A piece of red and apiece of blue glass will be used to filter out all the frequencies of white light fromthe object box except those of red or blue, which pass through the glass plates.Place the red glass plate in front of the object box and adjust the image screenuntil a clear image is formed. Measure and record the image distance for this redlight. Replace the red plate with a blue glass plate in front of the object box.Readjust the image screen for a clear image with this blue light. Measure andrecord the image distance for the blue light.
Part III. Spherical Aberration
Spherical aberration is actually due to the spherical curvature of the lens and notdue to light frequency. A nearly monochromatic light white light passingthrough the red glass plate will be used in this part of the experiment to allowthe observation ofspherical aberration without the interference of chromaticaberration.a. Place the metal disc with the hole in the center in front of the lens between
the object and the lens. This will allow only the light rays near the principalaxis of the lens to pass through. Adjust the image .screen until a clear image isfound. Measure and record this image distance.
b. Place the metal disc with the center covered but the outer edge open betweenthe object and the lens; this will allow only those rays,at a distance from theprincipal axis to pass through the lens. Adjust the image screen until a clearimage is formed. Measure and record the image distance.
Part IV. Astigmatism
a. Leave the red glass in front of the lens and rotate th'e lens mount about itsverticaraxis while observing the image on the screen. Fix the lens mount at anangle of approximately 45 degrees with its vertical axis. Move the imagescreen until the vertical lines of the image are clear. The horizontal part of theimage will be fuzzy. Measure and record this image distance.
b. Move the image screen until the horizontal part of the image is clear and thevertical portion is fuzzy. Measure and record this distance. This difference inimage distance is due to the simulation of a deformed lens.
55

Calculations:
Part I.
Part II.
a. From the basic thin lens equation and the image and object distances,compute the focal length of the lens.
b. Use the spherometer equation to calculate the radius of curvature for eachface of the lens.
c. Utilizing the focal length and radii of curvature from the above calculations,apply the lensmaker's formula and determine the index of refraction of theglass for white light.
a. Utilizing the image distance foired light and the image distance for blue light,calculate, using the basic thin lens formula, the focal length for red and bluelights.
b. Use the radii of curvature calculation from Part I and the focal lengthcalculations from Part II, determine the index of refraction (Az ) for the red
and then the blue light.
Analysis:
1. Carefully illustrate by the use of diagrams the phenomena of sphericalaberration, chromatic aberration.
2. What caused the distortion encountered in Procedure Part IV, Astigmatism,and how can this defect be used to advantage?
3. From collateral reading, explain how chromatic aberration and sphericalaberration are minimized in ordinary optical instruments.
56

EXPERIMENT XVI
PolarizatiOn of Light
Purpose:
To study the phenomenon of light polarization, the transverse character of light,and to investigate some practical applications of polarized light.
Apparatus:
Optical bench, screen, diaphragm with variable aperture, light source, Polaroidexperimental kit (Bausch and Lomb Inc.), optical bench mounts, convex lens with 20 to30 cm. focal length, photoelastic material, photoelastic samples, photoelastic stress cycler(Scott Engineering Model No. 9047) andpolariscope (ScottEngineering Model No. 9015.)
Information:
Light waves are transverse waves which are electromagnetic in character andtravel through a vacuum at approximately 186,000 miles/second. The .electric andmagnetic vibrations which make up light vibrate perpendicular to each other. Bothvibrations are perpendicular to the direction of travel of the wave. Ordinary light appearsto be made up of millions of these vibrations; and these waves are vibrating in allpossible planes,which intersect in an axis, which is defined as the direction of travel ofthe wave. If the ordinary light beam could be observed end on from a position along theaxis of travel, the waves should.be equally distributed in all planes about the axis. This isan example of what is said to be unpolarized light.
In light which is polarized, all the electric vibrations of the electromagnetic waveare in the same plane. There are several ways by which light may be polarized. Some ofthese are: by reflection from air and dust particles in the atmosphere, by doublerefraction through material crystals like calcite, by reflection from nonconductingsurfaces, and by selective absorption with materials such as tourmaline and other opticalsubstances.
The easiest to use of the above methods is a manufactured material known asPolaroid. This material is made up of small needle-shaped crystals of the organiccompound, sulfate of iodoquinine. When these crystals are lined up parallel to each otherand imbedded in a nitrocellulose mastic, a thin, plastic-like film, they will transmit nearlyall the components of light vibrating in one direction but will absorb nearly all othercomponents of light. The, effect is similar ,to the selectric absorption of light in crystalslike tourmaline.
57

*.
,
b
,17
'41011k.
0:
*.*
a
.t'
.
1
e
1S.

Procedure:
Part 1. Observation of the Effect of Double PolarizersSet up an opti,,t1 bench with a light source, lens system and adjustable aperture atone end, and a screen at the other end. Adjust the lens for a parallel beam oflight and the aperture to a diameter of about 1 inch.Place one piece of polarizing material from the polarizing kit in the light beamabout 5 inches in front of the screen. Place a second piece of polarizing materialin the light beam about 3 inches from the screen. Leave the first piece ofpolarizer
in the fixed position, and rotate the second piece of polarizer about theaxis of the light beam. Observe and record the effect of this action on the lightscreen.
Part I1. Effect of Crystals such as Calcite, Mica and Celloph Films,
With the second polarizer still 3 inches from the sckedn, remove the first polarizerand usecrystals of calcite and mica and'cellophane film in its place. Rotate eachof these samples in the beam of light while bending and twisting them. Observeand record the effect on the light on the screen.
Part III. Strains in Transparent MaterialsSet up the Scott Cycle'r Model No. 9047 between the two polarizing plates of theScott Polariscope model 9015. Use the white-light position of the switch onpolariscope model 9015. Insert stress samples in the Stress cycle, observe andrecord your observations both before and during the time the stress cycler isoperating.
Results:
Present your results under the headings listed in tre Procedure section of thisexperiment. Describe exactly what you learned and use sketches to clarify your points.
Analysis and Interpretation:1. How does this phenomenon of polarization help prove that light is transmitted
by transverse wave motion?2. What are some practical uses of polarization in the glass industry?3. How do Polaroid glasses reduce glare?
59

EXPERIMENT XVII
it/Ill Ha! 1/1,1111 II) ( ,I,iss
Purpose :
To study the effect of hca, on the strain patterns in vlass
Apparatus:
"urn.:r, sass laboratory samples and Scott Engineering Polariscopc Moati
Information:Glass at ordinary temperatures is a highly elastic substance, which is obtained as
the result of cooling a viscous liquid. The amount of stress in glass is dipendent on its
total thermal history.
Glass, except at very high temperatures, is a very poor conductor heat.
Therefore, as glass is heated or cooled, temperature gradients are developed. 'Mk
temperature gradient is the slope of the curve formed when tem!. erature is plotted against
the distance from the surface to the center of the object; it describes the lag, ir
temperature between the outside and the inside of the glass.
A change in temperature of a glass object causes a consequent change in length.
The external length will be different from the internal length, so stresses will be set upbetween the internal and external portions of the glass. Wherever there is a stress, there
will be strain developed. When viewed under polarized light, these strain lines will appear.
If glass is heated to a very high temperature, it becomes viscous enough that these strain
strata cannot exist. The problem is how to cool the glass to normal using temperatures
without having excessive internal strains develop.
When the glass is cooled rapidly, very large and widely distributed strains willappear. Sometimes these strains are large enough to cause the glass to break withouthandling or use. There are times, though, when these large and widely distributed strains
are not enough to break the glass, and in this case it achieves properties of strength and
surface hardness. These will be studied in a later experiment.
Theoretically the proper method used to remove and relieve these strain stratawould be to keep the temperature of the glass as nearly the same on the inside as it is on
the outside during the cooling process. The term "anneal" is used in the glass industry.The annealing of glass consists of raising the glass object to a very high temperature sothat the strains disappear; then slowly lowering the temperature so that the internaltemperature remains fairly close to the external temperature.
60

Procedure:
1. Minimum Strain.Using a sample of glass tubing fresh from the shipping crate or storage rack,
observe and sketch the strain patterns in the glass as seen through a polariscope.
2. Temporary strainHeat one end of sample glass tubing in steady flame of intense heat. The glass
reed not be heated to its working pint. Remove glass tubing from the flame and insertit between the two disks of the polariscope. Observe and sketch the strain lines along the
glass as it is moved between the polariscope disks from the hot end to the cooler end.After heating the tubing again, let it cool norm illy in the room. Observe it through thedisks on the polariscope at about two-minute intervals. Describe what changes occur in
the strain pattern in the glass.3. Permanent Strain
Heat a piec- of glass tubing to a moderately high temperature then quickly
quench it in a container of water. Place the quenched tube between the disks of thepolariscope. Observe and sketch the strain lines in the glass.
Results:Organize and sketch the strain diagrams and observed material into the body of a
report of your data.
Ana ly ;is and Interpretations:1. Would it be theoretically possible to produce a piece of glass completely free
of strain?2. Why is glass at 200° -C easier to chip than glass at normal room temperature?3. A piece of glass has a coefficient of linear expansion of 8.5 X 10⁻⁶/°C ai d a
temperature gradient of 100°C. What would this represent in difference inlength from outside to inside per centigrade degree?
61

62

EXPERIMENT XVIII
Glass Tube Bending and Breaking Points
Purpose:'To determine a modulus of elasticity for glass tubing and to determine a shearing
force for glass tubing under the following conditions: dust on the glass, grease on theglass, scratches, and wetting.
Apparatus:
Scott Engineering Properties of Materials Test System Model 9014; ScottPolariscope Model 9015; glass tubing specimens dusty from the storage rack and wellcleaned; micrometer calipers; and vernier calipers.
Information:Glass has some unusual properties because, as used in the glass shop, it is a super-
cooled liquid rather than a true crystalline solid. It has some of the physical
characteristics of solids such as its hardness, solid form, and elasticity. It also'has somerather curious properties such as not being plastic at room temperature. If a force isapplied to glass, it will bend elastically until it breaks but will not bend elastically andstay partially deformed as will a piece of metal. The modulus of elasticity is normallygiven by the equation
S
where:E = moduiLs of elasticity (psi)
S = bending stress (psi)e = strain due to bending action (inch/inch)
Glass also has some other strange properties due to its unusual classification. Themolecules at the surface of the glass give it much of its strength by cohesive forces calledsurface tension. If the surface tension is disrupted or the intermolecular forces disturbed,the strength of the glass is drastically reduced. A scratch will disrupt these forces as wellas putting a ;stress into the glass. Dirt, grease, and water will also disrupt the surfacetension of the glass. For this reason, wetting a scratch will make a break much easier toaccomplish.
63

Procedure:
1. Set up the properties-of-materials test system in the long configuration forsingle, central-force beam bending. Place the support posts so that theysupport the glass rod near its ends. Use support heads 14-09-000. Set up thepolariscope so the glass specimen can be cbserved as it is bent.
2. Set up the Scott strain balance system with the active gage between the glassrod, which will be set in position, and the yoke. Zero the null indicator withthe initial balance after the active gage is in position and before a force hasbeen applied.
3. Cut glass tube in lengths of approximately 20 cm and use samples with thefollowing conditions:
a. Dirty, as from long storage on a rack.
b. Greasy, as from excessive handling.c. Scratched,as for making a break.d. Scratched and wetted,as for making a break.e. Well cleaned by chromic Acid- and washed with water and dried.
4. Apply load in 10- id increments for unscratched specimens and 1-poundincrements for scratched specimens and record strain on the strain gage andmicrometer until the breaking point is reached.
Results:
1. Observe and sketch the type of fracture that results from each specimencondition.
2. Calculate the modulus of elasticity, using the length of the tube as the distancebetween support points, and the deformation found by the micrometer tocalculate strain.
3. Use the strain recorded by the strain gage to calculate the modulus ofelasticity.
Analysis and Interpretation:
1. Describe what effects the various conditions have on the modulus of elasticity,the breaking, point, and the resulting type of fracture.
2. Plot the stress vs. strain on a graph. The modulus of elasticity can readily befound from this plot if the stress is plotted vertically and the strain
horizontally. The modulus of elasticity (E) will then be the slope of thisgraph.
64
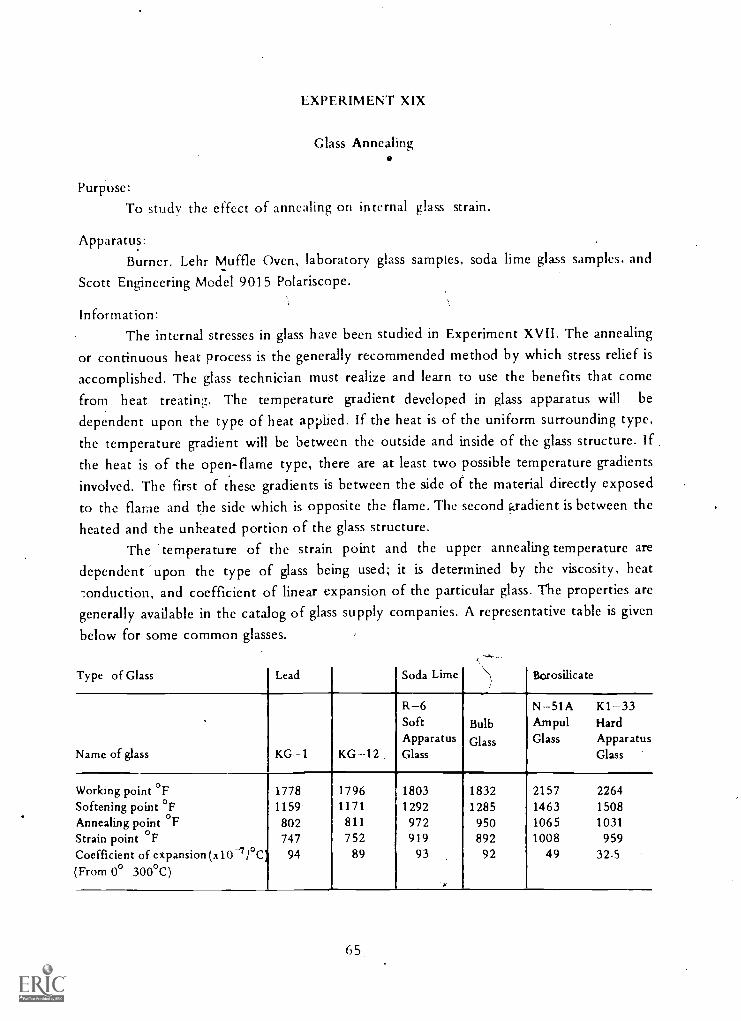
EXPERIMENT XIX
Glass Annealing
Purpose:To study the effect of annealing on internal glass strain.
Apparatus:Burner, Lehr Muffle Oven, laboratory glass samples, soda lime glass samples, and
Scott Engineering Model 9015 Polariscope.
Information:The internal stresses in glass have been studied in Experiment XVII. The annealing
or continuous heat process is the generally recommended method by which stress relief is
accomplished. The glass technician must realize and learn to use the benefits that come
from heat treating. The temperature gradient developed in glass apparatus will be
dependent upon the type of heat applied. If the heat is of the uniform surrounding type,the temperature gradient will be between the outside and inside of the glass structure. Ifthe heat is of the open-flame type, there are at least two possible temperature gradientsinvolved. The first of these gradients is between the side of the material directly exposed
to the flame and the side which is opposite the flame. The second uadient is between the
heated and the unheated portion of the glass structure.The 'temperature of the strain point and the upper annealing temperature are
dependent 'upon the type of glass being used; it is determined by the viscosity, heat-.onduction, and coefficient of linear expansion of the particular glass. The properties aregenerally available in the catalog of glass supply companies. A representative table is given
below for some common glasses.
Type of Glass Lead Soda Lime 1 Borosilicate
R-6 N-51A K1-33Soft Bulb Ampul HardApparatus Glass Glass Apparatus
Name of glass KG-1 KG- 12 Glass Glass
Working point °F 1778 1796 1803 1832 2157 2264Softening point °F 1159 1171 1292 1285 1463 1508Annealing point °F 802 811 972 950 1065 1031Strain point °F 747 752 919 892 1008 959Coefficient of ekpansion(x10-7/°C1 94 89 93 92 49 32.5'From 0° 300°C)
65,

A very im portant property of any apparatus glass is heat shock or thermalendurance. This is the ability of a material to withstand sudden changes in temperaturewithout bred king. Thermal endurance is largely a property of the coefficient ofexpansion. Referring to the table for this experiment, it will be observed that theexpansion coefficients vary from 32.5 x 10 -7 / °C to 94 x 10-7/°C. The glasses withlow coefficients of expansion can be cooled faster after working without developingexcessive cooling strain. The glasses with high coefficients of linear expansion must becooled slowly, or they could crack before they can be gotten to the annealing oven. Ifdone properly, most of the internal strains can be removed in the flame where the glasswas worked.
The upper annealing temperature is at a point where the material is viscousenough so that the glass is no longer elastic and the stress will not cause a strain. Yet, itmust be below the temperature at which the glass object would distort in shape. Theupper annealing -temperature is very close to the softening temperature of the glass, sothat this temperature will seldom be used in the annealing process.
The temperature generally used for annealing is from 50° to 75° above the strainpoint. This strain point is the point where the material has regained the elasticitynormally associated with a solid. This is the point where an annealing time of four hourswill not remove the internal strains. A 4-hour period is actually an excessive annealingtime, because 90% of the internal stress is removed in two minutes at the upper annealingtemperature.
The annealing temperature actually used will depend mainly on the expansicincoefficient of the material, the time alloWed for annealing, the residual strain desired inthe material, and the method of annealing to be used. Once the temperature has droppedbelow the strain point, the internal strain is fairly well fixed into the glass.
Flame annealing is the method used to anneal the glass while it is still in theworking flame. To anneal the glass structure, it is rotated and moved back and forth inthe flame to reduce all temperature gradients to a minimum while raising the glass to theannealing temperature. The annealing temperature for flame annealing wo.:1.:1 approachthe upper annealing temperature for the type of glass in order to reduce the annealingtime. After the annealing temperature is reached and while rotating and moving theapparatus, it is gradually lifted out of the flame until uniform cooling has occurred andthe temperature has dropped below the strain point. This type of annealing must be donewith soft glasses that have a high coefficient of expansion and may be done withthin-wall hard glass. This process will remove the major portion of the internal stressfrom the glass.
The Lehr furnace technique of annealing is the method used for maximum orspecific relief of internal stress. It uses a lower annealing temperature for longer periodsof time. This process gives much better control and uniformity of the annealed end
66

product, though the time may he measured in hours. This is not a disadvantage because
furnaces have been built which are lug. id% instrilmented,and the temperature and time can
be automatically controlled. The operator simply places the glass in the oven and thetcuperature is at a tart the r,ztk,r. the operator tree to goback to glass fabrication while the equipment is being annealed. This process will be uses{
for specific residual-strain annealing and for heavy-wall or largo glass apparatus.
Procedure:
Part 1. Flame Annealing
a. Fabricate a simple laboratory apparatus from soft glass. As soon as the
apparatus is completed. remove it from the flame and let it cool in the air.Place the apparatus for viewing with the Scott Engineering Polariscope Model9015. Observe and record the strain lines in the apparatus.
b. Fabricate a soft-glass simple laboratory apparatus as in (a). but make sure the
complete apparatus is rotated and uniformly heated in the working flame asthe unit is completed. Gradually lift the apparatus out of the flame and allowit to cool uniformly under the influence of the flame. Place the apparatusbetween the discs of the Scott Engineering Polariscope Model 9015. Observe
and record the strain patterns in the apparatus.
c. Repeats steps (a) and (b) above for a thin-wall hard-glass apparatus.
d. Repeats steps fsa) and (b) for a heavy -wall hard-glass apparatus.
Part I. Lehr Furnace Annealing
a. Place the apparatus fabricated in part la in the oven. Set the automaticinstrumentation to take the temperature up rapidly to the maximum and thenrapidly cool the apparatus. After cooling, remove apparatus from oven andplace it between the discs of the polariscope. Observe and record the internal
strain patterns in .the apparatus.
b. Place the apparatus used in part Ila in the oven. Set the automatic
instrumentation to raise the temperature ir-- the maximum slowly and thencool it slowly.
c. Repeat Steps Ila and Ilb with the apparatus fabricated in part I c.
d. Repeat steps Ila and Ilb with the apparatus fabricated in step Id.
Result:
Use the observations and sketches recorded in the measurements section of this
es periment :tad discuss what you have learned about glass annealing.
Analysis and Interpretation:
1. From collateral reading. discuss the methods and application of glass annealing
in the glass industry.
2. Why is proper annealing of critical importance in optical glass?
3. Explain why there is a difference between the annealing procedure of soft and
hard glass.

EXPERIMENT XX
Glass Strength Testing
Purpose:
To study methods of strength-resting glassapparatus.
Apparatus:
Scott Engineering Properties of Materials System Model 9014, Scott EngineeringPolariscope Model 9015. and soft and hard glass samples.
Information:
Except for glass which is to be used for optical applications, the most importantof its properties is its mechanical strength. In all types of glasses the measurement of itsmechanical strength is a much more difficult' task than the measurement of its opticalproperties. The modulus of rapture is the tensile strength when measured by bendingrather than direct axial stress. One of the most important mechanical properties of glass isthat the compressive and shear strengths of glass are almost infinite.
In practical applications where shear or compression are attempted, some bendingwill occur. Thus, a tensile stress and consequent failure are induced.
Several of the factors concerning the effect of surface scratching, or wettedsurface of glass, have been studied in the experiment dealing with glass bending andbreaking. This experiment dealt with finding the modulus of elasticity by the bendingmethod. The difficulty in applying this to glass apparatus is that it measures the weaknessof the surface; the condition of the surface depends upon whether it has been scratched,touched, or simply left in the air to age.
The bending moment under a single concentrated load varies from zero at thesupports to maximum at the center where the load is applied. This gives the maximumbending moment only at this central point; and the modulus of rupture from thisexperiment is not as accurate as most scientists think it could be.
Very little experimentation has been done with so-called no-shear load testing, orthe use of two equal loads equidistant from the center. This type of loading produces abending moment throughout the distance between the two loads which is constant andequal.
This loading should give more uniform results than the central, concentrated loadand will be the method used in this experiment.
The glass sample is length L1 , and the distance between the loads is L2. If L2 is
equal to one half of L1 and F = P (ram area), then the bending moment may befound by the formula developed below.
MPA, (E1L2 p4r (1"
2
68
-1/2)
4

where:= maximum bending moment in in.-lbs.
P= pressure reading from hydraulic gagelr = ram area of hydraulic piston
= .223 in2 when shaft is retracting= .373 in2 when shaft is extending
L1 = length of rod between the supports in inchesL = distance between equal loads in inches
Then:
LL2
2
tlP Ar L1
8
The maximuhn tensile stress developed will be, according to the study of strength ofmaterials,
Where:
Rupture stress =
Where the beam is symmetrical:
solid circular Z = d32
tubular circular rod Z
Alz
4 4
32 d1
rectangular rod Z b6 h2
Z= section modulus in inchesd = diameter of solid rod in inchesd1 = outside diameter of tubular rod in inches
d2 = inside diameter of tubular rod in inches
b = width of rectangular rod in inchesii = height of rectangular rod in inches
Procedure:
Part 1. Solid glass rod
a. Place Vs-inch-diameter solid soft-glass rod in Scott Properties of Materials TestSet as shown in photograph.Be sure that the large hose from the hydraulic jackis connected to the top of the jack.
b. Read and record rod diameter and length between supports.c. Pump up the pressure using the hydraulic jack until rapture of the glass
occurs. Read and record the pressure on the gage at time of rupture.d. Repeat steps (a), (b). and (c) for '4-inch-diameter solid hard-glass rod.
69

4.11MIMIPIIIYANIP.1111111.
I
I.
VIM
TEST Cor'Y
70
V.
4,-,1,44.
41.

Part II. Tubular glass rod
a. Place inch diameter tubulat sHt glass rod on Scott PropertiesMaterials Test Set Model 9014as shown in photograph. Be sure that the largehose from the hydraulic jack is connected to the top of the jack.
h. Measure and record the outside and the inside diameter of the rod and thelength of the rod between the supports.
c. Pump up the pressure on the gage until the glass rod ruptures. Read andrecord the pressure of the gage at the time of rupture.
d. Repeat steps (a), (b), and (c) for 1/4-inch-diameter hard- glass tubular rod.
Results:
1. Using measurements from part I, calculate the bending moment (Al), sectionmodulus (Z) and the rupture stress on the solid glass rods.
2. Using measurements from part II, calculate the bending moment (Al), sectionmodulus (Z) and the rupture stress on the tubular glass rods.
3. Compare the results of the rupture stress calculations for this experiment withthose of the other members of the class. /
Analysis and Interpretation:1. If there arc discrepancies between your findings and those of your classmates,
what are some of the possible causes for these discrepancies?2. How do the results of the experiment compare with the results of Experiment
XVIII on glass tube bending and breaking?
71