doctoral education in the uk: ideal models and the stark reality professor mick fuller chair of uk...
TRANSCRIPT

Doctoral education in the UK: ideal models and the stark reality
Professor Mick FullerChair of UK Council for Doctoral EducationMember of Steering Committee, EUA-CDE
Head of Graduate School, Plymouth University

PGR PGT Batchelor
Other UG Total
Over 2.5M students
4% 19% 57% 20% 100%
UK student population
data from HESA

PG numbers overall (HESES)
Millward Inside Government 2014


Numbers of PGR starters (75-80% FT)
0
2,000
4,000
6,000
8,000
10,000
12,000
14,000
16,000
18,000
20,000
1996-97
1997-98
1998-99
1999-00
2000-01
2001-02
2002-03
2003-04
2004-05
2005-06
2006-07
2007-08
2008-09
2009-10
Academic year
Nu
mb
er o
f st
arte
rs
Full-time PhDFull-time MPhil to PhDPart-time PhDPart-time MPhil to PhD
PhD study Trends and profiles1996-97 to 2009-10 HEFCE 2011
81% decadal increase
Mean age 27.8 yrs
16%decadal increase
Mean age 38.9 yrs

Numbers of PGR starters by origin
0
1,000
2,000
3,000
4,000
5,000
6,000
7,000
8,000
9,000
10,000
1996-97
1997-98
1998-99
1999-00
2000-01
2001-02
2002-03
2003-04
2004-05
2005-06
2006-07
2007-08
2008-09
2009-10
Academic year
Nu
mb
er o
f st
arte
rs
UK
International
EU
PhD study Trends and profiles1996-97 to 2009-10 HEFCE 2011
57%
122%
115%

UUK 2013

0 20 40 60 80 100 1200
200
400
600
800
1000
1200
Mean no PhD’s awarded/yr
25% - 4 Universities (Oxford, Cambridge, UCL, Manchester)25% - 18 Universities (Russell Group)25% - 32 Universities (Russell Group + some others)25% - 66 Universities (Alliance + MillionPlus)

HEFCE Issues report 2013
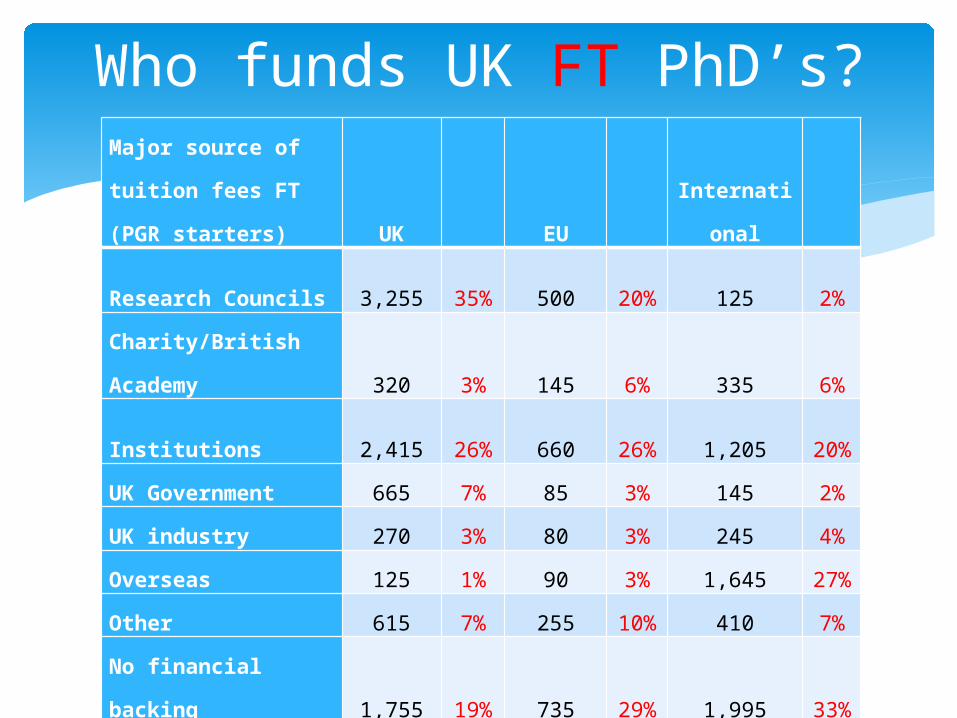
Who funds UK FT PhD’s?Major source of
tuition fees FT
(PGR starters) UK EU
Internatio
nal
Research Councils 3,255 35% 500
20
% 125 2%
Charity/British
Academy 320 3% 145 6% 335 6%
Institutions 2,415 26% 660
26
% 1,205
20
%
UK Government 665 7% 85 3% 145 2%
UK industry 270 3% 80 3% 245 4%
Overseas 125 1% 90 3% 1,645
27
%
Other 615 7% 255
10
% 410 7%
No financial
backing 1,755 19% 735
29
% 1,995
33
%
Total 9,420
100
% 2,550
100
% 6,105
100
%

Who funds UK PT PhD’sMajor source of
tuition fees PT
(PGR starters) UK EU
Internatio
nal
Research Councils 0 0% 0 0% 0 0%
Institutions 660 18% 55 10% 65 11%
UK Government 250 7% 30 6% 10 2%
UK industry 400 11% 25 5% 25 4%
Other 250 7% 40 7% 60 10%
No financial
backing 2,055 57% 365 71% 430 73%
Total 3,615
100
% 510 100% 590
100
%

Response mode research grant funding and research student funding Engineering and Physical Sciences RC (EPSRC) Natural and Environmental Sciences RC (NERC) Biotechnological and Biological Sciences RC
(BBSRC) Medical RC (MRC) Economic and Social Science RC (ESRC) Arts and Humanities RC (AHRC)Large equipment research grant funding Science and Technology RC (STSC)
Research Councils UK (RCUK)

Old Individual studentships Research grant tied studentships CASE studentships
The Roberts Agenda (generic skills) – 2004-2011
New Block grant studentships – DTC/CDT/DTPs CASE studentships
The changing face of RCUK research student funding models

Government funding for PGR
AHRC
BBSRC
EPSRC
ESRC
MRC
NERC
STFC
HEFCE
SFC
HEFCW
DELNI
0 50000000 100000000 150000000 200000000 250000000 300000000
RC’s = £400M
RDP = £240MQr = £1018M
Millward Inside Government 2014

Government RCUK’s - DTC/DTP/CDT/IDC Innovate UK – Knowledge Training Partnerships (KTPs)
European Commission Marie Sklodowska-Curie (ITN/IDP), Erasmus Mundus doctoral
schools Industry – Pharma, Chemical, Engineering/Manufacturing
companies Universities – from Government funding and
Philanthropic donations Charities – Leverhulme, Cancer Research Foundation,
British Council International government sponsors
Major funders of PhD training

Generic elements for ideal research student training - RCUK
Discipline congruent Quality research activity Critical Mass of PGR students; 50 -100+ Subject specific skills training especially in year 1 eg a
PGCert/Dip or compulsory modules (structured training) Cohort approach to management and training Generic skills training and career development Industry contacts and internships Partnerships with other institutions/networks - mobility Conference support

CDTs Single institution Speciality research training + generic skills training Industrial collaboration cohort
DTPs/ITNs Partnership of several institutions Structured training in yr 1 + generic skills training Internships/Placements Mobility (experience in another lab/Uni) cohort
Common themes of block grant funding for PGR

You must have a good funding track record from the research council you are applying to – high starting thresholds e.g. BBSRC £7M in last 3 years (means RC will only place students where it has placed research funds – blocks out new/developing units)
You must have good completion rates of previously RC funded PGR students – over 70% submitted within 4 years
You must have an already established good training programme
You must match funded the studentships (additionality) – min of 25-50% of the number requested i.e you need to commit University money to the “pot”
Stark realities of getting RCUK block grant funding

Need to have entered in the Research Excellence Framework (REF2014) REF2014 is made up of 36 subject disciplines (was 63 in RAE08) Unis choose who to enter and which disciplines to enter (R&T staff – T
only, staff not eligible) The quality of each discipline entry is judged on:
Quality of Outputs – best 4 outputs per academic entered Quality of Research Environment – research income, research student
completions, research strategy Quality of Research Impact
This gives a profile of quality: proportion of 4*, 3*, 2*, 1*, uc The Quality profile then goes into two algolrhithms to calculate funding
(Mainstream Qr and Research Degree Programmes (RDP) Qr) RDP depends on weighted Quality rating x Nos of current Home PGR
students Mainstream Qr depends on a weighted Quality rating x Nos Staff submitted
X subject weighting
Getting HEFCE PGR grant

Original statement was: “To fund quality research wherever it was found”However this saw more of the money distributed away from the top research intense Unis and so a weighting was introduced2009 – weighting 7x4* + 4x3* + 1x2* (no funding for 1* or uc)2012 – weighting 3x4* + 1x3* (no funding for 2* less for 3*)2015 – weighting 4x4* + 1x3* (even less for 3*)
Net effect: concentration of funding
Changes to the weightings

0 20 40 60 80 100 120 1400
2000000
4000000
6000000
8000000
10000000
12000000
14000000
16000000
RDP allocation
RDP income post 92 RDP pre 92 RDP specialist colleges
£

European Commission Horizon 2020
“The Commission will propose a common approach to help ensure that the next generation of doctorate holders can actively contribute to the Innovation Union with a further one million more PhD holders by 2020”
doctoral training should have a certain critical mass, doctoral programmes should include transferable
skills training, such programmes should respect the principles of the
European Charter & Code, doctoral candidates should acquire the ability to
challenge disciplinary borders doctoral candidates should spend some research time
abroad and in industry in the broad sense.

Ideal = expensive model Expensive = fewer studentships 2 tier system emerging Concentration effects to fewer Unis/Depts Not all PhD students are 22-25 yrs PT studies not facilitated by the model Professional doctorates not included What jobs do they get – not all can become
academics ( < 20%) Are they being trained for the right job?
Stark realities of new models of PGR funding

University AllianceHighest-earning 20
Universities forResearch Income
% change in Doctoral graduates (2002-03 to 2012-13) 134% 41%
% change in share of UKHE Doctoral graduates (2002-03 to 2012-13) 2.8% -2.8%
% change in total research income (in cash terms 2002-03 to 2012-13) 63% 92%
% change in share of UKHE research income (in cash terms 2002-03 to
2012-13) -0.28% 4.9%
Does Concentration lead to better Doctoral training?

Queen
Mar
y, U
nive
rsity
of L
ondo
n
Unive
rsity
of L
iver
pool
Aston
Uni
vers
ity
Unive
rsity
of S
heffi
eld
Unive
rsity
of C
entra
l Lan
cash
ire
Unive
rsity
of B
radf
ord
Unive
rsity
of M
anch
este
r
Lond
on S
choo
l of E
cono
mics a
nd P
oliti
cal S
cien
ce
Unive
rsity
of N
ottin
gham
Unive
rsity
of H
ull
Unive
rsity
of R
eadi
ng
Unive
rsity
of D
urha
m
Unive
rsity
of B
irmin
gham
Cranfi
eld
Unive
rsity
Unive
rsity
of B
ath
Liver
pool
John
Moo
res U
nive
rsity
Unive
rsity
of P
lym
outh
Unive
rsity
of W
arwic
k
Nottin
gham
Tre
nt U
nive
rsity
De Mon
tfort
Unive
rsity
Keele
Uni
vers
ity
Royal
Hol
loway
, Uni
vers
ity o
f Lon
don
Unive
rsity
of H
udde
rsfie
ld
Birkbe
ck C
olle
ge
Unive
rsity
of S
alfo
rd
Brune
l Uni
vers
ity
Golds
mith
s' Col
lege
Anglia
Rus
kin
Unive
rsity
Unive
rsity
of B
olto
n0.0
10.0
20.0
30.0
40.0
50.0
60.0
70.0
80.0
90.0
100.0
HEFCE 7 yr completion rates for FT students 2010/11
%
0
20,000
40,000
60,000
80,000
100,000
120,000
140,000
160,000
180,000
0
20
40
60
80
100
120
140
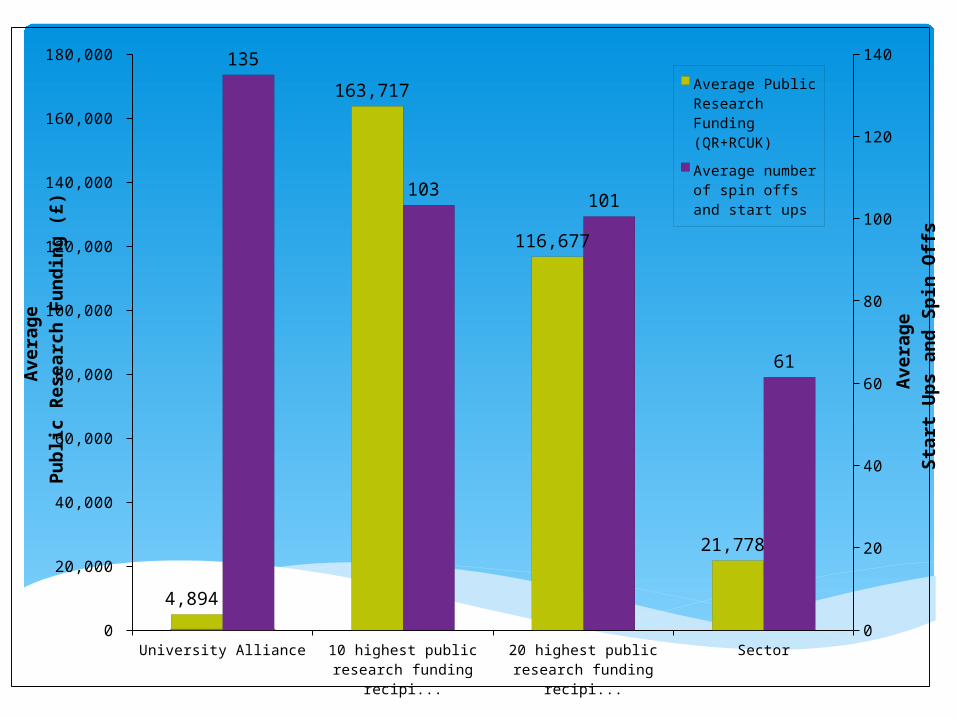
4,894
163,717
116,677
21,778
135
103 101
61
Average Public Research Funding (QR+RCUK)
Average number of spin offs and start ups
Ave
rag
e
Pu
bli
c R
ese
arc
h F
un
din
g (
£)
Ave
rag
e
Sta
rt U
ps a
nd
Sp
in O
ffs
Rise in Graduate Schools 2000 – 2013 Graduate Schools now in most Universities
Some institutional wide Some faculty/discipline based
As some Unis became successful at getting CDTs/DTPs/ITNs then this has challenged the overall management of them to prevent re-inventing the wheel
Current trend is the rise in the “Graduate College” which is the institutional wide Graduate School
How are new models of funding influencing Universities behaviour to support PGR
students?

Is the experiment working? Does block grant, cohort funding lead to:
better student experience? improved completion rates? better preparedness for employment? better employment for those PhD graduates?
Will it prejudice PhD graduates who do not come from a CDT/DTP/ITN cohort?
Should Unis remodel their entire PhD provision to fit the block grant, cohort funded examples?
Should Unis identify training streams for PhD students? Academic stream; Industrial stream; Entrepreneur stream;
Public sector stream
Challenges - Where to from here?

Don’t forget to ask the students!