doctor of philosophy of the requirements for the degree of...
TRANSCRIPT

i
EXPERIMENTAL INVESTIGATION OF INTERNAL COOLING PASSAGES OF
GAS TURBINE BLADE WITH PIN-FINS AND RIB-TURBULATORS
by
Sin Chien Siw
B.Eng., University Technology Tun Hussein Onn, Malaysia, 2002
M.S., University of Pittsburgh, USA, 2007
Submitted to the Graduate Faculty of
Swanson School of Engineering in partial fulfillment
of the requirements for the degree of
Doctor of Philosophy
University of Pittsburgh
2012

ii
UNIVERSITY OF PITTSBURGH
SWANSON SCHOOL OF ENGINEERING
This dissertation was presented
by
Sin Chien Siw
It was defended on
July 17, 2012
and approved by
Dr. Minking Chyu, Ph.D., Professor, Department of Mechanical Engineering and
Materials Science
Dr. Gerald Meier, Ph.D., Professor, Department of Mechanical Engineering and
Materials Science
Dr. Laura Schaefer, Ph.D., Associate Professor, Department of Mechanical Engineering and
Materials Science
Dr. Mark Kimber, Ph.D., Assistant Professor, Department of Mechanical Engineering and
Materials Science
Dissertation Director: Dr. Minking Chyu, Ph.D., Professor, Department of
Mechanical Engineering and Materials Science

iii
Copyright by Sin Chien Siw
2012
iv
EXPERIMENTAL INVESTIGATION OF INTERNAL COOLING PASSAGES ON
GAS TURBINE BLADE WITH PIN-FINS AND RIB-TURBULATORS
Sin Chien Siw, Ph.D.
University of Pittsburgh, 2012
Heat transfer and pressure characteristics in a rectangular channel are experimentally explored in
detailed. The study consisted of 3 parts: 1) effects of detached pin space, 2) combined effects of
detached pin space and ribs, and 3) effects of pin-fin geometry on heat transfer. The overall
channel geometry (W=76.2 mm, E=25.4 mm) simulates an internal cooling passage of wide
aspect ratio (3:1) in a gas turbine airfoil. With a given pin diameter, D=6.35 mm= ¼E, three
different pin-fin height-to-diameter ratios, H/D = 4, 3, and 2, were examined. Each of these
three cases corresponds to a specific pin array geometry of detachment spacing (C) between the
pin-tip and one of the endwalls, i.e. C/D = 0, 1, 2, respectively. The Reynolds number, based on
the hydraulic diameter of the un-obstructed cross-section and the mean bulk velocity, ranges
from 10,000 to 25,000. The experiment employs a hybrid technique based on transient liquid
crystal imaging to obtain distributions of the local heat transfer coefficient over all of the
participating surfaces, including the endwalls and all the pin elements. Pressure drop of each test
case is also measured in order to evaluate the performance of each case based on a non-
dimensional parameter, performance index, PI.
Experimental results reveal that the presence of a detached space between the pin-tip and
the endwall have a significant effect on the convective heat transfer and pressure loss in the
channel. The presence of pin-to-endwall spacing promotes wall-flow interaction, generates
additional separated shear layers, and augments turbulent transport. In general, an increase in
detached spacing, or C/D leads to lower heat transfer enhancement and pressure drop.

v
Addition of broken ribs and full ribs has significant impact on heat transfer enhancement
at the endwall only. Due to the geometry of the ribs, that is relatively low as compared to the
overall height of the channel, the pressure loss seems to be insensitive to the presence of the ribs.
Results showed that ribs underperform as compared to the cases without ribs.
Triangular pin-fins with sharp edges have the advantages of generating additional wakes
and vortices compared to circular and semi-circular pin-fins which contribute to higher heat
transfer at the downstream region. However, heat transfer at the leading region of the triangular
pin-fins are lower due to a more streamlined geometry at the leading region and without the
presence of horseshoe vortices, that is one of the major contributing factors of heat transfer
enhancement for circular and semi-circular pin-fins. Having the largest number of pin-fins and
arranged in a dense configuration, the TRI3 case has the highest overall heat transfer
enhancement ranging between 3.5-3.8, that is approximately 5%-20% higher than that of the
circular pin-fin array. As the TRI1 and TRI2 cases show comparable heat transfer enhancement,
this suggests that the heat transfer performance of the triangular pin-fin arrays is insensitive to
the transverse spacing. In addition, more uniform heat transfer is also observed on the endwall
and neighboring pin-fins in all triangular shaped pin-fin arrays. The semi-circular pin-fin array
has the lowest heat transfer performance ranging from 2.7-3.4. However, triangular pin-fin arrays
give the highest pressure loss due to the largest induced form drag among all cases, while
circular pin-fin array exhibits the lowest pressure loss.
vi
TABLE OF CONTENTS
ABSTRACT………………………………………………………………………………...........iv
ACKNOWLEDGMENTS……………………………………………………………………...xv
1.0 INTRODUCTION
1.1 BACKGROUND…..……………………………………………………………..1
1.2 LITERATURE REVIEW ON TURBINE BLADE INTERNAL
COOLING……………………………………………………………………......4
1.3 LITERATURE REVIEW ON RIB-TURBULATED INTERNAL COOLING
PASSAGES…………………………………………...…………………………13
1.4 PRESENT STUDY STATEMENT…....………………………………………20
2.0 TRANSIENT THERMOCHROMIC LIQUID CRYSTAL TECHNIQUE AND
DATA ANALYSIS……………………………………...…………………………...22
2.1 INTRODUCTION..…………………………………………………………….22
2.2 TRANSIENT THERMOCHROMIC LIQUID CRYSTAL TECHNIQUE...24
2.3 LUMPED HEAT CAPACITY METHOD…………………………………....26
3.0 THE EXPERIMENT AND EXPERIMENTAL APPARATUS…………….…....31
3.1 OVERALL SETUP………..…………………………………………………...31
3.2 TEST SURFACE PREPARATION……..……………..……………………..33
3.3 EXPERIMENTAL PROCEDURE……..……………………………………..34

vii
4.0 EFFECTS OF DETACHED PIN SPACE ON HEAT TRANSFER AND
PIN-FIN ARRAYS….………………………...……………..……………….……..35
4.1 TEST CASES………………….………………….…………………..………...35
4.2 LOCAL HEAT TRANSFER COEFFICIENT DISTRIBUTION….…….…37
4.3 ROW-RESOLVED, AVERAGED NUSSELT NUMBER……….……..……43
4.4 OVERALL HEAT TRANSFER COEFFICIENT…………………….....…..48
4.5 PRESSURE LOSS COEFFICIENT…………………..…………….………...49
4.6 PERFORMANCE INDEX….………………………………………………….51
4.7 KEY FINDINGS………………………………………………….…………….52
5.0 COMBINED EFFECTS OF DETACHED PIN SPACE AND RIB-
TURBULATORS ON HEAT TRANSFER AND PIN-FIN ARRAYS……….…54
5.1 TEST CASES…………………………………………………………………...54
5.2 LOCAL HEAT TRANSFER COEFFICIENT DISTRIBUTION…….…….56
5.3 ROW-RESOLVED, AVERAGED NUSSELT NUMBER……...…..……..…59
5.4 ENDWALL AND OVERALL HEAT TRANSFER ENHANCEMENT…....65
5.5 PRESSURE LOSS COEFFICIENT AND PERFORMANCE INDEX..........67
5.6 COMPUTATIONAL METHODOLOGY AND RESULTS……………..…..69
5.7 KEY FINDINGS……………...………………………………………………...76
6.0 FULLY BRIDGED TRIANGULAR, SEMI-CIRCULAR AND CIRCULAR
PIN-FIN ARRAYS………………………………………..……………….….…….78
6.1 NUMERICAL MODELING APPROACH...………………………….……...79
6.2 TEST SECTION ………………………………………………..……………...84
6.3 LOCAL HEAT TRANSFER COEFFICIENT DISTRIBUTION….….…….88
6.4 ROW-RESOLVED, AVERAGED NUSSELT NUMBER…….………..……94
6.5 HEAT TRANSFER ENHANCEMENT AND PRESSURE LOSS……….…98

viii
6.6 KEY FINDINGS…………………..…………………………………………..103
7.0 CONCLUSIONS AND FUTURE WORK.……………….…………...………...105
7.1 CONCLUSIONS AND MAJOR ACCOMPLISHMENTS……..………….105
7.2 FUTURE WORK…………………………………….………..……………....109
BIBLIOGRAPHY…...………………………………………………..……………………….110
ix
LIST OF TABLES
Table 1.1 Projected Coal-Gas Operating Parameters. ................................................................... 1
Table 2.1 Uncertainties of Measured Parameters ........................................................................ 30
Table 4.1 Test Cases for Pin-Fins (Baseline)............................................................................... 35
Table 5.1 Test Cases for Broken Rib and Full Rib with Pin-Fins. .............................................. 54
Table 6.1 Test Cases Test Cases for Triangular, Semi-Circular and Circular Pin-Fin Arrays ....85
x
LIST OF FIGURES
Figure 1.1 Internal Cooling Passage in Serpentine Form…………………..…………….…….....3
Figure 1.2 Schematic of Flow Field Around the Pin Confined Between Endwalls.………...…....5
Figure 1.3 Double-Wall Cooling with Pin-Fins - European Patent Specification …………….….8
Figure 1.4 Conceptual View of a Cooling Passages Size and Orientation ….…………..…...….13
Figure 1.5 Various Rib Configuration Used to Enhance Internal Heat Transfer………..….……14
Figure 2.1 Liquid Crystal Color Intensity vs. Temperature …………………………...…..….....23
Figure 2.2 Schematic of One-Dimensional Transient Heat Transfer Model………………….....24
Figure 3.1 Schematic Layout of Test Setup ……….………………………………………...…..32
Figure 4.1 (a) Inline and (b) Staggered Pin-Fin Array (Top View)……………………….….....36
Figure 4.2 Pin-Fin Configuration for All Staggered Arrays (Side View)………………….........36
Figure 4.3 Local Heat Transfer Coefficient, h, Distribution on Individual Pins and Endwall,
Re=25,000……………… …………………..…………………………………..…...39
Figure 4.4 Shear Stress (Pa) on Top and Bottom Endwall at Re=15,000……………………..…41
Figure 4.5 Heat Transfer Coefficient Distribution from Both CFD Prediction and Experimental
Results………………………………………………………………….…………….42
Figure 4.6 Schematic of Row in Pin-Fins Array ………………………………………………..43
Figure 4.7 Row-Resolved Average Nusselt Number (a) Staggered Array, and (b) Inline Array..44
Figure 4.8 Row-Resolved Average Nusselt Number for “Mixed” Pin-Fin Cases (a) Pin-Fin, and
(b) Endwall………...………………………..………………………………………...45
xi
Figure 4.9 Overall Heat Transfer Enhancement vs. Re……………………...……………….....48
Figure 4.10 Normalized Friction Factor vs. Re…….……..……………….………………....…49
Figure 4.11 Performance Index vs Re …………..….……….………………..……………….....51
Figure 5.1 Test Plate Design Model (Top View) with (a) Broken Ribs and Pin-Fins
(b) Full Ribs with Pin-Fins…………...…………………………………………...….55
Figure 5.2 Local Heat Transfer Coefficient, h (W/m2-K) Distribution for Endwall and Pins
(H/D=2) at Re=25,000…….……………………………….………………………...57
Figure 5.3 Local Heat Transfer Coefficient, h (W/m2-K) Distribution for Endwall and Pins
(H/D=3) at Re=25,000……….………………………………………….…………...58
Figure 5.4 Row-Resolved Average Nusselt Number for Endwall and Pin-Fins
(a) Baseline (b) Pin-Fins with Broken Ribs (c) Pin-Fins with Full Ribs.…..........….62
Figure 5.5 Row-Resolved Average Nusselt Number for Endwall and Pin-Fins
(a) Baseline (b) Pin-Fins with Broken Ribs (c) Pin-Fins with Full Ribs.……......….63
Figure 5.6 Row-Resolved Average Nusselt Number for Endwall and Pin-Fins with Full Ribs,
(a) Pin-Fins (H/D=2) (b) Pin-Fins (H/D=3) (c) Pin-Fins (H/D=4)…..….….……......64
Figure 5.7 Endwall Heat Transfer Enhancement vs Re ...…..…………….……….……......….65
Figure 5.8 Overall Heat Transfer Enhancement vs Re ……..…..…………….…….…….........66
Figure 5.9 Pressure Loss Coefficient vs Re …..…………………………………………..….....67
Figure 5.10 Performance Index vs Re………...………………………………………...…….....68
Figure 5.11 Flow Domain of the Computational Model…………………………………………71
Figure 5.12 Shear Stress (Pa) on the Top Endwall………………………………………………72
Figure 5.13 Turbulent Kinetic Energy on the Top Endwall……………………………………..73
Figure 5.14 Heat transfer Coefficient on the Top Endwall………………………………………75
Figure 6.1 Turbulent Kinetic Energy Distribution Surrounding the Pin-Fin Element…………..81
Figure 6.2 Pressure Distribution Surrounding the Pin-Fin Element…………………………….82
Figure 6.3 Heat Transfer Coefficient, h(W/m2-K) Distribution Surrounding the Pin-Fin
Element………………………………………………………………………...…....83

xii
Figure 6.4 Pin-Fin Element Geometry…………………………………………………………...85
Figure 6.5 Top View of Test Plate with Different Pin-Fin Configurations……………………...87
Figure 6.6 Local Heat Transfer Coefficient Distribution (TRI1)…………….…………………90
Figure 6.7 Local Heat Transfer Coefficient Distribution (TRI2)………………………….……91
Figure 6.8 Local Heat Transfer Coefficient Distribution (TRI3)……………….………………92
Figure 6.9 Local Heat Transfer Coefficient Distribution of Triangular, Semi-Circular and
Circular Shaped Pin-Fin Arrays………………………………………….…………..93
Figure 6.10 Row-Resolved Heat Transfer (Triangular Pin-Fins)……….…………….…………96
Figure 6.11 Row-Resolved Heat Transfer (Triangular, Semi-Circular and Circular Pin-Fins)…96
Figure 6.12 Row-Resolved Heat Transfer Enhancement for Triangular Pin-Fin Arrays ……….97
Figure 6.13 Row-Resolved Heat Transfer Enhancement for Triangular, Semi-Circular
and Circular Pin-Fin Arrays……………………………………………………….. 97
Figure 6.14 Endwall Heat Transfer Enhancement vs Re………………………………………...99
Figure 6.15 Total Heat Transfer Enhancement vs Re…………………………………………..100
Figure 6.16 Pressure Loss vs. Re………..……………………...………………………………100
Figure 6.17 Performance Index vs. Re………………………………………………………….102

xiii
NOMENCLATURE
Roman Letters
A Area
C Detached spacing between pin-tip and endwall
D Pin diameter, 6.35mm
Dh Duct hydraulic diameter
E Channel height
f Friction factor, (ΔP/ρU2)(Dh/L)
H Pin height
h Heat transfer coefficient
k Thermal conductivity
L Channel length
Nu Nusselt number
P Pressure
Pr Prandtl number
rh Rib height
rw Rib width
Re Reynolds number, UDh/ν
S Inter-pin spacing in longitudinal direction

xiv
T Temperature
Tr Reference temperature
U Bulk mean air velocity in a channel
X Inter-pin spacing in transverse direction
y+
Non-dimensional distance from the wall
Greek Letters
Thermal diffusivity
β Non-dimensional time, β=h(t/ρcpk)1/2
θ Non-dimensional wall temperature, θ=(Tw-Ti)/(T∞-Ti)
Dynamic viscosity
Density
Time
ν Viscosity
Subscript
o Smooth channel
p Pin
r Row
T Total or entire array
w Endwall

xv
Superscript
o Degree
Abbreviations
TLC Thermo-chromic liquid crystal

xvi
ACKNOWLEDGEMENTS
Many people provided assistance during this endeavor. First, I want to acknowledge my
advisor, Dr. Minking K. Chyu, for his continuous technical and financial support,
encouragement, and patience guidance throughout my dissertation work.
I also like to thank Dr. Gerald H. Meier, Dr. Laura Schaefer, and Dr. Mark Kimber, for
giving their precious time on the advisory committee. The work done by the staff of the
machine shop in the school of engineering was invaluable during construction of the test facility
and several test sections in this research effort. My thanks are also extended to the faculty and
staff members in the Department of Mechanical Engineering and Materials Science Department.
Special thanks go to my colleague in the heat transfer group, Pavin Ganmol for his
support, help, and inspiration. Thank you for your time and effort.
Finally, I wish to express my gratitude to my wife, Lee Ping Ng, and parents for their
continuous support and love throughout this journey.
This research is sponsored by the Department of Energy, National Energy Technology
Laboratory under the RDS contract DE-FE-0004000. The author wishes to thank Mr. Rich
Dennis and Ms. Mary Anne Alvin for their continued support towards this research effort.

1
H2O (75-90)
CO2 (25-10)
O2, N2, Ar (1.7)
H2O (17.3)
CO2 (1.4)
N2 (72.2)
Ar (0.9)
O2 (8.2)
H2O (8.5)
CO2 (9.27)
N2 (72.8)
Ar (0.8)
O2 (8.6)
Turbine Flow
Composition, %
~1500 (HPT)
~625 (IPT)~300~265
Turbine Inlet
Pressure, psig
~595
(~1100)
~595
(~1100)
Turbine
Exhaust
Temperature,
C (F)
~1760 (~3200) (IPT)
~760 (~1400) (HPT)
~1425
(~2600)
~1370
(~2500)
Turbine Inlet
Temperature,
C (F)
~1480
(~2700)
~1480
(~2700)
Combustor
Exhaust
Temperature,
C (F)
Oxy-Fuel
Turbine
2015
Hydrogen
Turbine
2015
Syngas
Turbine
2010
PROJECTED ADVANCED TURBINE
OPERATING CONDITIONS
1.0 INTRODUCTION
1.1 BACKGROUND
Gas turbines are highly effective engineered prime movers for converting energy from thermal
form (combustion stage) to mechanical form – are widely used for propulsion and power
generation systems. Although the science and technology in gas turbines has improved
tremendously over the decades, besides rising fuel prices, the demands on higher efficiency,
lower emissions and longer service life has continued to challenge the limit of current knowledge
Table 1.1 Projected Coal-Gas Turbine Operating Parameters

2
and capabilities. The overall efficiency and service life of a gas turbine is strongly depends on
the turbine components, which are exposed to high-pressure and high temperature gas exited
from the combustor that may be as high as about 2000oC (stoichiometric combustion) [1].
Table 1.1 summarizes the key operating parameters of future coal-gas turbines required
to meet the performance goal mandated by the US fossil energy policy [2]. Evident in Table 1 is
that thermal load induced by TIT alone will lead to immense challenges in maintaining the
material integrity of turbine components. This is more critical for the intermediate pressure
turbine (IPT) of the oxyfuel system, which the TIT reaches over 1750oC. Table 1 also shows the
turbine working fluid composition and turbine inlet pressure for various coal-gas turbine
systems. In addition, the oxyfuel turbine which comprises of significant amount of superheated
steam is substantially different from a conventional gas turbine with air/nitrogen enriched
stream. Compared with air, steam has rather different properties and is considerably more
corrosive. Realizing these higher firing temperatures associated with various working fluids and
requirements in carbon dioxide sequestration, this creates new challenges in protecting turbine
hot sections.
There are three major approaches in the research and development efforts for confronting
the thermal challenges in gas turbines: (1) develop high temperature substrate materials, (2)
improvement in thermal barrier coatings (TBCs), and (3) advances in cooling technology. The
main focus of this study is directed to the internal cooling of the airfoil. Gas turbine cooling
technology is complex and can be categorized into two different approaches: internal and
external cooling. For internal cooling, coolant extracted from the compressor is forced into and
directed through the cooling flow circuits embedded inside the turbine components. External
cooling, on the other hand, ejected coolant out through discrete holes or slots to provide a coolant

3
film over the exposed component surfaces from the hot combustion gases. Bunker [3] stressed
that active cooling technology that involves uniformity of internal cooling, ultimate discrete hole
film cooling and micro-cooling remains as one of the thermal challenges in the gas turbine
community. Greater degree of uniformity in internal cooling can overcome most thermal stress-
strain limitation allowed by turbine airfoils to withstand higher bulk temperatures.
Figure 1.1 Internal Cooling Passages in Serpentine Form
Figure 1.1 shows the schematic view of a typical cooling method for the main body of an
airfoil using internal convection supplied by serpentine passages. Apart from internal cooling,
portion of the coolant is used for external cooling as effective thermal protection from the
external flow, particularly for the first stage airfoils of the turbine. Han et al. [4] describes many
cooling techniques that are commonly used in various combinations to increase the lifetime of
the turbine airfoils. However, excessive use of coolant will reduce the gain of the higher inlet

4
temperature due to consumption of compressed air and the mixing between the hot combustion
gases and coolant reducing the overall thermal efficiency of the entire system. Thus, extensive
research has been conducted to explore and find better internal cooling configurations that can
provide more protection with less coolant.
1.2 LITERATURE REVIEW ON TURBINE BLADE INTERNAL COOLING
The internal cooling passages are mostly modeled as short, square or rectangular channels with
various aspect ratios. The heat transfer augmentation in rectangular passages primarily depends
on the geometry of the vortex generators (i.e. size, shape, distribution), flow attach angle and
flow Reynolds number.
Turbulence promoters are introduced in the internal cooling passages for heat transfer
enhancements. The most common turbulence promoters are so-called the rib-turbulators, that
typically oriented at certain angle transverse to the flow direction and formed as an integral part
of the airfoil inner wall. The majority of work related to the rib-turbulators in the past decades
was documented by Han et al. [4]. Rib-turbulators that have two-dimensional structures are
mainly used in the serpentine passages to cool the main body of an airfoil. Typically, rib height
is about 5-10% of the entire cooling passage, a rib spacing-to-height ratio varying from 5 to 15,
and a rib flow attack angle around 30˚-60˚ [5]. In general, smaller rib height is more efficient for
higher Reynolds number flows, and the heat transfer enhancement decreases, but pressure drop
penalty increases with Reynolds number.

5
More complex three-dimensional structures like the pin-fins, delta wing, cubic and
diamond elements are also being considered and explored as turbulence promoter candidates in
the turbine airfoil cooling passages. These three dimensional structures protrude from the heat
transfer surface to the coolant flow path promoting wake shedding that increases the overall free-
stream turbulence. The overall effective heat transfer is by no means increases as well. These
combined effects explain that the three-dimensional structures perform better as compared to the
rib-turbulators. For any pin-fin array, besides this wake shedding, a horseshoe vortex originates
just upstream of the base of the pin and wraps around the pin, causing more flow disturbances.
However, such complicated structures are always accompanied with greater pressure drop in the
channel.
Figure 1.2 Schematic of Flow Field Around the Pin Confined Between Endwalls
Figure 1.2 illustrates the key features of cross-flow around a cylinder with the presence of
endwalls. There exists a nearly stagnant region in the frontal part of the pin where the horseshoe

6
vortices which is one of the major components of heat transfer augmentation are formed. Such
behavior was reported in some early studies conducted by Chyu and Natarajan [6] and Goldstein
et al. [7] based on heat transfer analysis with a single pin. Ames et al. [8] performed spatially
resolved heat transfer measurements and reported that the local heat transfer enhancement was
due to the local freestream turbulence as well as local secondary flows, i.e., the horseshoe vortex.
Recent experimental studies by Ostanek and Thole [9] in exploring the flow field of single row
of pin-fins suggested that as the Reynolds number increases, the intensity Kármán vortices
surrounding the pin-fin tend to increase and stay closer to the pin-fin. Their experimental results
also show that the high heat transfer in the pin-fin array is mainly driven by the Kármán vortices
that efficiently entrained core fluid and transported into the wake where turbulent mixing
allowed effective heat transfer to occur.
Previous studies in pin-fin array heat transfer have been focused on the effects of array
geometry and shape of the pin element [10-26]. Amstrong and Winstanley conducted a review of
pin-fin heat transfer and compiled the data of staggered arrays up to 1987 [10]. For short pins
(i.e. H/D<1.0), the endwalls compose of significant portion of the heat transfer surface, the pin
heat transfer is dominated by the endwall interactions. Under such circumstances, the scale of
turbulent vortices can be expected to be the order of the pin diameter, which is the order as the
channel height. The flow will be well mixed with no separation of wall and pin effects. For the
cases with longer pin-fins, a significant gain is that the pins will comprise of greater effective
heat transfer area as compared to the endwall. However, this has reduced the dominating effect
of endwall-pin interactions at the center of the channel. This is consistent with the findings
reported by Sparrow et al. [22], where a cylinder is affected by the endwall on the order of one
diameter away from the wall.
7
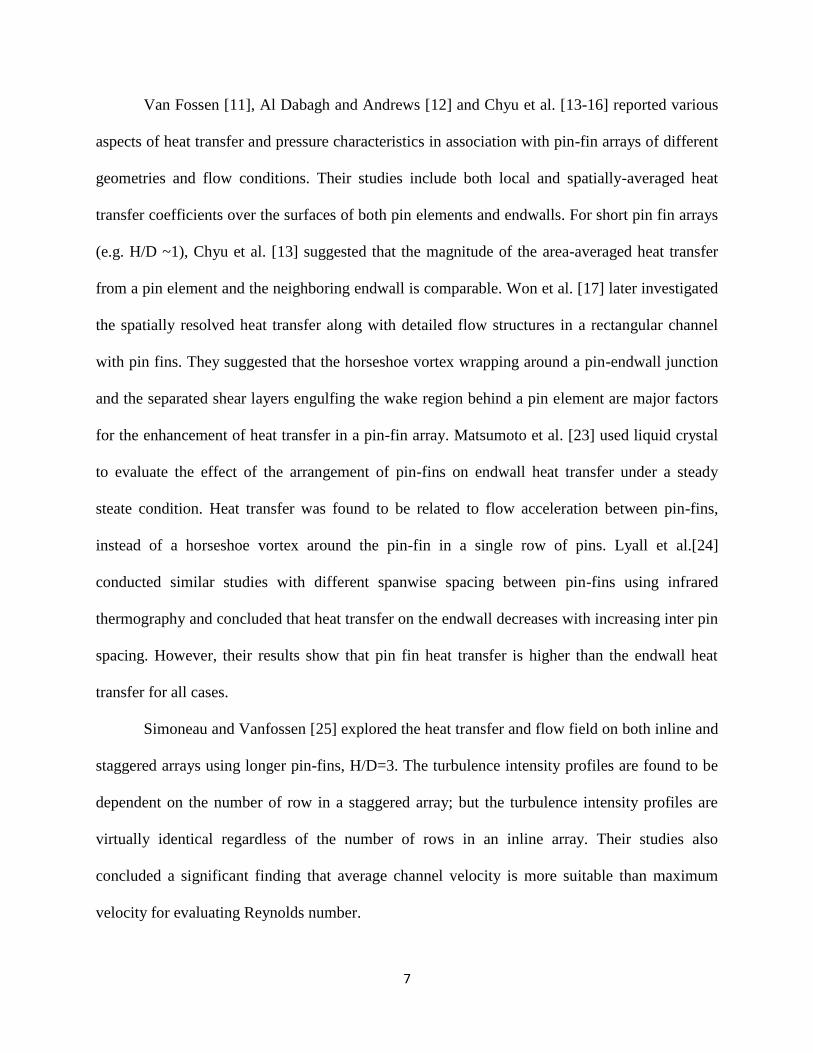
Van Fossen [11], Al Dabagh and Andrews [12] and Chyu et al. [13-16] reported various
aspects of heat transfer and pressure characteristics in association with pin-fin arrays of different
geometries and flow conditions. Their studies include both local and spatially-averaged heat
transfer coefficients over the surfaces of both pin elements and endwalls. For short pin fin arrays
(e.g. H/D ~1), Chyu et al. [13] suggested that the magnitude of the area-averaged heat transfer
from a pin element and the neighboring endwall is comparable. Won et al. [17] later investigated
the spatially resolved heat transfer along with detailed flow structures in a rectangular channel
with pin fins. They suggested that the horseshoe vortex wrapping around a pin-endwall junction
and the separated shear layers engulfing the wake region behind a pin element are major factors
for the enhancement of heat transfer in a pin-fin array. Matsumoto et al. [23] used liquid crystal
to evaluate the effect of the arrangement of pin-fins on endwall heat transfer under a steady
steate condition. Heat transfer was found to be related to flow acceleration between pin-fins,
instead of a horseshoe vortex around the pin-fin in a single row of pins. Lyall et al.[24]
conducted similar studies with different spanwise spacing between pin-fins using infrared
thermography and concluded that heat transfer on the endwall decreases with increasing inter pin
spacing. However, their results show that pin fin heat transfer is higher than the endwall heat
transfer for all cases.
Simoneau and Vanfossen [25] explored the heat transfer and flow field on both inline and
staggered arrays using longer pin-fins, H/D=3. The turbulence intensity profiles are found to be
dependent on the number of row in a staggered array; but the turbulence intensity profiles are
virtually identical regardless of the number of rows in an inline array. Their studies also
concluded a significant finding that average channel velocity is more suitable than maximum
velocity for evaluating Reynolds number.

8
Coolant inlet
Coolant outlet
Using a hybrid measurement technique similar to that used in the present study, Chyu et
al. [14] investigated the effects of pin height-to-diameter ratio on the heat transfer from both pin-
fin surfaces and endwalls and reported that the increase in pin height leads to a higher overall
heat transfer, but with a greater pressure loss. Park et al. [18] recently performed similar
experiments using the naphthalene-sublimation technique to examine the rotation effects on heat
transfer at the endwall. The overall averaged results show similar patterns to those from Chyu et
al. [12], but rotation induces notable difference in heat/mass transfer partition between the two
Figure 1.3 Double-Wall Cooling with Pin-Fins - European Patent Specification,
EP 1 617 043 B1, 2008 [27]
9
endwalls. Uzol and Camci [26] investigated the endwall heat transfer and total pressure drop
within various arrays of pin-fin using similar the technique as Chyu et al. [14] with circular pins
and two-elliptical pin-fin arrays. The heat transfer in the wake of circular pins is about 25%
higher than that of the elliptical arrays. However, the elliptical pin-fin array is viewed as a more
desirable configuration due to lower pressure drop as compared the circular pin-fin array.
While pin-fins are used to cool the trailing edge section of a turbine airfoil, they often
serve as part of the mechanical structure to bridge the pressure-surface and suction-surface in a
rather thin region. As a result, all pin elements are attached directly to the endwalls and are often
referred to as “pedestals”. However, this may not necessarily be the case for the cooling of the
main body section of an airfoil. Recent developments of the so-called “double-wall,” “micro-
circuit,” or “skin” cooling for the main-body could utilize pin-fins of H/D ratio higher than one
installed in a channel directly beneath the airfoil surface [27-28]. Figure 3 revealed a typical
double wall cooling structure, which is a European patent filed in 2008 and very different from
the conventional serpentine passages as presented in the previous section [27]. These
approaches, when used in the main body section of an airfoil, can have more flexibility for
design innovation to further improve the level of heat transfer enhancement than the pedestal
cooling near the trailing edge.
In addition, heat removal in this case is expected to be more effective compared to the
typical serpentine arrangement, as the coolant is positioned closer to airfoil’s outer wall. Most
recent simulation study by Siw et al. [29] revealed that double-walled cooling significantly
reduces the overall metal temperature of the airfoil by 50 – 100oC as compared to conventional
airfoils with serpentine cooling passages. Such a great temperature reduction is desirable as,

10
generally in practice, a nominal 10oC lower turbine operation typically prolongs the components’
lives by two folds.
Recently, Ganmol et al. [30] has adopted this patent into one of their experimental
studies using hybrid measurement technique as describe by Chyu et al. [14]. Detailed heat
transfer coefficient results show that impingement jet inlet can enhance heat transfer by 3 to 5
folds over the typical flow through a staggered pin fin array in a straight channel. The results
suggest that, due to the impingement effects, the 90-degree jet inlet also creates stronger
turbulent flow downstream than that with a typical through-flow conditions that explains greater
heat transfer enhancement. On the other hand, such configuration suffers larger pressure drop as
compared to conventional serpentine cooling passages with staggered pin-fins array.
In the present study, the primary notion of having pin-fins partially detached from the
endwall is to promote turbulence and associated transport in a cooling channel, thus enhance
heat transfer and overall cooling effectiveness. Meanwhile, the extent of the pressure loss can be
alleviated. To the author’s knowledge, so far in the open literature reveals that the effects of a
clearance or gap between the pin-tip and endwall, C, has been studied very little.
Virtually all the previous studies pertaining to pin tip-clearance effects were directed to
examining the heat transfer over the uncovered portion of the endwall. The experimental study
by Steuber and Metzger [31], who used wooden pins of partial lengths attached directly to a
heated endwall, is probably one of the earliest studies of this kind. The pins are thus heat
transfer inactive. The tallest, full-length pins have the pin-height equal to the pin diameter, i.e.
H/D=1, so the remaining cases with a pin-tip and endwall clearance are of H/D<1. Their results
suggested that pin-fin arrays of partial length pins consistently lead to lower heat transfer and
reduced pressure loss. Arora and Abdel-Messeh [32] later performed a similar study using a wide

11
aspect ratio channel. They concluded that the average heat transfer rate decreases linearly with
an increasing value of C/D. Chang et al. [19] recently measured the heat transfer from the
endwall with C/D ranging from 0 to ¾. For the partial pin-fins cases, only one side of the
endwall is mounted with pin-fins, while the opposite side is a smooth surface. Their pins are
made of Teflon, thus are heat transfer inactive also. They reported that an increase in the tip
clearance changes the nature of horseshoe vortices as well as the wakes and the separated shear
layer downstream to a pin, which collectively reduces the endwall heat transfer and overall
pressure loss. However, if the performance index, which is a measure of heat transfer
enhancement per unit pressure drop, is concerned, the case of C/D= ¼ emerges as the optimal
case, with the value of performance index even higher than that of the corresponding full-length
pin-fin array. Similar studies on the tip-clearance effects for square pins (prisms) relevant to the
cooling of electronic components and wind engineering have also been performed [20,21].
Contrary to the circular pin-fin studies aforementioned, the square pins are heated whereas the
endwall is kept generally adiabatic. Dogrouz et al. [21] experimentally investigated the effects
of detached clearance for square prisms with a range 1 < C/D < 8 and reported that the value of
C/D renders little effect on heat transfer provided that the clearance is sufficiently large. On the
other hand, a progressive reduction in pressure drops prevails over the entire range of C/D
variation.
There are some other pin-fin elements with more streamlined geometry that have been
explored as an alternative to circular pin-fins. When streamlined pin-fins are aligned with the
flow, heat transfer and pressure drop are expectedly reduced for oblong [33] and for ellipse [34]
shaped pin-fins. Uzol and Camci conducted detailed flow field measurements using bluff and
streamlined bodies and showed main differences in terms of delayed boundary layer separation,

12
reduction of turbulence kinetic energy, and narrower wake region [34]. For streamlined pin-fins,
the heat transfer was concentrated directly behind the pin-fins; while, the heat transfer of circular
pin-fin was more uniformly distributed in the transverse direction.
Chyu et al. [35] used mass sublimation technique to explore the heat transfer
characteristics of cubic and diamond shaped pin-fin arrays. Their results revealed that the general
trend of mass transfer enhancement does not change by changing the shape of the pins. There is
an initial increase in mass-transfer coefficient with increasing row number and then the mass
transfer coefficient subsides towards a fully developed value. In addition, the results concluded
that the cubic shaped pin-fin array has the highest mass transfer compared to diamond and
circular pin-fin arrays; circular pin-fin array has the lowest enhancement. However, the circular
pin arrays provide the lowest pressure loss among the three arrays.
In most turbine airfoil applications, pin height may vary from 1 to several diameter in
length, 1<H/D<5, which is different than that of compact heat exchangers with H/D that
exceeded 4. Armstrong and Winstanley [10] claimed that interpolating between these two cases
does not solve the turbine application problem where H/D values are on the order of one. Arora
and Abdel-Messeh [32] claims differently, where averaged Nusselt number for the pin-fin arrays
with varying gaps can be interpolated from the fully bridged pin-fins case and the smooth
channel results.

13
1.3 LITERATURE ON RIB-TURBULATED INTERNAL COOLING PASSAGES
Rib-turbulators are often cast on both walls of the internal cooling passages that are mostly
modeled as square or rectangular channels with various aspect ratios. It is common to have
rectangular cooling passages with different aspect ratios along the entire airfoil as shown in Fig.
1.4. Cooling enhancements induced by the ribs are fairly straightforward for stationary airfoils
which is due to the additional secondary flow from the ribs, but become much more complicated
in rotating blade channels due to the effects of rotation, coolant velocity, and buoyancy which
may result in strong secondary flows and even local flow reversal [37,38]. There are vast
literatures available about rib-turbulators studies conducted in both rotating and non-rotating
Figure 1.4 Conceptual View of a Cooling Passages Size and Orientation [36]

14
Figure 1.5 Various Rib Configurations Used to Enhance Internal Heat Transfer [38]
channels that involve different combinations of rib height, rib angle, rib spacing, rib shape, and
inline or staggered rib configurations.
Han et al. [4] compiled most of the findings related to rib-turbulators until the year 2000.
Figure 1.5 shows several rib configurations that have been studied by different groups of
researchers [39]. In general, smaller rib height is more efficient for higher Reynolds number
flows, and the heat transfer enhancement decreases but pressure penalty increases with the
Reynolds number. However, in some highly demanding cooling designs, larger rib height-to-
channel hydraulic diameter ratio can be used to generate higher heat transfer enhancement
provided pressure penalty is not a main concern.

15
Earlier studies by Han et al. [40] using some of the rib configurations as shown in Fig.
1.5 suggested that both 45o parallel rib and 45
o V-shaped rib have similar performance and better
than those of 45o crossed rib, inverted V rib and 90
o rib. Later studies by Han et al. [41] further
concluded that V-shaped broken ribs are better than the corresponding 60o and 45
o parallel
continuous ribs. Lee at al. [36] investigated the heat transfer in a single rectangular channel with
V-shaped and angled rib-turbulators with and without gaps, including the effect of channel
orientation with respect to the axis of rotation. Under both stationary and rotating conditions, the
results revealed that V-shaped rib configurations produces more heat transfer enhancement than
the angled rib configurations.
Han and Park [42] studied the combined effects of rib angle and channel aspect ratio in
rib roughened rectangular channels and found that the heat transfer in the square channel with
angled ribs is about 30% greater than that of the transverse rib case. Based on the experimental
studies by Park et al. [43] with five channels of different aspect ratio, and varying rib angles
between 30o and 90
o, their results concluded that wide aspect ratio channel with rib angles of
45o/30
o gives the best heat transfer enhancement. Besides rib configurations, rib spacing and
height in the internal cooling passages are important that has certain impact towards the heat
transfer behavior. Pacing too many ribs on the heat transfer surface could result in an increase in
pressure drop. Insufficient of ribs will result in minimal heat transfer due to minimal breaking of
boundary later. Taslim and Spring [44] used a liquid crystal technique to investigate the effects
of rib profile, rib spacing, and blockage ratios on heat transfer and friction. From their
experiments, they found out that there is an optimum pitch distance between ribs for any given
blockage ratio.

16
Wright et al. [45] conducted experimental works with high aspect ratio channels that
involves rotational effects reported that the discrete W-shaped and discrete V-shaped ribs proved
to have the greatest overall performance while the more standard angled ribs performed the
worst. Recently, Rallabandi et al. [46, 47] conducted systematic experimental studies to explore
the heat transfer and pressure losses in a stationary channel with square/sharp edged ribs at a
wide range of Reynolds number ranging from 30,000 to 400,000. Their studies also included
round edged ribs to take into account of manufacturing effects. The heat transfer performance are
comparable between the round ribs and sharp ribs, but round rib post a better advantage with
slightly lower pressure drop due to less friction. Recent extended study by Alkhamis et al. [48]
using 45-deg V-shaped ribs concluded that V-shaped ribs has higher heat transfer performance
with insignificant pressure loss than that of angled ribs.
The blockage ratio, rh/Dh (defined as rib height-to-hydraulic diameter) has a mild effect
on heat transfer performance, for a given rib spacing. This is mainly attributed to larger
separation and reattachment zone caused by taller ribs compared to shorter ribs. Ultimately, this
results in a higher turbulence in the flow-field. Also, on decreasing the rib spacing, the heat
transfer enhancement is observed to increase the area available for heat transfer increases due to
the larger number of ribs in the channel. The large number of ribs also induces greater secondary
flow [42, 44, 46, 47].
For a rib-turbulated channel, as the heat transfer coefficient increases with Reynolds
number, it is found that the Nusselt number normalized by the fully developed smooth channel
based on the Dittus-Boelter correlation decreases with increasing Reynolds number. On the other
hand, the normalized friction factor encountered by the rib-turbulated channels tends to increase
with Reynolds number [37-40, 46-49].
17
One of the earliest successful prediction models for the average heat transfer coefficient
and friction factor in channels with two opposite rib-roughened walls was formulated by Han
[50]. More recently, Chandra et al. [51] extended the past predictions to the cases of varying
number of ribbed walls in a square channel. However, Rau et al. [52] pointed out that the valid
range for the application of Han’s formula was actually limited to rh/Dh<0.0625.
Due to certain manufacturing limitations, the actual ribs in the internal cooling passages
will not have sharp angle at the edges, but rounded corners. Lockett and Collins [53] investigated
the heat transfer distribution and associated hot spot around square and rounded rib geometries.
As the rounded rib has more streamlined shape, this has resulted in a sharp decrease of heat
transfer at the rear of the square rib. Han et al. [54] conducted a similar study and concluded that
the square and rounded rib has no effects towards the heat transfer characteristics at higher
Reynolds number where the flow is in the completely rough regime. Chandra et al. [55]
investigated the effect of rib shape on the heat transfer and pressure loss in the square channel.
They concluded that for a given friction factor, heat transfer performance is comparable among
the tested rib geometries (triangular, slant-edged ribs, circular and semi-circular ribs) except that
the square rib, which exhibits the highest heat transfer enhancement. The latest findings of rib-
turbulated channel with various rib geometries were reported by Ahn [56]. Contrary to the
previous works, he suggested that the triangular-shaped rib has the highest heat transfer
performance. More recent experimental studies by Wang and Sunden [57] based on a square
channel with various-shaped ribs (square, equilateral-triangular, trapezoidal with decreasing
height, trapezoidal with increasing height) show disagreement with the conclusions reported by
Ahn [55]. Wang and Sunden found that the trapezoidal-shaped rib with decreasing height in the

18
flow direction has the highest heat transfer performance while having the shortest reattachment
length among all cases.
Han et al. [49] extended his experimental studies using three-dimensional structures, so-
called the wedge-shaped and delta-shaped ribs. The delta-shaped ribs stand out as the best
performer, with 3 to 4 times heat transfer enhancement over smooth channel; pressure drop was
7 to 9 times higher. Recent experimental studies by Ganmol [58] using cubic, diamond and delta-
shaped elements in a two-pass stationary channel showed that the heat transfer in the first pass is
enhance up to 3 folds as compared to the smooth channel.
The earlier computational studies on internal cooling passages with ribs have mostly been
restricted to two-dimensional flows. In recent years, a number of researchers have reported three-
dimensional studies. Using a low-Reynolds k-ω turbulence model, Stephens et al. [59] and Rigby
et al. [60] presented the numerical simulations for flow and heat transfer in a nonrotating straight
duct with normal 90-deg ribs. Stephens et al. [61] investigated the flow and heat transfer
characteristics with angled, rounded ribs on two opposite endwalls and provided important
characteristics on the angled rib ducts. Stephens and Shih [62] and Shih et al [63] explored the
effect of angled ribs on the heat transfer coefficients in a rotating two-passage duct using low-Re
k-ω turbulence model to study the effects of Reynolds numbers, rotation numbers, and buoyancy
parameters. Their research findings compared to Johnson et al. [64] revealed that the heat
transfer coefficient was under-predicted for the stationary case.
The second moment closure model used by Chen et al.[65] has been applied to internal
cooling channels with a wide range of rib-turbulator configurations and channel aspect ratios.
Using the same model, Jang et al. [66] reported that their simulation results of predicted heat

19
transfer coefficient in channels with 45o and 60
o ribs is in agreement with the experimental data.
Heat transfer coefficient prediction was well matched with Johnson et al.[64] data for both
stationary and rotating case. Prakash and Zerkle [67], employing a high Reynolds number k-e
turbulence model with wall function, conducted a simulation study to predict the flow and heat
transfer in a rib-turbulated rectangular duct with and without rotation. They concluded that a low
Reynolds number model is necessary to simulate real gas turbine conditions and a Reynolds
stress model is required to capture anisotropic effects.
Su et al. [68] conducted a complementary study to numerically predict the heat transfer
characteristics in the cooling passages with aspect ratios varying from 1:4 to 4:1 which also
includes the rotating effect. They reported that in the under engine-like condition with high
rotation and high Reynolds number, the effect of rotation decreases with the channel’s aspect
ratio. Recently, Kamali and Binesh [69] performed numerical calculations to study the heat
transfer and friction factor of four different rib shapes, i.e., square, triangular, trapezoidal with
varying height in the flow direction. Their findings revealed that the inter-rib spacing and rib
shape have profound effects towards the heat transfer distribution in the channel. In addition,
their simulation results and an experimental work by Wang and Sunden [57] showed that the
trapezoidal shaped rib has the highest heat transfer performance among all rib geometries, which
is not in agreement with the conclusion by Ahn [56]. The abovementioned numerical studies
concluded that accurate near-wall modeling turbulence transport is crucial to ensure good
prediction of flow field and heat transfer characteristics on the endwall.
20
1.4 PRESENT STUDY STATEMENT
There are significant level of studies that have been focused on either surface enhancement, such
as vortex generators/turbulators, or turn effects, in exploring the characteristics of both heat
transfer and pressure loss in the respective cooling passages. Depending on differences in design
and flow conditions, typical rib-turbulators can promote an approximately 2.0 to 3.5 fold heat
transfer enhancement, with a 6 to 10 times pressure loss, as compared to their smooth wall
counterparts [1]. The turbine community and OEMs (original equipment manufacturers), i.e.
Siemens, General Electric, Rolls Royce and etc. are striving to improve the heat transfer
enhancement factor in order to reduce the coolant consumption on external cooling. This will
eventually improve the overall efficiency of the entire turbine system.
Pin-fins as three-dimensional vortex generators for heat transfer augmentation rather than
the two-dimensional rib-turbulators in the older designs have been selected as the main focus in
this study. The objective of this study is to investigate the effects of detached pin-fins and pin-fin
arrays on heat transfer. With a given pin diameter, D=6.35 mm= ¼E, three different pin-fin
height-to-diameter ratios, H/D = 4, 3, and 2, were examined. Each of these three cases
corresponds to a specific pin array geometry of detachment spacing (C) between the pin-tip and
one of the endwalls, i.e. C/D = 0, 1, 2, respectively. Heat transfer characteristics of both endwalls
and pin-fins are explored, analyzed and then compared among different configurations and
previous studies. Virtually, there is no study in the open literature that has been directed to the
detached pin-fins effect in the internal channel.
To the author’s knowledge, there is no reported information about the details heat transfer
and pressure drop measurement of the combination effects of the detached pin spacing and ribs.
21
The above literature reviews concluded that V-shaped produce overall better heat transfer
enhancement than the angled ribs. In this study, two newly proposed ribs design: broken ribs and
full ribs, will be investigate together with the effects of detached pin spacing on heat transfer and
pressure drop.
In the later part of this study, novel three-dimensional pin-fin elements, i.e., triangular
and semi-circular shaped are explored and compared to the circular pin-fin array that served as
baseline case. Heat transfer enhancement of the typical circular pin-fin array is mainly attributed
to the horseshoe vortices, while the wakes and separation shear layers generated by the sharp
edges in the cubic pin-fins are the main source of heat transfer enhancement in the array. This
heat transfer enhancement mechanism is mainly attributed to the leading region (approximately
50% of the cross-sectional area) of both circular and cubic pin-fin as the flow tends to separate
after passing the leading region. Based on this notion, heat transfer performance of the semi-
circular and triangular pin-fin arrays, which consists of half circular and half cubic is explored.
All pin-fins in each array are fully bridged between the top and bottom endwalls. There are three
triangular pin-fin arrays with different inter pin spacing in both longitudinal and transverse
direction in order to determine the ideal configuration for the triangular pin-fin array.
In addition, cursory numerical studies using commercial available software, ANSYS
CFX will be conducted to explore the flow field pressure distribution of certain cases in this
study to provide better insights and understanding of the flow and heat transfer characteristics in
the test domain. All experimental studies will be conducted using a well-established transient
thermochromic liquid crystal (TLC) technique.

22
2.0 TRANSIENT THERMOCHROMIC LIQUID CRYSTAL TECHNIQUE AND
DATA ANALYSIS
2.1 INTRODUCTION
Thermochromic liquid crystal (TLC) can be used as a precise indicator of surface temperature,
providing the relation between its reflected light and surface temperature is known. The color of
the TLC is transparent; more precisely, it does not reflect visible light when its temperature is not
within the prescribed temperature range. The temperature at which the visible color can be
viewed is obtainable depending upon the melting point of the liquid crystal. Due to this
important criterion, TLC can be customized up to about 150oC with color ranges of 1
oC to 50
oC
[68]. The TLC used in this study is customized to start displaying color at 38oC. TLC reflects
light from the long wavelengths to short wavelengths on heating. The first color shown is
comprised of mainly a red component. As heating proceeds, the color passes through a visible
color spectrum from red, to yellow, to green, ultimately reaches blue. The temperature
bandwidth for the color displayed is customized to 5oC. The color property of the TLC applied in
this study is shown in Fig. 2.1. The capability for temperature indication utilizes thermochromic
liquid crystal application for heat transfer measurement.

23
38.2
Inte
nsi
ty R
G
B
Temperature ( C)
There are a few advantages of the TLC heat transfer measurement technique over other
heat transfer measurement techniques. One of the most appealing advantages of the TLC method
is that it provides detailed local heat transfer information and temperature distribution of the
entire test domain as compared to the conventional method employing intrusive instrumentation,
such as thermocouples, to measure the temperature that only provide information on discrete
Figure 2.1 Liquid Crystal Color Intensity vs. Temperature
points. Therefore, the TLC method has proven to be one of the viable approaches in studying
complicated heat transfer designs that have highly spatial variation in flow and heat transfer
patterns, such as the internal cooling passages on turbine airfoil.
24
liquid crystal Tw()
channel wallz
q
T=T(z,)
hot air
Methods of employing the TLC to attain heat transfer measurement can be divided into
two categories based on the testing procedure: steady state and transient method. Transient TLC
technique is used in this study and the details are described in the following section.
2.2 TRANSIENT THERMOCHROMIC LIQUID CRYSTAL TECHNIQUE
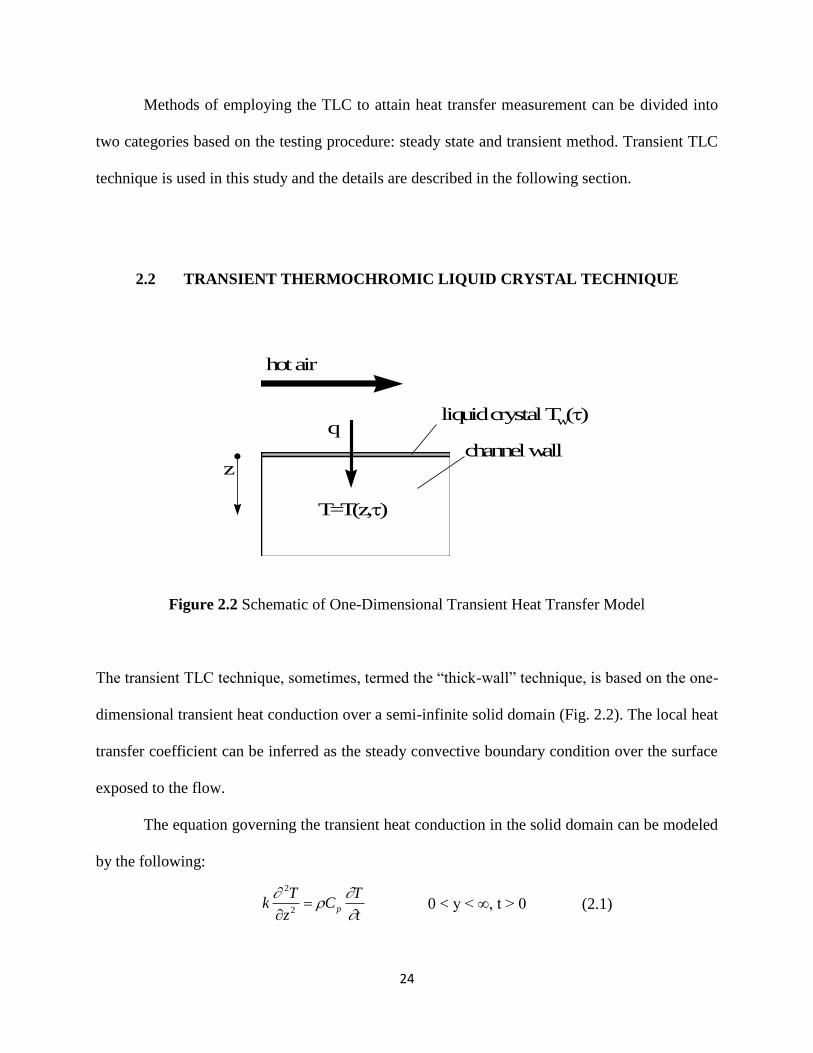
Figure 2.2 Schematic of One-Dimensional Transient Heat Transfer Model
The transient TLC technique, sometimes, termed the “thick-wall” technique, is based on the one-
dimensional transient heat conduction over a semi-infinite solid domain (Fig. 2.2). The local heat
transfer coefficient can be inferred as the steady convective boundary condition over the surface
exposed to the flow.
The equation governing the transient heat conduction in the solid domain can be modeled
by the following:
(2.1) t
TC
z
Tk p
2
2
0 < y < ∞, t > 0
25
The associated boundary and initial conditions are
where Ti is the initial temperature of the test section, Tw is the local surface temperature, and Tr
is the flow reference temperature. Equations (2.1)-(2.4) lead to a solution of Tw expressed as
In a typical heat convection system, the reference temperature Tr is readily available, i.e. equal to
the temperature of the mainstream or bulk flow and the material properties of the solid are
known or determined experimentally. As the time-varying liquid crystal images can provide a
relation between Tw and t over the entire viewing domain, the distribution of local heat transfer
coefficient, h, can be resolved from the above equation.
True step changes of the applied flow temperatures are usually not possible in reality, and
the reference temperature, Tr, in fact, is a function of time. This can be accounted for by
modifying the solutions via superposition and Duhamel's theorem. The solution becomes:
N
1i
riiw T)t(UTT (2.6)
where
)(
k
herfc)(
k
hexp1)(U ii2
2
i (2.7)
Two important assumptions are made in this analysis. First, heat transfer in the lateral
direction is negligible as compared to the z-direction as shown in Fig. 2.2 This is assured by
)(0
rw
z
TThz
Tk
(2.2)
(2.5)
k
therfc
k
th
iT
rT
iT
wT
2
2exp1
(2.4)
(2.3) izTT
iotTT

26
using thick material with low thermal conductivity such as Plexiglas. Second, the surface coating
of both TLC and black backing paint has negligible thermal influence on the heat conduction
behavior on the test domain, since the thickness of both layers are in terms of only several
microns.
The transient TLC technique is a well-known technique and properly documented in the
gas turbine community. Ireland and Jones, Baughn et al., Critoph et al., and Yen are some of the
early researchers who have successfully applied this technique for convective heat transfer
studies [70-73].
2.3 LUMPED HEAT CAPACITY METHOD
The lumped capacity model is used to deduce averaged heat transfer information on the heat
transfer elements (i.e. pin-fins) where the one-dimensional model fails. In transient heat transfer,
the lumped heat capacity model assumes the temperature is uniform throughout the model and is
only a function of time. This is accomplished by using small elements with high thermal
conductivity (i.e. Aluminum, Copper) that ensures low Biot number as one of the criteria in this
approach. The temperature of the element, T(t) can then be modeled by an initial value problem,
i.e.
and T=Ti at t=0
where A is the effective heat transfer area, while Cp is the constant pressure heat capacitance of
the element. The above equation subjected to one initial condition can be solved analytically and
can be expressed as
dt
dTmCTrThA p)( (2.8)

27
To a great extend, this solution is similar, yet simpler than Eq. (2.5). This resemblance makes it
possible to implement the two solutions together in the same numerical procedure for the post-
run data reduction. For imperfect step changes in flow temperature, superposition and Duhamel’s
integral can be applied, as in Eq. (2.10) and (2.11), i.e.
where
Based on above formulation, from the temporal history of the temperature of the element, the
convective heat transfer coefficient can be deduced. Note that the heat transfer coefficient
deduced from the transient method based on a lumped heat capacity model is an averaged value
over all wet surfaces of the element.
A dimensionless parameter, Biot number, which can be defined as:
is calculated to ensure the validity of the lumped heat capacity model. From Eq. (2.12), L,
represented the characteristic length of the solid, which can be either the diameter or length of
the pin-fins; h is the convective heat transfer on the fluid side; k is the thermal conductivity of
Cp
hAt
iT
rT
iTT
exp1 (2.9)
)(exp1)(
2
2
ii tk
htU
N
i
rii TtUTT1
)( (2.10)
(2.11)
hA
kA
L
k
hLBi
1(2.12)

28
w
ww
wA
ANuNu
p
pp
pA
ANuNu
the solid element. The Biot number provides the ratio of the convective across the fluid boundary
layer to the conduction within the solid. In other words, it can also be viewed as ratio of
resistance to conduction within the solid to the resistance to convection. It is widely accepted that
the Biot number shall be much less than 0.1 for the lumped heat capacity model to be valid. As
the elements used in this study is made from Aluminum and small in size (D=0.25 inch, L=0.5-
1.0”), the Biot number will be relatively small, and the uniformity of temperature within the
element can be assumed at any time. The Biot number of the pin-fin elements for each test case
is less than 0.01.
The acquired heat transfer coefficient can be transformed into dimensionless term which is
known as Nusselt number and its definition is
The magnitude of Nuw and Nup is calculated by the heat transfer coefficient contributed by the
individual endwall and pin-fins weighted by the size of the wetted area, i.e.,
The overall average heat transfer coefficient in the internal channel is calculated by combining
the heat transfer coefficient contributed by both the pin-fins and the endwall and weighted by the
size of the wetted area, i.e
k
hDNu h (2.13)
wp
wwpp
TAA
ANuANuNu (2.16)
(2.14)
(2.15)
29
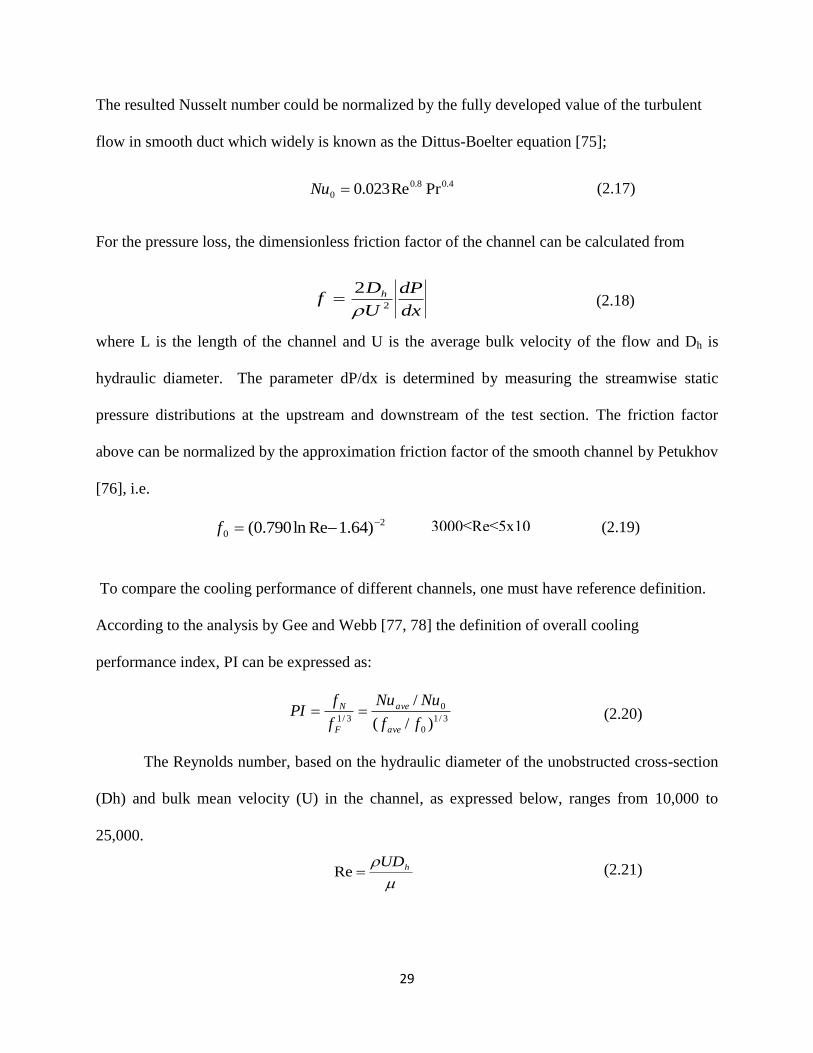
The resulted Nusselt number could be normalized by the fully developed value of the turbulent
flow in smooth duct which widely is known as the Dittus-Boelter equation [75];
For the pressure loss, the dimensionless friction factor of the channel can be calculated from
where L is the length of the channel and U is the average bulk velocity of the flow and Dh is
hydraulic diameter. The parameter dP/dx is determined by measuring the streamwise static
pressure distributions at the upstream and downstream of the test section. The friction factor
above can be normalized by the approximation friction factor of the smooth channel by Petukhov
[76], i.e.
To compare the cooling performance of different channels, one must have reference definition.
According to the analysis by Gee and Webb [77, 78] the definition of overall cooling
performance index, PI can be expressed as:
The Reynolds number, based on the hydraulic diameter of the unobstructed cross-section
(Dh) and bulk mean velocity (U) in the channel, as expressed below, ranges from 10,000 to
25,000.
4.08.0
0 PrRe023.0Nu (2.17)
3/1
0
0
3/1 )/(
/
ff
NuNu
f
fPI
ave
ave
F
N (2.20)
3000≤Re≤5x10⁶
2
0 )64.1Reln790.0( f (2.19)
hUDRe (2.21)
(2.18) dx
dP
U
Df h
2
2

30
Uncertainty calculations were performed based on a confidence level of 95% by Kline
and McClintock [74]. The typical uncertainties from the above-mentioned technique at better
than 95% confidence level are estimated and presented in Table 2.1.
Table 2.1 Uncertainties of Measured Parameters
The combination rule results in the final uncertainty estimated as:
δh/h = {[(δ(ρCpk)1/2
/(ρCpk)1/2
]2+[δt/t]
2+[δβ/β]
2}
1/2 = 5.89 %
The uncertainty of the friction factor is estimated to be approximately 8%; this is mainly due to
pressure tap readings in turbulent flow which tend to have a significant fluctuation component.
Parameters Uncertainty (±%)
δ(T∞-Ti)/(T∞-Ti) 1.5
δ(Tw-Ti)/(Tw-Ti) 1.5
δ(√ )/ (√ ) 5
δt/t 1.5
δθ/θ
θ = (Tw-Ti)/(T∞-Ti)
+1.8
δβ/β = (1/β)(δβ/δθ)(δθ) +2.74

31
3.0 THE EXPERIMENT AND EXPERIMENTAL APPARATUS
3.1 OVERALL TEST SETUP
The overall test setup is shown in Fig.3.1. The tests were conducted in SB21 Benedum Hall, at
the University of Pittsburgh. All experiments in this study used air as the working fluid. In this
study, a series of experiments were performed to investigate the heat transfer and pressure
characteristics in a high aspect ratio, (3:1 width-to-height), channel, and mounted with pin-fins at
different configurations and arrays.
Compressed air is provided from an existing in-house air compressor and metered using
an ASME orifice before entering the flow loop as shown in Fig. 3.1. This metering is performed
by measuring pressures immediately upstream of the orifice plate and across the orifice plate
(using a water-filled and mercury filled manometer). Images of the test domain were captured
using a CCD camera mounted perpendicularly above the test section. Simultaneously, the hot air
temperature was measured using 2 thermocouples located at about 50mm upstream and
downstream of the test domain, which served as inlet and outlet temperature profiles that were
later required for the data reduction procedure. These thermocouples are connected to a National
Instruments SCXI 1000 Chassis via the NI SCXI 1303 terminal block. The test section has a

32
Figure 3.1 Schematic Layout of Test Setup
pressure tap at both the inlet and outlet region, located at the same streamwise distance as the
thermocouples. Pressure drop across the channel was measured from the pressure taps using an
inclined manometer. The test section shown in Fig. 3.1, is a rectangular channel of 76.2mm x
25.4mm (3.0” x 1.0”), made of 25.4mm thick Plexiglas. The low thermal conductivity of
Plexiglas is necessary for the one-dimensional, semi-infinite heat transfer model on which the
local heat transfer coefficient on the surface in between the adjacent pins is based. A rectangular
channel of 76.2mm x 25.4mm (3.0” x 1.0”), made of 25.4mm thick Plexiglas with the total
length of 254 mm is connected to the inlet of the test section to ensure the flow is uniformly
mixed prior of reaching the inlet of the test section. Pin-fins are made from 6.35mm (1/4”)
diameter Aluminum rod and bar stock to ensure very small Biot number so that each pin can be

33
considered as a lump unit with uniform temperature. One end of the pin-fins are threaded and
screwed into the Plexiglas by 3.2mm (⅛”). The pin-fin (D=6.35mm) arrays consist of 2 sets of
pin-fin configurations, inline and staggered, each with three different ratios of detached-
clearance to diameter, C/D=0, 1 and 2, which correspond to a pin-fin height ratio of H/D=4, 3
and 2, respectively. A thin layer of thermochromic liquid crystal is spray-coated on the Plexiglas
followed by a thin layer of black paint to enhance the color intensity of the liquid crystals. This
transient liquid crystal technique has been described in the previous section. This is also a well-
known technique and properly documented in the turbine heat transfer literature [79, 80]. The
detailed operating principle of the hybrid measurement technique is well described by Chen and
Chyu [81,82]. In order to verify the accuracy of each test case, the smooth entrance region of the
test section is closely monitored to ensure that the value of heat transfer coefficient is
comparable to the Dittus-Boelter correlation within the tolerance of ±10%. This will confirmed
that the flow condition in the test section is well-match to the desired Reynolds number for each
test cases.
3.2 TEST SURFACE PREPARATION
The surface of the test section has to be cleaned after the machining process to remove any oil
residual and left to dry completely. Next, a thin uniform layer of thermochromic liquid crystal
is coated on the test surface followed by a layer of black paint. The presence of black paint will
enhance the color contrast of reflecting light from liquid crystal. The most effective applying
method is to use hobby paint sprayer to apply both the black paint and the liquid crystal on the
surface. When both the liquid crystal and black paint dries, the top part of the test section, which

34
is a flat plexiglas plate is secured on to the bottom and top part with machine screws. The test
section is then connected to the experiment setup. Thermocouples and pressure taps are mounted
to the test section prior to the experiments.
3.2 EXPERIMENTAL PROCEDURE
Prior to the experiment, air is ducted away using a three-way valve while being heated by a
series of online heaters. The desired air temperature (~70.0oC ± 1.0
oC) is achieved using a
variable transformer controlling the amount of power supplied to the heaters. Temperature
readings from the thermocouples at the inlet and along the test section are recorded by a data
acquisition system from National Instruments. Before starting the test, the digital camcorder is
set to view the appropriate image domain. The lighting has to be adjusted to light up the test
section and not create a shadow that is could hinder the post processing analysis.
When temperature of the diverted airstream became steady, the hot air was directed into
the test section. Simultaneously, the camcorder records the video image and the data acquisition
system records the thermocouple readings. The test usually lasts approximately 2-4 minutes. A
test ends when the liquid crystal throughout the surface turns into blue color. When the test
ends, the flow is diverted away from the test section and the heater is turned off. For each test,
pressure drop across the test section is measured directly from the incline manometer. The flow
is not shut down until the system is cool down to the safe level. All the data are saved for post
processing by the in-house code, Liquid Crystal Imaging Analyzer (LCIA). The total run time for
each test is about 1 hour. Before starting the next test, the test section is left for at least 4 hours
to cool down to the room temperature.

35
4.0 EFFECTS OF DETACHED PIN SPACE ON HEAT TRANSFER AND
PIN-FIN ARRAYS
4.1 TEST CASES
Table 4.1 Test Cases for Pin-Fins (Baseline)
Table 4.1 summarizes the initial test cases for this study. The results from the initial tests will be
used as baseline data in comparisons with the data acquired from subsequent tests. Cases 1 to 5
represent systematic variations of the detached clearance for both staggered and inline pin-fin
arrays. For these five cases, the tip-to-endwall clearance is uniform for any given case. Cases 6
Case Pin-Fins
Configurations
Pin-Tip to
Endwall
Spacing
Ratio, C/D
Pin-Fins Height
to Pin Diameter
Ratio, H/D on
Top Endwall
Pin-Fins Height
to Pin Diameter
Ratio, H/D on
Bottom Endwall
1 Staggered 0 4 4
2 Staggered 1 3 3
3 Staggered 2 2 2
4 Inline 1 3 3
5 Inline 2 2 2
6 Staggered 0 and 1 4 3
7 Staggered 0 and 2 4 2
36
Top endwall (T)
Bottom endwall (B)
Top endwall (T)
Bottom endwall (B)
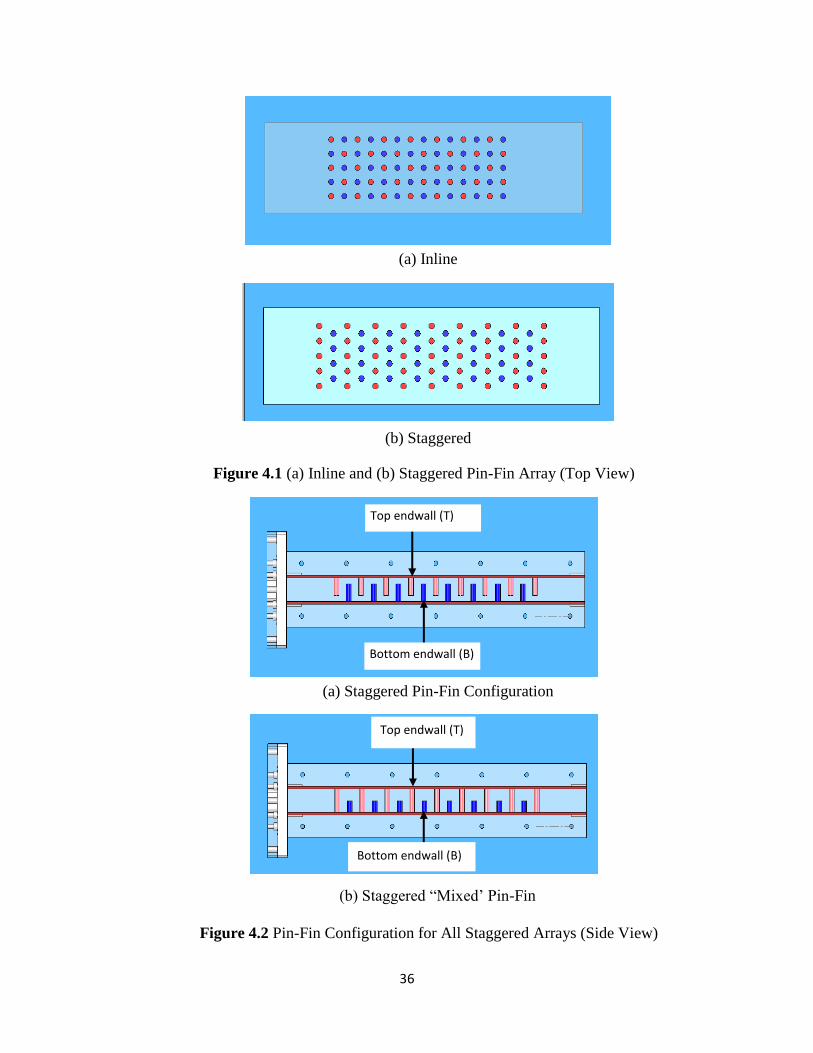
Figure 4.2 Pin-Fin Configuration for All Staggered Arrays (Side View)
(b) Staggered “Mixed’ Pin-Fin
Configuration
(a) Staggered Pin-Fin Configuration
(a) Inline
(b) Staggered
Figure 4.1 (a) Inline and (b) Staggered Pin-Fin Array (Top View)

37
and 7, on the other hand, have different sizes of clearance between the pin-tip and the two
opposing endwalls, hence they will be referred as "mixed" pin-fins array in the remainder of this
paper. Figures 4.1 illustrate the array geometry with different cross-sectional views and related
nomenclature. In Figures 4.1, the 'red' color dots represent pin-fins mounted on the top endwall
while 'blue' color dots represent pin fins mounted on the bottom (opposite) endwall. All arrays
consist of sixteen rows, with nominally five pins per row. Figures 4.2 shows a side view of the
pin-fin configuration for all staggered arrays as listed in Table 4.1. While the top and bottom
endwalls are essentially symmetric in pin arrangement, the "top" endwall is referring to the
specific channel wall mounted with the first row of the pin-fin array, as shown in Fig. 4.2a. For
the mixed pin-fin cases, e.g. Case 6 and Case 7, the "top" endwall is the specific surface of the
test channel where the longer pins are mounted, whereas the "bottom" endwall is the opposing
surface mounted with shorter pins, as shown in Fig. 4.2b. In other words, top endwall
experiences a wider clearance against the tip of pins mounted on the opposing (bottom) endwall.
Vice versa is true for the bottom endwall which faces a narrower tip-to-endwall clearing. In some
of the figures presented in the results section, the top endwall will be abbreviated as "T" and the
bottom endwall as "B."
4.2 LOCAL HEAT TRANSFER COEFFICIENT DISTRIBUTION
Figures 4.3 reveals the effects of different detached spacing on the local heat transfer coefficient
distribution for the staggered arrays at Re=25,000. The figure shows contour plots of the local
heat transfer coefficient (h) on one of the endwalls and attached pins, over a domain spanning
about three pitches transversely and along the center-axis of the test pin-fin array. Since virtually

38
half of the pins are detached from either endwall for the cases C/D=2 and 1, their longitudinal
pitch, as shown in Figs. 4.3a and 4.3b, appears to be double that of the case C/D=0 with all pins
attached to both endwalls. A comparison of the colored contour values in Figs. 4.3 clearly
suggests that C/D=1 has the highest heat transfer coefficient overall among the three cases
shown. The corresponding h values for C/D=0 and C/D=2 appear to be comparable. Further
examining the individual contour plots suggests that, for the pin-fins case with the largest
detached spacing, i.e. C/D=2, the endwall exhibits higher heat transfer coefficient than the pin-
fins. For C/D=1 and C/D=0, the magnitude of the heat transfer coefficient over the pin surface
is generally higher than that of the neighboring endwall for the first few rows, up to row three or
five. Such a trend then reverses toward downstream. This observation has never been reported in
the turbine heat transfer literature.
VanFossen [9], in his pioneer work reported that, for staggered arrays with S/D = X/D =
3.46 and 0.5 ≤ H/D ≤ 2.0, the heat transfer coefficient on the pin surface is approximately 35%
higher than that on the endwall. More recently, Chyu et al. [57] reported a similar result that, for
S/D = X/D = 2.5 and H/D=1, a pin element inherits a higher surface heat transfer coefficient than
the neighboring endwalls by about 25%. The study by Al Dabagh and Andrews [10] suggested
otherwise that, for X/D=2.0, S/D=1.5 and H/D=0.7, the pins have a 15-35% lower heat transfer
than the endwall. The lower heat transfer from the pins in this case is likely caused by the very
low pin-height and diminishing influence of crossflow around a cylinder or tube bundle.
In the present study, the fact that the pins are of higher heat transfer than the endwall near
the upstream portion of the test section may be attributable to two somewhat independent factors.
First, the pins are relatively taller than the standard pedestals, i.e. H/D > 1, and the effects of
cylinder-in-crossflow become prominent. The second factor is the excessive vortex shedding

39
Figure 4.3 Local Heat Transfer Coefficient, h, Distribution on Individual Pin-
Fins and Endwall, Re=25,000
(a) C/D=2 (Staggered)
(b) C/D=1 (Staggered)
(c) C/D=0 (Staggered)
h (W/m2-K)
and turbulence generation associated with the separated shear layers induced by the sharp edge
of the detached pin tip. This latter effect, understandably, depends strongly on the clearance size
and the system’s Reynolds number. The case of C/D=1 and H/D=3 with relatively high heat
transfer overall, shown in Fig. 4.3b, suggests an optimal combination of these two effects. It is
likely that the turbulence level in the bulk flow continues to increase downstream, which
progressively enhances the heat transfer on the endwall and eventually reaches a state surpassing
the heat transfer from the neighboring pins, as revealed in Figs. 4.3a and 4.3c, for C/D=2 and
C/D=0, respectively. This phenomenon seems to be rather insignificant for the case C/D=1 and
H/D=3, at least within the current range of test geometry and flow conditions.
40
In order to verify these results and gain a much better understanding with respect to the
heat transfer phenomena of the pin-fin arrays due to different tip-to-endwall clearance,
simulation efforts were conducted using a commercially available computational fluid dynamics
(CFD) software, FLUENT. The simulated domain was based upon the geometry and dimension
of the experimental test configurations and performed at Re=15,000 and the results were
published by Chi et al. [83]. Figure 4.4 shows the CFD predictions of local shear stress of the
baseline case, fully bridged pins, C/D=0, and two additional staggered arrays with tip-to-endwall
clearance, C/D=1 and C/D=2. The shear stress on the endwall is high when the flow is
accelerated around the pin and also results from the presence of horseshoe vortex that wrapped
around the pin. As expected, the shear stress is also higher at the tip-to-endwall clearance with
the presence of separated shear layers and additional turbulence in the flow regime. This is
strongly attributed to the staggered array with pin C/D=1 that has better heat transfer
performance than the baseline case as presented in earlier section.
Figure 4.5 reveals the comparisons of local heat transfer coefficient distribution obtained
from both simulation and experimental efforts at Re=15,000 plotted at the same scale. The
simulation results also reveal that the heat transfer from the pin-fin surfaces is higher than that of
the neighboring endwall. While the both CFD prediction and experimental results in Fig. 4.5
exhibits different resolution, qualitatively, the heat transfer pattern from the computational
studies is in agreement with the experimental measurement. However, quantitatively, the CFD
models seem to under-predicts the cases by approximately 30 to 40% as compared to the
experimental data. Such phenomena can be due to the turbulence model used in the near wall
region that failed to capture the heat transfer with sufficient accuracy quantitatively.
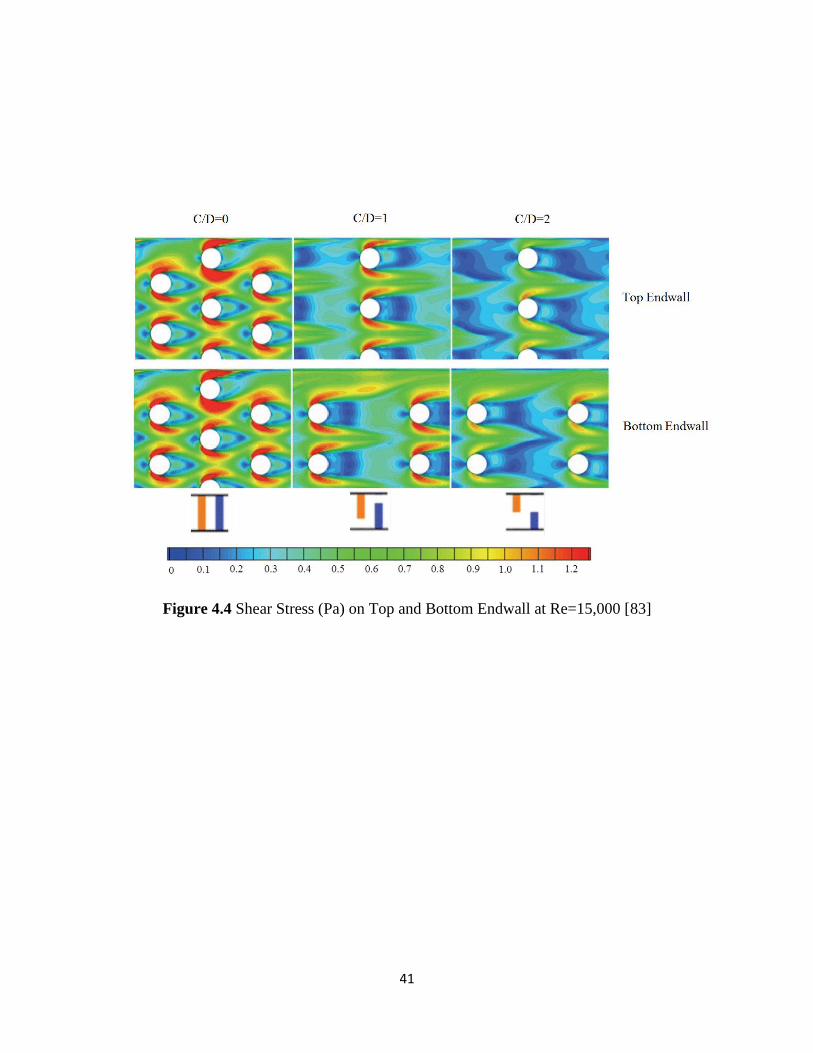
41
Figure 4.4 Shear Stress (Pa) on Top and Bottom Endwall at Re=15,000 [83]

42
Fig
ure
4.5
Hea
t T
ransf
er C
oef
fici
ent
Dis
trib
uti
on f
rom
Both
CF
D P
redic
tion a
nd E
xper
imen
tal
Res
ult
s

43
Flow
4.3 ROW-RESOLVED, AVERAGE NUSSELT NUMBER
The domain of a given row is centered at the location of the pin axis and extends one-half
longitudinal spacing both upstream and downstream, as shown in Fig. 4.6 for one representative
endwall with pin-fins. The area includes the circumferential surface of a row of pin-fins and the
associated uncovered endwall.
Figure 4.6 Schematic of Row in Pin-Fins Array
Figures 4.7 and 4.8 present the row-resolved average Nusselt number of the pin-fins and
the endwall for various C/D ratios of inline and staggered arrays at Re=15,000. The caption “S”,
“I”, “P” and “W” in these figures stand for “staggered”, “inline”, “pin” and “endwall”,
respectively. Also, in Fig. 4.7a, discrete symbols are used to represent data for heat transfer from
the pins, and line-connected symbols are for the data on the neighboring endwall. The effects of
detached tip clearance, e.g. C/D ratio, as depicted from the local results in Figs. 4.3 for a
relatively higher Reynolds number Re=25,000, are evident in both figures. The case C/D=1 for
the staggered array, again, has the highest heat transfer overall.
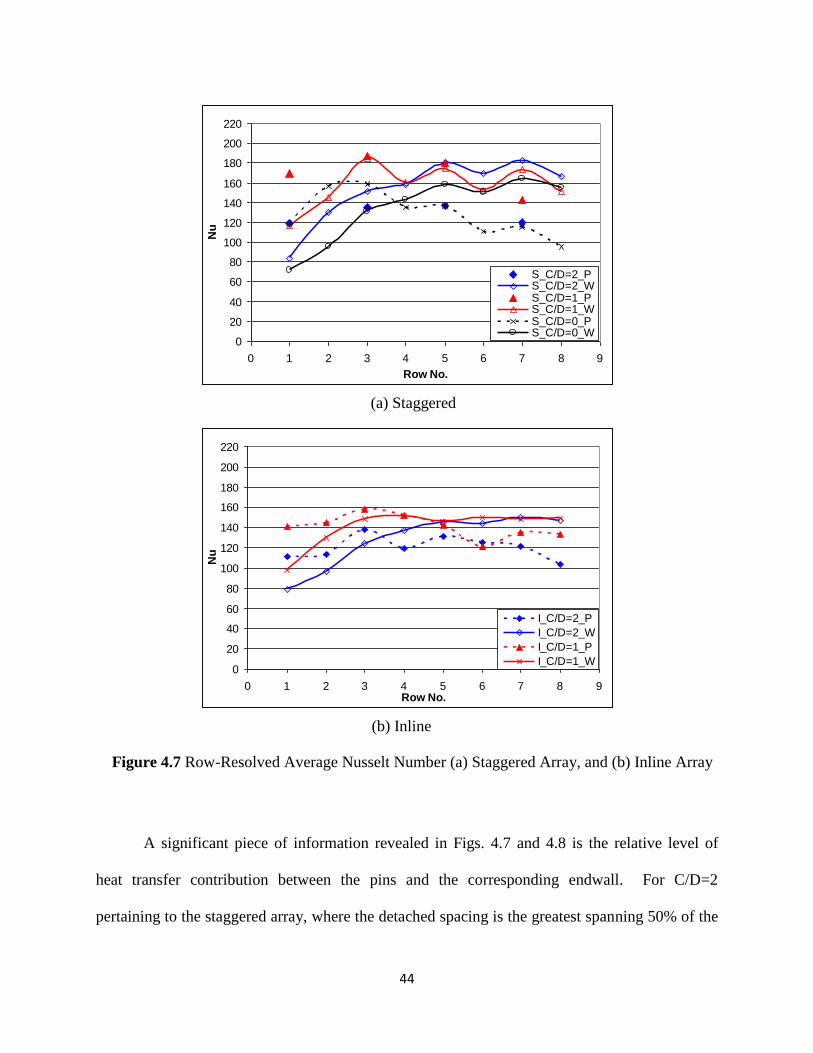
44
A significant piece of information revealed in Figs. 4.7 and 4.8 is the relative level of
heat transfer contribution between the pins and the corresponding endwall. For C/D=2
pertaining to the staggered array, where the detached spacing is the greatest spanning 50% of the
Figure 4.7 Row-Resolved Average Nusselt Number (a) Staggered Array, and (b) Inline Array
(b) Inline
0
20
40
60
80
100
120
140
160
180
200
220
0 1 2 3 4 5 6 7 8 9Row No.
Nu
I_C/D=2_P
I_C/D=2_W
I_C/D=1_P
I_C/D=1_W
(a) Staggered
0
20
40
60
80
100
120
140
160
180
200
220
0 1 2 3 4 5 6 7 8 9
Row No.
Nu
S_C/D=2_P S_C/D=2_WS_C/D=1_PS_C/D=1_WS_C/D=0_PS_C/D=0_W

45
entire channel height, heat transfer from the endwall is about 10% to 60% higher than the pins,
except for the first three rows. This trend can be explained plausibly that the large tip-to-endwall
clearance forms a less resistive pathway for the flow or coolant, leading to more active heat
Figure 4.8 Row-Resolved Average Nusselt Number for “Mixed” Pin-Fin
Cases (a) Pin-Fin, (b) Endwall
(b) Endwall
0
20
40
60
80
100
120
140
160
180
200
220
0 1 2 3 4 5 6 7 8 9Row No.
Nu
w
S_C/D=0&2(B)
S_C/D=0&2(T)
S_C/D=0&1(B)
S_C/D=0&1(T)
(a) Pin-Fin
0
20
40
60
80
100
120
140
160
180
200
220
0 1 2 3 4 5 6 7 8 9Row No.
Nu
p
S_C/D=0&2(B)
S_C/D=0&2(T)
S_C/D=0&1(B)
S_C/D=0&1(T)
46
convection near the endwall. However, pins of the first row contribute more heat transfer than
the neighboring endwall by about 50%. This is reasonable, as the effect of detached spacing will
prevail only after a sufficient developing regime. A very similar trend exists in the baseline case
of fully bridged pins, C/D=0. The case of C/D=1 is the only exception, as the rise of heat
transfer on the endwall downstream to the first few rows is rather insignificant. Instead, the
levels of heat transfer contributed by the pins and the neighboring endwall are comparable,
except for the first row and the third row, where pins are about 30% to 50% higher. In addition,
Fig. 4.7a also reveals that the heat transfer coefficient at the endwall for the cases with detached
tip-to endwall clearance, i.e. C/D=1 and 2, are higher than the baseline case. This finding is not
fully consistent with the results reported by Chang et al.[17] as their results only shows
enhancement in the first few rows. The row-resolved heat transfer characteristics for the inline
array, as shown in Fig. 4.7b, are similar to that of the staggered array. For all the inline cases,
pins again inherit higher heat transfer than the endwall in the first three to five rows before the
trend reverses downstream. The spread of the heat transfer contribution between the pins and the
endwall seems to be smaller than that of the staggered arrays. Based on the overall values of the
Nusselt number exhibited in Fig. 4.7a, a staggered array with a tip-to-endwall clearance, either
C/D=1 or C/D=2, renders about 15-20% higher heat transfer than the corresponding inline array.
This finding is consistent with the general notion that the staggered array is capable of generating
more heat transfer enhancement than the inline array.
Figures 4.8 shows the row-resolved Nusselt number for the pin fin arrays with “mixed”
tip-to-endwall clearance. As stated earlier, the “top” endwall, captioned as “T” in the figure, is
the surface mounted with longer pins; whereas the “bottom” endwall, noted as “B”, serves as a
base for shorter pins. However, in the present cases, as C/D=0 implies half of the pins actually

47
attach both endwalls. Therefore, the bottom endwall, in fact, not only serves as the base surface
for the shorter pins but also has the longer pins attached. In Figure 4.8a, the results show the heat
transfer from the pins, rather than from the endwall. The data associated with a “T” (solid
symbol) is for the longer pins, i.e. H/D=4, and a “B” (open symbol) is for the shorter pins, either
H/D=2 (C/D=2) or H/D=3 (C/D=1). Both Figs. 4.8a and 4.8b reveal several significant trends
with somewhat complex transport phenomena. First of all, the heat transfer from the shorter pins
is generally higher than that of the longer pins, and its magnitude appears to be insensitive to the
size of tip-to-endwall clearance above the shorter pins. Second, the magnitudes of heat transfer
from the longer, and fully bridged pins shows notable variation with the size of tip-to-endwall
clearance or C/D ratio. Here, the fully-bridged pins neighboring with shorter pins of C/D=1
render an approximately 20% higher heat transfer than that mixed with the pins of C/D=2. This
increase in heat transfer is likely induced by vortex shedding along with the separated shear layer
generated by the tip edge of the shorter pins. Third, as shown in Fig. 4.8b, the bottom endwall
with both the shorter and longer pins attached has a higher heat transfer than the top endwall
where only the full-length pins are attached. This implies that the heat transfer enhancement on
the endwall under a mixed pin-fin situation might be more dominated by the horseshoe vortex
near the pin-endwall junction rather than the turbulence elevation induced by the detached pin
tip. A comparison of Figs. 4.7 and Figs. 4.8 suggests that mixed pin-fins might be
disadvantageous if attaining optimal heat transfer is the primary design objective, as the Nusselt
numbers for the mixed cases are generally lower than those of the corresponding cases with a
uniform detached tip-to-endwall clearance.

48
1.00
1.50
2.00
2.50
3.00
3.50
4.00
4.50
0 5000 10000 15000 20000 25000 30000Re
Nu
T/N
uo
S_C/D=2S_C/D=1S_C/D=0I_C/D=2I_C/D=1S_C/D=0 & 2S_C/D=0 & 1
4.4 OVERALL AVERAGED HEAT TRANSFER COEFFICIENT
Figure 4.9 Overall Heat Transfer Enhancement vs. Re
Figure 4.9 reveals the overall array-averaged heat transfer enhancement relative to the
corresponding fully developed turbulent heat transfer in a smooth channel, NuT/Nuo. Clearly
shown in Fig. 4.9 is that the case of C/D=1 for the staggered array has the highest heat transfer
enhancement among all the cases studied. The value of NuT/Nuo ranges from 3.6 to 4.2, which is
substantially higher than the conventional pedestals of short pin fins. As discussed earlier, such
heat transfer enhancement is attributable to the change in flow structures induced by the presence
of spacing between the pin-tip and the adjacent endwall, which in turn, favors pin-endwall
interaction and the turbulent transport in the bulk flow. About 15% lower than the enhancement
level of C/D=1 are the cases of C/D=2 and C/D=0 for the staggered array, as well as C/D=1 for
the inline array. These are followed by the lowest enhancement group of two mixed pin cases
and the case of C/D=2 for the inline array. However, the enhancement level for the mixed case,

49
15
25
35
45
55
65
75
0 5000 10000 15000 20000 25000 30000Re
f/fo
S_C/D=2S_C/D=1 S_C/D=0I_C/D=2I_C/D=1 S_C/D=0 & 2S_C/D=0 & 1
C/D=0 combined with C/D=2, increases notably as Re>15,000. The data presented by Chang et
al. [17] and Arora and Abdel-Messeh [30] reveal that the heat transfer enhancement are
increasing with pin height (i.e. decreasing C/D) as they only consider the contribution from the
endwall. Based on the results in this study, this may not be true by considering the heat transfer
contribution from the pin-fins.
4.5 PRESSURE LOSS COEFFICIENT
Figure 4.10 Normalized Friction Factor vs. Re
Heat transfer enhancement is usually accompanied by the penalty of additional pressure loss. A
pin-fin element obstructs the flow causing drag and head loss in the system. The pressure loss
characteristics of all cases presented in Fig. 4.10 are based on f/fo, where f is the friction factor,

50
defined by Eq. 2.18 and fo is the overall friction factor normalized by the corresponding data for
fully developed flow in a smooth, defined by Eq. 2.19.
Most cases seem to have fairly constant pressure loss with respect to Re. A significant
finding revealed in Fig. 4.10 is that an increase of C/D ratio leads to a lower pressure loss,
corresponding to a lower value of f/fo. Overall, staggered pin-fin arrays induce greater pressure
losses than the corresponding inline arrays. Such a characteristic is consistent with the findings
reported in the earlier studies [17, 29, 30]. Also shown in Fig. 4.10 is that C/D=0 for the
staggered array has the highest pressure loss and C/D=2 for the inline array has the lowest. For
C/D=1, both staggered and inline arrays have about 40% to 50% lower pressure loss than that of
C/D=0 for the staggered array. The pressure loss for C/D=2 for the staggered array is about 10%
to 20% higher than its inline counterpart.
Another significant finding observed in Fig. 4.10 is that in the mixed pin-fin cases where
the pin fins are at full height, the pressure loss seems to be insensitive to the presence of different
detached spacing. This suggests that the pressure characteristics for the mixed cases are dictated
by the full-height or taller pins.

51
4.6 PERFORMANCE INDEX
The assessment of performance for a pin-fin array is measured by the so-called performance
index, PI, defined as in Eq. 2.20. Figure 4.11 shows the variations of PI varying with Re for each
C/D ratio tested. Since the heat transfer enhancement (NuT/Nuo) generally decreases with Re,
and the pressure loss coefficient (f/fo) tends to increase with Re, the PI decreases with increasing
Re. The cases of C/D=1 and 2 in the staggered arrays yield the highest PI, while C/D=0 has the
lowest performance index, due to having the largest pressure drop among all cases. The
performance index for the mixed case, C/D=0 combined with C/D=1, is slightly lower than the
staggered case of C/D=0, and inherits the worst performance index among all cases. Both inline
cases (i.e. C/D=1 and 2) outperform the mixed cases by about 10%-20%.
0.00
0.20
0.40
0.60
0.80
1.00
1.20
1.40
0 5000 10000 15000 20000 25000 30000Re
Per
form
ance
Ind
ex
S_C/D=2
S_C/D=1
S_C/D=0
I_C/D=2
I_C/D=1
S_C/D=0 & 2
S_C/D=0 & 1
Figure 4.11 Performance Index vs Re

52
4.7 KEY FINDINGS
The present study performed a systematic investigation on the effects of detached spacing of pin
fin arrays on heat transfer in a rectangular channel. The geometry and test conditions are
relevant to the new cooling concepts with three-dimensional protruding elements, rather than
two-dimensional elements, for the enhancement of turbine internal cooling. The concept of
implementing pin fins with detached spacing between the pin-tip and the adjacent endwall is to
promote turbulent convection with separated shear layers induced near the pin-tips. Local heat
transfer data obtained over the entire wetted surface suggests that the size of detached spacing,
normalized by the pin diameter, i.e., C/D, has a profound influence on the overall heat transfer
characteristics in the channel. Compared to the baseline case of the fully attached pin-fin array,
S/D=X/D=2.5 and H/D=4 (i.e., C/D=0), the case for the staggered array with C/D=1 results in
the highest heat transfer enhancement among all the cases studied, approximately 15% higher
than the baseline case. Accompanied with this heat transfer enhancement for C/D=1 is another
favorable feature in reduction of pressure loss by approximately 30 to 35%. While the case with
C/D=2 shows a comparable heat transfer enhancement with the baseline, the reduction of
pressure loss is even more substantial than the case of C/D=1. Mixed pin-fins cases do not
appear to be a viable choice as compared to the staggered cases as these cases exhibit lower heat
transfer enhancement. With respect to the overall performance index, a measure of heat transfer
enhancement per unit pressure loss, is of concern, the case with C/D=1 and 2 for staggered arrays
is the most favorable. CFD predictions are very useful into providing insight in the spatial details
of the internal cooling channel, however, it is limited by the very complex flow conditions with
the presence of pin fin and clearance between the pin tip and opposite endwall. Consequently,

53
internal cooling performance of the gas turbine airfoil is often very difficult to predict and
remains a major constraint for turbine designers.

54
5.0 COMBINED EFFECTS OF DETACHED PIN SPACE AND RIB-TURBULATORS
ON HEAT TRANSFER AND PIN-FIN ARRAYS
5.1 TEST CASES
Table 5.1 Test Cases
Case Pin-Fins
Configurations
Pin-Tip to
Endwall
Spacing
Ratio, C/D
Pin-Fins
Height to Pin
Diameter
Ratio, H/D on
Top Endwall
Pin-Fins
Height to Pin
Diameter
Ratio, H/D on
Bottom
Endwall
1 Staggered w/
Broken Ribs 1 3 3
2 Staggered w/
Broken Ribs 2 2 2
3 Staggered w/
Full Ribs 0 4 4
4 Staggered w/
Full Ribs 1 3 3
5 Staggered w/
Full Ribs 2 2 2
The same experimental setup and measurement techniques that were described in the previous
section were used to explore the combined effects of detached pin space and rib-turbulators in

55
(a) Broken Ribs and Pin-Fins
(b) Full Ribs and Pin-Fins
Figure 5.1 Test Plate Design Model (Top View) with (a) Broken Ribs and Pin-Fins
(b) Full Ribs with Pin-Fins
this subsequent study. The same sets of pin-fin are used and new test plates with the same
geometry and pin-fin configurations as described in the previous section were fabricated to
accommodate the ribs. The design models of two test plates with different ribs configurations are
shown in Fig. 5.1. The width, rw and height, rh of the ribs is 1/16 inch (1.59mm). The rib height-
to-channel height ratio is 0.0625. For the broken rib, the length of the ribs is 0.5 inch (12.7mm),
Full Ribs Hole for pin-fins
Broken Ribs Hole for pin-fins

56
while for the full rib cases, the ribs are extended from one pin to another to the following row as
shown in Fig. 5.1b. The test cases explored in this study are shown in Table 5.1. Only staggered
pin-fin arrays are explored as previous results proved that staggered arrays outperform inline
arrays in all test conditions.
5.2 LOCAL HEAT TRANSFER COEFFICIENT DISTRIBUTION
Figures 5.2 and 5.3 show the results of local heat transfer coefficient, h distribution for the
endwall and pin-fins with the additional effects from broken ribs and full ribs at Re=25,000. The
results (staggered arrays with no ribs) from the previous section are used as baseline case in
comparisons with the findings in the section. The results are plotted according to the pin
detached spacing, C/D= 2 and 1. One significant observation from both Figs. 5.2 and 5.3 is that
the presence of full ribs, disregard of detached pin spacing, has eliminated the horseshoe vortex
around each pin-fin in the array. The horseshoe vortices are still preserved in the baseline and
broken ribs with pin-fins cases. In addition, one great advantage of having the broken ribs is that
the local heat transfer coefficient where the ribs are positioned is enhanced substantially in the
entire domain. This is a very substantial finding that contradicted with most literatures
[11,12,15,18] as they reported that the heat transfer from the pins is generally higher than that of
the neighboring endwall. In general, for the same Re and same ribs configurations, heat transfer
seems to increase with the pin height.
Based on overall comparison from the level of heat transfer in Figs. 5.2 and 5.3, for the
same detached pin space, broken rib cases outperforms the other cases. One possible explanation
may be due to excessive vortices generated by the broken ribs while still preserving the

57
horseshoe vortices as one of the major contributions in heat transfer enhancement. Overall, the
heat transfer pattern for all cases are still the same with literatures [10-17], where the heat
transfer reaches the peak value and around the fourth row, and settles at a final ‘fully developed’
value.
Figure 5.2 Local Heat Transfer Coefficient, h (W/m2-K) Distribution for Endwall and
Pins (C/D=2; H/D=2) at Re=25,000
(a) Baseline
(a) Broken Ribs with Pin-Fins
(c) Full Ribs with Pin-Fins
0 33 100 133 167 200 233 263 300 67

58
Figure 5.3 Local Heat Transfer Coefficient, h (W/m2-K) Distribution for Endwall and
Pins (C/D=1; H/D=3) at Re=25,000
(a) Baseline
(c) Pin-Fins with Full Ribs
(b) Pin-Fins with Broken Ribs
0 33 100 133 167 200 233 263 300 67

59
5.3 ROW-RESOLVED AVERAGED HEAT TRANSFER
Results in this section present the row-resolved averaged Nusselt number of the pin-fins and
endwall for cases listed in Table 5.1, conducted at Re ranging from 10,000 to 25,000. Some of
the results obtained in the previous section, will be used as baseline data for comparisons. The
caption “S”, “FR”, “BR”, “w”, and “p” in these figures stand for “staggered array as baseline”,
“full ribs”, “broken ribs”, “endwall” and “pin-fins”, respectively. The caption “2”, “3”, and “4”
denotes the height of the pin-fins normalized by the pin diameter, i.e. 2 represents pin-fins
H/D=2, C/D=2. Figures 5.4, and 5.5, reveals the row-resolved averaged Nusselt number for
endwall and pin-fins of the broken rib and full rib cases with pin-fins H/D=2 (i.e. C/D=2) and
H/D=3 (i.e. C/D=1) in comparisons with the staggered array without ribs (that serve as baseline)
from the previous section. The domain of a given row is centered at the location of the pin axis
and extends one-half longitudinal spacing both upstream and downstream as shown in Fig. 4.4 in
the previous section.
Figures 5.4 show that the magnitude of heat transfer increment at the endwall with Re for
the baseline case is the lowest compared to the broken and full rib cases. This is more evident for
the broken rib cases as the Re increases. Generally, heat transfer at the endwall alone for the
broken rib and full rib cases are higher than the baseline case by about 10% to 25%. However, at
the lowest Re (i.e. Re=10,000), the heat transfer at the endwall for all cases are very much
comparable. Heat transfer from the pin-fins in all cases at Re=10,000 are also relatively close,
which suggest that the bulk flow fields in the core region very much behave the same in these
cases. However, with the presence of ribs, the flow characteristics relatively close to the endwall
are significantly altered as compared to the case without ribs, which explains the impact of ribs

60
on heat transfer at the endwall in earlier findings. Comparing between the heat transfer from the
endwall and pin-fins, the heat transfer from endwall surpasses the pin-fins by 10% up to 50%.
Similar comparisons are made for the cases with pin-fins H/D=3 (i.e. C/D=1) and the
results are presented in Figs. 5.5. The level of heat transfer at the endwall is higher than that of
the cases with shorter pin-fins (i.e. H/D=2; C/D=2), and depicted similar trends with the results
in Figs. 5.4 except for the broken rib cases. For the broken rib case, at higher Re, i.e. Re=20,000
and 25,000, heat transfer increases drastically and varies at a larger scale throughout the entire
domain. It seems the separated shear layers created at the pin tip and additional vortices
generated by the broken ribs have prominent effects towards the heat transfer on the endwall.
Heat transfer on the endwall is higher than the neighboring pin-fins for the broken ribs and full
ribs cases, by about 10% to 25%. However, the trend is reversed for the baseline cases starting
from the first row up to the fifth row. Heat transfer from pin-fins is higher than the neighboring
endwall by 10% up to about 20%. Evidently, this shows that the separated shear layers generated
by the pin tip alone and the pin-to-endwall interaction have more dominating impact towards
heat transfer on the pin-fins than the combinations effects from the detached pin space and ribs.
Such profound effects decrease as the flow progresses towards downstream, and eventually heat
transfer on the endwall becomes greater than that of the pin-fins.
Figures 5.6 show the comparisons of all cases with full ribs for endwall and pin-fins.
Evidently, with longer pin-fins, the heat transfer seems to increase at a larger scale, i.e. H/D=4 at
Re=25,000, the heat transfer almost increases by 2.5 fold as compared to the first row. Overall,
the magnitudes of heat transfer from the case with longer, and fully-bridged pins, outperform the
case with shorter pin-fins. In addition, heat transfer for the pin-fins throughout the entire domain
increased more drastically as compared to the endwall counterpart. For cases with longer pin-
61
fins, shorter flow length is require to reach the peak heat transfer as compared to shorter pin-fins.
This is shown is both H/D=3 and H/D=4 cases, i.e. C/D=1 and 0, where the peak value occurs at
the third row, as reported in most literatures. The case with shorter pin-fins, H/D=2, the peak
value of heat transfer is observed at the fifth row. Detailed comparisons indicated that the
endwall has substantially higher heat transfer than the neighboring pin-fins for all cases by about
25% up to 60% although the ribs have eliminated the horseshoe vortices in the array. These
phenomena can be explained plausibly based on two important factors. Firstly, as explained in
the previous section, with shorter pin-fins in the array, this has created a path a less resistance
and has caused more flow to move closer towards the endwall causing greater heat transfer.
Secondly, having ribs spanning from pin to pin has increase the effective heat transfer area in
each respective row. The difference between magnitude of heat transfer is even more significant
at lower Re, i.e. for the case with shortest pin-fins, i.e. C/D=2, and at Re=10,000, the heat
transfer at the endwall is about two times higher than that of the neighboring pin-fins.
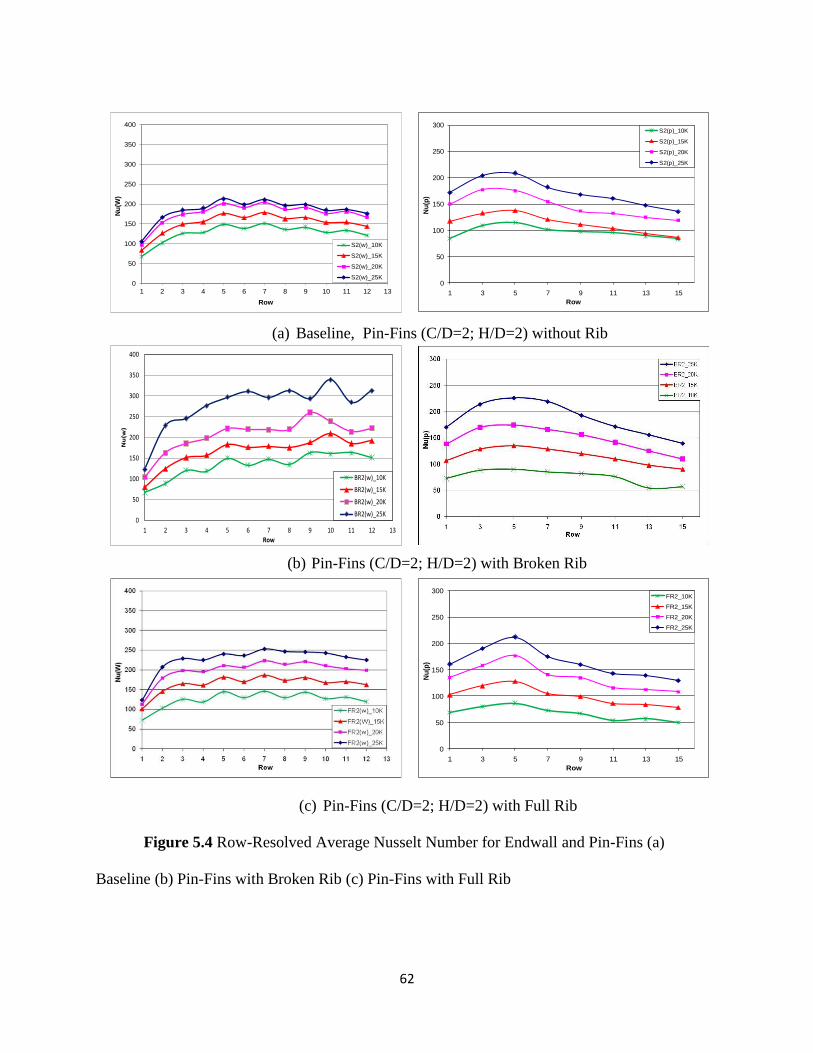
62
(a) Baseline, Pin-Fins (C/D=2; H/D=2) without Rib
(b) Pin-Fins (C/D=2; H/D=2) with Broken Rib
(c) Pin-Fins (C/D=2; H/D=2) with Full Rib
0
50
100
150
200
250
300
350
400
1 2 3 4 5 6 7 8 9 10 11 12 13
Nu
(W)
Row
S2(w)_10K
S2(w)_15K
S2(w)_20K
S2(w)_25K
0
50
100
150
200
250
300
350
400
1 2 3 4 5 6 7 8 9 10 11 12 13
Nu(w
)
Row
BR2(w)_10K
BR2(w)_15K
BR2(w)_20K
BR2(w)_25K
0
50
100
150
200
250
300
1 3 5 7 9 11 13 15
Nu
(p)
Row
S2(p)_10K
S2(p)_15K
S2(p)_20K
S2(p)_25K
0
50
100
150
200
250
300
1 3 5 7 9 11 13 15
Nu
(p)
Row
FR2_10K
FR2_15K
FR2_20K
FR2_25K
Figure 5.4 Row-Resolved Average Nusselt Number for Endwall and Pin-Fins (a)
Baseline (b) Pin-Fins with Broken Rib (c) Pin-Fins with Full Rib

63
Figure 5.5 Row-Resolved Average Nusselt Number for Endwall and Pin-Fins
(a) Baseline (b) Pin-Fins with Broken Rib (c) Pin-Fins with Full Rib
0
50
100
150
200
250
300
350
400
1 2 3 4 5 6 7 8 9 10 11 12 13
Nu
(W)
Row
S3(w)_10K
S3(w)_15K
S3(w)_20K
S3(w)_25K0
50
100
150
200
250
300
1 3 5 7 9 11 13 15
Nu
(p)
Row
S3(p)_10K
S3(p)_15K
S3(p)_20K
S3(p)_25K
0
50
100
150
200
250
300
350
400
1 2 3 4 5 6 7 8 9 10 11 12 13
Nu(w
)
Row
BR3(w)_10K
BR3(w)_15K
BR3(w)_20K
BR3(w)_25K
0
50
100
150
200
250
300
1 3 5 7 9 11 13 15
Nu
(p)
Row
FR3_10K
FR3_15K
FR3_20K
FR3_25K
(a) Pin-Fins (C/D=1; H/D=3) without Rib
(b) Pin-Fins (C/D=1; H/D=3) with Broken Rib
(c) Pin-Fins (C/D=1; H/D=3) with Full Rib

64
Figure 5.6 Row-Resolved Average Nusselt Number for Endwall and Pin-Fins with Full
Ribs, (a) Pin-Fins (H/D=2) (b) Pin-Fins (H/D=3) (c) Pin-Fins (H/D=4)
(a) Pin-Fins (C/D=2; H/D=2) with Full Ribs
(b) Pin-Fins (C/D=1; H/D=3) with Full Ribs
(c) Pin-Fins (C/D=0; H/D=4) with Full Ribs

65
5.4 ENDWALL AND OVERALL AVERAGED HEAT TRANSFER ENHANCEMENT
The result in Fig. 5.7 illustrates the local trend and row-resolved average Nusselt number
delineated earlier. Full ribs are very effective in enhancing heat transfer when coupled with fully
bridged pin fins. This is clearly shown in Fig. 5.7 as the full rib case with fully bridged pin-fins
exhibits the highest heat transfer factor ranging from 4.3-4.9. The broken rib cases of C/D=1 and
C/D=2 show rather high heat transfer factors that range from 3.6-4.5. The baseline case of
C/D=2 has the lowest heat transfer factor. For the same detached pin-fins height, all broken rib
cases outperform the full rib cases by approximately 10-15%. Overall, the results indicate that
both broken and full rib cases outperform the baseline cases.
Figure 5.7 Endwall Heat Transfer Enhancement vs Re

66
Figure 5.8 Overall Heat Transfer Enhancement vs Re
Figure 5.8 reveals the heat transfer enhancement of the full rib and broken rib cases
normalized with the fully developed smooth channel in comparisons with the baseline cases.
While the previous section shows that both broken rib and full rib have profound effects towards
the heat transfer on the endwalls, by considering the level of heat transfer and overall effective
heat transfer area in the domain, it is clearly proven that the baseline case, C/D=1 (i.e. H/D=3)
remains the best performer among all cases. This is mainly due to the heat transfer contributed
by the pin-fin that is higher than the neighboring endwall as compared to both broken rib and full
rib case. Among the full rib cases, C/D=2 is the worst case, while C/D=1 and 0 are comparable.
The broken rib cases performs better than the full ribs cases by about 10%, but still underperform
as compared to the baseline case, C/D=1. However, at high Re, the level of heat transfer
enhancement in the broken rib cases seems to increase and match with the baseline case, C/D=1.

67
5.5 PRESSURE LOSS COEFFICIENT AND PERFORMANCE INDEX
Figure 5.9 Pressure Loss Coefficient vs Re
The presence of broken rib and full rib pressure loss coefficient versus Re for all cases is
presented in Fig. 5.9. As the height of the ribs is 1/16” (1.59mm) which is about 6% of the
channel height, the presence of broken rib and full rib do not impose significant pressure loss to
the entire domain as compared to the cases without ribs. Pressure drop in both broken rib and full
rib cases is approximately 5%-8% higher than the baseline cases.

68
Figure 5.10 Performance Index vs Re
Fig. 5.10 reveals the performance index for all cases in comparisons with the baseline
results from previous section. With low heat transfer enhancement, but coupled with relatively
low pressure loss, broken rib with pin-fin C/D=2 yields the highest PI together with baseline case
C/D=1 and C/D=2. Full rib with pin-fin C/D=2 has comparable PI between both broken rib
cases. All broken rib cases outperform the full rib cases with pin-fins C/D=1 and 0 by about 10%
-20%.

69
5.6 COMPUTATIONAL METHODOLOGY
A numerical investigation is conducted to explore the effects of broken rib and full rib towards
the heat transfer performance on the endwall as compared to the baseline case, detached pin-fin
array without ribs. The simulation results will provide better insights and understanding of the
flow field which strongly affects the heat transfer performance in the flow domain.
The geometry of the simulated flow domain for the detached pin-fin arrays is illustrated
in Fig. 6.1. The flow domain is a rectangular channel with width, W of 47.63mm and height, E of
25.4mm. The total length of the flow domain is 95.25mm, which consists of 5 rows of pin-fin.
The flow domain represents a partial section of the experimental model and numerical
calculations are performed based on this selected flow domain. The diameter and height of the
pin is 6.35mm and 19.05mm. With the channel height of 25.4mm, the clearance, C between the
pin-tip and opposite endwall normalized by the pin diameter, C/D is 1. The pin-fins are arranged
in a staggered configuration with the same inter-pin spacing (SL/D=ST/D=2.5) as the
experimental setup. The geometry of the broken rib and full rib case is based on the experimental
model as presented in the earlier section.
The mesh for each computational domain is generated using CFX Mesh. The total
number of cells in each case is approximately 5.5 million. The flow domain for each individual
case is presented in Fig. 5.11. On the solid walls, 20 layers of prisms elements are then created
with a growth rate of 1.2. Pyramid elements are avoided anywhere in the domains, since this type
of element can leads to a solution divergence once the higher accuracy scheme is utilized. The
grid spacing of the first cell normal to the top and bottom endwalls is 0.1mm, which produces y+

70
values between 5 and 15. The computational scheme is based on k-ɛ turbulence model with
scalable wall functions.
All equations were solved to high resolution schemes. In all calculations, the root-mean-
square (rms) and maximum absolute errors for both the mean flow and turbulence quantities
were monitored for each computational block to ensure complete convergence of the numerical
solutions and a convergence of 10-5
was used for the maximum rms error.
On operating conditions, for all cases, the temperature on the wall and pin-fin surfaces is
set at Tw=Tp=313.15K; the temperature and the bulk velocity of the air at the channel inlet were
uniform at Tin=343.15K and U=8.24m/s. The pressure at the channel exit was Pexit= 1atm. In this
computational study, the Reynolds number simulated was Re=15,000 based on the hydraulic
diameter of the unobstructed channel cross-sectional area and bulk velocity with the dynamic
viscosity evaluated at the channel inlet.

71
Figure 5.11 Flow Domain of the Computational Model
(a) Detached Pin-Fin (Baseline)
(b) Detached Pin-Fin with Broken Rib (BR)
(c) Detached Pin-Fin with Full Rib (FR)

72
Figure 5.12 Shear Stress (Pa) on the Top Endwall
(c) Detached Pin-Fin with Full Rib (FR)
(a) Detached Pin-Fin (Baseline)
(b) Detached Pin-Fin with Broken Rib (BR)
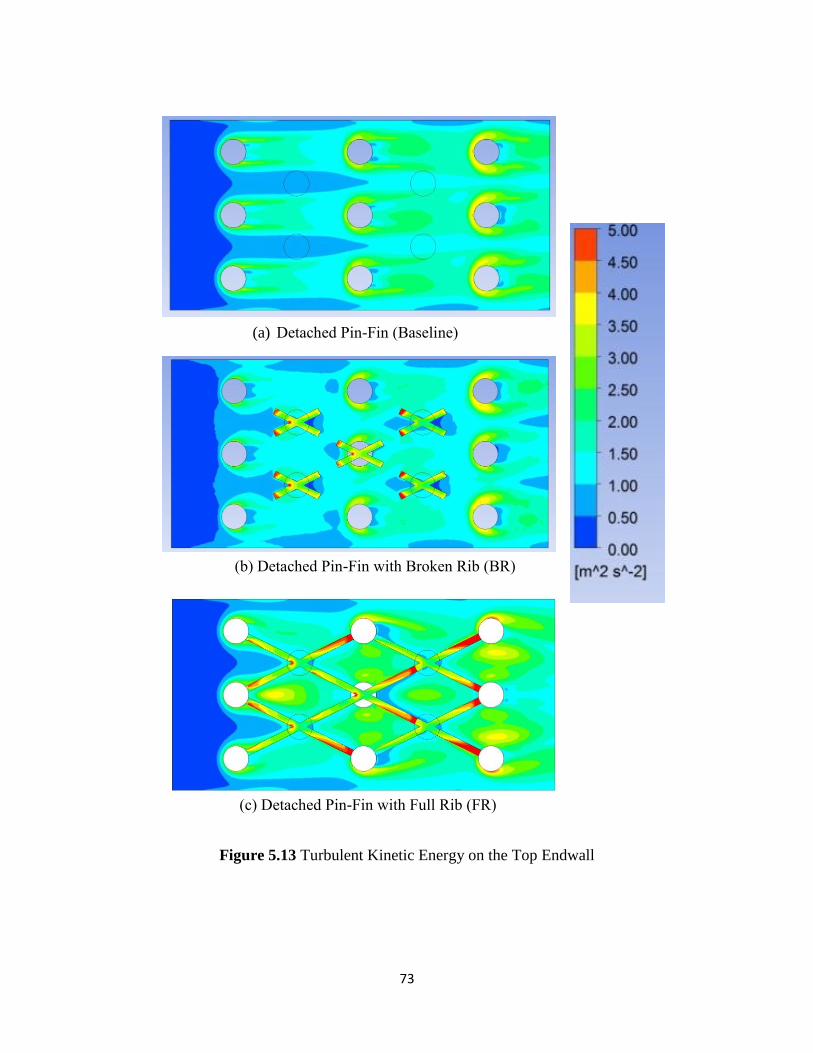
73
Figure 5.13 Turbulent Kinetic Energy on the Top Endwall
(c) Detached Pin-Fin with Full Rib (FR)
(b) Detached Pin-Fin with Broken Rib (BR)
(a) Detached Pin-Fin (Baseline)

74
Figure 5.12 illustrates the shear stress on the top endwall where the pin-fin and ribs are
mounted. Shear stress on the top endwall is high when the flow is accelerated around each pin-
fin and when the horseshoe vortices wrapped around each pin-fin. This is clearly shown in the
baseline and broken rib case. The shear stress is low near stagnation regions and in the vicinity
when the streamline comes together. Heat transfer is expected to be high in the region about the
stagnation zone, and regions where streamlines converge because the fluid away from the
endwall is transported to the wall, which will increase the temperature gradient.
Figure 5.13 illustrates the turbulent kinetic energy contour of the detached pin-fin arrays.
The turbulent kinetic energy levels provide a good indication of vortices generation, flow mixing
and energy transfer that explains the heat transfer characteristics in the experimental findings.
For the detached pin-fin (baseline) case, a wake is generated behind each pin that extends up to
the next row of pin-fins mounted on the opposite endwall. The size of this wake is largest at the
base of the pin-fin where the wake and the horseshoe vortex interact. Note that similar wake
characteristics with lower levels are observed in the broken rib case. Turbulent kinetic energy is
high along the rib, mainly attributed to the secondary flow that moves parallel along the rib
surface. This is consistent with the numerical study by Al-Qahtani et al. [84,85] using 45-deg
angled ribs and V-shaped ribs in square and rectangular channels. Higher levels of turbulent
kinetic energy are observed in the separated shear layer near the rib where the mainstream flow
and the recirculation interact. Thus, the fluid adjacent to the endwall is continuously mixing with
the core fluid which leads to better bulk flow mixing. This phenomena increases heat transfer on
the endwall.

75
Figure 5.14 Heat Transfer Coefficient on the Top Endwall
(b) Detached Pin-Fin with Broken Rib (BR)
(a) Detached Pin-Fin (Baseline)
(c) Detached Pin-Fin with Full Rib (FR)

76
Figure 5.14 illustrates the local heat transfer coefficient distribution of the detached pin-
fin arrays and their order from high to low is mainly attributed to the turbulence kinetic energy
and shear stress as discuss above. The heat transfer distribution is comparable to the
experimental results presented earlier in Figs 5.2 and 5.3. The horseshoe vortices in both the
detached pin-fin and detached pin-fin with broken rib arrays is preserved. As expected, the
horseshoe vortices in the full rib array are largely altered. In the broken rib array, higher heat
transfer occurs in the leading region of the rib due to flow impingement. The heat transfer along
the full rib is substantially higher than the neighboring endwall region. In addition, high heat
transfer is observed at the reattachment zone behind the full rib. However, there is a small
recirculation region immediately behind the full rib that resulted in low heat transfer. Overall, the
full rib case has the highest heat transfer compared to the other cases.
5.7 KEY FINDINGS
The present study performs a systematic investigation with respect to the effects of detached
spacing of pin-fin arrays on the heat transfer in a rib-roughened channel. The geometry and test
conditions are relevant to advanced cooling concepts with three-dimensional protruding
elements, combined with two-dimensional elements, for enhancement of turbine airfoil internal
cooling. The concept of implementing pin-fins with detached spacing between the pin-tip in the
rib roughened channel is to promote turbulent convection with separated shear layers induced
near the pin tips together with separation and reattachment effects from the ribs that could further
enhance the overall heat transfer.

77
The presence of broken ribs and full ribs has significant effect on endwall heat transfer
enhancement only. Broken ribs and full ribs are effective in enhancing the heat transfer on the
endwall only by gaining an additional 10%-20% as compared to the baseline cases. Fully bridged
pin-fins with full ribs provide the highest heat transfer factor on the endwall, ranging from 4.3-
4.9. Ribs, however, posed an adverse effect on the test domain. The presence of ribs which alter
the horseshoe vortices reduce the heat transfer on the pin-fins by 10% to 50% as compared to the
neighboring endwall. From the overall heat transfer enhancement standpoint, the baseline case of
C/D=1 remains as the best configuration among all cases that were explored. As the height of the
ribs constitutes approximately 6% of the channel height, the presence of ribs imposed
insignificant pressure loss as compared to the baseline cases. Based on the PI, the baseline case
of C/D=1 remains as the best configuration among all cases including the C/D=2 baseline and
broken rib cases. Overall comparison in terms of PI shows that broken rib cases outperform the
full rib cases by 10% to 20%.
78
6.0 FULLY BRIDGED TRIANGULAR, SEMI-CIRCULAR AND CIRCULAR PIN-
FIN ARRAYS
The objective of this study is to investigate the heat transfer and pressure drop characteristics of
three different pin-fin elements in a cooling channel. To the authors’ knowledge, there is no
information of this nature reported in the open literature. Review of literature suggests that
diamond shaped pin-fin array induces higher heat transfer enhancement than the circular pin-fin
array. Based on this notion, triangular and semi-circular shaped pin-fin elements which possess
half of the geometry of diamond and circular shaped pin-fin are explored. For the same flow
domain and inter-pin spacing, the triangular and semi-circular pin-fin arrays will contribute to
approximately 50% reduction in total pin-fin mass compared to the diamond and circular pin-fin
arrays. In this research study, three different triangular pin-fin configurations are explored and
the optimal configuration will be determined based on the heat transfer performance compared to
the semi-circular and circular pin-fin arrays. A cursory numerical study is conducted using
commercial available software, ANSYS, CFX to explore the heat transfer characteristics of the
triangular, semi-circular and circular pin-fin. Test results obtained from the numerical studies
will provide further insights of local heat transfer distribution and flow field that is crucial in
understanding the experimental findings in the later part of this research effort.

79
6.1 NUMERICAL MODELING APPROACH
Numerical analysis employs commercially available software, ANSYS CFX, in order to explore
the heat transfer and pressure characteristics of the single pin-fin element, i.e. triangular, semi-
circular and circular pin-fin. The simulation domain (width, W=63.5mm; height, H=25.4mm;
length, L =101.6mm) consists of one single pin-fin element that is positioned at 25.4mm
downstream from the inlet. The operating conditions for all cases are set to be the same, with
inlet air temperature, Tin maintained at 300K, and bottom and top wall temperature is constant at
350K. The pin-fin surface temperature is set as adiabatic condition. The Reynolds number based
on hydraulic diameter is 15,000. The pressure at the exit is set to be atmospheric pressure. The
mesh for each case consists of approximately 9.0 million grids. The grids spacing of the first cell
normal to the wall corresponding to y+ values are between 10-20, to ensure the validity of
scalable wall function option in this numerical study. In this study, the governing equations used
are the ensemble-averaged continuity, incompressible Navier-Stokes, and energy equations for
an ideal gas. The effects of turbulence were modeled by the two-equation realizable k-ɛ model
with scalable wall functions. All iterations were continued until all residuals for all equations
plateau to ensure convergence to steady state condition. The root mean square (rms) normalized
scaled values of the equation residuals were always less than 10-5
for three component velocity,
energy, turbulent kinetic energy, dissipation rate and continuity equation.
Figure 6.1 illustrates the turbulent kinetic energy distribution for each pin-fin element on
the endwall. Note that the semi-circular pin-fin has the shortest wake behind the pin-fin
compared to the circular and triangular pin-fin. Earlier separation is observed in the semi-circular
pin-fin and resulted in the generation of longer wakes behind the pin-fin. The main source of

80
additional wakes behind the triangular pin-fin is ultimately caused by the sharp edges. The wake
in both semi-circular and triangular pin-fin can extend up to six times the pin diameter. In
addition, the wake generated by the triangular pin-fin tends to spread wider in the spanwise
direction. At the base of leading region for both circular and semi-circular pin-fin, the size of the
wake is the largest, where the flow is accelerated and when the horseshoe vortex wrapped around
each pin-fin. As the triangular pin-fin is more streamlined, no wake is generated at the leading
region.

81
Figure 6.1 Turbulent Kinetic Energy Distributions Surrounding the Pin-Fin Element
(a) Circular Shaped Pin-Fin
(b) Triangular Shaped Pin-Fin
(c) Semi-Circular Shaped Pin-Fin

82
Figure 6.2 illustrates the pressure loss in the test domain for different pin-fin elements.
With similar geometry at the leading region, circular and semi-circular shaped pin fin reveals the
same pressure losses profile except after the first quadrant. The pressure distribution is lower at
the back of the semi-circular pin-fin, driving more flow into that region, resulting in a higher heat
transfer immediately at the corresponding region behind the pin. With the presence of two sharp
edges at the trailing region that cause significant flow separations, substantially low pressure
distribution is observed in the triangular pin-fin case.
Figure 6.2 Pressure Distribution Surrounding the Pin-Fin Element
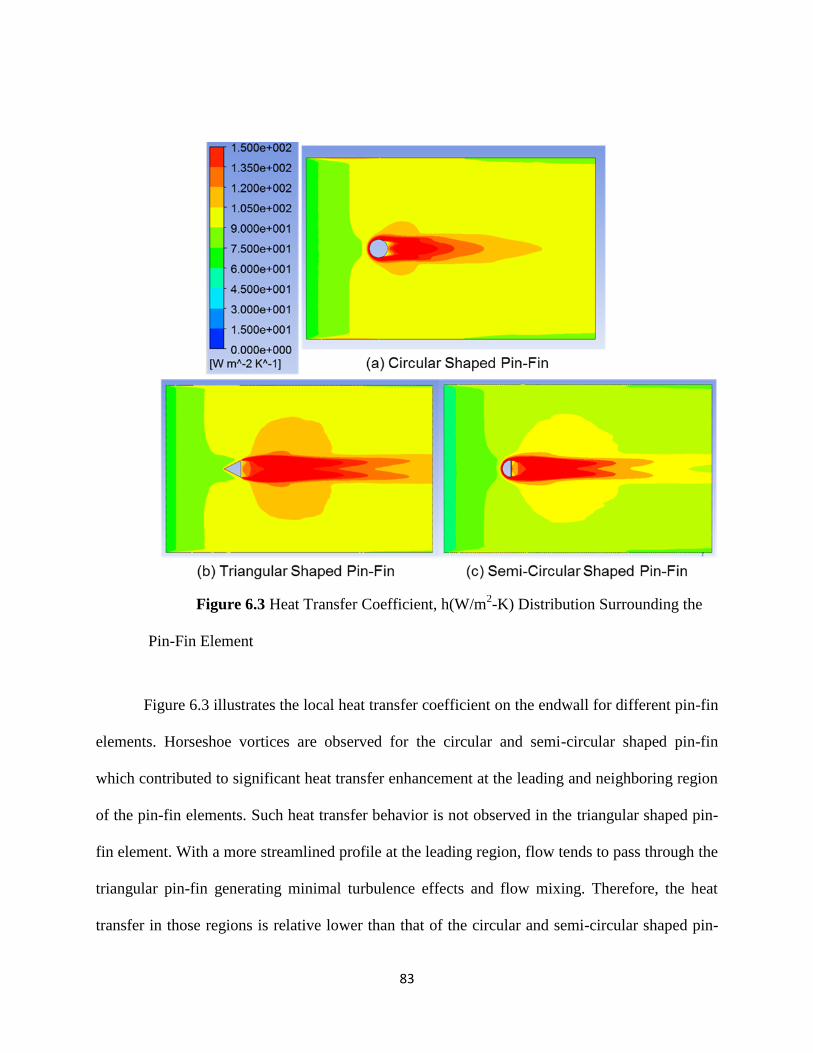
83
Figure 6.3 illustrates the local heat transfer coefficient on the endwall for different pin-fin
elements. Horseshoe vortices are observed for the circular and semi-circular shaped pin-fin
which contributed to significant heat transfer enhancement at the leading and neighboring region
of the pin-fin elements. Such heat transfer behavior is not observed in the triangular shaped pin-
fin element. With a more streamlined profile at the leading region, flow tends to pass through the
triangular pin-fin generating minimal turbulence effects and flow mixing. Therefore, the heat
transfer in those regions is relative lower than that of the circular and semi-circular shaped pin-
Figure 6.3 Heat Transfer Coefficient, h(W/m2-K) Distribution Surrounding the
Pin-Fin Element

84
fin. However, heat transfer increases substantially at the trailing region of the triangular shaped
pin-fin. This is mainly due to additional wakes generated by the two sharp edges, which
eventually lead to better mixing and heat transfer enhancement. In addition, the wakes generated
by the triangular pin-fin also has wider coverage compared to the circular and semi-circular pin-
fins.
6.2 TEST SECTION AND EXPERIMENTAL APPROACH
The test channel used to accomplish different tasks as described in the following section
simulates an internal cooling passage in a gas turbine airfoil. The test section is rectangular
channel of 76.2mm x 25.4mm (3.0” x 1.0”) made of 25.4mm thick Plexiglas that exhibits low
thermal conductivity, which is crucial for the one-dimensional, semi-infinite heat transfer model
on which the local heat transfer coefficient on the surfaces is determined. Circular, semi-circular
and triangular shaped pin-fins are made from 6.35mm (1/4”) diameter aluminum rods and square
bar stock to ensure a very small Biot number so that each pin can be considered as a lump unit
with uniform temperature. One end of the pin-fins are threaded and screwed into the Plexiglas
by 3.2mm (⅛”).
The experiments were conducted using the test rig as shown in Fig. 3.1, described in
earlier section based on the novel transient liquid crystal technique. Table 6.1 summarizes the
test cases explored in this study. Figure 6.4 and 6.5 illustrates the pin-fin elements and top view
of the test plate with triangular, semi-circular and circular pin-fin arrays explored in present
study. All pin-fin elements have the same characteristics width, D=6.25mm. All pin-fins are fully
bridged between both endwalls, having the total length, H of 25.4mm, which is the same as the

85
Table 6.1 Test Cases for Triangular, Semi-Circular and Circular Pin-Fin Arrays
channel’s height, E. Only staggered array pin-fin configurations are explored in this study, as it
is proven in most literature that staggered arrays outperform inline arrays. For triangular pin-fin
arrays, there are three different configurations corresponding to different inter-pin spacing as
presented in Table 6.1. Larger transverse pitch is introduced to the TRI2 and TRI3 cases as based
on the numerical findings, triangular pin-fin is capable of generating wider wakes that contribute
to higher heat transfer in the lateral region as compared to the circular and semi-circular pin-fin
case. The TRI1 and TRI3 cases have comparable number of pin-fins that is equal to 77 and 73.
Having the largest pitch in both streamwise and transverse direction, the TRI2 case has the least
Case Name Pin-Fin Shape SL/D ST/D
1 TRI1 Triangular 2.5 2.5
2 TRI2 Triangular 2.5 3.5
3 TRI3 Triangular 2.0 3.5
4 SEMI-C Semi-Circular 2.5 2.5
5 CIR Circular 2.5 2.5
Figure 6.4 Pin-Fin Element Geometry

86
number of pin-fins that is equal to 59. Both semi-circular and circular pin-fin arrays are based on
typical inter-pin spacing of 2.5 times the pin diameter in both transverse pitch and longitudinal
pitch, i.e., S/D=X/D=2.5. The circular pin-fin array, case 5, is referred as baseline case in
comparison to all other test cases as shown in Table 6.1. The Reynolds number, based on the
hydraulic diameter of the unobstructed cross-section (Dh) and bulk mean velocity (U) in the
channel, as expressed below, ranges from 10,000 to 25,000.

87
Case 1
Case 2
Case 3
Case 4
Case 5
Figure 6.5 Top View of Test Plate with Different Pin-Fin Configurations

88
6.3 LOCAL HEAT TRANSFER COEFFICIENT DISTRIBUTION
Figures 6.6-6.8 illustrate the local heat transfer coefficient, h, of the triangular pin-fin arrays at
different Re denote as “TRI1”, “TRI2” and “TRI3”. Based on the numerical findings in the
previous section showing that triangular pin-fin is capable of generating wakes in the wider
spanwise direction, the triangular pin-fin in the TRI2 and TRI3 cases are arranged in a larger
transverse pitch.
The test results reveal similar heat transfer trend in all triangular pin-fin arrays. Heat
transfer coefficient increases from the first row and reaches a peak value before decreasing
towards a periodic level when the temperature and flow field satisfy the fully developed
condition. For the circular shaped pin-fin array, peak heat transfer is achieved at the third or the
fourth row. This is consistent with the previously reported findings [5,6, 11-14]. Unlike the
circular pin-fin array, a significant improvement from the triangular pin-fin arrays is that h
continues to increase after the fourth row. Peak h are attained between the sixth and eighth row.
Further downstream, h in the triangular pin-fin arrays remains fairly constant throughout the
entire domain. Further comparison shows that the TRI3 case with the largest transverse pitch,
i.e., ST/D=3.5, and smallest longitudinal pitch, i.e., SL/D=2.0, has higher h on the pin-fins
compared to TRI1 and TRI2 cases. However, the TRI1 case has more uniform h than the TRI2
and TRI3 cases. This concludes that even though triangular pin-fin has sharp edges, that are
capable of generating wakes in a wider spanwise direction, having larger transverse pitch will
cause non-uniformity in heat transfer distribution within the same test domain. Also, the heat
transfer on the endwall for all triangular pin-fin arrays is relatively higher than the neighboring

89
pin-fins. In addition, heat transfer on the endwall appears to be fairly uniform after the eighth
row.
Figure 6.9 illustrates the heat transfer coefficient distribution for three different arrays
using triangular, semi-circular and circular pin-fin elements plotted at Re=25,000. These three
arrays have the same inter-pin spacing as presented in Table 1. Semi-circular and circular shaped
pin-fin arrays reveal similar heat transfer pattern and has the peak h value at the third or fourth
row before decreasing towards a fully developed value. Due to the presence of horseshoe
vortices in the circular and semi-circular pin-fin arrays, the first few rows of both arrays, h values
of these pin-fins is higher than those of triangular pin-fin array. However, this trend is reversed
as the flow progresses downstream. Because the triangular pin-fin have a more streamlined
profile, the h at the leading region is lower than that of circular and semi-circular pin-fins. Such
characteristics are in agreement with the numerical findings presented earlier. In addition, one
significant advantage from the triangular pin-fin array is that the h on the endwall is higher than
that of circular and semi-circular pin-fin arrays.
An overall comparison proves that triangular pin-fin has higher h on both pin-fins and
endwall than the semi-circular and circular pin-fin arrays. This is mainly due to the presence of
sharp edges that generate additional wake, resulted in better flow mixing, thus enhancing the
overall heat transfer performance. In addition, the triangular pin-fin array has more uniform h on
the endwall throughout the entire test domain.

90
Figure 6.6 Local Heat Transfer Coefficient Distribution (TRI1)
h(W/m2-K)

91
Figure 6.7 Local Heat Transfer Coefficient Distribution (TRI2)
h(W/m2-K)

92
Figure 6.8 Local Heat Transfer Coefficient Distribution (TRI3)
h(W/m2-K)

93
Figure 6.9 Local Heat Transfer Coefficient Distribution of Triangular, Semi-
Circular and Circular Shaped Pin-Fin Arrays
h (W/m2-K)

94
6.4 ROW-RESOLVED HEAT TRANSFER COEFFICIENT DISTRIBUTION
Figure 6.10 presents the row-resolved average h values of the pin-fins only of all arrays at
varying Re. Both the TRI1 and TRI2 cases, which have the same longitudinal pitch, but different
transverse pitch, reveal similar heat transfer pattern and comparable results. Even though the
TRI2 case has pin-fins with transverse pitch that is approximately 30% higher than the TRI1
case, the row-resolved average h values of pin-fins in both cases appear to be comparable. The
TRI3 case which has the smallest longitudinal pitch, i.e., SL/D=2.0, has the best heat transfer
performance. This becomes more significant as Re increases. However, for the first few rows,
the circular pin-fin array exhibits much higher h on the pin-fins than all triangular pin-fin arrays.
This is mainly attributable to the horseshoe vortices that are clearly shown in the Fig. 6.3.
However, after reaching the peak h, this trend is reversed at the downstream region. Unlike the
circular pin-fin array, all triangular pin-fin arrays have more uniform h values throughout the
entire domain. Towards the downstream region, the h for all triangular pin-fin arrays decreases
moderately towards a fully developed value.
Figure 6.11 reveals the averaged row-resolved heat trnasfer coefficient of the pin-fin
elements for triangular, semi-circular and circular pin-fin arrays. From the first row up to the
fourth row, semi-circular pin-fin array has lower h values as compared to the baseline circular
pin-fin array. However, towards downstream, h of the semi-circular and circular pin-fin arrays
appear to be comparable, and underperform as compared to the triangular pin-fin array. One
plausible reason that explains the difference of such phenomena between the triangular and
circular pin-fin arrays is that as the flow progresses downstream, the turbulence intensity in the
circular pin-fin array decays more significantly. This resulted in a substantial reduction in heat

95
transfer enhancement. Therefore, one significant advantage of the triangular pin-fin arrays is
providing more uniform heat transfer while minimizing hot spots in the cooling channel.
Figures 6.12 and 6.13 illustrates the averaged row-resolved heat transfer enhancement
for the triangular, semi-circular and circular pin-fin arrays normalized by the fully developed
smooth channel based on the Dittus-Boelter correlation as presented in Eq. (2.17). While the
result presented by Chyu et al. [13], reveals that generally, circular pin-fin array has superior heat
transfer performance compared to both diamond and cubic pin-fin arrays. However, current
experimental findings in Figs. 6.12 and 6.13 reveal an opposite trend. Overall, triangular pin-fin
arrays have heat transfer enhancement ranging between 3.0-5.0, which is approximately 10%-
25% higher than that of both semi-circular and circular pin-fin arrays. Figure 6.13 reveals that
overall heat transfer performance of semi-circular pin-fin array is slightly higher than that of
circular pin-fin array, except for the first few rows.

96
Figure 6.10 Row-Resolved Heat Transfer (Triangular Pin-Fins)
Figure 6.11 Row-Resolved Heat Transfer (Triangular, Semi-Circular and Circular
Pin-Fins)

97
Figure 6.12 Row-Resolved Heat Transfer Enhancement for Triangular Pin-Fin
Arrays
Figure 6.13 Row-Resolved Heat Transfer Enhancement for Triangular, Semi-
Circular

98
6.5 HEAT TRANSFER ENHANCEMENT AND PRESSURE LOSS
Heat transfer enhancement contributed by the endwall surface only with varying Re for all arrays
are plotted in Fig. 6.14. While results in the previous section revealed that TRI3 has the best
heat transfer performance on the pin-fins, however, based on the heat transfer enhancement on
the endwall, TRI1 outperforms all arrays. The TRI1 case has the highest heat transfer
enhancement ranging from 4.0-4.8, that is approximately 20% higher than that of the circular
pin-fin array. Interestingly, the result in Fig. 6.13 reveals that with approximately 20% lesser
number of pin-fins than the TRI3 case, the TRI2 case exhibits slightly higher heat transfer
enhancement than that of TRI3 case. Detailed comparisons between the results from Figs. 6.12
and 6.14 suggests that under the same flow condition and different inter-pin spacing, there is a
trade-off between the heat transfer on the endwall and pin-fins. While Fig. 6.14 shows that the
heat transfer enhancement on the endwall for the TRI2 case is higher than that of TRI3 case, the
result in Fig. 6.12 reveals an opposite trend whereby the heat transfer on the pin-fins is
penalized. Semi-circular pin-fin array has the lowest heat transfer enhancement, up to about 10%
lower than the baseline case. TRI2 and TRI3 cases slightly underperform compared to the TRI1
case, but has higher heat transfer enhancement than that of baseline case by approximately 5-
10%.
The total heat transfer enhancement for each pin-fin array, NuT, is determined based on
the heat transfer contributed by all participating surfaces (i.e., pin-fins and endwall), as shown in
Eq. (2.15), weighted by the wetted area and normalized by the heat transfer of a fully developed
channel calculated from the Dittus-Boelter correlation as shown in Eq. (2.17). Figure 6.15
illustrates the overall heat transfer enhancement by considering the magnitude of heat transfer
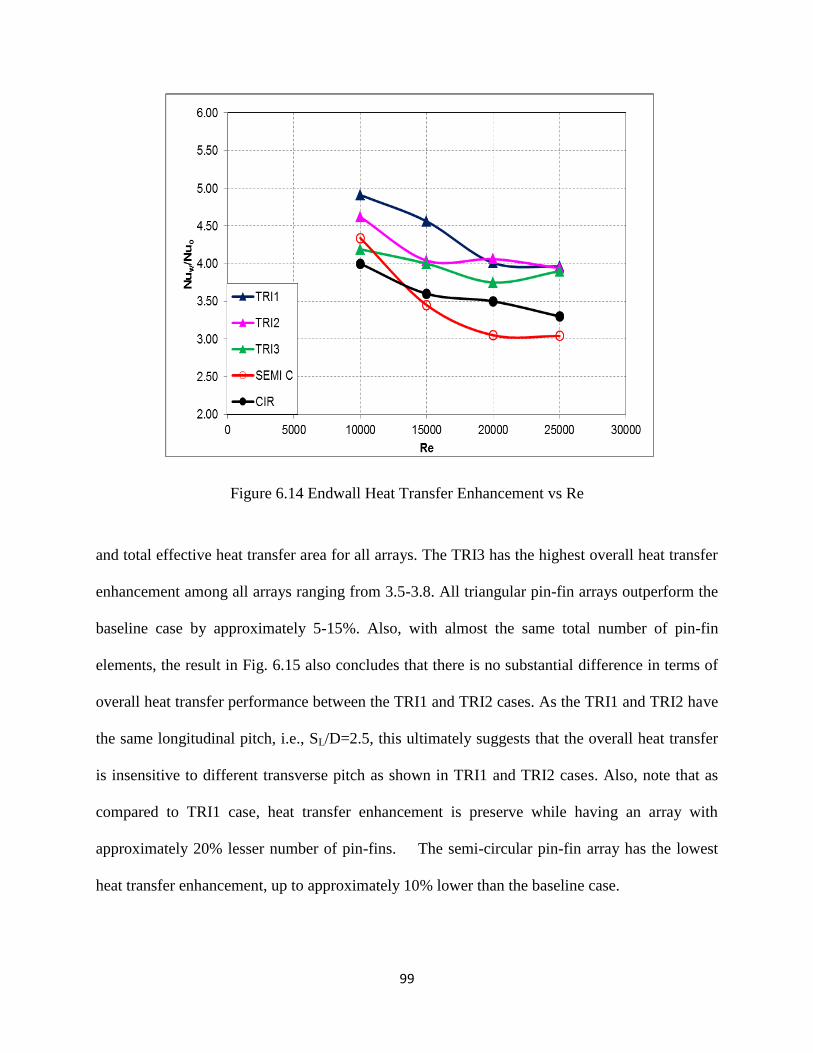
99
and total effective heat transfer area for all arrays. The TRI3 has the highest overall heat transfer
enhancement among all arrays ranging from 3.5-3.8. All triangular pin-fin arrays outperform the
baseline case by approximately 5-15%. Also, with almost the same total number of pin-fin
elements, the result in Fig. 6.15 also concludes that there is no substantial difference in terms of
overall heat transfer performance between the TRI1 and TRI2 cases. As the TRI1 and TRI2 have
the same longitudinal pitch, i.e., SL/D=2.5, this ultimately suggests that the overall heat transfer
is insensitive to different transverse pitch as shown in TRI1 and TRI2 cases. Also, note that as
compared to TRI1 case, heat transfer enhancement is preserve while having an array with
approximately 20% lesser number of pin-fins. The semi-circular pin-fin array has the lowest
heat transfer enhancement, up to approximately 10% lower than the baseline case.
Figure 6.14 Endwall Heat Transfer Enhancement vs Re

100
Figure 6.15 Total Heat Transfer Enhancement vs Re
Figure 6.16 Pressure Drop vs Re

101
Heat transfer enhancement is always penalized by the pressure loss in the system. The
pressure loss characteristics of all arrays presented in Fig. 6.16 are based on f/fo, where f is the
friction factor, defined by Eq. (2.18) and fo is the overall friction factor normalized by
thecorresponding data for fully developed flow in a smooth channel developed by Petukhov as
shown in Eq. (2.19).
The parameter dP/dx represents the pressure drop across the test section by measuring the
streamwise static pressure distributions upstream and downstream of the test section. Figure 6.16
shows the pressure loss of the test cases with varying Re. The TRI1 and TRI3 cases have the
largest pressure loss due to the friction and form drag induced by the triangular pin-fins. Larger
surface area from each triangular pin-fin together with sharp edges generate larger friction and
form drag compared to the other pin-fin elements. Semi-circular pin-fin array has a higher
pressure loss compared to the baseline case. The TRI2 case, which has approximately 20% lesser
pin-fins than TRI1 and TRI3 cases, understandably inherits lower pressure loss than the previous
cases. With more pin-fin elements, the semi-circular pin-fin array, exhibits higher pressure loss
than the TRI2 case.
Achieving an optimal design point makes an important issue of the heat transfer design.
One of measures for evaluating the heat transfer gain and pressure loss penalty is the
performance index, PI as shown in Eq. (2.20). Figure 6.17 shows the performance index for the
test cases versus the Reynolds number. Overall, the efficiency index decreases moderately with
Reynolds number. The result shows that the inter-pin spacing of the triangular pin-fin arrays are
insensitive to the performance index as all triangular pin-fin arrays have comparable value of
performance within the test Reynolds number. With higher pressure loss than that of circular pin-
fin array but lowest heat transfer enhancement, the semi-circular pin-fin array gives the lowest

102
Figure 6.17 Performance Index vs Re
performance index. The circular pin-fin array has comparable performance index as compared to
the triangular pin-fin array. In addition, the circular pin-fin array seems to be a preferred choice,
if a balance between heat transfer enhancement and induced friction loss is an important concern.

103
6.6 KEY FINDINGS
The present study performs a detailed experimental investigation of three different pin-fin
elements, i.e., triangular, semi-circular and circular shaped pin-fins in five different arrays. The
concept of using triangular and semi-circular shaped pin-fin is to explore and verify the heat
transfer and flow characteristics of both arrays as compared to the typical circular pin-fin array.
Experimental results of the local heat transfer coefficient distributions suggest that the
triangular shaped pin-fin arrays are more uniform compared to the semi-circular and circular
pin-fin arrays. Having the largest number of pin-fins and arranged in a dense configuration, the
TRI3 case has the highest overall heat transfer enhancement ranging between 3.5-3.8, that is
approximately 5%-15% higher than that of the circular pin-fin array. This can be verified by the
numerical findings that although the triangular pin-fin has lower heat transfer at the leading
region as compared to the circular pin-fin, but, due to the presence of sharp edges at the trailing
region, greater turbulence intensity together with the generation of separated shear layers has
eventually leads to higher heat transfer enhancement. As the TRI1 and TRI2 cases show
comparable heat transfer enhancement, this suggests that the heat transfer performance of the
triangular pin-fin arrays is insensitive to the transverse spacing. The semi-circular pin-fin array
has the lowest heat transfer performance ranging from 2.7-3.4. However, as the semi-circular
pin-fin only occupied 50% of the footprint given by the circular pin-fins in the same projected
area, this allows one to improve the heat transfer performance by increasing the number of semi-
circular pin-fin elements in the same test domain based on smaller inter-pin spacing. Such an
approach not only can contribute to further heat transfer enhancement of the entire test domain,
but also reduce the overall mass of the entire test channel as each semi-circular pin-fin only

104
accounts for one half the total weight of a circular pin-fin. All triangular pin-fin arrays exhibit
higher pressure losses compared to the other arrays due to larger friction drag and form drag.

105
7.0 CONCLUSIONS AND FUTURE WORK
7.1 CONCLUSIONS AND MAJOR ACCOMPLISHMENTS
This dissertation presents detailed experimental studies of internal cooling passages based on
several innovative cooling concepts by introducing detached pin space, various three-
dimensional elements (i.e., circular, triangular and semi-circular pin-fins, and the effects of rib-
turbulators to the detached circular pin-fin arrays are explored. The major findings of this
research study for all test cases are summarized below based on the following criteria:
1. Heat Transfer Enhancement
In order to maintain the structural integrity and reliability of the gas turbine airfoil, the
cooling performance becomes a main criterion that shall be considered in the design phase.
Therefore, with the highest overall heat transfer enhancement that range from 3.6-4.2, detached
pin-fin case, C/D=1 becomes the ideal candidate for internal cooling passages among all tested
cases. The semi-circular pin-fin array remains as the worst performer with heat transfer
enhancement ranging from 2.8-3.4. However, with the typical standard inter-pin spacing
normalized by the pin diameter of 2.5, the semi-circular pin-fin array only occupied
approximately 50% footprint of the entire flow domain compared to the circular pin-fin array.

106
This presents an option of improving the heat transfer performance of the semi-circular pin-fin
array by increasing the number of pin-fin elements with smaller inter-pin spacing.
The presence of broken-rib and full-rib only have significant impact towards the heat
transfer enhancement on the endwall due to additional separated shear layer and vortices
generated by the rib-turbulators. The results have shown that the broken-rib and full-rib has
effectively enhanced the heat transfer on the endwall by approximately 10-20% compared to the
baseline cases. The fully bridged pin-fin with full rib has the highest heat transfer enhancement
on the endwall ranging from 4.3-4.9. In addition, the triangular pin-fin array, TRI1 also has
comparable heat transfer enhancement on the endwall compared to the fully bridged pin-fin and
full rib case that range from 4.0-4.8. Also, the additional advantage of the triangular pin-fin array
is that the heat transfer distribution over the entire array is much more uniform compared to other
test cases. This will greatly reduce or eliminate the hot spots in the turbine airfoil. For some gas
turbine designers, the heat transfer enhancement on the endwall surface is more critical as this is
the main effective region at the metal substrate layer that is exposed to high thermal load.
Therefore, higher heat transfer enhancement on the endwall will significantly reduce the
temperature of the superalloy metal substrate. The triangular pin-fin array of TRI1 and fully
bridged pin-fin with full rib appeared to be the preferred choice for turbine designer among all
test cases if the heat transfer enhancement on the endwall.
2. Pressure Loss Coefficient
The pressure loss coefficient in the detached pin-fin array appears to be a strong function
of pin-fin height. Higher pin-fin height has resulted in a higher pressure loss due to greater
restriction to the bulk flow. Interestingly, the test results revealed that the presence of the broken-

107
rib and full-rib do not impose significant pressure loss to the pin-fin arrays, which resulted in a 5-
10% increment in pressure loss. The triangular pin-fin arrays have the highest pressure loss
among all test cases. The pressure loss in the triangular pin-fin arrays is approximately 20-30%
higher than that of fully bridged circular pin-fin array.
3. Performance Index
In order to achieve an optical design, the performance of each test case can be justify
based on the performance index, PI. The detached pin-fin case, C/D=1 is the ideal case that shall
be considered as it has the highest overall heat transfer enhancement with moderate pressure loss
as compared to other detached pin-fin arrays. The semi-circular pin-fin array has the lowest
performance index, mainly due to the lowest heat transfer enhancement and high pressure loss.
All broken rib and full rib cases seem to have lower performance index than the baseline cases
due to lower heat transfer enhancement. Overall, the detached pin-fin arrays and also the
detached pin-fin with broken rib and full rib arrays appear to have higher performance index than
the baseline case, circular pin-fin array by approximately 5-40%. The performance index from
the triangular pin-fin arrays is slightly higher than that of the baseline case, circular pin-fin array
due to higher pressure loss.
4. Manufacturability
Based on current manufacturing technology, any pin-fin element that possessed sharp
edges, i.e., triangular and semi-circular pin-fin will pose a great challenge in casting the pin-fin
array on the internal cooling channel. Up to date, the detached pin-fin arrays and the broken rib
and full rib arrays are considered as reasonable designs that can be realized by using
breakthrough manufacturing technique with better product development and manufacturing

108
processes introduced by Mikrosystems, Inc[86]. Currently, the University of Pittsburgh and
National Energy Technology Laboratory (NETL) are collaborating with Mikrosystems in
designing and fabrication of test coupons with realistic internal cooling configurations involving
pin-fin arrays using superalloy metal substrate. Upon completion, these test coupons will be
tested at near-room temperature at the University of Pittsburgh prior of further experimental
studies at realistic gas turbine condition using the high temperature pressurized combustion rig in
NETL(Morgantown).
Due to the manufacturing constraints and limitation, turbine design engineers tend to
eliminate the sharp edges by replacing them with a small radius. Therefore, in the actual turbine
airfoil, the triangular pin-fin will have a small radius, i.e., a fillet at each sharp edge. In addition,
even if the sharp edges are preserved, after the turbine airfoil is put into service for a certain
period, the sharp edges will be mainly eroded by the relatively hot coolant at high velocity. Other
than that, any debris or particles (drawn in by during the compression stage) which travel
together with the coolant might be deposited/adhered to any surfaces in the internal cooling
passages. This will ultimately altered/deformed the shape of the pin-fin elements as well. Under
a more severed condition, the internal cooling passages might be clogged. Overall, for near term
application, the detached pin-fin arrays, broken rib and full rib arrays will be the preferred
choice, from the manufacturing point of view and heat transfer performance.

109
7.2 FUTURE WORK
A significant amount of research work on exploring internal cooling has been accomplished in
the present work. Further investigations with innovative cooling concepts may be directed
towards a thorough study and maturity of the technologies for implementation in the state-of-the-
art gas turbines.
1. The ideal pin-fin and rib configurations can be applied in the test coupon using superalloy
metal substrate. Detailed experimental studies shall be conducted to characterize the heat
transfer performance of the coupon under near-room temperature and also realistic
turbine temperature to ensure the performance of such internal cooling design.
2. The research effort is focused on triangular pin-fin array with sharp edges and also
circular pin-fin that is perfectly perpendicular to the endwall. Further experimental study
can be extended using innovative cooling configuration involving pin-fin and rib-
turbulators with realistic effects, i.e., rounded corner and inclination. The presence of
rounded corner and pin-fin inclination effects will pose certain effects towards the heat
transfer performance in the entire pin-fin array.
3. Heat transfer in the downstream region is understandably lower and continues to decrease
as the driving potentials namely the turbulence intensity and temperature difference
between the wall and bulk start to decrease. Injection holes can be place behind the pin-
fins after the first few rows where the heat transfer starts decreasing. Additional coolant
injected from the holes will create additional vortices that eventually contribute grater
heat transfer in the entire domain.

110
BIBLIOGRAPHY
[1] Chyu, Minking, “Recent Advances in Turbine Heat Transfer-with A View of
Transition to Coal Gas Based Systems,” International Heat Transfer Conference,
IHTC-14.
[2] Alvin, M.A., Pettit, F., Meier, G, Yanar, N., Chyu, M., Mazzotta, D., Slaughter,
W., Karaivanov, V., Kang, B, Feng, C., Chen, R., and Fu, T.C., “Materials and
Component Development for Advanced Turbine Systems,” 5th International
Conference on Advances in Materials Technology for Fossil Power Plants, Marco
Island, Florida, October 2-5, 2007.
[3] Bunker, R.S., 2007, “Gas Turbine Heat Transfer: Ten Remaining Hot Gas Path
Challenges,” J. of Turbomachinery, Vol. 129, pp. 193-201.
[4] Han, J.C., Dutta, S., and Ekkad, S.V., 2000, “Gas Turbine Heat Transfer and Cooling
Technology,” Taylor and Francis.
[5] Han, J.C., and Chen, H.C., 2006, “Turbine Blade Internal Cooling Passages with Rib
Turbulators,” J. of Propulsion and Power, Vol. 22, No.2, pp. 226-248.
[6] Chyu, M.K., Natarajan, V., 1996, “Heat Transfer on the Base Surface of Three
Dimensional Protruding Elements,” Int. J. of Heat and Mass Transfer, Vol. 39, No.14, pp.
2925-2935.
[7] Goldstein, R.J., Chyu, M.K., and Hain R.C., 1985, “Measurement of Local Mass Transfer
on a Surface in the Region of the Base of a Protruding Cylinder with a Computer-
Controlled Data Acquisition System,” Int. J. of Heat and Mass Transfer, Vol. 28, No.5,
pp. 977-985.
[8] Ames, F.E., Nordquist, C.A., and Klennert, L.A., 2007, “Endwall Heat Transfer
Measurements in a Staggered Pin Fin Array with an Adiabatic Pin,” Proc. ASME Turbo
Expo 2007, GT2007-27432.
[9] Ostanek, J.K. and Thole, K.A., 2011, " Flowfield Measurements in a Single Row of Low
Aspect Ratio Pin-Fins," ASME Turbo Expo paper GT2011-45757.

111
[10] Armstrong, J., and Winstanley, D., 1988, “A Review of Staggered Array Pin Fin Heat
Transfer for Turbine Cooling Applications,” ASME J. Turbomach., 110, pp. 94-103.
[11] VanFossen, G.J., 1982, “Heat Transfer Coefficients for Staggered Arrays of Short Pin
Fins,” ASME J. Eng. Power, 104, pp. 268-274.
[12] Al Dabagh, A. M., and Andrews, G.E., 1992, “Pin-Fin Heat Transfer: Contribution of the
Wall and the Pin to the Overall Heat Transfer,” ASME Paper 92-GT-242.
[13] Chyu, M.K., Hsing, Y.C., Shih, T.I.-P., and Natarajan, V., 1999, “Heat Transfer
Contributions of Pins and Endwall in Pin-Fin Array: Effects of Thermal Boundary
Condition Modeling,” ASME J. Turbomach., 121, pp. 257-263.
[14] Chyu, M.K., Siw, S. and Moon, H.K., 2009, “Effects of Height-to-Diameter Ratio of Pin
Element on Heat Transfer from Staggered Pin-Fin Arrays,” GT2009-59814, ASME
Turbo Expo 2009, Orlando, June 8-12, 2009.
[15] Chyu, M.K., and Goldstein, R.J., 1991, “Influence of an Array of Wall-Mounted
Cylinders on the Mass Transfer from a Flat Surface,” Int. J. Heat Mass Transfer, 34(9),
pp. 2175-2186.
[16] Chyu, M.K., 1990, “Heat Transfer and Pressure Drop for Short Pin-Fin Arrays and Pin-
Endwall Fillet,” ASME Trans.-J. Heat Transfer, 112 (4), pp. 926-932.
[17] Won, S.Y., Mahmood, G.I., and Ligrani, P.M., 2004, “Spatially-Resolved Heat Transfer
and Flow Structure in a Rectangular Channel with Pin Fins,” Int. J. of Heat and Mass
Transfer, 47, pp. 1731-1743.
[18] Park, J.S., Kim, K.M., Lee, D.H., Cho, H.H., and Chyu, M.K., 2008, “Heat Transfer on
Rotating Channel With Various Height of Pin Fins,” ASME Turbo Expo, GT2008-50783.
[19] Chang, S.W., Yang, T.L., Huang C.C., and Chiang, K.F., 2008, “Endwall Heat Transfer
and Pressure Drop in Rectangular Channels with Attached and Detached Circular Pin–
Fin Array,” Int. Journal of Heat and Mass Transfer, 51, pp. 5247-5259.
[20] Sara, O.N., 2003, “Performance Analysis of Rectangular Ducts with Staggered Square
Pin Fins,” Energy Convers. Manage., 44, pp. 1787-1803.
[21] Dogrouz, M.B., Urdaneta, M., and Ortega, A., 2005, “Experiments and Modeling of the
Hydraulic Resistance and Heat Transfer of In-line Square Pin fin Heat Sink with Top By-
pass Flow,” Int. J. of Heat and Mass Transfer, 48, pp. 5058-5071.
[22] Sparrow, E.M., Stahl, T.J., and Traub, P., 1984, “Heat Transfer Adjacent to the Attached
End of a Cylinder in Crossflow,” Int. J. of Heat and Mass Transfer, Vol. 27, pp. 233-242.

112
[23] Matsumoto, R., Kikkawa, S., and Senda, M., 1997, “Effect of Pin Fin Arrangement on
Endwall Heat Transfer” JSME Int. Journal Series B, Vol. 40, No. 1, pp. 142-151.
[24] Lyall, M.E., Thrift, A.A., Thole, K.A. and Kohli, A., 2007, “Heat Transfer from Low
Aspect Ratio Pin Fins” ASME Turbo Expo 2007: Power for Land, Sea and Air, GT2007-
27431.
[25] Simoneau, R.J., and VanFossen, G.J., 1984, “Effect of Location in an Array on Heat
Transfer to a Short Cylinder in Crossflow,” J. of Heat Transfer, Vol. 106, pp. 42-48.
[26] Uzol, O, and Camci, C., 2001, “Elliptical Pin-Fins as an Alternative to Circular Pin-Fins
for Gas Turbine Blade Cooling Applications, Part 1: Endwall Heat Transfer and Total
Pressure Loss Characterisitics,” ASME Paper No.2001-GT-0180.
[27] Lafleur, Ronald S, United Technologies Corporation. Method for Cooling a Wall Within
a Gas Turbine Engine. EP 1 617 043 B1. 2008
[28] Chyu, M.K., Siw, S., Karaivanov, V., and Alvin, M.A., “Aerothermal Challenges in
Syngas, Hydrogen-Fired and Oxy-fuel Turbines: Part II – Effects of Internal Heat
Transfer,” J. Thermal Science and Engineering Applications, ASME Transaction, Vol. 1,
011003, 2009.
[29] Siw, S., Karaivanov, V. G., Slaughter, W. S., Chyu, M. K. and Alvin, M. A. 2009,
“Influence of Internal Cooling Configuration on Metal Temperature Distribution of
Future Coal-Fuel Based Turbine Airfoils,” ASME Turbo Expo 2009, GT2009-59289.
[30] Ganmol, P., Chyu, M.K., Shih, T.I.P., and Alvin, M.A., 2010, “Effects of 90-Deg Jet
Inlet on Heat Transfer from Staggered Pin Fin Arrays” ASME-AIT-UIT 2010
Conference on Thermal and Environmental Issues in Energy Systems.
[31] Steuber, G.D., and Metzger, D.E., 1986, “Heat Transfer and Pressure Loss Performance
for Families of Partial Length Pin Fin Arrays in High Aspect Ratio RectangularDucts,”
8th
International Heat Transfer Conference, Vol 6, pp. 2915-2920.
[32] Arora, S.C. and Abdel-Messeh, W., 1989, “Characteristics of Partial Length Circular Pin
Fins as Heat Transfer Augmentators for Airfoil Internal Cooling Passages,” ASME Paper
89-GT-87.
[33] Metzger, D. E., Fan, C. S., and Haley, S. W., 1984, "Effects of Pin Shape and Array
Orientation on Heat Transfer and Pressure Loss in Pin Fin Arrays," Journal of
Engineering for Gas Turbines and Power, 106(1), pp. 252-257.
[34] Uzol, O. and Camci, C., 2005, "Heat Transfer, Pressure Loss and
Flow Field Measurements Downstream of Staggered Two-Row Circular and Elliptical
Pin Fin Arrays," Journal of Heat Transfer, 127(5), pp. 458-471.

113
[35] Chyu, M.K., Yen, C.H., and Siw, S.C., 2007, “Comparison of Heat transfer from
Staggered Pin-Fin Arrays with Circular, Cubic and Diamond Shaped Elements,” ASME
Paper No. GT2007-28306.
[36] Lee, E., Wright, L.M., and Han, J.C., 2003, “Heat Transfer in Rotating Rectangular
Channels (AR=4:1) with V-Shaped and Angled Rib Turbulators with and without Gaps,”
ASME Paper No. GT2003-38900.
[37] Han, J.C. and Dutta, S., 2001, “Recent Developments in Turbine Blade Internal Cooling,”
Annals of the New York Academy of Sciences, Vol. 934, No. 1, pp. 162-178.
[38] Han, J.C. and Huh, M., 2009, “Recent Studies in Turbine Blade Internal Cooling,” Int.
Symp. On Heat Transfer in Gas Turbine Systems, Antalya, Turkey, August 9-14, 2009.
[39] Han, J.C. and Chen, H.C., 2006, “Turbine Blade Internal Cooling Passages with Rib
Turbulators,” J. of Propulsion and Power, Vol. 22, No. 2, pp. 226-248.
[40] Han, J.C., Zhang, Y.M., and Lee, C.P., 1991, “Augmented Heat Transfer in Square
Channels with Parellel, Crossed, and V-Shaped Angled Ribs,” ASME J. of Heat Transfer,
Vol. 113, pp. 590-596.
[41] Han, J.C., and Zhang, Y.M., 1992, “High Performance Heat Transfer Ducts with Parellel
Broken and V-Shaped Broken Ribs,” Int. J. of Heat and Mass Transfer, Vol. 35, No. 2,pp.
513-523.
[42] Han, J.C. and Park, J.S. 1988, “Developing Heat Transfer in Rectangular Channels with
Rib-Turbulators,” Int. J. of Heat Mass Transfer, Vol. 31, pp. 183-195.
[43] Park, J.S., Han, J.C., and Huang, Y., Ou, S., 1992, “Heat Transfer Performance
Comparisons of Five Different Rectangular Channels with Parellel Angled Ribs”, Int. J.
of Heat Mass Transfer, Vol. 35, No. 11, pp. 2891-2903.
[44] Taslim, M.E., and Spring, S.D., 1994, “Effects of Turbulators Profile and Spacing on
Heat Transfer and Friction in a Channel,” J Thermophysics Heat Transfer, Vol. 8, pp.
555-562.
[45] Wright, L.M., Fu, W.L., and Han, J.C., 2004, “Thermal Performance of Angled, V-
Shaped, and W-Shaped Rib-Turbulators in Rotating Rectangular Cooling Channels
(AR4:1),” ASME Paper GT2004-54073.
[46] Rallabandi, A.P., Yang, H., and Han J.C., 2009 , “Heat Transfer and Pressure Drop
Correlations for Square Channels with 45 Deg Ribs at High Reynolds Numbers”, J. Heat
Transfer, Vol. 131, 071703-1-10.
[47] Rallabandi, A.P., Nawaf, A., and Han J.C., 2009 , “Heat Transfer and Pressure Drop
Measurements for Square Channels with 45 Deg Round Edged Ribs at High Reynolds
Numbers”, ASME Paper No. GT2009-59546.

114
[48] Alkhamis N.Y., Rallabandi, A.P., and Han, J.C., 2011, “Heat transfer and Pressure Drop
Correlations for Square Channels with V-Shaped Ribs at High Reynolds Numbers,”
Journal of Heat Transfer, Nol. 133, pp. 1-8.
[49] Han J.C., Huang, J.J., and Lee, C.P., 1993, “Augmented Heat Transfer in Square
Channels with Wedge-Shaped and Delta-Shaped Turbulence Promoters”, Enhanced Heat
Transfer, Vol. 1, No. 1, pp. 37-52.
[50] Han, J.C., 1984, “Heat Transfer and Friction in Channels with Two-Opposite Rib-
Roughened Walls,” ASME Journal of Heat Transfer, Vol. 106, pp. 774-781.
[51] Chandra, PR., Alexander C.R., and Han J.C., 2003, “Heat Transfer and Friction
Behaviors in Rectangular Channels with Varying Number of Ribbed Walls,”
International Journal of Heat and Mass Transfer, Vol. 46, pp. 481-495.
[52] Rau, G., Cakan, M., and Moeller, D., and Arts, T., 1998, “The Effect of Periodic Ribs on
the Local Aerodynamic and Heat Transfer Performance of a Straight Cooling Channel,”
ASME Journal of Turbomachinery, Vol. 120, pp. 368-375.
[53] Lockett, J.F., and Collins, M.W., 1990, “ Holographic Interferometry Applied to Rib-
Roughness Heat Transfer in Turbulent Flow,” International Journal of Heat Mass
Transfer, Vol. 33, No. 11, pp. 2439-2449.
[54] Han, J.C., Glicksman, L.R., and Rohsenow, W.M., 1978, “An Investigation of Heat
Transfer and Friction for Rib-Roughened Surfaces,” International Journal of Heat Mass
Transfer, Vol. 21, No. 8, pp. 1143-1156.
[55] Chandra, P.R., Fontenot, M.L., and Han, J.C., 1998, “Effect of Rib Profiles on Turbulent
Channel Flow Heat Transfer,” AIAA Journal of Thermophysics and Heat Transfer, Vol.
12, No. 1, pp. 116-118.
[56] Ahn, S.W., 2001, “The Effect of Roughness Type on Friction Factors and Heat Transfer
in Roughened Rectangular Duct,” International Comm. Heat Mass Transfer, Vol. 28, No.
7, pp. 933-942.
[57] Wang, L. and Sunden, B, 2007, “Experimental Investigation of Local Heat transfer in a
Square Duct with Various-Shaped Ribs,” Heat and Mass Transfer, Vol. 43, pp. 759-766.
[58] Ganmol, Pavin 2010, “Heat Transfer in Two-Pass Channel with Vortex Generators,” PhD
Dissertation, Dept. of Mechanical Engineering and Materials Science, University of
Pittsburgh.
[59] Stephens, M.A. and Shih, T.I-P., 1995, “Computation of Flow and Heat transfer in a
Rectangular Channel with Ribs,” AIAA Paper, 95-0180.

115
[60] Rigby, D. L., Steinthorsson, E., and Ameri, A. A., 1997, ‘‘Numerical Prediction of Heat
Transfer in a Channel with Ribs and Bleed,’’ASME Paper 97-GT-431.
[61] Stephens, M. A., Chyu, M. K., and Shih, T. I-P., 1996, ‘‘Computation of Convective
Heat Transfer in a Square Duct with Inclined Ribs of Rounded Cross Section,’’ ASME
Paper 96-WA/HT-12.
[62] Stephens, M. A., and Shih T. I-P., 1997, ‘‘Computation of Compressible Flow and Heat
Transfer in a Rotating Duct With Inclined Ribs a 180 deg Bend,’’ASME Paper 97-GT-
192.
[63] Shih, T. I-P., Lin, Y.-L., Stephens, M. A., and Chyu, M. K., 1998, ‘‘Flow and Heat
Transfer in a Ribbed U-Duct under Typical Engine Conditions,’’ ASME Paper 98-GT-
213.
[64] Johnson, B.V., Wagner, J.H., Steuber, G.D., and Yeh, F.C., 1994, “Heat Transfer in
Rotating Serpentine Passage with Trips Skewed to the Flow, “ ASME Journal of
Turbomachinery, Vol. 116, pp. 113-123
[65] Chen, H.C., Jang, Y.J., and Han, J.C., 2000, “Near-Wall Second Moment Closure for
Rotating Multiple-Pass Cooling Channels,” AAIA Journal of Thermophysics and Heat
Transfer,” Vol. 14, No. 2, pp. 201-209.
[66] Jang, Y.J., Chen, H.C., and Han, J.C., 2001, “Flow and Heat transfer in a Rotating Square
Channel with 45-Degree Angled Ribs by Reynolds Stress Turbulence Model,” ASME
Journal of Turbomachinery, Vol. 123, No. 1, pp. 124-132.
[67] Prakash, C., and Zerkle, R., 1995, ‘‘Prediction of Turbulent Flow and Heat Transfer in a
Ribbed Rectangular Duct with and without Rotation,’’ASME J. Turbomach., 177, pp.
255–264.
[68] Su, G., Chen, H.C., Han, J.C., and Heidmann, D., 2004, “Computation of Flow and Heat
Transfer in Two-Pass Rotating Rectangular Channels (AR=1:1, AR=1:2, AR=1:4) with
45-Deg Angled Ribs by a Reynolds Stress Turbulence Model, “ASME Paper No.
GT2004-53662.
[69] Kamali, R and Binesh, A.R., 2008, “The Importance of Rib Shapes on the Local Heat
Transfer and Flow Friction Characteristics of Square Ducts with Ribbed Internal
Surface,” International Communications of Heat and Mass Transfer, Vol. 35, pp. 1032-
1040.
[70] Ireland, P.T., and Jones, T.V., 1985, “The Measurement of Local Heat Transfer
Coefficients in Blade Cooling Geometries,” AGARD Conference on Heat Transfer and
Cooling in Gas Turbines, CP 390, Paper 28, Bergen.

116
[71] Baugh, J.W., Ireland, P.T., Jones, T.V., and Saniei, N., 1989, “A Comparison on the
Transient and Heated-Coating Methods for the Measurement of Local Heat Transfer
Coefficients on a Pin-Fin,” J. Heat Transfer, Vol. 111, pp. 877-881.
[72] Critoph, R.E., and Fisher, M., 1998, “A Study of Local Heat Transfer Coefficients in
Plate Fin-Tube Heat Exchangers Using the Steady State and Transient Liquid Crystal
Techniques,” IMECHE Conference Transactions, Vol. 2, pp. 201-210.
[73] Yen, C.H., 1999, “An Experimental Study of Heat Transfer around Turbine Airfoils with
Closed-Loop Cooling,” PhD Dissertation.
[74] Kline, S.J. and McClintock, F.A., “Describing Uncertainties in Single Sample
Experiments,” Eng. (Am. Soc. Mech. Eng.), 75, pp. 3-8.
[75] Dittus, F. W., and Boelter, L. M. K., 1930, University of California, Berkley,
Publications on Engineering, Vol. 2, pp. 443.
[76] Petuknov, B.S., 1970, in T.F. Irvine and J.P. Hartnett, Eds., Advances in Heat Transfer,
Vol. 6, Academic Press, New York.
[77] Gee, D. L., and Webb, R. L., 1980, “Forced convection Heat Transfer in Helically Rib-
Roughened Tubes,” International Journal of Heat and Mass Transfer, Vol. 23, pp. 1127-
1136.
[78] Webb, R. L., “Performance Evaluation Criteria for Use of Enhanced Heat Transfer
Surfaces in Heat Exchanger Design, 1981, “International Journal of Heat and Mass
Transfer”, Vol. 24, pp. 715-726.
[79] Metzger, D.E. and Larson, D.E., 1986, “Use of Melting Point Surface Coatings for Local
Convection Heat Transfer Measurements in Rectangular Channel Flows with 90-Deg
Turns,” J. Heat Transfer, 109, pp 48-54.
[80] Chyu, M.K. Ding, H., Downs, J.P. and Soechting, F.O., 1998, “Determination of Local
Heat Transfer Coefficient Based on Bulk Mean Temperature Using a Transient Liquid
Crystal Technique,” J. Experimental Thermal and Fluid Science, 18, pp. 142-149.
[81] Chen, S.P., Li, P.W., and Chyu, M.K., 2006, “Heat Transfer in a Airfoil Trailing Edge
Configuration with Shaped Pedestals Mounted Internal Cooling Channel and Pressure
Side Cutback,” ASME Turbo Expo, GT2006-91019.
[82] Chyu, M.K., Oluyede, E.O., and Moon, H-K., 2007, “Heat Transfer on Convective
Surfaces with Pin-Fins Mounted in Inclined Angles,” ASME Turbo Expo, GT2007-
28138.

117
[83] Chi, X., Shih, T.I-P., Bryden, K.M., Siw, S.C., Chyu, M.K., Ames, R., and Dennis, R.A.,
“Effects of Pin-Fin Height on Flow and Heat transfer in a Rectangular Duct,” ASME
Turbo Expo GT2011-46014.
[84] Al-Qahtani, M S., Chen, H.C., and Han, J.C., 2002, “A Numerical Study of Flow and
Heat Transfer in Rotating Rectangular Channels (AR=4) with 45-Deg Rib-Turbulators by
Reynolds Stress Turbulence Model,” ASME Turbo Expo GT2002-30216.
[85] Al-Qahtani, M S., Jang Y.J., Chen, H.C., and Han, J.C., 2002, “ Flow and Heat transfer in
Rotating Two-Pass Rectangular Channels (AR=2) by Reynolds Stress Turbulence
Model,” International Journal of Heat and Mass Transfer, Vol. 45, No. 9, pp. 1823-1838.
[86] www.mikrosystems.com